the cost of social security in japan · contents of the cost of social security in japan 2004 i....
TRANSCRIPT
IPSS: Statistical Report No.17
THE COSToFSOCIAL SECURITYINJAPAN
Fiscal Year 2004(April 2004 - March 2005)
National Institute of Population and Social Security ResearchTOKYO JAPAN 2007
The statistics in this publication are estimated through the annual settlement ofaccounts based on the ILO standards for international comparison. NationalInstitute of Population and Social Security Research produces it. Application forpermission to reproduce or translate all or part of this publication should be madeto the Institute.

IPSS: Statistical Report No. 17
1
Contents of The Cost of Social Security in Japan 2004
I. The Scope of Social Security Expenditure
II. Summary of Social Security Expenditure, FY 2004Table 1 Social Security Expenditure by category, fiscal years 2003 and 2004Table 2 Social Security Expenditure by category as a percentage of National IncomeTable 3 Social Security Expenditure per head of population and per household, fiscal years 2003 and 2004Figure 1 Social Security Expenditure by category, fiscal years 1970-2004Table 4 Social Security Expenditure by functional category, fiscal years 2003 and 2004Table 5 Social Security Expenditure by functional category as a percentage of National IncomeFigure 2 Social Security Expenditure by functional category, fiscal years 2000-2004Table 6 Social Security Expenditure for the elderly, fiscal years 2003 and 2004
III. Summary of Social Security Revenue by source, FY 2004Table 7 Social Security Revenue by source, fiscal years 2003 and 2004Figure 3 Social Security Expenditure by revenue, scheme, category, function and target individuals, fiscal year
2004
IV. Statistical tablesTable 1 Social Security Expenditure by category, fiscal years 1950-2004Table 2 Three categories of Social Security Expenditure as a percentage of National Income, fiscal years 1951-
2004Table 3 Annual rates of increase in Social Security Expenditure and National Income, fiscal years 1951-2004Table 4 Social Security Expenditure and National Income per head of population, fiscal years 1951-2004Table 5 Social Security Expenditure for the elderly, fiscal years 1973-2004Table 6 Social Security Expenditure for child and family, fiscal years 1975-2004Table 7 Social Security Expenditure by institutional scheme, fiscal years 1995-2004Table 8 Social Security Expenditure by functional category, fiscal years 2000-2004Table 9 Cost of Social Security in fiscal year 2004 according to the ILO standardsTable 10 Social Security Revenue by source, fiscal years 1951-2004Table 11 Social Security Revenue by source, fiscal years 2000-2004
Reference: Description of functional categories in Social Security Expenditure
Appendix: Estimation of Japan's Social Expenditure by OECD standards
References: International Comparison according to OECD Social Expenditure database
Symbols contained in the Tables are shown below:
No figure -Minimum ratio when less than 0.05 0.0Estimated figure when less than half the unit used in the Table 0Reduced figure (ratio) ▲
Please direct inquiries to: Third Office, Department of Research Planning and Coordination, National Instituteof Population and Social Security Research
TEL: +81(0)3-3595-2985 FAX: +81(0)3-3591-4912

IPSS: Statistical Report No. 17
2
I. The Scope of Social Security Expenditure
1. The scope of social security expenditure is based on the ILO (International Labor Organization) standardsfor international comparison.
The ILO defines Social Security Expenditure as all schemes or services which meet the following three criteria:
(i) The objectives of the schemes must be to grant benefits for at least one of the following risks and needs: (1)Old age; (2) Survivor; (3) Invalidity; (4) Employment injury; (5) Sickness and health; (6) Family; (7)Unemployment; (8) Housing; (9) Public assistance and others.
(ii) The system must have been set up by legislation which attributes specific individual rights to, or whichimposes specified obligations on, a public, semi-public or autonomous body.
(iii) The system should be administered by a public, semi-public or autonomous body founded by legislation; orby a private body which has been granted rights to perform legal obligations.Specifically, the schemes for employment injury compensation are conducted by a private body as the casemay be, though it should be included in the scope of Social Security Expenditure.
On the basis of the criteria listed above, the following schemes are included in these statistics: social insurance(including unemployment insurance and employment injury compensation insurance), family allowances, specialschemes for public employees, public health service, public assistance, social welfare schemes and aid for warvictims. Social Security Expenditure is based on the above ILO standards and is estimated in each fiscal year budgetfor expenditure in each system of social security in Japan. Since 1949, the ILO has conducted 19 internationalinquiries on the cost of social security, and provides social security expenses data submitted by various countriesin "The Cost of Social Security" on its Internet homepage.
(See http://www.ilo.org/public/english/protection/secsoc/areas/stat/css/index.htm)
2. Social Security Expenditure is divided into "Medical care," "Pensions," and "Welfare & Others:"
(i) "Medical care"includes costs for medical insurance, the medical service system for the aged, medical aid forpublic assistance, medical services for Workmen's Accident Compensation Insurance, as well as costsrelated to government-financed special medical services, such as the treatment of tuberculosis and mentaldisorders, and public health services conducted by local health centers.
(ii) "Pensions" includes payments by public pension schemes such as National Pensions and Employee's PensionInsurance. It also includes some cash benefits paid in the form of pensions within the scheme of gratuitiesfor retired public employees, and the scheme for Workmen's Accident Compensation Insurance.
(iii) "Welfare & Others" includes expenses for social welfare services or long-term care, public assistances otherthan medical services, cash benefits for child allowance, sickness and injury cash benefits within the healthinsurance schemes, leave compensation benefits paid by the Workmen's Accident Compensation Insuranceand unemployment benefits from Employment Insurance. In addition, Long-term care includes long-termcare insurance benefits and public assistance long-term care services, atomic bomb victim long-term careinsurance system co-payments, partial cost sharing and family-care leave benefits.
3. The functional classification of Social Security Expenditure sums up benefits for each of the risks and needsincluded in 1(i) of the above Scope of Social Security Expenditure.

IPSS: Statistical Report No. 17
3
II. Summary of Social Security Expenditure, FY 2004
1. Social Security Expenditure in fiscal year 2004 was 85,646.9 billion yen.
(i) Of the three categories, Medical care was estimated at 27,153.7 billion yen, accounting for 31.7 percent ofthe total; Pensions was 45,518.8 billion yen for a total share of 53.1 percent. Welfare & Others was 12,974.4billion yen for a total share of 15.1 percent.
(ii) Social Security Expenditure increased by 1.6 percent in fiscal year 2004. The percentage share of theNational Income was 23.72 percent.
(iii) Social Security Expenditure per head of population was estimated at 670,800 yen, and the average expenditureper household was 1,826,900 yen.
Table 1 Social Security Expenditure by category, fiscal years 2003 and 2004
Note: ( ) The ratio to the total is expressed as a percentage.
Table 2 Social Security Expenditure by category as a percentage of National Income
Table 3 Social Security Expenditure per head of population and per household, fiscal years 2003and 2004
Notes: Social Security Expenditure per household = (Total number of people in households/Total number ofhouseholds) × Social Security Expenditure per head of population.
Rate of increaseHundreds of
millions of yenHundreds of
millions of yenHundreds of
millions of yen %
Total 1.6
Medical care 2.0
Pensions 1.6
Welfare & Others 0.8
of which Long-term care 9.3 56,289 (6.6)
Amount of increase
13,801
5,383
7,343
1,075
4,768 (5.6)
2004
856,469 (100.0)
271,537 (31.7)
455,188 (53.1)
129,744 (15.1)
(53.1)
128,669 (15.3)
51,521
(100.0)
266,154 (31.6)
447,845
Compared with the previous yearSocial SecurityExpenditure 2003
842,668
Social SecurityExpenditure 2003 2004 Increase compared with
the previous year
% % % pointTotal 23.51 23.72 0.21
Medical care 7.43 7.52 0.10
Pensions 12.50 12.61 0.11
Welfare & Others 3.59 3.59 0.00
of which Long-term care 1.44 1.56 0.12
Amount of increase Rate of increase
1,000 yen 1,000 yen 1,000 yen %
Per head of population 660.3 670.8 10.5 1.6
Per household 1,819.3 1,826.9 7.6 0.4
Compared with the previous yearSocial SecurityExpenditure 2003 2004

IPSS: Statistical Report No. 17
4
Figure 1 Social Security Expenditure by category, fiscal years 1970-2004
0
5
10
15
20
25
30
35
40
45
50
1970 75 80 85 90 95 2000Fiscal year
Trillion yenPensions
45,518.8 billion yen(53.1%)
Medical care27,153.7 billion yen
(31.7%)
Welfare & Others12,974.4 billion yen
(15.1%)

IPSS: Statistical Report No. 17
5
2. As can be seen in Table 4 below showing Social Security Expenditure by functional category, "Old age"heads the list with 50.4% of the total, followed by "Sickness and health" at 31.0%. These two functionalcategories make up approximately 81.4% of the entire Social Security Expenditure. The other functionalcategories and their percentages of the total are "Survivors" (7.3%), "Family benefits" (3.1%), "Social assistanceand others" (2.7%) ,"Invalidity benefits" (2.3%),"Unemployment" (1.7%),"Employment injury" (1.1%) and"Housing" (0.4%).
Table 4 Social Security Expenditure by functional category, fiscal years 2003 and 2004
Notes: 1. ( ) The ratio to the total is expressed as a percentage.2. Refer to 'Reference' for more details about functional classifications.3. “Family” decreased by 2.7% from the previous fiscal year (2003); however, there were reasons. Subsidiesfor public children's daycare service became autonomous and grants are no longer given by the centralgovernment; instead, they are self-financed by local governments. Assuming that the cost wasapproximately 332.2 billion yen, then the share of “Family” increased to 3.5% and the rate of increase was9.5% over the previous year.
Rate of increase
Hundreds ofmillions of yen
Hundreds ofmillions of yen
Hundreds ofmillions of yen %
Total 1.6
Old age 2.8
Survivors 1.4
Invalidity benefits 1.2
Employment injury ▲ 1.5
Sickness and health 1.8
Family benefits ▲ 2.7
Unemployment ▲ 25.8
Housing 11.9 (0.3)
8.7 Social assistanceand others
Compared with the previous yearSocial Security Expenditure 2003
842,668(100.0)
420,079(49.9)
▲ 5,029
334
61,687(7.3)
19,495(2.3)
9,912(1.2)
260,851(30.9)
27,217(3.2)
19,471(2.3)
2,796
21,159(2.5)
2004
856,469(100.0)
431,922(50.4)
62,527(7.3)
19,731(2.3)
9,763(1.1)
(0.4)
265,466(31.0)
26,494(3.1)
▲ 723
14,442(1.7)
3,130
1,834 22,993(2.7)
Amount of increase
13,801
11,842
840
236
▲ 150
4,616

IPSS: Statistical Report No. 17
6
Table 5 Social Security Expenditure by functional category as a percentage of National Income
Figure 2 Social Security Expenditure by functional category, fiscal years 2000-2004
Notes: In comparison with the previous year, “Family” decreased 0.03% due to fiscal reform of public children'sdaycare services. The central government no longer provides grants for this service, and thus the data cannot be estimated as before. If the cost of children's daycare service is estimated at approximately 332.2billion yen, the percentage of “Family” per national income was 0.83%, 0.07% higher than the previous year.
Social Security Expenditure 2003 2004 Increase compared withthe previous year
% % % pointTotal 23.51 23.72 0.21
Old age 11.72 11.96 0.24
Survivors 1.72 1.73 0.01
Invalidity benefits 0.54 0.55 0.00
Employment injury 0.28 0.27 ▲ 0.01
Sickness and health 7.28 7.35 0.08
Family benefits 0.76 0.73 ▲ 0.03
Unemployment 0.54 0.40 ▲ 0.14
Housing 0.08 0.09 0.01
Social assistanceand others 0.59 0.64 0.05
0
10
20
30
40
50
60
70
80
90
2000 2001 2002 2003 2004
Trillion yen
HousingEmployment injuryUnemploymentInvalidity benefitsSocial assistance and othersFamily benefitsSurvivorsSickness and healthOld age

IPSS: Statistical Report No. 17
7
3. Social Security Expenditure for the elderly (i.e., retirement pensions, medical care for the aged, welfareservices for the aged) was 60,653.7 billion yen. Its share of Social Security Expenditure was 70.8 percent.
Table 6 Social Security Expenditure for the elderly, fiscal years 2003 and 2004
Notes: 1.The ratio to the total Social Security Expenditure is expressed as a percentage.2.Health and medical services expenditure for the aged consists of expenditures concerning measures for
care control, the in-home welfare service expense not covered by long-term care insurance, etc.3.Elderly employment maintenance benefits provide those over 60 who, from the time of reaching 60 years
of age, are to continue working with a pay cut of more than 25%, with the equivalent of 15% of their payuntil they reach 65 years of age, with the aim of promoting the maintenance of employment andreemployment among people aged between 60 and 65.
4.The applicable age group for the healthcare system for the elderly was in October 2002 raised by fiveyears from the over-70s to the over 75s; thus it is necessary to bear in mind that the above figures forelderly healthcare (medical areas) benefits in 2003 and 2004 differ in terms of their applicable age range.That the rate of increase compared with the previous year is a negative figure is a reflection of this.According to the “2004 National Medical Care Expenditure (Estimates) (Ministry of Health, Labor andWelfare),” the national medical expenses for the over-75s in 2004 rose by 5.7% compared with theprevious year.
2003 2004Rate of increase
compared with theprevious year
Hundreds ofmillions of yen
Hundreds ofmillions of yen %
Total Social SecurityExpenditure 1.6
Expenditure for the elderly Hundreds ofmillions of yen
Hundreds ofmillions of yen %
Pension benefits 1.9
Medical care ▲ 0.4
Welfare services 10.4
Subsidies for elderlyemployees ▲ 6.7
Total 2.3
Population Rate of increase
By age group %
60 and over 2.9
65 and over 2.3
70 and over 3.7
75 and over 4.9
842,668
(100.0)
429,959
106,343
55,387
1,489
593,178 (70.4)
3,261
10 thousand
2,431
1,691
1,055
856,469
(100.0)
438,143
105,879
61,125
1,389
606,537
(70.8)
10 thousand
3,353
2,488
1,753
1,107
IPSS: Statistical Report No. 17
8
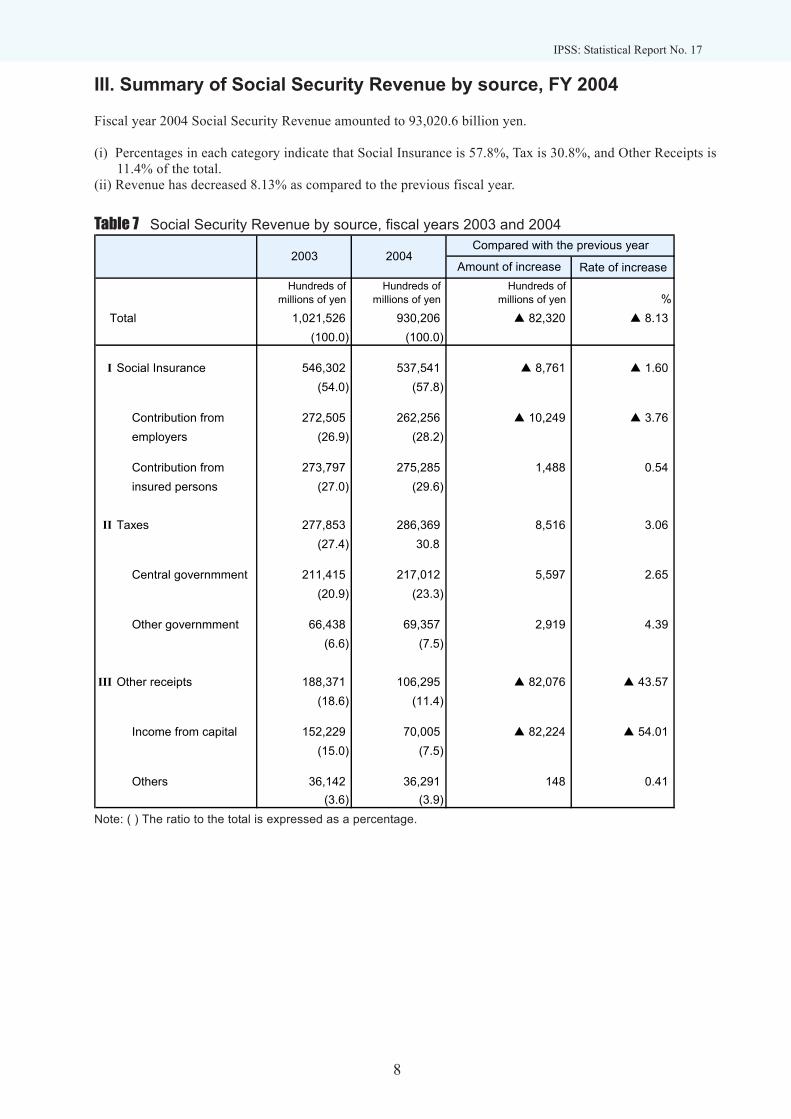
III. Summary of Social Security Revenue by source, FY 2004
Fiscal year 2004 Social Security Revenue amounted to 93,020.6 billion yen.
(i) Percentages in each category indicate that Social Insurance is 57.8%, Tax is 30.8%, and Other Receipts is11.4% of the total.
(ii) Revenue has decreased 8.13% as compared to the previous fiscal year.
Table 7 Social Security Revenue by source, fiscal years 2003 and 2004
Note: ( ) The ratio to the total is expressed as a percentage.
Rate of increaseHundreds of
millions of yenHundreds of
millions of yenHundreds of
millions of yen %Total ▲ 8.13
I Social Insurance ▲ 1.60
Contribution from ▲ 3.76 employers
Contribution from 0.54 insured persons
II Taxes 3.06
Central governmment 2.65
Other governmment 4.39
III Other receipts ▲ 43.57
Income from capital ▲ 54.01
Others 0.41
Compared with the previous year2003 2004
1,021,526(100.0)
546,302(54.0)
272,505(26.9)
273,797(27.0)
277,853(27.4)
211,415(20.9)
66,438(6.6)
188,371(18.6)
152,229(15.0)
36,142(3.6)
930,206(100.0)
537,541
262,256
275,285
286,369
(57.8)
(28.2)
(29.6)
30.8
217,012(23.3)
69,357(7.5)
106,295(11.4)
70,005(7.5)
36,291(3.9)
Amount of increase
▲ 82,320
▲ 8,761
▲ 10,249
1,488
8,516
5,597
2,919
▲ 82,076
▲ 82,224
148

IPSS: Statistical Report No. 17
9
Figure3 Social Security Expenditure by revenue, scheme, category, function and target individuals,fiscal year 2004
Not
es: 1
. "C
hild
, fam
ily" r
efer
s to
med
ical
insu
ranc
e in
the
form
of a
lum
p su
m m
ater
nity
allo
wan
ce a
nd c
hild
-rear
ing
allo
wan
ce, e
mpl
oym
ent i
nsur
ance
in th
e fo
rm o
fpa
rent
leav
e al
low
ance
, day
-car
e fa
cilit
ies
adm
inis
tratio
n co
sts
and
sing
le p
aren
t fam
ily a
nd d
isab
led
child
allo
wan
ce.
2. F
isca
l yea
r 200
4 So
cial
Sec
urity
Rev
enue
s am
ount
ed to
93.
0 tri
llion
yen
(exc
ludi
ng tr
ansf
er fr
om o
ther
sys
tem
s). T
he fi
gure
in s
quar
e br
acke
ts [
] rep
rese
nts
the
ratio
of S
ocia
l Sec
urity
Rev
enue
s to
tal.
3. F
isca
l yea
r 200
4 So
cial
Sec
urity
Exp
endi
ture
am
ount
ed to
85.
6 tri
llion
yen.
The
figu
re in
par
enth
eses
( ) r
epre
sent
s th
e ra
tio o
f Soc
ial S
ecur
ity E
xpen
ditu
re to
tal.
(Uni
t: Tr
illio
n of
yen
, %)
Rev
enue
Sch
eme
Cat
egor
yFu
nctio
nTa
rget
indi
vidu
als
Gen
eral
reve
nue
28.
6[30
.8]
Cen
tral g
over
nmen
t
2
1.7
Loca
l gov
ernm
ent
6
.9
Inco
me
from
cap
ital
10
.6[1
1.4]
Soc
ial
insu
ranc
e
7
7.8(
90.9
)M
edic
al in
sura
nce
15.3
Long
-term
car
ein
sura
nce
5.
6P
ensi
on b
enef
its
43
.8E
mpl
oym
ent i
nsur
ance
1.5
Acc
iden
t com
pens
atio
n
1.
0
Hea
lth a
nd m
edic
alse
rvic
es fo
r the
age
d
10
.7
Fam
ily a
llow
ance
, soc
ial
wel
fare
, pub
licas
sist
ance
6.0
(7.0
)
Pub
lic h
ealth
0
.5(0
.6)
Gra
tutie
s, s
uppo
rt
1
.3(1
.5)
Adm
inis
tara
tive
cost
, etc
.
4
.5
Bal
ance
of p
aym
ents
8.4
Pen
sion
s
4
5.5(
53.1
)
Med
ical
car
e
2
7.2(
31.7
)
Wel
fare
and
oth
ers
13.
0(15
.1)
Oth
er o
f whi
ch lo
ng-te
rmca
re
5
.6
Old
age
43.
2(50
.4)
Sic
knes
s an
d he
alth
26
.5(3
1.0)
Sur
vivo
rs
6.3
(7.3
)
Une
mpl
ymen
t
2
.6(3
.1)
Fam
ily b
enef
its
2
.3(2
.7)
Soc
ial a
ssis
tanc
e an
dot
hers
1.
4(1.
7)Em
ploym
ent i
njury
1.
0(1.
1)
Hou
sing
0.3
(0.4
)
Soc
ial
expe
nditu
refo
r the
elde
rly
6
0.7(
70.8
)
Pen
sion
ben
efits
43.8
Med
ical
car
e
10
.6W
elfa
re s
ervi
ces
6.3
Oth
er e
xpen
ditu
re
25.0
(29.
2)
Of w
hich
med
ical
car
e
16
.6
Of w
hich
Chi
led,
fam
ily
3
.1
Soc
ial
secu
rity
expe
nditu
re
Adm
inis
tara
tive
cost
, etc
.
4
.5
Adm
inis
tara
tive
cost
, etc
.
4
.5Ad
min
ista
rativ
e co
st, e
tc.
4.5
Bal
ance
of p
aym
ents
8.4
Bal
ance
of p
aym
ents
8.4
Bal
ance
of p
aym
ents
8.4
Inba
lidity
ben
efits
2.
0(2.
3)
Con
tribu
tion
from
Em
ploy
ers
26.
2
Insu
ranc
epr
emiu
m
5
3.8[
57.8
]
Con
tribu
tion
from
insu
red
pers
ons
27.
5

IPSS: Statistical Report No. 17
10
IV. Statistical tables
Table 1 Social Security Expenditure by category, fiscal years 1950-2004
Note: Rounding of the numbers may cause some discrepancies.
Social Security Expenditure
Fiscal year Total (A) Medical Care (B) B/AHundreds of
millions of yenHundreds of
millions of yen %
1950 1,261 646 51.2 615 48.81951 1,571 804 51.1 768 48.91952 2,194 1,149 52.3 1,046 47.71953 2,577 1,480 57.5 1,096 42.51954 3,841 1,712 44.6 2,129 55.41955 3,893 1,919 49.3 1,974 50.71956 3,986 2,018 50.6 1,969 49.41957 4,357 2,224 51.0 2,133 49.01958 5,080 2,099 41.3 2,981 58.71959 5,778 2,523 43.7 3,255 56.31960 6,553 2,942 44.9 3,611 55.11961 7,900 3,850 48.7 4,050 51.31962 9,219 4,699 51.0 4,520 49.01963 11,214 5,885 52.5 5,329 47.5
Pension (D) D/A Welfare & Others (E) E/A
Hundreds ofmillions of yen % Hundreds of
millions of yen %
1964 13,475 7,328 54.4 3,056 22.7 3,091 22.91965 16,037 9,137 57.0 3,508 21.9 3,392 21.21966 18,670 10,766 57.7 4,199 22.5 3,705 19.81967 21,644 12,583 58.1 4,947 22.9 4,114 19.01968 25,096 14,679 58.5 5,835 23.3 4,582 18.31969 28,752 16,975 59.0 6,935 24.1 4,842 16.81970 35,239 20,758 58.9 8,562 24.3 5,920 16.81971 40,258 22,505 55.9 10,192 25.3 7,561 18.81972 49,845 28,111 56.4 12,367 24.8 9,367 18.81973 62,587 34,270 54.8 16,758 26.8 11,559 18.51974 90,270 47,208 52.3 26,782 29.7 16,280 18.01975 117,693 57,132 48.5 38,831 33.0 21,730 18.51976 145,165 68,098 46.9 53,415 36.8 23,652 16.31977 168,868 76,256 45.2 65,880 39.0 26,732 15.81978 197,763 89,167 45.1 78,377 39.6 30,219 15.31979 219,832 97,743 44.5 89,817 40.9 32,272 14.71980 247,736 107,329 43.3 104,525 42.2 35,882 14.51981 275,638 115,221 41.8 120,420 43.7 39,997 14.51982 300,973 124,118 41.2 133,404 44.3 43,451 14.41983 319,733 130,983 41.0 144,108 45.1 44,642 14.01984 336,396 135,654 40.3 154,527 45.9 46,216 13.71985 356,798 142,830 40.0 168,923 47.3 45,044 12.61986 385,918 151,489 39.3 187,620 48.6 46,809 12.11987 407,337 160,001 39.3 199,874 49.1 47,462 11.71988 424,582 166,726 39.3 210,459 49.6 47,397 11.21989 448,822 175,279 39.1 225,407 50.2 48,136 10.71990 472,203 183,795 38.9 240,420 50.9 47,989 10.21991 501,346 195,056 38.9 256,145 51.1 50,145 10.01992 538,280 209,395 38.9 274,013 50.9 54,872 10.21993 568,039 218,059 38.4 290,376 51.1 59,603 10.51994 604,727 228,726 37.8 310,084 51.3 65,918 10.91995 647,314 240,593 37.2 334,986 51.8 71,735 11.11996 675,475 251,789 37.3 349,548 51.7 74,139 11.01997 694,163 253,070 36.5 363,996 52.4 77,098 11.11998 721,411 254,077 35.2 384,105 53.2 83,228 11.51999 750,417 263,953 35.2 399,112 53.2 87,352 11.62000 781,272 260,062 33.3 412,012 52.7 109,198 14.02001 814,007 266,415 32.7 425,714 52.3 121,878 15.02002 835,666 262,744 31.4 443,781 53.1 129,140 15.52003 842,668 266,154 31.6 447,845 53.1 128,669 15.32004 856,469 271,537 31.7 455,188 53.1 129,744 15.1
Pension,Welfare & Others (C) Hundreds of
millions of yen
C/A
%

IPSS: Statistical Report No. 17
11
Table 2 Three categories of Social Security Expenditure as a percentage of National Income,fiscal years 1951-2004
Sources: National Income up to 1954: Annual Report on National Income Statistics (1978); 1955-77: Report onNational Accounts (1988); 1978-1979: Annual Report on National Accounts (2000); 1980-96: Report onNational Accounts (2005); 1997-2004: Report on National Accounts (2006);1990 and after: RevisedNational Accounts by 2002 Standard, (93 SNA) by the Department of National Accounts, Economic andSocial Research Institute Cabinet Office, Government of Japan.
(Unit:%)
National Income
Total Medical Care Pensions Welfare & Others
1951 3.54 1.81 1.73 44,346 1952 4.21 2.20 2.01 52,159 1953 4.29 2.47 1.83 60,015 1954 5.83 2.60 3.23 65,917 1955 5.58 2.75 2.83 69,733 1956 5.05 2.56 2.49 78,962 1957 4.91 2.51 2.41 88,681 1958 5.41 2.24 3.18 93,829 1959 5.23 2.28 2.95 110,421 1960 4.86 2.18 2.68 134,967 1961 4.91 2.39 2.52 160,819 1962 5.15 2.63 2.53 178,933 1963 5.31 2.79 2.53 210,993 1964 5.60 3.05 1.27 1.29 240,514 1965 5.98 3.41 1.31 1.26 268,270 1966 5.90 3.40 1.33 1.17 316,448 1967 5.76 3.35 1.32 1.10 375,477 1968 5.74 3.36 1.33 1.05 437,209 1969 5.52 3.26 1.33 0.93 521,178 1970 5.77 3.40 1.40 0.97 610,297 1971 6.11 3.41 1.55 1.15 659,105 1972 6.40 3.61 1.59 1.20 779,369 1973 6.53 3.58 1.75 1.21 958,396 1974 8.03 4.20 2.38 1.45 1,124,716 1975 9.49 4.61 3.13 1.75 1,239,907 1976 10.34 4.85 3.80 1.68 1,403,972 1977 10.85 4.90 4.23 1.72 1,557,032 1978 11.51 5.19 4.56 1.76 1,717,785 1979 12.06 5.36 4.93 1.77 1,822,066 1980 12.19 5.28 5.14 1.77 2,032,410 1981 13.01 5.44 5.68 1.89 2,118,783 1982 13.68 5.64 6.06 1.97 2,200,091 1983 13.82 5.66 6.23 1.93 2,312,854 1984 13.83 5.58 6.36 1.90 2,431,547 1985 13.67 5.47 6.47 1.73 2,610,890 1986 14.39 5.65 7.00 1.75 2,680,934 1987 14.45 5.68 7.09 1.68 2,818,190 1988 13.97 5.48 6.92 1.56 3,039,679 1989 13.93 5.44 7.00 1.49 3,222,073 1990 13.56 5.28 6.90 1.38 3,483,454 1991 13.51 5.26 6.90 1.35 3,710,807 1992 14.57 5.67 7.42 1.49 3,693,238 1993 15.39 5.91 7.87 1.62 3,690,327 1994 16.17 6.11 8.29 1.76 3,740,796 1995 17.30 6.43 8.95 1.92 3,742,774 1996 17.82 6.64 9.22 1.96 3,791,076 1997 18.14 6.61 9.51 2.01 3,827,635 1998 19.37 6.82 10.31 2.23 3,725,035 1999 20.46 7.20 10.88 2.38 3,667,396 2000 21.02 7.00 11.09 2.94 3,715,975 2001 22.55 7.38 11.79 3.38 3,609,521 2002 23.49 7.38 12.47 3.63 3,557,846 2003 23.51 7.43 12.50 3.59 3,583,968 2004 23.72 7.52 12.61 3.59 3,610,126
Social Security ExpenditureFiscal year Hundreds of
millions of yen

IPSS: Statistical Report No. 17
12
Table 3 Annual rates of increase in Social Security Expenditure and National Income, fiscal years1951-2004
(Unit:%)
Social Security Expenditure
Total Medical Care Pensions Welfare & Others
1951 24.6 24.5 -
1952 39.7 42.9 17.61953 17.5 28.8 15.11954 49.0 15.7 9.81955 1.4 12.1 5.81956 2.4 5.2 13.2 1957 9.3 10.2 12.3 1958 16.6 ▲ 5.6 5.8 1959 13.7 20.2 17.7 1960 13.4 16.6 22.2 1961 20.6 30.9 19.2 1962 16.7 22.1 11.3 1963 21.6 25.2 17.9 1964 20.2 24.5 14.0 1965 19.0 24.7 14.8 9.7 11.5 1966 16.4 17.8 19.7 9.2 18.0 1967 15.9 16.9 17.8 11.0 18.7 1968 15.9 16.7 18.0 11.4 16.4 1969 14.6 15.6 18.9 5.7 19.2 1970 22.6 22.3 23.5 22.3 17.1 1971 14.2 8.4 19.0 27.7 8.0 1972 23.8 24.9 21.3 23.9 18.2 1973 25.6 21.9 35.5 23.4 23.0 1974 44.2 37.8 59.8 40.8 17.4 1975 30.4 21.0 45.0 33.5 10.2 1976 23.3 19.2 37.6 8.8 13.2 1977 16.3 12.0 23.3 13.0 10.9 1978 17.1 16.9 19.0 13.0 10.3 1979 11.2 9.6 14.6 6.8 6.1 1980 12.7 9.8 16.4 11.2 11.5 1981 11.3 7.4 15.2 11.5 4.2 1982 9.2 7.7 10.8 8.6 3.8 1983 6.2 5.5 8.0 2.7 5.1 1984 5.2 3.6 7.2 3.5 5.1 1985 6.1 5.3 9.3 ▲ 2.5 7.4 1986 8.2 6.1 11.1 3.9 2.7 1987 5.6 5.6 6.5 1.4 5.1 1988 4.2 4.2 5.3 ▲ 0.1 7.9 1989 5.7 5.1 7.1 1.6 6.0 1990 5.2 4.9 6.7 ▲ 0.3 8.1 1991 6.2 6.1 6.5 4.5 6.5 1992 7.4 7.4 7.0 9.4 ▲ 0.5 1993 5.5 4.1 6.0 8.6 ▲ 0.1 1994 6.5 4.9 6.8 10.6 1.4 1995 7.0 5.2 8.0 8.8 0.11996 4.4 4.7 4.3 3.4 1.3 1997 2.8 0.5 4.1 4.0 1.0 1998 3.9 0.4 5.5 8.0 ▲ 2.7 1999 4.0 3.9 3.9 5.0 ▲ 1.5 2000 4.1 ▲ 1.5 3.2 25.0 1.3 2001 4.2 2.4 3.3 11.6 ▲ 2.9 2002 2.7 ▲ 1.4 4.2 6.0 ▲ 1.4 2003 0.8 1.3 0.9 ▲ 0.4 0.7 2004 1.6 2.0 1.6 0.8 0.7
12.2 11.6 17.9 15.3
8.3 39.8 9.2 10.9
Fiscal year
▲ 7.3▲ 0.3
National Income
24.9 36.2 4.8 94.3

IPSS: Statistical Report No. 17
13
Table 4 Social Security Expenditure and National Income per head of population, fiscal years1951-2004
Social Security Expenditure per head National Income per head
1,000yen Index 1,000yen Index1973=100 1973=100
1951 1.9 3.3 52.5 6.01952 2.6 4.5 60.8 6.91953 3.0 5.2 69.0 7.81954 4.4 7.7 74.7 8.51955 4.4 7.7 78.2 8.91956 4.4 7.7 87.6 10.01957 4.8 8.4 97.6 11.11958 5.5 9.6 102.3 11.61959 6.2 10.8 119.2 13.61960 7.0 12.2 144.5 16.41961 8.4 14.6 170.6 19.41962 9.7 16.9 188.1 21.41963 11.7 20.4 219.5 25.01964 13.7 23.9 247.6 28.21965 16.2 28.2 273.2 31.11966 18.9 32.9 319.6 36.41967 21.6 37.7 375.0 42.71968 24.8 43.2 431.7 49.11969 28.0 48.9 508.7 57.91970 33.7 58.7 586.0 66.71971 37.9 66.1 621.7 70.71972 46.3 80.8 724.9 82.51973 57.4 100.0 879.1 100.01974 81.6 142.3 1,018.1 115.81975 105.1 183.3 1,108.7 126.11976 128.4 223.8 1,242.4 141.31977 147.9 257.9 1,364.7 155.21978 171.7 299.3 1,492.2 169.71979 189.3 329.9 1,569.6 178.51980 211.6 368.9 1,737.3 197.61981 233.8 407.5 1,798.1 204.51982 253.5 441.9 1,854.1 210.91983 267.5 466.3 1,935.9 220.21984 279.6 487.4 2,022.2 230.01985 294.8 513.8 2,158.3 245.51986 317.2 553.0 2,204.8 250.81987 333.2 580.9 2,306.9 262.41988 345.9 603.0 2,477.9 281.91989 364.3 635.0 2,616.7 297.61990 382.0 665.9 2,819.3 320.71991 404.2 704.6 2,991.8 340.31992 432.5 754.0 2,966.9 337.51993 455.3 793.7 2,955.7 336.21994 483.7 843.1 2,987.6 339.81995 515.5 898.6 2,982.3 339.21996 536.7 935.5 3,014.1 342.91997 550.2 959.1 3,035.3 345.31998 570.3 994.3 2,946.5 335.21999 592.3 1,032.6 2,895.6 329.42000 615.5 1,073.0 2,928.6 333.12001 639.5 1,114.8 2,838.0 322.82002 655.8 1,143.1 2,792.7 317.72003 660.3 1,151.1 2,808.5 319.52004 670.8 1,169.3 2,827.3 321.6
Fiscal year

IPSS: Statistical Report No. 17
14
Table 5 Social Security Expenditure for the elderly, fiscal years 1973-2004
Note: The applicable age group for the healthcare system for the elderly was raised by five years in October 2002,from the over-70s to the over-75s; thus it is necessary to bear in mind that the above figures for elderlyhealthcare benefits in 2001, 2002, 2003, and 2004 differ in terms of their applicable age range. According tothe “2004 National Medical Care Expenditure (Estimates) (Ministry of Health, Labour and Welfare),” the rateof increase in the national medical expenses for the over-75s rose by 0.5% in 2002, by 3.8% in 2003, and by5.7% in 2004 (compared with each previous year).
Hundredsof millions
of yen
Hundredsof millions
of yen
Hundredsof millions
of yen
Hundredsof millions
of yen
Hundredsof millions
of yen% %
Hundredsof millions
of yen%
1973 10,756 4,289 596 - 15,641 - 25.0 62,587 -
1974 19,204 6,652 877 - 26,733 70.9 29.6 90,270 44.2 1975 28,924 8,666 1,164 - 38,754 45.0 32.9 117,693 30.4 1976 40,697 10,780 1,489 - 52,966 36.7 36.5 145,165 23.3 1977 50,942 12,872 1,798 - 65,612 23.9 38.9 168,868 16.3 1978 61,329 15,948 2,060 - 79,337 20.9 40.1 197,763 17.1 1979 70,896 18,503 2,306 - 91,705 15.6 41.7 219,832 11.2 1980 83,675 21,269 2,570 - 107,514 17.2 43.4 247,736 12.7 1981 97,903 24,280 2,822 - 125,005 16.3 45.4 275,638 11.3 1982 109,552 27,450 3,129 - 140,131 12.1 46.6 300,973 9.2 1983 120,122 32,660 3,306 - 156,088 11.4 48.8 319,733 6.2 1984 130,497 35,534 3,467 - 169,498 8.6 50.4 336,396 5.2 1985 144,549 40,070 3,668 - 188,287 11.1 52.8 356,798 6.1 1986 163,140 43,584 4,316 - 211,040 12.1 54.7 385,918 8.2 1987 175,081 46,638 4,278 - 225,997 7.1 55.5 407,337 5.6 1988 185,889 49,824 4,569 - 240,282 6.3 56.6 424,582 4.2 1989 201,126 53,730 5,106 - 259,962 8.2 57.9 448,822 5.7 1990 216,182 57,331 5,749 - 279,262 7.4 59.1 472,203 5.2 1991 231,909 61,976 6,552 - 300,437 7.6 59.9 501,346 6.2 1992 249,728 66,685 7,456 - 323,869 7.8 60.2 538,280 7.4 1993 266,199 71,394 8,171 - 345,764 6.8 60.9 568,039 5.5 1994 286,248 77,804 9,066 - 373,118 7.9 61.7 604,727 6.5 1995 311,565 84,525 10,902 117 407,109 9.1 62.9 647,314 7.0 1996 326,713 92,166 11,537 369 430,784 5.8 63.8 675,475 4.4 1997 341,699 96,392 12,743 567 451,401 4.8 65.0 694,163 2.8 1998 362,379 101,092 13,797 773 478,041 5.9 66.3 721,411 3.9 1999 378,061 109,443 15,106 954 503,564 5.3 67.1 750,417 4.0 2000 391,729 103,469 35,698 1,086 531,982 5.6 68.1 781,272 4.1 2001 406,178 107,216 44,873 1,250 559,517 5.2 68.7 814,007 4.2 2002 425,025 107,125 50,792 1,437 584,379 4.4 69.9 835,666 2.7 2003 429,959 106,343 55,387 1,489 593,178 1.5 70.4 842,668 0.8 2004 438,143 105,879 61,125 1,389 606,537 2.3 70.8 856,469 1.6
SocialSecurity
Expenditure
Annualrate of
increase
Total (A)TotalSubsidies
foremployees
Annual rateof increase
% of total(A)
Fiscal year Pensionbenefits
Medicalcare
benefits
Welfareservicebenefits

IPSS: Statistical Report No. 17
15
Table 6 Social Security Expenditure for child and family, fiscal years 1975-2004Total
Total
Familyallowance
Childallowance
Child rearingallowance
Hundredof millions
of yen
Hundredof millions
of yen
Hundredof millions
of yen
Hundredof millions
of yen
Hundredof millions
of yen
Hundredof millions
of yen
Hundredof millions
of yen
Hundredof millions
of yen% %
1975 1,829 1,444 385 3,549 - 5,378 1,229 6,608 - 5.6 1976 2,333 1,691 642 4,258 - 6,591 915 7,505 13.6 5.2 1977 2,509 1,695 814 4,802 - 7,311 1,702 9,013 20.1 5.3 1978 2,834 1,719 1,114 5,243 - 8,076 1,683 9,759 8.3 4.9 1979 3,180 1,785 1,396 5,744 - 8,924 1,668 10,591 8.5 4.8 1980 3,560 1,778 1,782 5,998 - 9,558 1,639 11,197 5.7 4.5 1981 3,790 1,641 2,149 6,225 - 10,014 2,149 12,163 8.6 4.4 1982 4,109 1,660 2,449 6,386 - 10,494 2,240 12,735 4.7 4.2 1983 4,365 1,650 2,715 6,138 - 10,503 2,260 12,763 0.2 4.0 1984 4,544 1,637 2,908 6,408 - 10,952 2,641 13,593 6.5 4.0 1985 4,617 1,589 3,027 6,836 - 11,453 3,060 14,513 6.8 4.1 1986 4,604 1,605 3,000 7,635 - 12,239 3,161 15,401 6.1 4.0 1987 4,574 1,558 3,016 7,356 - 11,931 3,150 15,080 ▲ 2.1 3.7 1988 4,500 1,488 3,012 7,555 - 12,055 3,105 15,160 0.5 3.6 1989 4,465 1,454 3,011 8,046 - 12,511 2,990 15,501 2.3 3.5 1990 4,449 1,391 3,059 8,532 - 12,981 3,005 15,986 3.1 3.4 1991 4,439 1,381 3,058 9,327 - 13,766 3,104 16,870 5.5 3.4 1992 5,267 2,173 3,094 9,691 - 14,958 3,692 18,650 10.6 3.5 1993 5,072 1,942 3,130 10,424 6 15,502 3,775 19,277 3.4 3.4 1994 4,928 1,710 3,218 10,768 5 15,701 4,224 19,925 3.4 3.3 1995 5,112 1,612 3,500 11,177 327 16,616 4,753 21,369 7.2 3.3 1996 5,201 1,536 3,666 13,312 507 19,021 4,594 23,615 10.5 3.5 1997 5,304 1,497 3,807 12,809 559 18,672 4,585 23,258 ▲ 1.5 3.4 1998 5,370 1,486 3,885 13,336 603 19,310 4,687 23,997 3.2 3.3 1999 5,524 1,547 3,977 14,188 643 20,355 4,617 24,972 4.1 3.3 2000 7,116 2,917 4,199 14,963 721 22,801 4,618 27,419 9.8 3.5 2001 8,574 4,062 4,512 15,875 1,078 25,527 4,606 30,133 9.9 3.7 2002 8,964 4,315 4,649 16,765 1,241 26,970 4,543 31,513 4.6 3.8 2003 9,158 4,365 4,792 16,724 1,304 27,186 4,440 31,626 0.4 3.8 2004 11,236 5,909 5,327 13,857 1,370 26,463 4,443 30,906 ▲ 2.3 3.6
Annual rateof increase % of total
Fiscal year Maternityallowance
Childwelfareservice
Parent leaveallowance

IPSS: Statistical Report No. 17
16
Table 7 Social Security Expenditure by institutional scheme, fiscal years 1995-2004
Notes: 1. Health and Medical Services for the Aged include public health measures (e.g., medical check-ups andcounseling)
2. Family allowance includes income support for single parent families and for handicapped children.3. Employment insurance, etc. includes unemployment benefits, etc. by both Employment Insurance and
Seamen’s Insurance.4. The applicable age group for the healthcare system for the elderly was raised by five years in October
2002, from the over-70s to the over-75s; thus it is necessary to bear in mind that the above figures forelderly healthcare benefits in 2001, 2002, 2003, and 2004 differ in terms of their applicable age range.According to the “2004 National Medical Care Expenditure (Estimates) (Ministry of Health, Labour andWelfare),” the rate of increase in the national medical expenses for the over-75s rose by 0.5% in 2002, by3.8% in 2003, and by 5.7% in 2004 (compared with each previous year).
1995 1996 1997 1998 1999 2000 2001 2002 2003 2004
Total 64,731,417 67,547,515 69,416,332 72,141,071 75,041,726 78,127,238 81,400,724 83,566,605 84,266,791 85,646,871
Medical insurance 14,623,415 15,019,579 14,665,248 14,360,954 14,436,281 14,572,699 14,791,576 14,439,575 14,711,798 15,276,653
Health and MedicalServices for the Aged 8,582,796 9,300,376 9,777,650 10,188,446 11,026,058 10,447,419 10,804,055 10,801,187 10,722,379 10,675,977
Long-term care insurance - - - - - 3,252,114 4,122,775 4,666,117 5,110,400 5,577,221
Pension benefits 31,156,538 32,671,304 34,169,859 36,237,881 37,806,127 39,172,913 40,617,812 42,502,502 42,995,871 43,814,337
Employment insurance etc. 2,207,155 2,209,495 2,313,828 2,703,379 2,836,289 2,664,958 2,713,358 2,619,154 2,024,562 1,528,279
Workmen's accidentcompensation insurance 1,028,878 1,045,874 1,054,426 1,044,118 1,025,530 1,018,528 1,015,412 982,922 973,367 958,723
Family allowance 511,187 520,129 530,420 537,013 552,367 711,649 857,359 896,364 915,765 1,123,641
Public assistance 1,484,894 1,502,467 1,606,257 1,682,009 1,814,815 1,929,889 2,060,403 2,186,944 2,365,553 2,552,832
Social welfare 2,603,244 2,832,488 2,915,792 3,082,738 3,312,714 2,186,116 2,315,279 2,460,662 2,469,655 2,312,399
Public health 606,661 594,807 560,325 545,734 547,837 563,047 568,112 551,989 601,165 543,981
Gratuities for retired publicemployees 1,720,624 1,659,031 1,599,757 1,547,077 1,486,055 1,419,745 1,350,930 1,280,425 1,204,272 1,193,156
Aid for war victims 206,023 191,963 222,770 211,723 197,651 188,161 183,654 178,763 172,005 89,672
Total 100.0 100.0 100.0 100.0 100.0 100.0 100.0 100.0 100.0 100.0
Medical insurance 22.6 22.2 21.1 19.9 19.2 18.7 18.2 17.3 17.5 17.8
Health and MedicalServices for the Aged 13.3 13.8 14.1 14.1 14.7 13.4 13.3 12.9 12.7 12.5
Long-term care insurance - - - - - 4 5.1 5.6 6.1 6.5
Pension benefits 48.1 48.4 49.2 50.2 50.4 50.1 49.9 50.9 51.0 51.2
Employment insurance etc. 3.4 3.3 3.3 3.7 3.8 3.4 3.3 3.1 2.4 1.8
Workmen's accidentcompensation insurance 1.6 1.5 1.5 1.4 1.4 1.3 1.2 1.2 1.2 1.1
Family allowance 0.8 0.8 0.8 0.7 0.7 0.9 1.1 1.1 1.1 1.3
Public assistance 2.3 2.2 2.3 2.3 2.4 2.5 2.5 2.6 2.8 3.0
Social welfare 4.0 4.2 4.2 4.3 4.4 2.8 2.8 2.9 2.9 2.7
Public health 0.9 0.9 0.8 0.8 0.7 0.7 0.7 0.7 0.7 0.6
Gratuities for retired publicemployees 2.7 2.5 2.3 2.1 2.0 1.8 1.7 1.5 1.4 1.4
Aid for war victims 0.3 0.3 0.3 0.3 0.3 0.2 0.2 0.2 0.2 0.1R
atio to the total (%)
Expenditure (m
illions of yen)
Fiscal Year

IPSS: Statistical Report No. 17
17
Table 8 Social Security Expenditure by functional category, fiscal years 2000-2004
Note: Table 8 has been calculated in accordance with the standards of the ILO's "The Cost of Social Security 19th
International Inquiry."
(Unit: Million of yen)2000 2001 2002 2003 2004
Social Security Expenditure 78,127,238 81,400,724 83,566,605 84,266,791 85,646,871I Old age 36,827,004 38,950,874 41,238,195 42,007,917 43,192,160
Cash benefits 33,292,829 34,530,579 36,246,586 36,569,425 37,188,028Normal retirement pension 32,676,547 33,928,365 35,190,854 35,987,688 36,724,189Early retirement pension - - - - -
Lump sum payments - - - - -
Retirement grants 586,709 552,735 995,544 518,800 402,665Other cash benefits 29,573 49,479 60,187 62,937 61,174
Benefits in kind 3,534,175 4,420,295 4,991,610 5,438,491 6,004,132II Survivors 5,874,743 6,005,681 6,087,524 6,168,727 6,252,736
Cash benefits 5,873,870 6,004,892 6,086,813 6,168,104 6,252,220Survivors' pension 5,754,698 5,884,224 5,966,577 6,048,610 6,147,198Lump sum payments 11,301 11,163 10,299 10,378 11,431Survivors grants - - - - -
Other cash benefits 107,871 109,506 109,937 109,116 93,591Benefits in kind 873 789 711 623 517
Funeral expenses - - - - -
Other 873 789 711 623 517III Invalidity benefits 1,874,664 1,905,079 1,939,278 1,949,525 1,973,145
Cash benefits 1,670,284 1,692,407 1,715,825 1,727,152 1,749,181Full invalidity pension 1,623,413 1,645,877 1,669,335 1,680,606 1,702,193Partial invalidity pension - - - - -
Early retirement pension - - - - -
Lump sum payments 348 343 350 386 381Invalidity grants - - - - -
Other cash benefits 46,523 46,179 46,140 46,161 46,607Benefits in kind 204,380 212,672 223,452 222,373 223,965
IV Employment injury 1,037,704 1,034,645 1,001,203 991,249 976,269Cash benefits to the insured 496,743 494,757 481,670 473,042 461,604
Temporary cash benefits 188,542 186,819 178,465 172,921 166,465Long-term cash benefits (pensions) 238,348 238,050 235,370 233,322 230,525Other cash benefits 69,853 69,888 67,834 66,798 64,614
Cash benefits survivors 266,317 267,952 271,298 271,656 269,540Periodic benefit 243,617 245,343 248,466 248,539 247,211Other cash benefits 22,700 22,609 22,832 23,117 22,330
Benefits in kind 274,645 271,936 248,235 246,551 245,125Medical care 272,805 269,986 246,046 244,280 242,737Other benefits in kind 1,839 1,950 2,189 2,271 2,388
V Sickness and health 25,640,763 26,208,481 25,837,414 26,085,055 26,546,608Cash benefits 946,355 928,655 913,037 897,011 904,681
Sickness benefits 269,362 251,035 240,733 235,582 243,371Maternity benefits 461,623 460,350 454,080 443,724 444,084Other cash benefits 215,370 217,270 218,225 217,705 217,227
Benefits in kind (health) 24,694,408 25,279,826 24,924,378 25,188,045 25,641,927VI Family benefits 2,282,577 2,555,851 2,700,094 2,721,735 2,649,429
Cash benefits 786,251 968,323 1,023,623 1,049,291 1,263,761Periodic cash payments 786,251 968,323 1,023,623 1,049,291 1,263,761Other cash benefits - - - - -
Benefits in kind 1,496,326 1,587,528 1,676,471 1,672,444 1,385,668VII Unemployment 2,627,083 2,652,439 2,547,179 1,947,088 1,444,236
Cash benefits 2,627,083 2,652,439 2,547,179 1,947,088 1,444,236Regular Unemployment benefits 2,183,121 2,255,704 2,152,741 1,631,601 1,212,014Special periodic payments 272,407 250,397 242,050 166,847 149,852Severance/redundancy payments - - - - -
Other cash benefits 171,555 146,339 152,388 148,640 82,370Benefits in kind - - - - -
VIII Housing 198,619 220,058 250,321 279,623 313,019Cash benefits 198,619 220,058 250,321 279,623 313,019
Rent subsidy 198,619 220,058 250,321 279,623 313,019Benefits in kind - - - - -
Rent support - - - - -
Subsidies to home owners - - - - -
Other cash benefits - - - - -
IX Social assistance and others 1,764,080 1,867,616 1,965,398 2,115,873 2,299,270Cash benefits 656,587 696,762 765,015 823,449 879,120
Periodic cash payments 651,379 692,053 759,912 817,534 869,296Other cash payments 5,208 4,709 5,103 5,916 9,825
Benefits in kind 1,107,493 1,170,855 1,200,383 1,292,424 1,420,150

IPSS: Statistical Report No. 17
18
Table 9 Cost of Social Security in fiscal year 2004 according to the ILO standards(Unit: Million of yen)
1. Health Insurance(A)Government-managed 3,232,733 3,233,843 ― 900,162 ― 8 (B)Society-managed 2,841,703 3,489,664 ― 11,358 ― 73,316
2. National Health Insurance 4,010,124 ― ― 4,277,878 1,185,575 ―
Medical Care ServiceProgram for RetiredEmployees(republished)
663,225 ― ― ― ― ―
3. Health and MedicalServices for the Aged
― ― ― 2,608,044 1,302,260 ―
4. Long-term care insurance 956,452 ― ― 1,424,915 1,652,301 121 5. Employees' Pension
Insurance9,726,850 9,726,850 ― 4,322,860 ― 3,693,356
6. Employees' Pension Funds, etc. 408,551 1,504,637 ― 486 ― 1,687,430 7. National Pension 1,935,434 ― ― 1,614,804 ― 273,674 8. Farmers' Pension Fund, etc. 170,298 ― ― 153,024 ― 113,358 9. Seamen's Insurance 21,047 44,129 ― 4,891 ― 1,531
10. Agricultural, Forestry and FisheryOrganization, Employees' Mutual AidAssociation
― 13,538 ― 3,468 ― 4,639
11. Promotion and Mutual Aid Corporationfor Private Schools of Japan
237,863 232,530 ― 50,308 7,745 57,125
12. Employment Insurance 1,021,759 1,535,002 ― 476,744 ― 1,542 13. Workmen's Accident
Compensation Insurance― 1,044,726 ― 1,307 ― 109,698
14. Child Allowance ― 187,523 ― 293,168 186,162 ―
15. National and related public serviceMutual Aid Association
755,842 1,244,920 ― 153,585 ― 207,545
16. Existing Associations, etc. ― 354,265 ― 625 ― 23,658 17. Local Government Employees'
Mutual Aid Association2,208,962 3,466,205 ― 596 385,770 751,512
18. Yahata Mutual Aid Association, etc. ― 557 ― 13,718 ― 40 19. Government Employees' Accident
Compensation― 12,335 ― ― ― ―
20. Local Government Employees'Accident Compensation
0 26,327 ― ― ― 1,916
21. Public Corporation Staffs'Accident Compensation
― 6,287 ― ― ― ―
22. National PublicEmployees' Pensions
921 41,758 ― 143 ― ―
23. Local Public Employees' Pensions(gratuity)
― 60,488 ― ― ― ―
24. Public Health ― ― ― 486,977 254,810 ―
25. Public assistance ― ― ― 1,952,750 647,617 ―
26. Social welfare ― ― ― 1,763,450 1,313,442 ―
27. Aid for war victims ― ― ― 1,185,976 ― ―
27,528,537 26,225,584 ― 21,701,236 6,935,682 7,000,469
War victims:
Total
Contributions
Social insurance:
Family allowance:
Public employees:
Social Security schemesInsuredpersons Employers
Receipts
Other publicauthorities
Income fromcapital
Public health service:
Public assistance & social welfare:
SocialSecurity
Special Tax
Stateparticipation

IPSS: Statistical Report No. 17
19
continued (No. 2)(Unit: Million of yen)
1. Health Insurance(A)Government-managed 24,299 7,391,046 161 7,391,206 3,582,271 304,115 (B)Society-managed 370,814 6,786,854 ― 6,786,854 2,740,057 245,396
2. National Health Insurance 457,071 9,930,647 1,834,111 11,764,758 7,153,957 97,688 Medical Care ServiceProgram for RetiredEmployees(republished)
― 663,225 1,834,111 2,497,336 2,057,584 ―
3. Health and MedicalServices for the Aged
― 3,910,305 6,634,021 10,544,326 10,587,914 ―
4. Long-term care insurance 104,759 4,138,548 1,799,008 5,937,557 ― ―
5. Employees' PensionInsurance
17,845 27,487,759 7,494,808 34,982,567 ― ―
6. Employees' Pension Funds, etc. 37,571 3,638,675 85,188 3,723,863 ― ―
7. National Pension 1,544,137 5,368,049 12,472,571 17,840,621 ― ―
8. Farmers' Pension Fund, etc. 19,539 456,219 ― 456,219 ― ―
9. Seamen's Insurance 881 72,479 ― 72,479 16,463 1,989 10. Agricultural, Forestry and Fishery
Organization, Employees' Mutual AidAssociation
710,075 731,720 221 731,941 ― ―
11. Promotion and Mutual Aid Corporationfor Private Schools of Japan
1,110 586,680 18,996 605,676 88,528 8,167
12. Employment Insurance 22,046 3,057,094 ― 3,057,094 ― 82,754 13. Workmen's Accident
Compensation Insurance252,180 1,407,911 ― 1,407,911 ― ―
14. Child Allowance 1,724 668,577 ― 668,577 ― ―
15. National and related public serviceMutual Aid Association
45,332 2,407,223 243,694 2,650,917 215,835 20,568
16. Existing Associations, etc. 317 378,865 ― 378,865 ― ―
17. Local Government Employees'Mutual Aid Association
16,409 6,829,454 391,908 7,221,362 620,743 84,167
18. Yahata Mutual Aid Association, etc. ― 14,316 ― 14,316 60 1,700 19. Government Employees' Accident
Compensation― 12,335 ― 12,335 ― ―
20. Local Government Employees'Accident Compensation
2,942 31,186 ― 31,186 ― ―
21. Public Corporation Staffs'Accident Compensation
― 6,287 ― 6,287 ― ―
22. National PublicEmployees' Pensions
― 42,821 ― 42,821 ― ―
23. Local Public Employees' Pensions(gratuity)
― 60,488 ― 60,488 ― ―
24. Public Health ― 741,787 ― 741,787 466,930 108,990
25. Public assistance ― 2,600,366 ― 2,600,366 1,319,761 253 26. Social welfare ― 3,076,892 ― 3,076,892 117,208 ―
27. Aid for war victims ― 1,185,976 ― 1,185,976 1,222 ―
3,629,050 93,020,560 30,974,687 123,995,246 26,910,949 955,786
Social Security schemes
Social insurance:
Family allowance:
Public employees:
Public health service:
Public assistance & social welfare:
War victims:
Total
Other receipets
Receipts
Subtotal Transfer fromother schemes Total receipets
ExpendituresBenefits
Sickness & Childbirth
Medical care Cash benefits

IPSS: Statistical Report No. 17
20
continued (No. 3)(Unit: Million of yen)
PensionsCash benefits
otherthan pensions
1. Health Insurance(A)Government-managed ― ― ― ― ― ― ―
(B)Society-managed ― ― ― ― ― ― ―
2. National Health Insurance ― ― ― ― ― ― ―
Medical Care ServiceProgram for RetiredEmployees(republished)
― ― ― ― ― ― ―
3. Health and MedicalServices for the Aged
― ― ― ― ― ― ―
4. Long-term care insurance ― ― ― ― ― ― ―
5. Employees' PensionInsurance
― ― ― ― 21,538,042 ― ―
6. Employees' Pension Funds, etc. ― ― ― ― 1,807,630 ― ―
7. National Pension ― ― ― ― 13,923,039 ― ―
8. Farmers' Pension Fund, etc. ― ― ― ― 192,956 ― ―
9. Seamen's Insurance 4,506 ― 5,709 2,099 ― 3,129 ―
10. Agricultural, Forestry and FisheryOrganization, Employees' Mutual AidAssociation
― ― ― ― 51,625 ― ―
11. Promotion and Mutual Aid Corporationfor Private Schools of Japan
― ― ― ― 225,209 ― ―
12. Employment Insurance ― ― ― ― ― 1,441,107 ―
13. Workmen's AccidentCompensation Insurance
227,168 2,345 480,004 192,260 ― ― ―
14. Child Allowance ― ― ― ― ― ― 590,923
15. National and related public serviceMutual Aid Association
― ― 4,043 ― 1,673,817 ― ―
16. Existing Associations, etc. ― ― 4,873 ― 37,434 ― ―
17. Local Government Employees'Mutual Aid Association
― ― 6,531 ― 4,344,262 ― ―
18. Yahata Mutual Aid Association, etc. ― ― ― ― 4,875 ― ―
19. Government Employees' AccidentCompensation
3,966 17 6,444 1,907 ― ― ―
20. Local Government Employees'Accident Compensation
7,069 26 16,724 4,291 ― ― ―
21. Public Corporation Staffs'Accident Compensation
27 ― 6,227 33 ― ― ―
22. National PublicEmployees' Pensions
― ― ― ― 42,678 ― ―
23. Local Public Employees' Pensions(gratuity)
― ― ― ― 60,488 ― ―
24. Public Health ― ― ― ― 1,885 ― ―
25. Public assistance ― ― ― ― ― ― ―
26. Social welfare ― ― ― ― ― ― 532,718
27. Aid for war victims ― ― ― ― 1,084,333 ― ―
242,737 2,388 530,555 200,589 44,988,274 1,444,236 1,123,641
BenefitsExpenditure
Unemploymentlabor marked
measures
Familybenefits
Cash benefits
Medical care Other thanmedical care
Pensions
Work-related accidents
Public health service:
Public assistance & social welfare:
War victims:
Total
Social Security schemes
Social insurance:
Family allowance:
Public employees:

IPSS: Statistical Report No. 17
21
continued (No. 4)(Unit: Million of yen)
1. Health Insurance(A)Government-managed ― ― ― 19,763 3,906,149 55,130 ―
(B)Society-managed ― ― ― 14,444 2,999,898 123,483 ―
2. National Health Insurance ― ― ― 36,747 7,288,392 224,359 ―
Medical Care ServiceProgram for RetiredEmployees(republished)
― ― ― ― 2,057,584 ― ―
3. Health and MedicalServices for the Aged
― ― ― ― 10,587,914 ― ―
4. Long-term care insurance 5,517,026 60,195 ― ― 5,577,221 199,192 ―
5. Employees' PensionInsurance
― ― ― ― 21,538,042 83,986 ―
6. Employees' Pension Funds, etc. ― ― ― ― 1,807,630 147,253 2,904 7. National Pension ― ― ― ― 13,923,039 132,079 ― 8. Farmers' Pension Fund, etc. ― ― ― ― 192,956 11,655 ― 9. Seamen's Insurance ― 2 ― 568 34,465 1,754 ―
10. Agricultural, Forestry and FisheryOrganization, Employees' Mutual AidAssociation
― ― ― ― 51,625 2,330 ―
11. Promotion and Mutual Aid Corporationfor Private Schools of Japan
― ― ― 2,010 323,914 4,050 ―
12. Employment Insurance ― 1,290 ― ― 1,525,150 116,271 ―
13. Workmen's AccidentCompensation Insurance
― ― ― ― 901,777 47,767 ―
14. Child Allowance ― ― 60,443 ― 651,367 2,140 ―
15. National and related public serviceMutual Aid Association
― 77 ― 4,707 1,919,046 6,745 ―
16. Existing Associations, etc. ― ― ― ― 42,307 1,748 ―
17. Local Government Employees'Mutual Aid Association
― 1,019 ― 13,514 5,070,237 36,048 ―
18. Yahata Mutual Aid Association, etc. ― ― ― ― 6,635 229 ―
19. Government Employees' AccidentCompensation
― ― ― ― 12,335 ― ―
20. Local Government Employees'Accident Compensation
― ― ― ― 28,109 1,912 ―
21. Public Corporation Staffs'Accident Compensation
― ― ― ― 6,287 ― ―
22. National PublicEmployees' Pensions
― ― ― ― 42,678 143 ―
23. Local Public Employees' Pensions(gratuity)
― ― ― ― 60,488 ― ―
24. Public Health 3,499 ― 50,739 1 632,044 2,240 ―
25. Public assistance 45,779 ― ― 1,187,040 2,552,832 47,534 ―
26. Social welfare ― ― 2,087,406 47,342 2,784,673 17,546 ―
27. Aid for war victims ― ― 517 93,591 1,179,662 6,314 ―
5,566,304 62,582 2,199,105 1,419,726 85,646,871 1,271,905 2,904
War victims:
BenefitsOthers
Other thanmedical care Cash benefits
Long-term careTotal
Social Security schemes
Social insurance:
Administrativecosts
Operatingloss
Expenditure
Total
Benefit inkind Cash benefits
Family allowance:
Public employees:
Public health service:
Public assistance & social welfare:

IPSS: Statistical Report No. 17
22
continued (No. 5)(Unit: Million of yen)
1. Health Insurance(A)Government-managed 224,434 4,185,712 3,112,677 7,298,389 92,818 (B)Society-managed 502,501 3,625,882 2,572,306 6,198,188 588,666
2. National Health Insurance 521,489 8,034,240 3,501,798 11,536,037 228,721 Medical Care ServiceProgram for RetiredEmployees(republished)
― 2,057,584 ― 2,057,584 439,753
3. Health and MedicalServices for the Aged
46,605 10,634,519 ― 10,634,519 ▲ 90,193
4. Long-term care insurance 103,895 5,880,308 197 5,880,504 57,052 5. Employees' Pension
Insurance145,803 21,767,832 10,879,479 32,647,311 2,335,256
6. Employees' Pension Funds, etc. 28,361 1,986,148 ― 1,986,148 1,737,715 7. National Pension 39,819 14,094,937 2,189,107 16,284,044 1,556,577 8. Farmers' Pension Fund, etc. 9,431 214,042 ― 214,042 242,177 9. Seamen's Insurance 1,857 38,076 28,775 66,850 5,628
10. Agricultural, Forestry and FisheryOrganization, Employees' Mutual AidAssociation
675,637 729,592 2,349 731,941 0
11. Promotion and Mutual Aid Corporationfor Private Schools of Japan
1,216 329,180 237,636 566,816 38,860
12. Employment Insurance 344,093 1,985,514 ― 1,985,514 1,071,580 13. Workmen's Accident
Compensation Insurance176,894 1,126,437 ― 1,126,437 281,474
14. Child Allowance 8,153 661,660 ― 661,660 6,917
15. National and related public serviceMutual Aid Association
6,871 1,932,663 646,626 2,579,289 71,627
16. Existing Associations, etc. 7 44,061 451,775 495,836 ▲ 116,971 17. Local Government Employees'
Mutual Aid Association1,024 5,107,309 1,820,466 6,927,775 293,588
18. Yahata Mutual Aid Association, etc. 7,436 14,300 ― 14,300 16 19. Government Employees' Accident
Compensation― 12,335 ― 12,335 0
20. Local Government Employees'Accident Compensation
1,099 31,120 ― 31,120 66
21. Public Corporation Staffs'Accident Compensation
― 6,287 ― 6,287 0
22. National PublicEmployees' Pensions
― 42,821 ― 42,821 0
23. Local Public Employees' Pensions(gratuity)
― 60,488 ― 60,488 0
24. Public Health 107,503 741,787 ― 741,787 0
25. Public assistance ― 2,600,366 ― 2,600,366 026. Social welfare 274,672 3,076,892 ― 3,076,892 0
27. Aid for war victims ― 1,185,976 ― 1,185,976 03,228,801 90,150,482 25,443,190 115,593,672 8,401,574
Differencebetween
receipts andexpenditures(balance ofpayments)
Totalexpenditures
Expenditure
Others Transfer to otherschemesSubtotal
Public health service:
Public assistance & social welfare:
War victims:
Total
Social Security schemes
Social insurance:
Family allowance:
Public employees:
IPSS: Statistical Report No. 17
23
Note: 1. Table 9 has been calculated in accordance with the standards of the ILO's "The Cost of Social Security18th International Inquiry." The estimates were made through the annual settlement of each scheme'saccounts for fiscal year 2004.
2. “Health and Medical Services for the Aged” includes only medical care benefits and grants for nursinghomes and excludes other health services such as medical check-ups and counseling, which are includedin “Public health.”
3. “National Pension” includes the welfare pension and the universal basic pensions. 4. The income from capital of Employees' Pension Insurance and National Pension is estimated with
reference to the Annual Report of Capital Gain of Pensions' Funds for fiscal year 2004. The estimated sumincludes an inherited gain and loss from the previous scheme.
5. “Employees’ Pension Fund, etc.” includes the Load Mining Pension Fund. 6. “Farmers' Pension Fund, etc.” includes the National Pension Fund. 7. “Agricultural, Forestry and Fishery Organization, Employees' Mutual Aid Association” was amalgamated
into Employees' Pension Insurance on April 1, 2002; however, the third tier of the original pension schemeremained in the former organization.
8. “Public health” includes public grants for the treatment of tuberculosis, etc. 9. “Family benefits” include not only child allowances but also income support for single parent families and
handicapped children. 10. As of April 1997, short-term benefits (i.e., medical benefits) of “Public Corporations Staff Mutual Aid
Associations” have been transferred to society-managed health insurance, and long-term benefits (i.e.,pension benefits) have been integrated into employees' pensions. Further, part of the pension benefitshave also been transferred to "16. Existing Associations, etc."
11. Rounding of the numbers may cause some discrepancies. After the rounding of numbers, zerorepresents up to one million.
12. “Unemployment and labor market measures” include subsidies for elderly employees.
Explanatory notes on items from “Cost of Social Security” 1. Explanatory notes on receipts items
(i) Income from capital includes interest, dividends, rents, capital gains, profits from redemption, etc.(ii) Transfers from other schemes include the following: contributions to special schemes for persons
employed on a daily-wage basis in Government-managed Health Insurance and National HealthInsurance; transfer payments from all health insurance schemes to the Medical Care Service Programfor Retired Employees in National Health Insurance; transfer payments from all health insuranceschemes to Health and Medical Services for the Aged; transfer payments from all schemes to theNational Pension for contribution to universal basic pensions; transfer payments from the NationalPension to other schemes for the payment of universal Basic Pensions, transfer payments from allhealth insurance schemes to Long-term care insurance, etc.
(iii) Other receipts include fees, cost-sharing, indemnities for damage, etc. 2. Explanatory notes on expenditure items
(i) Administrative costs include various costs for running offices, membership fees, transportation costsfor business trips, etc.
(ii) Operating loss in capital market; Evaluated loss of funds at the end of the accounting year.(iii) Transfers to other schemes include transfer payments from the other health insurance schemes to
special schemes for persons employed on a daily-wage basis, for Retired Employees, and for Healthand Medical Services for the Aged; transfer payments from Other pension schemes to the NationalPension for universal Basic Pensions; transfer payments paid by the National Pension to the otherschemes for the universal Basic Pension, transfer payments from all health insurance schemes toLong-term care contributions, etc.
(iv) Other expenditures include administrative costs for the Social Insurance Medical Fee Payment Fund,grants for constructing medical care and welfare service facilities, Maintenance fees for the facilities,etc.
IPSS: Statistical Report No. 17
24
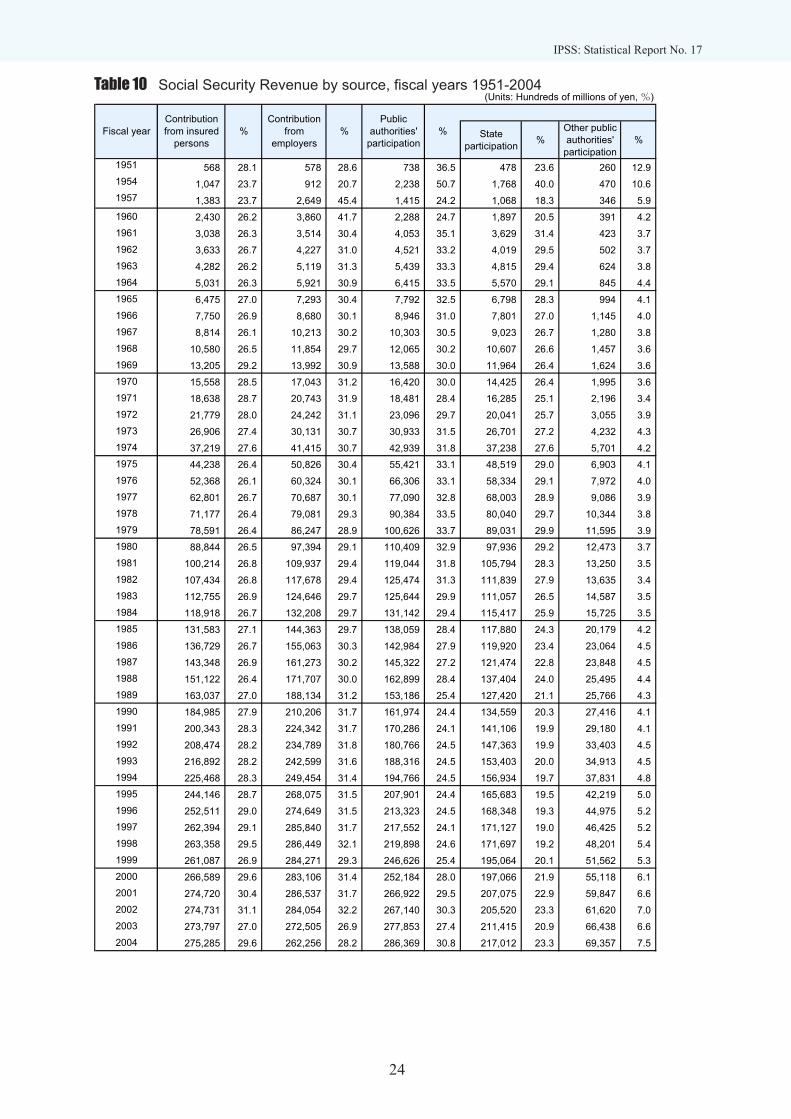
Table 10 Social Security Revenue by source, fiscal years 1951-2004(Units: Hundreds of millions of yen, %)
Stateparticipation %
Other publicauthorities'
participation%
1951 568 28.1 578 28.6 738 36.5 478 23.6 260 12.91954 1,047 23.7 912 20.7 2,238 50.7 1,768 40.0 470 10.61957 1,383 23.7 2,649 45.4 1,415 24.2 1,068 18.3 346 5.91960 2,430 26.2 3,860 41.7 2,288 24.7 1,897 20.5 391 4.21961 3,038 26.3 3,514 30.4 4,053 35.1 3,629 31.4 423 3.71962 3,633 26.7 4,227 31.0 4,521 33.2 4,019 29.5 502 3.71963 4,282 26.2 5,119 31.3 5,439 33.3 4,815 29.4 624 3.81964 5,031 26.3 5,921 30.9 6,415 33.5 5,570 29.1 845 4.41965 6,475 27.0 7,293 30.4 7,792 32.5 6,798 28.3 994 4.11966 7,750 26.9 8,680 30.1 8,946 31.0 7,801 27.0 1,145 4.01967 8,814 26.1 10,213 30.2 10,303 30.5 9,023 26.7 1,280 3.81968 10,580 26.5 11,854 29.7 12,065 30.2 10,607 26.6 1,457 3.61969 13,205 29.2 13,992 30.9 13,588 30.0 11,964 26.4 1,624 3.61970 15,558 28.5 17,043 31.2 16,420 30.0 14,425 26.4 1,995 3.61971 18,638 28.7 20,743 31.9 18,481 28.4 16,285 25.1 2,196 3.41972 21,779 28.0 24,242 31.1 23,096 29.7 20,041 25.7 3,055 3.91973 26,906 27.4 30,131 30.7 30,933 31.5 26,701 27.2 4,232 4.31974 37,219 27.6 41,415 30.7 42,939 31.8 37,238 27.6 5,701 4.21975 44,238 26.4 50,826 30.4 55,421 33.1 48,519 29.0 6,903 4.11976 52,368 26.1 60,324 30.1 66,306 33.1 58,334 29.1 7,972 4.01977 62,801 26.7 70,687 30.1 77,090 32.8 68,003 28.9 9,086 3.91978 71,177 26.4 79,081 29.3 90,384 33.5 80,040 29.7 10,344 3.81979 78,591 26.4 86,247 28.9 100,626 33.7 89,031 29.9 11,595 3.91980 88,844 26.5 97,394 29.1 110,409 32.9 97,936 29.2 12,473 3.71981 100,214 26.8 109,937 29.4 119,044 31.8 105,794 28.3 13,250 3.51982 107,434 26.8 117,678 29.4 125,474 31.3 111,839 27.9 13,635 3.41983 112,755 26.9 124,646 29.7 125,644 29.9 111,057 26.5 14,587 3.51984 118,918 26.7 132,208 29.7 131,142 29.4 115,417 25.9 15,725 3.51985 131,583 27.1 144,363 29.7 138,059 28.4 117,880 24.3 20,179 4.21986 136,729 26.7 155,063 30.3 142,984 27.9 119,920 23.4 23,064 4.51987 143,348 26.9 161,273 30.2 145,322 27.2 121,474 22.8 23,848 4.51988 151,122 26.4 171,707 30.0 162,899 28.4 137,404 24.0 25,495 4.41989 163,037 27.0 188,134 31.2 153,186 25.4 127,420 21.1 25,766 4.31990 184,985 27.9 210,206 31.7 161,974 24.4 134,559 20.3 27,416 4.11991 200,343 28.3 224,342 31.7 170,286 24.1 141,106 19.9 29,180 4.11992 208,474 28.2 234,789 31.8 180,766 24.5 147,363 19.9 33,403 4.51993 216,892 28.2 242,599 31.6 188,316 24.5 153,403 20.0 34,913 4.51994 225,468 28.3 249,454 31.4 194,766 24.5 156,934 19.7 37,831 4.81995 244,146 28.7 268,075 31.5 207,901 24.4 165,683 19.5 42,219 5.01996 252,511 29.0 274,649 31.5 213,323 24.5 168,348 19.3 44,975 5.21997 262,394 29.1 285,840 31.7 217,552 24.1 171,127 19.0 46,425 5.21998 263,358 29.5 286,449 32.1 219,898 24.6 171,697 19.2 48,201 5.41999 261,087 26.9 284,271 29.3 246,626 25.4 195,064 20.1 51,562 5.32000 266,589 29.6 283,106 31.4 252,184 28.0 197,066 21.9 55,118 6.12001 274,720 30.4 286,537 31.7 266,922 29.5 207,075 22.9 59,847 6.62002 274,731 31.1 284,054 32.2 267,140 30.3 205,520 23.3 61,620 7.02003 273,797 27.0 272,505 26.9 277,853 27.4 211,415 20.9 66,438 6.62004 275,285 29.6 262,256 28.2 286,369 30.8 217,012 23.3 69,357 7.5
Publicauthorities'
participation%Fiscal year
Contributionfrom insured
persons
Contributionfrom
employers%%

IPSS: Statistical Report No. 17
25
Table 10 continued
Note: 1. Table 10 has been calculated in accordance with the standards of the ILO's "The Cost of Social Security18th International Inquiry." However, a "Social Security special tax" does not exist in Japan, and thereforeis not indicated in this chart.
2. "Public authorities' participation" is the total of "State participation" and "Other public authorities'participation." "Other public authorities" means local governments' participation.
(Units: Hundreds of millions of yen, %)
22 1.1 117 5.8 2,023
96 2.2 124 2.8 4,417
148 2.5 245 4.2 5,839
458 4.9 224 2.4 9,260
621 5.4 319 2.8 11,545
787 5.8 448 3.3 13,616
965 5.9 549 3.4 16,353
1,203 6.3 567 3.0 19,137
1,516 6.3 921 3.8 23,996
1,938 6.7 1,536 5.3 28,850
2,459 7.3 2,030 6.0 33,820
3,087 7.7 2,349 5.9 39,933
3,925 8.7 536 1.2 45,247
4,796 8.8 864 1.6 54,681
6,158 9.5 957 1.5 64,978
7,535 9.7 1,226 1.6 77,877
9,137 9.3 1,095 1.1 98,202
11,737 8.7 1,678 1.2 134,988
14,641 8.7 2,249 1.3 167,375
17,391 8.7 4,094 2.0 200,483
20,894 8.9 3,515 1.5 234,987
23,815 8.8 5,114 1.9 269,571
27,284 9.1 5,502 1.8 298,251
32,682 9.7 5,929 1.8 335,258
38,830 10.4 6,098 1.6 374,123
44,366 11.1 5,841 1.5 400,793
49,943 11.9 6,654 1.6 419,642
55,581 12.5 7,535 1.7 445,384
62,020 12.8 9,748 2.0 485,773
68,872 13.4 8,793 1.7 512,442
71,981 13.5 11,713 2.2 533,637
74,309 13.0 13,025 2.3 573,062
77,015 12.8 21,796 3.6 603,167
83,580 12.6 22,915 3.5 663,661
89,374 12.6 23,370 3.3 707,714
90,810 12.3 24,343 3.3 739,182
95,171 12.4 25,403 3.3 768,380
93,630 11.8 32,366 4.1 795,684
98,118 11.5 33,005 3.9 851,245
96,594 11.1 34,125 3.9 871,202
104,424 11.6 31,156 3.5 901,366
89,989 10.1 32,916 3.7 892,610
144,381 14.9 34,663 3.6 971,028
64,976 7.2 34,708 3.8 901,562
43,464 4.8 32,259 3.6 903,902
16,124 1.8 40,170 4.6 882,218
152,229 15.0 36,142 3.6 1,012,526
70,005 7.5 36,291 3.9 930,206
Incomefrom
capitalOthers % Total%

IPSS: Statistical Report No. 17
26
Table 11 Social Security Revenue by source, fiscal years 2000-2004
Compared with the previous year (%)
Note: Table 11 has been calculated in accordance with the standards of the ILO's "The Cost of Social Security 19th
International Inquiry" (excluding transfers from other schemes).
(Unit: Million of yen)
2000 2001 2002 2003 2004
Total 90,156,212 90,390,211 88,221,802 101,252,598 93,020,560
I Social contributions 54,969,440 56,125,696 55,878,434 54,630,178 53,754,121
Employers' contributions 28,310,569 28,653,657 28,405,372 27,250,489 26,225,584
Social insurance contributions 23,154,013 23,511,410 23,334,507 22,275,300 21,323,333
from private employers
Social insurance contributions 5,156,556 5,142,247 5,070,865 4,975,189 4,902,251
from government
Contribution by protected persons 26,658,872 27,472,038 27,473,062 27,379,688 27,528,537
Contributions by employees 20,570,291 20,933,815 20,707,898 20,389,369 20,456,230
Contributions by self-employed 6,088,581 6,538,224 6,765,163 6,990,319 7,072,308
and pensioners
II Taxes 25,218,359 26,692,161 26,714,015 27,785,318 28,636,919
General revenues 25,218,359 26,692,161 26,714,015 27,785,318 28,636,919
Central government 19,706,578 20,707,501 20,552,001 21,141,503 21,701,236
Other government 5,511,781 5,984,660 6,162,014 6,643,815 6,935,682
Earmarked Taxes ─ ─ ─ ─ ─
Central government ─ ─ ─ ─ ─
Other government ─ ─ ─ ─ ─
III Other receipts 9,968,412 7,572,355 5,629,353 18,837,102 10,629,519
Income from Investments 6,497,578 4,346,421 1,612,356 15,222,875 7,000,469
Other 3,470,834 3,225,934 4,016,997 3,614,227 3,629,050
IV Transfers from reserves ─ ─ ─ ─ ─
2000 2001 2002 2003 2004
Total ▲ 7.15 0.26 ▲ 2.40 14.77 ▲ 8.13
I Social contributions 0.80 2.10 ▲ 0.44 ▲ 2.23 ▲ 1.60
Employers' contributions ▲ 0.41 1.21 ▲ 0.87 ▲ 4.07 ▲ 3.76
Social insurance contributions ▲ 0.38 1.54 ▲ 0.75 ▲ 4.54 ▲ 4.27
from private employers
Social insurance contributions ▲ 0.53 ▲ 0.28 ▲ 1.39 ▲ 1.89 ▲ 1.47
from government
Contribution by protected persons 2.11 3.05 0.00 ▲ 0.34 0.54
Contributions by employees 0.84 1.77 ▲ 1.08 ▲ 1.54 0.33
Contributions by self-employed 6.62 7.39 3.47 3.33 1.17
and pensioners
II Taxes 2.25 5.84 0.08 4.01 3.06
General revenues 2.25 5.84 0.08 4.01 3.06
Central government 1.03 5.08 ▲ 0.75 2.87 2.65
Other government 6.90 8.58 2.96 7.82 4.39
Earmarked Taxes ─ ─ ─ ─ ─
Central government ─ ─ ─ ─ ─
Other government ─ ─ ─ ─ ─
III Other receipts ▲ 44.32 ▲ 24.04 ▲ 25.66 234.62 ▲ 43.57
Income from Investments ▲ 55.00 ▲ 33.11 ▲ 62.90 844.14 ▲ 54.01
Other 0.13 ▲ 7.06 24.52 ▲ 10.03 0.41
IV Transfers from reserves ─ ─ ─ ─ ─

IPSS: Statistical Report No. 17
27
Reference: Description of functional categories in Social SecurityExpenditure
Social SecurityExpenditure ILO Definitions Japan
Old age This function covers all benefits paid topersons who have withdrawn from thelabor market due to retirement.
Employee’s Pension Insurance: Old-age pensionNational Pension: Old-age pension, Old-age welfarepensionEmployee’s Pension Fund, Farmer’s Pension Fund: Old-age pension, etc.Mutual Aid Associations: Retirement mutual aid pensionVarious gratuities for retired public employeesLong-term care insurance benefit, welfare service for theelderly in social welfare, etc.(Note) Medical expenses for elderly are included in the“Sickness and health” category.(Note) Medical aid in public assistance is included in“Other Public Assistance”.
Survivors This function covers benefits arising fromthe death of a protected person.
Employee’s Pension Insurance: Survivors’ pensionNational Pension: Survivors’ pension and lump sumpaymentsMutual Aid Associations: Survivors’ pension and lump sumpaymentsWar Victims: Survivors’ pension, etc.(Note) Of pensions paid to survivors, expendituresprovided from the accident compensation scheme areincluded in the “Employment injury” category.
Invalidity benefits Benefit paid to protected persons due topartial or total inability to participate ingainful employment due to a chroniccondition.
Employee’s Pension Insurance: Full invalidity pension andlump sum paymentsNational Pension: Full invalidity pensionMutual Aid Associations: Full invalidity pension and lumpsum paymentsPublic Health: Aid for vaccination complicationSocial Welfare: Special allowance for child rearing,Protection expenses for physically handicapped
Employment injury Benefit paid by a work injury program forwork-related injury, disease, incapacity ordeath of a protected person.
Workmen’s accident compensation insurance, Seamen’sinsurance, Public corporation Staff's accidentcompensations
Sickness and health Benefit provided with a view tomaintaining, restoring, or improving thehealth of the person protected - due todisease or injury, or maternity. (Alsoprovides income replacement duringperiods of inability to work.)
Nursing and maternity benefits and invalidity benefit inhealth insurance schemes (Society-managed healthinsurance, Government-managed health insurance, andNational health insurance).Mutual Aid Associations: Temporary (medical) benefit,maternity benefit, leave benefitPublic Health: Aid for vaccination complication/cashbenefit, etc.(Note) Expenditures provided from the workmen's accidentcompensation scheme are included in the “Employmentinjury” category.(Note) Medical aid for social assistance is included in the“Social assistance and others” category.

IPSS: Statistical Report No. 17
28
Note: ILO Definitions are the criteria used in “The Cost of Social Security, 19th International Inquiry.”
Social SecurityExpenditure ILO Definitions Japan
Family benefits Benefits provided to assist families withchildren and other dependents.
Maternity leave benefit and family-care leave benefit inemployment insurance, etc.Child allowancePublic Sanitation: Family-care allowance, supplementalbenefit for long-term care.Social Welfare: Child rearing allowance, Child welfareservice (child protection allowance and business for thesound fosterage of children)
Unemployment Benefits provided to protected persons due tothe loss of gainful employment.
Employment Insurance, Seamen’s Insurance: Jobseekerallowance, allowance for employment maintenance,employment stabilization business.(Note) Maternity leave benefit and family-care leavebenefit in continuous employment benefit is included in“Family”.(Note) Employment stabilization businesses includebenefits paid for the incumbent and employers, as wellas for the unemployed.
Housing Benefits provided (on a means-tested basis) toassist with the cost of housing.
Social Assistance Scheme: Housing aid
Social assistanceand others
Benefits in cash or in kind provided toindividuals or certain targeted groups whorequire specific assistance in order to obtain adefined minimum level of income and to meetminimum subsistence requirements.
Social Assistance: Various aidsMutual Aid Associations: Special payment for disasters.(Note) Housing aid in social assistance is included in the“Housing” category.

IPSS: Statistical Report No. 17
29
Estimation of Japan's Social Expenditure by OECD standards
The Social Expenditures were previously put together according to International Labor Organization (ILO)standards, and were an important indicator of changes from the past situation; however, data for this standardfrom the various countries has not been updated since 1996, and there are no indications that it will be updatedin the future.
On the other hand, although its scope is somewhat different, the Social Security Expenditure for the OECDstandard makes public relatively up-to-date annual data from the various countries, and therefore this report hassince last year contained the OECD’s estimations.
The scope of the OECD standard of Social Expenditure is broader than that of the ILO, and it includes thefigures for expenditure not directly spent on individuals, such as expenditure on equipping facilities.
Japan's Social Expenditure by OECD standards
According to the OECD standards, Japan’s Social Expenditure in 2003 was 91.9 trillion yen. Looking at thedifferent policy areas, expenditure on “Old age” was the greatest at 42.9 trillion yen (46.7%), followed by, inorder, “Health” at 30.4 trillion yen (33.1%) and “Survivors” at 6.3 trillion yen (6.8%).
Social Expenditure grew by 1.0% in comparison with the previous year, to 18.6% of GDP.

IPSS: Statistical Report No. 17
30
Notes: 1. Figures within brackets, ( ), represent the percentage of total expenditure.2. The column showing "Rate of increase compared with the previous year" for percentage of national
income and GDP, shows the rate at which these areas have increased in comparison with the previousyear (Unit: percentage points).
Source: OECD Social Expenditure Database 2006
Reference Table 1 Trends in Japanese social expenditure
Old age 305,240 324,115 334,781 373,474 396,779 419,951 429,044 2.2 (40.3) (41.3) (41.5) (44.1) (44.9) (46.2) (46.7)
Survivors 54,971 56,708 58,423 59,814 61,129 61,947 62,780 1.3 (7.3) (7.2) (7.2) (7.1) (6.9) (6.8) (6.8)
33,116 33,253 31,689 33,050 39,020 39,310 39,202 ▲ 0.3 (4.4) (4.2) (3.9) (3.9) (4.4) (4.3) (4.3)
Health 293,264 296,885 304,066 297,657 305,676 299,071 303,932 1.6 (38.7) (37.9) (37.7) (35.1) (34.6) (32.9) (33.1)
Family 27,894 28,751 29,766 32,588 35,272 36,663 36,849 0.5 (3.7) (3.7) (3.7) (3.8) (4.0) (4.0) (4.0)
15,639 13,207 14,732 14,653 14,416 14,400 14,888 3.4 (2.1) (1.7) (1.8) (1.7) (1.6) (1.6) (1.6)
Unemployment 21,364 24,127 26,005 28,272 23,221 28,926 22,201 ▲ 23.2 (2.8) (3.1) (3.2) (3.3) (2.6) (3.2) (2.4)
Housing - - - - - - - -
(-) (-) (-) (-) (-) (-) (-)
6,734 7,072 7,575 8,004 8,394 9,107 9,703 6.5 (0.9) (0.9) (0.9) (0.9) (0.9) (1.0) (1.1)
Total 758,222 784,118 807,037 847,512 883,906 909,375 918,598 1.0 (100.0) (100.0) (100.0) (100.0) (100.0) (100.0) (100.0)
19.8% 21.0% 22.0% 22.8% 24.5% 25.6% 25.6% 0.28
14.9% 15.6% 16.3% 16.9% 18.0% 18.6% 18.6% 0.03
Percentage of NI
Percentage of GDP
Rate of increasecompared with
the previous year(%)
Other social policyareas
Incapacity-relatedbenefits
Active labor marketprogrammes
(Units: 100 million yen)
1997 1998 1999 2000 2001 2002 2003

IPSS: Statistical Report No. 17
31
International Comparison according to OECD Social Expenditure database
When the Social Security Expenditure of various countries is compared against their Gross Domestic Product(GDP), that of Japan is higher than the United States but lower than Europe.We see a similar trend in terms of the burden, as well as invisible burden of tax and social contribution to theNational Income in Japan. (Reference Figure 1)
In addition, looking at the structural makeup of the Social Expenditure, the share of areas such as family, activelabor market policies and unemployment expenses is low in Japan compared with that in European countries(Reference Figure 2)
Reference Figure 1 International comparison of social expenditures and visible and invisible taxand social contributions ratio to the National Income in FY 2003
0%
10%
20%
30%
40%
50%
60%
70%
80%
Japan USA UK Germany France Sweden
Social expenditures per National Income
Social expenditures per GDP
Tax and social contribution ratio to National Income
Invisible tax and social contributions ratio to the National Income

IPSS: Statistical Report No. 17
32
Reference Figure 2 International Comparison of Social Expenditure by Policy Area in FY 2003
Reference Table 2 International comparison of social expenditures and visible and invisible taxand social contributions ratio to the National Income in FY 2003
Note: Taxes include social security costs as well as other expenses.Source:Regarding the Social Expenditure in 2003 of counties outside Japan OECD Social
Expenditure Database 2006The national income and GDP of Japan are from the “System of National Accounts2006” Cabinet Economic and Social Research Institute (as are all listed below).The (invisible) tax and social contributions to national income are presented by theMinistry of Finance, Japanese Government.
Japan USA UK Germany France Sweden
Social expenditures perNational Income 25.63% 20.50% 26.66% 36.77% 39.77% 44.14%
Social expenditures per GDP 18.61% 16.59% 20.83% 26.72% 29.08% 31.86%
Tax and social contributionratio to National Income 36.2% 31.8% 47.1% 53.3% 60.9% 71.0%
Invisible tax and socialcontributions ratio to the
National Income46.9% 38.3% 51.2% 58.4% 66.5% 71.1%
32.92%
30.72%
35.64%
36.27%
31.74%
6.83%
6.54%
20.66% 22.38%
11.73%
8.84%
10.37%
11.11%
6.36%
46.71%
2.15%
4.91%
1.23%
1.10%
6.58%
10.85%
8.83%
4.27%
12.02%
29.84%
26.12%
41.73%
33.09%
32.07%
4.21%
4.01%
3.67%
4.00%
4.21%
2.46%
0.87%
1.62%
3.91%
6.73%
2.46%
3.22%
2.42%
1.86%
0.85%
6.85%
2.91%
2.18%
0.59%
1.83%
3.30%
1.06%
1.18%
0% 10% 20% 30% 40% 50% 60% 70% 80% 90% 100%
Japan
USA
UK
Germany
France
Sweden
Old age SurvivorsIncapacity-related benefits HealthFamily Active labor market programmesUnemployment HousingOther social policy area

IPSS: Statistical Report No. 17
33
Reference Table 3-1 International Comparison of Social Expenditure relative to National Income inFY 2003
Reference Table 3-2 International Comparison of Social Expenditure relative to GDP in FY2003
Note: The OECD Social Expenditure Database has no estimates of revenue data.
Old age SurvivorsIncapacity-
relatedbenefits
Health FamilyActive labor
marketprogrammes
Unemployment Housing Other socialpolicy area Total
Japan 11.97% 1.75% 1.09% 8.48% 1.03% 0.42% 0.62% - 0.27% 25.63%USA 6.75% 1.01% 1.81% 8.55% 0.86% 0.18% 0.66% - 0.68% 20.50%UK 8.19% 0.29% 3.21% 8.55% 3.13% 0.66% 0.66% 1.83% 0.16% 26.66%Germany 13.10% 0.45% 3.99% 10.97% 3.25% 1.55% 2.48% 0.31% 0.67% 36.77%France 14.42% 2.62% 2.60% 10.39% 4.13% 1.46% 2.53% 1.16% 0.47% 39.77%Sweden 14.01% 0.95% 9.12% 9.88% 4.91% 1.77% 1.72% 0.82% 0.96% 44.14%
Old age SurvivorsIncapacity-
relatedbenefits
Health FamilyActive labor
marketprogrammes
Unemployment Housing Other socialpolicy area Total
Japan 8.69% 1.27% 0.79% 6.16% 0.75% 0.30% 0.45% - 0.20% 18.61%USA 5.46% 0.82% 1.47% 6.92% 0.70% 0.14% 0.54% - 0.55% 16.59%UK 6.40% 0.23% 2.50% 6.68% 2.44% 0.51% 0.51% 1.43% 0.12% 20.83%Germany 9.52% 0.33% 2.90% 7.97% 2.36% 1.12% 1.80% 0.23% 0.49% 26.72%France 10.55% 1.91% 1.90% 7.59% 3.02% 1.07% 1.85% 0.85% 0.34% 29.08%Sweden 10.11% 0.69% 6.58% 7.13% 3.54% 1.27% 1.24% 0.59% 0.70% 31.86%

IPSS: Statistical Report No. 17
34
Reference Chart 4 Definitions of OECD of Social Expenditure by policy areaSocial Security
Expenditure Definitions by OECD 1) Examples in Japan
1. Old age Old-age comprises all cash expenditures(including lump-sum payments) on old-agepensions within the public sphere. Old-agecash benefits provide an income forpersons retired from the labour market orguarantee incomes when a person hasreached a 'standard' pensionable age orfulfilled the necessary contributoryrequirements. This category also includesearly retirement pensions: pensions paidbefore the beneficiary has reached the'standard' pensionable age relevant to theprogramme. Excluded are programmesconcerning early retirement for labourmarket reasons which are classified underunemployment.The Social Expenditure Database includessupplements for dependants paid to old-age pensioners with dependants underold-age cash benefits. Old age alsoincludes social expenditure on services forthe elderly people, services such as daycare and rehabilitation services, home-help services and other benefits in kind. Italso includes expenditure on the provisionof residential care in an institution (e.g.,the cost of operating homes for theelderly).
Employees' Pension Insurance: Old age pension,Retirement pensionNational Pension: Old age pension, Old age Welfarepension, Retirement pension paid under the mutual aidassociations, Lump sum payment for temporary foreignerresidentsEmployee's Pension Fund, etc.: Old age pension Seamen'sInsurance: Old age pension, non contributory pension paidunder the former gratuity schemesLong-term care insurance: Old age care services, etc.Social Welfare: Old age welfare services, residential care,etc. Old age care services under a scheme of publicassistance
2. Survivors Many countries have social expenditureprogrammes in the public sphere whichprovide the spouse or dependent of adeceased person with a benefit (either incash or in kind). Expenditure in this policyarea has been grouped under survivors.Allowances and supplements fordependent children of the recipient of asurvivors’ benefit are also recorded here.
Employees' Pension Insurance: Survivors' pensionNational Pension: Survivors' pension, lump-sum paymentfor survivorsSeamen's Insurance: Survivors' pension, support forfuneral, Survivors' pension paid under the mutual aidassociations, lump-sum payment for survivors, support forfuneral, Survivors' pension under the aid for war victims,Support of funeral expenses under the scheme of healthinsuranceNote: Survivors' pension paid under the scheme ofworkmen's Accident Compensation Insurance is allocatedinto 3.Incapacity-related benefits

IPSS: Statistical Report No. 17
35
continued (No. 2)Social Security
Expenditure Definitions by OECD 1) Examples in Japan
3. Incapacity-relatedbenefits
Disability cash benefits are comprised ofcash payments on account of complete orpartial inability to participate gainfully inthe labour market due to disability. Thedisability may be congenital, or the resultof an accident or illness during the victim’slifetime.Spending on Occupational injury anddisease records all cash payments suchas paid sick leave, special allowances anddisability related payments such aspensions, if they are related to prescribedoccupational injuries and diseases.Sickness cash benefits related to loss ofearning because of the temporary inabilityto work due to illness are also recorded.This excludes paid leave related tosickness or injury of a dependent childwhich is recorded under family cashbenefits. All expenditure regarding thepublic provision of health care is recordedunder health. Social expenditure onservices for the disabled peopleencompasses services such as day careand rehabilitation services, home-helpservices and other benefits in kind.
Disability pension paid under the public pension schemeincluding Employee's pension Insurance, National Pension,mutual aid associations, Sickness leave payments are alsoincluded. Services provided under disability welfarescheme, cash benefits for households of handicappedchildren,Payment under the Workmen's Accident CompensationInsurance, Government Employees' AccidentCompensation, Local Government Employees' AccidentCompensation, etc. are allocated under this category.Protection measures for sickness such as AIDS andleprosy
4. Health Social expenditure data in the healthpolicy area is taken from the OECD Healthdatafile (OECD, 2006). All publicexpenditure on health is included (not totalhealth expenditure): current expenditureon health (personal and collective services(HC.1 to HC.7 in the ICHA) andinvestment (HC.R.1). Expenditure in thiscategory encompasses, among otherthings, expenditure on in-patient care,ambulatory medical services andpharmaceutical goods. Individual healthexpenditure, insofar as it is not reimbursedby a public institution, is not included. Asalready noted, cash benefits related tosickness are recorded under sicknessbenefits.
The costs of care service financed by long-term careinsurance for the elderly and prosthetic equipment (forinjuries, workmens' accident compensation, illnesses) havebeen deducted from the total public health expenditure,OECD Health datafile 2006 in order to avoide doubleaccounting. The deducted costs are estimated by theInstitute for Health Economic and Policy.
5. Family Family includes expenditure whichsupports families (i.e., excluding one-person households). This expenditure isoften related to the costs associated withraising children or with the support of otherdependants. Expenditure related tomaternity and parental leave is groupedunder the family cash benefits sub-category. The public expenditures for pre-primary education are included in thispolicy area from 2006 edition.
Child allowance, child allowances for single parent family,child allowance for households having handicappedchildren, Lump-sum payment for maternity leave, Leavecompensation during parental leave and care leave. Thepublic expenditure data for pre-primary education is takenfrom the OECD education at a glance 2006.

IPSS: Statistical Report No. 17
36
continued (No. 3)
Notes: 1. OECD Definitions are followed by the OECD Social Expenditure 2006 ed. 2. The Japanese translation of "9. Other social policy areas" are "Social Assistance and others" with a
reference to the included major schemes.
Social SecurityExpenditure Definitions by OECD 1) Examples in Japan
6. Active labor marketprogrammes
The category active labour marketprogrammes (ALMP) contains all socialexpenditure (other than education) whichis aimed at the improvement of thebeneficiaries’ prospect of finding gainfulemployment or to otherwise increase theirearning capacity. This category includesspending on public employment servicesand administration, labour market training,special programmes for youth when intransition from school to work, labourmarket programmes to provide or promoteemployment for unemployed and otherpersons (excluding young and disabledpersons) and special programmes for thedisabled. For more detailed informationregarding the categorization ofexpenditure on ALMP, see theEmployment Outlook, OECD, 2005www.oecd.org/els/employmentoutlook .
The costs financed by both of the employment insurancescheme and the general government revenue are included.The three policy measerus are services for thestabilization of employment, services for developmentcapacities, and services for the welfare of employments.
7. Unemployment The category unemployment includes allcash expenditure to people compensatingfor unemployment. This includesredundancy payments out of publicresources as well as pensions tobeneficiaries before they reach the'standard' pensionable age if thesepayments are made because they are outof work or otherwise for reasons of labormarket policy.
Unemployment benefits paid under the scheme ofemployment insurance. In additon to it, umemploymentbenefits paid by the Seamen's Insurance are included.The parental leave and care leave under the employmentinsurance are categorized as "5.Family." The trainingsubsidies are categorized as "6. Active labor marketprogrammes."
8. Housing Rent subsidies and other cash benefits tothe individual to help with housing costs.
An appropreate data is not available regarding Japanesedata, so it is not listed.
9.Other social policyareas
This category includes social expenditure(both in cash and in kind) for those peoplewho for various reasons fall outside thescope of the relevant programme coveringa particular contingency, or if this otherbenefit is insufficient to meet their needs.Social expenditure related toimmigrants/refugees and indigenouspeople are separately recorded in thiscategory. Finally, any social expenditurewhich is not attributable to othercategories is included in the sub-categoryother.
Public assistance; education assistance, maternityassistance, livelihood assistance, funeral assistance,health assistance, housing assistance, and long-term careassistance. Support for victims of natural disasters, Atomicbomb victims aid, etc.