the costs of ev fast charging infrastructure and economic
TRANSCRIPT

The Costs of EV Fast Charging Infrastructure and Economic Benefits to Rapid Scale-Up
By Jonathan Levy, Isabelle Riu, Cathy Zoi
May 18, 2020

1
Executive Summary
The recent COVID-19 crisis has heightened the urgency of transitioning to a fully electrified transportation sector as one of the keys to unlocking a more sustainable future for all. Replacing gas-guzzling cars with zero emissions electric vehicles (EVs) will not only help slash smog-forming pollution and curtail greenhouse gas emissions, it is also critical to protect human health.
The good news is that with more than one million electric vehicles on the road across the U.S., the EV market is at an inflection point as costs are poised to decline thanks to continued innovation and scaling. To achieve full electrification, there are three primary elements that are each distinctly important while also deeply interrelated: (1) reduced battery cost, (2) enhanced battery performance, and (3) ubiquitous charging infrastructure. While many EV drivers will do a combination of charging at home, work, and on the go, it’s estimated that the U.S. EV market will require as many as 45,000 DC fast chargers by 2025 to enable widespread EV adoption—a threefold growth from the approximately 13,000 DCFC available today, of which approximately 5,500 DCFC are available on public charging networks. Fast charging enables drivers to integrate their charging into their everyday lives and instills range confidence.
This paper examines ways that public and private stakeholders can work together to better understand and tackle the oft-overlooked costs and benefits of public fast charging infrastructure that is accessible to all. While electricity remains the largest cost driver, the full stack of costs also includes equipment at the early stage of a technology adoption curve, construction and installation costs, ongoing networking and maintenance costs, among other factors.

2
1 Introduction
For over a century, the world has relied almost entirely on direct combustion of fossil fuels to propel people and goods from place to place. A giant transformation to mobility fueled by electricity is now underway. This transition will yield significant economy-wide benefits, but will require continued progress on three fronts: reduced battery cost, enhanced battery performance, and ubiquitous charging infrastructure that can deliver reliable and convenient fast charging in a way that is sustainable both environmentally and financially. This paper will focus on the third, but as they are all inextricably linked, will start by briefly looking at each in turn to understand the current state of play of technology, economics, and where they are headed for public charging.
1.1 Background
Figure 1: Bloomberg New Energy Finance 2019 Electric Vehicle Outlook
The U.S. electric vehicle market (EV) has hit an inflection point, clearing one million EVs on the road [1] and accelerating up a steep adoption curve. As that market continues to scale, direct current fast charging (DCFC) infrastructure is critical to enabling consumer adoption of the new models that automakers have committed billions of dollars to manufacture.
1.1.1 Key Factors in EV Adoption
Figure 2: Bloomberg New Energy Finance Research Note
One material factor in spurring EV adoption has been the recent tremendous decline in battery costs, which are imperative for cost-competitive EVs. In 2015, the battery of a mid-sized EV comprised over 50% of the vehicle cost. In 2019, that number declined to 33%, and BNEF projects that by 2025 the battery will be less than 20% of the total cost of an EV [2].

3
Figure 3: CleanTechnica Analysis, Oct. 2018
In addition to price declines, EV adoption requires range confidence, that is the distance the car can travel between charges. Early EV models were seen entirely as commuter cars due to sub-100 mile range. EVs like the Chevy Bolt, Nissan LEAF Plus, Kia Niro, Tesla Model 3—with ranges >200 miles—have attracted buyers in new demographics. OEMs and industry researchers have predicted that ranges will increase further as battery performance is enhanced and cost declines continue.
Figure 4: Internal EVgo L1/L2/DCFC Charge Time Comparison
Of course, even the most affordable long-range EV requires a place to charge, or more accurately, places to charge. Hence the fundamental advantage of development of electrified transportation: electricity is everywhere. An ecosystem of ubiquitous charging infrastructure includes long dwell-time home charging and workplace charging, and public fast charging for those who don’t have residential charging (e.g. apartment dwellers and homes without garages), for people who have ‘mobile’ vocations (e.g. rideshare, delivery), or workers who travel significant distances from their base charging (e.g. sales, construction), as well as those for whom it is convenient to top-up their batteries while shopping, dining, or engaging in leisure activities.
Long dwell-time charging can be delivered via Level 1 (L1) or Level 2 (L2) chargers (whose power is 1.4 kW and 7.2 respectively) and is appropriate for home and workplace charging, taking advantage of the 5-16 hours drivers typically leave the car in the garage or at the office to allow the battery to replenish most or all of the miles consumed in the driver’s recent trips or commutes.
Higher power DCFC (formerly referred to as Level 3), with power levels 7 to nearly 50 times greater than L2s, is required is charging speed matters, that is a driver needs a charge in minutes rather than hours. Ideal settings for public fast charging stations are grocery stores, retail outlets, restaurants, and other places where the natural “dwell time” is 10-60 minutes.

4
It’s important to note that how quickly an EV can ‘fill up’ is governed not simply by the power of the fast charger. Charging speed is determined by the car battery’s inherent design capacity, its state of charge when it plugs in, as well as the power of the charger itself. Given that most cars on the road cannot currently receive more than 150kW—and many are limited to a maximum charge rate of 50kW or 100kW—the exact charging time will vary from vehicle to vehicle. The table below outlines the maximum charge rates for EVs currently on the market [3].
Figure 5: Table of Max Charge Rates for Currently Deployed EVs
1.2 DCFC’s Place in the Ecosystem Today—And Forecast Growth
There are currently over 5,500 public DCFCs in the U.S. [4], both ‘urban’ chargers in metropolitan areas and cities and ‘corridor’ chargers along highways that connect urban areas.
Figure 6: Estimated U.S. Charging Growth
As the number of EVs in operation grows, so will the need for DCFC—expectations range from 10,000 to 30,000 incremental DCFCs by 2025 [5]. The precise number required will not simply be a function of the number of EVs in operation, but also how they are being driven. Rideshare and delivery drivers travel 3-7 times more miles every day to do their jobs and need convenient, reliable fast charging to maximize the utilization of their vehicles and get people and goods from point A to point B. As previously noted, EVs driven by apartment dwellers or those without garages or workplace charging also need fast charging [6]. So the number of DCFCs required in a metropolitan area will be determined by characteristics of the driving population and the density of the urban form. With residential rentership outpacing growth in homeownership in 97 of the top 100 U.S. cities [7]), and the reduced likelihood that renters can or will invest in charging infrastructure in dwellings they don’t own, the urban and suburban cores may need even more public fast charging than is currently forecast.

5
1.2.1 Benefits of DCFC
First and foremost, availability of public fast charging infrastructure enables EV adoption, giving rise to improvements in air quality. Beyond the obvious, though, DCFC also provides several benefits to the power grid, including peak shaving and curtailment reduction. EVgo’s operating data demonstrate that fast charging’s load profiles and distributed loads are aligned with midday solar generation [8]. The graph below overlays EVgo’s fleet load profile with CAISO’s cumulative curtailment, illustrating that more than 45% of charging was performed during peak solar hours from 9 am through 3 pm (overlapping with periods when excess solar supply leads to system curtailments).
Figure 7: EVgo 2018 Fleet Load Profile Overlaid onto 2018 CAISO Curtailment
As rates nationally adjust to reflect higher penetration of solar and wind, as has been witnessed in both California and Texas, marginal load growth from EVgo’s fast charging network will continue to take advantage of the low marginal cost of solar generation during daylight hours. This alignment not only directly benefits the grid, but also retail electricity customers. For example, EVgo’s peak shaving load profile enables utilities to avoid or delay investments which ratepayers would otherwise finance [9]. Depending on the rate design, as utilities sell more kWh they have a larger market over which to spread fixed costs, potentially benefiting all customers, regardless of if they personally drive EVs [10]. Moreover, EVgo’s fleet load profile shows that more than 30% of charging occurred overnight, during periods of low demand on the system, providing additional peak shaving and valley filling grid benefits.
1.2.2 Business Models
The EV charging sector is comprised of companies whose purposes and business models vary, but fundamentally there are vendors and operators. Vendors are the equipment manufacturers and information technology providers who design, produce, and sell hardware and software to enable EVs to charge. The operators are the infrastructure businesses that typically build, own, and manage charger networks. At this nascent stage of market development, some companies focus on a single slice of that value chain—provision of network management software, for example—while others cover multiple pieces (e.g. hardware sales and network management services). EVgo is an integrated charging company that develops, owns, and operates a charging network, provides network management services to others who own charging assets, works with hardware vendors to specify equipment, and develops bespoke software to meet its network needs. One key advantage of the owner/operator model is sustained alignment with driver interests in maximizing reliability and convenience of charging. For vendors or software/networking services-oriented businesses,
Figure 8: Business Models

6
dispensing power to drivers is a secondary commercial interest, and thus reliability and availability of charging equipment may be lower priority.
2 Economics of Charging Infrastructure
Coffee drinkers and EV drivers have something in common: a range of options for ‘fueling up’. Coffee can be made at home or provided at work, or it can be procured at a local café where the price of a cappuccino helps cover the cost of equipment, rent, furniture, utilities, and staffing. Consumers may imagine that the cost of delivering electrons into an EV is equal to the per kWh price of electricity and is the same regardless of where the charge happens. Not so: charging costs vary depending on charging equipment, location of charging, electricity costs at that location (i.e., residential, commercial, or industrial) that include fixed and variable components, and may vary depending on the time the charge takes place. Fast charging is most analogous to the café experience for a coffee drinker: the speed and convenience of a premium product that comes via sophisticated, high-powered electrical equipment, rent paid to site hosts, large power flows that incur special utility demand charges, and field, call center, and billing staff to maintain the equipment and stay connected with customers. Just like brewing coffee at home will almost certainly be cheaper than purchasing a latte from a café, public charging has additional costs that need to be recovered in the price.
2.1 Economics of DCFC Fundamentally Different from L1 and L2
L1 charging takes up to 20 hours for a full charge and requires no special equipment, other than some safety circuitry to provide protection. The car is plugged into a standard power outlet as if it were a table lamp or a blender. A full L2 charge can take 4-8 hours and requires a home charger and a connection to a 240V outlet (same as for a household clothes dryer) that can be installed in a garage by an electrician. Accordingly, the economics of cost recovery are fairly straightforward.
In contrast, DC fast charging requires specialized high-power equipment capable of providing up to 1,000 Volts and 500 or more Amps (current) for passenger vehicles and substantially more for medium and heavy-duty vehicles. This is achieved through a sophisticated process of converting grid alternating current (AC) electricity into direct current (DC) electricity via an AC-to-DC convertor, and then scaling (boosting or bucking) the DC electricity via a DC-to-DC convertor to the voltages and currents required by the EV to charge its battery. In addition to the AC-to-DC and DC-to-DC convertors, a fast charger maintains a complex safety system that includes monitoring multiple parallel elements of the fast charge with respect to its environment and its connection to the EV, the latter also comprised of multiple elements including digital protocols between the charger and the EV and its battery management system. One 50kW DCFC unit contains 2,000-2,500 individual components, while an L2 charger has less than 200. Fast chargers must adhere to multiple UL industry standards to ensure user safety as well as multiple vehicle protocol and industry and safety standards. Development of a fast charger prototype typically represents 2 to 3 years of complex design and engineering and an additional year of certification to all the applicable standards. Finally, siting, constructing, and operating fast chargers are also subject to utility, local government, and building jurisdictional permitting and approvals requiring specialized skills and expertise, and oftentimes multiple revisions and re-reviews with the accompanying incremental time and cost.
2.2 All-In Cost Comparisons of Charging Infrastructure
During 2019, the Rocky Mountain Institute (RMI) undertook a confidential charging industry survey and published average cost findings for key elements of the charging infrastructure equipment stack [11]. Two data categories are particularly notable: (1) the large differences in cost between L2 and DCFC exceed an order of magnitude; and (2) the significant investment required if a transformer upgrade is needed.

7
Figure 9: RMI Summary Of Charging Costs
2.2.1 Specific Cost Items for DCFC
Fast chargers are sophisticated pieces of industrial equipment serving a critical retail function for drivers. To put the energy consumption into context, a single DCFC station with four 50kW chargers and utilization of 35% has the annual energy throughput equivalent to what it would take to power approximately 35 single family American homes for the same year [12]. Four 150kW chargers would equate to over 100 homes, and four 350kW chargers about the same as a neighborhood of >230 homes. Or examined through the solar power lens, the area of photovoltaic panels that would be required to supply a 4 x 150kW charging station is about 47 times the footprint occupied by the four chargers and their related equipment [13].
Fast charging dispenses a lot of electricity efficiently. That’s why it’s called ‘fast’. But electricity—while the single largest cost—is far from the only cost, even on operations, as the many DCFC components need to be carefully engineered, installed, integrated, protected, monitored, and regularly serviced.
The cost components of DCFC stations fall into three major categories summarized in Table 1 below: equipment, development, and operations. Equipment comprises not just the machinery of the charger itself (which, as noted above, on its own contains more than 2,000 components), but includes the related equipment to make the charger both functional and safe for public use. The development costs are primarily the labor hours required by a plethora of professionals to get a site from concept to commissioning, spanning identification of candidate sites, to negotiations with site hosts, utilities, local authorities, and contractors. Once a site is commissioned, the costs to operate the site include ongoing work to ensure the charger remains ready to do its job fast-charging EVs: dispensing electricity, performing maintenance, paying rent, servicing customer calls, paying local taxes, and billing drivers.

8
Table 1: Illustrative List of Public Fast Charging Cost Components by Category
*situation-specific: required sometimes but not always
The pie charts below illustrate the approximate breakdown of the major cost items for a typical station with 2 x 150kW fast chargers. On equipment, charger hardware is the vast majority (84%) with the associated interconnection switchgear and conduit comprising an additional 12% of costs. With respect to development (i.e., labor required for building a station), just over 80% is usually the construction itself, with the remainder associated with planning and design in advance of the actual ‘build’ activities. Around 50% of the costs of operating a fast charger are utility bills comprised fixed, variable, and demand charges)1. The remainder is relatively evenly distributed between other elements critical to ensuring high performance of this sophisticated infrastructure: maintenance, warranties, network communications, and customer service among them [14]. The same categories of costs are reflected in DCFC deployment for 50kW, 100kW, 150kW, and other charging configurations as well.
Figure 10: Visual Summary of DCFC Costs
1 Utility costs and rate structures across the US vary widely. 50% represents a network-wide average electricity cost weighting.

9
Figure 11: Visual Summary of DCFC Equipment Costs
The fast charging equipment supplier market is comprised of several companies with specific expertise in high-power electronics. As the ability of EVs to charge more quickly improves, the charger vendors are developing equipment that can better meet (or exceed) those needs. Vendors are innovating charger and station designs and configurations, from power sharing / power routing for improved asset utilization to incorporating micro-grid capabilities such as stationary storage and energy management to better mitigate grid impacts and improve siting opportunities. Increased power needs sometimes necessitate enhancements that increase equipment costs. For example, the push for 150kW chargers is spurring the deployment of cables with liquid cooling to manage the heat generated by the higher power levels and improve ‘handleability’ and durability of the equipment—and these enhancements generate higher costs.
2.2.2 DCFC Development Costs
Figure 12: Visual Summary of DCFC Development Costs
Because labor = time, what is embedded in development costs is how long a project takes. Current practice requires charging companies to secure permits, reviews, and approvals from utilities, local authorities, and state governments. This often takes multiple cycles of back-and-forth between developers and utilities, authority having jurisdictions (‘AHJ’s), and other entities. Delays—whether from outdated processes involving in-person delivery of planning drawings to lack of clarity around specific location requirements or disagreements around local interpretation of regulations—can add significant unnecessary costs to project development. In fact, these ‘soft costs’ can amount to up to 60% of the hours during a station’s development process. There are tremendous parallels between the EV charging industry today and the
10
distributed solar industry about a decade ago, with similar opportunities for driving down costs by reducing permitting time, standardizing processes, and streamlining approvals.
2.2.3 DCFC Operations Costs
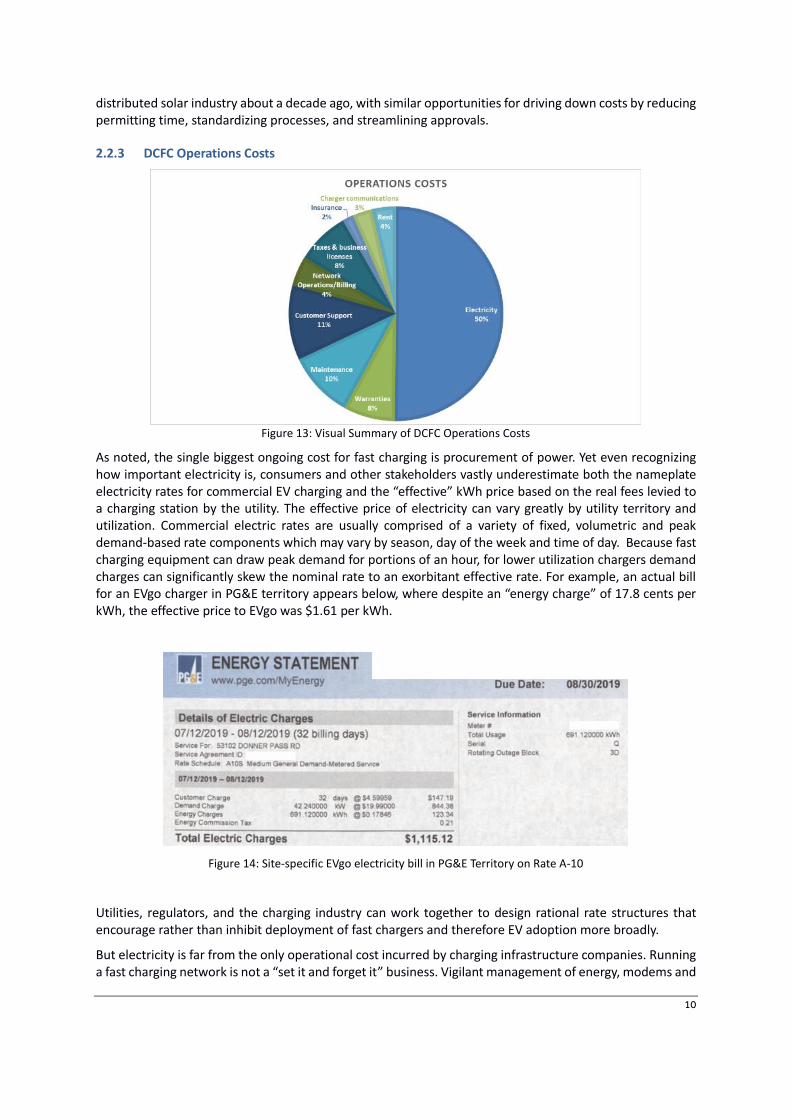
Figure 13: Visual Summary of DCFC Operations Costs
As noted, the single biggest ongoing cost for fast charging is procurement of power. Yet even recognizing how important electricity is, consumers and other stakeholders vastly underestimate both the nameplate electricity rates for commercial EV charging and the “effective” kWh price based on the real fees levied to a charging station by the utility. The effective price of electricity can vary greatly by utility territory and utilization. Commercial electric rates are usually comprised of a variety of fixed, volumetric and peak demand-based rate components which may vary by season, day of the week and time of day. Because fast charging equipment can draw peak demand for portions of an hour, for lower utilization chargers demand charges can significantly skew the nominal rate to an exorbitant effective rate. For example, an actual bill for an EVgo charger in PG&E territory appears below, where despite an “energy charge” of 17.8 cents per kWh, the effective price to EVgo was $1.61 per kWh.
Figure 14: Site-specific EVgo electricity bill in PG&E Territory on Rate A-10
Utilities, regulators, and the charging industry can work together to design rational rate structures that encourage rather than inhibit deployment of fast chargers and therefore EV adoption more broadly.
But electricity is far from the only operational cost incurred by charging infrastructure companies. Running a fast charging network is not a “set it and forget it” business. Vigilant management of energy, modems and

11
other communications services, preventative and corrective maintenance, replacement parts, along with ongoing rent, insurance and tax payments are needed to maintain uptime, ensuring that when an EV pulls up to a charger, everything works.
2.3 Pricing
As a business principle, charging companies must set prices so that the costs they incur for developing, owning, and operating the infrastructure are covered by revenue received. With L1 and L2 charging equipment, development and operations costs are a fraction of those for DCFC stations, hence the prices to consumers for charging on L1 and L2 can be materially lower and still allow for cost recovery.
In order to have revenues exceed the costs of building and operating DCFC stations, unit prices must be commensurately higher. In mature markets with both high penetrations of EVs and utility tariffs that reflect system benefits and value, market competitive pricing to consumers and fleets can support financial sustainability for fast charging businesses. That is, there will be enough retail and professional drivers charging at each station to cover the equipment, development, and operating costs of the chargers. This market case was demonstrated in several urban centers in California during the first part of 2019 when charging networks that had received capital expenditure support for construction also witnessed high utilization from a combination of electrified rideshare and retail EV drivers.
However, in nascent market—like the current one in most of the U.S.—making the financial math work can be challenging. In most U.S. geographies today, the combination of low volumes of EVs on the road, relatively early stage technology, and high “effective kWh” rates, means that the revenue derived from cars using fast chargers does not yet cover the costs of building, owning and operating them.
Therein lies the dilemma for business and policy makers alike: how to catalyze investment in a convenient, reliable, and innovative fast charging network deemed essential to widespread EV adoption when the EV market is at such an early stage. The answer lies in financial collaborations between keenly aligned stakeholders—charging networks, government, utilities, and OEMs—with shared interest in transportation electrification. Together these interested market participants can help enable acceleration of a competitive market for critical fast charging infrastructure ahead of when driver demand alone can support it.
3 Employment and Job Creation in EV Infrastructure
Even in its largely nascent stage, the EV sector has created thousands of jobs in a range of industries, often outpacing similar sectors. EV manufacturing by itself employed over 77,000 Americans in 2019, and showed the most job growth when compared to other alternative fuel vehicles over the past 4 years [15]. This number is only set to grow, as several OEMs continue to make significant investments in U.S. factories. GM invested $2.2 billion in the first EV dedicated plant, creating 2,200 jobs [16], and Volkswagen broke ground in November on a plant expansion dedicated for EV manufacturing adding 1,000 jobs [17]. There are also several new entrants expected to launch and ramp up production in the U.S. in the coming years. Rivian is expected to start producing vehicles next year, employing 1,000 people at full production [18], and Lucid Motors broke ground on its $700 million factory in December and is expected to support nearly 5,000 jobs by 2029 [19].
EV charging infrastructure in particular supports thousands of jobs in a variety of sectors. Over EVgo’s 10 year operating history, it has found that about 0.9 – 1.1 jobs is created for each DCFC built. Construction, installation, and site development are the most labor intensive and account for the majority of this estimate. The remainder supports jobs in areas such as equipment design and manufacturing, operations and maintenance, software development, accounting, and customer support. With over 13,000 DCFCs
12
installed to date, the industry has created an estimated 13,000 jobs, and to meet the needed 45,000 DCFCs in 2025, as detailed in Figure 6, an incremental 32,000 jobs will be created.
In addition to jobs directly created by the EV industry, there are several macroeconomic studies that quantify the monetary benefits from reducing fuel expenditures by adopting EVs while reducing emissions and petroleum imports. NREL conducted a nationwide assessment of the economic value of PEVs, modelling job and GDP impacts for varying levels of PEV penetration using the IMPLAN input-output model [20]. NREL predicted, on average, an additional 109,000 jobs would be created per year and GDP would increase by $9.9 billion in its central “Low Cost” scenario which assumed 55 million PEVs by 2035 and EV cost declines largely already achieved.
Next10, in conjunction with Berkeley Economic Advising and Research, recently released their economic assessment of PEVs for California specifically. Using BEAR, Berkeley’s dynamic economic forecasting model, and assuming 10 million PEVs in 2035, the study estimates an additional 394,000 to over half a million jobs created, depending on vehicle purchase and operating costs [21].
The latest data already indicate as costs continue to decline, EV adoption accelerates, and charging infrastructure expands, the EV industry will continue to create and support hundreds of thousands of diverse jobs nationwide.
4 Fast Charging Sector ‘Learning Curve’ Underway
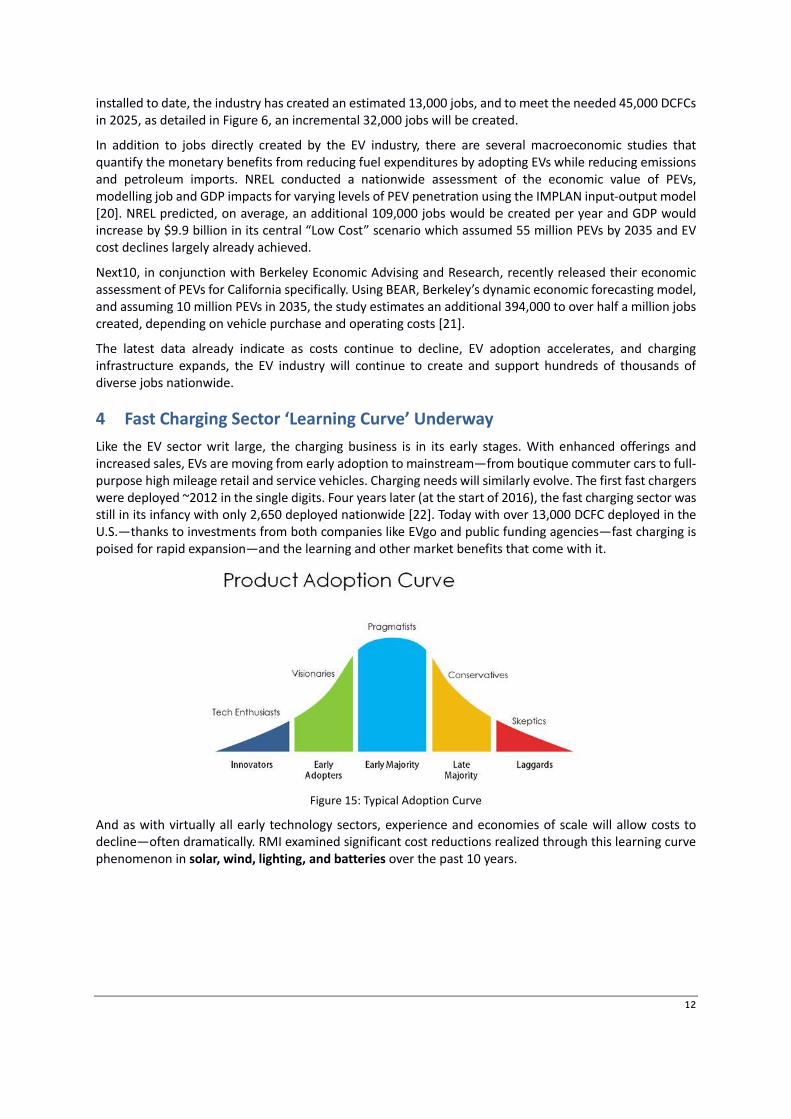
Like the EV sector writ large, the charging business is in its early stages. With enhanced offerings and increased sales, EVs are moving from early adoption to mainstream—from boutique commuter cars to full-purpose high mileage retail and service vehicles. Charging needs will similarly evolve. The first fast chargers were deployed ~2012 in the single digits. Four years later (at the start of 2016), the fast charging sector was still in its infancy with only 2,650 deployed nationwide [22]. Today with over 13,000 DCFC deployed in the U.S.—thanks to investments from both companies like EVgo and public funding agencies—fast charging is poised for rapid expansion—and the learning and other market benefits that come with it.
Figure 15: Typical Adoption Curve
And as with virtually all early technology sectors, experience and economies of scale will allow costs to decline—often dramatically. RMI examined significant cost reductions realized through this learning curve phenomenon in solar, wind, lighting, and batteries over the past 10 years.
13
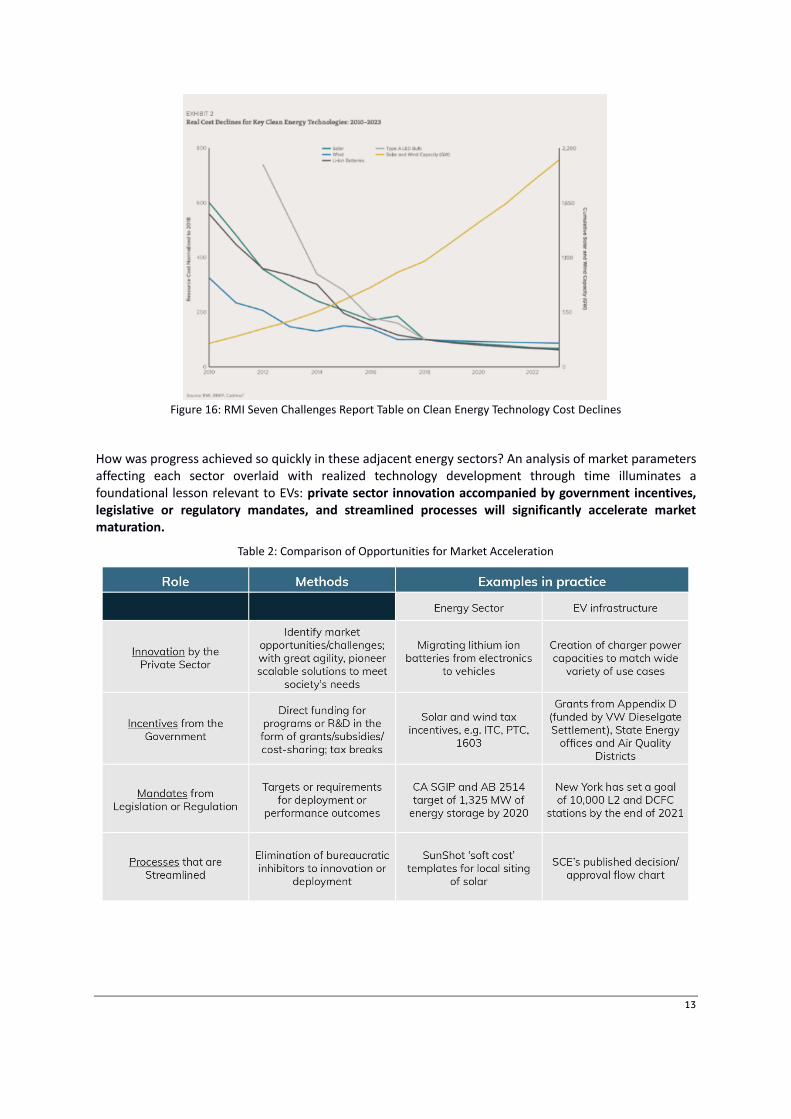
Figure 16: RMI Seven Challenges Report Table on Clean Energy Technology Cost Declines
How was progress achieved so quickly in these adjacent energy sectors? An analysis of market parameters affecting each sector overlaid with realized technology development through time illuminates a foundational lesson relevant to EVs: private sector innovation accompanied by government incentives, legislative or regulatory mandates, and streamlined processes will significantly accelerate market maturation.
Table 2: Comparison of Opportunities for Market Acceleration

14
4.1 Invest in Charging Infrastructure: The Roadmap for Stimulating Economic Growth, Addressing Climate Change, and Mainstreaming Electrification of Transportation
To address climate change and reduce local air pollution, as well as to satisfy the growing appetite of drivers for the superior performance of electric vehicles, rapid deployment of fast charging infrastructure must happen. As has been demonstrated in solar, wind, lighting and batteries before it, stakeholder collaboration in the EV infrastructure space will be fundamental. Such collaboration amongst interested market participants will enable the fast migration down the learning curve so the economics of fast charging are enhanced and the objectives of all parties can be met.
The table below highlights some of the largest near-term opportunities for market participants, through the lenses of each major cost category:
• Equipment: If utilities and policy makers can help underwrite the cost of equipment in advance of when widespread demand for charging exists, the private sector will continue to develop and deploy advanced technologies; charging equipment manufacturers will also need to help drive down their costs as the market scales.
• Development: Costs can be reduced substantially if utilities and government authorities turn attention to streamlining the permitting processes and the private sector adheres to terms and conditions contained in those permits; utilities can also significantly improve economics by investing in “make-ready” infrastructure to cover behind-the-meter investments.
• Operations: the significant low-hanging fruit is in ensuring electricity rates accurately reflect the local and system-wide benefits and costs EV charging brings to the grid and to the community at large; demand charge holidays, technology neutral low load factor rates, and other rationalization of commercial EV tariffs will be necessary to reduce “effective kWh” pricing to levels that recognize the value of beneficial load.
Table 3: Illustrative Cost Decline Opportunities by Participant

15
5 Conclusion –
A wide array of stakeholders have key roles to play in both understanding and reducing the costs needed to support near- and medium-term deployment of the public fast charging infrastructure required to support transportation electrification. Electricity is far from the only cost, though the complicated dynamic of electricity cost structures today often results in an effective per kWh price far exceeding what is assumed by stakeholders. Additionally, the all-in costs of developing, siting, engineering, constructing, operating, networking, and maintaining fast charging infrastructure go well beyond electricity, and all must be recovered in order to deploy the level of investment needed to meet the U.S. market’s infrastructure needs over the coming years. After all, the reliability and convenience of fast-filling an EV is just as important—and valuable—as charging a smartphone or grabbing a latte from the café on the corner.
References
[1] Veloz EV sales dashboard, https://www.veloz.org/sales-dashboard/
[2] Nathaniel Bullard, Electric Car Price Tag Shrinks Along With Battery Cost, https://www.bloomberg.com/opinion/articles/2019-04-12/electric-vehicle-battery-shrinks-and-so-does-the-total-cost
[3] The maximum charge rate for e-Golf is based on the 36 kWh model; the Hyundai Ioniq is based on the 30.5 kWh model; the Kia Soul is based on the 2020 model; the Nissan Leaf Plus is based on the 62 kWh model; the Tesla Model 3 is based on the Long Range model.
[4] U.S. Department of Energy Alternative Fuels Data Center, https://afdc.energy.gov/fuels/electricity_stations.html
[5] Michael Nicholas, Dale Hall, Nic Lutsey, Quantifying the Electric Vehicle Charging Infrastructure Gap Across U.S. Markets, https://theicct.org/sites/default/files/publications/US_charging_Gap_20190124.pdf and Julia Pyper, Electric Ridesharing Benefits the Grid, and EVgo Has the Data to Prove It, https://www.greentechmedia.com/articles/read/electric-ridesharing-benefit-the-grid-evgo.
[6] Michael Nicholas, Peter Slowik, Nic Lutsey, Charging Infrastructure Requirements to Support Electric Ride Hailing in U.S. Cities, https://theicct.org/sites/default/files/publications/Charging_infrastructure_ride_hailing_US_03242020.pdf
[7] Renters Became the Majority Population in 22 Big US Cities, https://www.rentcafe.com/blog/rental-market/market-snapshots/change-renter-vs-owner-population-2006-2016/
[8] CAISO, Wind and Solar Curtailment, December 31, 2018, http://caiso.com/documents/wind_solarreal-timedispatchcurtailmentreportdec31_2018.pdf
[9] Synapse Rate Benefit Report: https://www.synapse-energy.com/sites/default/files/EV-Impacts-June-2019-18-122.pdf
[10] Philip Jones, Jonathan Levy, Jenifer Bosco, John Howat, John Van Alst, Lisa Schwartz, The Future of Transportation Electrification: Utility, Industry and Consumer Perspectives, https://eta-publications.lbl.gov/sites/default/files/feur_10_transportation_electrification_final_20180813.pdf
[11] Chris Nelder, Emily Rogers, Reducing EV Charging Infrastructure Costs, https://rmi.org/wp-content/uploads/2020/01/RMI-EV-Charging-Infrastructure-Costs.pdf
[12] U.S. Energy Information Administration, FAQ, https://www.eia.gov/tools/faqs/faq.php?id=97&;t=3
[13] In the best solar region of the country the energy output of four 150kW chargers in one year would require 690 kW of solar panels which using the high efficiency panels represents 37,873square feet of real estate.
[14] Internal EVgo data
[15] National Association of State Energy Officials and Energy Futures Initiative, https://static1.squarespace.com/static/5a98cf80ec4eb7c5cd928c61/t/5e78b3c756e8367abbd47ab0/1584968660321/USEER+2020+0323.pdf

16
[16] Eisenstein, Paul, GM to Invest $2.2B in First All-Electric Vehicle Plant, Create 2,200 Jobs, https://www.nbcnews.com/business/autos/gm-invest-2-2b-first-all-electric-vehicle-plant-create-n1124086
[17] Volkswagen Launches Plant Expansion to Assemble Electric Vehicles in America, http://newsroom.vw.com/vehicles/vw-launches-plant-expansion-to-assemble-electric-vehicles-in-america/
[18] Tomich, Jeffrey, Rivian Rolls In and a Town Dares to Dream, https://www.eenews.net/stories/1061188863
[19] Burns, Matt, Lucid Motors Breaks Ground on its $800 Million Arizona Factory, https://techcrunch.com/2019/12/02/lucid-motors-breaks-ground-on-its-700-million-arizona-factory/
[20] Melaina, Marc, et al., https://www.nrel.gov/docs/fy17osti/66980.pdf
[21] Roland-Holst, David, et al., https://www.next10.org/sites/default/files/2020-01/clean-transportation-ev-benefits-final.pdf
[22] State of EV Charging in 2016, https://www.fleetcarma.com/electric-vehicle-charging-2016-maps/

17
Authors : Cathy Zoi, Jonathan Levy, Isabelle Riu
Cathy Zoi is the Chief Executive Officer (CEO) of EVgo. Cathy is a distinguished executive with decades of experience in the energy industry, government, academic, and non-profit sectors. Prior to joining EVgo in 2017 she was President and co-founder of Odyssey Energy, a distributed generation software company she continues to chair. She was founding CEO of Frontier Power, a rural electrification company incubated by SunEdison. Zoi was an energy investor at Silver Lake and Bayard Capital, a board member for Ice Energy, SES, and Pacific Solar, and a management consultant at ICF and Next Energy. She served in the Obama Administration as Assistant Secretary and Acting Under Secretary at the
Department of Energy, where she oversaw more than $30 billion in energy investments. Zoi was also the founding CEO of both the Alliance for Climate Protection, established and chaired by U.S. Vice President Al Gore; and the Sustainable Energy Development Authority, a $50m fund to commercialize clean energy technologies in Australia. In the early 1990s, Zoi was Chief of Staff for Environmental Policy in the Clinton White House and she pioneered the Energy Star program while at the U.S. EPA. Zoi was also an adjunct professor and Precourt Energy Scholar at Stanford University, where she taught and did research between 2012 and 2017. Zoi has a B.S. in Geology from Duke University and an M.S. in Engineering from Dartmouth.
Jonathan Levy is Senior Vice President of Business Development at EVgo. Jonathan’s focus at EVgo has been on improving execution and growth at the company, primarily through business development, partnerships, and other initiatives to expand access to electric vehicles for more American drivers. Prior to joining EVgo, Jonathan was Director of Policy and Strategy at Vision Ridge Partners, an investment firm focused on sustainable real assets. Jonathan started his career on Capitol Hill as a policy advisor to then-Congressman Rahm Emanuel and served in the Obama Administration in a variety of leadership positions at the U.S. Department of Energy and the White House. Jonathan serves on the Board of Directors of the Electric Drive
Transportation Association, Veloz, and Gourmet Symphony. He graduated magna cum laude from Emory University with a B.A. in Political Science.
Isabelle Riu is a Senior Product Development Analyst at EVgo. In her role, Isabelle leads analyses to drive network expansion, manage energy costs, model load profiles, and procure renewable energy. Prior to joining EVgo, Isabelle was a Specialist at Southern California Edison developing the modeling, forecasting and economic analysis for the utility’s long-term clean energy strategy. She has also held roles at Fluence, Sierra Club, and the Federal Energy Regulatory Commission. She holds a BA in International Affairs & Environmental Studies from the George Washington University, and a Master of Environmental Management from the Yale School of Forestry & Environmental Studies.