the costs of illiteracy in south africa
TRANSCRIPT

The costs of illiteracy in South Africa
MARTIN GUSTAFSSON, SERVAAS VAN DER BERG, DEBRA SHEPHERD AND COBUS
BURGER
Stellenbosch Economic Working Papers: 14/10
KEYWORDS: LITERACY, ILLITERACY, SOUTH AFRICA, EDUCATION PRODUCTION
FUNCTION, ECONOMIC GROWTH
JEL: C35, D23, I28, O15
MARTIN GUSTAFSSON DEPARTMENT OF
ECONOMICS UNIVERSITY OF STELLENBOSCH
PRIVATE BAG X1, 7602 MATIELAND, SOUTH
AFRICA E-MAIL:
ZA
SERVAAS VAN DER BERG DEPARTMENT OF
ECONOMICS UNIVERSITY OF STELLENBOSCH
PRIVATE BAG X1, 7602 MATIELAND, SOUTH
AFRICA E-MAIL:
DEBRA SHEPHERD DEPARTMENT OF
ECONOMICS UNIVERSITY OF STELLENBOSCH
PRIVATE BAG X1, 7602 MATIELAND, SOUTH
AFRICA E-MAIL:
COBUS BURGER DEPARTMENT OF
ECONOMICS UNIVERSITY OF STELLENBOSCH
PRIVATE BAG X1, 7602 MATIELAND, SOUTH
AFRICA E-MAIL:
A WORKING PAPER OF THE DEPARTMENT OF ECONOMICS AND THE
BUREAU FOR ECONOMIC RESEARCH AT THE UNIVERSITY OF STELLENBOSCH

The costs of illiteracy in South Africa1
MARTIN GUSTAFSSON, SERVAAS VAN DER BERG, DEBRA SHEPHERD AND COBUS
BURGER
ABSTRACT
In South Africa there has been a surge in publicly funded adult literacy education in recent
years. There is a recognition that for the effective monitoring of adult literacy, direct measures
of literacy are required. Grade attainment, self-reported ability to read and behavioural
variables relating to, for instance, reading habits produce vastly different measures of adult
literacy in South Africa. It is noteworthy that self-reported values change over time as
people’s perceptions of what consitutes literacy shifts. A 75% literacy rate is arguably a
plausible figure, though the absence of a direct measure is problematic. An education
production function suggests that literacy-related parent behaviour, independently of parent
years of education, influences performance of learners in school. In a multivariate
employment model, self-reported literacy is a statistically significant predictor of being
employed. In a cross-country growth model, poor quality schooling emerges as the variable
requiring the most urgent policy attention to sustain and improve South Africa’s economic
development. Both microeconomic and macroeconomic estimates suggest that with a more
typical level of school performance South Africa’s GDP would be 23% to 30% higher than it
currently is.
Keywords: Literacy, Illiteracy, South Africa, Education production function,
Economic growth
JEL codes: C35, D23, I28, O15
1 This report was produced for JET Education Services in 2009 and was made possible by funding
provided by Nedbank.

3
An extended summary of the findings
The paper’s key concerns are to estimate the current level of illiteracy in South Africa and to
gauge the costs of illiteracy, in monetary and non-monetary terms, to individuals and to the
country. Moreover, the paper identifies key strategies with respect to data collection and
education that seem important in the fight against illiteracy in South Africa.
In section 2 the UN and South African policy backgrounds are discussed. Both globally and in
South Africa, public commitment towards eradicating adult illiteracy has been strong, and
recently concrete targets have been set. But at both levels there has been insufficient clarity
around defining and measuring illiteracy, which one can assume affects adversely proper
monitoring of programme effectiveness. The trend has been for either grade attainment or
self-reported ability to read and write to be used as proxies for more objective measures of
literacy. Internationally, methodological advances have been made in adult literacy
monitoring programmes such as IALS, ALL and LAMP, but the implementation of these
kinds of programmes has not been widespread (they have enjoyed much less success than
standardised testing programmes aimed at schools). South Africa’s recently launched Kha ri
Gude adult education programme is briefly discussed. This is an ambitious programme, which
aims to halve adult illiteracy by 2012, has expanded phenomenally in just two years to an
enrolment of around 620,000, and includes student assessment tools that follow the LAMP
approach.
Section 3 provides a short literature review. Within the microeconomic field, there is a
contradiction between the typical finding for most countries whereby the rates of return to
primary schooling exceed those of the other levels, and the finding in South Africa that below
the end of secondary schooling, each additional grade makes little difference to one’s
earnings. It is suggested that the South African pattern is the product of an unusual emphasis
on a single standardised qualification at the end of Grade 12, and that given the existence of
national qualifications below the Grade 12 level, the typical pattern of high returns to primary
schooling might have emerged. On the macroeconomic side, there has been an important shift
of emphasis in recent years, from the use of years of schooling as a proxy for human capital in
explaining economic growth, to the use of educational quality variables. This shift has
emphasised the relative unimportance of quantitative measures of education (such as years of
schooling), and the relative importance of qualitative test-based measures. This has profound
education policy implications. Human capital, including literacy, should largely be viewed in
qualitative terms (for instance on the basis of standardised assessments), and not quantitative
terms (for instance years of schooling). Focussing exclusively on quantitative measures can
result in poorly aligned policies.
Section 4 concentrates on the level of illiteracy amongst adults in South Africa. Published
adult literacy rates for the country vary enormously, from the 88% of UNESCO to an
extremely pessimistic rate of 7% based on imputations using the level of learner performance
in schools. The self-reported ability to read and write variable collected by Stats SA results in
an adult literacy rate of 90%. All commonly employed grade attainment criteria result in
lower rates, from around 84% if Grade 4 (a UNESCO standard) is used to 78% or 71% if
Grades 6 or 7 (common standards in South Africa) are used. An interesting alternative to the
self-reported literacy and grade attainment criteria is the use of behavioural criteria, such as
time spent reading per week. Data collected from the parents of learners suggest that at least
75% of adults spend at least an hour reading per week. It is perhaps useful to think of this
75% level as a plausible minimum literacy level in South Africa.
Some interrogation of cross-country data indicates that having self-reported rates which are
higher than rates linked to grade attainment is the norm for developing countries, suggesting
that self-reported rates universally tend to result in over-estimates of adult literacy. A further
problem with self-reported literacy is that values are unstable over time. In the period 2001 to
4
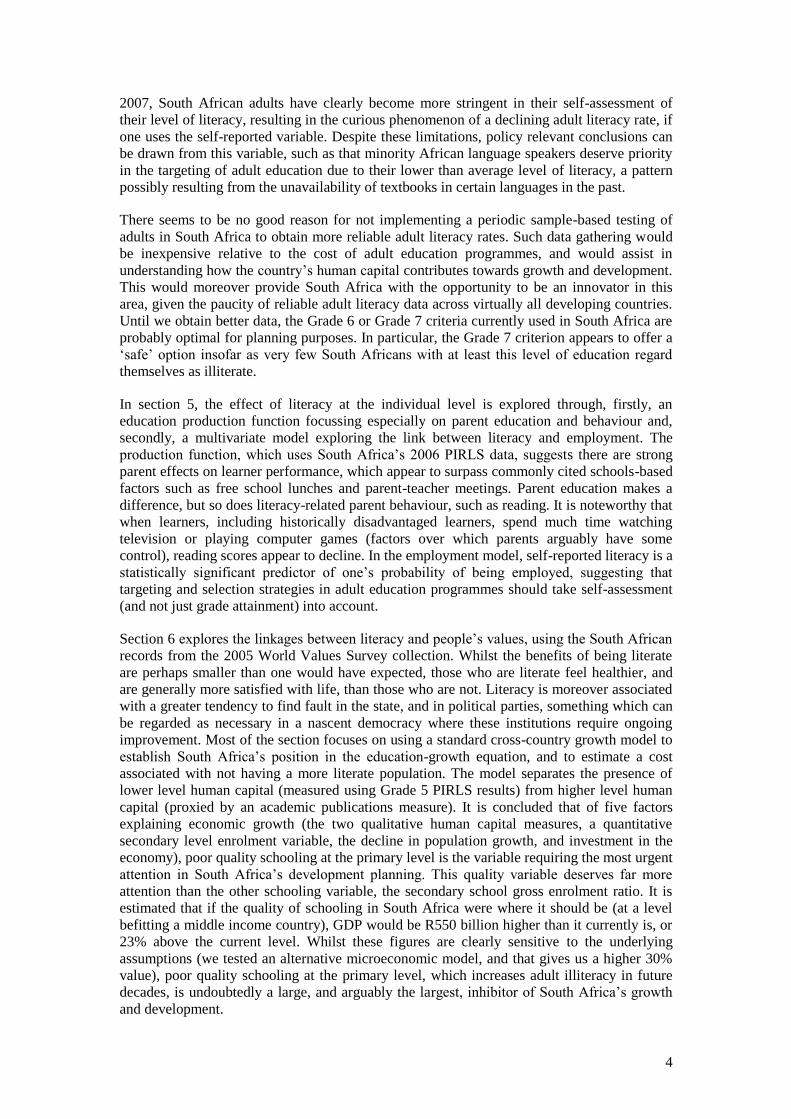
2007, South African adults have clearly become more stringent in their self-assessment of
their level of literacy, resulting in the curious phenomenon of a declining adult literacy rate, if
one uses the self-reported variable. Despite these limitations, policy relevant conclusions can
be drawn from this variable, such as that minority African language speakers deserve priority
in the targeting of adult education due to their lower than average level of literacy, a pattern
possibly resulting from the unavailability of textbooks in certain languages in the past.
There seems to be no good reason for not implementing a periodic sample-based testing of
adults in South Africa to obtain more reliable adult literacy rates. Such data gathering would
be inexpensive relative to the cost of adult education programmes, and would assist in
understanding how the country’s human capital contributes towards growth and development.
This would moreover provide South Africa with the opportunity to be an innovator in this
area, given the paucity of reliable adult literacy data across virtually all developing countries.
Until we obtain better data, the Grade 6 or Grade 7 criteria currently used in South Africa are
probably optimal for planning purposes. In particular, the Grade 7 criterion appears to offer a
‘safe’ option insofar as very few South Africans with at least this level of education regard
themselves as illiterate.
In section 5, the effect of literacy at the individual level is explored through, firstly, an
education production function focussing especially on parent education and behaviour and,
secondly, a multivariate model exploring the link between literacy and employment. The
production function, which uses South Africa’s 2006 PIRLS data, suggests there are strong
parent effects on learner performance, which appear to surpass commonly cited schools-based
factors such as free school lunches and parent-teacher meetings. Parent education makes a
difference, but so does literacy-related parent behaviour, such as reading. It is noteworthy that
when learners, including historically disadvantaged learners, spend much time watching
television or playing computer games (factors over which parents arguably have some
control), reading scores appear to decline. In the employment model, self-reported literacy is a
statistically significant predictor of one’s probability of being employed, suggesting that
targeting and selection strategies in adult education programmes should take self-assessment
(and not just grade attainment) into account.
Section 6 explores the linkages between literacy and people’s values, using the South African
records from the 2005 World Values Survey collection. Whilst the benefits of being literate
are perhaps smaller than one would have expected, those who are literate feel healthier, and
are generally more satisfied with life, than those who are not. Literacy is moreover associated
with a greater tendency to find fault in the state, and in political parties, something which can
be regarded as necessary in a nascent democracy where these institutions require ongoing
improvement. Most of the section focuses on using a standard cross-country growth model to
establish South Africa’s position in the education-growth equation, and to estimate a cost
associated with not having a more literate population. The model separates the presence of
lower level human capital (measured using Grade 5 PIRLS results) from higher level human
capital (proxied by an academic publications measure). It is concluded that of five factors
explaining economic growth (the two qualitative human capital measures, a quantitative
secondary level enrolment variable, the decline in population growth, and investment in the
economy), poor quality schooling at the primary level is the variable requiring the most urgent
attention in South Africa’s development planning. This quality variable deserves far more
attention than the other schooling variable, the secondary school gross enrolment ratio. It is
estimated that if the quality of schooling in South Africa were where it should be (at a level
befitting a middle income country), GDP would be R550 billion higher than it currently is, or
23% above the current level. Whilst these figures are clearly sensitive to the underlying
assumptions (we tested an alternative microeconomic model, and that gives us a higher 30%
value), poor quality schooling at the primary level, which increases adult illiteracy in future
decades, is undoubtedly a large, and arguably the largest, inhibitor of South Africa’s growth
and development.

5
A simplified version of the graph presented in the paper to explain the growth model appears
below.
Figure 1: Country development and school performance
0
10
20
30
40
50
60
70
80
90
100
% o
f le
arn
ers
pa
ssin
g th
e lo
we
st P
IRL
S b
en
ch
ma
rk Where South Africa's Grade 5 learners are currently, at 21%. This would be typical for a lower middle income country.
$5,990 $12,601LIC LMC UMC HIC
$1,970
Where South Africa's upper middle income economy, as measuredby GDP per capita (in PPP terms) lies.
The PIRLS pass rate should be around 50% to sustain the economy, according to international trends.

6
Acronyms and abbreviations used
ALL Adult Literacy and Lifeskills Survey
ASGISA Accelerated and Shared Growth – South Africa
EFA Education for All
GDP Gross domestic product
GER Gross enrolment ratio
GHS General Household Survey
HIC High income country
IALS International Adult Literacy Survey
ISO International Organization for Standardization
LAMP Literacy Assessment and Monitoring Programme
LFS Labour Force Survey
LIC Low income country
LMC Lower middle income country
NGO Non-government organisation
OECD Organisation for Economic Co-operation and Development
OLS Ordinary least squares
PIRLS Progress in International Reading Literacy Study
RDP Reconstruction and Development Programme
SACMEQ Southern and Eastern Africa Consortium for Monitoring Educational Quality
SES Socio-economic status
Stats SA Statistics South Africa
TIMSS Trends in International Mathematics and Science Study
UIS UNESCO Institute for Statistics
UMC Upper middle income country
UN United Nations
UNDP United Nations Development Programme
UNESCO United Nations Educational, Scientific and Cultural Organization
US United States
The following abbreviations for the provinces were used:
EC Eastern Cape
FS Free State
GP Gauteng
KN KwaZulu-Natal
LP Limpopo
MP Mpumalanga
NC Northern Cape
NW North West
WC Western Cape
ISO three-letter codes for countries are listed in Appendix B (the codes for Lesotho and
Swaziland are LSO and SWZ).

7
1 Introduction
Illiteracy is rightly seen as a major social scourge. The Nobel economics laureate Amartya
Sen, in his Development as Freedom, identifies illiteracy, premature mortality and
undernourishment as the three factors most succinctly describing human deprivation at the
most basic level2.
This paper attempts to throw new light on the challenges and solutions surrounding illiteracy
in South Africa. Our focus is shaped by the following three questions:
What are the long term consequences of low literacy levels, for the individual and society
as whole?
What is the Rand value cost of having low literacy levels in the country?
What are the levels of literacy in the country?
These questions deal mainly with the nature of the problem in South Africa. Whilst we do
examine the problem in depth, we also pay attention to the policy and behavioural solutions
that can contribute towards a South Africa that is free from illiteracy.
The available data sources for answering the three questions are far from ideal, and we
discuss the limitations with these sources in some depth. At the same time, we believe that the
existing datasets have not been sufficiently explored, and that the new analysis we undertake
using the available data can contribute towards a clearer picture of the challenges. Moreover,
examining what data we have assists in identifying the gaps, and hence planning the
collection of better data in the future.
In the paper, we use a number of different definitions and criteria for literacy, partly because
the data force us to do this, and partly because literacy needs to be understood differently
depending on one’s focus (in particular one’s policy focus).
The paper proceeds as follows:
Section 2 looks at how the UN bodies and the South African government have dealt with
illiteracy in their policies, and what the assumptions behind these policies have been.
Section 3 provides a literature review with a focus on the economic literature dealing with
the relationship between illiteracy, on the one hand, and individual and national welfare,
on the other.
Section 4 presents a cautious analysis of the available data to provide a picture of the
levels of illiteracy in South Africa. Definitions of illiteracy, and some cross-country
comparisons, are discussed. The data used here are mainly the Labour Force Survey
datasets of Stats SA (over the 2001 to 2007 period), but PIRLS data on parents are also
used to provide an alternative view.
Section 5 examines the impact of illiteracy at the level of individuals in South Africa.
This is done from two angles. Firstly, the impact of parent education on the performance
of children in schools is examined, through a production function using PIRLS data.
Secondly, the relationship between illiteracy (and basic education) on the one hand, and
employment on the other, receives attention, through a multivariate modelling of Labour
Force Survey data.
2 Sen, 1999: 103.

8
Section 6, after examining briefly links between literacy and people’s values (using the
South African records from the World Values Survey dataset), turns to the monetary cost
of having the levels of illiteracy we have, using a cross-country growth model. For the
measurement of literacy, this modelling makes use of the PIRLS 2006 dataset.
Section 7 provides a conclusion.
Whilst the paper examines the costs to individuals and the country of not reducing illiteracy
(or, to put it differently, the benefits of reducing it), it does not examine the costs of literacy
enhancing activities such as adult education programmes and school improvement initiatives.
This falls beyond the brief of this paper. It is worth pointing out, however, that these
monetary costs are considered to be low, at least for a country like South Africa, which
already devotes a high level of public and private spending towards education. The literature
indicates that worldwide the cost of providing basic education to illiterate adults is not high,
and that given relatively certain benefits (depending, of course, on the design of the
programme), costs relative to benefits are remarkably low3. As far as school improvement
initiatives are concerned, better utilisation of existing education funding has been argued is
the key to quality improvements, rather than higher levels of funding (at least in South
Africa)4. There is undoubtedly a sound argument in South Africa for increasing spending on
adult basic education programmes. However, the magnitude of this need is small in terms of
government’s overall budget. Whether one increases the budget for adult education through
growth in the total education budget, or by diverting some budget away from schooling, the
impact is negligible. In fact, it could be argued that since the advent of democracy in 1994,
the core problem has not been under-budgeting in adult education, but delays in formulating a
sufficiently clear and convincing strategy that could attract the necessary public funding.
3 UNESCO, 2005b: 145.
4 Gustafsson and Patel, 2006.

9
2 The policy background
This section describes how global and South African policies tackle the problem of adult
illiteracy, and examines the information and assumptions underlying the policy. The vast
terrain of policies for improving educational quality in schools, though linked to adult
literacy, are not dealt with here, though there is some discussion of this topic in section 6.
The role of the United Nations in bringing adult literacy issues to the fore has been
substantial, and in many senses the UN has become a standards setter not just for the
definitions of literacy, but even the design of adult education programmes. The 1948
Universal Declaration of Human Rights declared ‘elementary education’ a human right,
adding that it should be free and compulsory. The right to literacy is implied, and the
Declaration furthermore indicates that basic education should promote desirable values such
as respect for human rights and a striving for world peace.
It was only in 1990, however, that UNESCO made an explicit commitment to advancing adult
literacy, in the Jomtien World Declaration of Education for All5. We focus on the later Dakar
Framework for Action, of 2000, which included more specifics on adult literacy. Goal 4 of the
2000 framework calls for ‘Achieving a 50 per cent improvement in levels of adult literacy by
2015, especially for women, and equitable access to basic and continuing education for all
adults’. Complementary goals are Goal 2 (getting all children to complete primary schooling
by 2015) and goal 6 (ensuring that all children acquire ‘literacy, numeracy and essential life
skills’) 6.
Literacy rates of 85% for men and 74% for women worldwide were explicitly assumed. For
developing countries, where the bulk of the problem lies, these figures are mostly derived
through one of two approaches. Either national surveys which ask respondents whether they
are able to read are used (this is the preferred approach as far as UNESCO is concerned) or,
failing that, enrolment statistics submitted over the years to UNESCO are run through
UNESCO’s Global Age-specific Literacy Projections model, to arrive at an imputed literacy
rate. As an example, in the 2009 Education for All Global Monitoring Report, out of 40
African countries with adult literacy rates, 18 had rates based on self-reported values. As we
shall see below, both approaches are flawed.
The UNESCO argument for reducing adult illiteracy is sound, and is supported by the
literature. The impact of literacy on the economic and social improvement of individuals is
acknowledged, with special emphasis on the matter of female literacy, which is known to
improve health in households, and better enrolment ratios for girls.
The weakness of the Dakar framework lies in the absence of direction with respect to defining
literacy, measuring literacy and monitoring improvements. Goal 4 itself is vague as it is not
clear what the 50% improvement refers to. Is it a 50% reduction in the number of illiterates,
or an improvement in the literacy rate of 50%, for instance? Guidance on how to deal with the
typical problems experienced in adult basic education programmes is also absent.
Some of the gaps in the Dakar framework have been dealt with in the various releases of the
EFA Global Monitoring Report7. The 2005 report elaborates extensively on goal 6 (the
educational quality goal) and the 2007 report emphasises the importance of rigorous learner
assessments in cross-country programmes such as SACMEQ and PIRLS, and in country-
specific ‘national assessments’ (the report provides a short account of these assessments by
country). The 2006 report pays special attention to adult literacy, and discusses how
5 UNESCO, 1990.
6 UNESCO, 2000.
7 See in particular UNESCO (2005a), UNESCO (2005b) and UNESCO (2006).

10
measurement can be improved, with some attention to the experiences of three key
programmes: IALS, ALL and LAMP.
The International Adult Literacy Survey (IALS) started in 1994 and has involved 21
countries, one of which, Chile, is a developing country. The IALS was the first ever attempt
to obtain standardised test-based literacy figures from several countries. Data were collected
from national samples, and apart from literacy, numeracy and problem-solving skills were
tested. After 1998, following critiques of the tests, the sampling methodology, and the survey
procedures, the IALS was revised and became the Adult Literacy and Lifeskills Survey
(ALL). ALL has only seen six countries involved to date8.
The Literacy Assessment and Monitoring Programme (LAMP), started by the UNESCO
Institute for Statistics (UIS) in around 2005, is largely aimed at introducing IALS-type
literacy surveys in developing countries. A detailed methodology has been developed9, and
the focus has been on piloting this in five countries: Mongolia, Morocco, Niger, Kenya and
Jamaica. In 2007, Kenya published the results for the first survey, and the Kenyan experience
is generally considered an important milestone for this kind of work in developing countries10
.
Clearly, interest in measuring adult literacy in a standardised manner lags behind the interest
in measuring learner performance in schools in programmes such as TIMSS (47 countries in
total in 2003, of which 20 are developing countries). With a very few exceptions, such as
Kenya, this kind of measurement is still extremely rare.
It is noteworthy that despite its focus on emerging improvements in the measurement of adult
literacy, the 2006 EFA report stops short of questioning the worldwide literacy rate of around
80%, or proposing how revisions of these estimates could be arrived at.
In South Africa, the government’s Tirisano programme for improving education, launched in
1999, included as priority 2 of 9: ‘We must break the back of illiteracy among adults and
youths in five years’11
. However, the implied large-scale adult literacy programme did not
materialise. In 2008, a national government programme dealing specifically with adult
literacy, Kha ri Gude, was launched12
. The aim of the programme is to make 4.7 million adult
literate between 2008 and 2012, the assumption being that this is more or less half of the total
number of illiterate adults (and that this would achieve South Africa’s compliance with the
Dakar goal). The programme is premised on the employment of paid ‘volunteers’, the use of
standardised teaching packs, and some partnering with NGOs within the structure of the
public programme. Public spending is earmarked mainly for stipends for the volunteers, and
free materials for students. Enrolment in Kha ri Gude was reported to be 360,000 in 2008, and
preliminary Department of Education figures indicate an enrolment of around 620,000 in
2009, which exceeds original targets and can be seen as indicative of strong demand. Public
spending by the national government in 2008 was around R470 million, resulting in around
R1,300 per student, or more or less one-sixth of the level of spending on each public school
learner13
. Spending per student is expected to be reduced to around half of the 2008 figure in
2009, largely through improved procurement processes relating to the student materials and
some increases in the class sizes. Kha ri Gude, unlike many other literacy programmes,
includes a standardised assessment component in which all students are assessed and results
are moderated nationally. The assessment tools have been designed to be similar to those of
8 Information obtained from the US National Center for Education Statistics
(http://nces.ed.gov/Surveys/ALL/index.asp). 9 UNESCO, 2005c.
10 See http://www.kenyadulteducation.org.
11 Department of Education, 1999.
12 See http://www.kharigude.co.za/.
13 National Treasury, 2009: 258.

11
UNESCO’s LAMP. There is a strong emphasis on accountability mechanisms in the
programme aimed at ensuring correct utilisation of the programme’s resources.
The gaps at the international level with regard to definitions and clarity around measurement
and monitoring processes have to a large degree been mirrored in South Africa14
. In many
ways Kha ri Gude represents a very serious attempt to deal with these gaps. However, a
number of issues will need to be resolved as the programme unfolds. The assumption that
there are around nine million illiterate adults in South Africa requiring assistance could be an
over-estimate, given the discussion that follows in section 4. Though students are assessed in
Kha ri Gude, how the overall effectiveness of the programme in improving the lives of people
will be monitored is not yet finalised. In many respects literacy is a goal worth pursuing on its
own, but based on the literature on the social effects of literacy it is also reasonable to expect
results such as improved productivity and income, the empowerment of women and better
health practices in the home. A common problem with adult literacy programmes is that they
over-estimate demand. Enrolment levels in Kha ri Gude suggest this has not been the case,
but it remains to be seen if the strong demand will persist. Though materials are free and the
physical location of classes follows demand, there is likely to be a number of potential
students who do not regard the benefits of literacy worth the cost and effort. Cost could
include forfeited income in the case of the employed. Students are required to attend 10 hours
of classes per week for 6 months, making a total of around 240 hours.
Unfortunately, in South Africa and elsewhere in the developing world, schooling is falling
well short of expectations (as we shall see in section 6 below). The need to compensate for
this failing through adult education is likely to continue for many decades to come. Success in
the adult education field will to some extent depend on the right kind and level of attention to
monitoring and programme evaluation in government, in NGOs and amongst researchers15
.
14
See Aitchison and Harley (2004). 15
Oxenham (2004) provides an informative discussion of the ‘evaluphobia’ he believes often underlies
the failure in adult education programmes.

12
3 What the literature says
We repeat the three key questions dealt with in this report:
What are the long term consequences of low literacy levels, for the individual and society
as whole?
What is the Rand value cost of having low literacy levels in the country?
What are the levels of literacy in the country?
The first question is often asked in the literature, at the individual and country levels, as long
as one does not make the presence of the word ‘literacy’ a requirement, as the question is
often posed with respect to education in general. Sometimes, the reference to education is too
general, as low-level educational outcomes (such as literacy) are not sufficiently distinguished
from higher level outcomes (such as the ability to invent new technologies). This can be
confusing, and requires some discrimination in the interpretation of the literature. The second
question, a very specific one, is not answered with respect to any country to our knowledge,
but it can be answered once one has answered the first one. The third question is such a basic
one that one would think there would be a wealth of literature in this area across most
countries. Unfortunately, this is not the case, in particular as far as developing countries are
concerned, largely due to the data problems discussed in this paper.
In this section, we pay particular attention to studies dealing with the first question. We focus
on the empirical findings in the literature, and not on the much more technical matter of
methodology (section 6 deals with that to some degree). Given the overall focus of the paper,
most of the literature we reviewed is from the field of economics.
We begin with the microeconomic literature dealing with the relationship between literacy (or
basic education) and individual welfare (which is generally equated with income). Much of
this literature is based on the Mincerian earnings function, a model that specifies that a range
of factors, but in particular one’s level of education and years of experience, predict what one
will earn. Prominent here is the work of Psacharopoulos16
, which has looked at rates of return
at the primary, secondary and tertiary levels in a large number of countries, and emphasised
that returns at the primary level are greatest, implying that developing countries ought to pay
special attention to ensuring that everyone obtains a basic education (and achieves a basic
level of literacy). The way this finding has been used has been criticised. In particular,
ignoring investments at the secondary and tertiary levels in the interests of an almost
exclusive emphasis on primary schooling is something development agencies such as the
World Bank have been accused of at various points in time. But the finding itself has also
been challenged, largely with reference to countries that display different patterns. South
Africa is one such country. As Keswell and Poswell (2002) find, returns to schooling below
the Grade 12 level are negligible. Though the causes behind this atypical pattern have not
been studied in depth, it seems likely it results from South Africa’s rather top-heavy and
atypical qualifications system where there are no national qualifications issued below the
Grade 12 level.
Very few earnings function analyses use data on actual literacy, skills or knowledge as a
determinant of income. Mostly, the highest grade attained is used. A rare, albeit somewhat
dated, exception is a study by Boissiere, Knight and Sabot (1985), who use a sample dataset
of adults in Kenya and Tanzania to demonstrate the particularly powerful effects of literacy
and numeracy, as measured through standardised tests, on productivity and income.
16
See for instance Psacharopoulos and Patrinos (2002).

13
A number of analysts explore the mechanisms whereby more education translates into better
earnings. Here the argument often turns to the importance of having literate women, as this
improves family planning, general health practices in the household, and the schooling of the
next generation of females. A meta-study by Malhotra, Pande and Grown (2003) is a helpful
source in this regard. Lauglo (2001) discusses the evidence of the impact of adult basic
education programmes in Sub-Saharan Africa.
On the macroeconomic side, much attention since the 1960s has gone towards establishing the
role of education, or human capital, in country growth models. One of the less complex
examples is Mankiw, Romer and Weil’s (1992) empirical model, which we use in section 6.
Some models have used the self-reported literacy variable, for instance those of Romer (1989)
and Naudé (2004), who focuses on Africa. Barro and Lee (2001) are amongst the few who
have used test-based adult literacy statistics (from IALS) to link literacy to economic growth.
Much of the complexity in some of the models is due to the attempt to explain how
technological change, a strong predictor of growth, comes about, and how human capital,
through imitation or innovation activities, contributes to technological change. Benhabib and
Spiegel’s (1994) empirical modelling, for example, pays special attention to how
technological knowledge is disseminated across countries, and links this to trade and cross-
country learning. Given the technological changes in the last two decades, especially in the
information and communication industries, these models emphasising the role of technology
have enjoyed much prominence.
Recent work by Hanushek and Woessman (2007 and 2009) stands out as being particularly
valuable for a number of reasons. They have made exceptionally good use of data from
international testing programmes to arrive at educational quality measures, in contrast to the
quantitative variables used in other growth modelling. They find, as one should expect, that
measures of the quality of schooling are far more significant than measures of the quantity of
schooling in the modelling of growth, and suggest that emphasising quantitative measures
(such as years of schooling) can be fundamentally misleading for the policymaker. Hanushek
and Woessman’s approach, which is permitted by substantial improvements in recent years in
the availability of qualitative data, has undoubtedly brought about an important shift in our
understanding of growth and development. In their 2007 paper, Hanushek and Woessman
underline three policy strategies. One, there should be healthy competition between schools,
linked to the parent’s right to choose a school. Two, there should be sufficient management
autonomy at the school level. In other words, schools should not be entangled in a large
bureaucracy. Three, there should be accountability for results amongst schools. It is
interesting to gauge South African schools against these three criteria. Arguably, South Africa
does well against the first two criteria, but poorly against the third one, largely because
accountability mechanisms linked to results are insufficiently developed. This will receive
attention below in section 6. An advantage with the Hanushek and Woessman papers is that
they are easy to read, in comparison to other texts on the topic. Their economic models are
relatively un-complex, and their policy discussion straightforward.
Some analysts have questioned certain fundamentals of the ‘education produces growth’
hypothesis. Bils and Klenow (2000), for instance, suggest that it is possible that with higher
income comes the ability to invest more in education, and that this produces better educational
quality. In other words, there could be reverse causality. Pritchett (1996), using empirical
cross-country models, argues that educational quality cannot lie behind improvements in
income, as more education does not appear to improve productivity. The responses to the
sceptics have been convincing. As an example, Hanushek and Kimko (2000) compare the pay
of US workers who received their schooling outside the US, to school quality levels from the
countries of origin, and find a clear association, thus supporting the notion that education, and
not other country-specific factors, lie behind better income.

14
4 Establishing literacy levels in South Africa
How literate are South African adults? This question is the focus of this section. We first look
at Stats SA household data, which are commonly used to address the question, and uncover a
few unexpected patterns. We also explore other sources of data, arrive at tentative conclusions
about the answer to the question, and explain what data would be required for greater
certainty.
Stats SA’s sample-based household surveys generally include the following questions,
directed towards all household members: ‘Can you read in at least one language?’ and ‘Can
you write in at least one language?’ The interviewer is told to consider the answer to be ‘Yes’
if the person can read (or write) a whole paragraph, but ‘No’ if, for instance, the person is just
able to read (or write) his or her name. The questions are asked in both the Labour Force
Survey (LFS) and General Household Survey (GHS). Here we use the LFS dataset, because
this survey includes the language most often spoken at home, something the GHS does not
include. Moreover, we examine the grade attainment data for adults included in the LFS.
Figure 2 illustrates the trend over time captured in the LFS (there are two surveys a year). The
self-reported ability to read and write variables, and three grade attainment criteria are shown.
Grade 4 is shown as UNESCO commonly uses a Grade 4 or 5 criterion17
, and Grade 6 and 7
are commonly used as criteria for being literate in South Africa18
. The focus is on the
population aged 15 and above, which follows the UNESCO standard19
(in South Africa age
16 and older is commonly used). Using grade attainment criteria for arriving at an adult
literacy rate clearly results in lower rates in South Africa, compared to the self-reported
variables. For instance, using the Grade 7 criterion gives a rate of around 70%, against around
90% if one uses the self-reported variables. It makes virtually no difference to the self-
reported measure whether one uses ability to read or ability to write. In fact, for 99.6% of
adults, the response is the same. The grade-linked literacy rates are all improving. For
instance, the Grade 6 criterion gives an annual improvement in the literacy rate of 0.5
percentage points (if we exclude the rate for 2001, which is an outlier that could represent an
error in the data). On the other hand, self-reported literacy is declining very slightly by an
average of 0.1 percentage point a year. This contradiction is puzzling. Below, we argue that
South Africans appear to have become more stringent in their self-reporting of their literacy
over the years.
The adult literacy rate for South Africa published by UNESCO in 2009, arrived at through
running enrolment figures submitted over the years by the South African government through
UNESCO’s Age-specific Literacy Projections Model, is 88%, in other words between the
self-reported and Grade 4 curves in Figure 220
. This translates into around 3.9 million illiterate
adults (out of a total of 33 million adults in 2007). Using the Grade 6 or 7 criteria results in
much higher numbers of illiterate adults of around 7.8 million and 10.1 million.
17
UNESCO, 2005b: 164. 18
Department of Education (2006) specifies Grade 6, but Grade 7 is also commonly used as this is the
last primary school grade. 19
UNESCO, 2003. 20
UNESCO, 2009: 274.

15
Figure 2: Labour Force Survey literacy trend 2001-2007 (all adults)
Source: Stats SA, 2007. Note: The ‘Write (SR)’ and ‘Read (SR)’ curves overlap almost perfectly, and are therefore not distinguishable. All adults aged 15 and above considered.
The next graph follows one set of age cohorts, namely those aged 15 to 50 in 2001. This view
of the trend is important as any improvements seen in the previous graph would to a large
degree be the result of the fact that the younger cohorts entering the group of adults would
tend to be better educated that those leaving. The Figure 3 view permits us to see what
differences may have been brought about by educational interventions aimed at adults. Here
the puzzle of a decline in self-reported literacy is more marked (the average annual decrease is
0.3 percentage points). The grade attainment improvements are less marked than the in the
previous graph, but still noticeable, especially with respect to Grade 7. However, the grade
attainment improvements are limited to younger adults. If we examine only adults aged 25
and above, there is no noticeable improvement for any of the grades. This does not mean that
there is no educational improvement at a basic level amongst adults. The way the LFS grade
attainment questions are posed in the questionnaire makes it likely that that they will elicit
responses only with respect to schooling, and not with respect to equivalent attainment within
adult basic education. It should be noted, however, that only around 0.1% of adults, or around
50,000, indicated in the LFS that they were attending adult education classes, and this level
does not seem to have changed noticeably in either direction between 2001 and 2007. Such
low levels of participation in adult education would not be associated with noteworthy
changes in the overall adult literacy figures. Even if 25,000 adults had achieved a Grade 7
level each year in the 2001 to 2007 period, this would only have changed the adult literacy
rate (using the Grade 7 criterion) by around 0.05 percentage points per year.
65%
70%
75%
80%
85%
90%
95%
Mar-0
1
Sep
-01
Mar-0
2
Sep
-02
Mar-0
3
Sep
-03
Mar-0
4
Sep
-04
Mar-0
5
Sep
-05
Mar-0
6
Sep
-06
Mar-0
7
Sep
-07
% li
tera
te
(usi
ng
sch
oo
ling
or
self
-re
po
rte
d m
eas
ure
s)
Write (SR)
Read (SR)
Gr 4
Gr 6
Gr 7

16
Figure 3: Labour Force Survey literacy trend 2001-2007 (fixed cohort of adults)
Source: Stats SA, 2007. Note: The ‘Write (SR)’ and ‘Read (SR)’ curves overlap almost perfectly, and are therefore not distinguishable. Individuals aged 15 to 50 considered in 2001, and thereafter these parameters increased by 1 in each new year.
The following graph illustrates the literacy trend by age. What this pattern implies is that even
if there is no adult education intervention, there will be improvements to the literacy rate over
time, simply because adults with less literacy are replaced by adults with more literacy over
time. As an example, some simple modelling reveals that a literacy rate of 90% in 2007 (using
the Grade 4 criterion) becomes 93% in 2015, 96% in 2025 and 98% in 2050, just on the basis
of the present educational profile of young adults.
Figure 4: Labour Force Survey literacy adult trend by age (2007)
Source: Stats SA, 2007.
In the following graph, we explore the link between the self-reported literacy variable and the
grade attainment variable. As one would expect, those adults with fewer years of schooling
would regard themselves as less literate. But what is striking is that the relationship between
highest grade attained and self-reported literacy appears to be changing over time. For
example, in 2001, 98% of adults aged 15 and over with a Grade 5 education considered
65%
70%
75%
80%
85%
90%
95%
Mar-0
1
Sep
-01
Mar-0
2
Sep
-02
Mar-0
3
Sep
-03
Mar-0
4
Sep
-04
Mar-0
5
Sep
-05
Mar-0
6
Sep
-06
Mar-0
7
Sep
-07
% li
tera
te
(usi
ng
sch
oo
ling
or
self
-re
po
rte
d m
eas
ure
s)
Write (SR)
Read (SR)
Gr 4
Gr 6
Gr 7
40%
50%
60%
70%
80%
90%
100%
18 22 26 30 34 38 42 46 50 54 58 62 66
% li
tera
te(u
sin
g sc
ho
olin
g o
r se
lf-r
epo
rted
m
easu
res)
Age
Gr 4
Gr 6
Gr 7
Read (SR)

17
themselves literate. In 2007 only 92% did. A very similar pattern emerges if we limit the
analysis to adults aged 20 to 29. What this suggests is that over time adults are becoming
more stringent in their self-reporting of ability to read and write. The trend seems to have
been particularly strong between 2001 and 2005. One can speculate that a more competitive
and information-driven society is making people downgrade their own sense of being literate
as they experience more barriers relating to their levels of literacy. This is what explains the
downward trend in self-reported literacy in Figure 3 and Figure 4 above. These patterns
confirm that subjective self-reported measures of literacy are highly unreliable. Not only are
they likely to be incomparable across countries, they are moreover unstable within a country
over time.
Figure 5: Relationship between education and self-reported literacy
Source: Stats SA, 2007. Note: Reading variable used on vertical axis. The population aged 15 and above is considered.
One thing that should be noted about the above graph is that Grade 7 appears to be a relatively
stable anchor in the sense that by this level of grade attainment, virtually all adults report
being literate across all years. The self-reported literacy rate at the Grade 7 level is not less
than 98.5% in any year. This would support the use of the Grade 7 threshold as a ‘safe’ one.
An adult who has attained Grade 7 is very unlikely to feel illiterate, but substantial numbers
of adults with less than Grade 7 are likely to feel illiterate, with the proportion increasing the
lower the grade.
The next graph focuses on the relationship between self-reported literacy and completion of
primary schooling across a small selection of middle income countries where UNESCO
published self-reported literacy rates. South Africa’s situation is by no means atypical. In all
the countries in the graph, self-reported literacy is higher than the rate one would obtain using
primary school completion, and the gap between the two measures is in fact lower in South
Africa than in the other countries, whether one uses the data published by UNESCO (ZAF1)
or 2007 Stats SA figures (ZAF2). But we could find no telling patterns in the relationship.
Moreover, the gap or ratio between the two measures was not found to have any clear
relationship with school quality measures such as those of PIRLS (PIRLS data are discussed
in section 6).
0%
10%
20%
30%
40%
50%
60%
70%
80%
90%
100%
0 1 2 3 4 5 6 7 8 9 10
% li
tera
te (
usi
ng
self
-re
po
rte
d m
eas
ure
)
Highest grade attained
LFS 2001 09
LFS 2003 09
LFS 2005 09
LFS 2007 09

18
Figure 6: Relationship between education and self-reported literacy across countries
Source: UNESCO, 2007; Barro and Lee, 2001. Note: ZAF1 is derived from the same sources as the other countries, whilst ZAF2 is derived from Stats SA (2007).
The pattern we see in Figure 5 underlines an important point. One should not expect a reliable
measure of literacy to display any drastic threshold points in a comparison against grade
attainment. One should expect people to attain some benchmark level of literacy in different
ways in the schooling system. Some will attain it in a lower grade than others, depending on
such factors as innate ability, socio-economic background and the quality of the school. An
important policy tool that would assist the targeting of adult literacy programmes is a profile
such as the one in Figure 5, but with some standardised test-based scale along the vertical
axis. The curves would probably be similarly shaped, but certainly lower in the graph, given
that the self-reported literacy rate can be considered an over-estimate. This tool, which could
be devised on the basis of a sample-based testing of adults that included grade attained as a
background variable, could assist in planning where to target adult education programmes (the
distribution of grade attainment across the country is relatively well known through various
Stats SA sources).
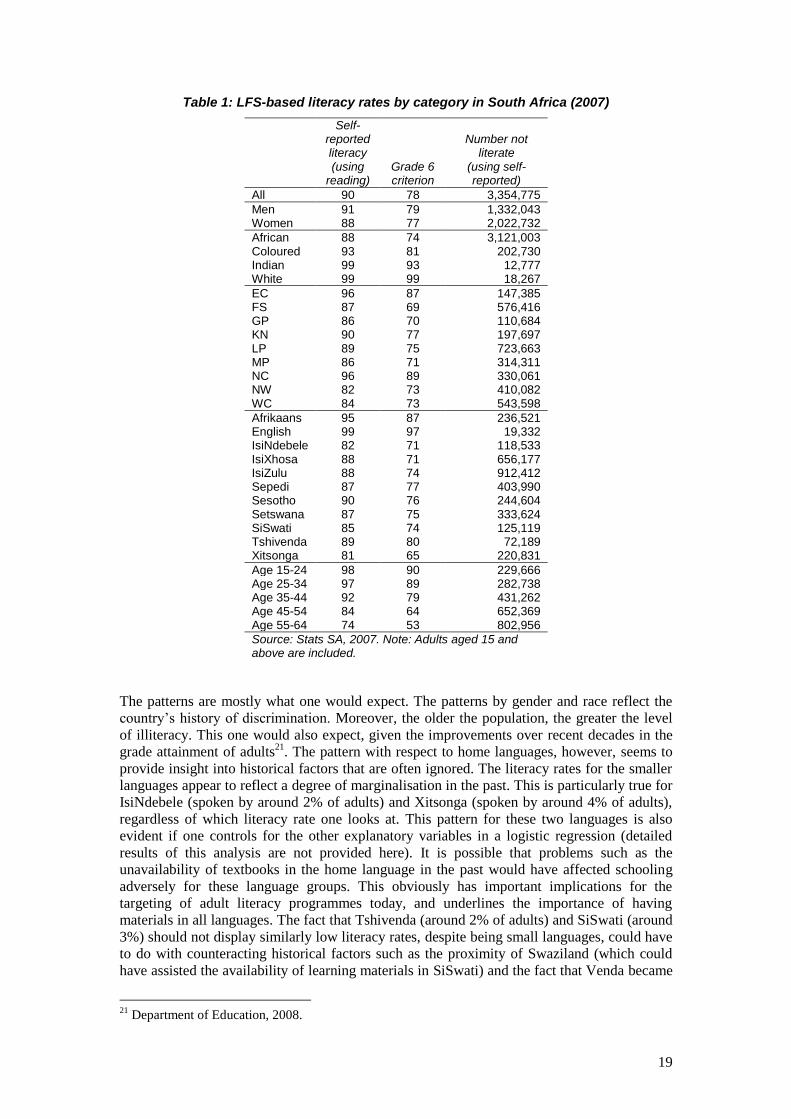
Table 1 below provides literacy rates for the whole population of adults (aged 15 and above)
and for sub-groups of this population. The first column gives the literacy rate using the LFS
self-reported reading ability variable (which is virtually equal to the self-reported writing
ability variable). In the second column, the Grade 6 attainment criterion is used.
R² = 0.1986
70
75
80
85
90
95
100
30 40 50 60 70 80 90
% li
tera
te (
usi
ng
self
-re
po
rte
d m
eas
ure
)
% of adults who have completed primary schooling
MEX
CHL
THA
IDNBRA
ZAF1
ZAF2
PHL
BWASWA
TUN
19
Table 1: LFS-based literacy rates by category in South Africa (2007)
Self-reported literacy (using
reading) Grade 6 criterion
Number not literate
(using self-reported)
All 90 78 3,354,775
Men 91 79 1,332,043 Women 88 77 2,022,732
African 88 74 3,121,003 Coloured 93 81 202,730 Indian 99 93 12,777 White 99 99 18,267
EC 96 87 147,385 FS 87 69 576,416 GP 86 70 110,684 KN 90 77 197,697 LP 89 75 723,663 MP 86 71 314,311 NC 96 89 330,061 NW 82 73 410,082 WC 84 73 543,598
Afrikaans 95 87 236,521 English 99 97 19,332 IsiNdebele 82 71 118,533 IsiXhosa 88 71 656,177 IsiZulu 88 74 912,412 Sepedi 87 77 403,990 Sesotho 90 76 244,604 Setswana 87 75 333,624 SiSwati 85 74 125,119 Tshivenda 89 80 72,189 Xitsonga 81 65 220,831
Age 15-24 98 90 229,666 Age 25-34 97 89 282,738 Age 35-44 92 79 431,262 Age 45-54 84 64 652,369 Age 55-64 74 53 802,956
Source: Stats SA, 2007. Note: Adults aged 15 and above are included.
The patterns are mostly what one would expect. The patterns by gender and race reflect the
country’s history of discrimination. Moreover, the older the population, the greater the level
of illiteracy. This one would also expect, given the improvements over recent decades in the
grade attainment of adults21
. The pattern with respect to home languages, however, seems to
provide insight into historical factors that are often ignored. The literacy rates for the smaller
languages appear to reflect a degree of marginalisation in the past. This is particularly true for
IsiNdebele (spoken by around 2% of adults) and Xitsonga (spoken by around 4% of adults),
regardless of which literacy rate one looks at. This pattern for these two languages is also
evident if one controls for the other explanatory variables in a logistic regression (detailed
results of this analysis are not provided here). It is possible that problems such as the
unavailability of textbooks in the home language in the past would have affected schooling
adversely for these language groups. This obviously has important implications for the
targeting of adult literacy programmes today, and underlines the importance of having
materials in all languages. The fact that Tshivenda (around 2% of adults) and SiSwati (around
3%) should not display similarly low literacy rates, despite being small languages, could have
to do with counteracting historical factors such as the proximity of Swaziland (which could
have assisted the availability of learning materials in SiSwati) and the fact that Venda became
21
Department of Education, 2008.

20
one of the nominally independent homelands under apartheid, a move that was rewarded with
preferential public funding from the central apartheid government.
Up to this point, the focus has been on individual adults. Focussing on literacy patterns at the
household level can be at least as important. Specifically, the percentage of households with
at least one literate adult is an important indication of the access people have to someone who
can assist them with matters such as enrolling in schools, applying for a social grant, applying
for a job, and so on. The household-level statistics are in fact better than the individual level-
ones. Whilst 90% of adults describe themselves as literate, 96% of households have at least
one adult who reports being literate. Similarly, whilst 82% of adults have at least Grade 6,
92% of households have at least one adult with at least Grade 6.
Undoubtedly, having literacy statistics based on standardised testing of adults would be ideal
for understanding the problem, and designing interventions. However, alternatives to the
usual Stats SA datasets provide some insights into what one should look for in alternative
measures of literacy, and what values one might expect. For instance, two of the national
learner testing programmes from the last decade have included data collection from parents,
with a special focus on the educational characteristics and behaviour of parents (though no
literacy test was applied to the parents). These two programmes are the international PIRLS
programme and the Department of Education’s Systemic Evaluation. The next table extracts a
few statistics from the PIRLS 2006 dataset. It is noteworthy that the correlation between grade
attained and time spent reading amongst the learners of parents is rather low (around 13% just
using the four levels of reading shown in the table, and seven levels of education). More
pertinent to the focus of this section of the report, 75% of parents report reading at least one
hour per week. This statistic is arguably more telling than either the self-reported literacy or
the grade attainment statistics discussed above. It is unlikely that someone who reports
reading over one hour per week in a survey such as PIRLS is illiterate. The question, because
it relates to an activity, as opposed to an assessment of one’s own abilities, is probably less
prone to subjectivity. The last column suggests that if one imposed a cut-off of at least one
hour of reading a week, then the adult literacy rate would be 75%. One could also impose
more stringent requirements, and arrive at lower literacy rates, such as 31% if one’s
requirement is at least six hours of reading a week. How representative would the PIRLS
respondents be of South Africa’s adults? It is difficult to tell, but of relevance here is the fact
that more women than men provided responses (9,336 female respondents, against 5,209 male
respondents, but with a large number of respondents, 3,009, with the gender variable left
blank). Any parent or guardian in the home was permitted to fill in the questionnaire, and only
one questionnaire was sent to each learner’s household. The fact that there are adults in
households who are not parents of learners in Grade 5 (the grade tested in PIRLS 2006) would
clearly diminish the credibility of generalising on the basis of the Table 2 statistics.
Nevertheless, given the general paucity of good data on adult literacy, a statistic such as the
75% ‘literacy rate’ seen in the table provides us with a rough indication of the minimum level
of literacy amongst adults. Adults who read less than one hour a week could of course also be
literate, which is why the 75% is best viewed as a minimum. But would an adult who hardly
ever reads, in a society where newspapers are fairly widespread, really qualify as being
literate? These are questions that need to inform improvements in our monitoring of adult
literacy.

21
Table 2: An alternative view on literacy (I)
Not Gr 9 Gr 9 Gr 12
Post-Gr 12 Total
Cumulative (‘literacy
rate’)
Time spent reading to oneself (including books, magazines, newspapers and materials for work) in a typical week:
< 1 hour/week 6 6 9 4 25 100 1-5 hours/week 6 7 21 9 44 75 6-10 hours/week 3 3 6 5 17 31 >10 hours/week 2 3 5 4 14 14
Total 17 19 41 23 100 Source: IEA, 2007. Note: The values refer to the percentage of the total pool of parents.
Hanushek and Woessman (2007: 57) argue that the adult literacy rate in South Africa is only
7%, using an extremely stringent approach where they combine enrolment data and
internationally comparable learner test scores. To compare, Brazil’s adult literacy rate, using
the same methodology, is found to be only 8%. Colombia and Egypt, on the other hand, enjoy
literacy rates of 30% and 32%. Clearly, if one considers the low level of learner achievement
in schools, then adult literacy rates of over 80% for South Africa appear to be incongruously
high. In PIRLS 2006, only 22% of Grade 5 learner reached the ‘low international benchmark’
of 400 points, meaning only 22% of learners were able to read and write, using the lowest
standard contemplated within the PIRLS programme (there are several international
benchmarks within PIRLS, and if one were to use a higher one the 22% ‘literacy rate’ for
South Africa would obviously be even lower). This 22% should be compared to the fact that
92% of adults with Grade 5 considered themselves literate in 2007 (see Figure 5). Even the
more realistic comparison between a 22% ‘literacy rate’ for Grade 5 learners and the fact that
65% of PIRLS parents with less than Grade 9 read for more than an hour a week, still points
to an incongruity (the PIRLS parent questionnaire pools everything from no schooling to not
completing lower secondary schooling into one categorical value, so it is not possible to
isolate, for instance, Grade 5). It seems very unlikely that this discrepancy, a discrepancy
found in many developing countries, could be the result of (or mainly the result of) a
deterioration in the quality of schooling (meaning older adults with just Grade 5 would be
more literate than learners in Grade 5). It seems much more plausible to ascribe the
discrepancy to measurement problems and, perhaps, to the fact that literacy skills are
accumulated by adults beyond formal schooling, in an informal manner (such as through the
reading of newspapers).
To conclude this section, the available data do not allow us to determine with reasonable
certainty what percentage of adults are able, for instance, to read a paragraph (the Stats SA
criterion for adult literacy). It is probably safe to assume, however, that the adult literacy rate
is at least 75%, based on who reads at least an hour a week, according to the PIRLS
(admittedly problematic) sample of parents we have. How much higher than 75% the actual
figure is, is debatable. It seems unlikely that it is as high as 88%, the level calculated and
published by UNESCO. The only way of obtaining such a high figure is to use self-reported
literacy, which we have seen is unstable (even for the same people over time), or a very low
grade attainment assumption (in fact even lower than Grade 4, judging from Figure 2). The
Grade 6 attainment criterion, which gives a rate of 78% in 2007, seems more credible. The
Grade 7 criterion, which gives 71%, is perhaps too stringent, though it is safe in the sense that
one is unlikely to exclude many adults who feel they are illiterate. But grade attainment is a
far from ideal measure of adult literacy, as suggested by poor results in standardised testing
programmes in the schools, such as PIRLS. There is no good reason for not measuring adult
literacy directly, using for instance the sample-based and test-based methodology of
UNESCO’s LAMP programme. Such a method can provide reliable results at a relatively low
cost.
22
5 The individual effects of illiteracy
Here two key impacts of adult literacy (and, by implication, possession of a basic education
amongst adults) are explored: the impact on the performance of children in school, and the
impact on being employed.
The Progress in International Reading Literacy Study (PIRLS) of 2006 provides us with an
opportunity to examine linkages between parent (including parent literacy) factors and learner
performance. In South Africa, PIRLS 2006 tested a representative sample of around 14,000
Grade 5 learners, and collected contextual information from the learners themselves, their
schools, their teachers and their parents through questionnaires. The reading scores are set on
a scale with an average of 500 and a standard deviation of 100 across all countries. Table 3
below provides the results of an education production function (also sometimes referred to as
an education input-output model), linking 21 input variables with the reading scores of the
South African learners. The statistical model is a weighted clustered survey regression
model22
. Two of the input variables, the socio-economic status (SES) of learners and the
school infrastructure index, are compound indices constructed from several variables in the
dataset, using a principal components approach. In line with common practice, missing
learner-level values were imputed using the school-level mode, whilst missing school-level
values resulted in the omission of whole schools from the analysis. Model A below is for the
entire South Africa PIRLS sample, whilst model B uses only those schools where testing
occurred in one of the nine African languages (in other words not in English or Afrikaans).
Model B allows us to focus on the dynamics of historically disadvantaged school
communities, where the need for quality improvements is most urgent23
. It should be noted
that a substantial number of learners from homes where an African language is spoken would
be excluded from model B. These African learners, who would mostly have written the test in
English, would generally be middle class learners attending schools which may or may not be
historically African. This largely explains why around 31% of learners are not included in
model B below, whilst only 17% of children aged 5 to 14 do not speak an African language at
home (according to the 2007 LFS).
22
A separate report which is an appendix to this paper provides full details on the analysis summarised
here. 23
See for instance Van der Berg (2007) for an account of the race dimensions of the educational quality
issues in South Africa.

23
Table 3: School production function results
A B
Pupil and household level
Is female 26.510 (14.08)** 29.000 (14.19)** Is under age 11 -22.758 (4.73)** -21.098 (4.25)** Is over age 11 -22.955 (7.25)** -13.240 (4.5)** SES (mean = 0, s.d. = 1) 11.003 (9.74)** 6.055 (4.98)** SES squared 4.112 (3.31)** -2.070 (1.67) Spends >5 hours per day on computer games -16.368 (7.73)** -16.099 (6.95)** Spends >5 hours per day watching television -10.091 (4.49)** -7.686 (3.42)** Gets homework > once per week 25.666 (8.81)** 22.548 (8.77)** Gets homework < once per week 25.132 (4.88)** 14.997 (2.44)*
Household literacy
Father completed secondary school 14.410 (5.02)** 8.300 (2.85)** Mother completed secondary school 20.044 (6.79)** 13.163 (4.29)** Mother uses test language at home 13.910 (4.29)** 15.033 (5.92)** Children's books are in test language 9.035 (3.54)** -2.670 (1.26) Parent reads every day 11.387 (5.20)** 13.716 (5.27)** Has <25 books -9.151 (3.32)** 4.496 (1.66) Parent helps the child with homework 8.654 (3.23)** 9.854 (2.92)**
School level
School mean of SES 49.372 (14.87)** 13.763 (2.27)* School mean of SES squared 15.218 (7.63)** 2.914 (0.90) Infrastructure index (mean = 0, s.d. = 1) 2.307 (1.11) -0.884 (0.43) Parent-teacher meeting held > once per year 9.538 (1.42) 2.025 (0.33) No free lunch is provided 15.079 (2.22)* -1.367 (0.20)
Constant 202.053 (16.45)** 193.831 (18.27)**
R-squared 0.62
0.24 Number of observations 13164
9066
Source: IEA, 2007. Note: Values in brackets are t-statistics expressed in absolute terms. ** and * indicate that the coefficient is significant at the 1% and 5% levels respectively.
Parent education makes a difference to learner performance. Specifically, in historically
African schools, if both the mother and the father had completed secondary schooling, the
expected PIRLS score of the learner would be about 21 points higher (8.300 plus 13.163, and
almost a quarter of one standard deviation on the cross-country scale), compared to learners
whose parents had both not completed secondary schooling. The fact that the association with
the mother’s education should be greater than that with the father’s education underlines the
importance of educating females for human capital transfer across generations. And the fact
that the effects of parent education in historically African schools should be lower than those
in the full sample could point to problems these schools experience in translating home
background advantage to outstanding classroom performance, a phenomenon that has been
examined by, for instance, Van der Berg (2008). Of more direct relevance to the question of
the impact of basic literacy, parents who say that they read every day are associated with an
improvement of 14 PIRLS points in the African language sub-sample.
The two book variables, namely having less than 25 books in the home and having children’s
books that are in the PIRLS test language, yield no meaningful or statistically significant
coefficients in the model. This is surprising, given positive evidence on the impact of books
or newspapers in the household in other analyses24
. This should serve as a reminder that these
kinds of production function results are sensitive to a range of data and modelling problems,
and that firm policy conclusions should only be drawn from the accumulation of knowledge
across several such models.
24
See for instance Hanushek and Luque (2003: 490). Gustafsson and Patel (2008: 33) find, using the
South Africa’s 2004 Systemic Evaluation dataset, that having newspapers in the home is associated
with better reading and mathematics scores.
24
Further variables in the model relating to parent behaviour (and potentially subject to
influence through adult education) include helping the child with homework (improvement of
10 PIRLS points in the African language sub-sample), and allowing children to watch more
than five hours of television or play computer games for more than five hours per week (both
display substantial negative associations with learner performance, and the data indicate that
the percentage of African learners surpassing the five hour threshold is 20% for both
activities).
To put the parent variables in context, if we add the parent education and parent behaviour
effects in the African language sub-sample, we obtain around 85 PIRLS points. This provides
a sense of the difference that parents can make, if one’s improvement occurs off a low base.
We can compare this to a 2 point improvement associated with more parent-teacher meetings,
a 1.3 point improvement if free lunches are provided at the school, or an 8 point improvement
if the SES value shifts by one standard deviation from -1.0 to 0.0. The model undoubtedly
supports a strong policy focus on parent education and behaviour.
Next, we examine the impact of a basic education and adult literacy on being employed. We
decided to limit our focus to employment as a dependent variable here, as opposed to wage,
given the high unemployment rate in South Africa (officially 22% in 2008), and the strong
emphasis on tackling unemployment in government and non-government circles.
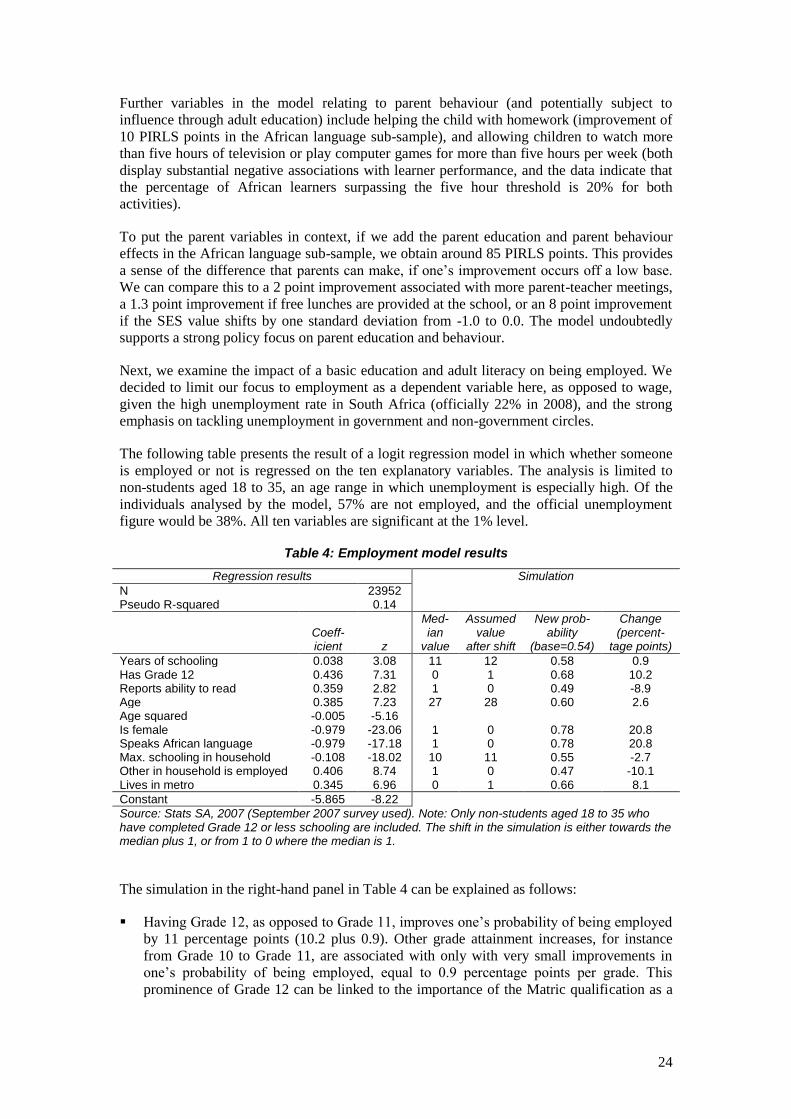
The following table presents the result of a logit regression model in which whether someone
is employed or not is regressed on the ten explanatory variables. The analysis is limited to
non-students aged 18 to 35, an age range in which unemployment is especially high. Of the
individuals analysed by the model, 57% are not employed, and the official unemployment
figure would be 38%. All ten variables are significant at the 1% level.
Table 4: Employment model results
Regression results Simulation
N
23952
Pseudo R-squared
0.14
Coeff-icient z
Med-ian
value
Assumed value
after shift
New prob-ability
(base=0.54)
Change (percent-
tage points)
Years of schooling 0.038 3.08 11 12 0.58 0.9 Has Grade 12 0.436 7.31 0 1 0.68 10.2 Reports ability to read 0.359 2.82 1 0 0.49 -8.9 Age 0.385 7.23 27 28 0.60 2.6 Age squared -0.005 -5.16
Is female -0.979 -23.06 1 0 0.78 20.8 Speaks African language -0.979 -17.18 1 0 0.78 20.8 Max. schooling in household -0.108 -18.02 10 11 0.55 -2.7 Other in household is employed 0.406 8.74 1 0 0.47 -10.1 Lives in metro 0.345 6.96 0 1 0.66 8.1
Constant -5.865 -8.22
Source: Stats SA, 2007 (September 2007 survey used). Note: Only non-students aged 18 to 35 who have completed Grade 12 or less schooling are included. The shift in the simulation is either towards the median plus 1, or from 1 to 0 where the median is 1.
The simulation in the right-hand panel in Table 4 can be explained as follows:
Having Grade 12, as opposed to Grade 11, improves one’s probability of being employed
by 11 percentage points (10.2 plus 0.9). Other grade attainment increases, for instance
from Grade 10 to Grade 11, are associated with only with very small improvements in
one’s probability of being employed, equal to 0.9 percentage points per grade. This
prominence of Grade 12 can be linked to the importance of the Matric qualification as a

25
provider of labour market signals, and the absence of similar qualifications at other levels
of the schooling system.
Self-reported ability to read is associated with an 8.9 percentage point improvement in
one’s probability of being employed. Although only 4% of the adults analysed by the
model describe themselves as being unable to read, the fact that self-reported literacy
should have a statistically significant association with employment, whilst controlling for
years of schooling, seems important25
. It suggests that apart from highest grade attained,
people’s perceptions of their own ability to read is a relevant criterion when targeting
adult education programmes at potential students. In other words, providers can use grade
attainment cut-offs when recruiting students, but they should also encourage anyone who
perceives himself as illiterate, regardless of highest grade attained, to enrol.
The reduction in one’s probability of being employed associated with being female and
African is high (and virtually the same for the two explanatory variables). Apart from
labour market discrimination and problems in accessing employment-inducing social
networks, a problem linked to the being African variable is that the quality of schooling in
historically African schools has tended to be poor.
Household factors such as the years of schooling of the most educated other household
member, and whether anyone in the household is employed, are significant, underlining
the importance of targeting adult education towards areas where a high proportion of
households (as opposed to individuals) experience human capital and employment
deprivation.
Finally, living in one of the six metropolitan areas in the country is associated with an
increase in one’s employment probability of 8 percentage points, underlining the
importance of targeting rural areas in employment interventions.
It is should be noted that neither the employment model, nor the school model in this section
are able to establish the direction of causality between variables, for instance, between self-
reported literacy and one’s probability of being employed. It is frequently possible that the
causality is complex, and that it works in both directions. For instance, literacy may indeed be
a reason contributing towards better employment prospects. However, it is possible that some
of the association relates to the fact that employment causes better literacy (and confidence in
one’s ability to read) through work experience. But the room for interpretation depends on the
relationship being considered. It is unlikely that learner literacy would cause parent literacy in
any significant manner, for instance, so in this instance there could be greater certainty about
the effect (namely that parent literacy assists learner literacy).
25
A variable on whether one had completed primary schooling was added to the model, and was found
to be statistically insignificant.
26
6 The social and economic costs of illiteracy to the country
The economic modelling presented in this section is aimed at quantifying the cost of illiteracy,
in terms of country-level aggregate income (and hence, in monetary terms). But before we
turn to this modelling, the World Values Survey dataset provides an opportunity to examine
linkages between literacy and social benefits, such as social cohesion, which are difficult to
evaluate in monetary terms.
The World Values Survey last collected information from South Africa in 2005, when a
sample of around 3,000 adults aged 16 and above were interviewed. According to that dataset,
80% of respondents had completed primary schooling, and 49% had read a newspaper in the
last week – these criteria form the basis for defining literacy in Table 5 below.
People’s values are a function of many different variables. What is presented in Table 5 are
simple descriptive statistics, and not an attempt to disentangle the multivariate relationships
(the dataset does lend itself towards such analysis, however). Race, age and gender would
undoubtedly influence people’s values in the South African context, so it is important to read
the table in the light of this breakdown. We see, for instance, that Africans make up the great
majority of both illiterate and literate respondents (however one defines literacy). This group
would thus predominate in the statistics for all four columns in the table. The gender
breakdown is relatively even. The literate (especially if one uses the primary school criterion)
would tend to be younger than the non-literate.
The percentages in Table 5 from ‘Health’ to ‘Non-violent’ indicate the percentage of
respondents displaying the desirable characteristic. Thus, 85% of respondents are considered
to be non-violent as around 85% of them indicated that it was not acceptable for a man to beat
his wife. If we begin with the factors that are important for social cohesion, we see
considerably greater interest in politics amongst the literate (whichever way we define
literacy) and perhaps a greater interest in democracy, though for both groups more than 90%
of respondents support democracy. (Differences such as that between 93% and 94% are so
small that, given the size of the sample, it is possible that there is no difference. We need a
difference of around two percentage points before we can be about 95% certain there is
indeed a difference). Completing primary school seems to be associated with less sexism, but
regular reading of newspapers does not seem to have the same effect. Acceptance of gender-
based violence (almost 13% of respondents, and 15% of male respondents, believe it is
justifiable to beat one’s wife) does not seem to be lower amongst the more literate. Over half
of respondents trust three key institutions of the state, the government, the police and the
courts, but a substantial minority do not, and that minority is larger amongst the literate. This
is to be expected, and the pattern is similar in many other countries. Fewer than half of
respondents trusted political parties (in 2005), and the distrust was substantially larger
amongst the literate. This lack of trust can of course be desirable insofar as it translates into
political pressure for institutions to improve. On a personal level, people who are literate tend
to feel healthier, more satisfied with life, and less used by others. The association between
completing primary schooling and self-reported health is particularly strong.

27
Table 5: Literacy and values
Characteristic Question
Criterion: Completed primary school
Criterion: Reads newspapers
% for illiterate
% for literate
% for illiterate
% for literate
% of all respondents
20 80 51 49
Completed primary school
What is the highest educational level that you have attained?
0 100 67 93
Reads newspapers
Did you read a daily newspaper last week?
17 57 0 100
Age 50 34 38 36
Is female 48 51 56 44
Speaks Afrikaans 1 12 5 15
Speaks African language
95 74 88 69
Health How would you describe your health? 55 84 72 85
Not used Do you think people take advantage of you?
52 57 52 60
Satisfied How satisfied are you with your life? 66 77 70 80
Work ethic Is work a duty towards society? 73 75 72 77
Political Are you interested in politics? 38 46 41 48
Democratic Is it good to have a democratic system?
91 94 93 94
Experiences democracy
How democratic is your country? 85 82 84 81
Trusts police Do you have confidence in the police?
67 61 66 58
Trusts courts Do you have confidence in the courts?
75 64 71 62
Trusts government
Do you have confidence in the government?
80 68 75 66
Trusts parties Do you have confidence in the political parties?
50 42 47 41
Pays taxes Is it justifiable to cheat on taxes? 85 88 88 87
Social cohesion Do you trust people in your neighbourhood?
77 72 74 71
Non-sexism Do you believe that men make better political leaders?
41 51 49 50
Non-xenophobic Should employers give preference to South Africans?
26 21 21 23
Non-violent Is it justifiable for a man to beat his wife?
85 88 88 86
Source: World Values Survey Association, 2008. Note: In the rows referring to people’s values, the percentage shown is the percentage of respondents displaying the desirable characteristic, for instance responding that it is not justifiable for a man to beat his wife. In cases where in the data there was a scale for the response (for instance agreement on a scale of 1 to 10), the binary response needed for the above statistics was imputed based on what seemed reasonable (for instance 1 to 5 meaning disagreement and 6 to 10 meaning agreement).
Overall, the link between literacy and desirable values in society is perhaps not as strong as
one may have thought. In particular, it is telling, and probably counter-intuitive, that literacy
should not appear more strongly associated with less sexism, and a greater intolerance of
violence. The problem could lie in the simplicity of the analysis provided by the above table
(the aim here is merely to provide a glance at the World Values Survey, not an in-depth
analysis of the data). But the patterns we see could also serve as a useful reminder that
schooling and newspapers per se are not a guarantee of more desirable social values.
Schooling and newspapers can serve as vehicles for the dissemination of such values, if they
convey the necessary messages in an effective manner.

28
We now turn to the core concern of this section, determining the monetary cost of illiteracy.
Here we make use of cross-country growth models that include a human capital element.
These models have existed for several decades and have increasingly moved from more
tangible explainers of economic growth, such as fertility and investment in physical capital, to
more intangible explanatory variables, such as the level of human capital and the country’s
ability to harness recent technologies, or even create new technologies. GDP per capita, or
year-on-year growth in GDP per capita, in real inflation-adjusted terms, tends to be the
variable being explained in these models. The assumption, often not made explicit, is that
GDP per capita (or average income per capita) is important partly because it is a reliable
indicator of the overall-well being of the citizens of a country, and the country’s level of
development. This assumption is clearly debatable, and alternative indicators have been
devised, the best known probably being the Human Development Index of the UNDP. Here
we do not enter these debates, and limit our attention to economic growth, which, despite
certain limitations, is undoubtedly important for a country’s development (and has been a
cornerstone of both the RDP and ASGISA in South Africa).
The model we use is the ‘augmented Solow model’ of Mankiw, Romer and Weil (1992), who
take one of the earliest growth models, that of Solow (1956), and augment it with a human
capital element (something Solow had excluded from his model). In most economic growth
models that include a human capital element, this element appears in the form of just one
variable, for instance average years of education completed of adults, or the percentage of
adults who have completed primary school. Here we adopt the less common approach of
using two variables, one for a lower level of educational attainment (such as achieving basic
literacy), and one for a high level of educational attainment (such as excelling at the tertiary
level). There are good reasons for believing that one needs to focus separately on two
different educational factors, especially when, as in this study, our concern lies in isolating the
impact of being literate.
A key recent paper on the links between education and economic growth is that of Hanushek
and Woessman (2007). This excellent paper (and a few others like it) can be regarded as
seminal for education planners, as it explains rather convincingly how important improving
the quality of schooling is for the development of countries, and how earlier analytical and
policy emphases on years of schooling have to some degree been misplaced. Whilst
enrolment-focussed programmes (such as UNESCO’s Education for All at the global level)
are undoubtedly valuable, allowing the inter-related issues of enrolments, grade attainment
and dropping out to cloud the importance of reaching critical minimum levels of quality in
schooling, raises the risk of inefficient public spending, and below optimal economic and
social development. The need to re-focus on quality has been widely recognised. It receives
in-depth attention in the 2005 Global Monitoring Report of the Education for All programme.
In South Africa, improving educational quality in schools has assumed a new urgency in the
Minister of Education’s budget speeches, starting from around 2004.
Much of the analysis we perform here is similar to that of Hanushek and Woessman (2007).
We use data on educational quality in the model, taking advantage of recent datasets from
programmes applying standardised reading tests across several countries. Apart from TIMSS
and PISA (used by Hanushek and Woessman), we use PIRLS 2006 and SACMEQ 2000 data.
The latter dataset is of particular value not only because it includes South Africa and her
regional neighbours, but also because it assists in introducing a critical mass of developing
countries into the analysis. Here we elaborate on Hanushek and Woessman’s (2007) methods
of illustrating graphically how improving educational quality can impact on economic growth,
and pay special attention to the policy implications for South Africa26
.
26
Subsequent to their 2007 paper, Hanushek and Woessman published a paper in 2009 which
formalised their key 2007 arguments, and provided an analysis using both a low-level human capital

29
The variables used in the modelling are listed in Table 6. The first three (income per capita,
investment over GDP and the annual increase in the working age population) form the basis
for the original Solow model. When Mankiw, Romer and Weil (1992) augmented the Solow
model, what they did was introduce the secondary school enrolment level as a human capital
variable (this is our fourth variable). We included two tertiary enrolment variables in our
analysis to deal with high-level human capital: tertiary students per 1,000 inhabitants and
engineering students at the tertiary level per 1,000 inhabitants. These two variables were not
included in our final models as their performance as explanatory variables in the exploratory
analysis was inconsistent. They are not unimportant variables, clearly, and they deserve
serious attention in this kind of analysis. In particular, it was telling that the engineering
variable appeared more significant than the general tertiary enrolment variable in some of the
exploratory analysis (the details of which are not included in this report).
The two PIRLS variables listed in Table 6 were used as the most robust indicators of literacy
in our final models. Of the 84 countries for which we obtained values, only 38 had actual
PIRLS values (the PIRLS values we used were those for the 2006 run of the programme).
PIRLS, or the Progress in International Reading Literacy Study, tested Grade 4 learners in
reading and literacy, using standardised tests. South Africa, one of the few developing country
participants, tested Grade 5 learners, instead of Grade 4 learners, and tests were conducted in
the eleven official languages27
. In the case of 46 countries for which PIRLS 2006 data were
not available, PIRLS-like scores were assigned to students based on performance in four other
international testing programmes, namely PISA28
2000 (reading score of 15 year olds used),
PISA 2003 (reading score of 15 year olds used), SACMEQ29
2000 (Grade 6 reading score
used) and TIMSS30
2003 (Grade 8 mathematics score used). This was required largely to
generate enough data for developing countries. The data processing is explained in Appendix
A, and the values arrived at are given in Appendix B. The reason why TIMSS 2003
mathematics scores were used, despite the focus being on literacy, is partly that TIMSS
served as a necessary vehicle for linking SACMEQ 2000 to PIRLS 2006, and partly that this
allowed for the inclusion of even more developing countries, though wherever possible
literacy scores, and not TIMSS mathematics scores, were used. Mathematics and language
scores tend to correlate well with each other31
, which seems to justify the use of the TIMSS
score as a proxy for a literacy score.
variable, and a high-level one, using low and high thresholds within the learner performance data. This
is partly similar to what is done in this paper to cater for levels of human capital. 27
Mullis, Martin, Kennedy and Foy, 2007: 30, 133. 28
Programme for International Student Assessment, run by the OECD. 29
Southern and Eastern African Consortium for Measuring Educational Quality, run by the
International Institute for Education Planning (IIEP) of UNESCO. 30
Trends in International Mathematics and Science Study, run by the International Association for the
Evaluation of Educational Achievement (IEA). 31
The national averages for TIMSS 2003 mathematics and for PIRLS 2006 reading, for the 25
countries that participated in both, was 0.88.
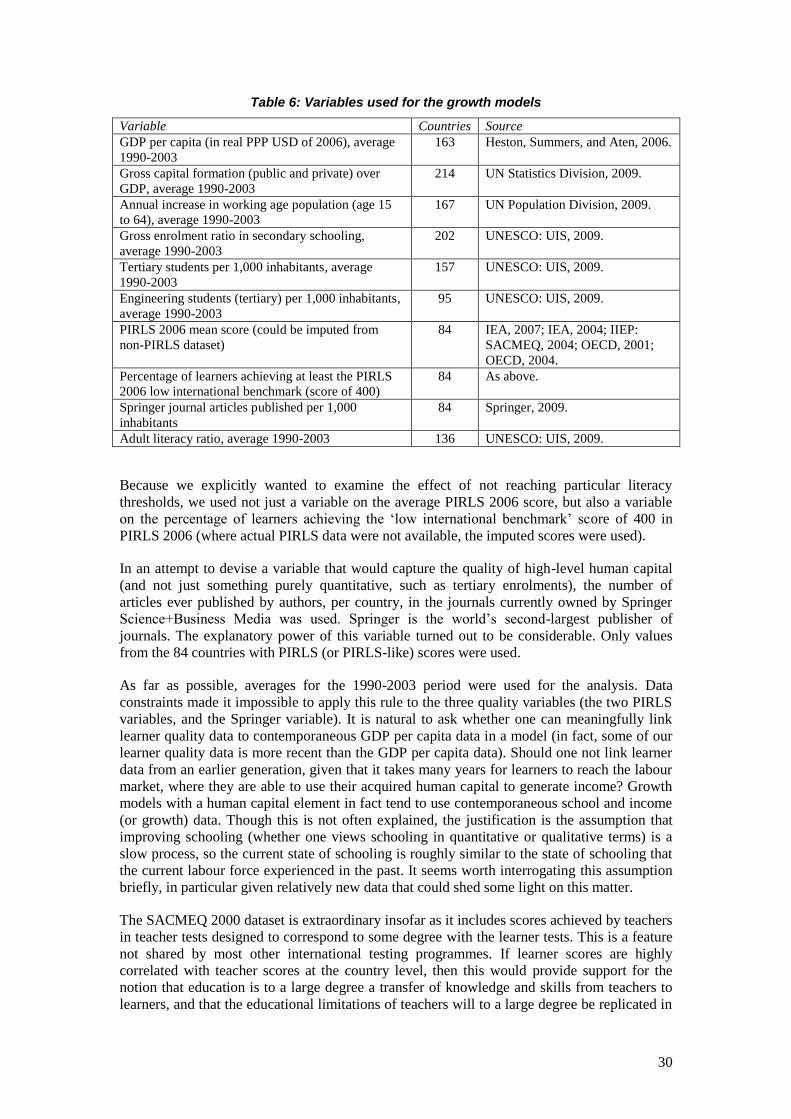
30
Table 6: Variables used for the growth models
Variable Countries Source
GDP per capita (in real PPP USD of 2006), average
1990-2003
163 Heston, Summers, and Aten, 2006.
Gross capital formation (public and private) over
GDP, average 1990-2003
214 UN Statistics Division, 2009.
Annual increase in working age population (age 15
to 64), average 1990-2003
167 UN Population Division, 2009.
Gross enrolment ratio in secondary schooling,
average 1990-2003
202 UNESCO: UIS, 2009.
Tertiary students per 1,000 inhabitants, average
1990-2003
157 UNESCO: UIS, 2009.
Engineering students (tertiary) per 1,000 inhabitants,
average 1990-2003
95 UNESCO: UIS, 2009.
PIRLS 2006 mean score (could be imputed from
non-PIRLS dataset)
84 IEA, 2007; IEA, 2004; IIEP:
SACMEQ, 2004; OECD, 2001;
OECD, 2004.
Percentage of learners achieving at least the PIRLS
2006 low international benchmark (score of 400)
84 As above.
Springer journal articles published per 1,000
inhabitants
84 Springer, 2009.
Adult literacy ratio, average 1990-2003 136 UNESCO: UIS, 2009.
Because we explicitly wanted to examine the effect of not reaching particular literacy
thresholds, we used not just a variable on the average PIRLS 2006 score, but also a variable
on the percentage of learners achieving the ‘low international benchmark’ score of 400 in
PIRLS 2006 (where actual PIRLS data were not available, the imputed scores were used).
In an attempt to devise a variable that would capture the quality of high-level human capital
(and not just something purely quantitative, such as tertiary enrolments), the number of
articles ever published by authors, per country, in the journals currently owned by Springer
Science+Business Media was used. Springer is the world’s second-largest publisher of
journals. The explanatory power of this variable turned out to be considerable. Only values
from the 84 countries with PIRLS (or PIRLS-like) scores were used.
As far as possible, averages for the 1990-2003 period were used for the analysis. Data
constraints made it impossible to apply this rule to the three quality variables (the two PIRLS
variables, and the Springer variable). It is natural to ask whether one can meaningfully link
learner quality data to contemporaneous GDP per capita data in a model (in fact, some of our
learner quality data is more recent than the GDP per capita data). Should one not link learner
data from an earlier generation, given that it takes many years for learners to reach the labour
market, where they are able to use their acquired human capital to generate income? Growth
models with a human capital element in fact tend to use contemporaneous school and income
(or growth) data. Though this is not often explained, the justification is the assumption that
improving schooling (whether one views schooling in quantitative or qualitative terms) is a
slow process, so the current state of schooling is roughly similar to the state of schooling that
the current labour force experienced in the past. It seems worth interrogating this assumption
briefly, in particular given relatively new data that could shed some light on this matter.
The SACMEQ 2000 dataset is extraordinary insofar as it includes scores achieved by teachers
in teacher tests designed to correspond to some degree with the learner tests. This is a feature
not shared by most other international testing programmes. If learner scores are highly
correlated with teacher scores at the country level, then this would provide support for the
notion that education is to a large degree a transfer of knowledge and skills from teachers to
learners, and that the educational limitations of teachers will to a large degree be replicated in

31
education limitations amongst learners. This dynamic would, in turn, suggest that improving
schooling is a very slow process involving a gradual growth in human capital over
generations. Figure 7 below indicates that there is indeed a pattern (indicated by the R2 value
of 0.35 based on an exponential trendline), but that deviation from the pattern is not that
difficult. To illustrate, Tanzania’s teachers are amongst the least knowledgeable in the region
(according to their scores), and yet their learners score amongst the highest in the region.
Figure 7: Learner and teacher performance
Source: IIEP: SACMEQ, 2004. Note: The two SACMEQ 2000 countries Mauritius and South Africa do not appear as in these countries teacher tests were not run, largely as a result of teacher union opposition (South Africa did, however, run the teacher tests in the 2007 run of SACMEQ).
If the relationship between teacher human capital and learner results is relatively weak, as is
indicated by the graph, then it becomes less justifiable to use contemporaneous school and
income data. If more dynamic factors, such as the length of the school day, or the availability
of textbooks, are able to make a difference to learner performance, separately from the skills
and knowledge of teachers, then there is a greater likelihood of rapid changes in the levels of
learner performance, and using learner results from a later period as a proxy from an earlier
period becomes less plausible. Unfortunately, there is no easy way out of this quandary as the
required data on learner performance from an earlier period is not available. The best we can
do is let these observations bring extra caution to our interpretation of the growth model.
The next table presents the bivariate correlations between our variables. The bivariate
correlations between GDP per capita and the other variables are of particular interest. Here the
exceptionally low coefficient for investment over GDP of just .04 is noteworthy, despite the
fact that in the multivariate model investment will be seen to be a significant explanatory
variable. This contrast is not a key concern for this paper, however. The human capital
variables, except for engineering enrolment and adult literacy, all display a correlation in the
range of .46 to .68. One would not expect a very high correlation for the adult literacy
R² = 0.35
400
420
440
460
480
500
520
540
560
580
600
700 720 740 760 780 800 820
Me
dia
n le
arn
er
sco
re
Median teacher score
SWZ
NAM
LSO
MWI ZMB
UGA
KEN
BWA
TZA
SYC
MOZ

32
variable, given how it is derived. The very high correlation of .98 between the two PIRLS
variables is to be expected32
.
Table 7: Correlations of country-level variables
GD
P p
er c
apita
Investm
en
t ove
r GD
P
Incre
ase
in w
.a.p
.
Se
co
nd
ary
GE
R
Te
rtiary
en
rolm
en
t ratio
En
gin
ee
ring
en
rolm
en
t ratio
PIR
LS
20
06
PIR
LS
20
06
% p
assin
g
Artic
les p
er 1
,00
0 p
op.
Lite
racy ra
tio
GDP per capita 100 Investment over GDP 4 100
Increase in w.a.p. -33 -11 100 Secondary GER 68 19 -65 100
Tertiary enrolment ratio 55 3 -49 77 100 Engineering enrolment ratio 32 21 -39 54 81 100
PIRLS 2006 60 -3 -71 74 73 55 100 PIRLS 2006 % passing 57 -3 -73 75 73 53 98 100
Articles per 1,000 pop. 64 -10 -44 63 44 22 59 57 100 Literacy ratio 46 29 -54 79 63 59 68 68 49 100
Note: Each statistic is based on a pairwise comparison. Coefficients have been multiplied by 100.
Table 8 provides the results of the multivariate regression models. Models A and B replicate
the Mankiw, Romer and Weil (1992) augmented Solow model with more recent data. The
difference between models A and B is that B includes only those countries for which the
PIRLS learner performance data were available – the results suggest that this substantial
reduction in the number of countries, from 108 to 55, makes little difference to the model
estimates. Both models exclude those countries Mankiw, Romer and Weil (1992) filtered out
as they were assumed to display unusual growth trajectories: oil producers, ex-communist
countries and countries with a population of less than one million. It should be noted that for
the human capital variable, secondary school enrolments over the entire population aged 15 to
64 (as opposed to the secondary level GER) is used, in line with Mankiw, Romer and Weil
(1992). Model B can be expressed as follows:
The fact that the results are fairly similar to the original results confirms the robustness of that
model and justifies its use as a basis for exploring the performance of our additional human
capital variables. Model C is the original model with the PIRLS ‘literacy rate’ and the natural
logarithm of the article publication variable added. All the explanatory variables display a
statistically significant association with GDP per capita (at the 95% confidence level). This is
the model that is used further down to gauge the cost of illiteracy. It can be expressed as
follows:
If the secondary school enrolment variable s is removed, the slope coefficient of the PIRLS
variable increases, but perhaps not by as much as one might anticipate – the increase is from
32
Hanushek and Woessman (2007: 39) note this same pattern between the mean and the percentage
achieving a low threshold score.

33
.0070 to .0086. In model D, the PIRLS country mean instead of the PIRLS ‘literacy rate’ is
used. As one might expect, model D is similar to model C, though the PIRLS variable is now
only significant at a 90% confidence level. Models E and F repeat model C, but with more
variables as the country filters are relaxed. In model E only the population filter is applied,
and in model F only the oil producer filter is applied. Whilst the relaxation of these filters has
little effect on the significance and slope coefficients of the human capital variables, they
render the investment and demographic variables insignificant. For this reason, it was decided
to retain all the original Mankiw, Romer and Weil (1992) country filters in the model (model
C) used to determine the cost of illiteracy. Model G tests the use of the UNESCO adult
literacy variable r as the only human capital variable (it is entered in the quadratic form, and a
joint significance reveals that despite the low t values, jointly r and r2 are significant
predictors at the 1% level). Given the way this variable is derived, it should not surprise us
that the overall fit of the model, as indicated by R2, is the lowest of all the models. Yet the fact
that the literacy variable is highly significant, despite the measurement problems, suggests
that standardised and more objective measures of adult literacy are likely to be extremely
strong predictors of GDP per capita.
Table 8: Cross-country regression results
Dependent variable: ln(Y), Y is
GDP over working age population A B C D E F G
ln(i), i is investment over GDP 1.04 (4.47)
1.19 (3.11)
.70 (2.29)
.73 (2.39)
.22 (0.84)
.37 (1.23)
1.02 (4.28)
ln(n + g + δ), n is increase in working age population
33
-.79 (-9.40)
-.70 (-8.25)
-.21 (-2.19)
-.22 (-2.36)
.00 (-0.01)
-.03 (-0.41)
-.44 (-3.22)
ln(s), s is secondary enrolment over
working age population .78
(6.85) .91
(6.00) .49
(3.91) .52
(4.15) .42
(3.08) .46
(3.53)
pirls% is PIRLS 2006 % passing
.0070 (2.23)
.0072 (2.27)
.0090 (2.78)
PIRLS 2006
.0023 (1.90)
literacy ratio
-.01 (-0.67)
r2, r is literacy ratio
.00024 (1.95)
ln(A), A is articles per 1,000 pop.
.20 (3.66)
.21 (3.59)
.26 (4.44)
.22 (3.72)
Constant 4.78 (7.58)
4.15 (3.52)
6.21 (6.89)
5.44 (5.90)
7.77 (9.67)
7.04 (7.77)
5.36 (6.96)
N 108 55 55 55 63 60 84
R2 0.74 0.73 0.87 0.86 0.81 0.84 0.68
Note: t-statistics are in brackets.
Whilst in model C both the quantitative (enrolment) and qualitative (PIRLS) variables are
simultaneously significant, Hanushek and Woessman (2007: 33) find that their qualitative
variable renders their quantitative enrolment variable insignificant, suggesting that it is far
more important to concentrate on educational quality than on enrolments in education
policies. Why would the quantitative variable still appear significant in our model, beside the
educational quality variable? There are a couple of possible explanations. It could be because
our model includes more developing countries (in particular African ones). It could also be
because the dependent variable is different – log of GDP per capita in our model whilst
average annual growth rate in GDP per capita in that of Hanushek and Woessman (2007).
To facilitate the interpretation of model C for South African policymaking, the model is
reproduced graphically below. The positions of the curve labels indicate against which
33
g, or growth in the level of technology, and δ, or the rate of depreciation of capital goods, are
retained in the model, and are assumed to add up to 0.05 for all countries, following Mankiw, Romer
and Weil (1992: 414).

34
vertical axis to read the values. Labels on the left side of the graph indicate that the curve
should be read against the left-hand vertical axis, whilst labels on the right indicate that the
right-hand vertical axis should be used.
Figure 8: Graphical representation of the growth model
Note: The positions of curve labels indicate whether the left-hand or the right-hand axis applies. The actual GDP per capita curve (thick dotted line) is indexed to equal 100 at the lowest point. The solid thick line refers to GDP per capita estimated by the model. All GDP per capita values are expressed as natural logarithms. The cut-offs for lower income countries, lower middle income countries, upper middle income countries and high income countries are calibrated so that countries become classified as they would in the World Bank’s classification (the dollar values are those of Heston, Summers and Aten, 2006). Curves are smoothed using lowess values. Triangles refer to South Africa’s position. South Africa’s I/GDP value, of 16, was in fact below the lowest point of the I/GDP curve, but the marker was placed at the lowest curve point of 19 to facilitate the presentation.
The implied trends over time in the country development trajectory are indicated by the
curves in Figure 8, and South Africa’s position on these curves is indicated using red
triangles. South Africa’s GDP per capita is that of an upper middle income country (UMC).
Investment over GDP in the period 1990 to 2003 (the period for which the data apply) was
extremely low in South Africa, at the level of a low income country (LIC). This variable has
since changed. In 2007, investment over GDP was 22%, or at a level befitting an upper
middle income country (investment over GDP should be read against the right-hand vertical
axis of the graph)34
. The annual increase in the working age population in the 1990 to 2003
period, at 2.9%, was higher than what was typical for a UMC. It should have been lower
given that this value is expected to fall as a country develops. Again, however, Statistics
South Africa data indicate that in 2008 the value was more or less where it should be (for a
UMC), at around 2.1% (more or less the level for Argentina)35
. The secondary level gross
34
Throughout our analysis, investment over GDP is gross capital formation (which includes
government and private investment) over GDP. 35
Mid-year population estimates for 2007 and 2008 used.
0
5
10
15
20
25
0
20
40
60
80
100
120
140
160
180
$5,990 $12,601LIC LMC UMC HIC
$1,970

35
enrolment ratio in South Africa for 1990 to 2003, at 86%, was higher than one would expect
of a typical upper middle income country. In fact, it was almost that of a high income country
(HIC) such as the Czech Republic (92%). By 2007, after years of strong growth, the South
African ratio had reached 103%, according to the 2007 Community Survey36
. The number of
published Springer articles for South Africa (a total of 8,749, or 0.21 per 1,000 inhabitants) is
somewhat low, at a lower middle income level, when it should be at around the level enjoyed
by Turkey (0.32) or Chile (0.38). Finally, the PIRLS ‘literacy rate’ for South Africa, at 21%,
is considerably below what it should be. It is above the expected low income country level
(1% for Zambia or Mozambique, or 8% for Tanzania), but well below the actual levels for the
three lower middle income countries that participated in PIRLS 2006: Morocco (24%),
Indonesia (53%) and Iran (60%). According to the model reflected in Figure 8, but even
according to a more casual comparison against other countries, South Africa’s PIRLS pass
rate ought to be around 50%, given the country’s level of development as reflected by GDP
per capita.
Figure 8, and the above discussion, imply that low educational quality stands out the critical
brake on economic growth in South Africa. Enrolment in schools is clearly not a problem. But
if the quality of education is an important factor behind growth, as our model suggests, and as
work by analysts such as Hanushek and Woessman suggest even more strongly than we do,
then investing in the improvement of educational quality should lie at the heart of South
Africa’s growth strategy.
These conclusions would remain essentially the same if we had used average learner
performance, as opposed to percentage of learners passing some international threshold.
The model we have used allows us to calculate, very roughly, the cost of not being a more
literate society. If we assume that the country’s PIRLS ‘literacy rate’ should be 50%, and that
the model C slope coefficient for this variable, of .0070 (see Table 8), describes the impact of
moving from the current 21% to the desired 50% ‘literacy rate’, then GDP per capita would
be around 23% higher if we were as literate as we ought to be. If we put Rand values to this,
GDP per capita in 2009 would be around R12,000 higher, and total GDP would be around
R550 billion higher. This suggests one could argue that illiteracy is costing the country a large
amount of income in the vicinity of R550 billion a year.
In addition to the modelling discussed here, we tried a different approach, using a
microeconomic model, in order to quantify the relationship between educational quality and
income. We did this partly to demonstrate how sensitive any income estimates are to one’s
model and one’s assumption, but also to verify whether a different approach would also reveal
very large benefits for improvements in educational quality. Our alternative model involved
using a grade- and race-specific educational quality measure developed by Burger (2009). If
we use this measure in a Mincerian earnings function, we find that an improvement of 1.07
standard deviations in the measure for adults aged 20 to 29 results in an income improvement
of 30%, which we can compare to the 23% GDP improvement referred to above. (The
improvement in the PIRLS ‘literacy rate’ from 21% to 50% translates into an improvement in
the mean from 302 to 429, which represents an improvement of 1.07 standard deviations in
the South African data.) The 30% level we obtain using the alternative model would translate
into an annual cost of around R750 billion a year. The result confirms that that income returns
to educational quality improvements are substantial enough to warrant very serious attention
to the matter of quality in the country’s education policies.
36
The 2007 Community Survey (Stats SA, 2008) indicates that 5,299,578 youths aged 14 to 25
attended secondary school, and that the population aged 14 to 18 (five cohorts to correspond to five
years of secondary schooling) was 5,130,146.
36
Does a country necessarily have to concentrate on its weak points (educational quality in
South Africa) in promoting growth, as opposed to its strong points (enrolments in South
Africa)? If various factors contribute towards economic growth, does it really matter which
one the country focuses on? The answer is yes. The various factors (such as enrolment and
educational quality) reinforce each other. Moreover, the law of diminishing returns in
economics must inform policy choices. Beyond certain threshold levels, inputs in the growth
process (just like inputs in the production process in the firm) tend to diminish in potency. For
instance, beyond a certain threshold, the growth impact of investments in physical capital
diminish, partly because they divert resources away from other important activities, such as
education. Similarly, making increased enrolments a top priority in a country such as South
Africa, which already has a favourable level of school enrolments37
, could divert resources
and policy attention from quality improvement strategies. In the absence of some abnormal
phenomenon, such as the discovery of large oil reserves in South Africa, the typical growth
dynamics will apply to the country, and this means paying special attention to the growth
factors that lag behind. The foregoing discussion is thus not just about what to focus on in
promoting growth, but also what should probably not be a top policy priority.
Though it is not a central concern in this paper, the question of how to improve the quality of
school education deserves at least a cursory discussion. It is useful to distinguish between top-
down approaches and bottom-up approaches, and to emphasise that a mix of both approaches
is needed. The tendency is arguably for governments and societies to pay too much attention
to top-down policies, and too little attention to policies that facilitate a bottom-up approach38
.
What we refer to as the top-down approach can be summed up as follows. The government
and education researchers (the top) find out what interventions are most cost-effective for
bringing about quality improvements, and policies (teacher incentives, textbook funding,
infrastructure planning, and so on) are designed to emphasise these interventions. Much of the
so-called production function literature, and the effective schools literature, are aimed at
clarifying what interventions work39
. In South Africa, policies such as the school funding
norms40
and the recently restructured teacher pay system41
are explicitly constructed to
improve educational quality (this is clearly the aim, though whether the construction is the
right one is and ought to be the subject of ongoing debate). In order to monitor whether the
top-down interventions are having the desired effect, performance statistics, such as those
emerging from the Grade 12 examinations or from the Systemic Evaluation programme42
(which applies standardised tests at the primary level on a sample basis), are analysed. Top-
down interventions have an important role to play, for instance where they involve the spread
of new teaching methodologies that have been proven to raise learner performance within
pilot projects that include control groups of schools. Such methodologies seem to have been
identified in a few projects in South Africa, such as Learning for Living at the primary level
and Quality Learning Project at the secondary level43
.
37
The South African level of enrolments at the tertiary level, on the other hand, comes out low in an
international comparison, and could be linked to the relatively low performance of South Africa with
respect to our journal article publications variable. This is a vital matter for growth, but does not
receive detailed attention here as our focus is on illiteracy, or problems at the lower end of the
educational range. 38
Hoenack (1996: 332) makes this argument, but using different terminology. 39
Christie, Butler and Potterton (2007) provide an example of a South African effective schools
analysis. Gustafsson (2007) provides a brief account of recent education production function studies for
South Africa. 40
Government Notice 869 of 2006 (see http://www.gov.za/). 41
Resolution 1 of 2008 of the Education Labour Relations Coucil (see http://www.elrc.org.za). 42
See for instance Department of Education (2005). 43
See Schollar (2005) and Kanjee and Prinsloo (2005).

37
The bottom-up approach aims to harness parent demands for quality education, and the
innovation of teachers to bring about quality improvements. To some extent, this approach
involves leaving it up to the teachers themselves to work out what improves educational
quality. But it by no means condemns government and researchers to inaction. Rather, it shifts
the emphasis of national efforts to two key things. Firstly, having national quality standards,
tools for teachers themselves to test attainment of those standards and regular and sufficiently
widespread standardised assessments organised by the authorities become important.
Secondly, parents need to be targeted with very clear information on what constitutes quality
education, on how well their children are faring, and on the mechanisms for complaining
about the quality of their children’s education. In South Africa, the Grade 12 examinations
provide a powerful accountability tool at the end of the secondary level, but as has often been
argued, the country lacks such tools at lower levels of the system. The Systemic Evaluation,
whilst it is an essential programme for monitoring the system as a whole and follows best
practice in other developing countries, is not able to provide individual schools and teachers
with feedback on their performance, because it is based on a sample. A programme such as
the Systemic Evaluation is almost certainly too costly to replicate across all schools without
compromising on the rigour of the data collection (it is essentially a programme designed to
support the top-down approach). The challenge facing developing countries is thus to design
cheaper programmes that can assess learners, perhaps with less (but sufficient) rigour, and on
a massive scale. South Africa’s national Foundations of Learning programme44
, which
involves the distribution of testing packs to schools, has the potential to fill this gap and to
provide parents with an easily intelligible method of following their children’s performance
and exerting the right kind of pressure when schools under-perform. It is worth underlining
that without assessments that are standardised across schools (this has been the norm in
primary schools in South Africa up till now) and without good feedback mechanisms to
parents, it is virtually impossible for parents to know how much improvement they can
legitimately and reasonably demand of their schools. The success of government programmes
such as Foundations of Learning (and similar assessment programmes implemented by
NGOs) is a vital factor impacting on future income and welfare in South Africa.
To end this section, a look at the distribution of the PIRLS 2006 scores of a few countries
(just actual PIRLS scores, not the imputed ones used in the earlier analysis) throws some light
on key specifics of the quality challenge facing South Africa. The countries included in the
following graph are the only four large developing countries that participated in PIRLS 2006,
namely Indonesia, Iran, Morocco and South Africa, plus one developed country that
participated, namely New Zealand.
44
Government Notice 306 of 2008 (see http://www.gov.za/).

38
Figure 9: PIRLS 2006 score distributions for a few countries
Source: IEA, 2007.
The need to improve the quality of education for the worst performers, largely the poor, is
confirmed by the low position of South Africa’s curve in the left-hand two-thirds (at least) of
the above graph. But the extent of the problem (79% of learners do not attain the 400 low
international benchmark) suggests strongly that policy focus needs to be largely on systemic
solutions, as opposed to the targeting of poorly performing pockets of the system (an
approach that would be more appropriate for a country like New Zealand, where only 7% of
learners do not reach the benchmark). At the very top end of the performance range in South
Africa, scores are relatively good compared to those of the other developing countries in the
graph. This means that pockets of rather good practice can be found within the country, which
can serve to inform improvements in the rest of the system. However, it is also important to
stress that the best practice pocket is dangerously small in South Africa, and needs to be
expanded. Only 5% of learners at the top end perform slightly better than those of Iran. To the
left of the 95th percentile, the South African curve drops steeply. It is probably true to say that
the popular perception in South Africa is that the country’s best schools (whether public or
independent45
) are on a par with the best schools in developed countries. A comparison
between the curves of South Africa and New Zealand, however, would suggest that this is not
the case, and that improvement strategies should focus even at the top end46
. This should
strengthen the argument for system-wide solutions that include a focus on factors common to
the whole system, such as textbooks.
45
The PIRLS sample includes independent schools. 46
A similar picture of relatively poor performance at the top end emerges if one compares the scores of
the learners whose parents are university graduates across countries, as is done by Reddy (2006: 88) in
analysing the 2003 TIMSS dataset.
0
100
200
300
400
500
600
700
800
0 20 40 60 80 100
PIR
LS 2
00
6 r
ead
ing
sco
re
Percentiles of learners
NZL
IDN
IRN
MAR
ZAF

39
7 Conclusion
The executive summary provides a section by section summary of the paper. Here the focus is
on identifying what may be the principal findings of the paper, and what the key pointers are
for policymaking and future data collection and analysis.
The paper throws some new light on the unreliability of self-reported measures of adult
literacy, and suggests that instead of the 90% adult literacy rate obtained from these measures,
a figure closer to 75%, more or less the percentage of adults who spend at least an hour a
week reading, should be used as an adult literacy rate for the country. Literacy rates based on
highest grade passed in the schooling system, whilst in certain contexts somewhat useful as
proxies for the true literacy rate, need to be calculated and interpreted with caution given that
different grade attainment levels bring about literacy for different people (one person may
require a Grade 4 to be literate, whilst another may require a Grade 7). But it is important to
stress that given the lack of test-based data on adult literacy in South Africa, the best we can
do currently is arrive at tentative estimates of the adult literacy rate. Even so, it seems that we
can conclude that officially published adult literacy rates (in particular UNESCO’s 88%) are
over-estimates. Going forward, policymakers and researchers should pay attention to how
South Africa can obtain nationally representative objective measures of adult literacy. There
are a number of options available, and these need to be assessed carefully. Slotting into an
existing international adult literacy monitoring programme, in particular ALL or LAMP, is an
option (though ALL appears to have no other developing country participants). Designing a
national programme, informed by experiences in the international programmes, and on
national experiences such as those in Kenya, is another option. The cost of the data collection
would be small, especially in comparison to current budgets for adult illiteracy programmes,
yet probably large enough to make central government funding necessary.
But within a long-range perspective, what is perhaps even more important than research into
adult literacy, is research into optimal methods for using data on learner performance below
the Grade 12 level to drive quality improvement in schools (and hence reduce adult illiteracy
in the future). Major strides on the data collection front have been made in the last ten years,
through participation in international programmes, and through the country’s own Systemic
Evaluation programme. We have a much better picture of where South Africa’s school quality
is pegged internationally, and what the distribution of learner performance is within the
country. Currently, our knowledge of average learner performance down to the province level
is good. However, below this level, at the level of districts and schools, our understanding is
poor. Yet it is local level performance data that is likely to be most useful for schools and
district offices, where much of the improvement effort must be concentrated. As has been
argued in section 6, effective performance measurement at the local level probably requires
different instruments to what one has at a national or international level, given the cost
factors. Of course arriving at optimal data collection strategies is only one part of the problem.
The other is arriving at optimal strategies for using the data to stimulate a local commitment
towards improving educational quality.
The paper found literacy effects at the individual level. For instance, the literacy of parents
(and their behaviour, such as their reading behaviour) displays a large association with learner
literacy (the magnitude of parent factors, relative to that of other factors, is arguably larger
than is commonly believed). Literacy is associated with self-reported satisfaction, and health,
and with a healthy questioning of those in political power, and political parties generally. A
better understanding of why literacy is important depends to a large degree on obtaining better
measures of adult literacy. For this area of research data collections limited to localised
samples are often good enough, and are less costly and less complicated to realise than
nationally representative collections.

40
The finding that illiteracy costs the country R550 billion per year in income (and GDP),
whilst perhaps not a finding of a directly practical nature, is nonetheless useful as an indicator
of the magnitude of the literacy challenge in the larger development debate. What should be
emphasised in this regard is the finding that within the overall economic growth picture
(obtained using standard cross-country modelling), education is clearly a laggard factor. In
respect of other typically analysed growth factors, South Africa does fairly well, but in respect
of education it does not. There is room for much more research and public debate on the
linkages between education policies and the growth and development policies. In particular,
the right balance between general education and specialised vocational education needs more
attention, as does the right balance between uplifting the educational quality of the worst
performers in the schooling system and uplifting the educational quality of everyone. It goes
without saying that part of the debate should be about the right balance between economic
growth, in the traditional sense, and broader development indicators such as the UNDP’s
Human Development Index (HDI) and even life satisfaction indicators such as those found in
the World Values Survey.

41
References
Aitchison, J. & Harley, A. (2004). South African illiteracy statistics and the case of the
magically growing number of literacy and ABET learners. Durban: University of
KwaZulu-Natal. Available from: <http://www.ukzn.ac.za/cae/caepubs/JJWAAH04.pdf>
[Accessed June 2009].
Barro, R.J. & Lee, J.-W. (2001). International data on educational attainment (dataset).
Cambridge: Harvard University.
Benhabib, J. & Spiegel, M.M. (1994). The role of human capital in economic development:
Evidence from aggregate cross-country data. Journal of Monetary Economics, 34: 143-
173.
Bils, M. & Klenow, P.J. (2000). Does schooling cause growth? Journal of Economic Growth,
90(5): 1160-1183.
Boissiere, M., Knight, J.B. & Sabot, R.H. (1985). Earnings, schooling, ability and cognitive
skills. The American Economic Review, 75(5): 1016-1030.
Burger, C. (2009). Role of school quality in labour market discrimination in South Africa.
Oxford: Centre for the Study of African Economies. Available from:
<http://www.csae.ox.ac.uk/conferences/2009-EDiA/papers/435-Burger.pdf> [Accessed
May 2009].
Christie, P., Butler, D. & Potterton, M. (2007). Schools that work. Pretoria: Independent
Schools Association of South Africa. Available from:
<http://www.isasa.org/component/option,com_docman/task,doc_view/gid,531/Itemid,27/
> [Accessed January 2008].
Department of Education (1999). Call to action: Mobilising citizens to build a South African
education and training system for the 21st century. Pretoria. Available from:
<http://www.capegateway.gov.za/Text/2004/5/tirisanocalltoaction.pdf> [Accessed March
2009].
Department of Education (2005). Grade 6 Systemic Evaluation: National. Pretoria. Available
from:
<http://www.hsrc.ac.za/research/output/outputDocuments/3580_Grade6National.pdf>
[Accessed February 2006].
Department of Education (2006). PFMA planning and reporting requirements for Provincial
Education Departments. Pretoria. Available from:
<http://www.education.gov.za/dynamic/dynamic.aspx?pageid=326&dirid=20> [Accessed
April 2008].
Department of Education (2007). Plan for a mass literacy campaign for South Africa.
Pretoria.
Department of Education (2008). Ministerial Committee on learner retention in the South
African schooling system. Pretoria. Available from: <http://www.education.gov.za>
[Accessed April 2008].
Gustafsson, M. (2007). Using the hierarchical linear model to understand school production
in South Africa. Stellenbosch: University of Stellenbosch. Available from:
<http://ideas.repec.org/p/sza/wpaper/wpapers32.html> [Accessed February 2007].
Gustafsson, M. & Patel, F. (2006). Undoing the apartheid legacy: Pro-poor spending shifts in
the South African public school system. Perspectives in Education, 24(2): 65-77.
Gustafsson, M. & Patel, F. (2008). Managing the teacher pay system: What the local and
international data are telling us. Cape Town: DPRU. Available from:
<http://www.commerce.uct.ac.za/Research_Units/DPRU/Conference2008/Conference200
8_Papers/Gustafsson%20-Teacher%20pay%20system%202008%2010%2005.pdf>
[Accessed March 2009].
Hanushek, E.A. & Kimko, D.D. (2000). Schooling, labor-force quality and the growth of
nations. The American Economic Review, 90(5): 1184-1208.
Hanushek, E.A. & Luque, J.A. (2003). Efficiency and equity in schools around the world.
Economics of Education Review, 22: 481-502.

42
Hanushek, E.A. & Woessman, L. (2007). The role of school improvement in economic
development. Washington: National Bureau of Economic Research. Available from:
<http://papers.nber.org/papers/w12832.pdf?new_window=1> [Accessed June 2007].
Hanushek, E.A. & Woessman, L. (2009). Do better schools lead to more growth? Cognitive
skills, economic outcomes, and causation. Washington: National Bureau of Economic
Research. Available from: <http://www.nber.org/papers/w14633.pdf?new_window=1>
[Accessed March 2009].
Heston, A., Summers, R. & Aten, B. (2006). Penn World Table version 6.2. Philadelphia:
Center for International Comparisons of Production, Income and Prices at the University
of Pennsylvania. Available from: <http://pwt.econ.upenn.edu/php_site/pwt_index.php>
[Accessed June 2007].
Hoenack, S.A. (1996). The economics of education in developing countries: An assessment of
the state of the art. Economics of Education Review, 15(4): 327-338.
IEA (2004). TIMSS 2003 (dataset). Chestnut Hill: Boston College. Available from:
<http://timss.bc.edu/timss2003.html> [Accessed July 2007].
IEA (2007). PIRLS 2006 (dataset). Chestnut Hill: Boston College. Available from:
<http://timss.bc.edu/pirls2006/index.html> [Accessed June 2008].
IIEP: SACMEQ (2004). SACMEQ II (2000 dataset). Harare.
Kanjee, A. & Prinsloo, K. (2005). Improving learning in South African schools: The Quality
Learning Project (QLP). Pretoria: HSRC. Available from: <http://www.hsrcpress.ac.za>
[Accessed May 2009].
Keswell, M. & Poswell, L. (2004). Returns to education in South Africa: A retrospective
sensitivity analysis of the available evidence. South African Journal of Economics, 72(4):
834-860.
Lauglo, J. (2001). Engaging with adults: The case for increased support to adult basic
education in Sub-Saharan Africa. Washington: World Bank. Available from:
<http://www.eric.ed.gov/ERICDocs/data/ericdocs2sql/content_storage_01/0000019b/80/1
a/8b/4f.pdf> [Accessed March 2009].
Malhotra, A., Pande, R. & Grown, C. (2003). Impact of investments in female education on
gender equality. Washington: World Bank. Available from:
<http://siteresources.worldbank.org/INTGENDER/Resources/ImpactInvestmentsFemaleE
du.pdf> [Accessed June 2008].
Mankiw, N.G., Romer, D. & Weil, D.N. (1992). A contribution to the empirics of economic
growth. Quarterly Journal of Economics, 107(2): 407-443.
Mullis, I.V.S., Martin, M.O., Kennedy, A.M. & Foy, P. (2007). PIRLS 2006 international
report. Chestnut Hill: Boston College. Available from: <http://timss.bc.edu> [Accessed
April 2007].
National Treasury (2009). 2009 Estimates of National Expenditure. Pretoria. Available from:
<http://www.treasury.gov.za> [Accessed June 2005].
Naudé, W.A. (2004). The effect of policy, institutions and geography on economic growth in
Africa: An econometric study based on cross-section and panel data. Journal of
International Development, 16: 821-849.
OECD (2001). PISA 2000 database (dataset). Paris. Available from:
<http://www.oecd.org/document/48/0,3343,en_32252351_32236159_33668528_1_1_1_1,
00.html> [Accessed July 2007].
OECD (2004). PISA 2003 database (dataset). Paris. Available from:
<http://www.oecd.org/document/0/0,3343,en_32252351_32236173_33694144_1_1_1_1,0
0.html> [Accessed July 2007].
Oxenham, J. (2004). Adult education and training (ABET) vs. poverty: What have we
learned? Benoni: Kitso Training and Development. Available from:
<http://www.kitsotraining.co.za/abet%20vs%20poverty.pdf> [Accessed January 2009].
Psacharapoulos, G. & Patrinos, H.A. (2002). Returns to investment in education: A further
update. Washington: World Bank. Available from: <http://www.worldbank.org>
[Accessed November 2006].

43
Pritchett, L. (1996). Where has all the education gone? Washington: World Bank. Available
from: <http://www.worldbank.org> [Accessed January 2009].
Reddy, V. (2006). Mathematics and science achievement at South African schools in TIMSS
2003. Pretoria: HSRC. Available from: <http://www.hsrcpublishers.ac.za> [Accessed
July 2006].
Romer, P.M. (1989). Human capital and growth: Theory and evidence. Washington: National
Bureau of Economic Research. Available from: <http://www.nber.org/papers/w3173>
[Accessed April 2007].
Sachs, J.D. & Warner, A.M. (1997). Sources of slow growth in African economies. Journal of
African Economies, 6(3): 335-376.
Schollar, E. (2005). The evaluation of the Learning for Living Project. Johannesburg:
Business Trust. Available from:
<http://www.jet.org.za/documents/Schollar.pdf#search=%22%22learning%20for%20livin
g%22%20%22south%20africa%22%22> [Accessed September 2006].
Sen, A. (1999). Development as freedom. New York: Alfred A. Knopf.
Solow, R.M. (1956). A contribution to the theory of economic growth. Quarterly Journal of
Economics, 70(1): 65-94.
Springer (2009). AuthorMapper (dataset). Berlin. Available from: <http://authormapper.com>
[Accessed March 2009].
Statistics South Africa (2007). Labour Force Survey 2007b (dataset). Pretoria. [Earlier
datasets in this series also used.]
Statistics South Africa (2008). Community Survey 2007 unit records (dataset). Pretoria.
UN Population Division (2009). World population prospects: The 2006 revision (dataset).
New York. Available from: <http://esa.un.org/unpp/index.asp>
UN Statistics Division (2009). National accounts estimates of main aggregates (dataset). New
York. Available from: <http://data.un.org>
UNDP (2007). Human Development Report 2007/2008: Fighting climate change: Human
solidarity in a divided world. New York Available from: <http://www.undp.org>
[Accessed March 2008].
UNESCO (1990). World Declaration on Education for All. Jomtien Available from:
<http://www.unesco.org/education/efa/ed_for_all/background/jomtien_declaration.shtml>
[Accessed March 2009].
UNESCO (2000). The Dakar Framework for Action. Dakar Available from:
<http://unesdoc.unesco.org/images/0012/001211/121147E.pdf> [Accessed March 2009].
UNESCO (2005a). Education for All global monitoring report 2005: The quality imperative.
Paris Available from: <http://www.unesco.org/education/gmr_download/chapter2.pdf>
[Accessed May 2008].
UNESCO (2005b). Education for All global monitoring report 2006: Literacy for life. Paris
Available from: <http://www.unesco.org> [Accessed November 2006].
UNESCO (2005c). Standards and guidelines for the design and implementation of the
Literacy Assessment and Monitoring Programme (LAMP). Montreal: UIS. Available
from: <http://www.unesco.org> [Accessed November 2006].
UNESCO (2006). Education for All global monitoring report 2007: Solid foundations. Paris
Available from: <http://www.unesco.org> [Accessed March 2007].
UNESCO (2007). Education for All global monitoring report 2008: Will we make it? Paris
Available from: <http://www.unesco.org> [Accessed February 2008].
UNESCO (2009). Education for All global monitoring report 2009: Overcoming inequality:
Why governance matters. Paris Available from: <http://www.unesco.org> [Accessed
March 2009].
UNESCO: UIS (2009). Education statistics (dataset). Montreal. Available from:
<http://www.uis.unesco.org/ev_en.php?URL_ID=3753&URL_DO=DO_TOPIC&URL_S
ECTION=201>
UNESCO: UIS (2003). Education indicators: Technical guidelines. Paris. Available from:
<http://www.uis.unesco.org> [Accessed January 2005].

44
Van der Berg, S. (2007). Apartheid’s enduring legacy: Inequality in education. Journal of
African Economies, 16(5): 849-880.
Van der Berg, S. & Louw, M. (2008). Lessons learnt from SACMEQ. In G. Bloch, L.
Chisholm, B. Fleisch and M Mabizela (ed.), Investment choices for South African
education. Johannesburg: Witwatersrand University Press.
World Values Survey Association (2008). World Values Survey 2005 official data file
(dataset). Madrid Available from: <www.worldvaluesurvey.org> [Accessed February
2009].

45
Appendix A
The following steps were followed to derive PIRLS-like data for 46 countries that did not
have original 2006 PIRLS data.
Firstly, the relationship between the 25 country averages of TIMSS 2003 mathematics
and PIRLS 2006 (where countries participated in both) was examined graphically. Three
different linear relationships were defined, on the basis of a visual examination of the
non-linearities in the graph. The first was for a low performance group (in the range South
Africa to Morocco, using the TIMSS averages), the second for a middle performance
group (Morocco to Moldova), and the third for a high performance group (Moldova to
Singapore). Each of the three linear relationships was defined using an OLS regression.
The three sets of coefficients were used to translate TIMSS scores to PIRLS-like scores
for the 20 countries participating in TIMSS but not PIRLS.
Secondly, one set of OLS regression coefficients for the relationship between SACMEQ
2000 (reading) and PIRLS 2006 was found using South Africa and Botswana as the
linking countries, but using the PIRLS-like score for Botswana obtained from the
previous step (this was necessary as South Africa was the only country that participated in
both SACMEQ 2000 and PIRLS 2006). The coefficients were used to translate the
SACMEQ scores of the remaining 11 countries to PIRLS-like scores.
Thirdly, the relationship between the 38 country averages of PISA reading and PIRLS
2006 (where countries participated in both) was examined graphically. PISA 2000 and
PISA 2003 scores were used. Where countries had PISA scores for both years, the
average of the two was used. Two different linear relationships were defined. The first
was for a lower performance group (Indonesia to Slovakia, using the PISA averages), and
the second for a higher performance group (Slovakia to the United States). Each of the
two linear relationships was defined using an OLS regression. The two sets of coefficients
were used to translate PISA scores to PIRLS-like scores for the 10 countries participating
in PISA but not PIRLS.
The relevant PIRLS-like average score for each of the 46 countries was determined as
follows. If the country had TIMSS data, but no PISA or SACMEQ data, then the PIRLS-
like score derived from TIMSS was used. Else, the PIRLS-like score derived from the
PISA or SACMEQ scores was used (no country participated in both SACMEQ and
PISA).
Finally, a PIRLS-like score per performance percentile within each of the 46 countries
had to be calculated. Breakdowns by percentile using the TIMSS, SACMEQ and PISA
data were first produced, using whatever data each country had available. These
breakdowns were translated into PIRLS-like breakdowns using in the case of each
country the coefficients that had been used to calculate the PIRLS-like country average.
The selection procedure described in the previous bullet was applied to decide which
PIRLS-like breakdown to use for the analysis.

46
Appendix B
This table provides values for the 55 countries entered in models B, C and D.
Table 9: Data for core set of countries
ISO code Country
GDP per capita
Investment over GDP
Increase in w.a.p.
Secondary GER
Tertiary enrolment
ratio
Engineering enrolment
ratio PIRLS 2006
PIRLS 2006 % passing
Articles per 1,000 pop.
Literacy ratio
ARG Argentina 10,511 16.8 1.5 75 54.2 5.1 461 67 0.30 97
AUS Australia 23,748 23.4 1.4 134 50.8 5.7 548 100 2.88 AUT Austria 24,782 22.4 0.5 103 31.0 4.5 539 98 6.63 BEL Belgium 22,766 19.9 0.1 141 35.9 4.1 535 97 2.98 BRA Brazil 6,951 17.1 2.3 71 19.7 1.8 437 61 0.14 86
BWA Botswana 6,508 27.0 3.6 63 4.5 0.2 319 5 0.13 75
CAN Canada 23,939 19.2 1.1 104 42.1 4.3 550 98 3.11 CHE Switzerland 27,624 23.4 0.7 97 23.5 3.4 539 100 7.82 CHL Chile 10,119 23.6 1.8 75 34.8 11.6 450 67 0.38 95
DNK Denmark 25,288 19.1 0.3 120 37.0 3.7 542 97 4.36 EGY Egypt 4,066 17.5 2.6 80 37.9
369 44 0.14 56
ESP Spain 17,566 23.7 0.7 113 46.2 7.7 524 94 1.21 96
FIN Finland 20,138 19.2 0.2 121 54.5 14.0 554 100 3.71 FRA France 23,079 19.1 0.4 108 35.2
531 96 1.87
GBR United Kingdom 22,382 17.4 0.2 111 36.9 3.4 545 100 2.67 GHA Ghana 1,252 20.4 3.2 37 3.6 0.5 304 0 0.03 58
GRC Greece 13,131 20.0 0.9 94 44.9 6.9 532 100 1.47 94
HKG Hong Kong 25,977 27.2 1.6 80 23.6 4.1 555 99 1.03 IDN Indonesia 3,635 23.0 2.3 51 16.3
405 53 0.01 82
IRL Ireland 19,629 19.6 1.3 110 45.9 5.3 547 100 2.62 ISR Israel 19,700 21.5 3.0 90 51.6 9.4 509 85 4.92 ITA Italy 21,120 20.1 0.1 92 32.0 5.3 543 99 1.79 98
JOR Jordan 3,722 25.3 4.9 64 39.7 5.5 412 53 0.30 90
JPN Japan 23,185 27.5 0.3 100 31.7 5.6 543 100 1.12 KEN Kenya 1,277 16.1 4.0 32 3.4 0.6 334 13 0.07 74
KOR Korea 13,644 34.0 1.5 94 68.6 23.4 549 100 0.64 LBN Lebanon 5,083 28.6 2.4 77 38.1 4.6 434 58 0.23 MAR Morocco 3,754 23.9 2.6 40 11.2 0.4 323 24 0.05 42

47
ISO code Country
GDP per capita
Investment over GDP
Increase in w.a.p.
Secondary GER
Tertiary enrolment
ratio
Engineering enrolment
ratio PIRLS 2006
PIRLS 2006 % passing
Articles per 1,000 pop.
Literacy ratio
MEX Mexico 7,403 19.2 2.7 65 22.3 3.9 452 66 0.11 89
MKD Macedonia 5,036 16.8 0.8 69 20.7 4.1 422 65 0.07 95
MOZ Mozambique 1,102 21.9 2.2 7 0.8
316 1 0.00 39
MUS Mauritius 13,153 25.7 1.5 67 10.3 1.7 328 27 0.07 82
MWI Malawi 765 17.9 3.4 20 0.4 0.1 263 0 0.02 64
MYS Malaysia 9,757 32.5 3.2 62 28.4 7.3 519 100 0.13 86
NAM Namibia 4,981 21.5 4.1 58 7.3 0.3 275 3 0.06 80
NLD Netherlands 23,693 21.5 0.6 127 32.4 3.4 547 100 3.97 NOR Norway 29,666 20.0 0.6 114 44.8 3.1 519 93 3.21 NZL New Zealand 19,146 20.4 1.2 107 49.2 3.2 540 92 2.63 PER Peru 3,956 20.1 2.4 76 35.0
339 31 0.03 87
PHL Philippines 3,399 21.1 2.8 78 34.7 4.4 321 0 0.02 93
POL Poland 7,377 19.8 0.6 96 45.0 6.1 528 93 0.89 99
PRT Portugal 15,607 24.6 0.5 100 38.0 7.7 532 100 0.79 88
SVN Slovenia 16,170 22.8 0.6 97 46.5 8.2 522 95 1.51 100
SWE Sweden 22,895 17.2 0.4 131 42.0 7.8 547 98 4.88 SYR Syria 1,877 21.8 4.0 46
318 0 0.03 83
THA Thailand 6,309 32.3 1.9 51 35.4
472 76 0.08 93
TTO Trinidad and Tobago 11,740 20.1 1.4 76 7.6 1.1 436 64 0.07 97
TUN Tunisia 6,257 25.3 2.7 63 23.2 2.7 403 52 0.15 TUR Turkey 5,275 22.6 2.6 62 26.3 3.7 494 77 0.32 79
TZA Tanzania 667 20.6 3.2 5 0.8 0.1 334 8 0.03 69
UGA Uganda 922 16.8 3.2 14 2.9 0.2 296 11 0.02 62
URY Uruguay 9,774 13.1 0.7 91 30.2
485 71 0.27 97
USA United States 30,844 18.0 1.0 95 54.1
540 96 2.32 ZAF South Africa 7,818 16.0 2.9 86 16.2 1.2 302 21 0.21 82
ZMB Zambia 932 14.9 2.9 25 2.6
270 1 0.05 67