the council of ambulance authorities 2012-2013 annual report 2 · the council of ambulance...
TRANSCRIPT


The Council of Ambulance Authorities 2012-2013 Annual Report 2
Table of Contents
Chairman’s Introduction .......................................................................................................................................................... 3
Council of Ambulance Authorities ....................................................................................................................................... 5
Chief Executive Officer’s Report ............................................................................................................................................ 6
CAA Committees and Working Groups ............................................................................................................................... 8
Accreditation ................................................................................................................................................................................. 9
Service Reports ......................................................................................................................................................................... 11
Comparative Data 2012-2013 ............................................................................................................................................. 51

The Council of Ambulance Authorities 2012-2013 Annual Report 3
Chairman’s Introduction This year, 2012-13, is the final year of my current term as Chair of the CAA. Ray Creen, who has been Deputy Chair, will take over the role after the 2013 Annual General Meeting. It has been an eventful three years for the CAA and a very satisfying period in which to have been its chair. In this period, we completed a strategic review of the CAA: appointed our first CEO, Greg Mundy; celebrated our 50th Anniversary; and continued to advance the ambulance sector in Australia and New Zealand through our collective work in committees, our representation to Governments and other decision makers and the exchange of ideas and perspectives between members. The Strategic Directions adopted by the Board for the CAA in 2010-11 included a stronger focus on influencing health policy and a stronger profile for the CAA was identified as one of the means to this end. Showcasing the work of our sector both internally and to our external stakeholders is important in achieving this stronger profile and our 2012 conference in Hobart signalled the arrival of a new look CAA. For the first time we staged a full two day conference with a formal trade exhibition as part of it. We more than doubled the number of delegates from the previous year’s event and we used the event to mark our 50th birthday with the launch of an updated history of the CAA. The conference focussed on Shaping the Future asking the question ‘what will ambulance services in Australia and New Zealand look like 10-20 years from now’ in areas such as patient care, workforce including volunteering and technology. Looking ahead has been a feature of the CAA throughout its history and I look forward to seeing that continue. As is our usual practice, we presented our annual Ambulance Awards at a special dinner during the conference. I would like to congratulate the winners and the runners up for their creativity and achievements in the continuing advancement of ambulance services in Australia and New Zealand. We have been pleased to see the emergence of a similar body to the CAA in England with the formation there of the Association of Ambulance Chief Executives (AACE) in 2011. Meeting with the AACE members at their Ambulance Leadership Forum (ALF) in May 2013 served to reinforce the importance of maintaining links with international colleagues and to learn from their approaches to the similar issues facing all of us in the ambulance sector. We learned about the changes to emergency medical services in the National Health Service and the performance to date of their alternative phone service for non-emergency assistance (111 as opposed to 999). I shared with the ALF delegates our experiences in Western Australia of building a data rich organisation and our CEO, Greg Mundy, provided an overview of ambulance services in Australia and New Zealand. We look forward to an ongoing relationship with AACE, alongside that which we enjoy with the Paramedic Chiefs of Canada and the International Roundtable on Community Paramedicine. I would like to thank my Board colleagues for their support and collegiality throughout my term as CAA Chair; the CEO and CAA Secretariat team for their hard-working support for me and the Board; and the representatives from our member services who contribute so much to the work of the CAA. I have enjoyed my three years as Chair of the CAA, we have achieved much and I look forward to the future of the ambulance sector and its Association with optimism. Tony Ahern Chairman Council of Ambulance Authorities
The Council of Ambulance Authorities 2012-2013 Annual Report 4
Council of Ambulance Authorities
The Council of Ambulance Authorities Inc. (CAA) is the peak body representing the principal statutory providers of
ambulance services in Australia, New Zealand, and Papua New Guinea. The CAA formally incorporated in December
2002, having operated as an informal grouping of the ambulance services of Australia, New Zealand, and Papua New
Guinea since 1962.
Intent
The intent of the Council of Ambulance Authorities is to influence, advise and develop superior pre-hospital care and
ambulance services in the Asia Pacific Region.
Purpose
Policy Actively contribute to the development of public policy
Knowledge Develop a body of knowledge through research, exchange of information, monitoring and
common KPI reporting
Quality Develop and implement standards for improved quality of care and services
Synergies Develop common systems and processes
Leverage Jointly fund initiatives for common outcomes.

The Council of Ambulance Authorities 2012-2013 Annual Report 5
Chief Executive Officer’s Report 2012-13 saw a consolidation of our efforts to establish and maintain a presence for the ambulance sector and the CAA at the national level in health and emergency services, building on the introductory contacts made in my first year as CEO. One of the key policy issues facing the ambulance sector in Australia and New Zealand is the question of the regulation of paramedics. Agreement to introduce professional registration in New Zealand has already been reached though not yet implemented. In Australia, where eight jurisdictions need to find common ground, progress has been slower. This question has been in front of Australian Health Ministers for some time and a formal consultation process on their behalf took place in 2012-13. The CAA and individual ambulance services attended a number of the face-to-face consultation sessions and we made a formal written submission responding to the formal Consultation Paper issued by the Australian Health Ministers’ Advisory Council on this issue. The CAA supports the concept of professional registration for paramedics; it is consistent with the profound changes in our sector in recent decades and will assist with the development of a culture to support its continued development. We followed our submission up with meetings and correspondence with key decision makers including Commonwealth and State Ministers and senior officials. At the time of writing, consideration of this issue by Ministers is ongoing. In last year’s Annual Report, I wrote about the emerging interest in community paramedicine, often referred to as ‘Extended Care Paramedicine’, not least in supporting the health of people in rural and remote communities. We were pleased in 2012-13 when Health Workforce Australia (HWA) announced a project, as part of their Expanded Scope of Practice initiative, to conduct pilots of new models of paramedic care in a range of sites around Australia and invited the CAA to be a member of their reference group for this project. Five projects were funded for approximately 18 months, finishing in mid-2014. A formal evaluation forms part of the process, which will assist decision making about the future of these projects and other work in this area. There are services of this type now in many parts of the world and other CAA members, in addition to those participating in the HWA project, also provide such services. The geographical spread of the International Roundtable of Community Paramedicine (IRCP), whose conference the CAA hosted in Sydney in 2011 has now expanded to include the United Kingdom, reflecting the international interest in this particular frontier. The Association of Ambulance Chief Executives (AACE, our UK equivalent) were the hosts of IRCP in May 2012. Our annual conference was in Hobart in October 2012 and I am pleased to see it developing into the feature event on the ambulance calendar in Australia and New Zealand. Our record number of delegates enjoyed a rich program of international and local speakers, supported by our increasing numbers of sponsors. Our partnership with Ambulance Tasmania in planning and staging the 2012 conference was a rewarding and productive one and we now have a sustainable model for future CAA conferences. The links between our sector and other parts of the national health and emergency services system continue to be important and continue to grow. As I noted in my report last year, Australia has taken the first steps on a path towards uniform, Activity-Based, funding for public hospitals; has established a network of new coordinating agencies in primary health care – the Medicare Locals – and there is now, more than ever a need for our sector to maintain strong links with the stakeholders and policy makers, especially in the areas likely to directly impact on ambulance services. We need to know what is happening on the national stage in Australia and to seek to influence it where we need to. This is why we participate in the activities of organisations such as the National Rural Health Alliance (NRHA), the Australian Healthcare and Hospitals Association (AHHA) and the National Primary Health Care Partnership (NPHCP). As well as providing two-way channels of communication, participating in such networks helps to ensure that the ambulance perspective is heard, understood, and sought out when it is relevant or needed. The development of the sector’s information and policy base continued in 2012-13, through the work of our committees and working groups, including this year a re-vamped Clinical Forum. CAA’s Emergency Management Committee commissioned a report from consultants on the role of ambulance services in

The Council of Ambulance Authorities 2012-2013 Annual Report 6
Emergency Management and work commenced this year on a CAA Position Statement on this subject for launching at our 2013 Conference. The Ambulance Education Committee continued its role of overseeing the Paramedic Education Programs Accreditation Scheme (PEPAS) together with many other aspects of professional education. Lilia Sher joined the CAA Secretariat this year as PEPAS Coordinator, providing valued support for this important function. I very much appreciate the knowledge, experience and collegiality of the members of these groups which in many ways are the engine room driving the collective forward movement of the ambulance sector in Australia and New Zealand. Bringing together senior managers from each service to discuss a focussed agenda of current and developing issues allows us to consolidate and coordinate effort on strategically-chosen issues and to keep abreast of the variety and diversity of our member organisations on others. We have world-class quality ambulance services in Australia and New Zealand and the involvement of the CAA bringing people together since its first meeting in December 1962 has helped us get to this point. I know that this appreciation is shared by the CAA Board, the members of our committees and CAA Secretariat staff who contribute to our work. I look forward to another productive year in 2013-14.
Greg Mundy Chief Executive Officer Council of Ambulance Authorities

The Council of Ambulance Authorities 2012-2013 Annual Report 7
CAA Committees and Working Groups
Ambulance Education Committee (AEC)
The AEC provides a focal point on ambulance education programs and professional practice and considers
education matters relevant to the provision of quality ambulance services.
The AEC oversees the work of the Paramedic Education Programs Accreditation Scheme (PEPAS), which reviews
and accredits entry-level university degree courses for paramedics. It also looks at new methods of delivering
education including simulation and e-learning. The AEC is a key vehicle for stakeholder engagement between the
universities, professional bodies and the CAA in this context.
Emergency Management Committee (EMC)
The Emergency Management Committee provides advice to the Board relating to ambulance involvement in
emergency management including such issues as: resource capacities and development; national standards and
technical matters. The EMC looks at the involvement of ambulance services in major emergencies with a view to
distilling the lessons to be applied to future events.
Strategic and Business Advisory Committee (SBAC)
The SBAC is the key advisory group to the CAA on matters relating to the strategic direction and development of
business, resourcing, planning, reporting, and operational matters within the sector. The SBAC provides oversight for
the CAA’s data collections and their development including data for the annual Report on Government Services
(ROGS).
Rural and Remote Group
The Rural and Remote Working Group (RRG), provides a national focus and acts as the key advisory group to the
CAA on matters relating to the strategic direction and development of ambulance services in rural and remote
areas. Key issues include models of service delivery and strategic issues that affect the delivery of volunteer
ambulance services. The RRG acts as the CAA’s representative on the National Rural Health Alliance. When
required, the RRG assists the host jurisdiction in planning a rural and remote symposium in conjunction with CAA’s
Annual Conference.
Clinical Forum
The Clinical Forum provides an opportunity for the clinical directors of each service to exchange information, issues,
and perspectives on clinical matters. Its agenda covers clinical practice, current clinical research projects, and related
matters.

The Council of Ambulance Authorities 2012-2013 Annual Report 8
Accreditation Scheme Update
The CAA administers the Paramedic Education Programs Accreditation Scheme (PEPAS) in cooperation with professional bodies and the tertiary sector to ensure paramedic graduates are equipped to meet the challenges of today’s ambulance services. The PEPAS scheme is accepted as the industry standard; at the close of 2012-13 financial years 16 (sixteen) universities were at various stages of accreditation or evaluation of their program/s. The Accreditation of entry-level paramedic education programs has 3 stages: Preliminary approval Preliminary approval of a new entry-level paramedic education program is sought prior to the commencement of teaching the course and approval is normally granted prior to, or commensurate with, the entry of the first cohort into the program. Provisional accreditation A new program that has been granted preliminary approval will be eligible for provisional accreditation after the first year of teaching, subject to successful annual review. Provisional accreditation may also be granted where conditions are attached following assessment for full accreditation. Full accreditation A program is eligible for full accreditation for a period of up to 5 years after the first cohorts of graduates have at least 12 months of practice experience following graduation. The following Universities hold provisional/full accreditation as at June 30 2013:
Monash University: Bachelor of Emergency Health (Paramedic); Bachelor of Nursing/ Emergency Health
(Paramedic).
Flinders University: Bachelor of Paramedic Science.
Victoria University: Bachelor of Health Science (Paramedic).
Queensland University of Technology: Bachelor of Health Science (Paramedic).
Edith Cowan University: Bachelor of Science (Paramedical Science).
Charles Sturt University: Bachelor of Clinical Practice (Paramedic); Bachelor of Nursing / Bachelor of Clinical
Practice (Paramedic); Graduate Diploma Clinical Practice (Paramedic).
Auckland University of Technology NZ: Bachelor Health Science (Paramedicine).
Whitireia Polytechnic NZ: Bachelor of Health Science (Paramedic).
Australian Catholic University: Bachelor of Nursing/Bachelor Paramedicine; Bachelor Paramedicine.
Central Queensland University: Bachelor of Paramedic Science.
University of Tasmania: Bachelor of Paramedic Practice.
University of Queensland: Bachelor of Paramedic Science.
University of Sunshine Coast; Bachelor of Paramedic Science.

The Council of Ambulance Authorities 2012-2013 Annual Report 9
The following university programs are being evaluated for provisional/full accreditation or hold preliminary approval:
University of Ballarat (now Federation University of Australia; Graduate Diploma of Paramedicine.
Curtin University; Bachelor of Science (Health Sciences).
La Trobe University; Bachelor of Health Sciences Paramedic Practice.
Enrolments in Accredited Courses The below table provides an overview of the total number of enrolments for 2013 by location in Australia and New Zealand.
Location Total Enrolments
New Zealand 373
Australian Capital Territory 108
New South Wales 736
Queensland 1796
South Australia 417
Tasmania 100
Victoria 2043
Western Australia 671
TOTAL 6244
The Council of Ambulance Authorities 2012-2013 Annual Report 10
Service Reports
This section presents the 2012-13 annual reports received from the Council of Ambulance Authorities member
services.
A.C.T. Ambulance Service.
Ambulance Service of New South Wales.
Ambulance Tasmania.
Ambulance Victoria.
Queensland Ambulance Service.
SA Ambulance Service.
St John Ambulance Australia (NT) Inc.
St John Ambulance Australia (Western Australia) Inc.
St John Ambulance Papua New Guinea.
St John New Zealand.
Wellington Free Ambulance.

The Council of Ambulance Authorities 2012-2013 Annual Report 11
Australian Capital Territory Ambulance Service
Contact Details
Title: Chief Officer (Ambulance)
Incumbent: David Foot ASM
Location:
ACT Emergency Services Agency HQ
9 Amberly Avenue
Fairbairn ACT 2609
Postal Address:
PO Box 158, Canberra City 2600
Telephone: +61 2 6207 8701
Facsimile: +61 2 6207 9984
E-mail: [email protected]
Jurisdiction The ACT Emergency Services Agency (ESA) provides emergency management arrangements for the ACT under the
Emergencies Act 2004. The four operational services within the ESA include the ACT Ambulance Service, ACT Fire &
Rescue, ACT Rural Fire Service, and the ACT State Emergency Service, which, through collaborative working
arrangements, play a significant role in preparing for, preventing and responding to emergency incidents within the
Australian Capital Territory.
As a response agency of the ESA, the ACT Ambulance Service (ACTAS), holds legislated responsibility within the ACT
for the provision of emergency, non-emergency, specialist ambulance services and aero-medical services to the
surrounding region of south east NSW.
The Australian Capital Territory is the smallest territory of the Australian States and Territories. It occupies an area
encompassed by South East New South Wales and covers approximately 2,360 square kilometres. The resident
population of the Australian Capital Territory is approximately 382,9001 primarily spread across various town centres
of Civic, Woden, Belconnen, Tuggeranong, and Gungahlin. The capital city of Canberra occupies an area of
approximately 300 square kilometres.
1 Preliminary Data Population at end Sept qtr 2013_ABS
Our Vision and Mission
Our Vision A prepared community supported by an expert and timely emergency service response.
Our Mission
Protection and preservation of life through professional ambulance services.

The Council of Ambulance Authorities 2012-2013 Annual Report 12
The Year in Review Activity & Performance
In 2012-13, ACTAS managed 41,346 incidents involving 41,560 responses by operational crews. This was achieved
with a patient satisfaction survey result of 98% of patients satisfied or very satisfied with the level of service
provided.
ACTAS attended 50% of emergency incidents in 8.7 minutes or less (performance target 8 minutes) and 90% in 13.7
minutes or less (performance target 12 minutes 30 seconds). The 2012-13 results showed a continued improvement
compared to the 2011-12 outcome for these indicators of 9.3 minutes and 14.8 minutes respectively. This is a
notable achievement when considering that ACTAS reporting response times commence from the first keystroke on
the Computer Aided Dispatch system and increased workload.
Emergency Planning and Preparedness
As with previous years, ACTAS administered the Directorate influenza vaccination program. This annual exercise
continues to be viewed as a valuable strategy in increasing the participation of salaried and volunteer staff in the
vaccination program, reducing the impact of seasonal influenza on staff absenteeism, and increasing preparedness in
the event of pandemic influenza. In 2012-13, the program involved 781 departmental officers from ESA, ACT
Corrections, ACT Magistrates Court and the Justice and Community Safety Directorate receiving flu vaccinations.
A new Concept of Operations targeted at strengthening the cohesiveness in joint operations between the ACTAS and
ACT Fire & Rescue was finalised and endorsed by the Emergency Services Agency Commissioner as a “Notifiable
Instrument’ under the Emergencies Act 2004 in March 2013.
Key Achievements
In the 2012-13 Budget, the ACTAS was allocated $13.347m over four years. This funding, which supports Stage II of
the ACTAS Sustainable Frontline resourcing model delivered 15 additional frontline staff, commissioned two
additional ambulance vehicles to support additional staffing and replaced cardiac monitor/defibrillators on all
frontline intensive care ambulances and semi-automatic external defibrillators on supporting emergency response
vehicles.
In October 2013, the ACT hosted the annual Council of Ambulance Authorities conference titled “Exploring the
Frontiers, Paramedicine of Tomorrow’. The conference, which was formally opened by the ACT Minister for Police &
Emergency Services Mr Simon Corbell MLA, attracted, in excess of 200 delegates and included keynote national and
international speakers, some of which included Deputy Superintendent Michael Bosse from Boston Emergency
Medical Services (EMS), who captivated the audience with his role in leading the tactical response to the Boston
bombings, and Professor Russell Gruen from the Victorian National Trauma Research Institute.
A 2012-13 mental health training initiative focused on staff working within the ESA’s Communications Centre and
ACTAS recruits. Forty-eight staff members were involved in this initiative. Adjustments will be made to the existing
program in 2013 in anticipation of changes to the Mental Health (Treatment and Care) Act 1994, which proposes to
extend legal powers to ACTAS officers to authorise an emergency detention order in the pre-hospital environment as
announced by the ACT Chief Minister on 26 April 2013.
The aeromedical service (Snowy Hydro SouthCare) operated by the ACTAS on behalf of the ACT and NSW
Governments flew 498 missions. The previous establishment of dedicated training and accommodation facilities at
the helicopter base supported the service being awarded training accreditation from the colleges of Intensive Care
Medicine, Australasian College for Emergency Medicine, and Australia and New Zealand College of Anaesthetists.

The Council of Ambulance Authorities 2012-2013 Annual Report 13
Four Intensive Care Paramedic officers were selected and travelled to South Australia to undertake Extended Care
Paramedic training with the South Australian Ambulance Service. The trial, funded by Health Workforce Australia,
will see ACTAS deploying four Extended Care Paramedics on 12-hour shifts into front line operations over the next
twelve months. A Steering Committee established to oversight the trial includes representation from Medicare
Local, a number of areas of ACT Health including Community Nursing and Aged Care, ACT Government Solicitors, the
ACTAS Medical Advisor and senior management.
Key Targets for 2013-14
In 2012, the NSW Ministry for Health commenced a statewide review of aero-medical (rotary wing) ambulance
services. The review has been used by the NSW Government to inform a ten (10) year plan for the configuration
and future development of aero-medical services in NSW. The ACTAS will be contributing personnel to the ongoing
works coming out of the review, based on the role of the ACT aeromedical service in the statewide retrieval system.
The Service, in consultation with a number of stakeholders, will also commission a follow up review to the 2010
“Lennox Report” and undertake a review of organisational culture with both strategies aimed at further
strengthening corporate, clinical and operational governance and engagement at all levels of the Service.
See www.ambulance.act.gov.au for further information.
The Council of Ambulance Authorities 2012-2013 Annual Report 14
Ambulance Service of New South Wales
Contact Details
Title: Chief Executive
Incumbent: Ray Creen ASM
Location:
Balmain Road
Rozelle NSW 2039
Postal Address:
Locked Bag 105
Rozelle NSW 2039
Telephone: +61 2 9320 7601
Facsimile: +61 2 9320 7802
Email: [email protected]
Our Vision
Excellence in Care
Activity The average daily number of ambulance responses increased by 3.3 per cent over the past year. NSW Ambulance
provided over 1,219,262 total responses (both emergency and non-emergency), compared to 1,183,795 total
responses in 2011/12.
On average, there were 3,340 responses per day – equivalent to a response every 25.9 seconds. The total number of
emergency responses was 898,132, compared with 865,725 in 2011/12.
The average number of emergency responses per day increased by 4 per cent from 2365 in 2011/12 to 2461 in
2012/13.
NSW Ambulance provided 321,130 non-emergency responses compared with 318,070 in 2011/12.
The Year in Review 2012/13 has been a year of major change for NSW Ambulance, with the appointment of a new Chief Executive and
the launch of the Reform Plan for NSW Ambulance released by the Minister for Health in December 2012. The plan
outlines five strategic directions aimed at improving ambulance services for the NSW community:
Integrating NSW Ambulance into the broader health system.
Separating non-emergency patient transport (NEPT) from urgent medical retrieval patient services
so NSW Ambulance is able to focus on its core role of attending to emergencies.
Developing new models of care and investing in new providers to effectively manage demand, and
response times, reduce paramedic fatigue and improve the operating costs of NSW Ambulance.
Ensuring that NSW Ambulance has effective infrastructure, and a funding model, that will ensure
financial sustainability in the future.
The Council of Ambulance Authorities 2012-2013 Annual Report 15
Strengthening the leadership, workforce and governance structure of NSW Ambulance and
embracing the CORE values of Collaboration, Openness, Respect, and Empowerment.
NSW Ambulance has formed a high level Steering Committee comprising key stakeholders from across the health
system who are working together to implement the reforms. As at June 2013, 11 of the 34 reforms contained in the
plan are complete and the remaining 23 are on track, with the majority expected to be completed by the end of
2013.
The implementation of the Reform Plan will assist in ensuring that patient care is delivered in a coordinated way
across the entire health system, increasing the ability of ambulances to respond to urgent life threatening
emergencies. The leadership capability across the organisation will be strengthened by the realignment of the
executive structure, recruitment to vacant positions and enhanced training opportunities.
Top 10 Achievements 2012-13
1. Non-Emergency Patient Transport (NEPT) project improving efficiencies in transporting non-
emergency patients, splitting them from the emergency services tier of NSW Ambulance. A
dedicated NEPT booking hub will be established at Regent’s Park in July.
2. Implementation of the Aeromedical Reform Plan. Initiated by the NSW Government in 2012, a
detailed review of Aeromedical Services was established, aimed at improving the quality of service
provided statewide.
3. 24 hour secondary triage with Healthdirect Australia. Patients phoning Triple Zero (000) who meet
certain criteria are transferred to Healthdirect Australia, which undertakes secondary triage to
provide referral services and self-care instructions.
4. Work continues on transitioning NSW Ambulance to StaffLink Human Resource Information System
(HRIS) and implementing HealthRoster, bringing NSW Ambulance human resource systems in line
with NSW Health.
5. Ambulance Operational Showcase was conducted in April 2013, giving Local Health District
representatives the opportunity to view the tools used to manage demand and optimise availability
of ambulance resources.
6. Turnaround delays reduced through collaboration between NSW Ambulance’s Hunter New England
Sector and the Hunter New England Local Health District. Various initiatives significantly reduced
off- stretcher delays – from 1555 hours of lost productivity in July 2012 (due to crews waiting in
excess of 30 minutes to off-load patients) down 48 per cent to 748 hours in June 2013.
7. Stroke Reperfusion Program launched in January 2013, improving patient access to stroke services,
specifically to early stroke thrombolysis at an Acute Thrombolytic Centre (ATC). By June 2013,
paramedics had transported 550 patients to ATCs with an average patient thrombolysis rate of 12
per cent.
8. Cardiac Care Program. Patients who present to NSW Ambulance with ST Elevation Myocardial
Infarction (STEMI) are provided the most appropriate treatment pathway, either Pre-Hospital
The Council of Ambulance Authorities 2012-2013 Annual Report 16
Assessment for Primary Angioplasty (PAPA) or Pre-Hospital Thrombolysis (PHT). In 2012/13, 1159
patients were enrolled in the PAPA pathway and 49 patients received PHT.
9. Implementation of the New Emergency Response Grid, increasing the safety of paramedics with
fewer requirements for lights and sirens responses. It also decreases response time to Priority 1
incidents, meaning the sickest patients receive more expedited care.
10. Expand the Frequent User Program. Over the past three years, NSW Ambulance has seen a year on
year rise in the number of responses to patients who use NSW Ambulance more than 10 times per
year. The frequent user project aims to develop a strategy to work with this patient group to ensure
they are able to access health care interventions appropriate to their needs without the repeated
use of emergency services. Key components of the model include patient identification, review of
patient acuity and implementation of a range of interventions developed in consultation with Local
Health Districts and other care providers.
Future Directions 2013-14 Top 10 Planned Activities and Outcomes
1. NSW Ambulance restructure. The Reform Plan for NSW Ambulance acknowledged the current
structure could be improved by better aligning and grouping ‘like’ functions across the organisation,
reducing the number of direct reports to the Chief Executive, creating a business improvement
directorate and grouping executive services and public affairs. These changes will enhance
communication across the organisation and improve NSW Ambulance’s ability to meet current and
future workforce and patient needs.
2. The Reform Plan for Aeromedical (Rotary Wing) Retrieval Services in NSW was announced in mid-
2013, with the Government committing an additional $39 million over the next three years which
will result in improved quality of care and access to critical care services for NSW patients.
Aeromedical clinical and aviation crews will benefit from improved safety, training and education.
3. StaffLink Human Resource Information System is a human resource and payroll system rolled out
across NSW Health since 2009. In line with the Reform Plan to be more closely integrated with NSW
Health, NSW Ambulance commenced implementation of StaffLink in February and will use the
system for HR, finance, salary packaging, workers’ compensation and clinical administration, with
the go-live scheduled for early 2014.
4. HealthRoster is the integrated electronic rostering system being introduced across NSW Health,
with NSW Ambulance one of the first to implement the eRostering system. HealthRoster has now
been configured to meet NSW Ambulance requirements and roll-out has commenced to
operational staff. This roll-out will be extended to corporate and other staff over the next 12
months.
5. Non-Emergency Patient Transport (NEPT). One of the five key strategic directions set out in the
Reform Plan for NSW Ambulance is that NEPT be split from the emergency medical retrieval tier.
This will reduce the demands on the NSW Ambulance fleet and resources throughout the state,
The Council of Ambulance Authorities 2012-2013 Annual Report 17
enabling us to respond more quickly to priority patients. It will also improve the flow of non-
emergency patients to and from scheduled hospital and other medical appointments.
6. Fire and Rescue NSW Emergency First Responder Trial. The Reform Plan for NSW Ambulance
outlined strategic directions for improving emergency out-of-hospital care for the NSW community,
including developing new models of care. NSW Ambulance is working with Fire and Rescue NSW on
the Emergency First Responder Trial, to be held in the Northern Beaches in early 2014. Arising from
the reform, this initiative aims to improve patient outcomes and enhance service delivery by
dispatching firefighters with paramedics to life threatening emergencies.
7. Fleet improvements. The phasing out of the Volkswagen T5 and Crafter ambulance and patient
transport vehicles has commenced and all vehicles will be replaced over the next three years. Three
additional bariatric ambulances have been introduced and can be used to transport morbidly obese
patients (weighing up to 300 kg) and critically ill patients in a state of high-dependency.
8. InterCAD Emergency Messaging System (ICEMS). NSW will introduce ICEMS, which will facilitate the
exchange of recorded mission critical information between emergency service organisations in a
more accurate and timely manner, strengthening the notification protocols.
9. New and revised NSW Ambulance Clinical Protocols and Pharmacology were released in October
2012, marking two significant milestones – the implementation of a Protocol Governance System,
and the first suite of protocols reflecting paramedic feedback on format and distribution. While the
initial review of all Clinical Protocols and Pharmacology is scheduled for completion by 2015, the
ongoing systematic review and identification of new initiatives is a continual process, which will
ensure patients receive the best possible treatment.
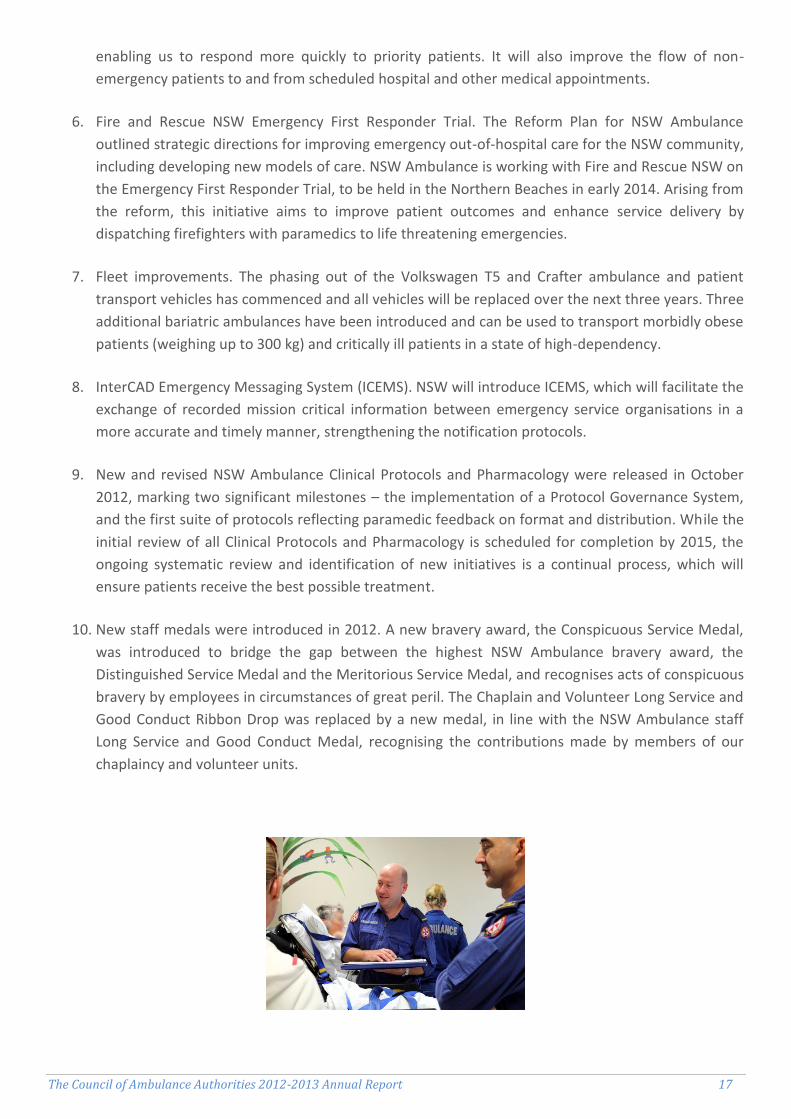
10. New staff medals were introduced in 2012. A new bravery award, the Conspicuous Service Medal,
was introduced to bridge the gap between the highest NSW Ambulance bravery award, the
Distinguished Service Medal and the Meritorious Service Medal, and recognises acts of conspicuous
bravery by employees in circumstances of great peril. The Chaplain and Volunteer Long Service and
Good Conduct Ribbon Drop was replaced by a new medal, in line with the NSW Ambulance staff
Long Service and Good Conduct Medal, recognising the contributions made by members of our
chaplaincy and volunteer units.
The Council of Ambulance Authorities 2012-2013 Annual Report 18
Ambulance Tasmania
Contact Details
Title: Chief Executive Officer
Incumbent: Dominic Morgan
Location:
State Headquarters
Lower Level, 12 Brisbane Street
Hobart TAS 7000
Postal Address:
GPO Box 125
Hobart TAS 7001
Telephone: +61 3 6230 8580
Facsimile: +61 3 6230 8573
Email: [email protected]
Our Vision
Ambulance Tasmania’s vision is excellence in ambulance and out of hospital care.
Jurisdiction Ambulance Tasmania (formerly Tasmanian Ambulance Service) was established under the Ambulance Service Act
(1982). It is a statutory entity, which is part of the Department of Health and Human Services. Ambulance Tasmania
(AT) has:
5 Divisions including Emergency and Medical Services, Health Transport Service, Aero-Medical and
Medical Retrieval, Clinical Services and Operational Support Services.
Emergency and Medical Service (AT- EMS) has 3 operational regions, a state- wide communications
centre and volunteer coordination unit.
The Health Transport Division manages the statewide coordination of Non-Emergency Patient
Transport Services (AT-NEPTS) for DHHS.
The Aero-medical and Medical Retrieval Division is also now an integrated service of Ambulance
Tasmania.
The Clinical Services Division is responsible for providing advice and guidance on research clinical
practice and providing RTO compliant educational and professional development services.
Operational support services division provides all of ATs corporate services.
Under the Ambulance Service Act (1982), the Director of Ambulance Services is responsible for co-ordinating all
ambulance services for AT, and all independent services, which ostensibly operate under the Director’s consent and
this includes a commercial sector providing non-urgent patient transport and safety coverage at sporting events.

The Council of Ambulance Authorities 2012-2013 Annual Report 19
Tasmanian residents continue to enjoy free ambulance transport within Tasmania. Some reciprocal arrangements
exist with mainland services but not all.
The Year in Review The highlights for the year have included:
Kingston station on the urban fringe of Hobart was converted to a full urban station with 24/7 dual
paramedic crewing as a result of combined Commonwealth State funding.
Roll out of the first 18 of the new ETT Sprinter vehicles at a cost of $1. 76 million.
Established a fifth Community Emergency Response Team (CERT) at Ellendale in rural Tasmania.
Completed the rollout of new Clinical Practice Guidelines, medications and equipment and training.
Completed Hobart Complex Stage 2 redevelopment completing the full construction of the State
Operations Centre and Hobart redevelopment over 4 years at approximately $7.9 Million.
New Ambulance Tasmania fixed wing aircraft commenced operations.
Implemented new $300,000 Zetron (Acom) switching system for radio and telephony integration
into state communications centre.
Implementation of $100,000 voice logger hardware and software to the state communications
centre.
Successfully completed the Hobart First intervention Vehicle trial.
Implemented Extended Care Paramedic trial into Launceston after a $750 000 successful bid for
Australian Government funding.
Held two Staff Awards and Recognition Ceremonies in the state.
Implementation of Hobart First Intervention Vehicle (FIV) Trial and first change over.
Recruitment of twelve additional paramedic staff and seven new graduate paramedics.
Implementation of stand-alone redundancy arrangements for duress device monitoring into
communications centre.
Commencement of Technical Radio Communications Consultant to establish radio communications
strategic plan.
Launched new Volunteer Manual, Policies and Procedures.
Developed the 2013-2016 Ambulance Tasmania Business Plan.
Future Directions 2013-14 The year ahead will no doubt present challenges. AT is required to deliver on further Efficiency Dividends in difficult
economic times. AT will however continue to fund initiatives commenced in the previous years as well as:
Continuing upgrade of medical and training equipment.
Continuation of a routine asset and property maintenance program.
Ongoing improvement of information systems.
Continuation of a cyclical ambulance replacement program.
Ambulance Tasmania acquired Australian Government funding towards investment in on board computer systems,
which will improve efficiency by linking into the Computer Aided Despatch system and pre-populate the electronic
patient report form with patient details, as well as contributing to officer safety through its duress and automatic
vehicle location capacity.
Ambulance Tasmania secured additional Australian Government funding under the Health Workforce Agreement to
extend the role of Paramedics in the rural community. This will be initiated in 2012/13 and continue the year after.
The Council of Ambulance Authorities 2012-2013 Annual Report 20
Ambulance Victoria (AV)
Contact Details
Title: Chief Executive Officer
Incumbent: Greg Sassella
Location:
375 Manningham Road
Doncaster VIC 3108
Postal Address:
PO Box 2000
Doncaster VIC 3108
Telephone: +61 3 9840 3630
Facsimile: +61 3 9840 3546
Email: [email protected]
Our Vision and Mission
Ambulance Victoria’s Mission Statement:
We improve the health of our community by delivering innovative, high-quality ambulance services
Ambulance Victoria (AV) commenced operation on 1 July 2008. AV currently has four areas of focus that guide the
development of its strategic direction:
1. Our Services: Co-ordinate and deliver safe and efficient patient-centred care.
2. Our People: Work collaboratively to achieve a safe, capable, accountable, and engaged workforce.
3. Our Partners & Community: Partner with key stakeholders to deliver improved health outcomes,
enhanced community safety and resilience.
4. Our Financial Sustainability: Ensure Ambulance Victoria’s business model can resource current
service needs and investment in service improvements.
Jurisdiction Ambulance Victoria (AV) reports through the Department of Health to the State Minister for Health, the Hon. David
Davis, MP. The Board of Directors, appointed by the Governor in Council on the Minister’s recommendation, is
responsible for the provision of comprehensive and efficient ambulance services.
The organisation is managed by the Chief Executive Officer, (who reports to the Board) and the Executive
management team.
The Council of Ambulance Authorities 2012-2013 Annual Report 21
The Year in Review Emergency Road Services
Responding to over 476,000 emergency and urgent road incidents, AV experienced strong growth in 2012/13 (5.1%),
following on from a moderate increase (2.1%) in the previous year. Despite the large increase in demand, the
percentage of Code 1 cases responded to within 15 minutes only declined slightly from 74.8% in 2011/12 to 73.0%.
The Referral Service, established in 2003, managed a record 50,613 emergency calls in the metropolitan area during
the year, an increase of more than 5.0 per cent over the previous year. This service was responsible for significantly
reducing demand for emergency ambulance dispatching, thereby increasing the availability of ambulances to
respond to more urgent emergency calls.
The Referral Service was also successfully introduced outside the metropolitan area to the Barwon South West
region (including Geelong). At the same time, preparations were made to increase call-talking capacity prior to
expanding the Service to the rest of the state.
A number of new response units were established during 2012/13 including 4 new 24 hour branches, and
upgrades/additional shifts and peak period units were implemented at 11 other metropolitan and rural locations.
AV continues to work closely with the Department of Health and hospitals to reduce patient transfer time.
Additionally a pilot project to trial a paramedic motorcycle unit in Melbourne’s city centre continues.
Work continued throughout 2012/13 to further consolidate metropolitan and rural operational processes and
systems; an integrated statewide rostering function was implemented.
Non-Emergency Road Services
With just under 340,000 cases, non-emergency caseload declined by 1.0%, following on from a period of strong
growth in the previous two years. A statewide tender for the provision of non-emergency services statewide was
also undertaken during the year.
Air Ambulance
Air Ambulance incidents increased by 3.9% over 2012/13 to 7,359.
Information Management & Communications
In 2012/13, the focus for information systems and communications was on improving existing platforms for key
systems, including developing and implementing a new intranet system, a new business intelligence tool, and
developing an upgrade and a new interface for VACIS which is now Windows based.
Research & Development
Work progressed throughout the year on understanding the epidemiology and outcomes of key patient groups such
as cardiac arrest and major trauma. Additionally, three key randomised controlled trials, RINSE (cooling during CPR),
AVOID (air versus oxygen for STEMI patients), and POLAR (induced hypothermia for head injured patients),
progressed with no complications.
Staff Development
A major program to introduce cultural change was developed during 2012/13. Additionally a new Learning and
Development framework was introduced as well as an implementation strategy.

The Council of Ambulance Authorities 2012-2013 Annual Report 22
Health & Safety
A number of on-going health and safety initiatives continued to be implemented, including a fatigue management
strategy, and a plan to reduce manual handling injuries. In the mental health space, a psychosocial risk management
framework was also agreed and developed, and the SMART program further expanded.
Future Directions 2013-14 With the activity of infrastructural and process consolidation now complete, AV has refocused on developing and
implementing a range of new initiatives to improve services and deal with the key issues it faces.
Our Services
In 2013/14, work will continue to design a new service model in order to provide more appropriate and safe care for
patients whilst optimising the use of existing resources. This increase to our demand management initiatives will
significantly increase our capacity to provide rapid responses to the most urgent cases.
A major program of works is underway. Key deliverables for 2013/14 are:
Statewide expansion of the successful Referral Service beyond Melbourne and the Barwon South West
Regions.
Plan to undertake a high-volume in-field referral trial, whereby attending paramedics would be able to refer
relevant low-acuity patients to more appropriate health providers and care.
Investigate improvements to triage processes and alternative care providers for low-acuity patients,
including further enhancing the relationship with Medicare locals.
In parallel with this work, AV will also implement 16 new government-funded units across the state. Additionally,
processes will continue to be developed to improve ambulance availability, including standardising processes for
paramedics at hospital and opportunities to review the status of crews at hospital. The Ambulance Arrivals Board,
exchanging real-time information between AV and EDs to better manage arrivals and patient flow, will also be
extended to a number of key hospitals.
Our People
Building an inclusive culture is an important focus for AV in 2013/14, with increased engagement, more effective
communication, and increased decision-making ability. Key deliverables for the coming year include:
Implementing Culture Change Working groups.
Implementation and communication of AV agreed Values and Behaviours.
Building a new Reward & Recognition Framework.
Developing and understanding of staff engagement.
Enterprise Agreements are also due this year with both paramedics and non-operational staff.
Programs will also be rolled out to support the professional and ongoing development of our people and leaders. In
2013/14, AV will:
Implement the Operational Frontline Management Model.
Implement targeted Development Programs for Senior Leaders and managers/team leaders.
Complete 360 Degree feedback process for current and future leaders.

The Council of Ambulance Authorities 2012-2013 Annual Report 23
Our Financial Sustainability
AV will continue to work with the Department of Health and Government to ensure it’s funding is financially
sustainable into the future and is better aligned to the revised operating model. At the same time, our analytical and
forecasting capability will be further developed through the Analytics and Reporting Program and a new business
intelligence tool.
In 2013/14, AV will also finalise the tender arrangements for the supply of rotary wing aircraft.
Other
Work will continue on developing VACIS 3.0 in the coming year to a redesigned and updated version. At the same
time, work will commence to install VACIS throughout the non-emergency provider fleet.

The Council of Ambulance Authorities 2012-2013 Annual Report 24
Queensland Ambulance Service
Contact Details
Title: Commissioner
Incumbent: Russell Bowles ASM
Location:
Emergency Services Complex
Cnr Kedron Park and Park Roads
Kedron QLD 4031
Postal Address:
GPO Box 1425
Brisbane QLD 4001
Telephone: +61 7 3635 3271
Facsimile: +61 7 3247 8267
Email: [email protected]
Our Vision and Mission
Blueprint for better healthcare in Queensland
- Health services focused on patients and people
- Empowering the community and our health workforce
- Providing Queenslanders with value in health services
- Investing, innovating and planning for the future
Queensland Public Service Values
The Council of Ambulance Authorities 2012-2013 Annual Report 25
Jurisdiction The Queensland Ambulance Service (QAS) operates under the authority of the Ambulance Service Act 1991. On 1
October 2013, the QAS became a Division of the Department of Health, following Machinery of Government
changes.
The QAS serves over 4.6 million Queenslanders and 162,000 tourists per day across a vast state of 1.73 million
square kilometres, including about 1,000 offshore islands. Queensland is Australia’s most decentralised state and
accounts for 22.5% of Australia’s land mass.
The QAS provides essential emergency medical services including pre-hospital care and related services across
Queensland. The QAS aims to improve the health, safety, and well- being of individuals and the community by
continuing to strive for excellence through innovation.
Services include:
Providing pre-hospital paramedical response services to patients who suffer sudden illness or injury.
Emergency and routine pre-hospital patient care.
Inter-facility ambulance transport.
Planning and coordination of major events, multi-casualty incidents and disasters.
Community services such as community education.
Pre-hospital care research.
The QAS provides its services through 3,878 full-time equivalent employees and approximately 357
volunteers, which includes Ambulance Attendants, Community First Responders and Volunteer Drivers.
The Year in Review On 2 November 2012, the QAS underwent its most significant structural reform process since the organisation was
formed in 1991.
The formation of 16 Local Ambulance Service Networks (LASNs) and the reporting arrangements implemented as
part of this structural reform have been undertaken with the primary goal of ensuring that frontline operations
receive the support they need to deliver effective pre-hospital care and transport services to the Queensland
community.
The ambulance service delivery model is now closely aligned with the Department of Health Hospital and Health
Services (HHS) boundaries and changes focus on enabling local accountability and local solutions to be achieved.
Response Performance In 2012-13, QAS provided services in response to 870,213 incidents across Queensland compared to 833,243
incidents in 2011-12.
For 2012-13, overall demand increased by 4.44% compared to 2011-12. The combined Code 1 and 2 incidents
(emergency) increased by 6.43% with Code 3 and 4 (non-emergency) incidents increasing by 0.46%.
In spite of a growth in demand for ambulance services, fifty percent of Code 1 life threatening incidents were
attended within 8.2 minutes, and ninety percent of Code 1 life threatening incidents were attended in 16.5 minutes
achieving the Queensland Governments Service Delivery Statements targets/estimates of 8.2 minutes and 16.5
minutes respectively.
In 2012-13, QAS employed an additional 60 ambulance officers above attrition.

The Council of Ambulance Authorities 2012-2013 Annual Report 26
State Operations Centres
The QAS manages seven Operations Centres across the State, which are located in Cairns, Townsville,
Rockhampton, Maroochydore, Toowoomba, Brisbane and Southport.
During 2012-13, QAS Operations Centres received 617,729 Triple Zero (000) calls for assistance. The State
Operation Centres answered 90.64 % of Triple Zero (000) calls in less than 10 seconds.
Metropolitan Emergency Department Access Initiative
The Metropolitan Emergency Department Access Initiative (MEDAI) project was established in October 2011 to
identify solutions to ambulance vehicle ramping in Queensland metropolitan hospitals. The primary aim of the
MEDAI project was to improve timely access to emergency care for the people of Queensland. The Minster for
Health, tabled the MEDAI report in Parliament on 2 August 2012. The final report set out 15 recommendations (two
relating to QAS) that aimed to improve the way in which issues in relation to ambulance ramping and access block
are managed across Queensland public hospitals. The MEDAI recommendations pertaining to QAS were
implemented by 1 January 2013. Following MEDAI and other QAS renewal processes, patients are now receiving
hospital care faster and ambulances are being available sooner to respond to the next call for assistance.
Clinical Advances
In 2012-13, QAS implemented the Clinical Support Officer (CSO) Field Audit. These real-time in-field audits of
authentic clinical cases provide a far superior model of clinical support and governance than the previous model, and
allows our clinical support officers to facilitate a more evidence-based clinical support mechanism. Overall the QAS
audits approximately 13% of acute cases attended by ambulance.
A number of clinical advancements to paramedic practice occurred in 2012-13, including:
Introduction of the o_two® Continuous Positive Airway Pressure (CPAP) to Intensive Care Paramedics for
the treatment of acute cardiogenic pulmonary pressure. QAS is the first service in the world to use this
particular type of CPAP, which is smaller, less expensive and uses less oxygen. To date it has had
overwhelmingly good results.
Introduction of the CT-6 femoral traction splint. This is a large investment in updated technology and
brings QAS to the forefront of contemporary pre-hospital long bone fracture management.
Rollout of flight paramedic course which allows our paramedics to be better skilled in critical care and will
prepare them to undertake more cases without the need for medical officers.
Introduction of the Public Hospital Clinical Matrix, which aids paramedics in decision making regarding
appropriate patient disposition.
Introduction of a dedicated centralised Intensive Care Paramedic primary percutaneous coronary
intervention (pPCI) referral line. This recorded telephone line provides ICPs with direct access to any state-
wide pPCI facility by means of a tiered menu system, negating the need for ICPs to maintain the contact
details of individual facilities.
Analgesic practice has been expanded to allow Advanced Care Paramedics to administer IM/IV
fentanyl to adult patients, and Intensive Care Paramedics to administer IV fentanyl to paediatric
patients.
Introduction of finger pulse oximetry to QAS First Responders.
The QAS 24 hour Medical Consultation Line number was changed to a 1300 number, which is now recorded
and available for review, by the Medical Director to enhance consistency and quality of clinical advice
provided to QAS paramedics.
The Council of Ambulance Authorities 2012-2013 Annual Report 27
In 2012-13, QAS continued its rapid trauma response vehicle program, staffed by a QAS Senior Pre-Hospital
Registrar and an Intensive Care Paramedic – trialling new modalities including RSI, pre-hospital ultrasound and
damage control resuscitation with blood products. This program will evolve in 2013-14 to being paramedic
driven, with the physicians moving to a professional development role on selected shifts.
Vehicles
In 2012-13, 130 new and replacement ambulance vehicles were commissioned. Highlights of the 2012-13 build
were ongoing production of the single stretcher Toyota Landcruiser cab chassis with a manufactured patient care
compartment and the Mercedes Sprinter LWB Patient Transport vehicles, which are configured for two stretchers
and five seated patients.
Research
The Clinical Performance and Service Improvement Unit (CPSIU) carries out an expansive work program, providing
an evidence base for QAS clinical practice and operations. The Unit aims to facilitate interaction between industry,
paramedics and academics to develop the pre-hospital profession and the evidence base for pre-hospital care.
Key activities of the CPSIU in 2012-13 include:
Facilitation of QAS participation in an international trial (ATLANTIC) of antiplatelet drug Ticagrelor
(conducted by Astra Zeneca).
Participation in a national study to examine rates of mental health, suicide, drug and alcohol involvement
in patients presenting to ambulance services (Department of Health and Ageing, Turning Point Victoria).
Development and refinement of clinical and system performance indicators to inform continuous clinical
quality improvement.
Undertake a range of analyses to support the significant reform agenda in emergency health service
delivery across Queensland, including new initiatives to effectively manage service demand, patient
distribution, and the growth of lower acuity patient cohorts.
Capital Works
The QAS had 10 major projects listed in the 2012-13 Budget Paper 3, of which three have been completed and
seven are in progress.
Education
The QAS continued its partnerships with five Queensland Universities for the provision of pre- employment
Bachelor of Paramedicine and dual Bachelor of Paramedicine/Bachelor of Nursing degrees. The participating
Universities are Queensland University of Technology (Kelvin Grove Campus), University of Queensland (Ipswich
Campus), University of Sunshine Coast (Sippy Downs Campus), Australian Catholic University (Banyo Campus) and
Central Queensland University (Rockhampton Campus).
Future Directions 2013-14 QAS transition to Queensland Health
On 1 October 2013, following the outcome of the Police and Community Safety Review commissioned by the
Minister for Police and Community Safety, the QAS was transferred to the Queensland Health portfolio as a
discreet Division of the Department of Health.
The transfer recognises the longstanding close positive long term working relationship that exists between QAS
and Queensland Health as partners in identifying a broad range initiatives to improve health service delivery to
Queensland communities including more recently, reducing ambulance ramping and improving timely access to
emergency care.
The Council of Ambulance Authorities 2012-2013 Annual Report 28
Further opportunities also exist as a result of the portfolio change to enhance clinical procedures for paramedics,
access to patient information and to develop a greater understanding of the effect of pre-hospital care on patient
outcomes through the closer health relationship.
Managing Demand for Services
Demand for emergency ambulance services continues to grow, particularly in the south- eastern corner of
the state, which includes some of the nation’s fastest growing areas. Queensland’s population growth rate
remains higher than the national average and the highest of all Australian states.
Population growth and ageing continue to be the main drivers of demand for health services. Over the last nine
years, the growth in Code 1 and Code 2 incidents has averaged 6.4% annually.
In order to meet future challenges, QAS will employ an additional 60 ambulance officers across the state in 2013-
14, bringing the total staff increase to 802 for the period 2007-08 to 2013-14.
Research
The Clinical Performance and Service Improvement Unit is committed to the conduct of high quality research, and
detailed analysis, which supports and informs the ongoing quality improvement strategies of QAS in all aspects of
its operational and strategic development activities. Planned projects for the coming year include the pilot and
evaluation of targeted strategies to effectively and efficiently deliver care to both lower and high acuity patients,
an examination of the mortality and morbidity of serious trauma patients transferred within the Queensland
trauma system, and an evaluation of the feasibility of Advanced Care Paramedic-led thrombolysis in regional
areas.
Capital Works
Eleven replacement, redeveloped or refurbished ambulance facilities will be commenced, progressed or
completed in 2013-14. In addition, continuation of the design and redevelopment of the Spring Hill complex
and ambulance station.
Vehicles
The QAS will commission 155 new or replacement ambulance vehicles in 2013-14 to ensure the ambulance fleet is
effectively maintained to meet increasing community needs.

The Council of Ambulance Authorities 2012-2013 Annual Report 29
SA Ambulance Service
Contact Details
Title: Chief Executive Officer
Incumbent:
Ray Creen (to 15 March 2013)
Aaron Chia (acting from 15 March to 28 July 2013)
Robert Morton (commenced 29 July 2013)
Location:
216 Greenhill Road Eastwood SA 5063
Postal Address:
GPO Box 3 Adelaide SA 5001
Telephone: +61 8 8274 0401
Facsimile: +61 8 8272 9232
Our Vision, Mission and Values
Our Vision
The community of South Australia is secure in the quality of service provided by their ambulance service.
Our Mission
To save l ives, reduce suffer ing and enhance quality of life, through the provision of accessible and responsive
quality patient care and transport.
Our Values
We value our reputation and professional profile and these values influence the way our business is conducted
and how our organisation is managed.
We do this with accountability, integrity, and innovation. We value the passion, effectiveness, and
potential of our people, and their need to feel valued and respected.

The Council of Ambulance Authorities 2012-2013 Annual Report 30
Jurisdiction Our purpose and objectives
SA Ambulance Service (SAAS) is the principal provider of emergency ambulance services in South Australia. This
provision of ambulance service comprises:
Triple zero (000) call receipt and patient triage.
Pre-hospital emergency patient care transport.
Non‐emergency patient care and transport.
Emergency and major event management.
MedSTAR emergency medical retrieval services.
To complement the provision of ambulance services, SAAS also:
Coordinates the State Rescue Helicopter Service.
Manages the Royal Flying Doctor (RFDS) contract for fixed wing inter-hospital air transfers.
Collaborates with Flinders University to deliver the Bachelor of Paramedic Science, the Master of
Health Sciences (Pre‐Hospital and Emergency Care) and the Masters of Retrieval Practitioner program.
Collaborates with James Cook University to deliver the Post Graduate Certificate in Aeromedical
Retrieval and Masters in Public Health degree.
Operates as a registered training organisation providing in-house, nationally accredited training to its staff.
Promotes and administers the Ambulance Cover subscription scheme.
Promotes and manages Call Direct - a 24‐hour personal monitoring emergency service.
Legislation
SAAS is constituted by the Health Care Act 2008 under which it is an identifiable incorporated entity. In
accordance with the Act, SAAS is managed by a Chief Executive Officer, who reports to the Chief Executive of
SA Health.
Workforce
SAAS has a total number of 1,340 personnel, which includes patient services paid employees and support
services paid employees. In addition to this, there are 1503 volunteers.
Reporting relationships
The Chief Executive of SA Health is responsible for the administration of SAAS and has appointed and
delegated appropriate managerial powers to the Chief Executive Officer of SAAS.
At a corporate level, SAAS ultimately reports through SA Health to the Minister for Health and Ageing. However,
it continues to maintain its status as a separate entity for the purposes of reporting to the Department of Treasury
and Finance.
For operational matters, SAAS has a close relationship with the System Performance Division of SA Health.
Issues that have an impact on the operations of the health system are therefore reported through to the chief
executive of SA Health via the Deputy Chief Executive, Systems Performance of SA Health.
The Council of Ambulance Authorities 2012-2013 Annual Report 31
The Year in Review
Highlights for 2012 - 13 include:
Our people
Implementation of a new operational safety training program as part of induction and professional
development education schedules for all operational staff. The program provides theoretical and practical
training to equip staff with appropriate responses when confronted by aggressive or violent patients
and/or bystanders.
Achievement of the best work health and safety (WH&S) performance across the SA Health portfolio for
the second year in a row - SAAS achieved 11 out of the 13 safety performance targets.
Successful completion of SAAS's Aboriginal Traineeship Program by one trainee, resulting in a Certificate III
in Business.
Recognition of SAAS staff achievements at the annual Graduation and Presentation Ceremony - 289 staff
members/teams were recognised and four staff members were honoured with the prestigious Ambulance
Service Medal.
Contribution to the development and launch of an innovative vehicle crash simulator, as well as simulator
training rooms. Both greatly enhance SAAS's educational facilities and program.
Leadership
The State Leadership Conference provided managers from all organisational levels the opportunity to
review and contribute to the development of SAAS's next strategic plan.
SAAS was awarded the Educational Performance Award (part of the CAA Australasian Ambulance Awards
for Excellence) for developing the ‘eBooks for Rural Volunteer Ambulance Recruits' project.
Service delivery
Launch of the MedSTAR Kids ambulance by the Minister for Health and Ageing to improve service delivery
to neonatal and paediatric patients.
Installation and activation in April 2013 of new mobile data terminals (MDTs) into operational vehicles
across the organisation.
Following the success of SAAS’s Extended Care Paramedic (ECP) Program in the metropolitan area, SAAS
commenced a trial of this in the regional areas of Mount Gambier and Port Lincoln.
Implementation of the 'Lightfoot' trial in the southern metropolitan area (title based on the name of the
external specialist consultancy employed by SAAS) to address issues around data availability, resourcing,
utilisation and operational performance. The trial aimed to ensure the application of best-practice
performance management.
Successes included:
Improvement in Priority 1 response times.
Reduced case-work load for area clinical team leaders.
Reduction in non-emergency inter-hospital transfers.
Ambulance crew call-on-air times brought close to the benchmark.
Answering more than 90 per cent of the total of 177 752 triple zero calls received within 10 seconds.
Establishment of the Upper Murray Mallee Volunteer Regional Response Team (UMMVRT) to assist with
volunteer roster coverage for the Lameroo, Pinnaroo, Swan Reach and Morgan teams.
A 310 per cent increase in Special Operations Team (SOT) responses to incidents.
The Council of Ambulance Authorities 2012-2013 Annual Report 32
Community
SAAS was involved in the planning of over 427 public events. SAAS personnel attended and supported 84
of these.
Establishment of a second Country Regional Response Team (CRRT) - this increased the CRRT numbers by
40.5 per cent. The CRRT are a group of volunteers based in the metropolitan area who provide regional
areas with short-notice roster coverage across the State when required.
During National Volunteer Week, 68 events were held across the State to recognise the contribution of
SAAS volunteers for their local regional communities.
All of these activities occurred while SAAS experienced a 2.74 per cent overall increase in the number of
cases compared to the previous year.
Of the total incidents, 129 142 were emergency cases (priorities 1 and 2), 73 725 were urgent cases
(priorities 3, 4 and 5) and 59 687 were non-urgent/routine (priorities 6, 7 and 8).

The Council of Ambulance Authorities 2012-2013 Annual Report 33
Northern Territory St John Ambulance Australia (NT) Inc
Contact Details
Title: Chief Executive Officer
Incumbent: Ross Coburn
Location:
50 Dripstone Road
Casuarina NT 0810
Postal Address:
PO Box 40221
Casuarina NT 0811
Telephone: +61 8 8922 6201
Facsimile: +61 8 8922 6266
Email: [email protected]
Our Vision and Mission
VISION
The vision for the Service is to promote health and well being to all Territorians and to form an integral part of
the total Health delivery continuum. A key objective is to make ‘First Aid a part of every Territorian’s Life’.
MISSION
To be the leading provider of first aid, ambulance, and related health services in the Northern Territory.
Jurisdiction St John Ambulance Australia (NT) Inc. is a not-for-profit organisation that operates under contract to the NT
Government to provide the Ambulance Service throughout the Northern Territory. The organisation comprises
of essentially two separate entities – one delivering contracted Ambulance and associated services – and the
other operating the traditional St John volunteer services, first aid training, first aid kit sales and contract
paramedical services and vehicle fit-out activities.
Territorians form approximately 1% of the Nation’s population but currently have the highest growth
percentages in population with 30% of the population being indigenous. The Northern Territory sits in the
central north of Australia, between Western Australia and Queensland, directly above South Australia. It covers
an area in excess of 2.16 million square kilometres and the total population – around 235,000 – tends to be
concentrated around two major centres – Darwin (including Palmerston) and Alice Springs.
There are many challenges in the NT with the expanse we face, the large indigenous population and the average
age being 31 years, the approach to Ambulance Services is certainly unique and reflects an understanding of
the cultural extremities, and activities of the young, which exist.
The Council of Ambulance Authorities 2012-2013 Annual Report 34
The Year in Review Operations
Activity and Performance
The 2012-2013 year saw an increase in workload across the Territory. Paramedics transported 36,578 patients, (up
1.9%) with ambulance vehicles travelling 1,123,656km an increase of 11.8% on the previous year. The increase in
kilometres travelled versus patient kilometres (402695, an increase of 3.6%) can be attributed to the introduction of
the ECP program and on-road supervision. This has alleviated the presentations at hospital, with the ECP’s ability to
ANR patients who would normally require transport.
The 000 call centres received 44,985 calls in the 2012-2013 year.
Key Achievements
St John NT was again a proud finalist in the Northern Territory Training Awards for the second year in a row, against
some very strong competition.
We were extremely honored to have three members nominated in the local round of the Pride of Australia medal
awards; Warren Purse - ICP; Anthony Kleidon - Volunteer; and Ben Hankin - Cadet. Congratulations to the three
nominees.
We invested a significant amount of time in updating our website and in February launched our new look, with a
measurable increase in traffic to the site.
The NT was host to the St John Ambulance National Member Convention in May, which saw delegates from around
the country attend a well presented and informative event.
Education
The Paramedic Training College continues to work with Edith Cowan University (ECU) to deliver the Paramedic
Graduate Program, whilst transitioning the last of our in-house trained students.
The HWA Extended Care Paramedic (ECP) Program is in full play and the results of reductions in emergency
department admissions growth is clearly evident. With the issue of non-funding for this program post 30 June 2014
by HWA and at a Territory level, the benefits now being achieved could potentially be lost.
Communications
Siren implementation was completed mid-year, with trials undertaken in July. With the commencement of this
platform, we are now in a position to report and track accurate and individual clinical data.
The upgrade of the Alice Springs Communications centre, now means that the ICAD system, is in use in both the
Northern and Southern regions, allowing for implementation of a virtual communications system across the whole of
the Territory.
Clinical Advances
Our education focus has increased emphasis on underpinning knowledge, supporting evidence based practice. To
support this move, we have introduced a Clinical Practice Manual, comprising of 3 elements: Drug Therapy Protocol,
Clinical Practice, Guidelines, Clinical Practice Procedures.
To improve our Clinical Governance structure, we introduced Annual photographic Authority to Practice cards for all
levels of operational staff.
Workforce
Staffing numbers have remained static over the past 12 months, with little turnover of operational staff.
There has been a significant number of staff presented with awards for significant years of service. We
acknowledged 17 members who achieved 5 years of service, 6 members with 10 years of service and 1 member
with 15 years of service.
The Council of Ambulance Authorities 2012-2013 Annual Report 35
We have recently signed off on a community engagement program with Bendigo Bank, which aims to place AED’s
into the community. It is envisaged that by the end of 2013, an additional 8 units will be placed around the Darwin
Community.
Community Education
In the past 12 months, there has been significant growth in the Community Education program, with the addition of
a dedicated community educator and vehicle for the Central Australia region. Our aim is to reach 5000 students over
the next 12 months, upholding our value of “making first aid a part of all Territorians’ lives”.
Future Directions 2013-14 In the second half of 2013, we are aiming to release a personal issue Amicroe Touch TAB S 7” tablet, to all
operational ambulance staff, which will enable the staff to have immediate access to the Clinical Practice Manual,
issued at the start of the year.
The Siren Electronic case card (ePCR) system will be operational in all centres and vehicles prior to Christmas.
Data from the ECP program will be fully accessible by the end of 2013. We believe this will confirm what has already
been indicated in that the program has been an effective project in the Darwin area.
The Enterprise Agreement discussions for the 1 July 13-commencement date are still ongoing with a number of
issues to be resolved prior to the year-end.
With the recent appointment in the Marketing/PR area of the business, a significant positive profile building exercise
centered around the work of Paramedics and Community assistance prior to the arrival of a paramedic, will be
embarked upon.
The Council of Ambulance Authorities 2012-2013 Annual Report 36
St John Ambulance WA Inc
Contact Details
Title: Chief Executive Officer
Incumbent: Tony Ahern
Location:
209 Great Eastern Hwy
Belmont WA 6104
Postal Address:
PO Box 183
Belmont WA 6984
Telephone: +61 8 9334 1222
Facsimile : +61 8 9277 6662
Our Purpose
Our purpose for being in Western Australia is for the unique contribution that we make in serving humanity and developing resilient communities in this State. We achieve our purpose when we make first aid a part of everyone’s life, and deliver high quality, cost-effective ambulance services to the people of Western Australia.
Jurisdiction Responsibility for providing ambulance services across 2.5 million square miles – the largest area in the world
covered by a single ambulance service – comes with its challenges, but also opportunities: to innovate, reform, and
work more effectively with partners in healthcare. For St John Ambulance in Western Australia, 2012/13 was a year
of considerable achievement across all areas of operation, providing a solid platform for the negotiation of a future
long-term contract with State Government, and proving the benefits of an integrated, streamlined, and employee-
engaged approach to pre-hospital care.
The Year in Review Activity and response times
Overall ambulance activity increased by over 12,000 cases (a rise of over 5%) from the previous financial year, with
our metropolitan and country crews responding to 194,445 and 57,772 cases respectively. Despite this increase in
activity, our ability to meet response time targets also increased across all categories (emergency, urgent, and non-
urgent). On average, over 93% of all cases were responded to within the required time target, compared to the
previous year’s average of 90%.
Better response times have been achieved through an increase in standby capacity, which is measured as that
percentage of the total number of crews, which are able to respond to a call-out at any given time. In 2012/13, our
standby capacity was 54.6%, an increase of 1.5% on last financial year’s figure of 53.5%.
The Council of Ambulance Authorities 2012-2013 Annual Report 37
Resources
Underpinning our improved capacity and response times was the increased resources funded through the
Department of Health’s contract. Our fleet of ambulance vehicles has increased by 8 to 466 and our full time (paid)
staff establishment has grown by 152 to 1286. Much of this increase is attributable to an increase in the number of
paid metropolitan staff who work in operational or operational-support roles. Volunteer numbers have remained
constant and during the year, they contributed over three million hours of voluntary service to the community
through St John.
Alleviating pressure on public health system
A great success for the service this year has been in establishing, in partnership with other healthcare providers,
alternative pathways for patients whose conditions are such that presentation at an Emergency Department is not
essential. Together, these pathways help alleviate the pressure on the State’s public health system and, according to
our estimates, have saved the government hundreds of thousands of dollars in public healthcare expenses.
Ambulance Surge Capacity Unit (ASCU)
Located in a ward at Hollywood Private Hospital, and launched in May as a trial and operational when ramping
occurred outside Perth’s emergency departments, ASCU accommodated up to 15 low acuity patients. Rather than
being ramped, patients could be assessed and cared for by St John employed medical staff (including a paramedic,
GP, and RN) in a safe, more comfortable, hospital environment, and then either diverted to an alternative care
provider, admitted into a private hospital, or transported back to the ED when ramping had eased. In May and June
2013, 221 patients were admitted to ASCU, of whom 30% were diverted to an alternative care provider.
Importantly, our paramedic crews were able to “reclaim” several hundred hours on the road - a contributing factor
in our higher standby capacity and improved response times.
Silver Chain Priority Response Assessment (PRA)
Paramedics who attend patients with non-urgent symptoms can refer those patients to Silver Chain’s PRA service,
which sees a Registered Nurse visit the patient’s home within four hours to provide low-level treatment and
monitoring. Of the over, 150 cases referred to PRA within the reporting period, only a small percentage have
required eventual admission to hospital.
Salvation Army’s Bridge House
Paramedics who attend patients experiencing the effects of drugs and alcohol, but who do not require treatment at
an Emergency Department, can transport those patients to the Salvation Army’s Bridge House. 48 patients were
transported to this facility in 2012/13.
Medicare Local
Towards the end of the reporting period, St John entered into discussions with Medicare Local (Perth Central & East
Metro) to establish a GP-referral system, where low acuity patients can be referred to a GP rather than be admitted
to an ED. This pathway is expected to become operational during the 2013/14 Financial Year.
Technology driven performance
Embracing technology and adapting it to suit operational environments is essential if performance is to become
optimal. Achievements in 2012/13 have cut across operational and clinical areas, and have included:
The development of a ‘Metropolitan Operations Dashboard’ – a screen-sized data- board providing area
managers a real time overview of response time performance, crew availability, and emergency department
capacity.
The rollout of Electronic Patient Care Records across the volunteer service (EPCR having previously been
rolled out to all metro paramedics), replacing the paper-based system. Patient care records are what on-

The Council of Ambulance Authorities 2012-2013 Annual Report 38
road staff use to record patient and treatment information; this information can also be viewed by
the hospitals, as the patient is en route.
Rollout of the MRX HeartStart defibrillator across all metropolitan ambulances and in career
(country) sub-centres. The MRX provides 12 lead ECH capability and protocols.
Regionalisation
The Country Ambulance Service entered its third of year of the regionalisation program, in 2012/13,
with the focus of this program largely being on decentralisation and strengthening support for locally
based crews. Throughout the year, an additional four community paramedics (CPs) were employed in
country WA, bringing the total to 20; these CPs are based at one centre but spend much time visiting
other centres within the same region and supporting local volunteer training and recruitment efforts and
better integration with the local health system. In addition to community paramedics, another five
ambulance paramedics were also employed, bringing the total number of paid paramedics in the country
to 74, with an additional complement of six paramedics expected to be employed in Karratha,
Kununurra and Busselton during 2013/14.
Staff engagement
Our staff and volunteers played a key role in the task of deciding the strategies needed to achieve the
organisation’s vision as to where it wants to be by 2017. Staff have also been empowered to take
responsibility for continual operational improvement through attendance at dedicated workshops during
which data is examined and analysed to see where performance might be improved. If issues have been
identified through the standard analytical and reporting process, then a review team engages in team-
based problem solving to initiate, implement, and monitor the effectiveness of solutions.
First aid
St John Ambulance WA trained over 190,226 students in first aid throughout the financial year – a
12.3% increase on the previous year – and in doing so became the first organisation in Australia to
teach over 190,000 people in a year; a strong demonstration of the organisation’s aim to make first aid a
part of every Western Australian’s life, and to build more resilient, first-aid aware communities.
Future Directions 2013-14
2012/13 marked the third year of a four-year contract between St John Ambulance WA and the WA
Government to provide the state’s ambulance service. During 2013/14, both parties (SJA & DoH) will be
working on a long- t e r m contract for the period beginning July 2014. Excellent achievements in
2012/13 combined with a record of providing a very cost-effective service to government position us well
to secure a favourable outcome, although we acknowledge that competing pressures on government
finances will present challenges for both parties.
We will be increasing our efforts to develop alternative pathways for low-acuity patients, and to work
collaboratively with stakeholders to achieve this; to continue promoting our first aid training services so
that the number of students who are taught first aid, rises even more; to increase our footprint and
market positioned in industrial health; and to establish our Patient Transfers Service as a strong, stand-
alone, commercially oriented business unit completely separate from the Emergency Ambulance Service.

The Council of Ambulance Authorities 2012-2013 Annual Report 39
St John Ambulance New Zealand
Contact Details
Title: Chief Executive Officer
Incumbent: Peter Bradley (from 24 September 2012)
Location:
St John National Headquarters
2 Harrison Road
Mt Wellington
Auckland New Zealand
Postal Address:
Private Bag 14902
Auckland 1741
New Zealand
Telephone: +64 9 579 1015
Email: [email protected]
Our Vision and Mission
VISION
Enhanced health and well-being for all New Zealanders
MISSION
The mission of St John is to prevent and relieve sickness and injury, and act to enhance the health and
well-being of all people throughout New Zealand
Jurisdiction St John has provided ambulance services in New Zealand since 1885. St John is a community-based
charitable organisation with a national headquarters in Auckland and a national trust board, which
delegates responsibility for oversight of service delivery to three regional trust boards. The organisation
comprises more than 17,600 volunteer and paid staff.
St John provides emergency ambulance services for nearly 90% of the country’s population and to 97%
of New Zealand’s geographical area. Ambulance services in Wellington and the Wairarapa are provided
by Wellington Free Ambulance. St John offers other services in these regions (first aid training, medical
alarms, event medical services, and Youth programmes).

The Council of Ambulance Authorities 2012-2013 Annual Report 40
The Year in Review –
Changing our Service to meet the needs of the future.
St John staff treated over 415,000 patients in the last year. The volume of 111 calls for an ambulance
was up 3.8% on last year to 380,785.
In the changing and challenging New Zealand healthcare environment, we have continued over the last
12 months to focus on adapting our operating model to anticipate and accommodate those changes
and the increasing demand for our services over the next five years.
In response to a growing, ageing population, with more chronic health needs we have been creating
models and initiatives that are better for our patients, increase our effectiveness and our efficiency, and
that ultimately are better for the wider New Zealand health system.
We are ensuring our resources are directed at providing the right care at the right time – with an
increasing focus on taking care to people, rather than people to care. We have looked in particular at
the best ways to respond to low acuity 111 calls for an ambulance.
Future Focus
In support of the five year integrated business plan for St John, has been the development of an
Operations Plan. This has been a ‘bottom up’ development – based on ideas from St John staff and
health partners and focused on addressing the challenges we face, delivering a good value, sustainable,
service delivery model and improving the quality and safety of our care and services.
The Operations Plan details key initiatives and planning for a new service delivery model; several
initiatives began in 2012/13.
Key Initiative – Right Care, Right Time
In August 2012 we introduced a new response system for ambulance services (St John and Wellington
Free Ambulance), to ensure we focus on connecting patients to the right care at the right time. Since its
introduction we have seen a significant reduction in the time it takes us to get to an urban immediately
life threatening (cardiac / respiratory arrest) incident.
We receive over 1,000 emergency 111 calls for ambulance every day. We used to respond to
approximately two-thirds of those as immediately life threatening (i.e. sending an ambulance, lights and
sirens). Yet up to 80% of these can be later diagnosed as mid to low acuity.
The motivator for the change to the new response system was to enable us to better triage the
incoming calls to our Communication Centres and our response to incidents – focussing on those
incidents where getting to the patient faster will make a difference. It has assisted us in identifying
those incidents where it may be better to redirect a patient to other parts of the health system.
With the new response system the terms Priority 1, 2, 3 are no longer used when responding, replaced
by a five colour coded response system (purple, red, orange, green and grey) based on international
best practice.
The new response system has produced better outcomes in the community, particularly for high acuity
patients. Since August 201 nationally we have achieved a 10.3% reduction in the time it takes to get to
The Council of Ambulance Authorities 2012-2013 Annual Report 41
an urban purple incident (immediately life threatening (cardiac / respiratory arrest)). This is now
averaging 6 minutes and 7 seconds.
Key Initiative – Sierra Cars
To help meet the challenge of demand, we have looked at all aspects of how we can best deliver
unscheduled care to match patient needs. Our goal is to use our expertise to have more New Zealanders
treated in their homes and communities where this is appropriate and right for the patient.
In Auckland, Hamilton and Christchurch we trialled single crewed vehicles to attend low acuity calls that
have a high probability of resulting in non-transport to an ED – freeing up resources to focus on life
threatening emergency incidents. It is called a “sierra” car because of the Communication Centre call
sign given to them.
Since the introduction of the sierra cars in January 2013, they have proven to be an effective alternative
care option and will continue in Auckland and Christchurch, with some adjustments being made to
ensure we are running them as efficiently as possible.
Key Initiative – Clinical Telephone Advice
In October 2012 we worked with our Canterbury (South Island) health partners to launch Clinical
Telephone Advice (CTA). This is a process where a clinician takes an incident from when someone has
called 111 for an ambulance, that has been triaged as not serious or immediately life threatening (i.e.
low acuity) and re-triages the patient by gathering additional information to ensure the patient gets the
most appropriate care, via the most appropriate pathway. That may or may not involve sending an
ambulance.
The objectives are to improve patient outcomes by providing an enhanced secondary clinical triage
service, to free up St John resources to respond effectively to life threatening priority calls, and gives us
the ability to link lower acuity patients to care that’s most appropriate for them – which is not always an
ED.
The pilot has a resolution rate of around 3% of eligible (i.e. lower acuity) calls managed through
telephone based triage and advice. Overall, we believe that 9% of our total incidents can be managed
through CTA.
Key Initiative – Demand Resource Profiling
Over the last 12 months we have completed a detailed analysis of every district St John operates in
nationwide, in order to understand any gaps between the level of patient demand and the current
resources available in that area. The objective being that we have the right resources at the right place
at the right time to best meet our patient demand.
At 2012/13 year end, we have a better understanding of the level of demand for emergency ambulance
service (EAS) transport, EAS non-transport and patient transfer service (PTS) and we are able to match
the resource type to the demand type.
With the demand-resource profile recommendations we expect be able to improve/ increase the
efficiency of our responses e.g. we expect to respond to 4,400 more high acuity patients (with life
threatening symptoms) a year within 8 minutes in urban areas.

The Council of Ambulance Authorities 2012-2013 Annual Report 42
Key Initiative – Leading Safe and Effective Services
To ensure we have a fit for purpose, future focused management structure to allow us to adapt to meet
our changing environment, a review of Operations Team Leader, Team Manager and Rural Support
Officer roles was managed in 2012/13. The result was a new structure aimed to ensure the right roles
with the right people, that we have managers with the right skills with clear responsibilities and that
teams are well led and motivated to deliver safe and effective clinical services.
The key change was the introduction of 41 new Territory Manager roles. Overall there was an increase
of 14 additional first line staff. We also changed Operations senior management structure – to give
more support to the Operations Director.
Key Initiatives – Electronic Patient Report Forms (EPRF)
This transformational project kicked off in 2012/13. ePRFs will improve the quality and safety of our
care and services and patients’ experiences – because we’ll have clear information that we can link up
with other health providers and rich information which we can share with Health and use to inform and
improve our services.
St John ambulance officers currently manually fill in around 2 million pages of paper patient report
forms each year. The ePRF project will see these paper forms replaced with electronic records
completed on a portable tablet device. And that electronic record can be shared with health partners
(GPs, DHBs) to help with the treatment of patients.
The rollout of electronic patient report forms will be phased and is due to start 1 June 2014 and be
completed by June 2015.
Ambulances Communication Centres
In the last year Telecom directed 1.16 million 111 calls to New Zealand’s three emergency agencies. Of
those calls 380,785 (33%) were 111 emergency calls for an ambulance. This is a 3.8% increase on the
previous year.
In 2012, we began key projects to ensure the critical systems and technologies we use to in our frontline
responses are fit for purpose, robust and up to date. In 2013/14, we will complete the upgrade of our
computer aided dispatch (CAD) system and the replacement of radio control terminals in the
Communication Centres.
In another significant project, from April 2014 we will start to equip each ambulance and operational
vehicle with a new mobile data terminal (MDT). Staff use the MDT to communicate their status during a
response and whether they’re available or not to accept jobs; it provides location information to the
CAD system and critical data for us to manage our service.
Current Performance – Response Times
St John has nine contracted ambulance response time targets, agreed with the Ministry of Health and
with ACC and in line with New Zealand ambulance standards.
Compared to the 2011/12 financial year, three of the previously missed targets in urban and rural were
achieved, despite increasing levels of demand.
The Council of Ambulance Authorities 2012-2013 Annual Report 43
Embedding a Performance and Improvement Culture
Over the last 12 months, we have continued to reinforce that all Operations staff have a role to play in
improving performance. This has been reflected through the ‘IdeAs’ process where staff have
continued to tell us ideas to improve our operation – over the last 12 month 410 ideas have come
through and 78 have been implemented. We have also achieved this by setting targets nationally that
we need to achieve, and through the use of storyboarding and good analytical data to work on the areas
that make a real difference to patient outcomes and performance.
Clinical Focus
In July 2013, St John welcomed Norma Lane to the new role of Clinical and Community Programmes
Director. Norma is focused on setting out the clinical strategy for the next five years. That focus is on
delivering a suite of clinical key performance indicators that will expand on our current cardiac arrest
data/return of spontaneous circulation (ROSC), to capture clinical outcomes and care given in the areas
of STEMI (ST segment elevation myocardial infarction), stroke, diabetes, asthma and pain management.
This will influence our education and training programme.
Future Directions 2013-14 We have identified what we think are the key components of the new service delivery model for
St John and now need to work with whole of Health to implement it. The fundamental issue is looking at
what we can do differently to manage low acuity patients.
We can treat more people at home. When we do transport, we can look at options other than just
transport to an ED. We need to work with Health to identify what will make a difference – for all of us.
Another key focus for 2013/14 will be working with Health on demand management initiatives, looking
in particular at how best to manage individuals who call us often, chronic obstructive pulmonary disease
(COPD) patients and high risk falls patients. We will also continue supporting appropriate public health
campaigns like blood pressure awareness week, men’s health week, and immunisation programmes, to
generally improve the health of the population.
Over the next 12 months, we will be implementing the resourcing plans resulting from our demand
profile work. We will also be focussing on full crewing and on the need for more frontline resource – in
Auckland and Christchurch in particular.

The Council of Ambulance Authorities 2012-2013 Annual Report 44
Wellington Free Ambulance
Contact Details
Title: Chief Executive
Incumbent: Diana Crossan
Location:
Wellington Free Ambulance Headquarters
19 Davis Street
Wellington City New Zealand
Postal address:
PO Box 601
Wellington
Telephone: + 64 4 499 9909
Facsimile: + 64 4 499 3777
Our Vision and Mission
Our Goal is to provide:
World-class free paramedic care for the people of greater Wellington and Wairarapa
Our Strategic Intentions are to:
Be a recognised key player in the New Zealand Sector
Be a high profile, dynamic, sustainable organization
Provide leading edge patient care
Be a great place to work
We value:
Passion Openness
Caring
Integrity
Learning – strive for excellence
The Council of Ambulance Authorities 2012-2013 Annual Report 45
Jurisdiction Wellington Free Ambulance serves the people of Greater Wellington and the Wairarapa and is the only
free emergency ambulance service in New Zealand.
Throughout the year we have provided the high-quality service that the people of our region have come
to expect. We answered close to 75,000 calls for help with 5,500 calls in the Wairarapa. Wellington
Free’s patients reported an overall satisfaction rating of 99%2 satisfied or very satisfied, based on their
experience of our service.
We are proud to play a vital role in the communities in which we work and are excited about developing
our model of care to reflect the changing needs of all people across our region.
The Year in Review
During the 2012/13 year, WFA achieved a number of key objectives in order to help achieve its
strategic goals:
WFA Board appointed a new chief executive, Diana Crossan.
The establishment of a Clinical support desk introduced paramedics into communications centres early
in the year. The immediate provision of clinical advice and support to despatchers and call takers, and to
road staff when needed, has further strengthened the delivery of care to our patients and helps create
more positive patient outcomes.
In New Zealand, a new emergency response system was introduced across the ambulance sector on the
15th of August. Emergency calls are now prioritised using a colour coded response system. The changes
help better differentiate low acuity incidents from time critical and life threatening incidents. The
system also enhances our ability to make appropriate decisions, including using secondary triage.
Secondary Triage is used internationally to help meet the needs of patients who do not have an
immediate or life threatening emergency. When a paramedic or registered nurse advises a patient by
phone this is referred to as a ‘hear and treat’ model. A see and treat’ model is when a paramedic and
ambulance physically attend a patient. Wellington Free participated in a pilot to trial secondary triage to
understand how the model might look like for us. We found that the benefits included reducing
inconvenience to our patients who didn’t need to go to hospital as well as more effective use of our
resources. It is remarkable to consider that over the year around over 2,000 people were helped
without the need to send an ambulance, which could then be called on for a much needed emergency.
These learnings enable us to transition alternative management of low-acuity work into our day-to-day
business. The overall value of evolving our services in this way is that from the very first interaction
with us, our patients can expect efficient and effective patient focused service delivery.
Our involvement with regional and national health organisations across the broader health sector is
crucial. An ambulance service relies on positive interactions with a range of providers and we can add
value through inputting into the future shape of integrated community based medicine. In this regard,
our expertise has been recognised across a range of clinical areas with five papers published in
academic journals this year. Topics have included ambulance triage at major events, extended care
paramedicine and resuscitation.
2 Council of Ambulance Authorities Patient Satisfaction Survey 2013. 2 August, 2013. Ehrenberg-Bass.University of South Australia.

The Council of Ambulance Authorities 2012-2013 Annual Report 46
Comparative Data 2012-2013
The following section includes data collected for the financial year 2012-13. Data is presented in
descending order based on population served by each service.
Please note the financial results for Australian Services have been adjusted by the Australian Bureau of
Statistics (ABS) gross domestic product (GDP) price deflator where appropriate. Therefore financial
results relating to previous years may not appear as first published.
The CAA would like to thank the Productivity Commission for assistance in producing the tables and
associated footnotes for Australian Services in this section.
Benchmarking information for Australian Services is published annually in the Report on Government
Services and further information regarding annual reports can be found at www.pc.gov.au
For further information regarding definitions, please refer to the CAA data dictionary which can be
found at www.caa.net.au
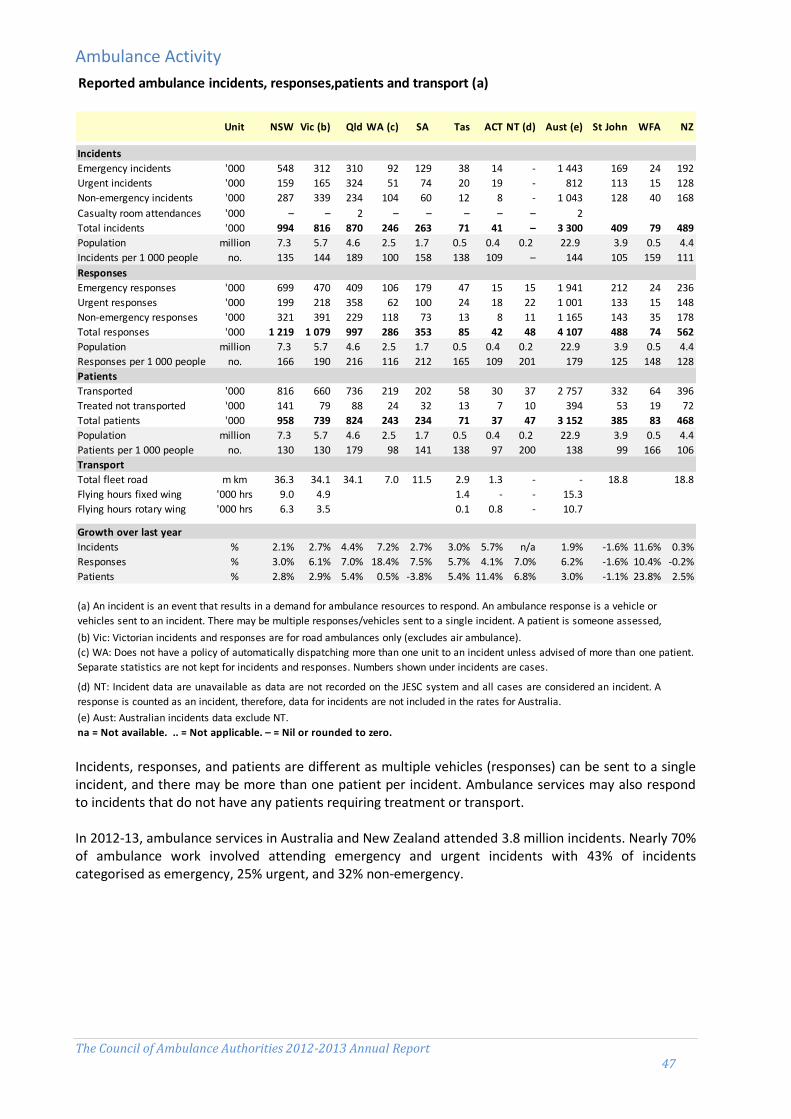
The Council of Ambulance Authorities 2012-2013 Annual Report 47
Ambulance Activity
Incidents, responses, and patients are different as multiple vehicles (responses) can be sent to a single incident, and there may be more than one patient per incident. Ambulance services may also respond to incidents that do not have any patients requiring treatment or transport. In 2012-13, ambulance services in Australia and New Zealand attended 3.8 million incidents. Nearly 70% of ambulance work involved attending emergency and urgent incidents with 43% of incidents categorised as emergency, 25% urgent, and 32% non-emergency.
Reported ambulance incidents, responses,patients and transport (a)
Unit NSW Vic (b) Qld WA (c) SA Tas ACT NT (d) Aust (e) St John WFA NZ
Incidents
Emergency incidents '000 548 312 310 92 129 38 14 - 1 443 169 24 192
Urgent incidents '000 159 165 324 51 74 20 19 - 812 113 15 128
Non-emergency incidents '000 287 339 234 104 60 12 8 - 1 043 128 40 168
Casualty room attendances '000 – – 2 – – – – – 2
Total incidents '000 994 816 870 246 263 71 41 – 3 300 409 79 489
Population million 7.3 5.7 4.6 2.5 1.7 0.5 0.4 0.2 22.9 3.9 0.5 4.4
Incidents per 1 000 people no. 135 144 189 100 158 138 109 – 144 105 159 111
Responses
Emergency responses '000 699 470 409 106 179 47 15 15 1 941 212 24 236
Urgent responses '000 199 218 358 62 100 24 18 22 1 001 133 15 148
Non-emergency responses '000 321 391 229 118 73 13 8 11 1 165 143 35 178
Total responses '000 1 219 1 079 997 286 353 85 42 48 4 107 488 74 562
Population million 7.3 5.7 4.6 2.5 1.7 0.5 0.4 0.2 22.9 3.9 0.5 4.4
Responses per 1 000 people no. 166 190 216 116 212 165 109 201 179 125 148 128
Patients
Transported '000 816 660 736 219 202 58 30 37 2 757 332 64 396
Treated not transported '000 141 79 88 24 32 13 7 10 394 53 19 72
Total patients '000 958 739 824 243 234 71 37 47 3 152 385 83 468
Population million 7.3 5.7 4.6 2.5 1.7 0.5 0.4 0.2 22.9 3.9 0.5 4.4
Patients per 1 000 people no. 130 130 179 98 141 138 97 200 138 99 166 106
Transport
Total fleet road m km 36.3 34.1 34.1 7.0 11.5 2.9 1.3 - - 18.8 18.8
Flying hours fixed wing '000 hrs 9.0 4.9 1.4 - - 15.3
Flying hours rotary wing '000 hrs 6.3 3.5 0.1 0.8 - 10.7
Growth over last year
Incidents % 2.1% 2.7% 4.4% 7.2% 2.7% 3.0% 5.7% n/a 1.9% -1.6% 11.6% 0.3%
Responses % 3.0% 6.1% 7.0% 18.4% 7.5% 5.7% 4.1% 7.0% 6.2% -1.6% 10.4% -0.2%
Patients % 2.8% 2.9% 5.4% 0.5% -3.8% 5.4% 11.4% 6.8% 3.0% -1.1% 23.8% 2.5%
na = Not available. .. = Not applicable. – = Nil or rounded to zero.
(a) An incident is an event that results in a demand for ambulance resources to respond. An ambulance response is a vehicle or
vehicles sent to an incident. There may be multiple responses/vehicles sent to a single incident. A patient is someone assessed,
treated or transported by the ambulance service.(b) Vic: Victorian incidents and responses are for road ambulances only (excludes air ambulance).
(c) WA: Does not have a policy of automatically dispatching more than one unit to an incident unless advised of more than one patient.
Separate statistics are not kept for incidents and responses. Numbers shown under incidents are cases.
(d) NT: Incident data are unavailable as data are not recorded on the JESC system and all cases are considered an incident. A
response is counted as an incident, therefore, data for incidents are not included in the rates for Australia.
(e) Aust: Australian incidents data exclude NT.

The Council of Ambulance Authorities 2012-2013 Annual Report 48
Figure 1 Incidents per day; hour; minute
Incidents in Australia have had a combined growth of 43% between 2003 and 2013 with an average growth per annum of 4.1%. In 2003, Australian ambulance services reported 2.3million incidents by 2013 there were 3.3 million incidents. In New Zealand, the number of incidents has grown by 31% between 2008 and 2013. The number of incidents has gone from 373,009 in 2008 to 488,594 in 2013. Average annual growth was 6.2%.

The Council of Ambulance Authorities 2012-2013 Annual Report 49
Incidents
Figure 2 Emergency and Urgent Incidents per 100,000 people
Figure 3 Emergency and Urgent Incidents per 100,000 people – 1 and 5year growth
In Australia over the past year, the rate of emergency and urgent incidents per 100,000 people has increased by 2.9%; with the increase range from 1.4% to 4.8% recorded. In New Zealand the emergency and urgent incidents rate per 100,000 people has decreased by -19.6% over the past year. WFA recorded a decrease-8.4% and St John NZ recorded a decreased amount -21%. Over the past five years, emergency and urgent incidents per 100,000 people have increased both in Australia and New Zealand, 11.3% and 8.9% respectively.
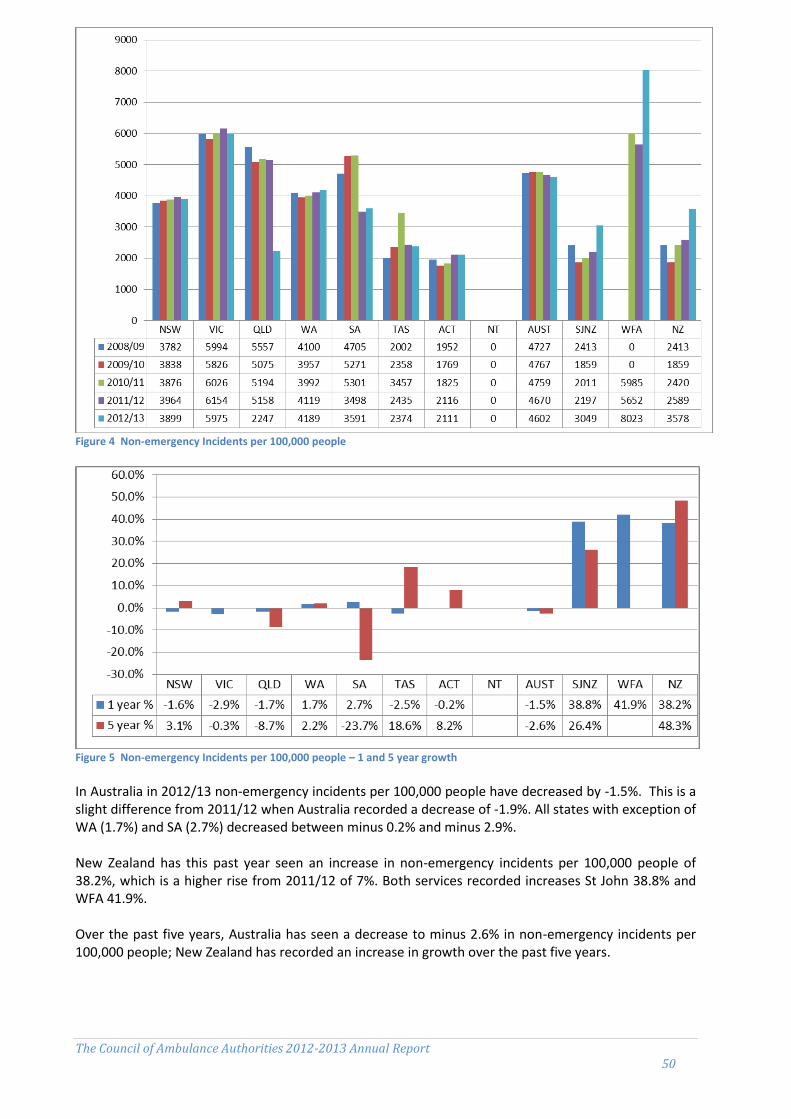
The Council of Ambulance Authorities 2012-2013 Annual Report 50
Figure 4 Non-emergency Incidents per 100,000 people
Figure 5 Non-emergency Incidents per 100,000 people – 1 and 5 year growth
In Australia in 2012/13 non-emergency incidents per 100,000 people have decreased by -1.5%. This is a slight difference from 2011/12 when Australia recorded a decrease of -1.9%. All states with exception of WA (1.7%) and SA (2.7%) decreased between minus 0.2% and minus 2.9%. New Zealand has this past year seen an increase in non-emergency incidents per 100,000 people of 38.2%, which is a higher rise from 2011/12 of 7%. Both services recorded increases St John 38.8% and WFA 41.9%. Over the past five years, Australia has seen a decrease to minus 2.6% in non-emergency incidents per 100,000 people; New Zealand has recorded an increase in growth over the past five years.

The Council of Ambulance Authorities 2012-2013 Annual Report 51
Figure 6 Non-emergency incidents as a % of total incidents
Figure 7 Non-emergency incidents as a % of total incidents – 1 and 5 year growth
In 2012-13, non-emergency incidents accounted for 32% of all incidents across Australia. This ranged from 17% in Tasmania to 42% in WA & VIC. Overall Australia has seen a decrease of minus 1.0% in non-emergency incidents as percentage of all incidents. In New Zealand non-emergency incidents represent 34% of all incidents which increased by 11%. Over the past five years, non-emergency incidents as a percentage of all incidents in Australia have seen a decrease of minus 3% while New Zealand has seen an increase to 6.6%.
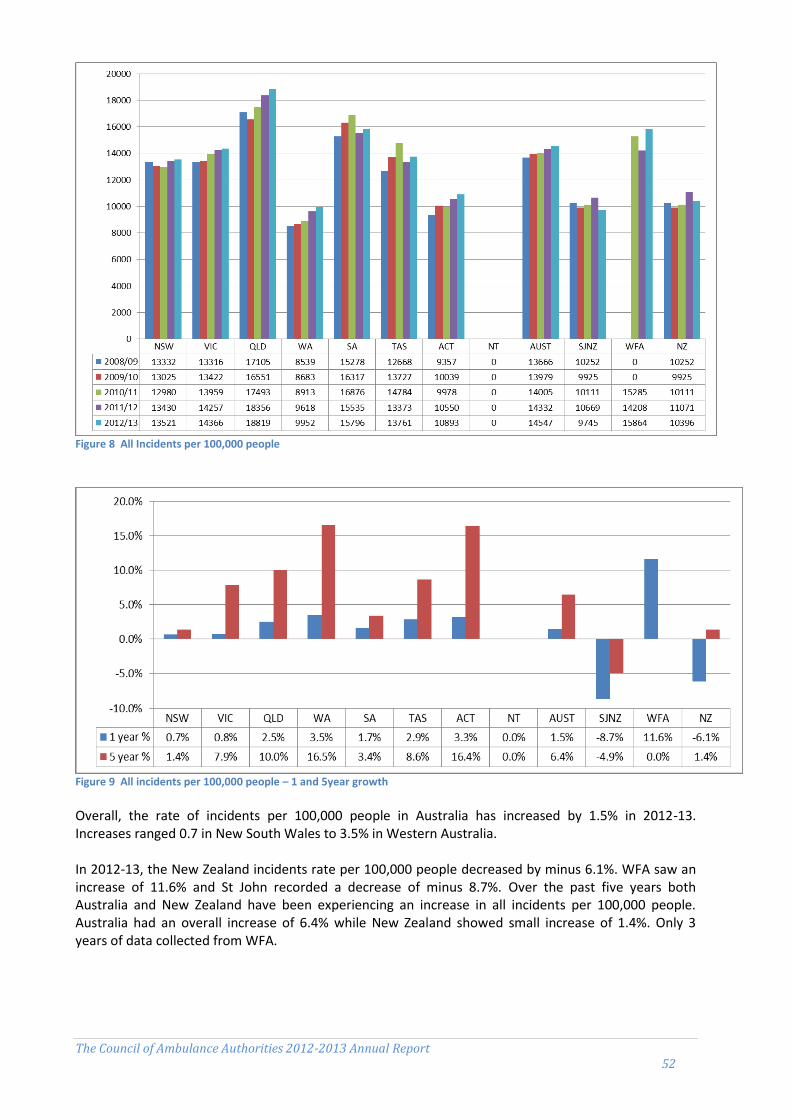
The Council of Ambulance Authorities 2012-2013 Annual Report 52
Figure 8 All Incidents per 100,000 people
Figure 9 All incidents per 100,000 people – 1 and 5year growth Overall, the rate of incidents per 100,000 people in Australia has increased by 1.5% in 2012-13. Increases ranged 0.7 in New South Wales to 3.5% in Western Australia. In 2012-13, the New Zealand incidents rate per 100,000 people decreased by minus 6.1%. WFA saw an increase of 11.6% and St John recorded a decrease of minus 8.7%. Over the past five years both Australia and New Zealand have been experiencing an increase in all incidents per 100,000 people. Australia had an overall increase of 6.4% while New Zealand showed small increase of 1.4%. Only 3 years of data collected from WFA.
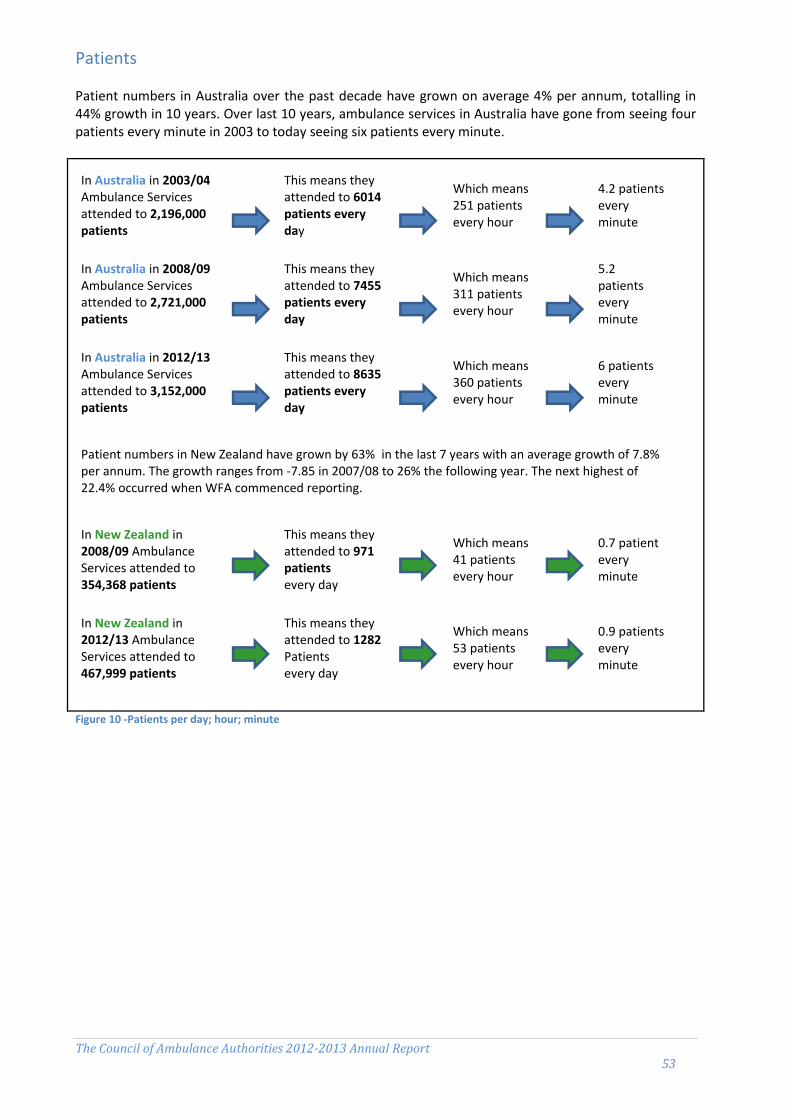
The Council of Ambulance Authorities 2012-2013 Annual Report 53
Patients Patient numbers in Australia over the past decade have grown on average 4% per annum, totalling in 44% growth in 10 years. Over last 10 years, ambulance services in Australia have gone from seeing four patients every minute in 2003 to today seeing six patients every minute.
Figure 10 -Patients per day; hour; minute
In Australia in 2003/04 Ambulance Services attended to 2,196,000 patients
This means they attended to 6014 patients every day
Which means 251 patients every hour
4.2 patients every minute
In Australia in 2008/09 Ambulance Services attended to 2,721,000 patients
This means they attended to 7455 patients every day
Which means 311 patients every hour
5.2 patients every minute
In Australia in 2012/13 Ambulance Services attended to 3,152,000 patients
This means they attended to 8635 patients every day
Which means 360 patients every hour
6 patients every minute
Patient numbers in New Zealand have grown by 63% in the last 7 years with an average growth of 7.8% per annum. The growth ranges from -7.85 in 2007/08 to 26% the following year. The next highest of 22.4% occurred when WFA commenced reporting.
In New Zealand in 2008/09 Ambulance Services attended to 354,368 patients
This means they attended to 971 patients every day
Which means 41 patients every hour
0.7 patient every minute
In New Zealand in 2012/13 Ambulance Services attended to 467,999 patients
This means they attended to 1282 Patients every day
Which means 53 patients every hour
0.9 patients every minute

The Council of Ambulance Authorities 2012-2013 Annual Report 54
Figure 11 Patients per 100,000 people
Figure 12 Patients per 100,000 people – 1 and 5 year growth Australian ambulance services have in 2012-13 attended to 3.2 million patients and New Zealand has attended to 468,000 patients. In the past year patients per 100,000 increased by 2.1% in Australia. Most states recorded an increase with the exception of Western Australia minus 3% and South Australia minus 4.8%. New Zealand saw an overall decrease to minus 4% in number of patients per 100,000 people in the past year with St John recording minus 8.2% while WFA saw an increase of 23.8%. WFA has had less than five years data collected. Overall the last five years has seen the increase in Australia and New Zealand 10.4% and 20.8% respectively.
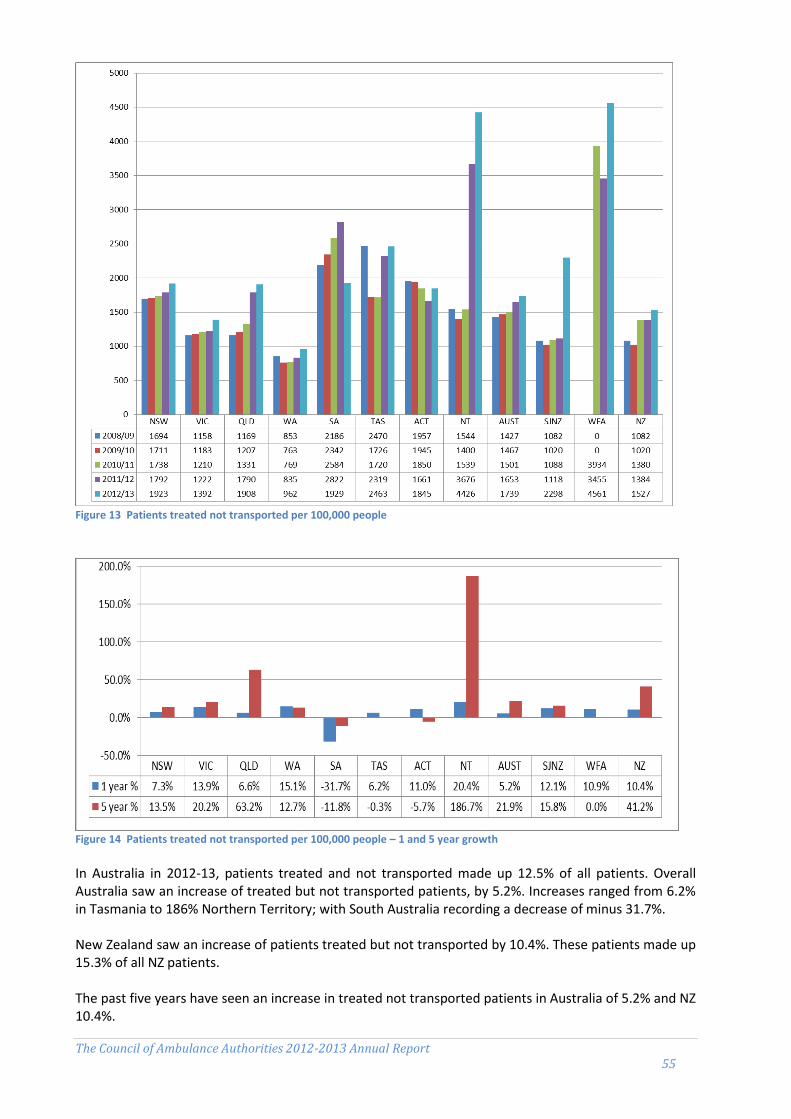
The Council of Ambulance Authorities 2012-2013 Annual Report 55
Figure 13 Patients treated not transported per 100,000 people
Figure 14 Patients treated not transported per 100,000 people – 1 and 5 year growth In Australia in 2012-13, patients treated and not transported made up 12.5% of all patients. Overall Australia saw an increase of treated but not transported patients, by 5.2%. Increases ranged from 6.2% in Tasmania to 186% Northern Territory; with South Australia recording a decrease of minus 31.7%. New Zealand saw an increase of patients treated but not transported by 10.4%. These patients made up 15.3% of all NZ patients. The past five years have seen an increase in treated not transported patients in Australia of 5.2% and NZ 10.4%.

The Council of Ambulance Authorities 2012-2013 Annual Report 56
Ambulance Staff
In 2012-13, Australia had 15,220 FTE salaried personnel employed by ambulance services; 82% of all staff employed primarily for operational purposes. New Zealand had 2045 full-time equivalent salaried personnel, of which 65% were operational.
Volunteers are counted in numbers and not FTE. Australian ambulance services in total had 7456 volunteers, of which 92% were involved in operations in 2012-13. New Zealand had 2911, who were all involved in operations.
Ambulance service organisations' human resources
Unit NSW Vic (a) Qld (b) WA (c) SA Tas ACT NT Aust St John WFA NZ
Salaried personnel
Ambulance operatives % 85.6 80.2 86.3 68.8 75.3 77.5 77.9 76.2 81.8 62.3 80.6 64.7
Ambulance operatives FTE 3 715 2 940 3 346 877 960 285 190 131 12 444 1107 216 1322
Patient transport officers FTE 226 59 179 83 57 19 11 7 642 70 29 98
Students and base level ambulance officers FTE 518 345 234 220 53 31 28 46 1 475 - 20 20
Qualified ambulance officers FTE 2 599 2 453 2 504 481 724 207 129 56 9 152 911 123 1034
Clinical other FTE 53 16 1 1 35 2 – – 107 1 - 1
Communications operatives FTE 318 67 428 92 92 27 22 22 1 068 125 44 169
Operational support personnel FTE 383 340 229 182 163 49 32 20 1 399 243 30 273
Corporate support personnel FTE 244 387 303 216 152 34 22 21 1 378 427 22 449
Total salaried personnel FTE 4 342 3 667 3 878 1 275 1 274 368 244 172 15 220 1777 268 2045
Population (i) million 7.3 5.7 4.6 2.5 1.7 0.5 0.4 0.2 22.9 3.9 0.5 4.4
Per 100 000 people
Students and base level ambulance officers FTE 7.0 6.1 5.1 8.9 3.2 6.0 7.4 19.4 6.4 - 4.0 0.5
Qualified ambulance officers FTE 35.4 43.2 54.3 19.4 43.5 40.3 33.9 23.6 40.0 23.3 24.6 23.5
Total FTE 42.4 49.3 59.4 28.3 46.7 46.3 41.3 43.1 46.4 45.6 53.5 46.5
Volunteers
Ambulance operatives no. 100 603 115 4 217 1 282 557 – – 6 874 2 853 58 2 911
Operational / corporate support no. 26 – – 364 192 – – – 582 - - -
Total volunteers no. 126 603 115 4581 1474 557 – – 7456 2853 58 2911
Community first responders
Total Community first responders no. 208 411 242 1 368 46 48 – – 2 323 – - –
(b) QLD: Volunteer numbers may fluctuate as members leave the service, new members are recruited and data cleansing occurs.
FTE Full time equivalent na = Not available. .. = Not applicable. – = Nil or rounded to zero.
(a) VIC: Data on volunteers includes some renumerated volunteers. These volunteers were remunerated for some time (usually response), but not
for other time (usually on-call time). Data on community first responders includes 50 CERT and 30 Hatzolah responders.
(c) WA: Operational and corporate support volunteers are the total of volunteers who perform a support role and do not undertake ambulance
rosters.

The Council of Ambulance Authorities 2012-2013 Annual Report 57
In 2012-13, there were 2323 first responders in Australia. These are the type of volunteers that provide emergency responses (with no transport capacity) and first aid care before ambulance arrival.
Figure 15 Ambulance service volunteers/first responders
Figure 16 Ambulance service volunteers/first responders – annual growth Ambulance volunteers in Australia and New Zealand represent a substantial proportion of the workforce, particularly in Western Australia, South Australia, Tasmania, and New Zealand. Ambulance services deeply value the significant contribution volunteers make to Australian and New Zealand communities and the many sacrifices and challenges volunteers face in their duties, particularly in rural and remote areas. Nationally in Australia in 2012-13, ambulance services consisted of 9779 volunteers including community first responders. Volunteers and first responder numbers increased in Australia by 27%. NZ showed a slight decrease of minus 2.6%
0
2000
4000
6000
8000
10000
12000
NSW VIC QLD WA SA TAS ACT NT AUST SJNZ WFA NZ
2008/09
2009/10
2010/11
2011/12
2012/13
NSW VIC QLD WA SA TAS ACT NT AUST SJNZ WFA NZ
% change -34.0% 10.4% 0.8% 54.6% 3.4% 15.1% 0.0% 0.0% 27.3% -4.6% 0.0% -2.6%
-40.0%
-30.0%
-20.0%
-10.0%
0.0%
10.0%
20.0%
30.0%
40.0%
50.0%
60.0%

The Council of Ambulance Authorities 2012-2013 Annual Report 58
Figure 17 Ambulance stations and locations by staff type per 100,000 people In 2012-13, there were 1161 ambulance response locations Australia wide, 62.5% with paid staff only, 9% combination of paid and volunteer staff, 28.5% fully volunteer supported. The distribution varies between states and territories, with WA, SA, and Tasmania heavily relying on volunteer based response locations in rural and remote areas. New Zealand had 203 locations in 2012-13, 14% were paid staff supported, 56% were supported by paid and volunteer staff, and 30% were fully volunteer supported. Ambulance services provide volunteers with quality education and ongoing training and support to ensure volunteer ambulance personnel are well prepared to meet the needs of their communities. Ambulance services continue to develop new initiatives to support the development of current volunteers and the recruitment of new volunteers.
Ambulance stations and locations, by staff type (a)
Unit NSW Vic (b) Qld WA SA Tas ACT NT Aust St John WFA NZ
Ambulance stations and locations
With paid staff only no. 224 166 242 30 42 12 7 4 727 22 7 29
With mixed paid and volunteer staff no. 6 62 – 12 3 16 – 3 102 109 5 114
With volunteer staff only no. 38 29 27 147 68 21 – 2 332 60 - 60
Total no. 268 257 269 189 113 49 7 9 1 161 191 12 203
Population (a) million 7.3 5.7 4.6 2.5 1.7 0.5 0.4 0.2 22.9 3.9 0.5 4.4
Per 100 000 people
With paid staff only no. 3.0 2.9 5.2 1.2 2.5 2.3 1.8 1.7 3.2 0.6 1.4 0.7
With mixed paid and volunteer staff no. 0.1 1.1 - 0.5 0.2 3.1 - 1.3 0.4 2.8 1.0 2.6
With volunteer staff only no. 0.5 0.5 0.6 5.9 4.1 4.1 - 0.8 1.4 1.5 - 1.4
Total no. 3.6 4.5 5.8 7.6 6.8 9.6 1.8 3.8 5.1 4.9 2.4 4.6
na = Not available. .. = Not applicable. – = Nil or rounded to zero.
0%
10%
20%
30%
40%
50%
60%
70%
80%
90%
100%
NSW VIC QLD WA SA TAS ACT NT AUST SJNZ WFA NZ
Ambulance stations and locations by staff type per 100,000 people
Volunteer
Mixed
Paid
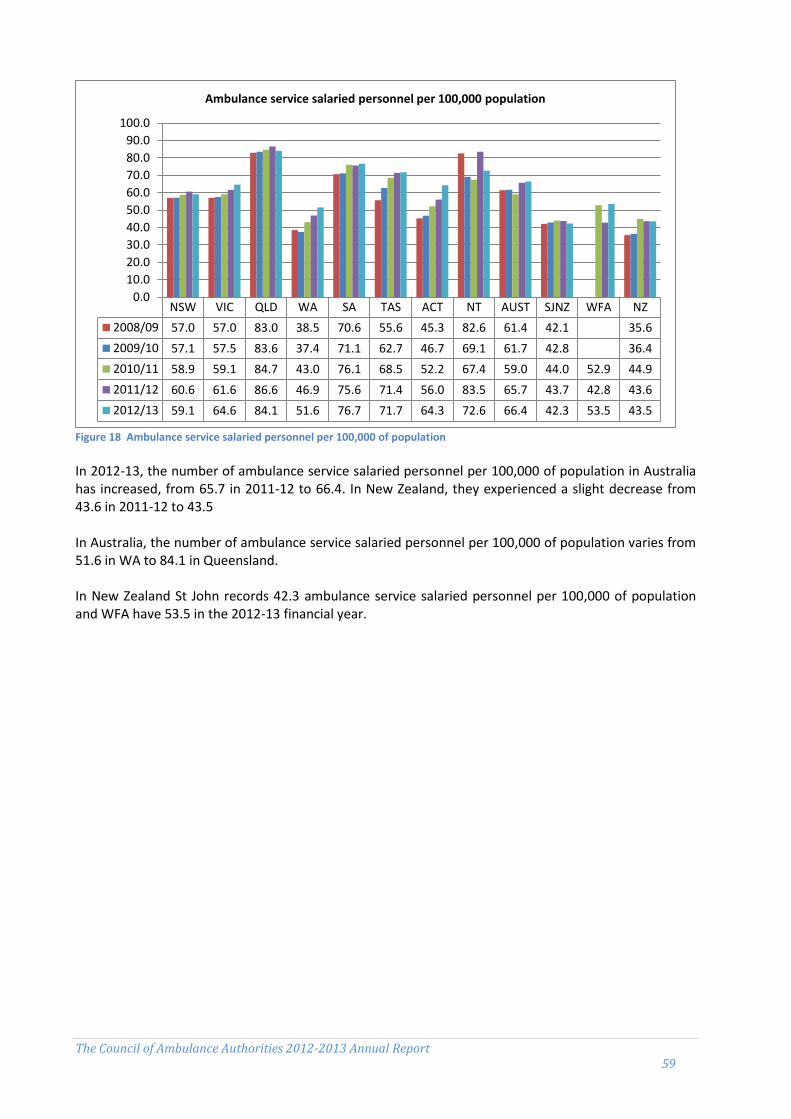
The Council of Ambulance Authorities 2012-2013 Annual Report 59
Figure 18 Ambulance service salaried personnel per 100,000 of population In 2012-13, the number of ambulance service salaried personnel per 100,000 of population in Australia has increased, from 65.7 in 2011-12 to 66.4. In New Zealand, they experienced a slight decrease from 43.6 in 2011-12 to 43.5 In Australia, the number of ambulance service salaried personnel per 100,000 of population varies from 51.6 in WA to 84.1 in Queensland. In New Zealand St John records 42.3 ambulance service salaried personnel per 100,000 of population and WFA have 53.5 in the 2012-13 financial year.
NSW VIC QLD WA SA TAS ACT NT AUST SJNZ WFA NZ
2008/09 57.0 57.0 83.0 38.5 70.6 55.6 45.3 82.6 61.4 42.1 35.6
2009/10 57.1 57.5 83.6 37.4 71.1 62.7 46.7 69.1 61.7 42.8 36.4
2010/11 58.9 59.1 84.7 43.0 76.1 68.5 52.2 67.4 59.0 44.0 52.9 44.9
2011/12 60.6 61.6 86.6 46.9 75.6 71.4 56.0 83.5 65.7 43.7 42.8 43.6
2012/13 59.1 64.6 84.1 51.6 76.7 71.7 64.3 72.6 66.4 42.3 53.5 43.5
0.0
10.0
20.0
30.0
40.0
50.0
60.0
70.0
80.0
90.0
100.0
Ambulance service salaried personnel per 100,000 population

The Council of Ambulance Authorities 2012-2013 Annual Report 60
Figure 19 Availability of paramedics/ambulance officers per 100,000
Figure 20 Availability of paramedics/ambulance officers per 100,000 – annual growth The figures for ambulance officers/paramedics include student and base level ambulance officers and qualified ambulance officers, but exclude patient transport officers. Overall, Australia experienced an increase of 0.7%. Increases were highest in ACT 22.6% with NSW, QLD, and NT recording a decreased in numbers. New Zealand saw a small decrease of -0.8% in ambulance officers/paramedics availability per 100,000 people. St John recorded a decrease of minus 4.1% and WFA saw a significant increase of 26.5%.
NSW VIC QLD WA SA TAS ACT NT AUST SJNZ WFA NZ
2008/09 42.1 43.4 55.9 23.1 42.9 40.7 30.4 51.9 43.2 19.6 16.6
2009/10 41.9 43.8 56.6 22.5 42.7 44.3 31.7 46.4 43.3 22.4 19.1
2010/11 42.7 44.1 57.1 24.1 43.3 44.2 34.0 41.3 41.2 23.1 20.4 22.8
2011/12 43.2 48.3 59.5 26.4 45.6 46.0 33.8 53.0 45.9 22.6 22.6 22.6
2012/13 41.9 49.3 59.4 28.3 46.7 46.4 41.4 43.1 46.2 21.7 28.6 22.4
0.0
10.0
20.0
30.0
40.0
50.0
60.0
70.0
Availability of paramedics/ambulance officers per 100,000 people
NSW VIC QLD WA SA TAS ACT NT AUST SJNZ WFA NZ
1 year % -3.1% 2.0% -0.2% 7.3% 2.6% 1.0% 22.6% -18.8% 0.7% -4.1% 26.5% -0.8%
-25.0%
-20.0%
-15.0%
-10.0%
-5.0%
0.0%
5.0%
10.0%
15.0%
20.0%
25.0%
30.0%

The Council of Ambulance Authorities 2012-2013 Annual Report 61
Figure 21 Operational ambulance workforce by age group Operational workforce by age group and is identified as staff with paramedic qualifications desirable or essential to the role. The larger the proportion of operational workforce closer to retirement, the more likely sustainability problems will arise in the future. In Australia 79% of the workforce was aged under 50, in New Zealand (data for St John only) the percentage was 66%. These numbers are consistent with the previous year’s data.
Figure 22 Operational ambulance staff attrition In 2012-13 staff attrition, which is calculated as the proportion of FTE employees who exit the organisation during the year, for Australia was 4.3% and varied between states and territories from 5.5 in NSW to 1.4 in SA.. New Zealand recorded a 2.3% staff attrition rate, with St John reporting 2.7% attrition rate and WFA 0%.
0%
10%
20%
30%
40%
50%
60%
70%
80%
90%
100%
NSW VIC QLD WA SA TAS ACT NT AUST SJNZ WFA NZ
Under 30 30-39 40-49 50-59 60 or over
0.0%
1.0%
2.0%
3.0%
4.0%
5.0%
6.0%
NSW VIC QLD WA SA TAS ACT NT AUST SJNZ WFA NZ
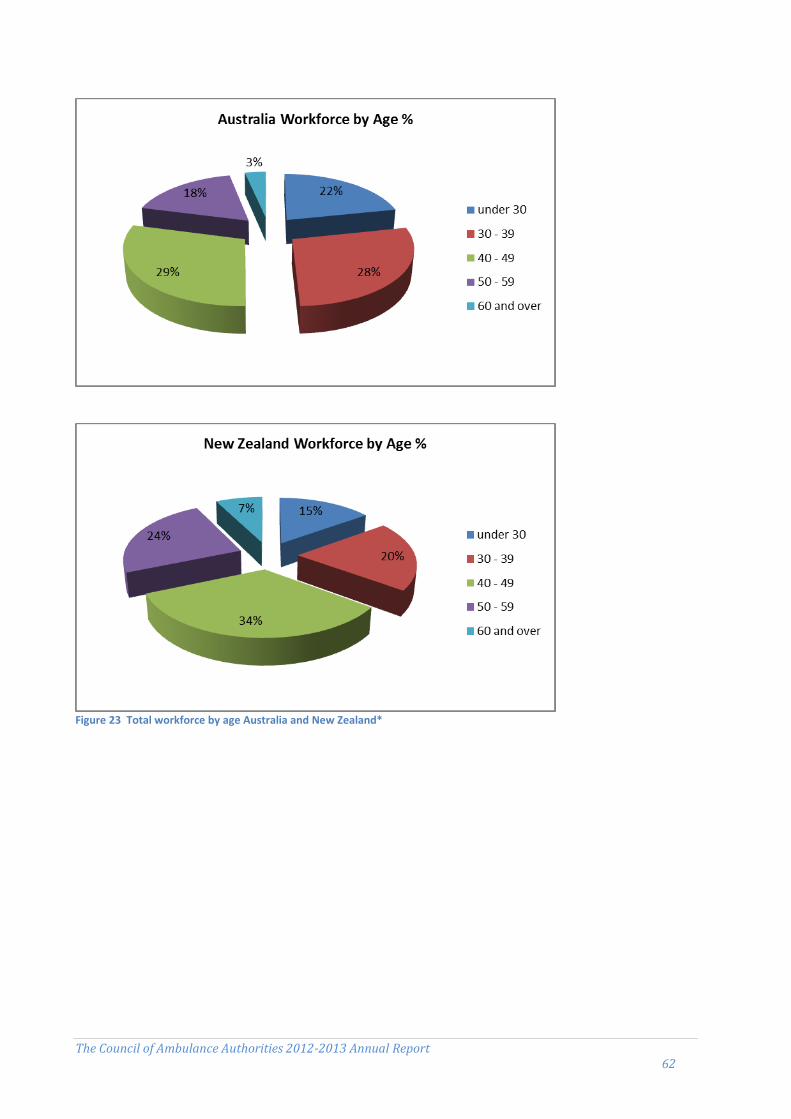
The Council of Ambulance Authorities 2012-2013 Annual Report 62
Figure 23 Total workforce by age Australia and New Zealand*

The Council of Ambulance Authorities 2012-2013 Annual Report 63
Assets
Ambulance assets (number) (a) (b)
Unit NSW Vic (c) Qld WA (c) SA Tas ACT NT (c) Aust (c) St John WFA NZ
Ambulance stations and locations
Response locations no. 268 257 269 189 113 49 7 9 1 161 191 12 203
Communication centres no. 5 – 7 1 1 1 1 1 17 2 - 2
Other locations no. 60 28 51 175 21 6 4 2 347 29 6 35
Total no. 333 285 327 365 135 56 12 12 1 525 222 18 240
First responder locations
Ambulance no. 16 58 29 456 8 5 – – 572 34 - 34
Third party no. 6 74 – – 12 4 – – 96 106 - 106
Ambulances and other vehicles
Ambulance general purpose no. 930 534 815 466 225 108 27 32 3 137 491 28 519
Patient transport vehicles no. 116 57 106 31 20 13 4 3 350 122 20 142
Operational support vehicles no. 306 316 210 32 87 31 11 12 1 005 45 10 55
Special operations vehicles no. 94 18 18 1 44 3 – 1 179 68 7 75
Administrative vehicles no. 70 146 40 66 22 5 1 6 356 120 3 123
Other vehicles no. 66 32 48 17 14 6 4 5 192 39 2 41
Total no. 1 582 1 103 1 237 613 412 166 47 59 5 219 885 70 955
(a) Differences in geography, topography and operational structures require different resourcing models across jurisdictions.(b) VIC: General purpose ambulances exclude contractors’ nonemergency vehicles and special operations vehicles include four fixed wing and three rotary wing aircraft under contract.na = Not available. .. = Not applicable. – = Nil or rounded to zero.
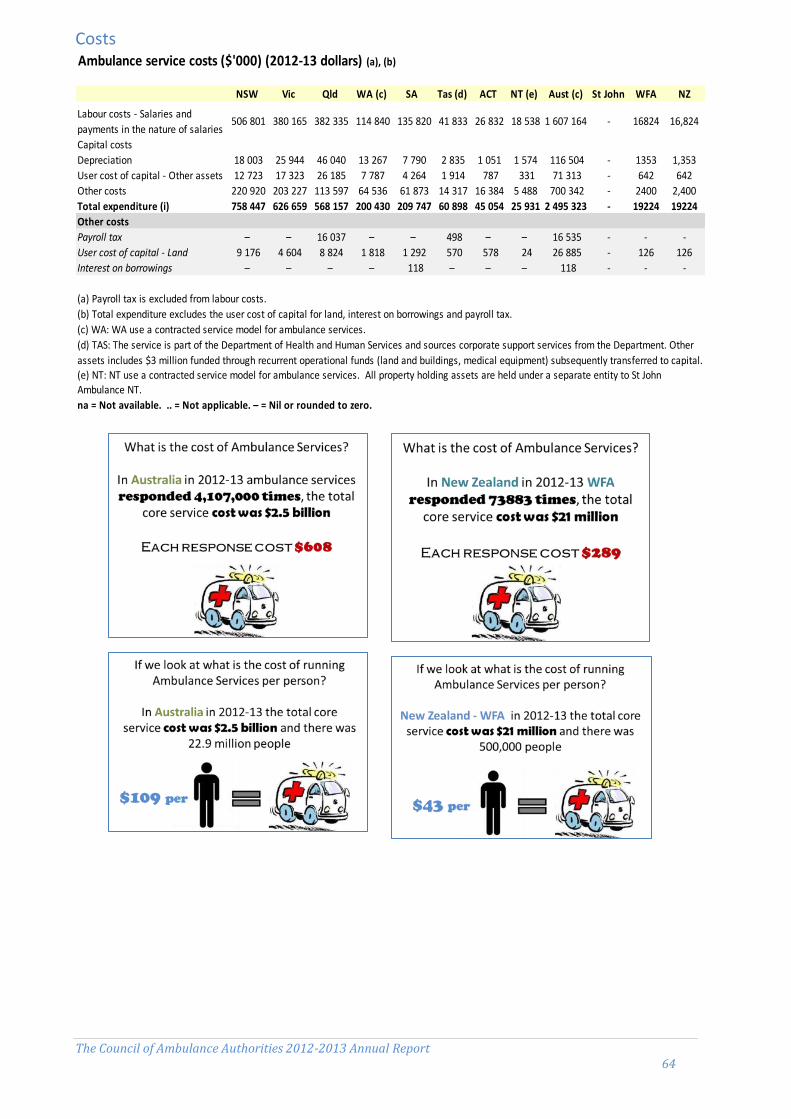
The Council of Ambulance Authorities 2012-2013 Annual Report 64
Costs
Ambulance service costs ($'000) (2012-13 dollars) (a), (b)
NSW Vic Qld WA (c) SA Tas (d) ACT NT (e) Aust (c) St John WFA NZ
Labour costs - Salaries and
payments in the nature of salaries 506 801 380 165 382 335 114 840 135 820 41 833 26 832 18 538 1 607 164 - 16824 16,824
Capital costs
Depreciation 18 003 25 944 46 040 13 267 7 790 2 835 1 051 1 574 116 504 - 1353 1,353
User cost of capital - Other assets 12 723 17 323 26 185 7 787 4 264 1 914 787 331 71 313 - 642 642
Other costs 220 920 203 227 113 597 64 536 61 873 14 317 16 384 5 488 700 342 - 2400 2,400
Total expenditure (i) 758 447 626 659 568 157 200 430 209 747 60 898 45 054 25 931 2 495 323 - 19224 19224
Other costs
Payroll tax – – 16 037 – – 498 – – 16 535 - - -
User cost of capital - Land 9 176 4 604 8 824 1 818 1 292 570 578 24 26 885 - 126 126
Interest on borrowings – – – – 118 – – – 118 - - -
(a) Payroll tax is excluded from labour costs.
(b) Total expenditure excludes the user cost of capital for land, interest on borrowings and payroll tax.
(c) WA: WA use a contracted service model for ambulance services.
(d) TAS: The service is part of the Department of Health and Human Services and sources corporate support services from the Department. Other
assets includes $3 million funded through recurrent operational funds (land and buildings, medical equipment) subsequently transferred to capital.(e) NT: NT use a contracted service model for ambulance services. All property holding assets are held under a separate entity to St John Ambulance NT.
na = Not available. .. = Not applicable. – = Nil or rounded to zero.

The Council of Ambulance Authorities 2012-2013 Annual Report 65
Patient Satisfaction
Figure 24 Proportion of ambulance users who were satisfied or very satisfied with the ambulance service
Satisfaction with ambulance service organisations (a)
Unit NSW Vic Qld WA SA Tas ACT NT Aust St John WFA NZ
Number of patients surveyed no. 1 300 1 300 1 300 1 300 1 300 1 300 1 300 1 300 10 400 – 8846 8846
Usable responses no. 385 430 396 364 546 591 383 189 3 284 – 2 400 2400
Overall satisfaction (c)
Very satisfied or satisfied % 99 98 96 99 99 98 98 95 98 – 99 99
95% confidence interval ± 1.0 1.3 2.0 1.2 1.0 1.0 1.2 2.9 0.5 – - –
Neither satisfied / dissatisfied % 1 1 2 1 1 1 1 3 1 – - –
Dissatisfied / very dissatisfied % – 1 2 – – 1 1 2 1 – 1 1
Phone answer time
Very satisfied or satisfied % 98 98 97 97 98 98 98 96 98 – 98 98
Neither satisfied / dissatisfied % 1 1 2 2 2 2 1 2 1 – 1 1
Dissatisfied / very dissatisfied % 1 1 1 1 – 1 1 2 1 – 1 1
Ambulance arrival time
Very satisfied or satisfied % 95 93 95 96 98 98 95 89 95 – 95 95
Neither satisfied / dissatisfied % 2 3 3 3 1 1 3 5 2 – 2 2
Dissatisfied / very dissatisfied % 3 4 2 1 1 1 2 6 3 – 3 3
Satisfaction with treatment
Very satisfied or satisfied % 99 99 98 99 99 99 98 96 99 – 98 98
Neither satisfied / dissatisfied % 1 – 1 1 – 1 1 3 – – 1 1
Dissatisfied / very dissatisfied % – 1 1 – 1 1 1 1 1 – 1 1
Satisfaction with paramedic attitude
Very satisfied or satisfied % 99 99 98 99 99 97 99 95 99 – 98 98
Neither satisfied / dissatisfied % 1 1 1 1 1 2 – 3 1 – 1 1
Dissatisfied / very dissatisfied % – – 1 – – 1 1 2 – – 1 1
Total patients (est.) (b) '000 958 739 824 243 234 71 37 47 3 152 - 74 74
(a) These results are from a survey distributed to code 1 and code 2 patients (Emergency and Urgent), per jurisdiction, per year.
(b) Total patients is equal to the sum of the number of patients transported plus the number treated and not transported.
na = Not available. .. = Not applicable. – = Nil or rounded to zero.
(c) Overall satisfaction rates from 2009 include standard errors for the 95 per cent confidence interval (for example, X per cent ± X per
cent). Confidence intervals for prior years are not available.
80.0%
82.0%
84.0%
86.0%
88.0%
90.0%
92.0%
94.0%
96.0%
98.0%
100.0%
NSW VIC QLD WA SA TAS ACT NT AUST SJNZ WFA NZ
Proportion of ambulance users who were satisfied or very satisfied with the ambulance service
2008/09
2009/10
2010/11
2011/12
2012/13

The Council of Ambulance Authorities 2012-2013 Annual Report 66
Figure 25 - Percentage Satisfied Patients- Australia & New Zealand
In 2012-13, the overall satisfaction with ambulance services in Australia and New Zealand was again high at 98% and 99% respectively. The satisfaction levels have slightly increased from last year’s results, seeing all states with exception of Qld and NT recording a small decrease.

The Council of Ambulance Authorities 2012-2013 Annual Report 67
Response Times
Ambulance code 1 response times (minutes) (a), (b)
Unit NSW Vic (c) Qld (d) WA SA Tas (e) ACT NT St John WFA
Statewide 50th percentile min 11.1 11.2 8.2 9.1 9.4 11.0 8.7 9.5 10.3 9.1
Statewide 90th percentile min 23.0 22.9 16.5 16.5 17.4 22.8 13.7 21.6 22.7 19.2
Capital city 50th percentile (f) min 10.9 10.9 8.2 8.7 9.2 10.1 8.7 8.4 10.5 9.1
Capital city 90th percentile (f) min 20.6 19.5 14.9 14.2 15.4 16.1 13.7 14.6 20.0 19.2
Urban centre (a)
Population ('000) 000 4 608.9 4 169.4 2 147.4 1 833.6 1 264.1 216.3 368.0 129.1 4471 450
Area (sq km) sq km 12368 9991 15826 6418 3258 1695 2358 3164 - -
Population per sq km no. 372.7 417.3 135.7 285.7 388.0 127.6 156.1 40.8 - -
na = Not available. .. = Not applicable. – = Nil or rounded to zero.
(a) Response times commence from the following time points: Vic (AV rural) receipt of call; Vic (AV metro), SA and Tas first key
stroke; NSW, Qld (QAS) and WA transfer to dispatch; and the NT crew dispatched. In 2007-08 the ACT response times commence
from the first key stroke, wheras, in 2006-07 response times commenced from incident creation. Therefore, ACT data across
years are not directly comparable.
(b) Urban centre response times are currently measured by the response times within each jurisdictions’ capital city —
boundaries based on the ABS Urban Centres Localities structure. Capital cities are Sydney, Melbourne, Brisbane, Perth, Adelaide,
Hobart, Canberra and Darwin.
(c) VIC: Metropolitan response and case times data are sourced from Computer Aided Dispatch system. Rural response times are
sourced from Patient Care Records completed by paramedics.
(d) QLD: Casualty room attendances are not included in response count and, therefore, are not reflected in response times data.
Response time calculations for percentiles for both Capital City and State sourced from Computer Aided Dispatch (CAD) system.
(e) TAS: The highest proportion of population is in small rural areas, relative to other jurisdictions, which increases average
response times.

The Council of Ambulance Authorities 2012-2013 Annual Report 68
Cardiac Arrest
Cardiac Arrest Survived Event Rate (a), (b), (c), (d), (e), (f), (g), (h)
Unit NSW (i) Vic (j) Qld WA SA Tas ACT NT St John WFA
Paramedic witnessed adult cardiac arrests
Incidents no. na 435 267 58 83 na 26 8 na 20
Survival incidents no. na 214 137 27 26 na 9 1 na 11
Survival rate % na 49.2 51.3 46.6 31.3 na 34.6 12.5 na 55.0
Adult cardiac arrests where resuscitation attempted (excluding paramedic witnessed)
Incidents no. na 2 020 1 097 756 586 323 69 138 na 157
Survival incidents no. na 608 269 204 143 99 15 39 na 78
Survival rate % na 30.1 24.5 27.0 24.4 30.7 21.7 28.3 na 49.7
Incidents no. na 589 379 156 167 143 17 46 na 77
Survival incidents no. na 290 156 65 78 63 10 29 na 53
Survival rate % na 49.2 41.2 41.7 46.7 44.1 58.8 63.0 na 68.8
(b) For each of the indicators used a higher or increasing rate is a desirable outcome.
(j) VIC: Excludes patients with unknown rhythm on arrival at hospital.
na = Not available. .. = Not applicable. – = Nil or rounded to zero.
Adult VF/VT cardiac arrests (excluding paramedic witnessed)
(i) all paramedic witnessed adult cardiac arrests where any chest compressions and/or defibrillation was
undertaken by ambulance/EMS personnel, where the patient has a return of spontaneous circulation (ROSC) on
arrival at hospital; and (ii) all adult cardiac arrests (excluding paramedic witnessed) where any chest compressions and/or defibrillation
was undertaken by ambulance/EMS personnel, where the patient has a return of spontaneous circulation (ROSC)
on arrival at hospital; and (iii) adult VF/VT cardiac arrests (a further breakdown of cardiac arrest data) the arrest rhythm on the first ECG
assessment was either Ventricular Fibrillation or Ventricular Tachycardia, where the patient has a ROSC on arrival
at hospital.
(c) Successful outcome is defined as the patient having return of spontaneous circulation (ROSC) on arrival to
hospital (i.e. the patient having a pulse). This is not the same as the patient surviving the cardiac arrest as having
ROSC is only one factor that contributes to the overall likelihood of survival.
(a) Rates are the percentage of patients aged 16 years or over who were in out-of-hospital cardiac arrest (excluding
paramedic witnessed) for:
(i) NSW: Data consistency issues mean that this measure is unable to be reported. NSW is awaiting the development
of a national methodology for calculation of this measure prior to revising its internal processes.
(d) The indicators used to measure outcomes for cardiac arrests are not directly comparable as each are subject to
variations based on differing factors used to define the indicator which are known to influence outcome. A recent
review of the data across jurisdictions has highlighted a level of uncertainty that all jurisdictions are utilising a
consistent definition in the denominator presented within the Cardiac Arrest data. These discrepancies are currently
the subject of further review by the Council of Ambulance Authorities.(e) The indicator ‘Adult cardiac arrests where resuscitation attempted’ provides an overall indicator of outcome
without specific consideration to other factors known to influence survival.
(f) Patients in Ventricular Fibrillation (VF) or Ventricular Tachycardia (VT) are more likely to have better outcomes
compared with other causes of cardiac arrest as these conditions are primarily correctable through defibrillation.
(g) Paramedic witnessed cardiac arrests are analysed separately in the indicators reported as these cardiac arrests
are treated immediately by the paramedic and as such have a better likelihood of survival due to this immediate and
rapid intervention. This is vastly different to cardiac arrests occurring prior to the ambulance arriving where such
increasing periods of treatment delay are known to negatively influence outcome.
(h) Cardiac arrest data is not comparable between jurisdictions due to different methods of reporting. Data is only
comparable between years for each individual jurisdiction (unless caveats say otherwise).