the credit liquidity trap - six swiss · pdf fileproduced by the royal bank of scotland plc....
TRANSCRIPT

BUILDING TOMORROW™
rbs.com/mib
Produced by The Royal Bank of Scotland plc.In the UK, the Royal Bank of Scotland plc is authorised by the Prudential Regulation Authority and regulated by the Financial Conduct Authority and the Prudential Regulation Authority.
The Credit Liquidity TrapMacro Credit Research
SSX and SBC, 26 November 2014Alberto Gallo, CFA
Head of European Macro Credit Research+44 (0) 20 7085 5736
Lee Tyrrell-HendryMacro Credit Analyst
+44 (0) 20 7085 [email protected]
Tao PanMacro Credit Analyst
+44 (0) 20 7678 [email protected]
Mateja PopovicMacro Credit Analyst
+44 (0) 20 7085 [email protected]
Rajarshi MalaviyaGaurav Chhapia
Chanchal Beriwal

2
The Credit Liquidity Trap
“There is always a temptation for the central bank to speak in a whisper, because anything that gets said reverberates so loudly in markets. But the softer it talks, the more the market leans in to hear better and, thus, the more the whisper gets amplified. So efforts to overly manage the market volatility associated with our communications may ultimately be self-defeating.” Jeremy C. Stein, Federal Reserve Governor, May 6, 2014
The persistence of current benign market conditions largely hinges on three key factors. First, continued strong investor confidence centres on a fragile euro area recovery with significant downside risks. In view of this, low levels of corporate default and volatility could be tested by a normalisation of global liquidity conditions. Second, strong risk appetite among global investors could be threatened by rising geopolitical tensions, growing vulnerabilities in emerging markets or an unexpected increase in global benchmark rates, which remain at historical lows. Any such unravelling of recent search-for-yield behaviour could prompt a sharp repricing of risk, which could be amplified by low market liquidity in key segments. ECB Financial Stability Review, April 2014
“The whole system relies on liquidity illusion: We know we can’t all buy or all sell all our assets the same day. If you don’t have a contingency plan if liquidity goes away, then you’re up the creek without a paddle” Peter Fisher, Blackrock Investment Institute, June 2014
Some broad combination of these pockets of evolving vulnerabilities—set against a backdrop of a rise in short-term interest rates or an unwinding of currently compressed risk and term premia—could prove disruptive. In particular, a tail risk where there was a precipitous attempt by investors to exit certain markets—perhaps exacerbated by outflows from ETFs and mutual funds as well as near-term market illiquidity—could trigger an abrupt and self-reinforcing re-pricing of a range of financial assets. IMF Article IV Consultation on the United States, June 2014

3
Corporate bond markets have grown and changed since the crisisFund and household holdings of corporate bonds (% of US corp. bond market)
Source: RBS Credit Strategy, Federal Reserve
0%
5%
10%
15%
20%
25%
30%
35%
1945 1951 1957 1963 1969 1975 1981 1987 1993 1999 2005 2011
Household ownership share Fund ownership share

4Source: RBS Credit Strategy, FRED
Asset managers face pressure as yield decline, fees stay the sameSome respond with lower fees, most hunt for more yield
0%
2%
4%
6%
8%
10%
12%
1956 1964 1972 1980 1988 1996 2004 2012
10y Bund yield
Asset Manager fees

5Source: RBS Credit Strategy, FRED
Asset Manager fees as a % of 10-year Bund yield
0%
5%
10%
15%
20%
25%
30%
35%
1956 1964 1972 1980 1988 1996 2004 2012

6
The beta trade: this time is different vs 2004-2007
Source: RBS Credit Strategy
Stylised efficient frontier. From “rating arbitrage” (pre-crisis) to search for high beta, nominal yield
0%
2%
4%
6%
8%
10%
12%
14%
0% 5% 10% 15% 20% 25% 30%
Volat ility
Expected return
QE effect
Today: inves tors buy unlevered, high risk assets (e.g. HY, cocos)
Pre-crisis: leveraged high-rated port folios (e.g. synthetic
CDOs, CPDOs)
“There are three ways to make a living in this business: be first, be smarter, or cheat” John Tuld, Margin Call (2011)

7
Compression in risk premia
Source: RBS Credit Strategy, FRED, Bloomberg. Date range: from 1999 to today (except EM HY where data is only available from Dec 2003 onwards).
0
500
1,000
1,500
2,000
2,500
3,000
$ IG € IG EM IG $ HY € H Y EM HY 10yUST
10yBunds
10ySPGBs
10y BTPs
V2X VIX P/E
LT average
CurrentMax
Min
20
40
60
80
100
120
8
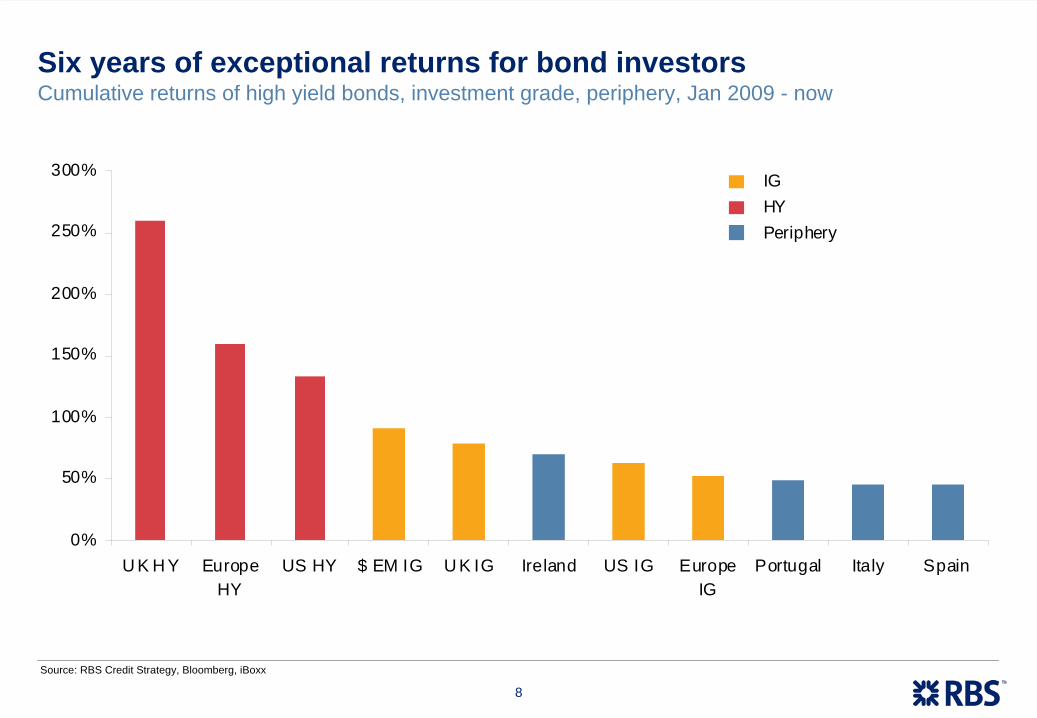
Six years of exceptional returns for bond investors
Source: RBS Credit Strategy, Bloomberg, iBoxx
Cumulative returns of high yield bonds, investment grade, periphery, Jan 2009 - now
0%
50%
100%
150%
200%
250%
300%
U K H Y EuropeHY
US HY $ EM IG U K IG Ireland US IG EuropeIG
Portugal Italy Spain
Periphery
IGHY

9
The end of the beta trade?
Source: RBS Credit Strategy
High-beta credit continues to weaken while Euro IG stays resilient, total returns, 100 = 31 Dec 2013
86
90
94
98
102
106
110
Jan Feb Mar Apr May Jun Jul Aug Sep Oct Nov
Euro IG US IG
Euro B US CCC
Cocos Corporate H ybrids
US Distressed

10
1. The architecture of the bond market has changed. The corporate bond market has grown in size as well since the crisis (from $6tn to roughly $10tn in the US). Households and especially mutual funds now own a larger share of credit
2. More mutual funds means more market participants in competition to outperform each other. Low yields have put pressure vs fee structures. Some asset managers have reacted by lowering costs – most instead have taken more risk.
3. Unlike pre-crisis, the search for yield since 2009 has manifested itself as a search for beta. This is different than pre-crisis, when investors were mostly leveraging highly rated assets. Today, investors rely less on rating agencies and building exotic/leveraged products is more difficult. The preference is for high nominal yield products, some of which have embedded leverage (e.g. contingent capital)
4. As a result, the last five years have seen strong performance in high beta bonds, including high yield, corporate and financial hybrid bonds, and periphery – this was accompanied by constant inflows into mutual funds
5. But as monetary policy normalises, the market is vulnerable to re-pricing, and the bottleneck of trading liquidity remains tight

11
Exit risk: Policy normalisation and risk repricing“Now, back to Macro. What is your exit strategy? The players won't be in on the scam, so they'll all think it's their lucky night, but you'll never get them out of there with their winnings, they'll gamble it all back. That's Vegas and that's your problem.”
Roman Nagel, Ocean’s Thirteen

12
What is liquidity? Systemic and refinancing liquidity risks are low
EUR 3m Libor-OIS spread, bp
Source: RBS Credit Strategy, Bloomberg
Debt maturity wall for European IG corporates, % of total debt
Source: RBS Credit Strategy, Bloomberg. *Included all non-financial corporates in iTraxx Main
0%
10%
20%
30%
40%
50%
60%
2014 2015 2016 2017 2018 2019 2020onwards
0
20
40
60
80
100
120
140
160
180
200
2006 2007 2008 2009 2010 2011 2012 2013 2014

13
But transactional liquidity is low: RBS liquid-o-meterTrading liquidity in US credit markets continues to decline, but is improving in Treasury markets.
Source: RBS Credit Strategy, Bloomberg, SIFMA, MarketAxess.
0
20
40
60
80
100
120
140
160
2005 2006 2007 2008 2009 2010 2011 2012 2013 2014
US T reasuries US corporate bonds100 = D ec 2006

14
Market grows but dealers pull backMarket size ($bn) vs dealer estimated holdings of corporate bonds (% of market size)
Source: RBS Credit Strategy, Bloomberg, SIFMA, MarketAxess, Federal Reserve Bank of New York
0.0%
0.3%
0.6%
0.9%
1.2%
1.5%
2002 2003 2004 2005 2006 2007 2008 2009 2010 2011 2012 2013 20140
1,000
2,000
3,000
4,000
5,000
6,000
7,000
8,000
9,000
10,000Credit market s ize (RHS) Dealers ' est. holdings (LHS)

15
Lower liquidity is partly a symptom of lower dealer inventoriesUS corporate bond dealer inventories, $bn.
Source: RBS Credit Strategy, Federal Reserve Bank of New York, SIFMA, MarketAxess. Note: because corporate bond dealer inventories are not broken down prior to 2013, we have assumed IG and HY inventories are in the same proportion as the average from 2013-present.
0
50
100
150
200
250
2002 2003 2004 2005 2006 2007 2008 2009 2010 2011 2012 2013 2014
IG + HY CP + RMBS + CMBSIG HYCP RMBSCMBS

16
Low volumes and higher transaction costs
Average daily trading volumes, %mkt size
Source: RBS Credit Strategy, SIFMA
Index members’ bid-ask, % CDS spread
Source: RBS Credit Strategy, Bloomberg
0.0%
0.1%
0.2%
0.3%
0.4%
0.5%
0.6%
0.7%
0.8%
05 06 07 08 09 10 11 12 13 140%
5%
10%
15%
20%
25%
30%
35%
2006 2007 2008 2009 2010 2011 2012 2013 2014
CDX HY Xover CDX IG

17
Markets are polarised between few liquid and many illiquid bonds
Distribution of bond by trading frequency in US TRACE
Source: RBS Credit Strategy, Michael A. Goldstein (Babson College)
0
200
400
600
800
1,000
1,200
0 50 100 150 200 250 300Number of bonds
Num
ber o
f tra
des
in 3
0 da
ys
Percent of trading days per quartile
Source: RBS Credit Strategy, IMF GFSR Oct 2014
0
10
20
30
40
50
60
70
80
90
100
0 25 50 75 100
Percent of index const ituentsPe
rcen
t of t
radi
ng d
ays
Corporate EM Bond Index HY
More liquidLess liquid

18
High quality collateral is shrinking
QE effects: repo volume goes down as Fed holdings go up Daily ave. collateral value in tri-party repo vs Fed holdings, $bn
Source: RBS Credit Strategy, SIFMA, Federal Reserve Bank of New York
Collateral velocity is going down Overall collateral volume (blue) vs sources of collateral (green)
Source: RBS Credit Strategy, Singh, M. (IMF, 2012 & 2013)
200
700
1200
1700
2200
2700
2011 2012 2013 2014
OtherTreasury securit iesAgency securitiesFed holdings of Treasury securit iesFed holdings of agency securit ies Central Collateral Desk
$10tn (2007) $5.8tn (2010) $6.1tn (2011) $6tn (2012)
$1.7tn (2007) $1.1tn (2010) $1.1tn (2011) $1.0tn (2012)
Hedge funds
$1.7tn (2007) $1.3tn (2010) $1.3tn (2011) $1.8tn (2012)
Securities lending via custodians
Money market funds
de minimis
Commercial banks
Velocity (overall collateral/sources)
2007: 3.0 2010: 2.4 2011: 2.5 2012: 2.2
“suppliers”“users”

19
Do you get paid for illiquidity? Not much
Deviations of estimated bond liquidity risk premia from historical averages
Source: RBS Credit Strategy, Bank of England
Decomposition of €HY spreads, bp
Source: RBS Credit Strategy, Bloomberg, Moody’s
0
200
400
600
800
1000
1200
1400
00 01 02 03 04 05 06 07 08 09 10 11 12 13 14
Volat ility riskD efault riskLiquidity risk
-200
-100
0
100
200
300
400
500
600
2000 2002 2004 2006 2008 2010 2012 2014
USD H YUSD IG (RHS)EUR IG (RHS)GBP IG (RHS)

20
Exiting stimulus can be painful
Source: RBS Credit Strategy, Bloomberg
Total returns during the taper tantrum (22 May – 29 August 2013)
-16%
-12%
-8%
-4%
0%
€ Fi
n T1
€ 1-
3yr
€ H
YS
&P 5
00S
pain
€ 3-
5yr
€ IG
Fin
sH
ealth
Cap
ital G
oods
Con
s N
on-c
ycM
ater
ials
€ IG
Italy
Con
s C
ycIn
dust
rials
Tech
Util
ities
Ene
rgy
BK
LN E
TF€
5-7y
r€
Fin
LT2
Telc
osX
over
JNK
E E
TF
$ H
YC
DX
HY
€ 7-
10yr
UC
00$
IGH
YG E
TFJN
K E
TFC
DX
EMPo
rtuga
lLQ
D E
TF$
EM IG
$ E
M H
Y$
EM
SO
VE
MB
ET
FE
MH
Y E
TFE
MLC
ETF
Gre
ece
IndicesSectorsPeripheryETFs

21
Tantrum 2.0 vs Tantrum 1.0
Source: RBS Credit Strategy, Bloomberg.
Total returns during the taper tantrum (22 May – 29 August 2013) vs 2014 sell off (30 June – 16 October 2014)
-25%
-20%
-15%
-10%
-5%
0%
5%
10%
€ Fi
n T1
€ 1-
3yr
€ H
YS&
P 5
00Sp
ain
sov
€ 3-
5yr
€ IG
Fin
sH
ealth
Cap
ital G
oods
Con
s N
on-c
yc€
IGIta
ly s
ovC
ons
Cyc
Indu
stria
lsTe
chU
tiliti
esEn
ergy
BKLN
ETF
€ 5-
7yr
€ Fi
n LT
2Te
lcos
JNK
E ET
F$
HY
€ 7-
10yr
£ IG
$ IG
HY
G E
TFJN
K E
TFPo
rtuga
l sov
LQD
ETF
$ EM
IG$
EM H
Y$
EM S
ovEM
B E
TFEM
HY
ETF
EMLC
ETF
Gre
ece
sov
Taper tantrum 2014 tantrum

22
Liquidity survey: Are you prepared?

23
Liquidity survey: Are you prepared?
What could make liquidity get worse in the near term?
Source: RBS Credit Strategy
How do you address lack of liquidity
Source: RBS Credit Strategy
84% of investors think lack of liquidity is a potential systemic risk for credit markets
0%
10%
20%
30%
40%
50%
60%
70%
Fed getsmore hawk ish
Risinggeopolit ical
risk
Idiosyncraticrisk
Eurozonedef lat ion
Other0%
10%
20%
30%
40%
50%
60%
70%
Mov
e to
mor
eliq
uid
asse
tcl
asse
s
Incr
ease
cas
h
Hol
d to
mat
urity
/laun
chfu
nds
with
targ
et d
ates
Trad
e m
ore
CD
S in
dice
s
Oth
er
Intro
duce
rede
mpt
ion
fees
24
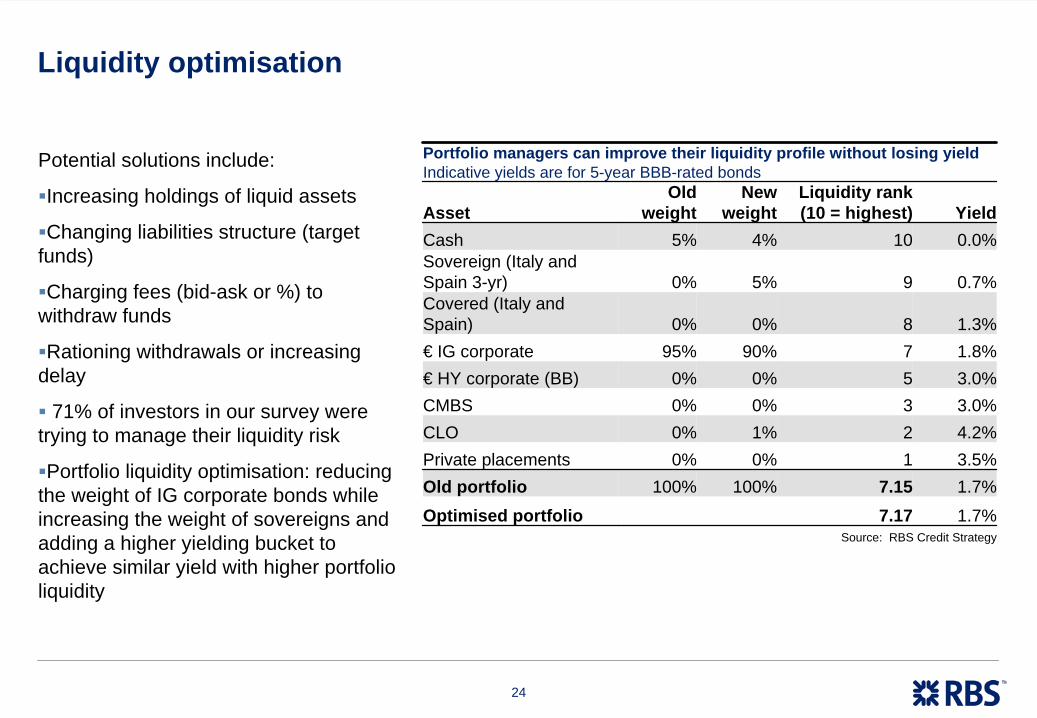
Liquidity optimisation
Portfolio managers can improve their liquidity profile without losing yield Indicative yields are for 5-year BBB-rated bonds
AssetOld
weightNew
weightLiquidity rank (10 = highest) Yield
Cash 5% 4% 10 0.0%Sovereign (Italy and Spain 3-yr) 0% 5% 9 0.7%Covered (Italy and Spain) 0% 0% 8 1.3%€ IG corporate 95% 90% 7 1.8%€ HY corporate (BB) 0% 0% 5 3.0%CMBS 0% 0% 3 3.0%CLO 0% 1% 2 4.2%Private placements 0% 0% 1 3.5%Old portfolio 100% 100% 7.15 1.7%
Optimised portfolio 7.17 1.7%Source: RBS Credit Strategy
Potential solutions include:
Increasing holdings of liquid assets
Changing liabilities structure (target funds)
Charging fees (bid-ask or %) to withdraw funds
Rationing withdrawals or increasing delay
71% of investors in our survey were trying to manage their liquidity risk
Portfolio liquidity optimisation: reducing the weight of IG corporate bonds while increasing the weight of sovereigns and adding a higher yielding bucket to achieve similar yield with higher portfolio liquidity

25Source: RBS Credit Strategy, Markit, Bloomberg. RBS JBI is an indicator of relative value of credit based on valuations, fundamentals, investor/issuer behaviour.
Vulnerable areas: High yield markets
0%
50%
100%
150%
200%
250%
300%
350%
400%
01 02 03 04 05 06 07 08 09 10 11 12 13 14
USEurope
Overvalued
Undervalued
RBS Junk Bubble Indicator (JBI) shows that European HY is no longer cheap

26
Flows of funds: Highest volatility in retail/HY segments
Source: RBS Credit Strategy, AMG US cumulative fund flows
-50
0
50
100
150
200
250
300
350
400
Jun 2010 Dec 2010 Jun 2011 Dec 2011 Jun 2012 D ec 2012 Jun 2013 Dec 2013 Jun 2014-10
0
10
20
30
40
50
60
70
80
Equity
Corp IG
Corp HY (RHS)
Loans (RHS)
Euro debt crisis
Yellen on HY
T aper Tantrum

27
The dangers of deflation: Small firms with high leverage will suffer
There is a weak tail of periphery firms with high leverage Share of listed companies by Net Debt/EBITDA, % total firms
Source: RBS Credit Strategy, Bloomberg
Default rates are low, but bad loans are rising European HY default rates vs average bank NPL%
Source: RBS Credit Strategy, Moody’s, Bloomberg, bank filings
0%
10%
20%
30%
40%
50%
60%
70%
80%
90%
100%
U K Ire Fra Ger Ita Esp Gre Por
<0 0-1 1-2 2-3 3-4 4-5 >5
0%
2%
4%
6%
8%
10%
12%
14%
2005 2006 2007 2008 2009 2010 2011 2012 2013 2014
HY default rates Average bank NPL%

28
Vulnerable areas: Contingent capital instruments
…but do expect a steep drop when a conversion occurs How do you think the market will react to a conversion?
Source: RBS Credit Strategy
Investors are searching for yield Why are you buying cocos?
Source: RBS Credit Strategy
Investors are asking for more standardisation. Real money demand could retreat on recent restrictions
Yield is the top reason why people buy cocos, despite heavy losses expected upon trigger event
0%
10%
20%
30%
40%
50%
60%
70%
80%
Yield Conversion isunlikely
Lack ofalternat ives
Cheap vs risks
0
10
20
30
40
50
60
70
0 -2 -4 -6 -8 -10 -12 -14 -16 -18 -20
Avg expected drop: -15%
% answers
But high tail risk
Coco market price drop following a conversion

29
Cocos: Large divergence in conversion/cancellation risks
Source: RBS Credit Strategy; based on model estimates for a 7% conversion trigger and an 8.5% cancellation threshold
Conversion and coupon cancellation probabilities
IntesaBBVA
Barclays
SocGenDB
Nationwide
Credit SuisseCredit Ag Group
UniC redit
UBS
Danske
Lloyds
Santander
NordeaKBCHSBC
0%
5%
10%
15%
0% 1% 2% 3% 4% 5% 6% 7% 8% 9% 10%
Probability of >1 cancellation in 5 years
Probability of conversion in 5 years
High earnings volat ility, weak capital
Low earnings volatility, strong capital High earnings volatility, strong capital
Low earnings volatility, weak capital

30
Vulnerable areas: Credit ETFs
ETFs own a larger share of the credit market now Corporate bond ownership in the US, % total
Source: RBS Credit Strategy, Federal Reserve
Liquidity mismatches are rising Days for the full liquidation of credit mutual funds & ETFs
Source: RBS Credit Strategy, IMF
0
10
20
30
40
50
60
70
2007 2008 2009 2010 2011 2012 2013 2014
U.S. corporate bond total
U.S. high yield7-day lim it for redemption payments
0%
1%
2%
3%
4%
5%
2006 2007 2008 2009 2010 2011 2012 20130%
2%
4%
6%
8%
10%
12%
14%
16%
18%
20%Money market funds Closed-end funds
ETFs Mutual funds (RHS)

31
1. Trading liquidity is low in corporate bonds. It has declined by around 70% since the crisis. Liquidity remains good on low-risk government bonds.
2. We measure trading liquidity using a combination of transaction costs, volumes and dealers’ inventories
3. Liquidity is polarised across areas of the bond market: few bonds trade every day, 80-90% do not
4. Are investors compensated for taking liquidity risk? Various indicators suggests they aren’t. Liquidity is a risk, no longer an opportunity
5. Which areas and instruments are most vulnerable? The low-end of the high yield market is fundamentally weak and exposed to deflation. It is also a highly retail- held market. Contingent capital instruments also bear strong negative convexity and lack standardisation, and are not priced according to risks
6. Is liquidity risk overstated? 84% of investors in our survey think lack of liquidity is a potential systemic risk for credit markets
7. The asset management industry can resist shocks, but some products may be vulnerable (e.g. credit ETFs)

32
Eurozone: Why liquidity will get worse

33
Banking systems: Euro area vs US
Source: RBS Credit Strategy, Bank of Italy, ECB, IMF, World Bank, FRED
5,605 - Number of banks - 5,783
3.1x - Bank assets/GDP - 0.8x
37 - Number of branches - 35 per 100,000 adults
22% - Bonds/total debt - 52%
16% - Mkt share of top 5 banks - 33%
€1,041bn - NPLs - $200bn
10.9% - NPLs/GDP - 1.2%
USEuro area

34
Stress test: Many passing banks are still weak
44% of banks failed or passed narrowly % by number and by total EU banking assets
Source: RBS Credit Strategy, ECB
Austria, UK and Germany have more narrow passes Assets as % of total banking system assets in the country
Source: RBS Credit Strategy, ECB
0%
10%
20%
30%40%
50%
60%
70%80%
90%
100%
Gre
ece
Cyp
rus
Aus
tria
UK
Italy
Bel
gium
Slo
veni
aP
ortu
gal
Ger
man
yIre
land
Fran
ceLa
tvia
Spa
inP
olan
dN
ethe
rland
sD
enm
ark
Finl
and
Hun
gary
Luxe
mbo
urg
Mal
taN
orw
aySw
eden
Fail Pass narrowly Pass
Narrow pass24%
(20% by total assets)
Pass56%
(77% by total assets)
Fail20%
(3% by total assets)
25
2969

35
Too big to fail has not gone awayBank asset size / GDP
0%
20%
40%
60%
80%
100%
120%
140%
160%
180%
200%
Dan
ske
UBS C
S
ING
Ban
k
San
tand
er
Rab
oban
k
HS
BC
Cre
dit A
g
BNP
Bar
clay
s
SEB
DB
KB
C
Soc
Gen
Uni
cred
it
BES
RZB
JPM
BAC C
iti
GS
MS
Source: RBS Credit Strategy, Bloomberg, company filings

36
0
10
20
30
40
50
60
70
80
Museums High schools Secondaryschools
Primaryschools
Pharmacies Kindergartens Hotels Bankbranches
Costs are still high
Source: RBS Credit Strategy, OECD, Istat
Number of branches per 1,000 people, Italy

37
Interconnectedness: Cross-holdings in Europe’s banking system
Source: RBS Credit Strategy, Bloomberg, company filings. Red = bank, Grey = sovereign, Blue = other
3.15%
Mediobanca8.7% UniCredit
Generali
12.2%
IntesaMonte
Groupama4.9%
Mediolanum
3.4%Credit AgricoleSocGen
0.52%
Natixis AM
AXA 0.52%
BNP
0.1%0.34%
Toro
1.4%1.3%
100%
0.10%
0.6%
2.45%
4.5%
Libya
2.6%
SantanderCredit Suisse
3.65%
France 2.51%
Deutsche Bank1.21%
0.01%
Commerzbank
0.19%
Allianz
Germany
Italy
17%
2.27%
2.28%
Bankinter
0.15%
2.8%UBS
Singapore
6.4%
Norway
3.26%
BBVA
0.22%
6.43%
Abu Dhabi
POP
State Street
0.14%
Caixa Geral4.92%
Portugal Telecom
0.16%
Telefonica
RepsolCaixabank
2.81%
11.6%
5.6%
5.75%CRH
4%
Veolia
5%
IberdrolaQatar9.42%
Gas Natural
Caixa Holdings34.6%
1.7%
BlackRock6.44%
0.07%
1.18%
9.88%
Fondo Strategico
77.7%
2.57%

38
Current leverage ratio requirements are too low
Bank losses in previous crises Losses as % of loans and assets
Source: RBS Credit Strategy, Bloomberg, Company filings
European banks are generally between 3-4% capital Leverage ratio, Q4 2013
Source: RBS Credit Strategy, Company filings. Using our estimates for Intesa and UniCredit
We estimate that banks need to reach a leverage ratio of 5.8% to insulate sovereigns from the cost of a crisis
Bail-in is only useful for idiosyncratic losses. 3% leverage ratio is insufficient
0%
5%
10%
15%
20%
AIB
Ang
lo
NB
G
Bank
ia
Amag
Mon
te
HB
OS ML
BoI
WaM
u
B&
B
Wac
h
Nro
ck
SN
S
UB
S
Dex
ia
Losses as % initial loans Losses as % initial assets
0%
1%
2%
3%
4%
5%
6%
BBV
A
Inte
sa
San
tand
er
Rab
oban
k
Uni
cred
it
KBC
Nor
dea
ING
Ban
k
Cre
dit A
g G
roup
BN
P
Soc
Gen
AB
N
Lloy
ds
UB
S
CM
ZB
Dan
ske
DB
Bar
clay
s
CS
Leverage ratio

39
Bank capital is near a 200-year low. More capital = less liquidity…
Source: RBS Credit Strategy, FDIC, Historical Statistics of America
0%
10%
20%
30%
40%
50%
60%
70%
1834 1844 1854 1864 1874 1884 1894 1904 1914 1924 1934 1944 1954 1964 1974 1984 1994 2004
Book value of equity / total assets for US banks

40
Capitalism without capital: The RWA optimisation arbitrage
Source: RBS Credit Strategy, Bloomberg
Large banks have optimised risk weights, but absolute capital levels remain low
0%
10%
20%
30%
40%
50%
60%
70%
80%
90%
100%
0 200 400 600 800 1,000 1,200 1,400 1,600 1,800 2,000
Credit Ag
HSBC
BNP
DB
Barclays
Soc Gen
Santander
BPCELloyds
UBSNordeaCS
UniCredit
ING
BBVA
Intesa
Rabo
Natixis
DanskeABN
SHSEB
PohjolaNwideDeka
LBBWDZ
Balance sheet size, EUR bn
RWA % total

41
Is more stimulus a solution?
Source: RBS Credit Strategy, Bloomberg, Federal Reserve, ECB, Bank of Japan, Bank of England
Central bank assets, $tn
0
2
4
6
8
10
12
14
16
18
2007 2008 2009 2010 2011 2012 2013 Now 2015E
BoE
BoJ
EC B
Fed
PBoC

42
The QE infinity trap: Further easing expectations can delay investment
Tighter fiscal policy than when the US and Japan did QE Government deficit, % GDP
Source: RBS Credit Strategy, IMF
Drops in interest rate do not seem to boost investment Change in US corporate investment after certain events, %
Source: RBS Credit Strategy, S.P. Kothari, J. Lewellen, J. Warner, the Economist (data from 1952 onwards)
-2%
-1%
0%
1%
2%
3%
4%
5%
6%
1 2 3 4 5 6Quarters after event
1 ppt decrease in interes t rates
10% increase in profits10% increase in return to shareholders
-14%
-12%
-10%
-8%
-6%
-4%
-2%
0%
2000 2002 2004 2006 2008 2010 2012 2014
Euro area USJapan
IMF forecas ts
Start of Fed QE
Start of ECB QE?
Start of BoJ QE
BoJ QE expansion
(Abenomics)
BoJ QE expans ion

43
The credit supercycle
Source: RBS Credit Strategy, ECB, FRED, Bloomberg
?
0
10
20
30
40
50
60
70
52 54 56 58 60 62 64 66 68 70 72 74 76 78 80 82 84 86 88 90 92 94 96 98 00 02 04 06 08 10 12 14
US GDPUS credit market debtEuropean credit m arket debt
Com petition & credit control introduced / Bretton Woods breaks down
Big Bang (UK) Glass-Steagall Act repealedFinancial crisisQuantitative eas ing
$tn
You are here
Asset bubbles
Deflation

44
Source: Google images
Conclusions: Learn to live with low liquidity
1. The size and shape of bond market has changed. There are more bonds, less trading liquidity and more leveraged products
2. Bond markets are vulnerable to policy normalisation in the US and UK, and investors are not paid for liquidity risk. Standardising bond markets will take time
3. European banks are still weak and will remain focused on strengthening capital, and liquidity will remain scarce for now
4. Investors should learn to live with low liquidity, adjusting their asset mix and liabilities structure

45
Source: Google images
BibliographyBank of England | Financial Stability Report, June 2014
BlackRock | Setting New Standards: The Liquidity Challenge II, May 2013
International Monetary Fund | 2014 Article IV Consultation with the United States of America, Concluding Statement of the IMF Mission, June 2014
M&G Bond Vigilantes | Corporate bond market liquidity – flush or flushed?, 4 December 2012
ESMA | Transparency of corporate bond, structure finance product and credit derivatives markets, 10 July 2009
SEC Fixed Income Roundtable | Michael A. Goldstein: Corporate Bonds
Biais, B.; Declerck, F. (2013), Liquidity, Competition & Price Discovery in the European Corporate Bond Market, Toulouse School of Economics
Chen, G.; Cui, R.; He, Z.; Konstantin, M. (2013), Quantifying Liquidity and Default Risks of Corporate Bonds over the Business Cycle, Chicago Booth
Dick-Nielsen, J. (2013), Dealer Inventory and the Cost of Immediacy, Copenhagen Business School
Dick-Nielsen, J.; Feldhütter, P.; Lando, D. (2012), Corporate bond liquidity before and after the onset of the subprime crisis, Journal of Financial Economics 103
Ejsing, J. W.; Sihvonen, J. (2009), Liquidity premia in German government bonds, Swiss National Bank
Fisher, R. W. (2014); Monetary Policy and the Maginot Line, Federal Reserve Bank of Dallas
Gallo, A. (2014); Fed has grown complacent on credit market risk, Financial Times
Scott-Quinn, B.; Cano, D., European Corporate Bond Trading – the role of the buy-side in pricing and liquidity provision
Schultz, P. (1998), Corporate Bond Trading Costs and Practices: A Peek Behind the Curtain, University of Notre Dame
Singh, M. (2013), Collateral and Monetary Policy, IMF Working Paper
Carroll, C.D.; Slacalek, J. and Tokuoka, K. (2014), The distribution of wealth and the MPC: Implications of new European data, ECB Working Paper Series No 1648
Gallo, A. (2014), Regulators must act on coco bond risks, Financial Times
Gallo, A. (2014), A QE Boost for business lending, WSJ

46
© Copyright 2014 The Royal Bank of Scotland plc and affiliated companies ("RBS"). All rights reserved.
This Material was prepared by the legal entity named on the cover or inside cover page. It is provided for informational purposes only and does not constitute an offer to sell or a solicitation to buy any security or other financial instrument. While based on information believed to be reliable, no guarantee is given that it is accurate or complete. While we endeavour to update on a reasonable basis the information and opinions contained herein, there may be regulatory, compliance or other reasons that prevent us from doing so. The opinions, forecasts, assumptions, estimates, derived valuations and target price(s) contained in this Material are as of the date indicated and are subject to change at any time without prior notice. The investments referred to may not be suitable for the specific investment objectives, financial situation or individual needs of recipients and should not be relied upon in substitution for the exercise of independent judgement. The stated price of any securities mentioned herein is as of the date indicated and is not a representation that any transaction can be effected at this price. Neither RBS nor other persons shall be liable for any direct, indirect, special, incidental, consequential, punitive or exemplary damages, including lost profits arising in any way from the information contained in this Material. This Material is for the use of intended recipients only and the contents may not be reproduced, redistributed, or copied in whole or in part for any purpose without RBS' prior express consent. In any jurisdiction in which distribution to private/retail customers would require registration or licensing of the distributor which the distributor does not currently have, this Material is intended solely for distribution to professional and institutional investors. RBS usually makes a market in fixed income and equity securities of issuers discussed in this report and usually deal as a principal in these securities.
THIS MATERIAL IS CLASSIFIED AS INVESTMENT RESEARCH AS DEFINED BY THE FINANCIAL CONDUCT AUTHORITY.
Analyst Certification: The research analyst or analysts responsible for the content of this research report certify that: (1) the views expressed and attributed to the research analyst or analysts in the research report accurately reflect their personal opinion(s) about the subject securities and issuers and/or other subject matter as appropriate; and, (2) no part of his or her compensation was, is or will be directly or indirectly related to the specific recommendations or views contained in this research report. On a general basis, the efficacy of recommendations is a factor in the performance appraisals of analysts. RBS policy prohibits its analysts, professionals reporting to analysts and members of their households from owning securities and from serving as an officer, director, advisory board member or employee of any company in the analyst's area of coverage.
Australia: This Material is issued in Australia by The Royal Bank of Scotland plc (ABN 30 101 464 528), 88 Phillip Street, Sydney NSW 2000, Australia which is authorised and regulated in Australia by the Australian Securities and Investments Commission (AFS License No. 241114) and the Australian Prudential Regulation Authority. Canada: The securities mentioned in this Material are available only in accordance with applicable securities laws and many not be eligible for sale in all jurisdictions. Persons in Canada requiring further information should contact their own advisors. EEA: This Material constitutes "investment research" for the purposes of the Markets in Financial Instruments Directive and as such contains an objective or independent explanation of the matters contained in the Material. Any recommendations contained in this Material must not be relied upon as investment advice based on the recipient's personal circumstances. In the event that further clarification is required on the words or phrases used in this Material, the recipient is strongly recommended to seek independent legal or financial advice. Denmark: The Royal Bank of Scotland N.V. is authorised and regulated in the Netherlands by De Netherlandsche Bank. In addition, The Royal Bank of Scotland N.V. Danish branch is subject to local supervision by Finanstilsynet, The Danish Financial Supervisory Authority. Hong Kong: To the extent this Material constitutes Type 4 regulated activity (advising on securities) and not within ancillary activities as defined in Part 1, Schedule 5 of the Securities and Futures Ordinance (Cap. 571 of the Laws of Hong Kong), this Material must not be distributed or transmitted into or within Hong Kong Special Administrative Region of the People's Republic of China. India: Shares traded on stock exchanges within the Republic of India may only be purchased by different categories of resident Indian investors, Foreign Institutional Investors registered with The Securities and Exchange Board of India ("SEBI") or individuals of Indian national origin resident outside India called Non Resident Indians ("NRIs"). Any recipient of this Material wanting additional information or to effect any transaction in Indian securities or financial instrument mentioned herein must do so by contacting a representative of RBS Equities (India) Limited. RBS Equities (India) Limited is a subsidiary of The Royal Bank of Scotland N.V.. Italy: Persons receiving this Material in Italy requiring further information should contact The Royal Bank of Scotland N.V. Milan Branch. Japan: This report is being distributed in Japan by RBS Securities Japan Limited to institutional investors only. Malaysia: RBS research, except for economics and FX research, is not for distribution or transmission into Malaysia. Netherlands: the Authority for the Financial Markets ("AFM") is the competent supervisor. Russia: This Material is distributed in the Russian Federation by RBS and "The Royal Bank of Scotland" ZAO (general banking license No. 2594 issued by the Central Bank of the Russian Federation, registered address: building 1, 17 Bolshaya Nikitskaya str., Moscow 125009, the Russian Federation), an affiliate of RBS, for information purposes only and is not an offer to buy or subscribe or otherwise to deal in securities or other financial instruments, or to enter into any legal relations, nor as investment advice or a recommendation with respect to such securities or other financial instruments. This Material does not have regard to the specific investment purposes, financial situation and the particular business needs of any particular recipient. The investments and services contained herein may not be available to persons other than 'qualified investors" as this term is defined in the Federal Law "On the Securities Market". Singapore: This Material is distributed in Singapore by The Royal Bank of Scotland plc, Singapore branch ("RBS plc Singapore"), Level 26, One Raffles Quay, South Tower, Singapore 048583, which is regulated by the Monetary Authority of Singapore. Singapore recipients should contact RBS plc Singapore at +65 6518 8888 for additional information. This Material and the equity securities, investments or other financial instruments referred to herein are not in any way intended for, and will not be available to, investors in Singapore unless they are accredited investors, expert investors and institutional investors (as defined in Section 4A(1) of the Securities and Futures Act (Cap 289) of Singapore (“SFA”). Further, without prejudice to any of the foregoing disclaimers, where this material is distributed to accredited investors or expert investors, RBS plc Singapore is exempted by Regulation 35 of the Financial Advisers Regulations (“FAR”) from the requirements in Section 36 of the Financial Advisers Act (Cap 110) of Singapore (“FAA”) mandating disclosure of any interest in securities referred to in this material, or in their acquisition or disposal. Recipients who are not accredited investors, expert investors or institutional investors should seek the advice of their independent financial advisors prior to making any investment decision based on this document or for any necessary explanation of its contents. South Korea: This Material is being distributed in South Korea by, and is attributable to, RBS Asia Limited (Seoul) Branch which is regulated by the Financial Supervisory Service of South Korea. Thailand: Pursuant to an agreement with Asia Plus Securities Public Company Limited (APS), reports on Thai securities published out of Thailand are prepared by APS but distributed outside Thailand by RBS Bank NV and affiliated companies. Responsibility for the views and accuracy expressed in such documents belongs to APS. Turkey: The Royal Bank of Scotland N.V. is regulated by Banking Regulation and Supervision Authority (BRSA). UAE and Qatar: This Material is produced by The Royal Bank of Scotland N.V and is being distributed to professional and institutional investors only in the United Arab Emirates and Qatar in accordance with the regulatory requirements governing the distribution of investment research in these jurisdictions. Dubai International Financial Centre: This Material has been prepared by The Royal Bank of Scotland N.V. and is directed at "Professional Clients" as defined by the Dubai Financial Services Authority (DFSA). No other person should act upon it. The financial products and services to which the Material relates will only be made available to customers who satisfy the requirements of a "Professional Client". This Material has not been reviewed or approved by the DFSA. Qatar Financial Centre: This Material has been prepared by The Royal Bank of Scotland N.V. and is directed solely at persons who are not "Retail Customer" as defined by the Qatar Financial Centre Regulatory Authority. The financial products and services to which the Material relates will only be made available to customers who satisfy the requirements of a "Business Customer" or "Market Counterparty". United Kingdom: The Royal Bank of Scotland plc is authorised by the Prudential Regulation Authority and regulated by the Financial Conduct Authority and the Prudential Regulation Authority. United States of America: This Material is intended for distribution only to "major institutional investors" as defined in Rule 15a-6 under the U.S. Exchange Act of 1934 as amended (the "Exchange Act"), and may not be furnished to any other person in the United States. Each U.S. major institutional investor that receives these Materials by its acceptance hereof represents and agrees that it shall not distribute or provide these Materials to any other person. Any U.S. recipient of these Materials that wishes further information regarding, or to effect any transaction in, any of the securities discussed in this Material, should contact and place orders solely through a registered representative of RBS Securities Inc., 600 Washington Boulevard, Stamford, CT, USA. Telephone: +1 203 897 2700. RBS Securities Inc. is an affiliated broker-dealer registered with the U.S. Securities and Exchange Commission under the Exchange Act, and a member of the Securities Investor Protection Corporation (SIPC) and the Financial Industry Regulatory Authority (FINRA).
Material means all research information contained in any form including but not limited to hard copy, electronic form, presentations, e-mail, SMS or WAP.
Disclosures regarding companies covered by us can be found on our research website. Please use https://strategy.rbsm.com/disclosures/default.aspx for Research.
Our policy on managing research conflicts of interest can be found here https://strategy.rbsm.com/Strategy/ConflictsPolicy.aspx.Should you require additional information please contact the relevant research team or the author(s) of this Material.