the critical role of demand-side esources in power …
TRANSCRIPT

EFFICIENT RELIABILITY
THE CRITICAL ROLE OF DEMAND-SIDE RESOURCES
IN POWER SYSTEMS AND MARKETS
Prepared forThe National Association of Regulatory Utility Commissioners
Richard CowartRegulatory Assistance Project
June, 2001
EFFICIENT RELIABILITY
THE CRITICAL ROLE OF DEMAND-SIDE RESOURCES
IN POWER SYSTEMS AND MARKETS
Prepared byThe Regulatory Assistance Project
forThe National Association of Regulatory Utility Commissioners
June, 2001
Richard H. Cowart
with assistance from:
Cheryl HarringtonDavid MoskovitzRichard SedanoWayne Shirley
Frederick Weston
Funded by a grant fromThe Energy Foundation
The Regulatory Assistance Project16 State Street


EFFICIENT RELIABILITY PAGE i
ACKNOWLEDGMENTS
This paper could not have been written without the creative insights, and the corrections and suggestionsprovided by many talented and helpful people. Many of the ideas in this work have emerged fromcollaborative discussions and workshops involving all of my colleagues at RAP. Eric Hirst and BrendanKirby provided excellent assistance on engineering and system management aspects of reliability.
Many others in the electric utility, regulatory, and advocacy communities have provided much of thedetailed information in the paper, and have helped to develop and critique the key ideas it presents.Those involved in the Lighten the Load project, including Lea Aeschliman, Jon Coifman, John White, Ralph Cavanagh, and Steve Nadel provided essential information and useful guidance on the context ofreliability challenges around the country. Others, including Riley Allen, Ned Raynolds, Chuck Goldman,John Plunkett, and Marty Kushler, provided information and critical comments that have improved thetext in many places.
We are indebted to the Energy Foundation for supporting this research, and to NARUC’s EnergyResources and Environment Committee for sponsoring the work, and providing invaluable guidance onthe ideas contained in the paper. Many useful suggestions, both substantive and editorial, were providedby Committee members and staff, including Nancy Brockway, Denis Bergeron, Alison Silverstein, andAnn Thompson. Despite all of this useful assistance, the views and opinions expressed herein, and allremaining errors, are solely those of the author.
In a more basic sense, this examination of public policy issues would not have been possible without thededication, commitment, and public-spirited focus of the Commissioners and Commission Staff of theNARUC who have sought to advance the public good through research, education and policydevelopment. This paper is really part of a series, stretching back many years, through whichCommissioners and Staff have examined tough problems and their solutions. I owe a great debt tomany in the regulatory community who have, over the course of two decades, provided the foundationsfor this work.

EFFICIENT RELIABILITY PAGE ii
TABLE OF CONTENTS
ACKNOWLEDGMENTS . . . . . . . . . . . . . . . . . . . . . . . . . . . . . . . . . . . . . . . . . . . . . . . . . . . . . . . . . . . . . i
EXECUTIVE SUMMARY . . . . . . . . . . . . . . . . . . . . . . . . . . . . . . . . . . . . . . . . . . . . . . . . . . . . . . . . . . . iv
I. INTRODUCTION . . . . . . . . . . . . . . . . . . . . . . . . . . . . . . . . . . . . . . . . . . . . . . . . . . . . . . . . . . . . . . . 1
II. THE UNWELCOME TRIO IN TODAY’S POWER MARKETS: RELIABILITY CHALLENGES, PRICE SPIKES,AND GENERATOR MARKET POWER . . . . . . . . . . . . . . . . . . . . . . . . . . . . . . . . . . . . . . . . . . . 3A. Reliability Challenges Expose the Value of Demand-Side Resources . . . . . . . . . . 3B. Compounding the Problems of Thin Margins: Price Spikes and Market Power . . 7
1. Price Spikes . . . . . . . . . . . . . . . . . . . . . . . . . . . . . . . . . . . . . . . . . . . . . . . . . . . 72. Market Power . . . . . . . . . . . . . . . . . . . . . . . . . . . . . . . . . . . . . . . . . . . . . . . . . . 9
C. Sources of Today’s Reliability Problems . . . . . . . . . . . . . . . . . . . . . . . . . . . . . . . . 101. Capacity Crunches are Directly Related to Load Growth . . . . . . . . . . . . . 102. Successful Energy Efficiency Programs Have Been Cut Back . . . . . . . . . 123. The Efficiency Yo-Yo: Demand-Side Cuts and the Rush to Restore Programs
. . . . . . . . . . . . . . . . . . . . . . . . . . . . . . . . . . . . . . . . . . . . . . . . . . . . . . . . . 14
III. SUPPLY-SIDE AND DEMAND-SIDE RELIABILITY: THE PRACTICAL REALITIES OF EXISTING POLICY16A. “Wires and Turbines” Reliability – Some Practical Considerations . . . . . . . . . . . 16
1. The Cost of New Generation . . . . . . . . . . . . . . . . . . . . . . . . . . . . . . . . . . . . . 172. Increasing Demands on Transmission Networks . . . . . . . . . . . . . . . . . . . . . 173. The Costs and Consequences of Overloaded Distribution Networks . . . . 184. Fuel Supply: Costs and Conflicts . . . . . . . . . . . . . . . . . . . . . . . . . . . . . . . . . 195. Environmental Costs of “Wires and Turbines” Reliability . . . . . . . . . . . . . 20
B. The Untapped Potential of Efficiency and Load Management – How Large is the Reservoir?221. Utility DSM Experience . . . . . . . . . . . . . . . . . . . . . . . . . . . . . . . . . . . . . . . . 232. Non-Utility Studies . . . . . . . . . . . . . . . . . . . . . . . . . . . . . . . . . . . . . . . . . . . . 243. Potential for Price-Responsive Peak Reductions by Customers . . . . . . . 254. How Large Does the Customer Response Need to Be? . . . . . . . . . . . . . . . 26
IV. WHY DON’T ELECTRICITY MARKETS SUPPORT EFFICIENCY AND LOAD MANAGEMENT? MARKET
FLAWS AND MARKET BARRIERS IN TODAY’S
POWER MARKETS . . . . . . . . . . . . . . . . . . . . . . . . . . . . . . . . . . . . . . . . . . . . . . . . . . . . . . . 28A. Historic Barriers to Energy Efficiency Remain . . . . . . . . . . . . . . . . . . . . . . . . . . . 28B. The New Efficiency Vacuum: How Efficiency Harms Utility Profits . . . . . . . . . 28
1. Competitive Generation Incentives . . . . . . . . . . . . . . . . . . . . . . . . . . . . . . . 292. Wires Company Revenues and the Problem of Lost Profits Math . . . . . . 29
C. Barriers to Efficiency in Wholesale Power Markets . . . . . . . . . . . . . . . . . . . . . . 31

EFFICIENT RELIABILITY PAGE iii
1. Six Reasons the Demand-Side Lags in Wholesale Market Reforms . . . . . 32
V. TAPPING THE DEMAND-SIDE RESERVOIR : A SOLUTION MENU FOR DECISION-MAKERS . . . . . . . 34A. Demand-Side Resources in Regional Power Pools and New Electricity Markets 36
1. Demand-Side Bidding . . . . . . . . . . . . . . . . . . . . . . . . . . . . . . . . . . . . . . . . . . 37a. Reforming Load Profiles: An Essential Step for Demand-Side Bidding
. . . . . . . . . . . . . . . . . . . . . . . . . . . . . . . . . . . . . . . . . . . . . . . . . . . 402. Multi-Settlement Markets . . . . . . . . . . . . . . . . . . . . . . . . . . . . . . . . . . . . . . . 413. Opening Ancillary Services Markets to Demand-Side Resources . . . . . . 444. Efficient Reliability Standard . . . . . . . . . . . . . . . . . . . . . . . . . . . . . . . . . . . . 49
B. Rates and Rules for Wires Companies . . . . . . . . . . . . . . . . . . . . . . . . . . . . . . . . . . 531. Transmission-Level Congestion Pricing . . . . . . . . . . . . . . . . . . . . . . . . . . . 532. Enhancing Reliability Through Retail Rate Design . . . . . . . . . . . . . . . . . . . 55
a. Reforming Traditional Rate Caps and Default Service Rates . . . . 56b. Revenue Caps, Not Price Caps or Fixed Charges, for Wires Companies
. . . . . . . . . . . . . . . . . . . . . . . . . . . . . . . . . . . . . . . . . . . . . . . . . . . 60C. Promoting End-Use Efficiency . . . . . . . . . . . . . . . . . . . . . . . . . . . . . . . . . . . . . . . . 60
1. Energy Efficiency’s Multiple Reliability Benefits . . . . . . . . . . . . . . . . . . 612. Capturing Efficiency Resources: Mechanisms for Today’s Markets . . . . 63
a. System Benefit Funds . . . . . . . . . . . . . . . . . . . . . . . . . . . . . . . . . . . . . 63b. The Energy Efficiency Utility: . . . . . . . . . . . . . . . . . . . . . . . . . . . . . 65c. System Benefit or Uplift Charges at the Regional Level . . . . . . . . 65d. Complementary Policies for Efficiency . . . . . . . . . . . . . . . . . . . . . 67
VI. CONCLUSION . . . . . . . . . . . . . . . . . . . . . . . . . . . . . . . . . . . . . . . . . . . . . . . . . . . . . . . . . . . . . . 68
APPENDIX . . . . . . . . . . . . . . . . . . . . . . . . . . . . . . . . . . . . . . . . . . . . . . . . . . . . . . . . . . . . . . . . . . . 70

EFFICIENT RELIABILITY PAGE iv
EXECUTIVE SUMMARY
The reliability of electric supply, long taken for granted by most citizens and governmental officials, isnow a matter of increasing national concern. Economic growth, heat waves and cold snaps are drivingthe demand for power to new peaks and taxing an already-constrained electric grid. Policymakers areconsidering what steps can be taken to assure system reliability during the transition to competitivemarkets, where traditional utility rules of price restraint and mutual aid are under siege. The Californiapower crisis of 2000-2001 commands national attention, but reliability problems in various forms arearising in almost every region of the country.
As the recently-released National Energy Policy states, “A fundamental imbalance between supplyand demand defines our nation’s energy crisis.” New investments in generation and transmissionare obvious reactions to reliability challenges, but we must also consider the very real reliability benefitsthat can be captured from energy resources held by customers: efficiency and load management,customer-owned generation, and customer responses to market prices.
The nation’s utility regulators have also recognized the importance of demand-side resources forreliability. They have by resolution urged state regulators, power pools, and Congress to “encourage andsupport programs for cost-effective energy efficiency and load management investments as both a short-term and long-term strategy for enhancing the reliability of the nation’s electric system..” This reportexplores the role that those resources can play in restoring the demand-supply balance in electricity. Itconcludes that as much as 40% to 50% of expected load growth over the next 20 years can be metthrough end-use efficiency and load management, cost-effectively and reliably. It sets out a menu ofregulatory and policy solutions to achieve that potential.
The Benefits of Demand-Side Resources
A narrow focus on fixing today’s weakest links in supply and delivery alone will ultimately be lessresilient and more expensive than a strategy that also targets reliability-enhancing demand-sideinvestments. Utility managers and regulators are often called on to identify the immediate causes of eachreliability event of public concern. It is usually possible to identify the weak link in the chain that linksgeneration, systems operation, transmission, and distribution to customer load. And, certainly,inadequate generation capacity, aging distribution infrastructure, and overloaded transmission links mustbe addressed to ensure reliable, high-quality service. But there are powerful reasons that reliabilitypolicy should also focus on, and seek to capture, demand-side solutions to reliability problems:
• Avoiding new weak links: By accepting load growth and demand spikes as givens, andattempting to meet them through an exclusive wires and turbines policy, reliability managers canfix each “weakest link” in the supply chain as it appears. But once one upgrade is completed, thenext weakest link will then emerge. For example, when load growth is met through increasedgeneration, it is likely that transmission links and gas pipeline capacity will be more stressed,

EFFICIENT RELIABILITY PAGE v
particularly in peak periods. Unless electric and gas transmission upgrades are also secured, theresulting degradation in transmission and fuel supply reliability may offset the gain in reliability dueto the new generation. Demand-side resources, on the other hand, can lighten the load at theend of the supply/delivery chain, and thus simultaneously enhance the reliability of each link in theentire chain, from generation adequacy and fuel supply all the way through to the localdistribution network.
• Matching needs and resources: Energy efficiency load reductions follow the load profile ofthe end-uses that set the system load curve during critical hours. For example, in most regions,air-conditioning load accounts for a major portion of daily system load swings on peak days.Improving air-conditioning efficiency automatically generates savings that lighten the system loadduring the most critical periods.
• Economic benefits: Enhancing reliability through demand side measures can also lower thenation’s electric bill. Many efficiency measures are simply less expensive than the costs ofgeneration, delivery, and reserves that they displace. Moreover, persistent high demand and highpeak loads are principal drivers of the price spikes and growing market power exercised bygenerators in wholesale power markets. Lightening the load can widen the margin betweendemand and supply, moderating generator market power and lowering wholesale market prices.
• Environmental benefits: Demand-side measures also lower the environmental footprint of theelectric industry, one of the most significant sources of pollution in modern society. Loadmanagement and load response programs lessen the need for new power plants and transmissionlines, while efficiency measures lower total fuel consumption and the related costs of airpollution, fuel extraction, and waste disposal. By lowering the risk of future environmentalproblems, demand-side measures also improve the long-term reliability of the electric system.
How Did We Get Here? Load Up, Efficiency Down
Load growth in the United States, and particularly peak load growth, have been proceeding at a pacethat has put great strains on our power system infrastructure. Between 1994 and 1999, non-coincidentsummer peak load in the U.S. increased by 95,000 MW. This is the equivalent of adding a new, 6-stateNew England to the nation’s electrical demand every 14 months. The Bush Administration’s NationalEnergy Policy now estimates that electricity demand will increase 45% by 2020, requiring the additionof 393,000 MW of new generating capacity. This is roughly nine times larger than California’s recentpeak load.
Meanwhile, unfortunately, the contribution of utility-sponsored demand-side management programs(DSM) to meeting the nation’s load growth needs has been in decline. In the early 1990's, utility DSMprograms saved a total of 29,000 MW at a cost of about 3 cents per kWh saved. Despite this generallysolid record of success, since the passage of the Energy Policy Act and the national move to retail

EFFICIENT RELIABILITY PAGE vi
electric competition, utility-sponsored DSM programs have been cut back sharply. Total utility DSMspending has declined by about 50% since 1993. Urgent efforts to restore those programs under crisisconditions are now underway in some states, with attendant logistical, marketing, and cost problems ofoff-again, on-again operations.
“Wires and Turbines” Reliability -- Some Practical Considerations
Undoubtedly, significant new investment in generation and transmission is justified on both on economicand reliability grounds. Economic growth, changes in settlement patterns, and the emergence of superiortechnologies all support a conclusion that many investments in generation and transmission are neededand should be supported in new markets and regulatory systems.
However, a national generation expansion program that overlooks cost-effective efficiency and load-management resources will be more expensive and less reliable than a program that is more balancedand more flexible. A supply-side strategy will require a very large commitment of investment capital ingenerating plants, gas pipelines, and electric transmission and distribution lines. It will also posesignificant new challenges for natural gas supply, increasing total annual demand by as much as one-third,and place upward pressure on gas prices. Finally, electric generation and transmission facilities bring withthem very substantial environmental costs, which must be absorbed or offset through additionalmitigation measures.
The Demand-Side Reservoir is Very Large Over the past two decades, there have been numerous studies, experiments, and programs aimed atimproving the efficiency of electricity use in the United States. The central lesson of these studies andinitiatives is that very large reservoirs of low-cost energy and capacity resources on the customer side ofthe electric meter are still untapped today. A careful review of past programs and current marketdata support a conclusion that a large fraction -- as much as half -- of the nation’s anticipatedload growth over the next decade could be displaced through energy efficiency, pricingreforms, and load management programs.
C In the decade up to 1994, utility-sponsored efficiency and load management programs avoided atotal of 29,000 MW, and avoided electric consumption at a utility cost of less than $0.03 perkWh. The DOE’s five National Energy Laboratories concluded in 1997 that cost-effectiveenergy efficiency investments could displace 15% of the nation’s total electrical demand by theyear 2010. This result is consistent with the experience of many utilities as well as several otherlarge-scale studies.
C Customer market studies and load-response pilot programs demonstrate that the potential forload management is also quite substantial. While most of the load of most large customers isconstrained by commercial and production needs, approximately 15% to 17% of their total load

EFFICIENT RELIABILITY PAGE vii
could be managed in response to short-term price signals. A relatively modest load responsewould lower peak demand, improve reliability, and lower power costs across regional powermarkets.
Historic Market Barriers and New Market Flaws Block Demand-Side Responses
Cost-effective energy efficiency investments are often untapped in the U.S. economy due to a number ofmarket imperfections and market barriers faced by individual customers. Even in the fluid and price-responsive electricity markets envisioned by restructuring advocates, most of the well-known andwidely-documented barriers to efficiency investments will remain. Moreover, the reduced sweep ofutility integrated resource planning (IRP), and new market rules and utility incentives have created newimpediments to market-based efficiency and load management.
In a competitive generation market, generators have no financial incentive to promote either efficiency orload management, and they profit handsomely from high peak prices. And under the rate designscommonly in use, wires companies profit from increased throughput, and find their profits harmed byenergy efficiency programs. Nor are today’s wholesale power markets structured to overcome these barriers or to reveal the valueof demand-side resources to market participants. While market advocates sometimes assume thatdemand-side responses can be “left to the market,” current market structures actually block price signalsfrom reaching service providers. Because of these structural barriers, neither providers, nor load-servingentities, nor end-users see the real value that demand-side resources can provide to the market and thegrid. Thus, the U.S. wholesale electric markets are more expensive, more volatile, and less reliable thanthey should be.
Tapping the Demand-Side Reservoir: A Solution Menu for Decision-makers
Our nation now has nearly twenty years’ experience with utility-sponsored energy efficiency programs,and has been engaged for several years in developing wholesale and retail markets in electricity. Theseexperiences lead to the central conclusion of this report:
Cost-effective efficiency and load management investments could significantly improve thereliability of the nation’s electric system, and make electricity markets more competitive andmore efficient, while lowering the economic and environmental costs of electric service. While the advantages of demand-side resources are widely recognized, there is no single “silver bullet”mechanism for capturing all of those benefits for electric systems and customers. Rather, the challengefacing decision-makers is to examine each market component, and each important market or regulatoryrule with the following questions in mind:

EFFICIENT RELIABILITY PAGE viii
Could the function of this market or the purpose of this rule be served at lower cost and/orlower risk through demand-side resources? And if so, how can we organize this market orstructure this rule to ensure that high-reliability, low-cost solutions are in fact developed?
Throughout the many markets and franchises operating in the U.S. today there are three major venuesfor discovering and deploying cost-effective efficiency resources:
A. Wholesale Market Structures:
Wholesale markets should be designed to invite demand-side price responses to bid against supply onthe trading floors of new electricity markets, and should permit demand-side resources to compete withtransmission and generation investments to meet system needs. The report sets out four policy reformsin this area:
C Demand-side Bidding: Early wholesale power markets have treated the demand side of themarket as essentially inelastic, and have focused on promoting competition among bidders onlyon the supply side. It is essential to open the trading floor to the demand side, and reveal theslope of the demand curve. Markets will clear at lower quantities and lower prices, especially inpeak periods, when this curve is exposed.
C Reforming Load Profiles: An essential step in promoting meaningful demand-side bidding is
the reform of the system of load profiles used by wholesale markets and wires companies toassign load responsibility among load-serving entities. With alternative load profiles in place,service providers would have an incentive to seek out customers who have less expensive (off-peak) consumption patterns, and to invest in equipment and rate plans that would movecustomers to more advantageous load profiles.
C Multi-Settlement Markets: A second needed reform in wholesale markets extends the
potential of demand responsiveness by recognizing the differences between projected marketconditions and real-time events. Bidding rules should permit market participants to planconsumption and generation decisions in advance, but they should also permit additionaladjustments to those plans in response to real-time conditions. This is one of the principaladvantages of “two-settlement” or “multi-settlement” systems.
C “Dispatchable Load” and Integrated Reserves Markets: From the perspective of the
system as a whole, controllable load can provide most balancing services just as well ascontrollable generation. Wholesale markets for ancillary services should permit demand-sideresources to bid their services on a technology-neutral basis in ancillary service markets.

EFFICIENT RELIABILITY PAGE ix
C Efficient Reliability Standard: System managers may propose generation and transmissioninvestments, supported by broad-based charges, to improve reliability.
Those proposals should be tested against demand-side and distributed resource options to seewhether they are the lowest-cost, reasonably-available means to correct a reliability problem.
B. Rates and Rules for Wires Companies:
C Transmission Congestion Pricing: Transmission constraints impose significant costs onelectric systems, but those costs have often been hidden in averaged rates, or paid for in upliftcharges on all buyers in a region. Locational pricing can reveal the cost of congestion and thusthe value of demand management and distributed resources to enhance reliability in constrainedareas.
C Enhancing Reliability Through Retail Rate Design: Rate design is still a critical function of
regulation -- almost all electricity is delivered on monopoly wires systems, and the vast majorityof energy sales are still made at regulated rates by regulated franchises or default serviceproviders. Administrative and legislative rate designs for power prices and wires services shouldbe re-examined for their effects on consumption, peak demand, and reliability. Retail rate capsshould be modified to better align rates and power costs, and to encourage customers to bettermanager their loads. Wires company rates should not be based on per-unit price caps, whichpromote throughput and impair reliability, but on performance-based, per-customer revenuecaps.
C. Promoting End-Use Efficiency:
Broad-based energy efficiency measures provide multiple reliability benefits to electric systems. Theycan reduce load, fuel use, equipment maintenance, and environmental impacts throughout the entireelectric system. Moreover, efficiency measures now have a very valuable role to play in lowering powermarket clearing prices. The savings resulting from energy efficiency are obviously very high at peak, butthey are also surprisingly high when all other hours of the year are considered. The “public” benefits ofenergy efficiency investments to customers in a market may substantially exceed the private benefits ofefficiency to those who install efficiency measures. The report recommends several mechanisms fordelivering broad-based efficiency measures to electric networks.
C System Benefit Funds: Broad-based wires charges can support efficiency and loadmanagement measures that enhance system reliability and lower market prices. Small, non-bypassable charges are competitively neutral and can provide adequate funding for programs toserve all customer classes. At least 19 states have established statewide funding mechanisms forefficiency programs, supervised by state agencies with a mandate to improve reliability and saveenergy cost-effectively.

EFFICIENT RELIABILITY PAGE x
• The Energy Efficiency Utility: One important variant on the statewide public benefits fund isthe Energy Efficiency Utility, which is awarded a franchise in order to deliver efficiency servicesto customers across a state or region. The first such utility was chartered by the Vermont PublicService Board, with a statewide franchise, supported by a wires charge in each franchiseterritory in which it delivers services.
• System Benefit or Uplift Charges at the Power Pool Level: Power pools and RTO’S withauthority to impose tariffs for supply-side investments should also have authority to support cost-effective demand-side programs on a regional basis. One option is a wires charge collected onthe same basis as other reliability and uplift charges collected by regional pools and reliabilitymanagers.
• Complementary policies for energy efficiency: Building codes, appliance and equipmentstandards, and financial policies are all important tools to advance energy efficiency in the powersector. Higher air conditioning standards alone could save over 40,000 MW over the next twodecades. Better building codes, expansion of the Energy Star labeling program, and new tax andfinance mechanisms would add measurably to a more reliable electric system.
Conclusion
Heat waves are natural events, but blackouts and price spikes are the result of governmental and privatechoices. Heat waves and cold spells are as predictable as snowstorms and hurricanes. The resultingoutages and price spikes are not “caused” by the weather, they are the consequence of our policydecisions. After a recent hurricane, Floridians learned that low-cost investments in roofing tie-downswould have kept many roofs intact in high winds. In a similar manner, energy efficiency investments canbe viewed as a low-cost means of “peak-proofing” the electric system, keeping the electric grid intactduring heat waves, cold snaps, and other challenging events. The means of providing this added measureof reliability are well within the grasp of utilities, governments, system operators and customers.

EFFICIENT RELIABILITY PAGE 1
I. INTRODUCTION
In the present movement towards competitive electricity markets, it is important to remember thatelectric system reliability is, in many respects, a classic public good. By the laws of physics, the essentialattributes of adequacy, voltage, and frequency are available to all interconnected users simultaneously.As one prominent marketer put it, “I tell all my prospects, as long as you’re connected to the grid, yourreliability will be just the same as your neighbors’, no matter who you buy your power from.” Like thetextbook examples of lighthouses and national defense, most aspects of electric reliability are providedto everyone or to no one, and everyone is required to pay for them. Public rules, imposed bygovernments, utilities, reliability councils, or power pools, will determine the costs of reliability measuresand the means of paying for them. In this environment, least-cost thinking can provide substantialbenefits to the public and the economy.
In response to recent reliability and price events, it is common for customers, politicians, and industryparticipants to conclude that outages and shortages are the result of a failure to build sufficient newgeneration, and/or too little investment in transmission and distribution facilities. It is, of course, often thecase that additional investments in generation and delivery facilities would improve reliability, and suchinvestments are often needed.
But this narrow focus overlooks the essential fact that reliability is a function of the relationship amonggeneration, wires, and load. When the relationship is out of balance, the search for solutions mustconsider new generation, investments in wires, or accelerated load management and efficiency measures,or a combination of the three. A persistent feature of the public dialogue on this critical topic has beenthe repeated refrain that reliability problems have been “caused by a failure to invest in generation (ortransmission)” rather than the equally logical observation that they have been caused by a failure to investadequately in cost-effective efficiency and load management, or to stimulate such investments throughbetter pricing and more efficient markets. Analysis of the current and emerging conditions of America’s electric grids reveals the followingconclusions:
• Rapid demand growth, the break-up of electric monopolies, and a critical decline in efficiencyand demand-side management programs are undermining the reliability of America’s electricgrids and now present a growing challenge to public decision-makers;
• In many locations, additional generating and transmission capacity will be needed to maintainreliable and efficient service. However, maintaining reliability exclusively through a “turbines andwires” policy will be unnecessarily expensive, and unnecessarily harmful to the environment;
• Energy efficiency and load management can add enormous value to the nation’s electric system,lowering the cost of electric service, mitigating capacity crunches, and cost-effectively improving
EFFICIENT RELIABILITY PAGE 2
system reliability. Responsible estimates of the demand-side potential conclude that as much as40%-50% of the nation’s peak load growth over the next twenty years could be met through energy efficiency, price-response, and load management measures that would be less expensivethan their supply-side substitutes;
• Demand-side resources can provide reliability and price benefits both in electricity markets, and
in franchise or monopoly service situations:
Where services are provided through competitive markets, those markets should bestructured to give demand-side and supply-side resources equal opportunity to supplyenergy, capacity, and reliability requirements.
Where electric services are provided through historic franchises or new default serviceproviders, demand-side resources should be built into the portfolio of resourcesassembled for the benefit of customers.
• Integrating demand resources into electricity markets will lower the cost of reliable service,mitigate the market power of concentrated supply-side generation owners, and lower marketclearing prices and price spikes at times of peak demand.
• Energy efficiency and load management programs can also lower the cost of distribution service,and improve distribution reliability by accommodating load growth and high-demand situationsbelow the load tolerance levels of the existing distribution network.
The foundations for these conclusions are set out in the sections following. This paper begins byexamining the unwelcome trio of problems now facing electricity markets: reliability challenges, pricespikes, and market power problems. It then examines the premises and risks of an exclusive, supply-side,“wires and turbines” approach to these problems, and examines the potential for demand-sideresources to contribute to their resolution. The paper concludes with a series of policy recommendationsin three areas: (A) measures to incorporate demand responses and demand-side resources into modernelectricity markets, (B) policies for the rate structures and operations of wires companies in order toremove regulatory barriers to demand-side resources, and (C) measures to support investments inefficiency and load management where market barriers continue to stand in the way of cost-effectiveefficiency investments.

EFFICIENT RELIABILITY PAGE 3
EFFICIENT RELIABILITY PAGE 4
1. For example, according to Larry Owens of Silicon Valley Power, a blackout costs Sun Microsystems “up to $1million per minute.” Mike Wallach of Oracle states, “The impact of momentary interruptions of power is extremelycostly in terms of lost productivity and potentially damaged equipment at Oracle....Whether the electricity was freeor cost three times as much would have absolutely no effect on the cost of our product.” Quoted in Karl Stahlkopf,Consortium for Electric Infrastructure to Support a Digital Society (CEIDS), Electric Power Research Institute(November 2000, Forth Worth, Texas). 2. Id.
II. THE UNWELCOME TRIO IN TODAY’S POWER MARKETS: RELIABILITY
CHALLENGES, PRICE SPIKES, AND GENERATOR MARKET POWER
It is now an understatement to observe that power markets throughout the United States are undergoinga dramatic transformation. The crises in California and the West in 2000-2001 dominate the nationaldebate, but several less dramatic processes are also underway: the rise of wholesale competition,transmission open access, and the creation of Regional Transmission Organizations; the move to retailcompetition in many states; the unprecedented pace of consolidation among utility companies; the rise ofthe merchant plant industry, based in part on the reshuffling of the nuclear industry and in part on the riseof efficient natural gas generating options.
Along with all of these changes has come the de-integration of functions that formerly occurred withintightly-woven franchise operations. Transactions that formerly occurred within integrated franchises arenow increasingly occurring in the regional wholesale marketplace, placing greater demands ontransmission grids, and undercutting the industry’s traditional ethic of cost-based mutual support. Acrossthe nation, significant and persistent load growth, particularly at peak, is placing ever-greater demandson electricity networks. As a consequence, supply adequacy, price spikes and electric system reliabilityhave become major public policy challenges in many regions. These new problems are introduced in thefollowing section.
A. Reliability Challenges Expose the Value of Demand-Side Resources
The reliability of electric supply, long taken for granted by most citizens and governmental officials, isnow a matter of increasing national concern. This increasing concern has two dimensions. First, there isa growing awareness that continuous power supply and improved power quality are criticalunderpinnings of the nation’s post-industrial, digital economy. That economy is increasingly based uponthe continuous real-time flow of information, and increasingly dependent on machines controlled bycomputer chips. For many high-tech businesses, power outages are unacceptably expensive.1 And formany electric applications, from home computers connected to the internet, to commercial bankingnetworks, to multi-million dollar industrial machines controlled by computer chips, even very smallvariations in power quality can cause troubling and expensive disruptions.2 The U.S. DOE now

EFFICIENT RELIABILITY PAGE 5
3. Environmental Media Services, “Widespread Reliability Problems Produce Huge Disruptions, Giant Costs,”(Lighten the Load, 2000.) 4. US DOE, Report of the US Department of Energy’s Power Outage Study Team (March 2000 Final Report), at S-2. The POST Report recommends 12 policies to promote reliability, including several that are consistent with therecommendations contained in Section V of this report. 5. As noted in the text below, California represents an important variation on this theme. The combined effects ofa severe drought, reducing generating capacity in the Northwest, and rapid load growth in the states surroundingCalifornia have reduced the generation available to meet load in California. Those physical events have greatlyenhance the opportunities of fuel suppliers and generators to exert market power in regional power markets.
estimates that power outages and other fluctuations in power delivery cost at least $30 billion a year inlost productivity.3
Second, over the past four years, managers and consumers across the nation have seen a significant risein the number of important reliability events, including power alerts, voltage reductions, power outages,and other system disturbances. The most significant reliability events from the summer of 1999 wereexamined by the US DOE’s Power Outage Study Team (POST), which concluded that the transition tomore competitive wholesale markets and to retail competition in many states had undermined theindustry’s traditional reliability mechanisms, and that “the necessary operating practices, regulatorypolicies, and technological tools for assuring an acceptable level of reliability were not yet in place” 4 tosupport changing industry conditions.
This view is echoed by the North American Electric Reliability Council (NERC), which testified inCongress during the year 2000 that reserve margins were shrinking, transmission lines were becomingoverloaded, and reliability challenges were greater than at any other time in recent history. By far themost significant series of events has been the continuing crisis in California, and its effects throughout theWestern Interconnection. The unprecedented series of rolling blackouts, power alerts, and price spikesin this region have many causes, which are the subject of intense debate. While the focus on California isunderstandable, it is important not to overlook conditions and events in other regions.
1. Adequacy, Security, and Power Quality Events Across the Country
Reliability problems have become so widely known that there is little need to document them here. Whatis not so well known, however, is the role of demand growth in causing those problems, and the role thatdemand-side responses can play in addressing them.
Review of the major reliability events of the last four years reveals a single key observation:
While the immediate system failure or technical problem involved in theses events varies fromcase to case, the underlying cause of these reliability problems is most often the high loads thesystem was required to serve at the time of failure.5 Demand-side resources can enhancereliability by moderating those challenging high loads.

EFFICIENT RELIABILITY PAGE 6
It is important to note that reliability problems are not simply the result of inadequate generation capacityacross a utility system or power pool, and they are not confined to a few high-growth states. As thefollowing examples demonstrate, the problems caused by high loads can affect reliability at all points onthe generation-transmission-distribution system, and they are occurring in all regions of the country.
• Local distribution failures: New York City and Chicago
On July 6 and 7, 1999 more than 200,000 people were left without power for up to 19 hours whenConsolidated Edison lost 8 of its 14 feeder cables serving the densely packed Washington Heightsneighborhood in northern Manhattan. Among those blacked out was the Columbia University MedicalCenter, where years’ worth of medical research was nearly lost when laboratory coolers failed. Theloss of feeders occurred because of heat-related failures in connections, cables, and transformers, andwas triggered by high, persistent demand during hot weather. ConEd serves the most dense electricpower load pocket in the world, with more than 3.1 million customers in a 604-square mile area.
Outages in Chicago have also been triggered by the failure of aging and overloaded local distributionsystems due to high demand during sustained hot weather. Between July 30 and August 12, 1999 threemajor outages struck Commonwealth Edison’s Chicago distribution network. Difficulties started late onthe afternoon of July 30, after demand set record highs. Cable faults knocked transformers off-line,sending automatic shutdowns cascading through the system. More than 100,000 customers sufferedoutages on July 30 and August 1. Later, on August 12, ComEd cut power to 3,300 customers,including the Chicago Board of Trade, served by a failed substation. Other firms closed their officesvoluntarily out of fear that the collapse would spread.
• Inadequate local transmission to serve a load pocket: San Francisco Peninsula (June, 2000)
The San Francisco Peninsula is a rapidly-growing load pocket, with inadequate local generation, servedby limited-capacity transmission lines. In June, 2000, during an early heat wave, the California ISO wasforced to institute rolling blackouts in San Francisco and surrounding areas in order to avoid uncontrolled overloads. This was the first time in modern history that intentional load losses wereimposed on customers by system managers in California. Even though much of Northern California wasexperiencing record heat at the time of this event, there was sufficient generation capacity available toserve San Francisco; however, the transmission links serving the Peninsula were unable to carry the loadrequired to meet peak demand in the load pocket.

EFFICIENT RELIABILITY PAGE 7
6. Between 1990 and 1999, California’s load growth averaged 1.1 percent per year, about half the national average.Hal Harvey, Bentham Paulos, and Eric Heitz,” California and the Energy Crisis:Diagnosis and Cure,” Energy Foundation (March 8, 2001), at 1 7. For example, during the 1990's, load grew 83% in Nevada and 42% in Arizona. Ibid. at 11. 8. Ibid. at 10.
• Regional transmission failure:Western States (August 10, 1996)
On August 10, 1996 the largest regional blackout in the U.S. since the New York City blackout of1965, cascaded across a multi-state region of the U.S. West. This event began with a transmission lineon the California/Oregon border that sagged under heavy load in high heat conditions, and shorted out.Other facilities were taken out by system operators and protective equipment to protect them fromfailure, resulting in a series of outages that stretched across several states. Altogether, 30,000 MW ofload was interrupted, and 7.5 million customers were affected, some unserved for as long as 9 hours.The California Energy Commission later estimated the economic cost of this outage to the Californiaeconomy alone at $1 Billion.
• Generation adequacy problems : California Crisis (Summer 2000 and continuing)
Since June 2000, California has experienced an unprecedented power crisis, marked by powerwarnings, price spikes, rolling blackouts, and numerous days of extremely low reserve margins. Whilethe crisis is associated with a supply-demand imbalance in California, for the most part, it has not beencaused by high, in-state load growth.6 Reserve margins have been dramatically cut by the effects of anextreme drought, reducing hydro capacity available in California and the Pacific Northwest. Moreover,many observers, including the California ISO, assert that reliability and price problems have beenexacerbated by strategic withholding and other “gaming” behavior by generators. Load growth inCalifornia, which has been modest in comparison to the pace of growth in surrounding states, isprobably not the principal cause of the state’s reliability problems. However, load growth throughoutthe region has greatly reduced the ability of California’s utilities to balance their systems with importsfrom other states.7 The effects have been exacerbated by a substantial reduction in energy efficiencyprograms in California since 1994, adding about 1100 MW to the state’s overall demand.8
New England (June 7 and 8, 1999):

EFFICIENT RELIABILITY PAGE 8
Record-breaking heat and humidity spread across the northeastern U.S. in June 1999, leading tooperating emergencies in New England, Ontario, and New York due to shortages of reserve generatingcapacity. Many generating units were out of service for maintenance and refueling, in anticipation of highdemand later in the season. Operators kept the system running with urgent calls for customers to curtailenergy use and forced voltage reductions. They brought in emergency power from several neighboringsystems, and from as far away as Michigan, until relief finally came in the form of cooler temperatures.
South Central States (July 23, 1999):
At noon on July 23, Entergy - which serves 2.5 million customers in Louisiana, Arkansas, Texas, andMississippi - discovered electric load was rising beyond forecast levels, at the same time that itsgenerating system was lagging behind projected capacity. Power imports expected from othergenerators disappeared as loads rose elsewhere. The company issued an emergency public request forconservation, only its third such appeal in 20 years, but this was not enough to prevent outages thataffected 500,000 customers. Load growth in the region will continue to threaten reliability despite amulti-billion dollar investment program in new capacity now underway. B. Compounding the Problems of Thin Margins: Price Spikes and Market Power
Deteriorating reliability is not the only consequence of declining reserve margins. In wholesale powermarkets in several US regions, system managers, load-serving entities, and customers are witnessingextraordinary price increases, particularly while reserve margins are thin. Meanwhile, it is apparent thatgenerators have significant market power to affect price and supply quantities, power not available inpurely competitive markets. As will be developed in Section V below, demand-management and energyefficiency investments hold significant potential both to improve reliability and to mitigate the undesirableeconomic attributes of current power markets.
1. Price Spikes
Electricity prices in regional wholesale markets are volatile, perhaps more volatile than for any othercommodity, . They are so variable because:
• Generators differ substantially in their costs to produce electricity (e.g., the running costs forhydro and nuclear units are typically well below $10/MWH, while the cost for an oldcombustion turbine might be $100/MWH or more);
• System loads vary substantially from hour to hour (e.g., by a factor of two to three during asingle day);
• Electricity cannot easily be stored and therefore must be produced and consumed at the sametime; and
EFFICIENT RELIABILITY PAGE 9
9. For example, in New England between May 1999 and July 2000, weekly peaks varied by about 50%, whileweekly spot prices varied by well over 1,000%. (In fact, in May 2000, the spot market price in New England reached$6,000/MWh, 200 times the usual market clearing price. This particular anomaly is unlikely to be repeated, butsubstantial price excursions are not unusual in regional power markets.)
Hours
01020304050607080
$/M
wh
Max = $6000/MWh, May 8, 20001% of hours above $73/MWhTop 1% of Prices equal 15.8% Wholesale Costs (weighted by load)
New England Spot Energy Prices12 Months Ending July 21, 2000
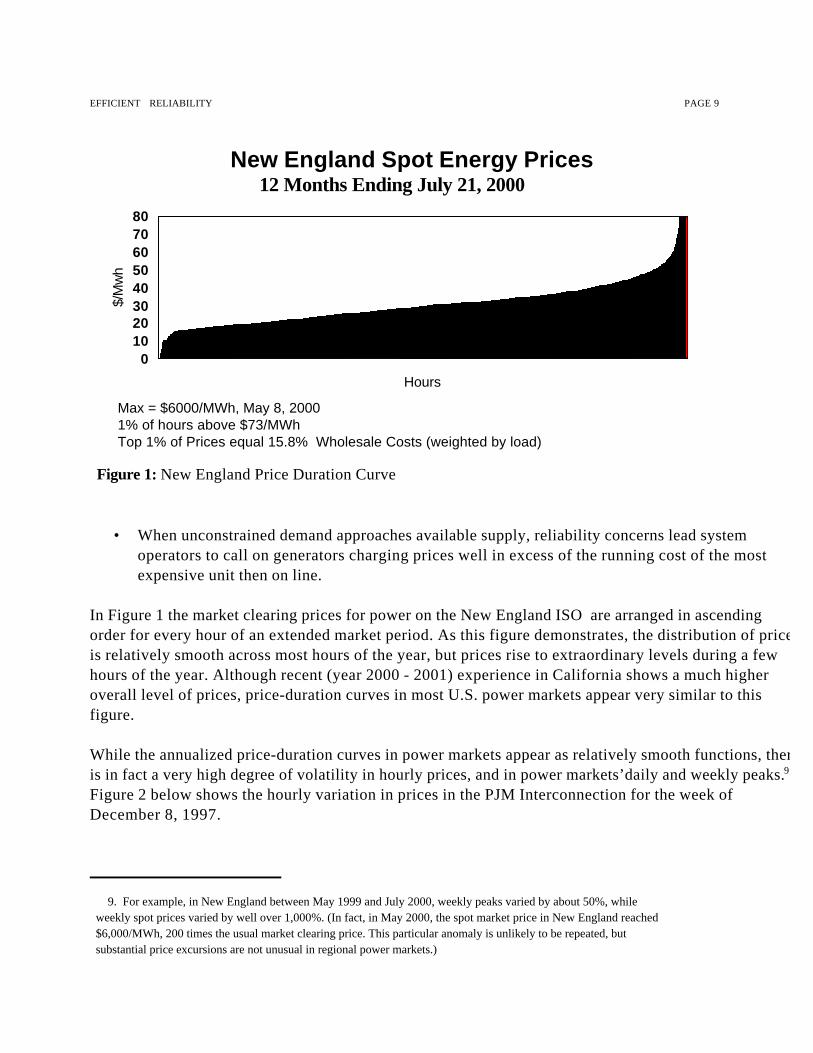
Figure 1: New England Price Duration Curve
• When unconstrained demand approaches available supply, reliability concerns lead systemoperators to call on generators charging prices well in excess of the running cost of the mostexpensive unit then on line.
In Figure 1 the market clearing prices for power on the New England ISO are arranged in ascendingorder for every hour of an extended market period. As this figure demonstrates, the distribution of pricesis relatively smooth across most hours of the year, but prices rise to extraordinary levels during a fewhours of the year. Although recent (year 2000 - 2001) experience in California shows a much higheroverall level of prices, price-duration curves in most U.S. power markets appear very similar to thisfigure.
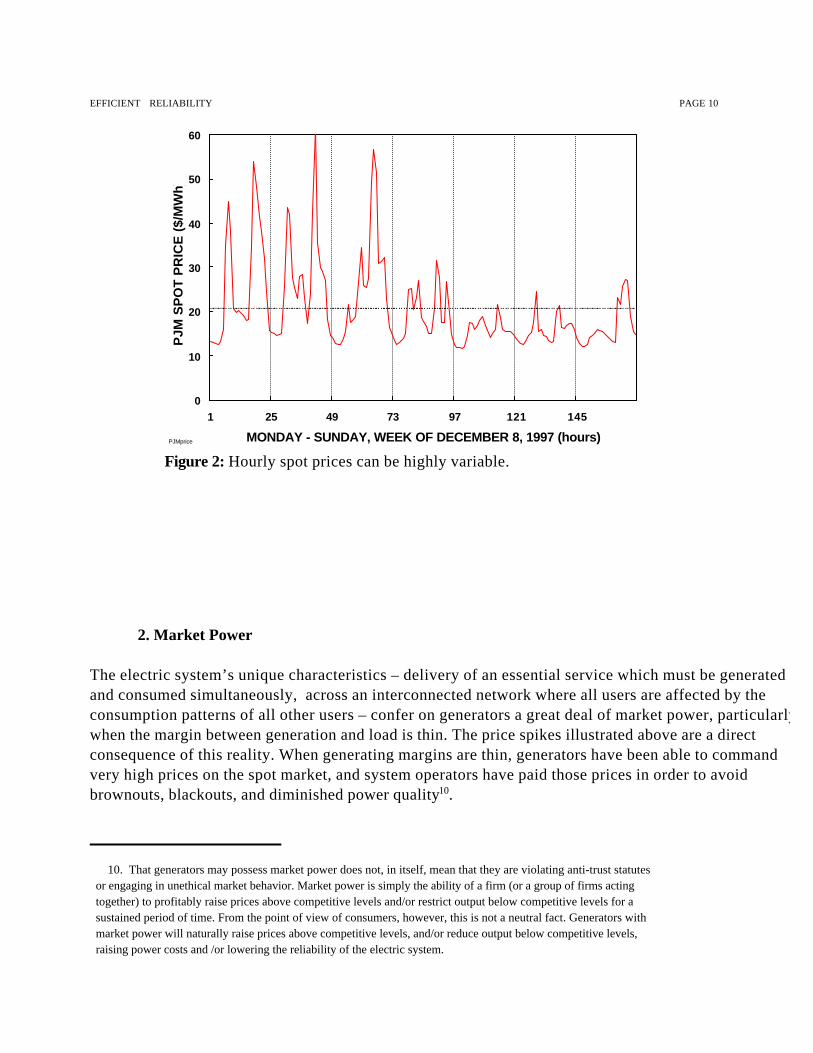
While the annualized price-duration curves in power markets appear as relatively smooth functions, thereis in fact a very high degree of volatility in hourly prices, and in power markets’daily and weekly peaks.9 Figure 2 below shows the hourly variation in prices in the PJM Interconnection for the week ofDecember 8, 1997.
EFFICIENT RELIABILITY PAGE 10
10. That generators may possess market power does not, in itself, mean that they are violating anti-trust statutesor engaging in unethical market behavior. Market power is simply the ability of a firm (or a group of firms actingtogether) to profitably raise prices above competitive levels and/or restrict output below competitive levels for asustained period of time. From the point of view of consumers, however, this is not a neutral fact. Generators withmarket power will naturally raise prices above competitive levels, and/or reduce output below competitive levels,raising power costs and /or lowering the reliability of the electric system.
PJMprice
0
10
20
30
40
50
60
1 25 49 73 97 121 145
MONDAY - SUNDAY, WEEK OF DECEMBER 8, 1997 (hours)
PJM
SP
OT
PR
ICE
($/
MW
h)
Figure 2: Hourly spot prices can be highly variable.
2. Market Power
The electric system’s unique characteristics – delivery of an essential service which must be generatedand consumed simultaneously, across an interconnected network where all users are affected by theconsumption patterns of all other users – confer on generators a great deal of market power, particularlywhen the margin between generation and load is thin. The price spikes illustrated above are a directconsequence of this reality. When generating margins are thin, generators have been able to commandvery high prices on the spot market, and system operators have paid those prices in order to avoidbrownouts, blackouts, and diminished power quality10.
EFFICIENT RELIABILITY PAGE 11
11. Energy Information Administration, The Changing Structure of the Electric Power Industry 2000: An Update,at 97 (October 2000). 12. In 1935, 13 companies controlled more than 50% of all IOU generation. After the breakup of the major holdingcompanies following passage of PUHCA, and for the decades between 1955 and 1995, one had to combine the assetsof the 200 largest companies to cross the 50% threshold. Today, 10 companies own 51% of IOU generation. 13. The New York PSC concluded that “strong mitigation measures need to be in place to prevent abuse of marketpower.” NY State Department of Public Service “Interim Pricing Report on New York State’s ISO,” December 2000. 14. Will McNamara, “Energy Stocks Tumble in Response to Possible California Refunds,” IssueAlert (June 25,2001).
The market power possessed by generators is also enhanced by the rapid pace of consolidation amongthe owners of generation facilities in the United States, yielding fewer and fewer competitors in regionalpower markets. According to a recent EIA report on utility structure, in 1992 the 10 largest utilities,ranked according to generation capacity, owned just 36% of all non-customer owned generationcapacity, but by the end of 2000 the 10 largest utilities controlled an estimated 51% of that capacity. During the same time period, the percentage of generation owned by the 20 largest companies rose from58% to 72% of total IOU and IPP generating capacity.11 The degree of concentration among the majorutilities is now approaching the levels it had reached in 1935, before passage of the Public UtilitiesHolding Company Act.12
Serious concerns have been raised in several power markets, including California, New England, andNew York13 that generators are “gaming” the bidding rules and/or strategically withholding generationfrom the market in order to drive prices higher. Most notably, in early 2001, the California IndependentSystem Operator (ISO) asserted that generators in that market had improperly manipulated bids andunit availability, raising total electricity costs in the state between May 2000 and February 2001 by $6.7billion.14 While allegations of strategic withholding have been vigorously disputed, the key point for thepurposes of this report is not in controversy:
When the margin between available generation and load is thin, generators can require veryhigh prices for supply-side resources. In this setting, demand-side resources have new value asa means of moderating the power of producers to raise the market clearing price well abovethe marginal cost of production.
C. Sources of Today’s Reliability Problems
1. Capacity Crunches are Directly Related to Load Growth
In response to recent reliability and price events, it is common for customers, politicians, and industryparticipants to conclude that outages and shortages are the result of a failure to build sufficient newgeneration, and/or too little investment in transmission and distribution facilities. It is, of course, often thecase that additional investments in generation and delivery facilities would improve reliability, and suchinvestments are often needed.
EFFICIENT RELIABILITY PAGE 12
15. EIA , Electricity End Use (1949-1999) Table 35 Noncoincidental Peak Load 16. New York Times 9/13/99 17. EIA, Electricity End Use (1949-1999) Table 8.9, Electric Utility Retail Sales
3,075,000
3,162,000
3,247,0003,289,000
3,400,000
9495
9697
983,000,000
3,100,000
3,200,000
3,300,000
3,400,000
3,500,000
Retail Sales(GWH)
585,844
620,249616,790
660,293669,069
679,526
9495
9697
9899
550,000
600,000
650,000
700,000
Summer Peak
But this simplistic approach overlooks the essential fact that reliability depends on the relationshipamong generation, wires, and load. When the relationship is out of balance, the search for solutionsmust consider new generation, investments in wires, or accelerated load management and efficiencymeasures, or a combination of the three. A persistent feature of the public dialogue on this critical topichas been the repeated refrain that reliability problems have been “caused by a failure to invest ingeneration (or transmission)” rather than the equally logical observation that they have been caused by afailure to invest adequately in cost-effective efficiency and load management, or to stimulate suchinvestments through better pricing and more efficient markets.
The undeniable fact is that load growth in the United States, particularly peak load growth, have beenproceeding at a pace that has put great strains on our power system infrastructure.
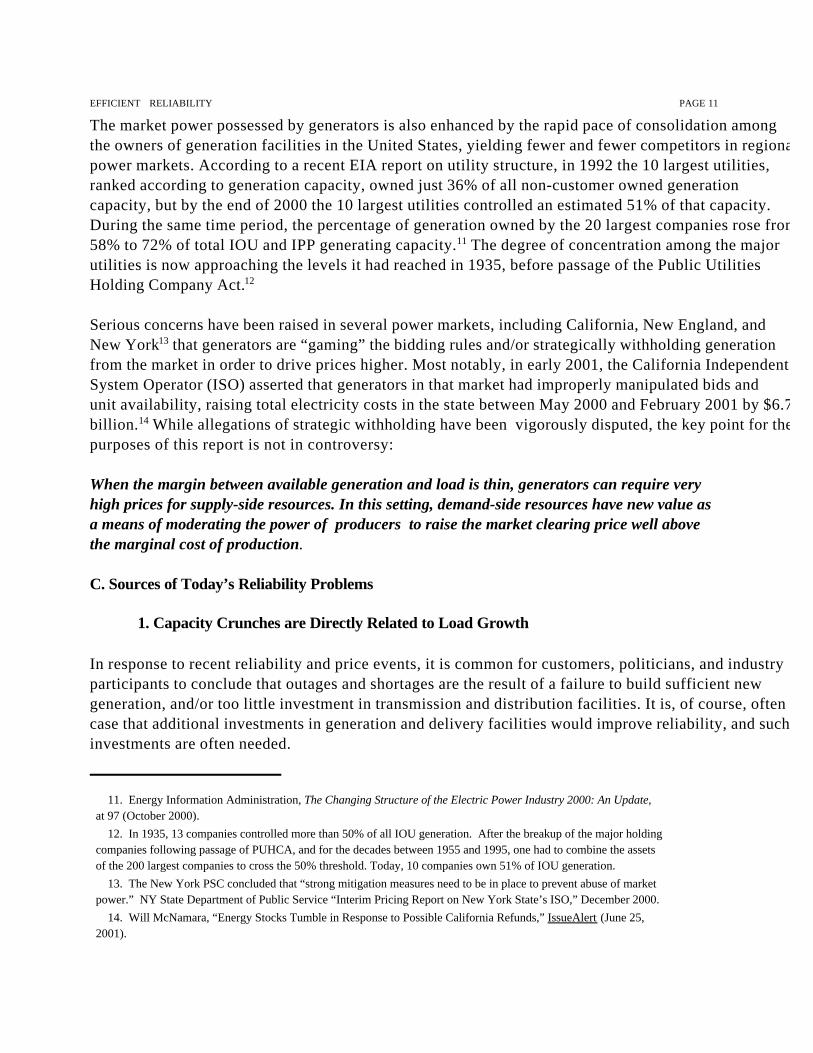
• Between 1994 and 1999, non-coincident summer peak load in the US rose from roughly585,000 MW to 680,000 MW — an increase of 95,000 MW in five years.15 See Figure 3.This is the equivalent of adding a new, 6-state New England to the nation’s electrical demandevery 14 months.
• Nationwide, electric consumption grew 31% in the decade between 1988 and 1998.16 Consumption grew 325,000 GWH (or about10.6%) between 1994 and 1998 alone.17
See Figure 4.
Figure 3: US Noncoincident Summer Peaks Figure 4: US Electric Retail Sales

EFFICIENT RELIABILITY PAGE 13
18. National Energy Policy, report of the National Energy Policy Development Group, May 2001 at p.1-4. This isroughly 9 times the current California system peak, and exceeds the existing generating capacity of Japan andGermany combined. 19. “Nationwide Capacity Shortage by 2007?” (Electricity Daily June 4, 1999). The WSCC could have a capacityshortfall of 17,200 MW, according to the study. MACC could fall short by 7100 MW, Ercot could have a 5,500 MWshortage, SPP could be short by 5,400 MW and ECAR 4,400. MAPP could be 3500 MW short, SERC 2,500 MWshort, MAIN 2,400 MW short, and FRCC down by 500 MW. The NPCC was the only region not expected to beshort, but this is because of significant new construction now being planned for that region See also, “TVA Warnsof Long, Hot, Power-Short Summer” (Electricity Daily May 6, 1999.) 20. Fickett, Gellings, and Lovins, “Efficient Use of Electricity,” Scientific American (1990).
Current estimates predict continued sustained growth in demand. Together with the need to replaceretiring generating units, this demand growth has led many analysts to declare a nationwide need toconstruct hundreds of thousands of MW of new generating capacity in the next few years:
• The most well-known assessment was prepared by the Bush Administration’s National EnergyPolicy Development Group in May, 2001, which concluded that electricity demand wouldincrease by 45% over the next 20 years, requiring the addition of 393,000 MW of newgenerating capacity to the nation’s electric grid.18.
• A number of projected shortages are, in utility planning terms, almost directly in front of us.According to a study by Applied Energy Group, all but one of the nation’s 10 regional reliabilitycouncils face a shortage of generating capacity by 2007.19
2. Successful Energy Efficiency Programs Have Been Cut Back
In the 1980s, U.S. electric utilities, regulators, and customers launched a serious effort to balance theindustry’s traditional focus on supply-side construction and rapid sales growth with a program ofinvestments in demand-side resources, governed by the process of integrated resource planning. Theoverall performance of demand-side management (DSM) programs, even during a period ofexperimentation and start-up, was very encouraging. Efficiency and load management resources wereoften cost-effective, and could add stability and reliability to electric systems. DSM programs displacedthe need to construct 29,000 MW of generating capacity. Overall DSM costs to utilities have beenabout 2.1 cents/kWh on a “simple” basis, and 2.9 cents including the time value of the invested capital.20
These investments were also, by their nature, modular and dispersed. They could be targeted to stressedtransmission and distribution (T&D) areas, and they have had almost no negative environmental impacts.
Unfortunately, the contribution of DSM to meeting the nation’s load growth needs has been in decline.Today’s capacity crunches and reliability problems have, in substantial part, been caused by a dramaticdownturn in our nation’s investment in these utility-sponsored energy efficiency programs followingpassage of the 1992 Energy Policy Act and the move toward competition in electricity markets.
EFFICIENT RELIABILITY PAGE 14
21. Nadel and Kushler, “Public Benefit Funds: A Key Strategy for Advancing Energy Efficiency,” The ElectricityJournal; October 2000. (For efficiency programs alone, excluding load management, the drop has been steeper — asmuch as 67% compared to the 1992-93 trendline.). 22. (Chuck Goldman, Energy Analysis Dept, Lawrence Berkeley Lab, April 22, 1999). For additional information onstate-level programs adopted since 1996, see Section V, below.
-
5,000
10,000
15,000
20,000
25,000
30,000
35,000
1992 1993 1994 1995 1996 1997 1998
Year
Pea
k L
oad
Red
uct
ion
(M
W)
Reductions by Energy Efficiency
Actual Reductions by Load Management
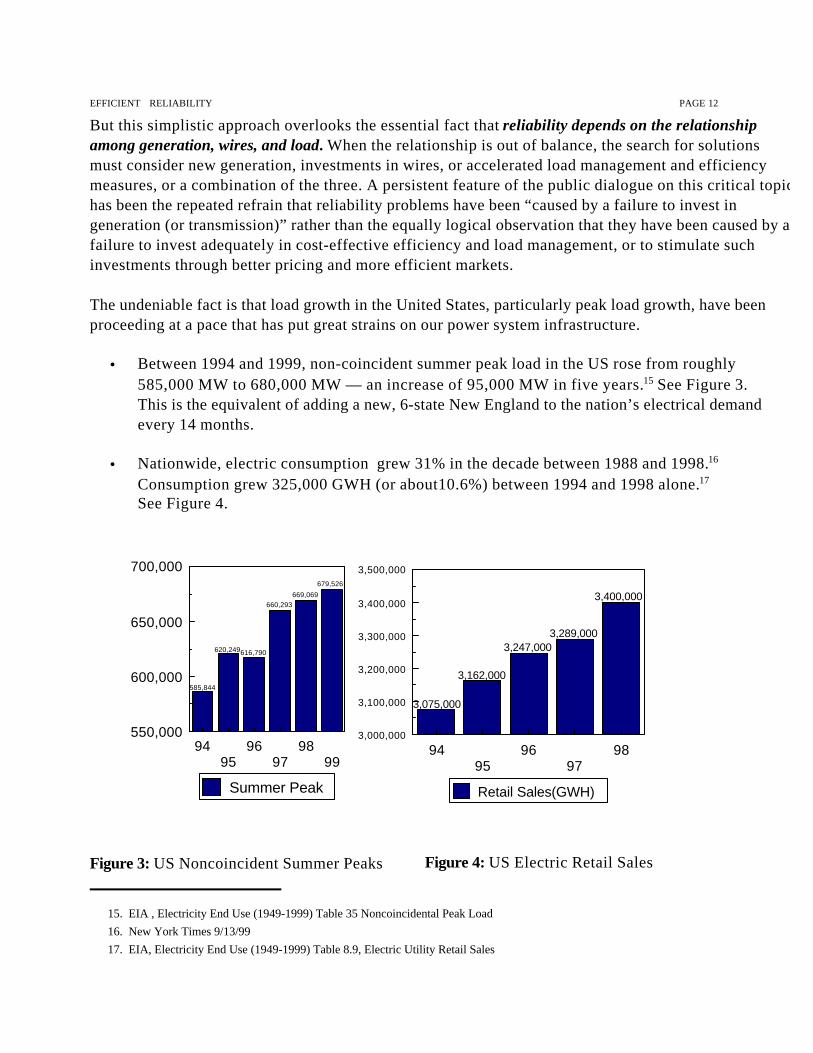
Figure 5: Peak Load Reductions from Efficiency and Load Management
Despite the generally solid record of success of utility DSM programs up to 1993-94, utility-sponsoredDSM programs have since been cut back sharply. Total utility DSM spending has declined by about50% since 1993. According to the EIA, utility spending for all DSM (efficiency and load management)totaled $2.7 Billion in 1993. Based on utilities’ announced plans, EIA at that time projected a 20%increase in DSM spending to about $3.5 Billion by 1998. Instead, spending has dropped to $1.5Billion, a decline of 45% in four years, and a reduction of 57% as compared to the trendline of 1991-93.21
A look at the 15 largest utility programs confirms this trend. Utility DSM spending has declined by about50% at those utilities since 1993. A modest fraction of that spending has been restored by publicbenefits programs in a few states.22
The abandonment of utility-sponsored DSM programs between 1994 and 1999 has dramaticallyreduced the contribution such programs could have made to meeting both energy needs and peakdemands in recent years. By 1993, DSM-related peak load reductions and were growing by about4,000 MW per year. However, this progress has been stalled, and total peak load reductions have beenvirtually flat since 1995. See Figure 5 below.

EFFICIENT RELIABILITY PAGE 15
23. ACEEE calculation based upon EIA data. 24. Neela Bannerjee, et al., “Power Politics: A Failed Energy Plan Catches Up to New York,” New York Times (June1, 2001). 25. “Report on the Reliability of New York’s Electric Transmission and Distribution Systems,” New York StateEnergy Planning Board (November 2000). 26. New York ISO, “Power Alert: New York’s Energy Crossroads,” March 2001 at 20-21. 27. Hal Harvey, Bentham Paulos, and Eric Heitz, “California and the Energy Crisis:Diagnosis and Cure,” ( Energy Foundation, March, 2001) at p.6.
Incremental energy savings from utility energy efficiency programs (additional savings relative to savingsachieved in the prior year) have also been cut in half, dropping from 8.6 billion kWh in 1994 to 4.3billion kWh in 1996. 23
3. The Efficiency Yo-Yo: Demand-Side Cuts and the Rush to Restore Programs
As power crises have mounted in California and the West, and reserve margins have narrowed in theEast, demand-side resources have received renewed attention, and policy-makers have rushed torestore programs that had been abandoned or cut back sharply in prior years. California and New Yorkprovide similar lessons in this area.
In New York, utility spending on energy efficiency was cut by about 75% in the mid-1990's, despiteprojections by the Public Service Commission that increased demand would lower the reserve marginunacceptably by the year 2000.24 By the summer of 2000, it became apparent that the combination ofincreased demand, limited transmission, and a lack of major new plants, particularly in New York City,was placing unacceptable pressure on reliable service. In response, the New York Power Authoritylaunched an emergency program to site 11 new gas-fired generators in the New York City region, andthe state legislature directed the Energy Planning Board to conduct a reliability study. That study foundthat demand-side measures, including energy efficiency measures, peak load shaving measures, andprice-responsive load programs, would all have a positive effect on reliability.25The New York PSCsubsequently doubled the funding given to utility efficiency programs through their System BenefitCharges, restoring a portion of the funding lost at the end of the 1990s. The New York ISO alsolaunched an Emergency Demand Response Program, and a Day-Ahead Demand Bidding Program toaddress the reserve deficiency.26
In California, utility demand-side programs were cut in half following the PUC’s initial moves tocompetition in 1994. (See Figure 6.) As a result, the state lost about 1100 MW in demand savings thatwould have been available to mitigate market power and avoid reliability crises in 2000 and 2001.27
When those power shortages arose, the General Assembly, the state’s utilities, and other agencieslaunched a portfolio of emergency demand-management programs to recapture some of

EFFICIENT RELIABILITY PAGE 16
28. See, e.g., Julie Tamaki, “Legislators to Promote Energy Conservation,” LA Times (Feb. 6, 2001).
California Utility Energy Efficiency Funding,
1988-2001
$99 $102
$209
$245
$287
$346
$416
$180$193 $192
$228 $228 $228 $228
$-
$50
$100
$150
$200
$250
$300
$350
$400
$450
1988 1989 1990 1991 1992 1993 1994 1995 1996 1997 1998 1999 2000 2001
mill
ion
$
Source: Office of Ratepayer Advocates, 1999.
Figure 6: Reductions in California Utility Efficiency Programs, 1995-2001. These cut-backs added 1100 MW to the state’s peak load in 2000-2001.
the ground lost over the preceding six years. More than $1 billion was authorized to be spent through avariety of programs, aimed at reducing demand by at least 1500 MW.28 Implementing these programson a crash basis, however, has presented numerous administrative and logistical challenges. Keypersonnel are no longer available, program designs are outdated, and stocks of energy efficientequipment are quickly depleted. Moreover, many savings opportunities arise infrequently (e.g., onlywhen a building is built or major renovations are undertaken). On-again, off-again programs have missedthose opportunities, and are now unable to recapture them. Finally, the emergency programs inCalifornia in 2001 have necessarily focused on immediate peak load reductions, even where long-termcost-benefit analysis would support investments with more sustained, but more gradual results.

EFFICIENT RELIABILITY PAGE 17
III. SUPPLY-SIDE AND DEMAND-SIDE RELIABILITY: THE PRACTICAL
REALITIES OF EXISTING POLICY
Modern electric policy debates are often clouded by an inherent conflict between two competingeconomic objectives:
• On the one hand, advocates of competition and free markets in electricity often assert that theparadigm of utility integrated resource planning developed over the past decade has outlived itsusefulness as a relic of “central planning,” and that markets alone will call forth the most efficientcombination of wires, turbines, and demand management services to meet the nation’s electricservice needs.
• However, at the same time, it is commonly observed, sometimes by the same advocates, that theincreasingly sophisticated power demands of the growing digital economy require higherreliability standards, along with increased authority in the hands of network managers to enforcethose standards, and to intervene in transmission and energy markets if necessary to protectagainst short-term and long-term network externalities.
While largely at odds, there is at least one point of reconciliation between these two positions. Whenregulators adopt system rules to structure electricity markets, and when reliability managers intervene inthem, those actions are the hand of government at work, not the invisible hand of the market. Thosegovernment actions should be guided by the same principles that have long guided least-cost utilityoperations: they should capture the highest value for consumers over the long run, for the lowestreasonable cost. The challenge is to (a) discover how to structure those markets efficiently; and (b)understand where network externalities require regulatory interventions in addition to market solutions.Demand-side resources offer valuable solutions in both of these areas.
A. “Wires and Turbines” Reliability – Some Practical Considerations
The conventional and predominant response to the nation’s current capacity/demand crunch is a focuson the construction of new power plants and major transmission lines.
Undoubtedly, significant new investment in generation and transmission is justified on both on economicand reliability grounds. Economic growth, changes in settlement patterns, and the emergence of superiortechnologies all support a conclusion that many investments in generation and transmission are neededand should be supported in new markets and regulatory systems.
However, major investment programs, particularly investment programs with large-scale and long-termfinancial and environmental consequences, should proceed only upon the conclusion that they areproviding the nation the highest value service at the lowest reasonable cost. A massive national electricalbuilding program, involving only central-station generation and transmission investments, and ignoring
EFFICIENT RELIABILITY PAGE 18
29. Electricity Daily 6/4/99 30. “National Energy Policy” (May 2001) at p. 1-4. 31. This is a relatively low figure, assuming that new generation would be overwhelmingly combined cyclenatural gas with an average capital cost of about $600/kW installed. Coal or nuclear facilities would, of course,involve much higher capital costs. Mike Kujawa, analyst at Allied Business Intelligence, states that over $100 Billionmust be put into new power generation by 2010 to meet demand growth during the first half of the period inquestion. (“Power Generation Opportunities in a Restructured Environment,” Reported in Deregulation Watch, July15 1999 p. 7) 32. James Mahoney, PG&E National Energy Group, “Estimated Capital Needs for Electric Reliability (2000-2020)”presented at the 2001 Annual Symposium of the New England Conference of Public Utility Regulators (May 22,2001). 33. Texas is a good example. Demands on the state’s transmission system have increased by 32% in the past sixyears, with only minimal additions to transmission capacity. Thus, even though 10,000 MW of new generation isbeing built, “Texas’ Achilles heel may be its transmission system, which is just as critical to a successful launch ofderegulation as adequate power supply.” Will McNamara, “Transmission Grid May Be Texas’ Achilles Heel,”IssueAlert (July 2, 2001).
cost-effective efficiency and load-management resources, will be more expensive and less reliable than aprogram that is more balanced and more flexible.
1. The Cost of New Generation
To begin with, a reliability policy that focuses on generation alone will be financially expensive.According to North American Electric Reliability Council data, generating capacity in the US will needto expand by about 12% by 2007, an increase of 91,000 MW of installed generation, in order tomaintain adequate reserve margins.29 DOE now projects a need for more than 390,000 MW of newcapacity by 2020.30 Although the capital cost of this new generating capacity is expected to be lowerthan the average cost of utilities’ historic plant, it nevertheless represents a huge commitment of capital,perhaps as much as $250 billion.31 Informed observers also project the need for 38,000 miles ofinterstate gas pipelines (at a cost of $35 billion), 255,000 miles of gas distribution pipe (up to $100billion), and 8800 miles of electric transmission lines ($5 billion) to support increased electric and gasconsumption through supply-side measures.32 In addition, of course, the fuel costs required to supportgeneration from those units will greatly exceed the capital costs of the units themselves.
2. Increasing Demands on Transmission Networks
Significant capital expansion of the nation’s transmission grids would also be required to meet continuingload growth through new generation, while supporting increasingly active regional wholesale powermarkets. According to many industry analysts, transmission grids are already strained. They could notsupport 200,000 to 400,000 MW of new generating capacity without substantial upgrades and newtransmission links33.

EFFICIENT RELIABILITY PAGE 19
34. EPRI, “Electricity Technology Roadmap” July 1999 p.22 35. Ibid. 36. These are among the recommendations contained in the Bush Administration’s National Energy Policy, (Report of the National Energy Policy Development Group, May 2001). Several bills have been introduced inCongress to provide federal preemption of state and local laws on transmission line siting. 37. See, e.g., New England ISO’s decision to pay for more than $130 million for “Pool TransmissionFacilities”throughout New England . 38. For example, Central Vermont Public Service reported that the marginal cost of transmission and primary andsecondary distribution was more than $67.00 per kw/year. Testimony of Scott Anderson, Vermont PSB Docket 5835(May 1995). Commonwealth Edison has committed to $1.5 billion in distribution investments as a condition offranchise renewal in Chicago. 39. Wayne Shirley, Regulatory Assistance Project, “Simplified Distribution System Cost Methodologies forDistributed Generation,” (Discussion Draft, February 2001) at 17 and 19. Posted at www.rapmaine.org. This studyanalyzed data from FERC Form1 for 93 utilities for the period 1995-99. A portion of the investment is required tosupport facility replacements and customer growth rather than peak load growth alone, so demand management would not necessarily avoid the entire amount. Still, the author concludes that the cost of distribution systemupgrades can rival the capital cost of generation required by load growth.
As EPRI has reported, the value of bulk power transactions in the U.S. has increased four-fold in justthe last decade, and about one-half of all domestic generation is now sold over ever-increasing distanceson the wholesale market before it is delivered to customers. “This growth, however, comes at a timewhen many parts of the North American transmission system are already operating close to their stabilitylimits, as illustrated by recent widespread outages in the Western states....Traditionally, utilities would beadding new transmission capacity to handle the expected load increase, but because of the difficulty inobtaining permits and the uncertainty over receiving an adequate rate of return on investment, the total oftransmission circuit miles added annually is declining while the total demand for transmission resourcescontinues to grow.”34 While 10,000 circuit miles of transmission were added in the 1985-1990 period,only 4,000 circuit miles were added between 1990 and 1995.35
Industry leaders have recently evidenced increasing concern over the transmission situation, and manynow propose statutory and regulatory interventions to enhance reliability through transmissioninvestments. Proposed solutions include incentive rates for transmission investments, federal preemptionof state and local siting laws,36 and grants of authority to RTO’S to commission transmission facilitiesand pay for them through broad-based regional uplift charges.37
3. The Costs and Consequences of Overloaded Distribution Networks
Meeting load growth through a supply-side “wires and turbines” approach also entails investing in thedistribution-level facilities necessary to reliably support increased load on local feeders and substations.The capital cost of such upgrades can be very high, even when amortized over the long lifetimes of thefacilities involved.38 Across a wide range of utilities, companies spend an average of about $750 per kWof peak load growth on transformers, substations, lines and feeders.39 In high cost areas, the requiredinvestment is several times greater.

EFFICIENT RELIABILITY PAGE 20
40. See, E.g., “Oops! ComEd Throws Chicago for a Big Loop” (Electricity Daily 8/16/99) : “The catalyst for Daly’sanger was the decision by ComEd to save transformers that were in danger of overheating because they were beingoverloaded after others failed. Saving the transformers meant cutting power to the Loop area in the heart of thecity’s business district....It was the third outage of the week...ComEd officials ...said more outages are likely becauseunderground cables were damaged during July’s heat wave and record power use.” See also, “Con Ed Fights Back After NY Blackout” (Electricity Daily 7/16/99) Con Ed spokesperson states, “Therewas no option of importing electricity from another community...The feeders in Washington Heights could only berepaired in Washington Heights.” 41. John Herbert, “The Gas-Fired Future: Boom or Bust?” Public Utilities Fortnightly, April 1, 2001, at 20. 42. Presentation of James Mahoney, PGE National Energy Group, National Governors’ Association ExecutivePolicy Forum on Energy (April 5, 2001). 43. Presentation of Tom Robinson of Cambridge Energy Research Associates, National Governors’ Association,Executive Policy Forum on Energy, (April 5, 2001). Natural gas prices averaged about $1.70 between 1986 and 1994,and rose to $2.26 between 1995 and 1999. The average almost doubled in 2000-2001, to $4.15. Even though gasdrilling is proceeding at record levels, analysts now predict that the higher “price plateau” will continue, largely dueto electric generation demands for gas. Ibid. 44. National Energy Policy, May 2001 at 7-12. 45. For example, California utilities have asserted that El Paso Natural Gas artificially limited gas throughput on itslines into Southern California, driving up power costs by $3.7 billion in 2000 and 2001. Will McNamara, “The CaseAgainst El Paso Corp.” IssueAlert, June 13, 2001.
Increased demand on local distribution networks will also threaten reliability, sometimes in ways that areunforeseen. Historically, more than 90% of all customer outages are caused by distribution-levelproblems. Many outages, such as those due to storm damage, are unrelated to load on the wires.However, local reliability problems are often the direct consequence of local load growth. For example,the well-publicized failures in New York and Chicago in the summers of 1999 and 2000 were causedby distribution problems, not system generation inadequacy.40 In both cases, the problem was anoverloaded local distribution network due to high, sustained peak demand -- demand that might havebeen mitigated by more aggressive efficiency and load management programs in those areas.
4. Fuel Supply: Costs and Conflicts
The nation’s currently projected electric load growth also brings with it considerable pressure on thenation’s natural gas delivery system. As a recent trade press cover story puts it, “When Gas Sneezes,We All Catch Cold.”41 New electric generation, predominantly natural gas-fired, is expected to raisenatural gas demand by as much as 20 billion cubic feet per day (BCF), a 30%+ increase over existingtotal deliveries of less than 60 BCF42. Several important consequences flow from this dramatic increasein gas demand. First, some experts now expect that the price of natural gas will be elevated to a new,higher plateau rate of $4 to $5 per mcf, rather than the $2/mcf rate the nation has enjoyed over the pastfew years.43 Second, increased pressure is being placed on gas pipeline capacity. The National EnergyPolicy states that an additional 38,000 miles of new transmission pipeline will be necessary to meetincreased gas demand over the next twenty years.44A shortage of pipeline capacity may also haveserious market power implications for both natural gas and electricity markets.45
EFFICIENT RELIABILITY PAGE 21
46. Few customers understand that high summer electric demand has the effect of raising winter heating bills andraising the risk of insufficient gas supply in the winter months. 47. When cold spells correspond with electric system peaks, (as occurs in winter peaking or dual-peak systems)there has to be enough gas and pipeline capacity to serve both firm gas load and electric generation loads, asevidenced in California and the Pacific Northwest in the fall and winter of 2000-2001. Cold weather throughout theregion placed high demands on the natural gas supply to serve direct heat loads; electric generation facilities wereleft without sufficient natural gas to supply electrical demand. This situation resulted in repeated interruptions,region-wide power warnings, rolling blackouts in California, and has required extraordinary actions by systemoperators and federal officials.
This is not the first time that gas-electric capacity conflicts have led to major reliability problems, ashundreds of thousands of blacked-out PJM customers learned in the winter of 1994. Gas-fired generating stationswere cut off during a cold spell, when natural gas supplies were needed by direct gas customers. Pennsylvania PUCCommissioner John Hanger pointed out after that event, “We cannot ignore the threat to reliability posed by plantsthat use only gas and are supplied with interruptible contracts, even though such plants amount to a smallpercentage of total capacity. When a system is stressed, reserve margins shrink precipitously...Every megawattcounts in an emergency.” “Electric Reliability: How PJM Tripped on Gas-Fired Plants,” Public Utilities Fortnightly,May 1, 1995. 48. Presentation of James Mahoney, (PGE National Energy Group) at the New England Conference of PublicUtility Commissioners, May 22, 2001. A gas pipeline interruption or compressor failure can cause a greater loss ofgeneration than a failure of New England’s largest nuclear power plant or largest electric interconnection. 49. A reality demonstrated repeatedly during rolling blackouts in California in 2000 and 2001.
Finally, dramatic increases in gas-fired electric generation raise reliability concerns within both the gasand electric markets. High summer gas demand (to fire electric generation) cuts into the gas industry’sability to transport and store gas in the summer to meet winter gas heating needs.46 Serious reliabilityproblems have also arisen due to competition between gas-for-electricity and gas-for-direct-heat duringthe winter.47 Because electric generators cannot store large quantities of gas, pipeline interruptions willalso directly and rapidly affect electric system reliability. For example, an explosion on the El Pasopipeline in Carlsbad, New Mexico early in 2001 took electric generation off line in California, andhelped trigger rolling blackouts. In New England, which is now enjoying the addition of more than10,000 MW of new capacity, 77% of the region’s pipeline capacity may be consumed for powergeneration, and the potential loss of compression on the region’s pipelines will soon become the largestsingle contingency that reliability planners must face in the region48.
The existence of competitive markets for electric generating fuels will not resolve these reliabilityproblem. Competitive markets will, of course, require suppliers and investors to make long-termdecisions about price and availability trends for fuels and technologies behind their power supplies.Customers may choose among those suppliers based upon the price, environmental characteristics, orother attributes of those choices. However, when a supplier or class of suppliers is unable to supplypower to the grid, their customer load will not be cut off -- those orphaned customers will, for allpractical purposes, become the electrical security responsibility of the system operator. For this reason,anyone’s generation problem can become everyone’s reliability problem49.
5. Environmental Costs of “Wires and Turbines” Reliability

EFFICIENT RELIABILITY PAGE 22
50. “California’s power plants, running hard to fend off a chronic electricity shortage, are themselves running outof pollution credits, forcing some to shut down...” The price of NOX emissions credits soared from $4 to $50 apound, and the California ISO was forced to negotiate with state air regulators to allow units to run under emergencyorders. “California Power Plants Run Out of Pollution Credits,” USA Today: November 30, 2000. While the need topurchase emission credits has sometimes been costly, California officials assert that generators have usually beenable to run when needed, despite air quality impacts. Marla Cone et al, “Bush’s Idea of Easing Smog Rules Won’tHelp, Experts Say” LA Times, January 25, 2001. 51. A recent case in point is the plant proposed for Coyote Valley, in California’s Silicon Valley, which waited formany months for siting approval notwithstanding the state’s ongoing reliability crisis and the rapid demand growthand reliability needs of the local high-tech industry.
The environmental costs of electric generation and transmission are widely documented and do notrequire elaboration here. Nevertheless, this discussion would not be complete without recognition thatthose costs are substantial, and an increase of more than 300,000 MW of generating capacity and 40%or more in consumption will impose very serious environmental impacts. The environmental impacts fromconstruction of new transmission facilities are also likely to be significant, and it is unlikely that major newtransmission lines will escape citizen opposition in the siting process.
In addition to the obvious direct environmental impacts, an electric service policy that dependsexclusively on supply side solutions runs the risk of threatening reliability in two ways. First, it mayoverextend environmental loading capacities, which could lead to strict future operating limits, orrestrictions on future capacity expansions in locations where they may be particularly needed. In the falland winter of 2000-2001, generators in California, running out of NOX allowances, were sometimes indanger of having to shut down even though their generation was needed to support the system.50
Second, reliance on “lumpy” supply-side solutions to the exclusion of dispersed demand-side optionsmay can create reliability problems as generation and transmission reserve capacities are eroded. Then,when a new capacity addition is critically needed, it may fall victim to public resistance, environmental orsiting problems. At that point, a long-term reliability challenge has been converted into a short-termreliability crisis.51
6. Lessons Learned – The Never-Ending Problem of Weakest Links
In the POST Report, and in many other post-event analyses, utility managers, regulators, and otherexperts are called on to identify the immediate causes of the types of reliability problems noted above. Innearly every case it is possible to identify the weak link in the chain that connects generation, systemsoperation, transmission, and distribution to customer load. For example, in the 1996 west-wide outage,an overloaded transmission link near the Oregon/California border was identified as the weak link thatstarted a cascade of problems. In Chicago and New York in 1999, aging and overloaded distributionfacilities were the links that failed. In California throughout 2000 and 2001, generation adequacy hasbeen a major continuing problem.
Of course it is important to address the weakest links in the supply and delivery chain in order toimprove reliability. For example, aging distribution infrastructure in Chicago and New York must be

EFFICIENT RELIABILITY PAGE 23
52. National Energy Policy (Report of the National Energy Policy Development Group, May 2001) at p. xi.
maintained and replaced over a reasonable schedule to ensure high quality service long into the future.However, a narrow focus on fixing today’s weakest links in the supply/delivery chain will ultimately beless resilient and more expensive than a strategy that identifies reliability-enhancing demand-sideinvestments as well.
By accepting load growth and demand spikes as givens, and attempting to meet them exclusivelythrough a wires and turbines policy, reliability managers can fix each “weakest link” in the supply chainas it appears. But once one upgrade is completed, a new weakest link will often emerge. For example, once load growth is addressed by siting new generation facilities, it is likely thattransmission links will be more stressed, particularly at peak-load periods. Unless transmission upgradesare also purchased, the resulting degradation in transmission reliability will offset the gain in reliability dueto the new generation. Similar problems may well arise in other areas, such as electric distributioncapacity, gas supply, pipeline capacity, and environmental loading limits.
Demand-side resources, on the other hand, can lighten the load at the end of the supply/delivery chain,and thus simultaneously enhance the reliability of each link in the entire chain, from fuel supply andgeneration adequacy all the way through to the local distribution network. The potential for enhancingreliability through demand-side resources is the focus of the next section.
B. The Untapped Potential of Efficiency and Load Management – How Large is theReservoir?
In setting out the first of five specific goals, the recently-released National Energy Policy states:
“Americans share the goal of energy conservation. The best way of meeting this goal is toincrease energy efficiency by applying new technology -- raising productivity, reducing waste,and trimming costs...America has made impressive gains in energy efficiency...We must build onthis progress and strengthen America’s commitment to energy efficiency and conservation.”52
This recent statement echoes the conclusions of the nation’s utility regulators. In a Resolution formallyadopted in 1999, NARUC found that
“Energy efficiency and load management programs are proven, cost-effective means ofmanaging load and enhancing reliability by matching electricity demand with the system'sgeneration, transmission, and distribution capacity constraints....”
and urged state regulators, power pools, and Congress to
EFFICIENT RELIABILITY PAGE 24
53. National Association of Regulatory Utility Commissioners, Resolution Supporting Energy Efficiency andLoad Management As Cost-Effective Approaches to Reliability Concerns (Adopted July 23, 1999). The full text ofthe Resolution is contained in the Appendix. 54. To put these figures in perspective, the capacity savings exceeded the total peak demand of the six NewEngland states, while the energy savings were equal to the annual consumption of 6.2 million average homes. 55. Fickett, Gellings, and Lovins, “Efficient Use of Electricity,” Scientific American (1990). 56. In 1993, utility estimates compiled by EIA projected peak load reductions of 55,000 MW by 1998. Due toprogram cutbacks later in the decade, savings peaked at 29,000 MW, and then fell to 25,000 MW. 57. As early as 1988, utility projections of the peak-reduction benefits of DSM averaged 3% nationwide. U.S. DOE, Electric Supplies for the 1990's: Growing Reliance on Demand Management and Third-Party Suppliers, (1988) atES-3. After gaining experience with more active DSM programs, leading utilities saw much greater potential fordemand reductions. For example, the following utilities projected double-digit capacity savings by the year 2000:Boston Edison (10.5%); ConEd (13.8%); PG&E (10.9%); Northern States Power (17.0%).
“encourage and support programs for cost-effective energy efficiency and load managementinvestments as both a short-term and long-term strategy for enhancing the reliability of thenation’s electric system...”53
The challenge is clear, but the question still remains: how large is the reservoir of cost-effective efficiencyopportunities? How high should be set our sights? Over the past two decades, there have beennumerous studies, experiments, and programs aimed at improving the efficiency of electricity use in theUnited States. The central lesson of these studies and initiatives is that very large reservoirs of low-costenergy and capacity resources on the customer side of the electric meter are still untapped today. Acareful review of past programs and current market data supports a conclusion that a largefraction -- as much as 40 to 50 percent-- of the nation’s anticipated load growth over the nexttwo decades could be displaced through energy efficiency, pricing reforms, and loadmanagement programs. This conclusion is based upon a number of leading indicators:
1. Utility DSM Experience
First, the nation’s experience with utility-sponsored DSM strongly suggests that concerted efforts tocapture customer-side resources can succeed. By 1996, DSM programs at over 500 utilities hadlowered peak demand by 29,000 MW, and were saving customers more than 61 billion kWhannually.54 Even in a period of start-up and experimentation, utility DSM programs were relativelyinexpensive, with utility program costs averaging between 2 and 3 cents per kWh saved.55 By 1995,when EPAct and utility restructuring initiatives began to undermine support for utility DSM programs,DSM savings were growing at the rate of 18 percent annually. Based upon a compilation of utility filings,EIA expected these double-digit savings growth rates to continue.56 Leading utilities, those with thegreatest DSM program experience, reported in many states that by the year 2000, their programs couldlower peak demand by 10 to 14 percent.57

EFFICIENT RELIABILITY PAGE 25
58. By early in the year 2000, the net financial benefits of these programs were projected to exceed $2.7 billion. Inview of the high prices and reliability crises seen in California in 2000 and 2001, the actual benefits are undoubtedlyvery much higher. 59. Interlaboratory Working Group, Scenarios of U.S. Carbon Reductions: Potential Impacts of EnergyTechnologies by 2010 and Beyond (September 1997), at pages 3.11 and 4.9. The five National Labs involved were:Oak Ridge National Laboratory, Lawrence Berkeley National Laboratory, Pacific Northwest National Laboratory,Argonne National Laboratory, and National Renewable Energy Laboratory. 60. U.S. DOE, National Energy Strategy, First Edition 1991/1992 (February 1991) at 36. The Strategy also foundthat these reductions would save money: “The net economic benefit is estimated to be about $35 billion for the 1990-2030 period.” Ibid.
The overall national experience is reinforced by the progress of efficiency and load managementprograms in individual states that made a continuing commitment to DSM. For example, between 1980and 1999, California’s efficiency programs avoided 4,400 MW of demand; this is equal to nearly 10%of the state’s 1999 peak, and a very large fraction of the state’s overall demand growth in those twodecades.58 New York’s experience is also instructive. Between 1990 and 1996, efficiency programs inNew York saved 5.7 billion kWh, and avoided 1,374 MW of generating capacity, also a largeproportion of total load growth in the state in those years.
2. Non-Utility Studies
The extent of the efficiency and load-management reservoirs has also been the subject of concentrated,thorough assessments by a number of non-utility experts:
• The leading governmental assessment is the well-known “Five Labs Study,” prepared by the USDepartment of Energy’s five National Energy Laboratories in 1997.59 That study found thatcost-effective energy efficiency investments could displace 15% to 16% of the nation’s totalelectrical consumption by the year 2010.
• This was not the first time that the U.S. DOE had recognized the potential of customer-sideresources. In its National Energy Strategy, the (first) Bush Administration concluded thatwidespread adoption of efficiency and load management measures through IRP could lowerdemand by about 7%, avoiding 45,000 MW of generating capacity by 2010, and 90,000 MWby 2030.60
• The magnitude of the efficiency resource potential is also indicated by the magnitude of thesavings projected for particular end-use technologies by the DOE when setting applianceefficiency standards, and by the EPA in its Energy Star programs.
EFFICIENT RELIABILITY PAGE 26
61. Fickett, Gellings and Lovins, “Efficient Use of Electricity” Scientific American, (1990). A contemporaneousstudy for EPRI by Barakat and Chamberlain put the technical potential as high as 40%, but recognized that much ofthis would be too expensive to secure. 62. Nadel, et al, Using Targeted Energy Efficiency Programs to Reduce Peak Electrical Demand and AddressElectric System Reliability Problems, ACEEE, Washington, DC (2000). 63. Correcting routine problems could reduce air conditioning peak demand by 14 percent in existing homes, and25 percent in new construction. Neme, Proctor, and Nadel, Energy Savings Potential from Addressing ResidentialAir Conditioner and Heat Pump Installation Problems, ACEEE, Washington, DC (1999). 64. “Commissioning” is the process of carefully examining the energy needs of buildings as they have changedover time, adjusting HVAC and other systems in line with those changes, and tuning up those systems to make themmore efficient. A recent pilot project in Chicago by Commonwealth Edison suggests the magnitude of the potentialsavings from these efforts. Commissioning just eleven buildings, Edison reduced peak demand by 2 MW, withannual energy savings of more than 6 million kWh, and bill savings of nearly half a million dollars. See Kessler, Hill,Philbrick and Malek, “Maintenance, Operations and Repairs (MORES) - A Utility Recommissioning Program” inConference Proceedings 7th National Conference on Building Commissioning, Portland Energy Conservation, Inc.,Portland OR (1999). 65. US DOE is in the process of setting new efficiency standards for air conditioning, which could boostefficiency by 20 to 30 percent in residential units, and 10 to 20 percent for small commercial systems. Thesestandards could eliminate the need for approximately 26,000 MW of peak generating capacity by 2010, and more thantwice that by 2020. Appliance Standards Awareness Project, Opportunity Knocks: Capturing Pollution Reductionsand Consumer Savings from Updated Appliance Efficiency Standards, ACEEE, Washington, DC (2000). 66. Lighting accounts for about 25 percent of summer peak demand in the commercial sector, and lighting energyuse in most buildings can routinely be cut 30 to 50 percent through a combination of improved technology,automatic controls, and better lighting design. Lighten the Load, Opportunities to Lighten Utility Load with MoneySaving Energy Efficiency Investments, Environmental Media Services, Washington, DC (2000).
• The Electric Power Research Institute concluded in 1990 that the nation’s low-cost energyefficiency potential was at least 15% of total electric demand.61
• More recently, the American Council for an Energy-Efficient Economy (ACEEE) concluded thatlow-cost efficiency programs could displace approximately 64,000 MW of generation capacitywithin a decade nationwide, by focusing on just four key areas of opportunity62: Improvinginstallation and maintenance of residential air conditioners (40,000 MW savings)63;Commissioning existing commercial buildings (20,000 MW savings)64; Higher efficiencystandards for air conditioning (30,000 MW savings)65; and Efficient commercial lighting systems(up to 20,000 MW savings).66 ACEEE concludes that these four programs alone could meetapproximately half of the total load growth now projected for the nation over the next 15 to 20years.
3. Potential for Price-Responsive Peak Reductions by Customers
Utility DSM programs have traditionally pursued peak load management as well as overall energyefficiency gains, and load-management programs historically accounted for about half of the overallcapacity savings attributed to utility DSM efforts. As electricity markets evolve, it is essential to assessthe potential for customer-managed load as a resource to lower system peak loads and improvereliability.
EFFICIENT RELIABILITY PAGE 27
67. An excellent review is Hirst and Kirby, Retail-Load Participation in Competitive Wholesale ElectricityMarkets , prepared for the Edison Electric Institute and the Project for Sustainable FERC Energy Policy (January2001). 68. S. Braithwait and M. O’Sheasy, “Customer Response to Market Prices -- How Much Can You Get When YouNeed It Most?” EPRI International Energy Pricing Conference 2000, Washington, DC, July 2000. 69. Adam Capage, et al “The Dawning of Market-Based Load Management,” ER 99-18 (November 1999). 70. Brendan Kiernan, “From RTP to Dynamic Buying: Communication, Analysis, and Control Tools for ManagingRisk,” E Source Energy Information and Communication Series EIC-7 (October 1999) at p.7.
How large is the responsive load reservoir? The savings levels attributed to historic load-managementprograms cannot simply be assumed to continue in new energy markets. On the down side, it appearsthat many industrial and commercial customers were willing historically to enroll in rate discountprograms on the understanding that they would in fact rarely be interrupted. On the other hand, marketstudies and a number of pilot programs suggest that many customers would willingly reduce theirconsumption during high-priced power periods in return for market-based savings, which might wellexceed the savings obtained under the historic utility tariffs.
Because there are many barriers today to the deployment of price-responsive load management, it is tooearly to know for certain how deep that response would be under different market rules and prices.However, analysts reasonably conclude that the potential is quite significant when compared to the levelsof response needed to moderate price spikes and meet reliability concerns.67 Some leading indicators:
• Georgia Power, which operates the largest dynamic pricing program in the nation, gives us agood idea of the load-response potential. About 1600 of Georgia Power’s large industrial andcommercial customers, representing about 5000 MW of load, are enrolled in an hourly pricingprogram. These customers historically reduced their loads by a total of about 500 MW whenprices reached $500/MWh or higher. In August 1999, when prices spiked at more than$1000/MWh, customer response reached 800 MW, which was about a 20 percent loadreduction at that time68.
• A customer market study by E-Source yields similar estimates. After interviews with energymanagers of more than 100 large companies, this study found that while most of the load of mostlarge customers was constrained by commercial and production needs, and would be largelyfixed in the short term regardless of price, approximately 15% of their load could be managed inresponse to short-term price signals.69
• A 1995 study by Science Applications International Corp. reached much the same conclusion,finding that about 17% of customer load was typically discretionary, and could respond to pricesignals in short-term power markets70.
4. How Large Does the Customer Response Need to Be?
EFFICIENT RELIABILITY PAGE 28
71. Hirst and Kirby, supra, at p. 6. 72. Renee Guild, “EPRI’s Response to Reliability Problems” presented at NARUC, November 8, 1999. 73. Hearing Before the Subcommittee on Energy and Power of the Committee on Commerce, House ofRepresentatives (July 15, 1998), serial no. 105-115, p.45.
Importantly, a fairly modest load response to price can have very large effects on both reliability andprice in constrained power markets. As Hirst and Kirby conclude, “when supplies are tight, smallchanges in the amount of power demanded can have dramatic effects on market-clearing prices.”71
• A 1999 study by the Electric Power Research Institute, based on customer-specific data fromlarge customers in the Midwest, found that if only 10% of customer load had been exposed toreal-time prices, the resulting customer demand reductions would have reduced the Midwestsummer price spikes by 33 to 66 percent.72 Robert Levin, Vice-President of the New YorkMercantile Exchange, was even more optimistic, testifying before Congress that “a 5 percentreduction in demand during the peak prices in the Midwest in 1998 could have dropped some ofthese prices 80 or 90 percent.”73
• EPRI reached a similar conclusion after study of the power markets in California in the summerof 2000. Here it found that a 1% reduction in load during high peak periods could reducemarket clearing prices by 10%, and a 5% reduction in load could reduce peak period prices by19%, bringing down total power costs for the summer season by 5 to 16% overall.

EFFICIENT RELIABILITY PAGE 29
74. A large body of theoretical and empirical literature, and numerous orders by public utility commissions havedocumented these barriers; it is not our intention to restate these conclusions here. The essential point is that thebarriers remain, while utility DSM programs have been reduced, and as a consequence the efficiency of the nation’selectric system is compromised. 75. David Moskovitz, “Profits and Progress Through Least Cost Planning,” National Association of RegulatoryUtility Commissioners (1990).
IV. WHY DON’T ELECTRICITY MARKETS SUPPORT EFFICIENCY AND LOAD
MANAGEMENT? MARKET FLAWS AND MARKET BARRIERS IN TODAY’S
POWER MARKETS
A. Historic Barriers to Energy Efficiency Remain
As utility regulators and demand-side professionals have long been aware, cost-effective energyefficiency investments are often untapped in the U.S. economy due to a number of market imperfectionsand market barriers faced by individual customers.74 Even in the fluid and price-responsive electricitymarkets envisioned by restructuring advocates, most of the well-known and widely-documented barriersto energy efficiency investments will remain. Those problems include:
• the gap between the private and social discount rates for efficiency investments; • lack of customer information about efficiency technologies and costs; • transaction costs for delivering and installing many small efficiency improvements; • first-cost problems and the customer’s limited access to capital; • builder/buyer, landlord/tenant, and other split-incentive problems; • environmental costs not included in the cost of power; and • masking of real-time costs through customer aggregation, average billing, and regulated rate
plans.
Utility DSM programs and energy efficiency standards have been designed to overcome those barriers,and have demonstrated their utility in doing so. To appreciate the contribution that demand-side optionscan make to improving reliability, it is critical to understand that the nation’s current, halting transition toelectric competition has not resolved those market barriers. Individual customers still face those barriers,and the reliability of the electric system is being eroded as a consequence.
B. The New Efficiency Vacuum: How Efficiency Harms Utility Profits
For more than a decade, advocates of utility-sponsored efficiency programs have understood thathistoric rate-making practices created a strong disincentive for franchise utilities to invest in energyefficiency programs, even when they would be beneficial for customers.75 Utility regulators created bothIRP mandates and lost-revenue adjustment mechanisms to resolve this problem.
EFFICIENT RELIABILITY PAGE 30
76. A notable exception is California, where the incumbent wires companies still retain responsibility for DSMprograms. As noted in Section II above, however, utility spending and performance have dropped significantlysince 1994. 77. Some investors and generators have argued that little-used peaking units will not be profitable (and thus, willnot be built) without broad support payments or very high peak-load prices ( $1200 to $5000 per MWH). EnronPower Marketing, Inc., “Analysis of the Midwestern Electricity Price Spikes of Late June 1998" (September 1998) atp.8.
The happy conjunction of responsibility and incentive that existed under many state IRP regimes hasdisintegrated with the transition to competition. Even in states that have not restructured, utilities havelittle incentive to pursue efficiency programs. Concerns about the prospects for competition in the future,about potential stranded costs, and about average rates combine to create powerful disincentives toefficiency programs, which lost-revenue mechanisms do not sufficiently erase. In states that haverestructured, under many restructuring plans, the traditional utility responsibility to engage in integratedresource planning and to deliver DSM programs has been lost, while the problem of lost revenueremains. As a consequence, in most states, none of the successor functional elements of the historicutility has the mandate to pursue cost-effective efficiency measures76. And none of the entities succeedingthe vertically integrated utility has a financial incentive to promote cost-effective energy efficiency for thebenefit of customers, the environment, or overall grid reliability.
1. Competitive Generation Incentives
In a competitive generation market, generators have no financial incentive to promote either efficiency orload management. Base-load and intermediate units benefit from being able to sell all of their output,preferably at high market clearing prices. Peaking units will be profitable only if peak-load conditionsobtain many hours of the year, or if peak-load clearing prices are high enough to cover the all-in costs ofthe unit. 77 In either event, efficiency and load-management measures that lower demand, lower marketclearing prices, and mitigate generators’ market power, will lower Genco profits.
2. Wires Company Revenues and the Problem of Lost Profits Math
It was a common assumption during restructuring debates in many states that wires companies, oncedeprived of the generator’s natural desire to promote sales, would be able to promote cost-effectiveefficiency measures that would lower sales and customers’ bills. While the assumption is superficiallyappealing, the opposite is true. Under the rate designs commonly in use, the financial disincentives tolower sales are worse for wires-only distribution or transmission companies than they are for integratedutility franchises.
The central problem with wires-company rate design is the predominant use of sales-based revenueformulas, particularly when per-kWh delivery prices are fixed for a long period of time, as with mostwires company price cap plans. Under this method of rate-making, once a wires company’s rates areset in a rate case, all changes in sales will directly affect the company’s profitability. Since, in the short
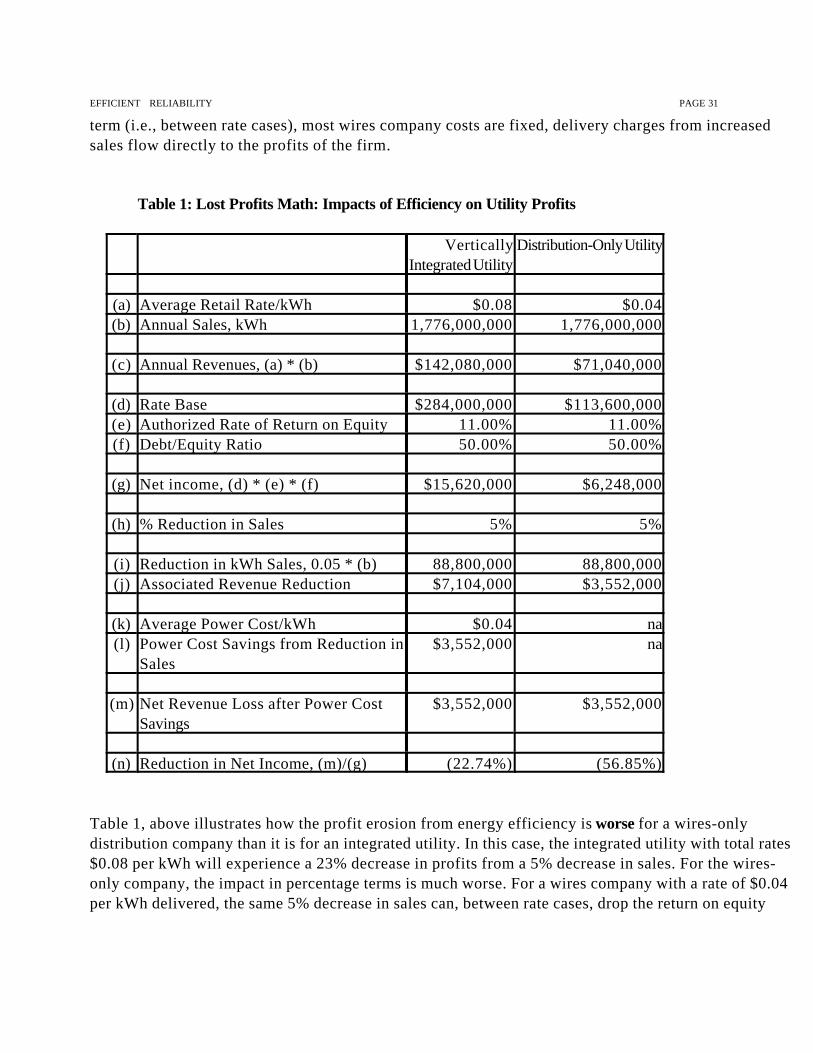
EFFICIENT RELIABILITY PAGE 31
term (i.e., between rate cases), most wires company costs are fixed, delivery charges from increasedsales flow directly to the profits of the firm.
Table 1: Lost Profits Math: Impacts of Efficiency on Utility Profits
VerticallyIntegrated Utility
Distribution-Only Utility
(a) Average Retail Rate/kWh $0.08 $0.04(b) Annual Sales, kWh 1,776,000,000 1,776,000,000
(c) Annual Revenues, (a) * (b) $142,080,000 $71,040,000
(d) Rate Base $284,000,000 $113,600,000(e) Authorized Rate of Return on Equity 11.00% 11.00%(f) Debt/Equity Ratio 50.00% 50.00%
(g) Net income, (d) * (e) * (f) $15,620,000 $6,248,000
(h) % Reduction in Sales 5% 5%
(i) Reduction in kWh Sales, 0.05 * (b) 88,800,000 88,800,000(j) Associated Revenue Reduction $7,104,000 $3,552,000
(k) Average Power Cost/kWh $0.04 na(l) Power Cost Savings from Reduction in
Sales$3,552,000 na
(m) Net Revenue Loss after Power CostSavings
$3,552,000 $3,552,000
(n) Reduction in Net Income, (m)/(g) (22.74%) (56.85%)
Table 1, above illustrates how the profit erosion from energy efficiency is worse for a wires-onlydistribution company than it is for an integrated utility. In this case, the integrated utility with total rates of$0.08 per kWh will experience a 23% decrease in profits from a 5% decrease in sales. For the wires-only company, the impact in percentage terms is much worse. For a wires company with a rate of $0.04per kWh delivered, the same 5% decrease in sales can, between rate cases, drop the return on equity

EFFICIENT RELIABILITY PAGE 32
78. While perhaps not immediately apparent, the arithmetic is easily explained. A wires company has a relativelysmall equity rate base, while the short term profit loss from throughput reductions is relatively large, and not offsetby power cost savings. The percentages shown here are illustrative -- percentages will vary with the rate design ofeach distribution company.
by more than 50%.78 The disproportionate impact works in the other direction in the event of anincrease in throughput. The arithmetic of lost profits helps to explain the decline in utility support forenergy efficiency programs in recent years, and should be an important factor in designing new efficiencydelivery mechanisms.
C. Barriers to Efficiency in Wholesale Power Markets
Efficient prices result from the constant, well-informed interaction of supply and demand in an openmarketplace. However, in today’s electric power markets, the dynamic interaction between price,supply and demand is indirect at best. As a consequence it is simply not possible in electricity markets inthe U.S. today to conclude that “the market” is functioning so as to call forth an efficient level of loadmanagement and long-term energy efficiency. The failure of electricity markets has been most marked, ofcourse, in California and the West in 2000-2001, but the structural flaws noted here exist to a significantdegree in all regions of the country.
The fundamental disconnection between cost and price in today’s markets has many causes, but its rootslie in the way that historic franchise rate designs have been pushed forward into current electricitymarkets:
• The regulation of the monopoly franchise was historically based upon average prices, set in ratecases, and revealed to customers in monthly bills long after the hour of consumption. This is stilltrue for most customers today;
• Although the cost of consumption varies quite significantly over time, very few customers eversaw any resulting rate shifts through interval metering or real-time tariffs; this price-averagingpolicy continues today, even in markets where the hourly market clearing prices vary by factorsof 100 or more;
• Under rate of return regulation, regulators and utilities found that the inefficiencies of inexactpricing could be moderated by rate regulations that required peak power to be sold at cost; byrate designs allocating costs among customer classes; and by utility planning decisions, includingexplicit efforts to moderate demand through DSM programs and interruptible contracts. Thesepolicies and programs have not been carried forward in restructured markets.
As will be seen in the discussion below, market designs that simply carry franchise-style rates forward tocompetitive, volatile wholesale markets have stifled the development of cost-effective efficiency andload-management resources, and exacerbated the cost and reliability challenges of fluctuating demand.
EFFICIENT RELIABILITY PAGE 33
79. Even where there are straight pass through mechanisms, such as in San Diego, California, the retail market hasnot developed enough to respond effectively. 64. Development of advanced, interactive load management is hampered by several factors: RTO and market rulesare uncertain; price patterns in new energy markets are not yet settled (quite the opposite!); customerresponsiveness is blunted by poor market signals and rate designs; and neither market rules nor regulators offersuccessful load managers payments that would reflect the full value of their services to the utility system. Theseproblems must be overcome in order to attract the capital and entrepreneurial talent necessary to launch thisimportant new industry.
Despite considerable variability in wholesale costs, the price signals sent to retail customers have beenmuted by price caps and average cost rates. Only the supply-side is represented in any meaningful wayin the emerging wholesale markets.
The demand-side of the wholesale market is essentially represented by a largely fixed, or price-insensitive, demand. As markets are developing, there is a gap between the wholesale and retailportions of the marketplace that inhibits the development of retail demand sensitivity. Variations insupply-side costs are simply not reflected in retail price signals.79 Thus, the information and incentivesnecessary to stimulate demand-side responsiveness by ultimate consumers are masked.
1. Six Reasons the Demand-Side Lags in Wholesale Market Reforms
What is emerging with the development of wholesale markets is an electricity market with responsivesupply resources, but without any significant price sensitivity on the demand-side. In economic terms,revealed demand is still inelastic. There are at least six reasons today’s emerging wholesale marketsdemonstrate inadequate price sensitivity on the demand-side:
(1) Real wholesale costs are not reflected in retail tariffs seen by most customers;(2) Wholesale energy markets have not built in a demand-side; (3) Load profiles used to assign wholesale costs to load-serving entities fail to account for the
actual costs of service to the LSE’s customers;(4) Demand-side resources are effectively excluded from the wholesale markets for reliability
services;(5) Transmission constraints have not been recognized in the pricing of wholesale energy
services. (6) The markets for innovative metering, reactive load management, and other demand-side
services are immature, and will remain uncertain until equitable market rules areestablished.80
Wholesale costs and price levels have long been muted by the traditional system of pricing retail servicesin the traditional vertically integrated utility system of regulation. This phenomenon continues in mostmarkets today. Even areas that have or are opening markets have established rate packages that closelyresemble the traditional utility service. Standard offer services in areas that have opened retail markets

EFFICIENT RELIABILITY PAGE 34
and the resistence to opening retail competition in other areas have perpetuated this phenomenon in thehistorical system. There is little relationship between high wholesale costs or prices (and correspondingrelationships to system reliability), and retail demand in a given hour or day. Rather, retail prices wereand are averaged over the year, the season, or for a specific period within a day.
When considering the overall success and critical challenges facing wholesale power markets in theUnited States, it would be difficult to overstate the significance of the six limitations listed here.
These structural market flaws are largely responsible for the price spikes and reliability challengesexperienced in these markets, and contribute greatly to the market power increasingly exercised bygenerators. There are, however, realistic and workable solutions to these market design flaws, which, ifadopted, could help to ensure more efficient and more reliable energy services. Those solutions are setout briefly in Section V, following.

EFFICIENT RELIABILITY PAGE 35
V. TAPPING THE DEMAND-SIDE RESERVOIR : A SOLUTION MENU FOR
DECISION-MAKERS
Our nation now has nearly twenty years’ experience with utility-sponsored energy efficiency programs,and has been engaged for several years in developing wholesale and retail markets in electricity. Theseexperiences lead to the central conclusion of this report:
Cost-effective efficiency and load management investments could significantly improve thereliability of the nation’s electric system, and make electricity markets more competitive andmore efficient, while lowering the economic and environmental costs of electric service. How can these benefits be obtained in today’s electricity franchises and markets? While the advantagesof demand-side resources are widely recognized, there is no single “silver bullet” mechanism forcapturing all of those benefits for electric systems and customers. Rather, the challenge facing decision-makers is to examine each market component, and each important market or regulatory rule with thefollowing questions in mind:
Could the function of this market or the purpose of this rule be served at lower cost and/orlower risk through demand-side resources? And if so, how can we organize this market orstructure this rule to ensure that high-reliability, low-cost solutions are in fact developed?
Throughout the many markets and franchises operating in the US today there are three major venues fordiscovering and deploying cost-effective efficiency resources:
(1) Wholesale Market Structures: Wholesale markets should be designed to invite demand-side price responses to bid against supply on the trading floors of new electricity markets, andshould permit demand-side resources to compete with transmission and generation investmentsto meet system needs;
(2) Rates and Rules for Wires Companies: Regulators should seek to send accurate pricesignals to customers and load serving entities, and remove barriers to demand-side resourcesthrough reliability rules, rate designs for wires companies, and retail default service standards;and
(3) System Benefit Programs : Legislatures and regulators should create funding mechanismsfor efficiency and load management investments, recognizing their reliability benefits, as well asthe significant market barriers that still block their efficient deployment.
In the sections below, we present brief description of workable mechanisms that meet these objectives.An “Efficient Reliability” program could well employ all of these means.

EFFICIENT RELIABILITY PAGE 36
Efficient Reliability Solution Menu
A. Wholesale Market Features
(1) Demand-Side Bidding: ## Price-sensitive load reveals a real demand curve## Reform load profiles to support demand management
(2) Multi-Settlement Markets: ## Day-ahead financial settlement permits economic resales of
load reductions in the spot market
(3) Open Ancillary Services Markets to Demand-Side Resources: ## Invite “dispatchable load” to bid into integrated reserves
markets
(4) Efficient Reliability Standard: ## Demand-side resources should receive equal treatment with
supply and transmission options in RTO and power poolinitiatives that use uplift and other “socialized” supportmechanisms
B. Rates and Rules for Wires Companies
(5) Transmission-Level Congestion Pricing:## Locational pricing reveals the value of distributed resources
acrossconstrained interfaces
(6) Enhancing Reliability Through Retail Rate Design:## Reform price caps and default service rates to reveal the
value of efficiency and load response at different times andlocations
## Use revenue caps, not price caps or high fixed charges, forwires company rate designs

EFFICIENT RELIABILITY PAGE 37
Efficient Reliability Solution Menu (con’t)
C. Promoting End-Use Efficiency
(7) System Benefit Funds:• Broad-based wires charges can support efficiency and load
management, enhance reliability, and lower market prices• Assign efficiency programs to entities with incentives and
ability to best succeed -- e.g., the Energy Efficiency Utility
(8) Poolwide uplift charges and market transformation programs:• Widespread use of efficient technology will lower wholesale
costs and enhance reliability across franchise and stateboundaries
(9) Complementary policies for efficiency: • Codes, standards, tax credits, and financing plans accelerate
the use of efficient end-use technologies
A. Demand-Side Resources in Regional Power Pools and New Electricity Markets
The focus of most decision-makers on supply-side solutions to meet load growth and reliability needs isperhaps a natural product of the manner in which franchises and electricity markets have evolved. Nevertheless, the demand side of these markets represents an enormous reservoir of untapped capacityavailable both as a moderating influence in the volatile wholesale electricity markets and as a resource inits own right in the markets for reliability services. Tapping these resources requires decision-makers tofocus clearly on a simply-stated goal:
Every effort should be made to expose the value of demand response in the wholesale andretail markets to as many participants as possible.
It is becoming clear that a demand response has enormous value to consumers. The problem is that thestructure of our markets hides that value from consumers, retail sellers, and innovative entrepreneurswho could develop new demand-side technologies and services. With the value of demand response sowell hidden from those who could profit from it, it is no wonder that we see little demand response inthese markets today. Regulators need to structure the market and market rules so customers, retail

EFFICIENT RELIABILITY PAGE 38
81. For a summary of this analysis, see Regulatory Assistance Project, “Using A Demand Response to StabilizeElectric Markets” (February, 2001). 82. FERC Order in NSTAR v. NEPOOL (July 26, 2000).
sellers, distribution utilities, and current and potential vendors of demand response have an opportunityto realize the value of the services they can offer81.
Fortunately, the Federal Energy Regulatory Commission (FERC) has responded to this challenge,observing that “... a successful transition to competitive electricity markets will necessarily involve anincreased participation of the demand side of the market in making resource decisions” and thatdemand-side participation “can serve to discipline prices by bringing supply and demand into balance.”82
Four policy reforms for accomplishing these purposes are described below.
1. Demand-Side Bidding: Price-sensitive load reveals a real demand curve
Under traditional franchise regulation, the financial relationship between electric demand and the cost ofsupply was indirect at best. In particular, the cost of maintaining reliability at peak was rarely reflected inpeak period prices. The price signals delivered to both wholesale and retail customers were averagedover time and location, and bore only a general relationship to the cost of production. Supply wasmanaged, not to match marginal cost and marginal “demand” from customers, but to meet the revealedload curve of customers who received only broadly averaged price signals. The “demand curve” in suchcircumstances was an engineering concept more than the revealed willingness-to-pay of the utility’scustomers. This is the vertical “assumed” demand curve shown in Figure 7.

EFFICIENT RELIABILITY PAGE 39
83. This does not require a rate system that charges real-time prices to all customers, a policy that could be bothexpensive and politically difficult. Substantial progress would be made even if only the largest customers receivedreal-time prices, and if customers and providers were rewarded for selling back high-value consumption avoided inpeak periods.
D e m a n d C u r v e
S u p p l y C u r v ePrice
Quantity
P 1
P 2
Q 2 Q 1
A s s u m e dD e m a n d
S h a d e d a r e a i s s a v i n g s t o w h o l e s a l e m a r k e t
Figure 7: Assumed vs. Actual Demand Curves for Electricity. Revealing the actual demandcurve would lower price and peak loads in the market.
Whatever the merits of this muted demand response in the franchise system, it has serious detrimentaleffects in electricity markets that are established to efficiently balance demand and supply. As recentprice spikes, high prices, and reliability challenges of those markets reveal, efficient energy marketssimply cannot be built on such a foundation. As noted in Section III, above, there is ample evidence thatfor many customers, demand for electricity is moderately elastic, and that at the high prices experiencedin tight market situations, customers with choices will respond by reducing demand, and/or shifting it tohours when prices are lower. Revealing the customers’ real demand curve is now a critical challenge forthe nation’s electric policymakers. As shown in the second curve in Figure 7, markets will clear at lowerquantities and lower prices when this curve is exposed83.
The good news in this connection is that a relatively modest demand response during just a few hours ofthe year could make a very substantial contribution to lowering peak demand, and thus enhancingreliability -- and lowering overall power costs at the same time. In New England, for example, 9% of thecapacity of the generating system is called on just 1% of the hours of the year, and the high cost of
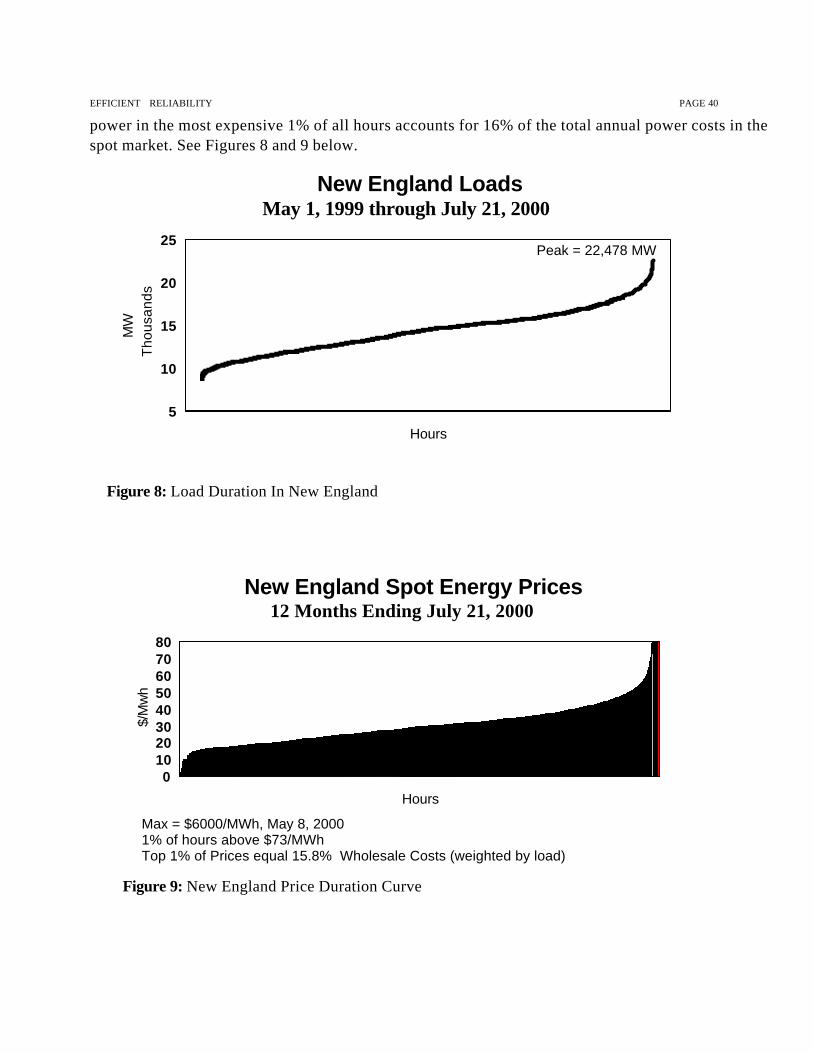
EFFICIENT RELIABILITY PAGE 40
Hours
01020304050607080
$/M
wh
Max = $6000/MWh, May 8, 20001% of hours above $73/MWhTop 1% of Prices equal 15.8% Wholesale Costs (weighted by load)
New England Spot Energy Prices12 Months Ending July 21, 2000
Figure 9: New England Price Duration Curve
Hours
5
10
15
20
25
Tho
usan
dsM
W
Peak = 22,478 MW
New England Loads May 1, 1999 through July 21, 2000
Figure 8: Load Duration In New England
power in the most expensive 1% of all hours accounts for 16% of the total annual power costs in thespot market. See Figures 8 and 9 below.
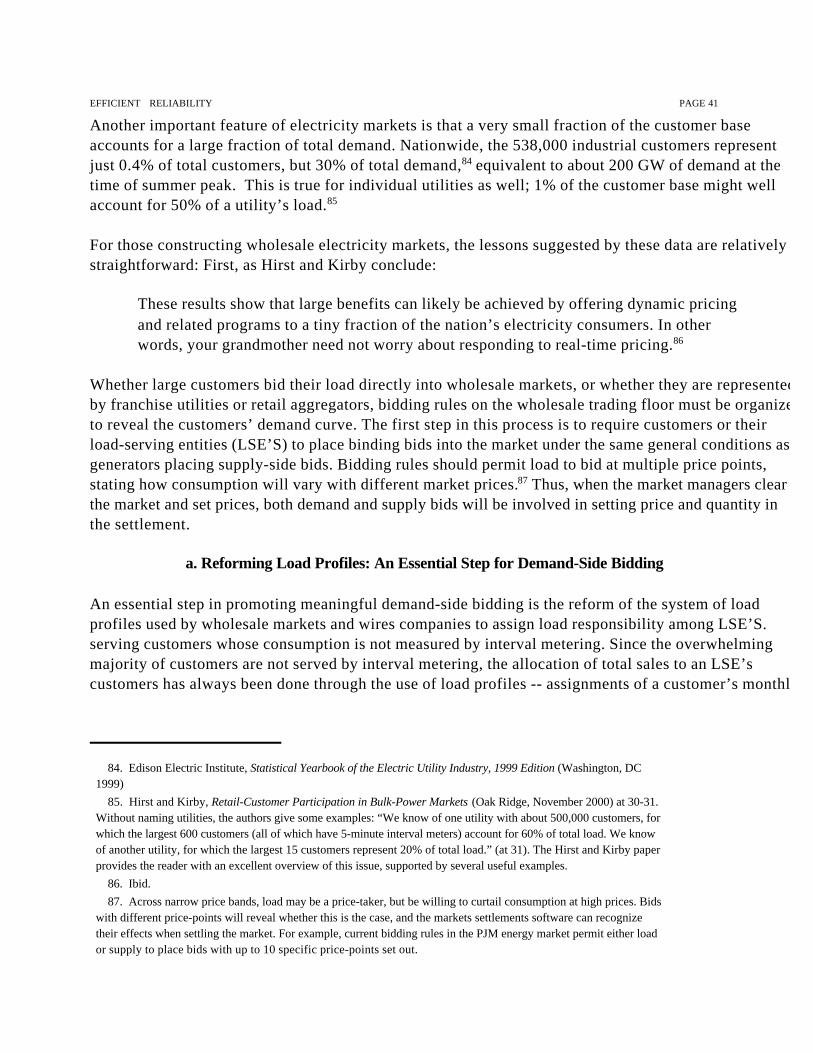
EFFICIENT RELIABILITY PAGE 41
84. Edison Electric Institute, Statistical Yearbook of the Electric Utility Industry, 1999 Edition (Washington, DC1999) 85. Hirst and Kirby, Retail-Customer Participation in Bulk-Power Markets (Oak Ridge, November 2000) at 30-31.Without naming utilities, the authors give some examples: “We know of one utility with about 500,000 customers, forwhich the largest 600 customers (all of which have 5-minute interval meters) account for 60% of total load. We knowof another utility, for which the largest 15 customers represent 20% of total load.” (at 31). The Hirst and Kirby paperprovides the reader with an excellent overview of this issue, supported by several useful examples. 86. Ibid. 87. Across narrow price bands, load may be a price-taker, but be willing to curtail consumption at high prices. Bidswith different price-points will reveal whether this is the case, and the markets settlements software can recognizetheir effects when settling the market. For example, current bidding rules in the PJM energy market permit either loador supply to place bids with up to 10 specific price-points set out.
Another important feature of electricity markets is that a very small fraction of the customer baseaccounts for a large fraction of total demand. Nationwide, the 538,000 industrial customers representjust 0.4% of total customers, but 30% of total demand,84 equivalent to about 200 GW of demand at thetime of summer peak. This is true for individual utilities as well; 1% of the customer base might wellaccount for 50% of a utility’s load.85
For those constructing wholesale electricity markets, the lessons suggested by these data are relativelystraightforward: First, as Hirst and Kirby conclude:
These results show that large benefits can likely be achieved by offering dynamic pricingand related programs to a tiny fraction of the nation’s electricity consumers. In otherwords, your grandmother need not worry about responding to real-time pricing.86
Whether large customers bid their load directly into wholesale markets, or whether they are representedby franchise utilities or retail aggregators, bidding rules on the wholesale trading floor must be organizedto reveal the customers’ demand curve. The first step in this process is to require customers or theirload-serving entities (LSE’S) to place binding bids into the market under the same general conditions asgenerators placing supply-side bids. Bidding rules should permit load to bid at multiple price points,stating how consumption will vary with different market prices.87 Thus, when the market managers clearthe market and set prices, both demand and supply bids will be involved in setting price and quantity inthe settlement.
a. Reforming Load Profiles: An Essential Step for Demand-Side Bidding
An essential step in promoting meaningful demand-side bidding is the reform of the system of loadprofiles used by wholesale markets and wires companies to assign load responsibility among LSE’S.serving customers whose consumption is not measured by interval metering. Since the overwhelmingmajority of customers are not served by interval metering, the allocation of total sales to an LSE’scustomers has always been done through the use of load profiles -- assignments of a customer’s monthly
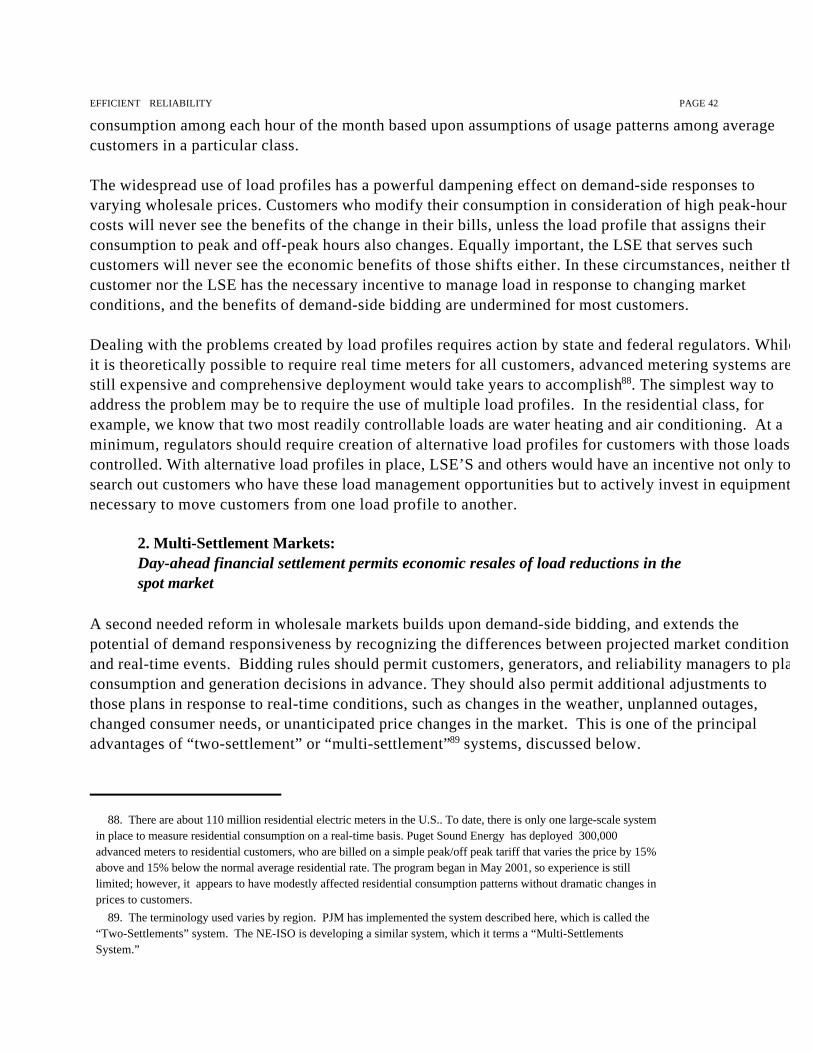
EFFICIENT RELIABILITY PAGE 42
88. There are about 110 million residential electric meters in the U.S.. To date, there is only one large-scale systemin place to measure residential consumption on a real-time basis. Puget Sound Energy has deployed 300,000advanced meters to residential customers, who are billed on a simple peak/off peak tariff that varies the price by 15%above and 15% below the normal average residential rate. The program began in May 2001, so experience is stilllimited; however, it appears to have modestly affected residential consumption patterns without dramatic changes inprices to customers. 89. The terminology used varies by region. PJM has implemented the system described here, which is called the“Two-Settlements” system. The NE-ISO is developing a similar system, which it terms a “Multi-SettlementsSystem.”
consumption among each hour of the month based upon assumptions of usage patterns among averagecustomers in a particular class.
The widespread use of load profiles has a powerful dampening effect on demand-side responses tovarying wholesale prices. Customers who modify their consumption in consideration of high peak-hourcosts will never see the benefits of the change in their bills, unless the load profile that assigns theirconsumption to peak and off-peak hours also changes. Equally important, the LSE that serves suchcustomers will never see the economic benefits of those shifts either. In these circumstances, neither thecustomer nor the LSE has the necessary incentive to manage load in response to changing marketconditions, and the benefits of demand-side bidding are undermined for most customers.
Dealing with the problems created by load profiles requires action by state and federal regulators. Whileit is theoretically possible to require real time meters for all customers, advanced metering systems arestill expensive and comprehensive deployment would take years to accomplish88. The simplest way toaddress the problem may be to require the use of multiple load profiles. In the residential class, forexample, we know that two most readily controllable loads are water heating and air conditioning. At a minimum, regulators should require creation of alternative load profiles for customers with those loadscontrolled. With alternative load profiles in place, LSE’S and others would have an incentive not only tosearch out customers who have these load management opportunities but to actively invest in equipmentnecessary to move customers from one load profile to another.
2. Multi-Settlement Markets: Day-ahead financial settlement permits economic resales of load reductions in the spot market
A second needed reform in wholesale markets builds upon demand-side bidding, and extends thepotential of demand responsiveness by recognizing the differences between projected market conditionsand real-time events. Bidding rules should permit customers, generators, and reliability managers to planconsumption and generation decisions in advance. They should also permit additional adjustments tothose plans in response to real-time conditions, such as changes in the weather, unplanned outages,changed consumer needs, or unanticipated price changes in the market. This is one of the principaladvantages of “two-settlement” or “multi-settlement”89 systems, discussed below.

EFFICIENT RELIABILITY PAGE 43
90. Peter Cramton and Robert Wilson (Market Design, Inc.), “A Review of ISO New England’s Proposed MarketRules,” Executive Summary at 2. 91. For example, In June of 2000, NE-ISO day-ahead load forecasts deviated from actual hourly loads byapproximately 3.4% (roughly 440 MW). In contrast, hourly forecasted prices deviated from actual settlement pricesby approximately 20% (or $8/MWH relative to the $39/MWh price for the month).
In multi-settlement systems the market is “settled,” or cleared, more than once, generally through thefollowing steps:
(1) First, in the “day-ahead” market, bids are taken both for loads and for supply resources.(2) Using settlement software to rank both demand and supply bids at various price-points, themarket manager clears the market at prices and quantities that are physically achievable.(3) At the time of this first settlement (usually a day ahead), accepted bids are not merelyhypothetical – they are firm financial commitments to buy and sell power at the market clearingprice. In a financial sense, power is bought and sold in this settlement.(4) Following the initial settlement, and up to a cut-point in the “day-of” market, buyers andsellers can seek to modify their commitments in a second settlement. Any adjustments made inthis settlement are also financially binding. (5) Discipline is imposed on bidders in these settlements by requirements that generation andpurchases conform to the obligations of their bids. Any deviations from the settlements arepresumed to be met by purchases from the spot market and are charged to suppliers andcustomers at spot market rates.
Multi-settlement systems can add both price stability and flexibility to electric power markets ascompared with a single, real-time settlement, such as the market used to date in New England. Themarket for energy services operated by ISO-New England since May, 1999 has depended heavily on asingle, after the fact, settlement, determined only after resources have been dispatched.90 Day-aheadprices are forecast, but with fairly low confidence.91 What has resulted is a structure in which neithersupply nor demand-side resources have much opportunity to plan for and respond to volatile prices. Byimpairing the ability of demand-side resources to plan for load reductions, and to profit from re-sellingdemand at times of high prices, single-settlement systems reduce the ability of demand response tosupply stability and reliability to the system.
In contrast, multi-settlement systems provide clear price signals to both suppliers and load in advance ofphysical generation and consumption activity. The first market in multi-settlement markets performs ahedging function for ultimate consumers and suppliers. (In effect, it reduces the exposure of load servingentities or retail customers to unexpected shortages in the real-time markets.) It also has the effect ofreducing the potential windfall profits flowing to operating generators from unscheduled outages in other

EFFICIENT RELIABILITY PAGE 44
92. Properly structured, it reduces the secondary rent or market price premium that will inure to the benefit ofother resources in a single market clearing price from actions to reschedule units (or declare a scheduled unitunavailable) in the real-time market. It may also strengthen the effective penalties from such rescheduling. (The unitthat is declared out of service must pay the market clearing price for the resource that was no longer available.)
units. Used in conjunction with demand-side bidding, multi-settlements can also provide strongincentives to meet the supply resource commitments made in the day-ahead settlement.92
EFFICIENT RELIABILITY PAGE 45
93. In some electricity markets, there may be a strong incentive for the physical withdrawal of generationresources when reliability is most threatened. For example, in the California and New England markets, only a fewfirms may set the clearing price when resources are limited (e.g., peak periods). The incentives for such gaming maybe very strong in constrained load pockets. The combination of only a few suppliers and a single clearing price maycreate a strong incentive to withdraw or declare units “unavailable” when such an event can lead to a significantincrease in the market clearing price that all producers will receive.
Profitable demand response in a multi-settlement system:
Multi-settlement markets support demand-side responses that can moderate the reliability problems andprice spikes associated with thin operating margins. This occurs in at least two ways. First, if prices clearat very high levels in the day-ahead market, LSE’S and their customers know in advance that it will be intheir interest to reduce consumption and sell the released power back into the wholesale market in the“day-of” settlement. The same is true if the day-ahead market clears at normal prices, but prices spikethe next day due to hot weather or unplanned outages. Anyone who purchased supply in the day-aheadmarket now has a clear opportunity to profit by reducing consumption and selling back their powerpurchases into the spot market.
Importantly, demand-side sale-backs of this type provide a virtually automatic profit incentive to load-side managers to reduce consumption at times of high peak load. And, because those sale-backs arere-sales of power actually purchased in the day-ahead market, in a settlement that satisfied the system’sphysical constraints, it answers the frequently-raised concern that purchases of demand reductions maymerely be paying for reductions in “phantom load.” Conversely, an LSE that finds its consumptionexceeding its day-ahead purchases in this case will be obliged to pay the high spot prices for thedeviation. Thus, LSE’S have an incentive to predict their loads accurately, and to control their loads intimes of thin margins and high prices.
Effects on reliability:
As can be seen from the examples above, multi-settlements markets create important opportunities fordemand-side as well as supply-side managers to meet the needs of the electric system during times ofhigh prices. Such a system is both financially and physically more stable than a system that attempts tobalance the market through ramping up and ramping down supply alone.
Mitigating market power and market “gaming”:
Market power monitors have raised concerns that a single settlement approach increases supplier incentives to manipulate markets through the physical or economic withholding of assets (e.g., bydeclaring units unavailable in the short term market).93 Well-functioning futures markets (including day-ahead markets) can reduce supplier incentives for gaming of this sort in the real-time market. In multi-settlement systems, units that suddenly become unavailable must purchase supply in the real-time marketto satisfy their output commitments; meanwhile, all other units that were cleared in the day-ahead market

EFFICIENT RELIABILITY PAGE 46
94. Arguably, it may simply shift the incentives for physical withdrawal of resources from the final market to theperiods that are used for determining price levels in the advance or hedging markets. Gaming the advance markets,however, will present more modest reliability problems. The advantage of time and financial signals sent by theseearlier advance-markets should increase the pool of available resources to meet service needs when the physicalresources are needed in the final contingency market.
receive only their day-ahead prices, not the temporarily high spot prices. And demand-side resourcescan enter the market through sale-backs when prices rise, moderating the impact of temporaryshortages. Under these conditions, the benefits to suppliers from short-term strategic withholding aregreatly reduced.
Conclusion - Multi-settlements:
Effective advance markets can serve to help reduce the financial exposure of load serving entities (andtheir customers) as well as suppliers, to variations in real-time clearing prices. Forward markets can alsohelp reduce the financial incentives for suppliers to manipulate short-term market clearing prices.94 Theywill also improve the strength and timing of price signals sent to end users to reduce loads when pricesare high in real-time markets. Demand-side bidding and the multi-settlement process complement eachother in each of these valuable functions. For these reasons, demand-side bidding and multi-settlementmarkets are important techniques to mitigate the reliability challenges, prices spikes, and market powerproblems seen in wholesale power markets in the U.S. in recent years.
3. Opening Ancillary Services Markets to Demand-Side Resources:Invite “dispatchable load” to bid into integrated reserves markets
As noted at the outset of this paper, electricity is a unique service in that production and consumptionmust be matched essentially instantaneously. Reliability of the power system is maintained by activelycontrolling some resources to continuously balance aggregate production and consumption. Historicallythis control was exercised only over large generators. Loads were most often free to consume electricityon their own schedules to meet their needs, while generation, under the control of the system operator,responded to the changing requirements imposed by loads.
However, from the perspective of the system as a whole, controllable load can provide many balancingservices just as well as controllable generation. And as wholesale markets evolve to provide competitionamong generators, new opportunities can emerge for demand-side resources to participate actively inproviding reliability resources to the power markets.
While FERC has recognized that competition will be desirable in setting the market values for differentreliability services, those competitive reliability markets tend to be built on the same weak foundation asthe market for wholesale generation generally. Because reliability has traditionally been viewed as aresource that, in periods of thinning reserve margins, could only be satisfied by bringing on more supplyresources, the reliability potential of the demand-side has often been overlooked. Resource adequacy
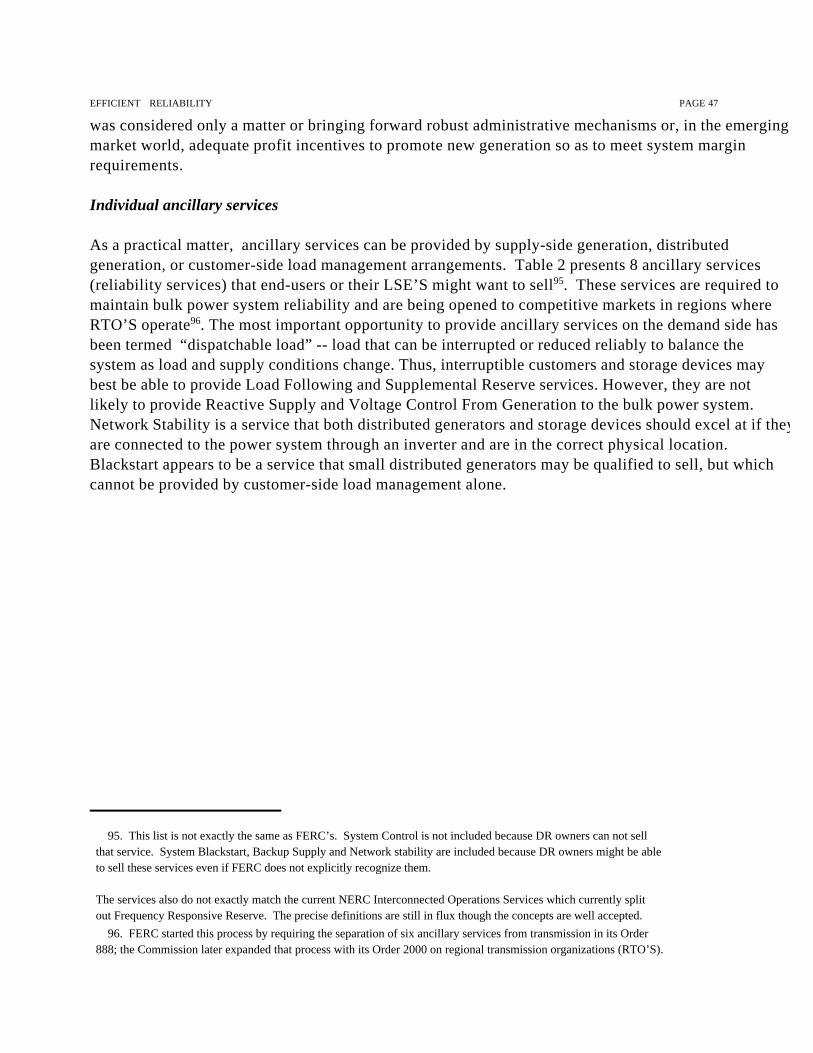
EFFICIENT RELIABILITY PAGE 47
95. This list is not exactly the same as FERC’s. System Control is not included because DR owners can not sellthat service. System Blackstart, Backup Supply and Network stability are included because DR owners might be ableto sell these services even if FERC does not explicitly recognize them.
The services also do not exactly match the current NERC Interconnected Operations Services which currently splitout Frequency Responsive Reserve. The precise definitions are still in flux though the concepts are well accepted. 96. FERC started this process by requiring the separation of six ancillary services from transmission in its Order888; the Commission later expanded that process with its Order 2000 on regional transmission organizations (RTO’S).
was considered only a matter or bringing forward robust administrative mechanisms or, in the emergingmarket world, adequate profit incentives to promote new generation so as to meet system marginrequirements.
Individual ancillary services
As a practical matter, ancillary services can be provided by supply-side generation, distributedgeneration, or customer-side load management arrangements. Table 2 presents 8 ancillary services(reliability services) that end-users or their LSE’S might want to sell95. These services are required tomaintain bulk power system reliability and are being opened to competitive markets in regions whereRTO’S operate96. The most important opportunity to provide ancillary services on the demand side hasbeen termed “dispatchable load” -- load that can be interrupted or reduced reliably to balance thesystem as load and supply conditions change. Thus, interruptible customers and storage devices maybest be able to provide Load Following and Supplemental Reserve services. However, they are notlikely to provide Reactive Supply and Voltage Control From Generation to the bulk power system.Network Stability is a service that both distributed generators and storage devices should excel at if theyare connected to the power system through an inverter and are in the correct physical location. Blackstart appears to be a service that small distributed generators may be qualified to sell, but whichcannot be provided by customer-side load management alone.
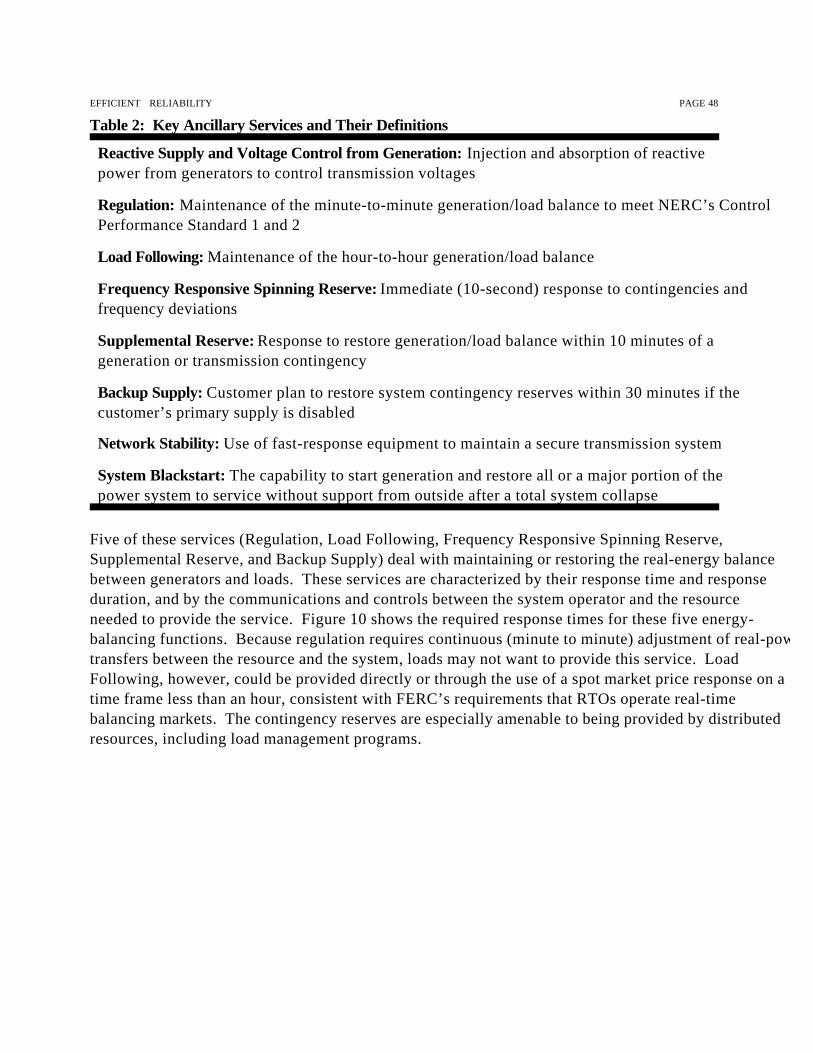
EFFICIENT RELIABILITY PAGE 48
Table 2: Key Ancillary Services and Their Definitions
Reactive Supply and Voltage Control from Generation: Injection and absorption of reactivepower from generators to control transmission voltages
Regulation: Maintenance of the minute-to-minute generation/load balance to meet NERC’s ControlPerformance Standard 1 and 2
Load Following: Maintenance of the hour-to-hour generation/load balance
Frequency Responsive Spinning Reserve: Immediate (10-second) response to contingencies andfrequency deviations
Supplemental Reserve: Response to restore generation/load balance within 10 minutes of ageneration or transmission contingency
Backup Supply: Customer plan to restore system contingency reserves within 30 minutes if thecustomer’s primary supply is disabled
Network Stability: Use of fast-response equipment to maintain a secure transmission system
System Blackstart: The capability to start generation and restore all or a major portion of thepower system to service without support from outside after a total system collapse
Five of these services (Regulation, Load Following, Frequency Responsive Spinning Reserve,Supplemental Reserve, and Backup Supply) deal with maintaining or restoring the real-energy balancebetween generators and loads. These services are characterized by their response time and responseduration, and by the communications and controls between the system operator and the resourceneeded to provide the service. Figure 10 shows the required response times for these five energy-balancing functions. Because regulation requires continuous (minute to minute) adjustment of real-powertransfers between the resource and the system, loads may not want to provide this service. LoadFollowing, however, could be provided directly or through the use of a spot market price response on atime frame less than an hour, consistent with FERC’s requirements that RTOs operate real-timebalancing markets. The contingency reserves are especially amenable to being provided by distributedresources, including load management programs.
EFFICIENT RELIABILITY PAGE 49
98041
0.1 1 10 100
TIME (MINUTES)
Regulation
Load Following
Frequency Responsive Spinning Reserve
Supplemental Reserve
Backup Supply
Contingency Operations
Normal Operations
Figure 10: Real-power ancillary services are differentiated by the required responsetime and duration.
Some important considerations
While the benefits of dispatchable load as a reliability service are conceptually straightforward, it willrequire careful thought to create market rules that will permit demand-side resources to compete fairly inancillary services markets. To begin with, system operators must articulate the requirements for reliabilityservices in technology-neutral language. That is, the required performance must be specified clearlyenough that separate commercial entities can agree on what will be provided, and at what price. Therequirements must specify performance rather than the methods to yield desired outputs. For example, asystem operator should request “100 MW of response that can be delivered within 10 minutes” ratherthan “100 MW of unloaded, on-line capacity from a large fuel-burning generator.”
In addition, system rules should respect the practical realities of distributed, demand-side resources, andnot require the types of communications and controls traditionally used to control central stationgenerators. Those who provide demand-side ancillary services should be permitted to demonstrate theavailability and performance of aggregated, distributed resources through reliable statistical means,without the necessity of hooking up each customer to real-time meters and direct links to system controlroom operators. It is not necessary to know exactly how each customer site is responding to system

EFFICIENT RELIABILITY PAGE 50
97. This is not to argue that demand-side resources should be held to lower standards than supply-side providersof ancillary services. For example, for a generator to supply contingency reserves, it must have capacity available torespond to the contingency; the generator cannot be operating at full load. Similarly, a load manager sellingcontingency reserves must have capacity it can make available when the contingency occurs-- in this case byensuring that there is active load in its portfolio that can actually be curtailed.
requests in order to rely on demand-side resources to help balance the system97. Indeed, in somerespects, distributed resources may be more reliable than traditional supply-side units.(See Box --
Reliability From Distributed Resources)
Conclusion - Ancillary Services:
If ancillary markets are established so that demand-side resources can participate actively, loadmanagement resources benefit because they receive revenue from the sale of valuable ancillary services. The power system also benefits in several ways. FERC ordered the unbundling of ancillary servicesfrom transmission to promote competitive markets, which should improve economic efficiency and lowerelectricity prices. These markets should be open to any technology capable of providing the service, notjust to traditional generators. This will expand supplies and reduce the horizontal market power ofgenerators. Finally, because ancillary services consume generating capacity, providing reserves throughdemand-side resources also improves overall resource utilization and reduces the excess fuel use andpollution associated with spinning reserves that are not serving load. When loads provide thesereserves, generating capacity is freed up to generate electricity.
Reliability from Distributed Resources
Whenever a system operator calls for the deployment of contingency reserves there is always somechance that the resource that is supposed to supply the reserve will fail to do so. The small size ofindividual distributed resources reduces the consequence of this problem and makes them a morereliable source of contingency reserves. Take, for example, the case of a system operatorpurchasing 100 MW of supplemental operating reserve from a 100 MW fast-start combustionturbine. This turbine might start within the required time on 90% of its attempts. In one case in tenthe system operator is 100 MW short. It does the system operator little good to reduce itsexpectations to 90 MW, though that is the average response.
A collection of 12,500 10-kW distributed resources that individually have only an 80% chance ofresponding each time makes a better aggregated resource. In this case 20% of the individuals fail torespond but the system operator still sees the full 100 MW response each time.
EFFICIENT RELIABILITY PAGE 51
98. This has been the practice in New England for many years. 99. For example, in the summers of 1999 and 2000 the New England and California ISO’s proposed collecting pool-wide uplift charges to bring in and operate emergency generators on barges anchored in the Connecticut River andSan Francisco Bay. Several pools have launched programs to acquire demand interruptions from customers who willagree to load controls directly from the ISO. 100. In 2000, the New England ISO accepted a recommendation to support the construction of severaltransmission upgrades throughout the region, as “Pool Transmission Facilities” because they would relievetransmission congestion in certain areas, and improve the resilience of the transmission system. In NE-ISO parlance,the cost of these upgrades will be “socialized” -- that is spread among all users of the regional transmission systemthrough a regional “uplift” charge. More than $120 million in capital costs will be raised, under a NE-ISO tariff, forthis purpose.
4. Efficient Reliability Standard:Demand-side resources should receive equal treatment with supply and transmissionoptions in RTO and power pool initiatives that use uplift and other “socialized”support mechanisms.
Resource adequacy and system reliability across electric networks are classic public goods, provided toall interconnected users on essentially the same basis. Efficiently constructed wholesale electricitymarkets, including adequate demand-side bidding systems, can moderate volatile markets and thus, thedegree to which reliability managers must intervene in the market to ensure reliable service. Nevertheless, reliability and power market managers often find it necessary to take administrative actionsto promote reliability. And typically, they seek to recover the costs of these administrative actions inbroad-based rates charged to all users of the grid. These administrative actions take many forms:
• Requiring the provision of specified ancillary services by market participants by rule; and/orpurchasing them on behalf of all market participants (and then imposing a tariff to pay for them);
• Socializing congestion costs, supported through uplift charges, so that customers in load pocketsdo not pay higher prices for power behind a constrained interface;98
• Entering the market directly through an RFP for the provision of reliability services, such as theemergency generators and dispatchable load contracts sought to be deployed in several powerpools in recent summers;99
• Identifying needed transmission links and supporting their construction through broad-basedtransmission tariffs or other forms of “uplift” assigned to users throughout the pool;100
• There are many other variations on this theme.
System operators have traditionally focused on supply-side resources in meeting reliability requirementsfor electric networks, especially in periods of stress. However, for many system needs, there is ademand-side corollary that could perform that same service at lower cost, provided that market ruleswere defined to include such resources, and broad-based funding were made available to support themon the same basis as the more traditional solutions.
EFFICIENT RELIABILITY PAGE 52
101. A standard of this sort has been under discussion in at least one of the nation’s ISOs. The Advisory Councilto the Board of the New England ISO addressed this issue, concluding that it should be the responsibility of theISO, as New England’s RTO, to analyze feasible alternatives to transmission investments for reliability, and topresent them as part of a regional reliability planning process. “The ISO should develop a regional plan fortransmission, with updates and modifications as market participants provide market-driven proposals to relievereliability and economic congestion conditions; this plan should identify high-value energy services and reliabilityneeds that should be addressed, and which could be remedied through either a transmission, generation, distributed-
(continued...)
Energy efficiency, load management, demand-side bidding, and distributed resources are all potentiallycost-effective means of meeting reliability needs identified by system operators and power poolmanagers.
So long as vertically-integrated utilities were basing their investment decisions on the principles of integrated resource planning, many reliability-enhancing decisions were governed by least-cost decision-making. With the breakup of the franchise, the demise of IRP, and the assumption of new responsibilitiesby RTO’s and other regional organizations, there are now numerous occasions where broadly-fundedinterventions may be taken without serious consideration of less expensive and more reliable alternativesbased on distributed resources and demand-side alternatives.
For this reason, reliability rules and investment decisions that will, by administrative action, impose costson consumers and other market participants, should first be tested by the following standard for theefficient provision of reliability:
The Efficient Reliability Standard
Before “socializing” the costs of a proposed reliability-enhancing investment through tariff,uplift, or other cost-sharing requirement, FERC, the state PUC, and the relevant RTOshould first require a finding:
(1) that the relevant market is fully open to demand-side as well as supply-sideresources;
(2) that the proposed investment or standard is the lowest cost, reasonably-availablemeans to correct a remaining market failure; and
(3) that benefits from the investment or standard will be widespread, and thusappropriate for support through broad-based funding.
If this standard were adopted as a screening tool by FERC and the nation’s RTO’S when consideringproposed reliability-enhancing rules and investments, it would provide a much-needed discipline insituations where expensive wires and turbines solutions are proposed to address reliability problems, andmore robust, less expensive, distributed solutions are overlooked.101

EFFICIENT RELIABILITY PAGE 53
101. (...continued)generation, or demand reduction approach.” In addition, the Advisory Council concluded that the ISO should analyze alternatives to transmission, and makethose analyses available in the public decision-making process on socialization proposals: “In situations where theISO-NE is called upon to analyze transmission proposals whose costs are proposed to be socialized (that is,recovered through a broad-based mechanism paid for by captive ratepayers, as opposed to proposals to recovermerchant transmission investments through market mechanisms), the ISO-NE should have a heightened duty tomake sure that its analyses consider the impacts of the proposal and a broad array of practical transmission and non-transmission alternatives to it. These analyses should be designed to analyze whether the proposed transmissionfacility is needed and least-cost.”(ISO-NE Advisory Committee, Comments to the ISO – New England BoardRegarding the Design of a Regional Transmission Organization for New England, October 11, 2000.)
Opportunities to adopt and apply this principle arise in numerous circumstances. At the legislative level,Congress and state legislatures have seen many proposals to amend underlying enabling legislationrelating to reliability. Statutory revisions in this arena should adhere to the principle that demand-side andsupply-side reliability options should be treated equally in considering how best to address reliabilityneeds. (See Box, Adding Balance to Reliability Legislation). FERC should also take the initiative on thispoint. Numerous state PUC’s have long understood that least-cost principles should govern utilitydecisions to make investment decisions that they plan to recover from ratepayers. Increasingly, thosedecisions are being made by RTO’s, ISO’s, Transcos and wholesale power pools, subject to FERCjurisdiction. FERC should require RTO’S to ensure that decisions to socialize reliability improvementshave been disciplined by a hard look at traditional, distributed, and demand-side alternatives.

EFFICIENT RELIABILITY PAGE 54
Adding Balance to Reliability Legislation
Reliability crises across the country have brought increased attention to reliability issues in Congress,along with numerous legislative proposals. The leading legislation in the last session of Congress was theso-called “NERC Consensus Reliability Bill,” which passed the Senate but died in the House. That billwould have given a new reliability organization, NAERO, extensive authority to promulgate rules tosecure the reliability of the nation’s bulk power system. The “bulk power system” was defined asincluding:
(1) high voltage transmission lines, substations, control centers, communications, data, andoperations planning facilities necessary for the operation of all or any part of theinterconnected transmission grid; and
(2) the output of generating units necessary to maintain the reliability of the transmission grid.
Even though reliability experts, including many at NERC, accept that demand-side options may be thebest and least expensive means to resolve particular reliability problems, there is no mention ofdistributed resources, energy efficiency, or load management whatsoever in this detailed legislativeproposal. This oversight should be corrected in any legislation Congress considers on reliability in thenext session. Congress should make clear that part of the mission of the nation’s regulators, wholesalepower markets and reliability organizations is to structure electricity markets to enhance demand-sideresponsiveness, and to support efficiency, load management, and distributed resources for theireconomic and reliability benefits. This expanded mission should be part of the mandate of NAERO,FERC, and the nation’s RTO’S, ISO’S and Transcos.
Such legislation should contain a provision equivalent to the Efficient Reliability Standard discussed inthe text, along with explicit recognition of the role of distributed resources in promoting the reliability ofthe bulk power system. For example, the definition of the bulk power system (quoted above) should beamended by adding: “and (iii) energy efficiency, distributed generation, and load management operationsnecessary to maintain the reliability of the transmission grid.” Similar language placing customer-sideresources on an even footing with generation and transmission resources would be appropriate inseveral other sections of the bill as well.
EFFICIENT RELIABILITY PAGE 55
B. Rates and Rules for Wires Companies
1. Transmission-Level Congestion Pricing:Locational pricing reveals the value of distributed resources across constrained interfaces
Transmission congestion refers to the situation in which it is not possible to complete all the proposedtransactions to move power from one location to another on the grid. Such commercial-transactionrestrictions can arise because of thermal, voltage, or stability limits on transmission elements. Congestionmay occur even when the actual flow on a line is well below the line’s capacity, whenever security-constrained dispatch requires modification of the economic dispatch. This situation occurs mostfrequently as the result of contingency analysis rather than because of steady-state line flows. Thegeneration dispatch is modified because a line will overload if a specific contingency occurs (e.g., agenerator or transmission line trips). Because there is often no time to take corrective action to preventcascading failures if such a contingency occurs, it is necessary to preemptively modify the generationdispatch. It is this off-economic dispatch that results in locational price differences.
Transmission Resource Constraints are Not Fully Recognized in Wholesale Prices
As wholesale markets have restructured, and as load has grown, transmission congestion has become anincreasing problem. The traditional vertically integrated utilities accounted for transmission constraintswhen they made their daily operating (unit-commitment) plans. Thus, they used their generatingresources in ways that would not overload the network. However, in today’s increasingly competitiveenvironment, suppliers schedule resources without a detailed knowledge of or interest in transmissionconstraints.
Transmission constraints impose significant costs on electric systems. However, in most places, thosecosts have not been reflected in either wholesale or retail prices. They have typically been collectedthrough a system uplift charge assessed on all buyers. This tradition must be changed in order to exposecost-effective solutions to congestion problems. The variability of wholesale costs caused by suchconstraints needs to first be recognized in wholesale prices. Financial congestion rights can assisttransmission planners and potential generators looking for promising locations for new generationsources. Location specific pricing of energy services in the face of such constraints may provide thenecessary incentives to LSE’s and final consumers to manage loads during periods when transmissionlines constrain access to the broader market.
In the long term, construction of new generators and transmission lines, or the addition of load reductionand load management programs, can reduce congestion. In the short term, system operators can treatcongestion in three possible way: they can mandate engineering solutions; they can socialize the costs ofcongestion; or they can use prices to let suppliers and consumers decide where to make investments andwhich transactions to forego.
EFFICIENT RELIABILITY PAGE 56
102. For example, locational prices can be set on a zonal basis (as in California) or on a nodal basis (as in PJM).New York and New England plan to use a mixed system, in which generators will face nodal prices and consumerswill face zonal prices.
The simplest (engineering) approach is to ignore congestion in setting energy prices (i.e., assume that allproposed transactions can be completed as if the amount of transmission capacity was infinite). Ifproposed transactions threaten to overload transmission lines, the security coordinator implementsNERC’s transmission loading relief (TLR) procedure. This procedure adopts an engineering approachto congestion relief. Transactions that contribute 5% or more to the congestion are cut. Many marketparticipants oppose TLR because they believe that the incumbent utilities manipulate the TLR calls andimplementation to favor their own transactions. In addition, FERC opposes the current TLR procedurebecause it is economically inefficient.
An alternative approach is to socialize congestion costs. With this approach, the system operator paysgenerators on either side of the constraint to increase output (constrained on) or decrease output(constrained off) to relieve the congestion. The system operator pays these generators for anyopportunity or out-of-pocket costs associated with this uneconomic dispatch. The costs so incurred arethen allocated to all transmission customers through an uplift charge. Although simple to implement, thisapproach is economically inefficient because it fails to send price signals to transmission users on the truecosts associated with their transactions. The absence of location-specific prices also robs investors ofimportant information on where to locate new generators or new demand management programs, andwhat transmission projects to build.
Finally, a more economically efficient way to deal with congestion is to use locational prices that providesignals to transmission users on the actual costs of transmission service. Because transmission constraintsvary with time, and vary from location to location, pricing systems that value access to differenttransmission paths at different times can be complex.102 The details of the method chosen in a region areless important than the basic policy conclusion: locational transmission pricing reveals the costs ofcongestion, and thus reveals the value of demand-side measures that manage load and providecongestion relief.
Locational Pricing reveals the cost of congestion and the value of congestion relief
The preceding discussion of transmission systems and costs touches on two important features relevantto the role of demand resources: (a) Congestion on the transmission network raises very importantreliability problems, not just for the load centers directly affected, but potentially for customers acrossthe entire affected network; and (b) Congestion on the transmission grid is not even across the network,and it varies with time. For these reasons, energy efficiency and load management resources may havegreat value when they reduce load in the particular locations and at the particular times that congestionproblems would otherwise arise..

EFFICIENT RELIABILITY PAGE 57
103. Particularly if the Efficient Reliability Standard (discussed above) is applied to proposals that would socializecongestion relief and mute the signals sent by locational pricing. Locational pricing and the Efficient ReliabilityStandard work together to advance the most reliable and lowest cost solutions to congestion problems. 104. PURPA Sections 111 to 117, codified at 16 USC Sections 2601 et seq. 105. An EPRI survey in 1990-91 reviewed more than 1,000 “innovative rates” of these types, offered by 135 majorutilities. EPRI, Survey of Innovative Rates, 1991 (Palo Alto, April 1992) (In three volumes). 106. As of June, 2000 about 98% of the national load is still provided by incumbent franchises. XENERGY
estimate, as reported in Restructuring Today, Monday, June 26, 3000 at 3.
The application of locational pricing is an important step in the development of competitive electricitymarkets. When congestion costs are assigned to the responsible load, a more accurate price signal isreceived within the load pocket. Thus, cost-effective means to reduce congestion will have theopportunity to compete to reduce the congestion and improve reliability.103 Generation, transmission,and load management options will all have the incentive and the opportunity to offer cheaper solutions tocustomers and load-serving entities within the load pocket. Because locational pricing sets anappropriate “avoided cost” benchmark, replacing a system in which congestion costs are not revealed tocustomers, efficiency and load management investments can compete on a fair basis with transmissionand generation options to provide reliability services in the load center.
2. Enhancing Reliability Through Retail Rate Design
At least since the passage of PURPA in 1978, utility managers and regulators have been aware of theimportant relationship between rate design and electric system reliability. Although it is little remarked ontoday, one of the important provisions of PURPA was a requirement that state utility commissionsexamine the rate designs then in common use, and consider adopting rates that would better reflect themarginal costs of service, and promote load management, energy efficiency, and conservation.104 Alarge number of rate design reforms were adopted across the nation, including: moving away fromdeclining block rates for large customers, and moving toward two-part (demand and energy) rates,seasonal rates, time-of-use rates, rate discounts for controlled load, and interruptible rates.105 Theseinitiatives were aimed at sending better price signals to customers for at least three reasons:
(a) to better reflect the marginal cost of consumption in rates faced by consumers; (b) to allocate more fairly the costs of the system among consumers; and (c) to improve reliability and lower overall system costs by removing inefficient subsidies and inspiring changes in demand patterns due to those more accurate price signals.
The nation’s recent focus on creating electricity markets has drawn attention away from the underlyingfact that rate design is still a critical function of regulation – almost all electricity is delivered onmonopoly wires systems under regulated delivery charges; and the vast majority of energysales are still made at regulated rates by regulated franchises or default service providers .106

EFFICIENT RELIABILITY PAGE 58
107. PURPA required each state regulatory body to examine its rate design practices within two years, and to re-examine them annually for a period of ten years. PURPA section 116(a). In view of today’s rapidly-changing marketsand technologies, and the nation’s widespread reliability and market power challenges, it would be sensible to take anew hard look at rate design options for load management, efficiency, and reliability purposes. 108. California is the leading example. End-use customers protected by rate caps received no price signal at allfrom rapidly changing, volatile wholesale markets. The resulting disconnection between wholesale markets and retailrates was a major contributor to California’s problems in 2000-2001: volatile wholesale markets, reliability threats, andgenerally elevated wholesale market prices.
Utility experience with cost-based and forward-looking rate design over the course of two decadesdemonstrated that the rate designs applied by wires companies and franchise service providers can have powerful effects on the reliability of electric systems. That hard-earned experience is now largelyoverlooked in the political debates surrounding restructuring. In part this is based on the misleadingassumption that market prices would directly deliver the efficient pricing signals for which rate designwas only a proxy. As it has worked out, this assumption is not even close to current reality. The realityis that over the past few years, fixed-price rate caps for utility service have become the predominantpricing option seen by customers both in traditional franchise states and in states moving to retailcompetition. This should lead regulators and reliability managers to the following conclusions.
Administrative and legislative rate designs for power prices and wires services should be re-examined for their effects on consumption, peak demand, and reliability, considering today’smarket conditions and power system technologies.107 In particular:
• Rate caps for power sales should be modified to add meaningful incentives to customers toimprove reliability through distributed generation and energy management operations; and
• Wires company rates should not be based on per-unit price caps, which promote throughputand impair reliability, but should ensure adequate support for the wires company throughperformance-based plans that reward efficiency in operations.
These two recommendations are addressed below.
a. Reforming Traditional Rate Caps and Default Service Rates
The theory advanced by market advocates in restructuring debates was deceptively simple: Competitivewholesale markets would reveal the true cost of electricity every hour of the year. Customers would seethese transparent prices and would efficiently increase or decrease their consumption in response tochanging prices. So much for the theory. In practice, hardly any customers have the metering needed totake advantage of real-time prices. Moreover, most states have adopted default service plans to protectcustomers from rate increases and rate volatility, which ensure that customers will not see variableprices as they occur in the wholesale market.108
The widespread adoption of low, fixed-price rate caps in default service plans has suppressed demand-side responses to wholesale market conditions in at least three ways.
EFFICIENT RELIABILITY PAGE 59
109. As of May 2000, the U.S. DOE’s Energy Information Administration reported that 25 states had passedrestructuring legislation and that two states, Michigan and New York, were proceeding under comprehensiveregulatory orders. Most states, however, are still in either the planning stages, pilot stages, or have only partiallyopened up their utility service territories. During 2001, in response to the California crisis, the pace of change inseveral states slowed down, leaving customers even more exposed to administratively set rates. 110. See Regulatory Assistance Project, “Setting Rates for Default Service: The Basics,” (January 1999). 111. Based on estimates by XENERGY as reported in Restructuring Today, Monday, June 26, 2000 at 3.
• First, the price cap blinds individual customers to what is really going on in the wholesalemarkets, and thus blunts any short-term demand responses that would moderate wholesale pricevolatility;
• Second, low default service rates poison the market for creative load management. By artificiallycreating a “safe harbor” for customers, the default service price cap inspires the vast majority ofcustomers to ignore potential choices in the market and to rely on the default service provider --usually the incumbent utility. It becomes virtually impossible for innovative LSE’S or loadaggregators to enter the market and profitably aggregate and manage customer load to thebenefit of the overall power market;
• Third, unless very carefully designed, default service price caps will override or undermine thebenefits of seasonal rates, time-of-use rates, credits for controlled loads, and other ratemechanisms previously used by utilities to manage load and account for the costs of peakloadpower. The system may end up with less load response under default service plans than it hadunder traditional regulation.
To reverse these effects, rate caps for power sales should be modified to add meaningful incentives tocustomers to improve reliability through distributed generation, energy efficiency, and load management.
The problem exists both in traditional regulation and in retail competition
This observation applies just as well in states that are definitely moving to retail competition, in those thatjust thinking about it, and in those where retail competition is not being considered at all. Retail choice isstill not available in most states.109 Of those states that have moved to retail choice, meaningful progresshas been slow and most have made provision for a transition service or “standard offer” that resemblesthe former bundled and averaged retail rate. In the 27 or more states that have moved to open theirmarkets, the standard offer is typically discounted through regulatory and accounting mechanisms in amanner that limits competition, at least in its early stages.110 Current estimates are that only 2% of thenational load has switched from the incumbent utilities.111 The opening of retail markets will encourage
EFFICIENT RELIABILITY PAGE 60
112. In California in 2000-2001, customer response to sharp price increases was initially weak. However, as the power crisis became more severe, and high prices continued, significant demand reductions began to occur. Politicalresponses, on the other hand, were powerful and clear from the beginning. Meaningful end user response will mostlikely emerge first from larger customer loads, especially those with flexibility provided through alternative fuels orself generation capabilities. Advances in metering, telephony, smart appliances and end-user applications may alsoplay a role over time. 113. This is by no means an exhaustive list. Many other innovations in rate design ought to be considered in theproceedings recommended above. Some of these innovations are relatively new, such as net metering; others havelong been used, but may need revival and adjustment in light of current technologies and changes in marketstructure. For example, regulators in Vermont are moving away from seasonal rates, which have had a very large andbeneficial effect on capacity factor and peak load exposure for the state’s utilities over two decades. The move isbased upon changes in the regional wholesale market, where winter power costs have moderated. But seasonal rateshave not been replaced by any new rate design to reflect the newly-volatile, high costs of consumption in thewholesale market at peak periods, both summer and winter.
price-responsive behavior on the demand side only if rate design permits wholesale market price signalsto reach retail consumers.112
It is not the opening of the markets that is central here, but rather the pricing and service options that arepresented to consumers, whether through traditional forms of electricity price regulation, through defaultservice plans, or through innovations that follow the opening and development of healthy retail markets.On the one hand, price innovation to support reliability can be encouraged within traditional regulation. And at the same time, the movement to retail competition will impair reliability unless customers receivemeaningful incentives to modify demand at peakload periods. Even where wholesale markets areregional, and regulated by FERC, this is a critical matter for state regulation. The rate designs andrequirements imposed at the state level will determine how those wholesale market prices are deliveredto retail customers.Solutions to consider
Consumer and low-income advocates rightly point out that price caps and default service plans areimportant mechanisms to protect small consumers from utility company mismanagement (undertraditional regulation) and from unpredictable and volatile wholesale markets (under retail competition).And it is hard to avoid the observation that most customers appear to prefer known, stable prices toflexible price plans, even where stable prices are somewhat more expensive. Thus, it is unlikely that thedream of market purists – changing wholesale market prices delivered directly to end-use customersevery hour of the day – will ever attract a large following among end-users. It is certainly unlikely toattract political support.
But there are several other options that could significantly improve customer price-responsiveness.Utilities and state regulators in any jurisdiction facing reliability concerns should quickly examine thefollowing:113

EFFICIENT RELIABILITY PAGE 61
114. Seasonal rates and time-of-use rates have long been a feature in many jurisdictions, but their usefulness incontrolling peak load has been eroded by inattention and the assumption that market prices would soon take over. 115. To the economist, differentiating prices according to geographic cost characteristics is no different thandoing so according to time of use. However, in light of the potentially very great differences in rates from area toarea, the administrative complexity of the rate structure, and universal service considerations, we are unlikely to seegeographically de-averaged rates any time soon.
• Time-differentiated default rates and price caps : Customers may prefer rate stability tofree-wheeling volatility, but they do not require a single rate for every hour of the year.114
Considering the enormous costs and reliability concerns associated with seasonal peaks, anyannual price caps adopted as part of a restructuring plan or utility rate freeze should includemeaningful differences between peak and off-peak consumption. On an average annual basis,“the default price” might well be the same, but reliability will be improved when consumers seethe cost of maintaining peak in the rates they pay during peak periods.
• Deaveraged buy-back rates: Despite the appearance that distribution costs do not varydirectly with usage, in fact they do – particularly when viewed in the longer run or when demandpresses up against the limits of capacity. At times of capacity constraint, the marginal costs ofdelivery rise very steeply – they are, in fact, the costs of new investment in wires, transformers,and substations. Moreover, as with transmission, the marginal costs of distribution can varysignificantly by time and location.
Where the marginal costs of distribution are high, the utility has a strong incentive to invest in lesscostly means of providing service: end-use efficiency, distributed generation, and loadmanagement, for instance. This is particularly true where, as in most areas, the retail rates fordistribution service are averaged, and marginal on-peak costs exceed marginal revenues. Insuch circumstances, utilities have a strong profit motive to reduce costs. Customers, in contrast,do not. They are not being given price signals that reflect the full marginal costs of service, atleast at times of peak, and consequently their incentives to invest in load reduction, loadmanagement, and other distributed resources are muted. And, if they are paying fixed fees fordistribution, the incentives are non-existent altogether.
One response is to de-average distribution prices, according to location, charging lowdistribution rates to customers on circuits with low marginal costs, and much higher rates tocustomers served by expensive and overloaded substations and feeders. This policy might beefficient, but does not satisfy widely-held notions of equity and universal service.115 Assumingthat the geographic de-averaging of wires company rates is not possible, alternative approachesfor promoting economically efficient outcomes must be developed. One such approach is thegeographically de-averaged “buy-back” credit. The utility would establish financial credits fordistributed resources, including efficiency and load management resources, installed in a givenarea. The credit amount would be a function of the distribution cost savings generated by thedistributed resources. It would be highest in areas of greatest need and would be as low as
EFFICIENT RELIABILITY PAGE 62
116. Variations of the de-averaged distribution credits could be a sliding scale standby rate or a hook-up“feebate.” For example, stand-by rates could be on a sliding scale ranging from high to negative. Negative stand-byrates, which look like distribution credits to customers, would be charged in high-cost areas. A hook-up feebatewould be a revenue-neutral charge that collects from customers installing distributed resources in low-cost zonesand pays to customers who install distributed resources in high-cost zones. 117. Demand-side resources are so much less costly that the winning bid prices would likely be far below 15¢. 118. See David Moskovitz, Profits and Progress Through Distributed Resources , NARUC, 2000 pp.16-18, 20-22, and Frederick Weston, Charging for Distribution Utility Services: Issues in Rate Design, NARUC 2000.
zero in low-cost areas, and could be set to share the system savings between the customer andthe distribution utility.116 For example, customers in an area with 20¢ distribution costs might beoffered a 15¢ credit.117 This would certainly produce a strong economic incentive for customersand others to invest in distributed resources.
b. Revenue Caps, Not Price Caps or Fixed Charges, for Wires Companies:
At first blush, the rate design for wires company services would not appear to raise significant reliabilityconcerns. But it does. In a price caps environment, the “lost profits” problem will continue to underminebroad-based energy efficiency improvements in end-uses throughout the grid. This will raise overallconsumption levels, erode reserve margins, and put increased stress on distribution and transmissionsystems. A system of high, fixed charges, as proposed by many utilities today, appears to address thisproblem, but it causes problems of its own. In this case, the wires company no longer has an incentive topromote high throughput. But, having paid a high fixed charge for access, the customer faces a muchlower rate for incremental consumption. Since incremental consumption drives peak, high peak loadprices, and reliability problems, high fixed customer charges can promote inefficient consumption anddegrade reliability.
The solution to both of these problems is a performance-based, per-customer revenuecap.118 It rewards a firm for increases in operating efficiency, while making it indifferent to thevolume of throughput over its wires. Since, in the short run, a distribution company’s costs varymore closely with the number of customers it serves than with throughput, a per-customerrevenue cap would produce annual revenues that more closely track annual costs. To the utility,a per-customer revenue cap looks just like a fixed-price rate structure, and it removes thecompany’s disincentive to support customer installations of efficiency and other distributedresources. However, the revenue cap enables prices for end-users to be set on a usage basis,enabling them to make consumption decisions and alternative energy investments that are, in thelonger term, more efficient. In addition, if the per-customer revenue cap is modified byperformance objectives, the resulting PBR plan can adjust rate levels automatically to encouragethe utility to pursue cost-effective distributed resource options, and lower the overall cost of the

EFFICIENT RELIABILITY PAGE 63
119. A rate plan with most of the attributes described here is now in effect for Pacificorp in Oregon, and (beforethe reliability and financial crises of 2001) was being considered by the major distribution companies in California. 120. As the Western reliability crises of early 2001 illustrate, fuel availability can be a major reliability problem.With adequate storage, as in California, fuel not burned in off-peak hours will be available when it is needed. 121. 1,000 MW of energy efficiency and 1,000 MW of large-scale generation are not equivalent. For example, inearly January, 2001, 30% of California’s generating capacity was unavailable because of heavy offshore waves,which threatened to block cooling intake pipes with kelp. On January 17-19, 11,000 MW of generation capacity wasout of service for maintenance following heavy service in the previous summer. On those days the state wasexperiencing Stage III alerts, and 500,000 customers experienced rolling blackouts. Meanwhile, the installed base ofefficiency resources was “on” and delivering significant benefits to the network.
distribution system. The resulting savings can be shared between the company and itscustomers.119
C. Promoting End-Use Efficiency
Decision-makers addressing the reliability problems of emerging wholesale power markets may find,because they are focusing on the problems of peak load, that they are drawn particularly to loadmanagement solutions. Demand-side bidding, price-responsive load, and “dispatchable load” ancillaryservices are very important resources to electricity systems and to reliability managers. Broad-basedenergy efficiency options may thus be overlooked, despite their economic and reliability benefits. Acentral conclusion of this report is that efficiency, load management, and price-responsive loadare complementary and essential components of reliable power systems and efficientelectricity markets.
1. Energy Efficiency’s Multiple Reliability Benefits
Broad-based energy efficiency measures provide multiple reliability benefits to electric systems, evenwhen they are not dispatchable at the discretion of operations managers. Energy efficiency measures:
• Reduce load, wear, and maintenance needs on the entire generation/transmission/distributionchain, even in hours when reliability problems were not anticipated by system managers;
• Reduce demand for generation fuels across both peak and non-peak hours, and thus improvefuel availability generally;120
• Reduce environmental emissions from generators, and thus conserve emissions credits to meetload at peak hours;
• Are modular, dispersed, and available in countless locations throughout electric grids, and thus,in a statistical sense are highly reliable in comparison with most generation resources;121
• Can reduce loading in strategic locations, and thus moderate transmission congestion and othersystem reliability problems whenever they might arise; and

EFFICIENT RELIABILITY PAGE 64
• Are automatically dispatched (by customers) coincident with the use of the underlying equipmentor load, and thus are always “on” without any delay, intervention by system operators, ornecessity to schedule or purchase the resource.
Economic benefits may be much larger in competitive wholesale markets
Utility DSM programs were always based on the knowledge that efficiency resources can often beacquired at relatively low cost, compared to the costs of generation, transmission, distribution, andreserves required to meet load growth. The benefits of cost-effective efficiency measures have beensubstantial. Significantly, in today’s electricity markets these benefits may be magnified many times.When deployed in markets subject to wholesale competition, efficiency measures may bring economicbenefits greatly out of proportion to their costs.
In most regional electricity markets, investments in energy efficiency (and load management) are not onlybeneficial to those consumers who use the technologies, they also lower the wholesale market pricespaid by all consumers. In competitive wholesale markets where all power plants receive the marketclearing price for each hour of operation (which is how all four spot markets associated with regionalISO’s now operate), the ability to reduce peak demand reduces the power costs paid to every unitrunning at the time of the peak. This market-wide cost reduction greatly exceeds the savings previouslyachieved by demand reduction in fully regulated wholesale markets, where the only cost savings fromreducing demand were those related to marginal unit(s) used to meet the peak. Suddenly, the value ofdemand reduction has jumped from the value of the avoidance of the marginal unit, to a system widemultiple of that number.
Massachusetts provides a clear example of this new value. The Massachusetts Department of EnergyResources concluded that the measures installed in their post-restructuring efficiency program loweredthe participants’ electricity costs by $20 million in 1999. The Department also concluded that, bylowering peak demand at high cost periods, the programs provided reliability and power cost savings toall customers, participants and non-participants alike. The benefit in just 13 hours on one high-cost dayexceeded $6 million. See Figure 11 below.

EFFICIENT RELIABILITY PAGE 65
122. Even those whose consumption remains unchanged (in traditional DSM programs, the “non-participants.”) 123. See Rich Ferguson, “The Public Value of Load Reduction in the California Market -- Preliminary Results”CEERT (July, 1999) (finding the public annual savings per MW of baseload reduction to be $650,000, or three timesthe direct power cost savings to conserving customers), and William Marcus and Greg Ruszovan, “Cost CurveAnalysis of the California Power Markets” Testimony in App. 99-03-014, CA PUC (September 2000).
Wholesale Energy Clearing Prices (ECP) on June 7, 1999
$0.00
$200.00
$400.00
$600.00
$800.00
$1,000.00
$1,200.00
1 2 3 4 5 6 7 8 9 10 11 12 13 14 15 16 17 18 19 20 21 22 23 24
Hour
$/M
W
ECP w/ EE
ECP w/out EE
Figure 11: Impact of demand reductions (EE) on wholesale energy clearing prices (ECP) in theNew England regional power pool on June 7, 1999
The savings resulting from energy efficiency are obviously very high at peak, but they are alsosurprisingly high when all other hours of the year are considered. Looking at the price curves in bothCalifornia and the PJM region over every hour in recent years yields the conclusion that the benefits ofenergy efficiency investments to customers in the pool generally122substantially exceed the privatebenefits of efficiency to those who install efficiency measures.123 For example, in the PJM market thevalue of load reduction was as high as $114 per MWh and averaged $67.67 per MWh (6.7 cents kwh)across all hours.. Enormous amounts of energy efficiency are available at far less than $67.67 per MWh.

EFFICIENT RELIABILITY PAGE 66
124. Ferguson, supra. 125. On the other hand, a utility that invests wisely in efficiency in its home territory may be able to reap thebenefits of off-system sales at high prices in wholesale markets, while saving on purchase power costs.
In a similar study done in California for the period June 1998 through May 1999, before the continuoushigh PX prices of 2000-2001, the savings per average kwh reduction across all hours was 7.51 cents.124
With a great untapped reservoir of demand reduction available at less than 4 cents per kwh, customersexposed to market prices will be paying a high and unnecessary price when efficiency programs are notpursued in their market regions.
2. Capturing Efficiency Resources: Mechanisms for Today’s Markets
As detailed above, broad-based programs to deploy efficiency resources can promote reliability andlower system operating costs. The challenge now is to create the mechanisms needed to deliver broad-based efficiency measures to electric networks. The most obvious opportunity would be to reinvigoratethe practice of utility Integrated Resource Planning, particularly in those franchises that are not likelyto face retail competition in the near-term -- which, for the next decade, may well be more than half ofthe nation. In those jurisdictions, legislators and regulators should seek to ensure, through careful review,that utilities are delivering cost-effective demand-side services to their customers. While logical, this maynot prove to be the most promising avenue. Many utilities in regions not yet open to competition areanticipating the possibility of retail competition in the future, and have been increasingly reluctant toinvest heavily in efficiency measures.125 Fortunately, regulators and legislators have other models toconsider.
Among the most promising options:
a. System Benefit Funds: Broad-based wires charges can support efficiency andload management measures that enhance system reliability and lower marketprices
In the absence of utility funding of efficiency programs in rates under integrated resource planning, it ispossible to support them through broad-based System Benefits Charges (SBCs) – wires chargesincluded in the electric bills of broad classes of customers. Because SBCs are non-bypassable, theyapply to all sales, and no competitive provider is disadvantaged by the collection mechanism. At least 19states, including California, Wisconsin, Ohio, New York, and Illinois have established statewide fundingmechanisms for efficiency programs, supervised by state agencies with a mandate to improve reliabilityand save energy cost-effectively. Details vary from state to state; revenues for these programs totaledabout $750 million per year in 2000 (about 25 percent of what the nation’s utilities spent on demand-side management in 1993). Independent funding of efficiency and load-management programs is neededin order to continue the contribution of those measures to system reliability. See Table 3, below.

EFFICIENT RELIABILITY PAGE 67
Table 3. Public Benefit Funds by State (mills/kWh)
Total Fund 3) Energy Efficiency Low Income Renewable Energy
State mills 4) State mills State mills State mills
New Jersey 3.76 New Jersey 3.15 New Hampshire 1.50 California 0.80
Connecticut 3.75+ Connecticut 3.00 Wisconsin 1.30 Connecticut 0.75
Massachusetts 3.70+ Massachusetts 3.00 Maine 0.80 Massachusetts 0.70
California 3.00+ Vermont 2.50 Ohio 0.70 Rhode Island 0.50
Wisconsin 2.90 Rhode Island 2.10 Pennsylvania 0.70 New Jersey 0.45
Rhode Island 2.60 Maine 1.50 Illinois 0.60 Oregon 0.30
Vermont 2.50+ Wisconsin 1.50 Maryland 0.60 New Mexico 0.24+
Maine 2.30 California 1.30+ Oregon 0.60 Wisconsin 0.10
Oregon 1.90 Oregon 1.00 California 0.50 Illinois 0.04
New Hampshire 1.50+ New York 0.60+ Montana 0.19+ Delaware 0.03
Montana 1.10 Maryland 0.23+ New Jersey 0.16 New York 0.03
Maryland 0.83+ Delaware 0.18 Delaware 0.10 Pennsylvania 0.02
Pennsylvania 0.82 Ohio 0.10 New York 0.10Maine
Dona-
tionsNew York 0.80+ Pennsylvania 0.10 Texas 0.07
Ohio 0.80 Illinois 0.03+ New Mexico 0.03+ Arizona TBD
Illinois 0.67+ Arizona TBDMassachusetts
Current
levels
Montana TBD
Delaware 0.31 New Hampshire TBD Nevada TBD
New Mexico 0.30 Nevada TBD Rhode Island In rates Vermont TBD
Texas 0.07+ Montana TBD Arizona TBD
Arizona TBD Texas TBD Connecticut TBD
Nevada TBD Nevada TBD
Vermont TBD
Source: Nadel, Kubo and Geller, 2000, State Scorecard on Utility Energy Efficiency Programs , American Council for an Energy-Efficient Economy, Washington, DC.
Notes: 1) Mills = tenth of a cent.
2) TBD = To be decided.
3) The total is the sum of efficiency, low-income, renewables AND other programs not specifically listed such as R&D.
4) A plus sign next to a value means that additional funding may be added due to administrative determinations ormunicipal utility programs.

EFFICIENT RELIABILITY PAGE 68
126. The concept was developed in the Board’s Order in Docket 5854 (December 30, 1996) at pp.107ff, and insubsequent orders in Docket 5980 (January 19, 1999, and September 30, 1999). The franchise was awarded aftercompetitive bidding in March 2000. 127. Vermont Energy Investment Corporation, Annual Report March 2001.
b. The Energy Efficiency Utility:
One important variant on the statewide public benefits fund is the Energy Efficiency Utility, which isawarded a franchise in order to deliver efficiency services to customers across a state or region. The firstsuch utility was chartered by the Vermont Public Service Board126, with a statewide franchise, supportedby a wires charge, averaging about 2.5 mills per kwh, in each franchise territory in which it deliversservices. It was designed to eliminate the conflict of interest that wires companies have with respect tomost efficiency services. It also minimizes the cost and complexity associated with regulatory scrutiny ofnumerous utility DSM programs.
The Vermont Efficiency Utility franchise was awarded through an open solicitation conducted by thePSB, and is subject to a performance-based incentive contract that encourages the utility to maximize itscost-effective performance. The Efficiency Utility (called Efficiency Vermont) is supported with fundsthat formerly went to power company DSM programs. As a private entity with an efficiency mission,subject to regulatory oversight and a performance contract, Efficiency Vermont is expected to be moreresponsive and more nimble than either the franchise utilities had been, or a state-run public energydepartment could be.
After its first year of operation, Efficiency Vermont reported that it had met or exceeded all of theperformance goals set out in its contract with state regulators, and had produced significant demand andenergy savings at a cost of “approximately 2.6 cents per kWh at a time when the comparable price ofwholesale electric supply is more than 5.2 cents per kWh.”127 In effect, Efficiency Vermont is building an“invisible power plant” to help meet Vermont’s electric power requirements.
c. System Benefit or Uplift Charges at the Regional Level:
Historically, utility energy efficiency programs were administered at the franchise level. More recently, asnoted in Table 3 above, states have recognized the value of statewide programs and funding sources.But there is no essential reason to draw the boundaries for efficiency programs at the state line. Powermarkets today are regional; transmission grids and system operations are regional; and reliability rulesand the costs of reliability programs are imposed across franchise and state boundaries. Moreover, themarkets and delivery channels for many end-use technologies (such as industrial motors, chillers, andhousehold appliances) are regional in nature. Finally, the economic, environmental, and reliabilitybenefits of improved electric efficiency flow to consumers across power pools and transmission grids,and do not stop at the state boundary. For all of these reasons, policy-makers should consider the merits

EFFICIENT RELIABILITY PAGE 69
128. Raab and Peters, “A Comparative Study of the Northwest Energy Efficiency Alliance and the NortheastEnergy Efficiency Partnership,” (NARUC 1998) at p.13. 129. The Northeast Energy Efficiency Partnership sponsors about $20 million per year in efficiency programs inthe region stretching from Maine to Maryland. It is funded principally by utility contributions, but receives somefederal and state agency support as well. Ibid. The youngest of these organizations is the Midwest EnergyEfficiency Alliance, also founded in recognition of the regional nature of electricity markets and efficiency benefits. 130. These points are discussed in the sections on demand-side bidding and the Efficient Reliability Standard,above.
of broad-based, regional funding for efficiency programs that will benefit regional power markets,regional reliability, and regional transmission systems.
The benefits of regional energy efficiency programs have been recognized by energy professionals anddecision-makers in a variety of contexts. The leading example has been the Northwest Power PlanningCouncil, which has sponsored very significant programs throughout the multi-state region served by theBonneville Power Administration. In recent years, multi-state programs in the BPA region have alsobeen developed and funded through the Northwest Energy Efficiency Alliance, a non-profit corporationgoverned by a board of utility, government, and other stakeholder representatives. As of 1999 it had anannual budget of $22 million per year.128 Regional efficiency organizations have also been established inthe Northeast and the Midwest.129
While the current regional efficiency partnerships offer promise, they are both voluntary and relativelysmall. What is lacking is a consistent funding mechanism to support delivery of demand-side resources inregional wholesale markets. Some modest load-management resources are now supported at the ISOlevel (see, e.g., the load-response programs sponsored by the New England, New York, and CaliforniaISOs in the summers of 2000 and 2001), but longer-term energy efficiency investments have been left toindividual utilities and to state system benefit funds.
This is a missed opportunity for two reasons. First, regional power managers -- RTOs, ISOs, Transcos,and reliability organizations -- are engaged in the process of securing generation, ancillary services,reserves, and transmission projects on a regional basis. Where efficiency investments would meet thosesystem needs at lower cost, the failure to invest in efficiency is driving up the cost of regional collectionmechanisms, and of reliable power for the region. Second, efficiency investments can provide benefits toconsumers across a region by lowering the price of power in regional power markets. Evidence fromexisting regional markets in California, PJM, and New England supports the conclusion that modestregional wires charges supporting regional efficiency programs could be highly cost-effective.130 Yet, inthe absence of a regional, non-bypassable collection mechanism, individual utilities and states willcontinue to benefit from their neighbors’ programs, whether or not they support equivalent programs oftheir own.
Wholesale markets could be designed to capture large consumer savings through broad-based markettransformation or energy efficiency programs without much difficulty. With so much money to be saved
EFFICIENT RELIABILITY PAGE 70
131. National Energy Policy, op. cit., at p.xi (quoting Vice-President Richard Cheney). 132. “Supply and Demand in the National Energy Policy,” PennFuture E-cubed (May 19, 2001) at p.3. 133. “Energy Star: The Power to Make a Difference in the Energy Crisis,” Environmental and Energy StudyInstitute briefing (Washington, DC March 20,2001).
and so many reliabilty benefits to be acheived these questions should be high priority issues for FERCand state regulators.
d. Complementary Policies for Efficiency: Codes, standards, tax credits, andfinancing plans accelerate the use of efficient end-use technologies
The principal focus of this report has been on measures that should be taken within the utility system tosupport greater reliability and lower costs through demand-side resources. It is not intended as anexhaustive review of the means to promote more efficient end-use technologies in the economy. Themost recent National Energy Policy states, “New technologies are proving that we can save energywithout sacrificing our standard of living. And we’re going to encourage it in every way possible.”131
Many complementary policies can, and should be, pursued to deliver those efficient technologies. Themost important tool at present is the use of advanced building codes and appliance efficiency standards.Air conditioning provides an excellent example of the potential. It is estimated that DOE’s recently-adopted standards for air conditioners will, over time, deliver more than 28,000 MW of savingsnationally. If those standards were raised to the level proposed by the previous administration, anadditional 13,000 MW of savings could be realized.132 Taken together, improved air conditionerefficiency standards can lower the nation’s load growth over the next two decades by 10% (41,000MW saved as compared with about 400,000 MW of load growth projected by EIA). Savings fromimprovements in the standards for building shells, climate control systems, lighting, and motors are alsopotentially quite large.
Voluntary installation of high-efficiency technologies is also an important public policy goal. The EPA’sEnergy Star program, for example, has accelerated sales of high-efficiency products, and led tonationwide peak load reductions of as much as 10,000 MW.133 Investments in Energy Star products andbuildings can be encouraged through many means not yet widely used: sales tax exemptions, tax credits,favorable tariffs by electric utilities, and low-cost financing plans. One promising financing technique nowunder development is called PAYS -- Pay As You Save. Under the PAYS plan, a customer’sinvestment in approved high-efficiency equipment is financed by a utility, an energy service provider, or apublic benefits fund. The investment is repaid through a charge on the customer’s utility bill, which givesthe customer an easy means of repayment, and gives the financing entity a low-risk repayment schedule.If widely implemented, financing programs like PAYS could improve system reliability by stimulatingdeployment of high-efficiency technology, particularly in the residential sector.

EFFICIENT RELIABILITY PAGE 71
VI. CONCLUSION
The unwelcome trio of problems facing power systems in the U.S. today -- price spikes, generatormarket power, and degraded reliability -- are essentially three faces of the same underlying problem, thetightening margin between supply and demand. When the margin between available capacity anddemand is thin, prices rise steeply and reliability is threatened. The principal response to thesecircumstances is often an assumption that additional generation and transmission facilities are theexclusive means of restoring balance to the grid. This assumption imposes unnecessary costs oncustomers, on the nation’s economy, and on the environment. Lightening the load on the electric grid canwiden the margin, lowering costs and enhancing reliability at the same time. This report concludes thatenergy efficiency, load management, and price-responsive load programs can meet up to half of thenation’s expected electric load growth over the next twenty years.
Finding a better balance between supply-side and demand-side investments for reliable grid management requires three basic public policy commitments: • First, decision-makers should acknowledge that the reservoir of demand-side opportunities is a
large and useful resource for grid management -- one that should be tapped when it is feasible andcost-effective to do so.
• Second, public policies should aim to capture the full range of demand-side resources available tothe grid. Peak-load management and price-responsive load programs are valuable resources, butthese short-term responses do not exhaust the cost-effective demand-side potential. There is acontinuing need to promote investments in longer-term demand reduction through efficient end-usetechnologies. Programs that promote deployment of efficient end-use technology should not besacrificed in favor of peak management programs. Long term energy efficiency and short term loadresponse are complementary resources, and both are needed.
• Third, there is no single “silver bullet” to ensure adequate development of demand-side options intoday’s power systems. There are many barriers to demand-side resources, while a variety ofsubsidies and traditions favor supply and power delivery options. Opportunities for improvementexist in many areas, from the tariffs and market rules governing operation of power pools andtransmission systems, to the rate designs of local distribution companies. Decision-makers shouldaim to develop a broad array of balancing solutions. Fortunately, there are many valuable ideasand models to draw upon. Many, but by no means all, of them are discussed in this report.
Heat waves are natural events, but blackouts and price spikes are the result of governmental and privatechoices. Heat waves are as predictable as snowstorms and hurricanes. When outages and price spikesfollow, they are not “caused” by the heat wave, they are the consequence of our policy decisions. AfterHurricane Andrew, Floridians learned that low-cost investments in roofing tie-downs would have kept alot of roofs intact in high winds. In a similar manner, energy efficiency investments can be viewed as alow-cost means of “risk-proofing” the electric system, keeping the electric grid intact during heat waves,demand spikes, and other reliability challenges. The means of providing this added measure of reliabilityare well within the grasp of utilities, governments, system operators and customers.

EFFICIENT RELIABILITY PAGE 72

EFFICIENT RELIABILITY PAGE 73
APPENDIX
Resolution Supporting Energy Efficiency and Load ManagementAs Cost-Effective Approaches to Reliability Concerns
WHEREAS, Both utility-sponsored and market-based energy efficiency programs have a demonstratedrecord of lowering demand for electricity -- according to the U.S. Energy Information Administration, in1997, cost-effective utility DSM programs provided over 25,000 megawatts of peak load reduction andsaved more than 56 million megawatt-hours annually; and
WHEREAS, Despite energy efficiency's proven track record, utility spending on energy efficiency programshas been dramatically curtailed, falling from $2.7 billion dollars in 1993 to only $1.6 billion in 1997,according to the U.S. Energy Information Administration; and
WHEREAS, Several areas of the country have recently experienced electric distribution and supplyreliability problems and major price volatility, for example:
• Utilities from Maine to Virginia cut the voltage they supplied to customers by 5 percent on at least oneoccasion during a five-week period in early summer, 1999, because their three regional power poolswere approaching or exceeding their prior peak load;
• New England experienced its first power warning ever in June 1999, and experienced two more powerwarnings in the following five weeks;
• Delmarva experienced rolling blackouts that affected 400,000 customers in early July 1999;• Utilities throughout the midwest lowered the voltage they supplied to customers in June of 1998 because
of severe capacity constraints; and• Denver experienced rolling blackouts on July 17, 1998, when demand exceeded electricity supply.
WHEREAS, During these distribution and capacity constraints, the spot market cost of power repeatedlyrose to the range of $1,000/MWhr for one or more hours in the day; and
WHEREAS, According to the North American Electric Reliability Council, generating capacity additionsare not keeping pace with demand growth - 24,400 MW of generation additions are planned by 2002, butdemand is projected to increase by approximately 36,000 MW; and
WHEREAS, the North American Electric Reliability Council also reports that transmission systems areincreasingly challenged to accommodate the demands of evolving competitive electricity markets, and
WHEREAS, According to a study performed by Applied Energy Group, Inc., nine of ten regional reliabilitycouncils in the United States will have a shortage of generating capacity by 2007; and
WHEREAS, Energy efficiency and load management programs are proven, cost-effective means ofmanaging load and enhancing reliability by matching electricity demand with the system's generation,

EFFICIENT RELIABILITY PAGE 74
transmission, and distribution capacity constraints, and such programs help to avoid the need to rely uponexcessively costly supply resources and strained transmission and distribution facilities; and
WHEREAS, For the last 15 years, NARUC has encouraged investment in cost-effective energy efficiencyprograms; now therefore be it
RESOLVED, That the Board of Directors of the National Association of Regulatory Utility Commissioners(NARUC), convened in its 1999 Summer Meeting in San Francisco, California, reaffirms NARUC'scommitment to, and support for, cost-effective demand-side management measures, including both energyefficiency and load management measures, as a critical component of strategies to address electric systemreliability concerns; and be it further
RESOLVED, That NARUC urges State public utility commissions to encourage and support programsfor cost-effective energy efficiency and load management investments as both a short-term and long-termstrategy for enhancing the reliability of the nation's electric system, and reducing its costs; and be it further
RESOLVED, That NARUC urges power pools and independent system operators to encourage andsupport market mechanisms that facilitate cost-effective energy efficiency investments, distributionenhancements, and load management by suppliers, marketers, and end-use customers; and be it further
RESOLVED, That NARUC urges Congress, as it considers legislation to restructure the nation's electricindustry, to include in such legislation workable mechanisms to support cost-effective State, utility, andmarket participant energy efficiency programs in order to enhance the reliability of the nation's electricsystem.______________________________________Sponsored by the Committees on Energy Resources and Environment and ElectricityAdopted by the NARUC Board of Directors July 23, 1999