the cruise market and uk perspective by william gibbons director passenger shipping association...
TRANSCRIPT

The Cruise Market The Cruise Market and UK Perspectiveand UK PerspectiveThe Cruise Market The Cruise Market
and UK Perspectiveand UK PerspectiveByBy
William GibbonsWilliam Gibbons
DirectorDirector
Passenger Shipping AssociationPassenger Shipping Association
Marketing Director Marketing Director
European Cruise CouncilEuropean Cruise Council
ByBy
William GibbonsWilliam Gibbons
DirectorDirector
Passenger Shipping AssociationPassenger Shipping Association
Marketing Director Marketing Director
European Cruise CouncilEuropean Cruise Council
Cruise Market UpdateCruise Market Update
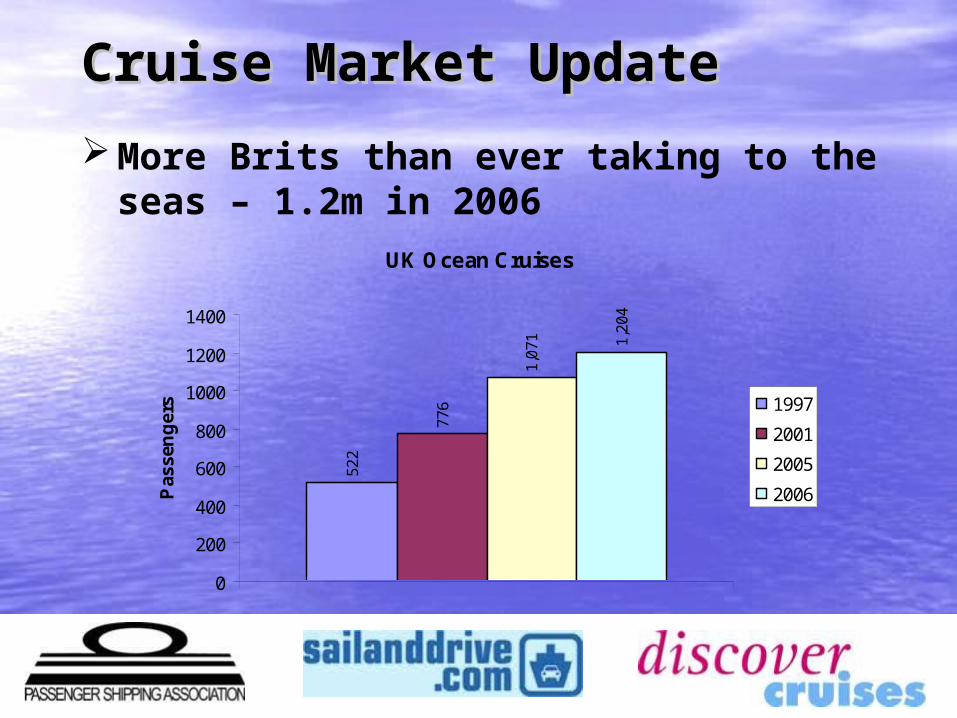
More Brits than ever taking to the seas – 1.2m in 2006
UK Ocean Cruises
522
776
1,07
1 1,20
4
0
200
400
600
800
1000
1200
1400
Pas
sen
ger
s 1997
2001
2005
2006

EX-UK Growth EX-UK Growth
Cruises taken from UK ports up 12% - 450,000
Trend set to continue with increased ex-UK capacity on its way in 2007.2007 – 500,0002008 – 700,000
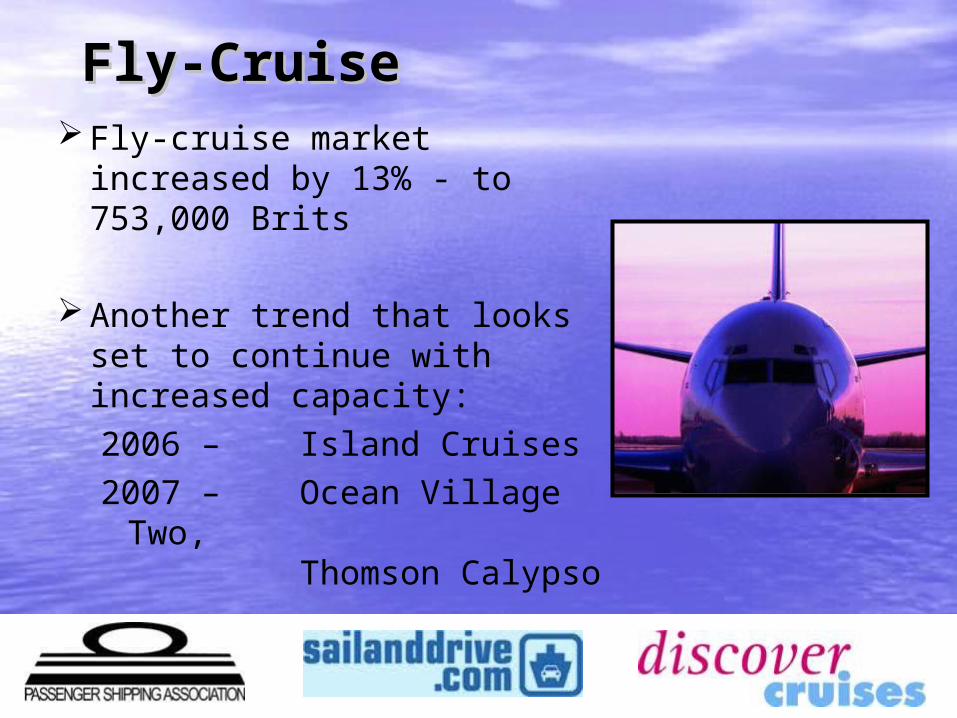
Fly-CruiseFly-Cruise Fly-cruise market increased
by 13% - to 753,000 Brits
Another trend that looks set to continue with increased capacity:2006 – Island Cruises2007 – Ocean Village
Two, Thomson Calypso
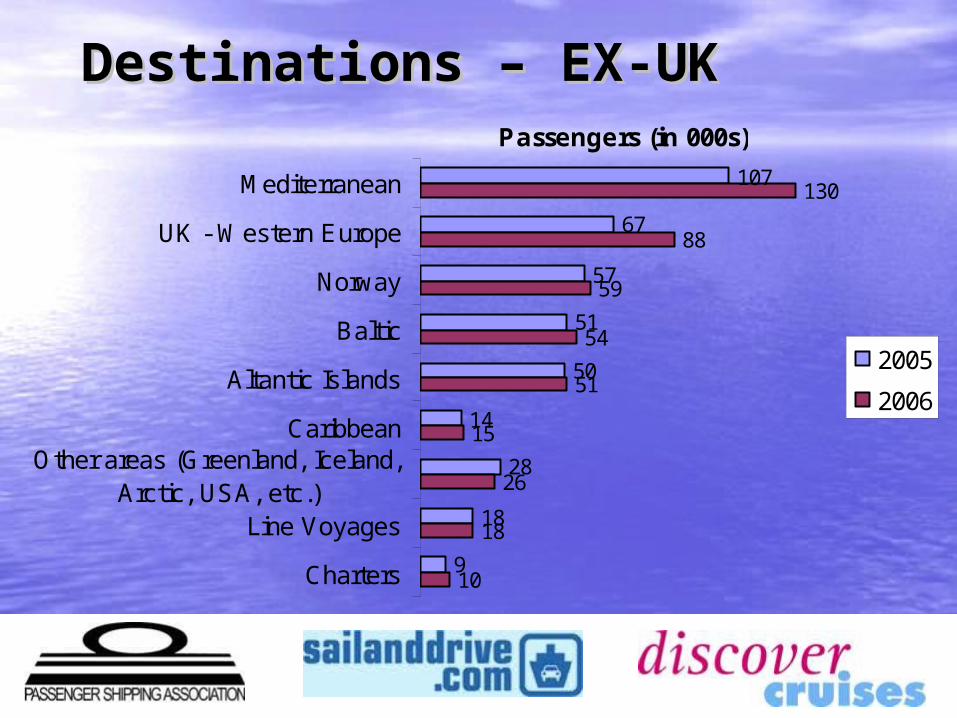
Destinations – EX-UKDestinations – EX-UK
107
67
57
51
50
14
28
18
9
130
88
59
54
51
15
26
18
10
Mediterranean
UK - Western Europe
Norway
Baltic
Altantic Islands
CaribbeanOther areas (Greenland, Iceland,
Arctic, USA, etc.)Line Voyages
Charters
Passengers (in 000s)
2005
2006

Destinations – Fly-Cruise Destinations – Fly-Cruise
263
202
18
46
34
26
18
60
322
195
40
35
35
29
25
72
Mediterranean
Caribbean, inc Bermuda
Indian Ocean, Red Sea, P Gulf
Atlantic Islands
West Coast, Mexico, Hawaii, P Canal
Alaska
Transatlantic - repositioning
Other areas
Passengers (in 000s)
2005
2006

BALTICBALTICEach Passenger visit at a European Port Embarkation and visiting - Expenditure €100.
Average Revenue Per Passenger - £1,447.
Average Revenue Per Diem - £122.
Norway – (£156.)
Average length of Cruise from UK 12days

Growth of UK PortsGrowth of UK PortsPassengers embarking in the UK grew
15% to 576,000- Non-UK residents accounted for
127,000, a growth of 27%
Ports of call passengers to UK ports grew 22% - to 392,000
Total value of cruise passenger expenditure in the UK – over £197m

Contribution of cruiseContribution of cruise
tourism to the tourism to the economieseconomies
of Europeof Europe

GP Wild/ BREA – Undertook StudyGP Wild/ BREA – Undertook Study
Over 3.1m European residents booked cruises – Over 3.1m European residents booked cruises – 23% of cruise tourists (passengers) worldwide23% of cruise tourists (passengers) worldwide
Over 2.8m cruise tourist embarked in Europe – Over 2.8m cruise tourist embarked in Europe – 90% were European nationals90% were European nationals
Majority visited Mediterranean, Baltic and other Majority visited Mediterranean, Baltic and other European regions generating 13.1m visits in European regions generating 13.1m visits in EuropeEurope
Major Highlights in 2005Major Highlights in 2005

As a result of European cruise operations As a result of European cruise operations and investment in new cruise ships, key and investment in new cruise ships, key economic impacts (direct, indirect, induced) economic impacts (direct, indirect, induced) throughout Europe in 2005 include:throughout Europe in 2005 include:
€€8.3 billion in direct spending by lines 8.3 billion in direct spending by lines and passengersand passengers
€€19.1 billion in total output19.1 billion in total output Over 187,000 jobsOver 187,000 jobs €€6.0 billion employee remuneration6.0 billion employee remuneration
Major Highlights in 2005Major Highlights in 2005

Country Impacts - 2005Country Impacts - 2005
CountryCountry Spending Spending €m€m
Total JobsTotal Jobs Compensation Compensation €m€m
ItalyItaly 2,5012,501 61,44561,445 1,8101,810
UKUK 1,6861,686 37,31937,319 1,4571,457
GermanGermanyy
1,0731,073 19,96919,969 725725
SpainSpain 683683 13,94013,940 422422
FinlandFinland 621621 10,20510,205 371371
FranceFrance 536536 7,2657,265 310310
Top sixTop six 7,1007,100 150,143150,143 5,0955,095
TotalTotal 8,3268,326 187,252187,252 6,0176,017
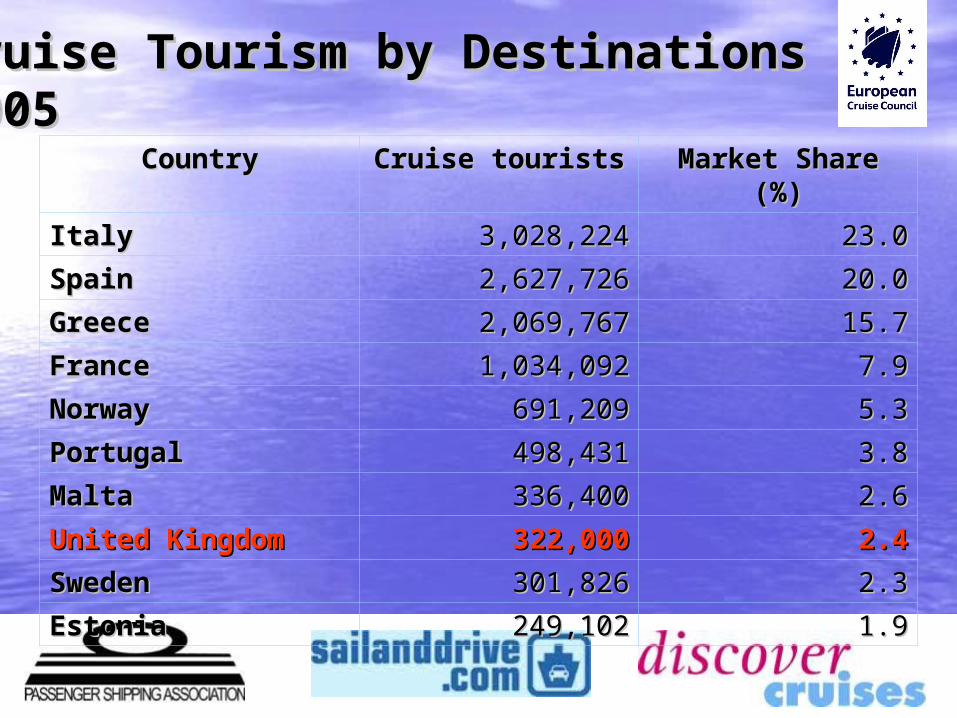
Cruise Tourism by Destinations Cruise Tourism by Destinations 20052005
CountryCountry Cruise touristsCruise tourists Market Share Market Share (%)(%)
ItalyItaly 3,028,2243,028,224 23.023.0
SpainSpain 2,627,7262,627,726 20.020.0
GreeceGreece 2,069,7672,069,767 15.715.7
FranceFrance 1,034,0921,034,092 7.97.9
NorwayNorway 691,209691,209 5.35.3
PortugalPortugal 498,431498,431 3.83.8
MaltaMalta 336,400336,400 2.62.6
United KingdomUnited Kingdom 322,000322,000 2.42.4
SwedenSweden 301,826301,826 2.32.3
EstoniaEstonia 249,102249,102 1.91.9

Western Europe as a Source Western Europe as a Source Market 2003-06Market 2003-06
Country 2003Group Total
(1,000’s Pax)
2004Group Total
(1,000’s Pax)
2005Group Total
(1,000’s Pax)
2006Group Total
(1,000’s Pax)
2005/06% Change
UK 964 1,029 1,071 1,214 13
Germany
537 583 639 700 10
Italy 346 400 514 559 9
Spain 307 300 379 378 0
France 212 222 233 265 14
Other 305 300 291 339 16
Total 2,671 2,835 3,126 3,455 11

Attitudes to CruisingAttitudes to Cruising
Research into people and their attitudes to cruising
Who would consider a cruise – and if not, why not?
What are the barriers to taking a cruise?
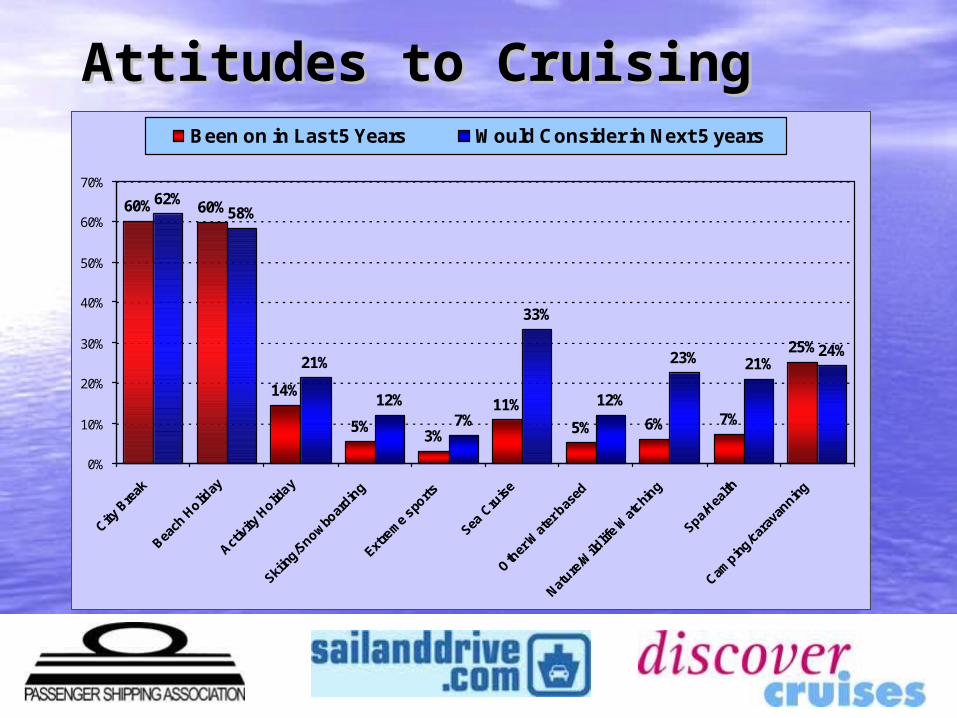
Attitudes to CruisingAttitudes to Cruising
60% 60%
14%
5%11%
5% 6% 7%
25%
62%58%
21%
12%7%
33%
12%
23% 21%24%
3%
0%
10%
20%
30%
40%
50%
60%
70%
City B
reak
Beach
Holid
ay
Activ
ity H
oliday
Skiin
g/Snow
boar
ding
Extre
me
sports
Sea C
ruis
e
Oth
er W
ater
bas
ed
Nature
/Wild
life
Wat
ching
Spa/Hea
lth
Campin
g/car
avan
ning
Been on in Last 5 Years Would Consider in Next 5 years
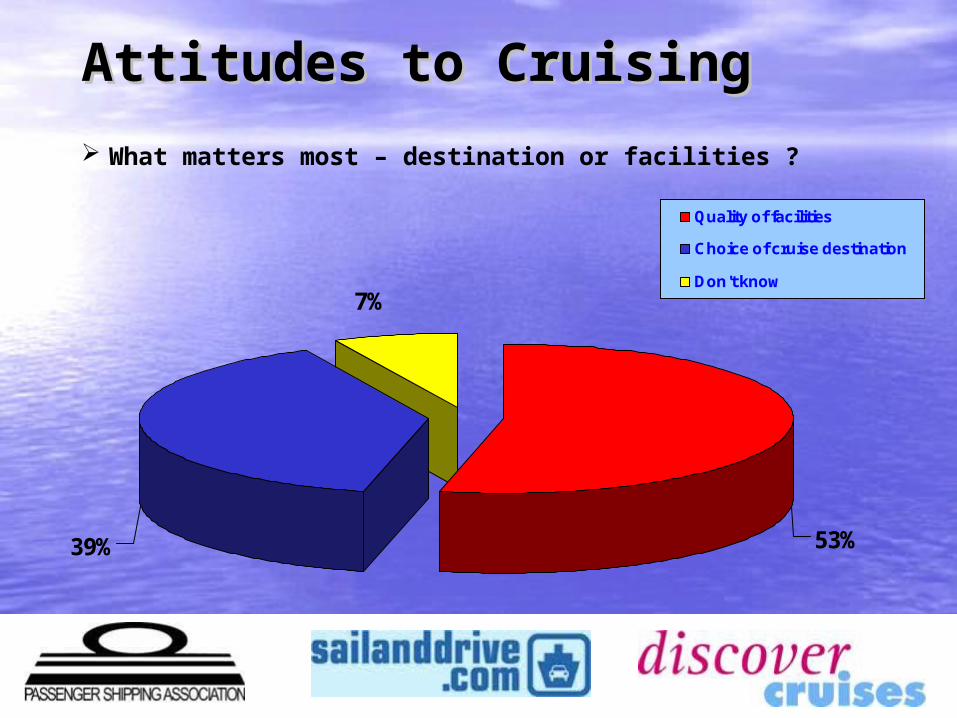
Attitudes to CruisingAttitudes to Cruising
What matters most – destination or facilities ?
7%
53%39%
Quality of facilities
Choice of cruise destination
Don't know
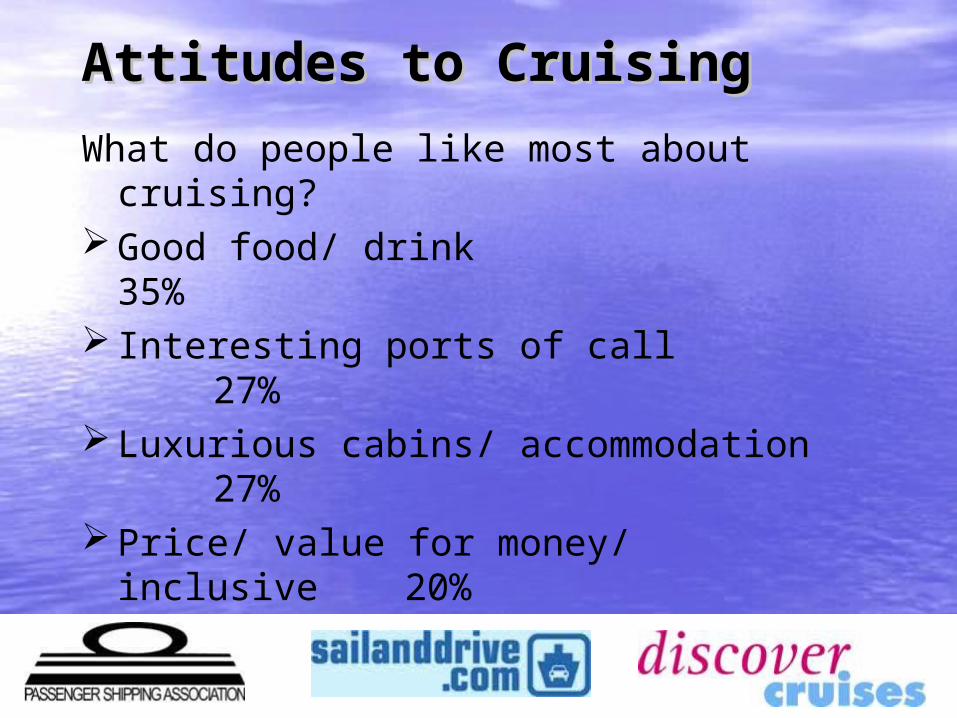
Attitudes to CruisingAttitudes to Cruising
What do people like most about cruising?
Good food/ drink35%
Interesting ports of call27%
Luxurious cabins/ accommodation27%
Price/ value for money/ inclusive20%

Attitudes to CruisingAttitudes to Cruising
What are the barriers to cruising?
Sea sickness/ bad weather 32%Being cooped up/claustrophobic
31%Not liking other passengers 25%
These barriers drop considerably once a person has actually taken a cruise


LUXURY LUXURY CRUISINGCRUISING
The Exclusive Collection – an alliance of nine ships
of excellence
Nearly 20,000 passengers are carried by the ultra
luxury lines – 1.6% of the UK market
Luxury passenger numbers have doubled
since 2002

SPECIALIST SPECIALIST CRUISINGCRUISING
Specialist Cruise Collection – an alliance of
11 cruise lines
Unique itineraries to destinations best
experienced by sea
A 27% growth in 2006

2008 ONWARDS2008 ONWARDS Boom in EX-UK Cruising
Cunard – Victoria
P&O – Ventura
Royal Caribbean Cruise Line – Liberty of the Seas
Fred Olsen – Balmoral
NCL – Jade
MSC – Armonia
(Including 5 Baltic Capital Cruises)
Carnival Cruise Line – Carnival Splendour (5 Cruises)

AND THE FUTURE…AND THE FUTURE…
1.3 million ocean cruise passengers in 2007
1.5 million ocean cruise passengers by 2008
Sheer diversity of cruising outperforming land based holidays – ranging from ships carrying up to 4,400 passengers to 49 passengers
39 brands represented by the PSA in the UK – more than any other country
There really is something for everyone!