the crystal structure of the system cadmium-mercury
TRANSCRIPT
Feb., 102s CADMIUM-MERCURY SYSTEM CRYSTAL STRCCTURE 3s 1
ruthenium was reduced to the bivalent state (see Table I11 and Fig. 1). It may therefore be concluded that the dark blue compounds which form after a small excess of titanous sulfate has been added are compounds of bivalent ruthenium, not of univalent ruthenium as supposed by these authors and by Remy and Wagner.
A bromide salt of ruthenium was prepared by digesting the chloride with bromine and hydrobromic acid and evaporating the solution with potas- sium bromide. An analysis of this salt showed that it conforms to the formula KzRuBrs(HzO) or K2RuBr50H. Titrations of hydrochloric acid solutions of this salt with thiosulfate after treating i t with potassium iodide, and with titanous sulfate by the electrometric method, showed that the ruthenium in the salt was in the quadrivalent state (see Tables IV and V). These results indicate 'that the true formula of the salt is K2RuBr50H, thus confirming the recent views of Howe.
PASADENA, CALIFORNIA
[CONTRIBUTION FROM THE METALLURGICAL LABORATORIES OF HARVARD UNIVERSITY ]
THE CRYSTAL STRUCTURE OF THE SYSTEM CADMIUM- MERCURY
BY ROBERT FRANKLIN MEHL' RECEIVED NOVEMBER 14, 1927 PUBLISHED FEBRUARY 4, 1928
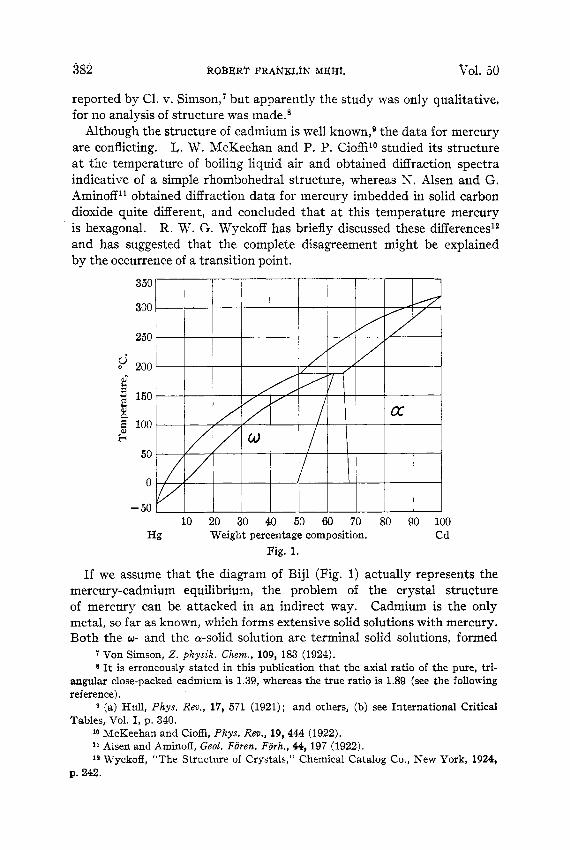
The system cadmium-mercury is interesting for a number of reasons. Its composition-temperature diagram (Fig. 1) is the only known example of Roozeboom's Type IV.2 Various compositions among the mercury- rich alloys have been used in the construction of standard cells. Nu- merous measurements on electrode potential, and on vapor pressure, of the liquid and partly liquid alloys have led a number of investigators to postulate the existence of intermetallic compound^.^ These, however, do not appear on the constitution diagram proposed by Bij14 (Fig. 1) and repeatedly ~onfirmed.~ Recently T. W. Richards and C. E. Teeter, Jr.,6 measured the heats of dilution of these alloys in mercury a t room temperature and found no critical points suggestive of a compound.
A few measurements of the crystal structure of the system have been 1 National Research Fellow. 2 Roozeboom, 2. physik. Chem., 30, 385 (1899). a (a) Hildebrand, Foster and Beebe, THIS JOURNAL, 42, 545 (1920); (b) Richards
and Forbes, Carnegie Institution Publication, No. 56 (1906); (c) 2. physik. Chem., 58, 738 (1906); (d) Hildebrand, Trans. Am. Electrochem. SOL, 22, 319, 335 (1913).
4Bijl, 2. physik. Chem., 41, 641 (1902). 6 (a) Puschin, 2. anorg. Chem., 36, 201 (1903); (b) Janecke, 2. physik. Chem.,
60, 409 (1907); (c) Schulze, ibid., 105, 177 (1923); (d) Tammann and Mansuri, 2. anorg. Chem., 132, 69 (1923).
6 Unpublished research.
382 ROBERT FRANKLIN MGHL Vol. 50
reported by C1. v. S i m ~ o n , ~ but apparently the study was only qualitative, for no analysis of structure was made.8
Although the structure of cadmium is well known,8 the data for mercury are conflicting. I,. W. McKeehan and P. P. Cioffi’O studied its structure a t the temperature of boiling liquid air and obtained diffraction spectra indicative of a simple rhombohedral structure, whereas N. Alsen and G. Aminoff l1 obtained diffraction data for mercury imbedded in solid carbon dioxide quite different, and concluded that a t this temperature mercury is hexagonal. R. W. G. Wyckoff has briefly discussed these differences12 and has suggested that the complete disagreement might be explained by the occurrence of a transition point.
350
300
250
,u; 200 e; * 150 2 g 8 100 H
50
0
- 5 O r I 10 20 30 40 50 60 70 80 90 100
Hg Weight percentage composition. Cd Fig. 1.
If we assume that the diagram of Bijl (Fig. 1) actually represents the mercury-cadmium equilibrium, the problem of the crystal structure of mercury can be attacked in an indirect way. Cadmium is the only metal, so far as known, which forms extensive solid solutions with mercury. Both the o- and the a-solid solution are terminal solid solutions, formed
7 Von Simson, Z. physik. Chem., 109, 183 (1924). 8 It is erroneously stated in this publication that the axial ratio of the pure, tri-
angular close-packed cadmium is 1.39, whereas the true ratio is 1.89 (see the following reference).
9 (a) Hull, Phys. Reo., 17, 571 (1921); and others, (b) see International Critical Tables, Vol. I, p. 340.
10 McKeehan and Cioffi, Phys. Rev., 19,444 (1922). 11 Alsen and Aminoff, Geol. Foren. Forh., 44, 197 (1922). 12 Wyckoff, “The Structure of Crystals,” Chemical Catalog Co., New York, 1924,
p. 242.
Feb., 1928 CADMIUM-MERCURY SYSTEM CRYSTAL STRUCTURE: 383
presumably by simple substitution and exhibiting the space lattice of the solvent metal alone, possibly somewhat altered in dimension.lS A de- termination of the structure of the w-solid solution should, therefore, give the lattice type for mercury.
In order, therefore, to present additional evidence on the constitution of the cadmium-mercury system with especial reference to intermetallic compounds, and indirectly to determine the crystal structure of mercury (with the assumption of the validity of the constitution diagram proposed by Bill,) the present study was undertaken.
Materials and Method The alloys were made up determinately and not analyzed.I4 The
cadmium bore a manufacturer’s analysis of 99.961% cadmium, 0.015% zinc, 0.023% lead and 0.001% iron. The mercury was “Redistilled Mercury,” which was passed through a nitric acid tower a dozen times and twice distilled in partial vacuum with a stream of dry air. The alloys were melted in Pyrex tubes under paraffin and quenched from the liquid state, the w-solid solutions in liquid air and the a-solid solutions in ice water. No loss of mercury or cadmium was observed during the preparation and the synthetic compositions given in Table I are, therefore, to be taken as representative of the final compositions.
It became apparent soon after the beginning of the work that drastic deformation followed by prolonged annealing was necessary, especially for the w-solid solution, to develop a structure crystalline enough to give sufficient diffraction lines for an analysis of structure. Each alloy bar (0.75cm. square) was therefore hammered on an anvil into a nail shaped piece, 0.30 cm. in diameter a t the top, tapering to a point a t the bottom. These pieces were annealed in a high temperature thermostat15 and were subsequently treated as noted in Table I.
The powder method of analysis was used, with the “X-Ray Diffraction Apparatus” supplied by the General Electric Company. Early attempts to obtain spectra from wires were unsuccessful because of the high opacity of the alloys. Later experiments on alloy foil were abandoned when i t was found an easy matter to obtain filings of the alloys sufficiently fine to pass a 200-mesh sieve. The powdered alloy mixed with finely ground
18 This is generally true of terminal solid solutions, with the exception of iron- carbon and manganese-carbon; see G. L. Clark, “Applied X-Rays,” McGraw-Hill Book Company, New York, 1927, p. 204.
l4 Most of the alloys were stock alloys from another investigation (T. W. Richards and C. E. Teeter, Jr., unpublished research). The author wishes to thank Dr. C. E. Teeter, Jr., for his kindness in making them available for this work.
16 Similar to that designed by J. H. Haughton and D. Hanson, J . Inst. Metals, No, 2, 18, 173K(1917), except that the low temperature bulb was eliminated entirely. A constancy in:temperature of 2 or 3 degrees up to 650 degrees was attainable.

384 ROBERT FRANKLIN MEHL Vol. 50
TABLE I TREATMENT OF ALLOYS
A = annealed; CD = cold drawn into wire; H = hammered; FSM = filed, sieved and mixed with flour.
Composition (weight
'% cadmium) Treatment
23.0 27.3 33.8 40.0 47.1 50.0 60.1 73.0 80.0 90.0
H; A 48 hrs. 60"; FSM; A 72 hrs. 60-70" H; A 36 hrs. 70"; CD; FSM; A 72 hrs. 70' H; FSM; A 96 hrs. 100-104" H; A 48 hrs. 120"; CD; A 72 hrs. 120"; FSM; A 72 hrs. 120" H; A 72 hrs. 140"; CD; FSM; A 12 hrs. 140" H; A 48 hrs. 150"; CD; FSM; A 12 hrs. 140" H; A 48 hrs. 170"; FSM; A 72 hrs. 170" H; A 48 hrs. 210"; FSM; A 48 hrs. 210" H; A 48 hrs. 230"; CD; A 18 hrs. 225"; FSM; A 72 hrs. 220" H; A 72 hrs. 260"; FSM; A 72 hrs. 260"
100.0 FSM
flour as a diluent,lB and packed into thin-walled glass (Pyrex) tubes of inside diameter 0.5 mm. (approximately), gave the most satisfactory films. Half the length of each tube was devoted to the alloy powder, and the other half to a 1:1.7 mixture of twice recrystallized sodium chloride and flour.
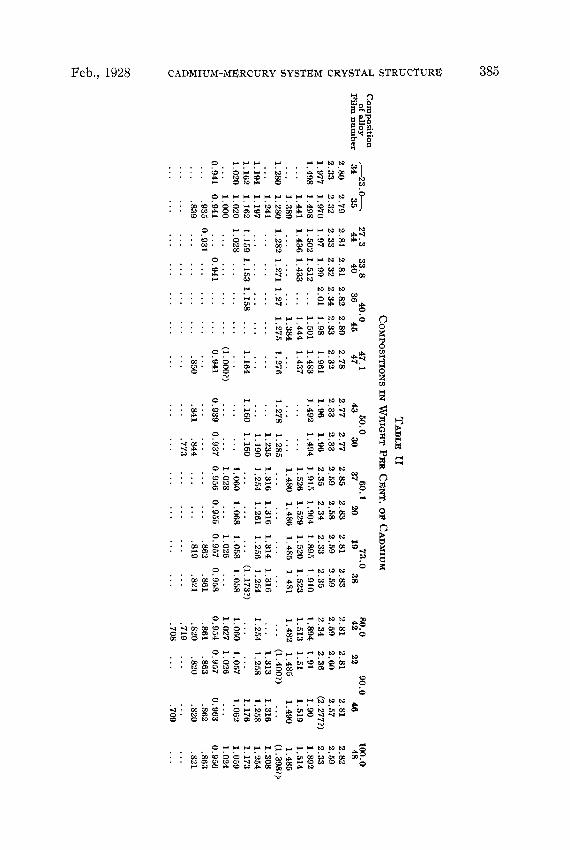
Each film thus had the standard sodium chloride spectrum alongside the alloy spectrum. A film calibration was calculated from the measured positions of the sodium chloride lines" and applied to the lines measured for the alloy. All of the measurements given in Table I1 are so corrected. The time of exposure was usually twenty-four hours, with 17-18 milli- amperes passing through the X-ray tube.
Experimental Results The measurements obtained from the films are given in Table 11.
The spectra obtained for the o-solid solution were much less sharp than those for the a-solid solution, and also less complete, as shown by Table 11. Film 36 was very poor, showing only scattered spots, with no fully developed lines. Film 40 was poor, with all lines diffused and striated except the one at 0.941 O i%.,
which was sharp. It is clear from the data in Table I1 that the spectra for all compositions
in the w-field are identical, not only in type but, within the error of meas- urement, in dimension also. Although the corresponding lines on the different films often appear to differ slightly in position, there is no pro- gressive variation in position with alloy composition. In order to arrive a t a series of values for the spectral lines best representative of the alloys
16 The table of dilutions proposed by W. P. Davey, Gen. Elec. Rev., 28, 589 (1925), was used in calculating the proportions of alloy powder and flour.
17 Davey, Gen. Eler. Rev., 29, 121 (19%).
Film 35 was probably the best in the o-field.
Film 45 was poor.
Feb., 1928 CADMIUM-MERCURY SYSTEM CRYSTAL STRUCTURE 385

386 ROBERT FRANKLIN MEHL Vol. 50
investigated in the w-field, the most sharply defined lines from the best films were averaged. These are given in Table 111.
TABLE I11 THE U-SOLID SOLUTION
d d Number of Average from Miller Theoretical Estimated codperatinp
best films indices spacings intensities planes
2,785 2.327 1.966 1.495 1.438 1.389 1.281 1.239 1.194 1.161 1,020 1.000 0.941
( ,844) . . .
lOO(2) 111 llO(2) 131 OOl(2) lOO(4) lOl(2) 120(2)
111(2)
201 (2)
33 1
151
llO(4) 121 113
2.78 2.33 1.966 1 I 500 1.438 1.390 1,278 1.239 1.191 1.161 1.019
,994 ,939 ,934
50 75 12 42 2 3 8
trace trace
trace trace trace
1 trace
3
2 4 2 8 1 2 4 2 4 4 8 4 2 8 4
The interplanar spacings observed correspond very closely to those re- quired by either the face-centered tetragonal lattice of axial ratio 0.520 or the body-centered tetragonal lattice of axial ratio 0.740. These two lattices are equivalent and alternative.I8 Table I11 also gives the theo- retical spacings as measured from the graph of Hull and Davey'O for the face-centered tetragonal lattice of axial ratio 0.520. The intensities are averages taken from estimations on films numbers 42, 47, 44, 34, 30 and 35. The dimensions for the unit face-centered tetragonal prism are an = 5.570 A., co = 2.896 A., or for the unit body-centered tetragonal prism are a0 = 3.932 A., c g = 2.910 A. The two values for CD should be equal. The difference originates in the error in the establishment of the correct axial ratios and in the absolute values of the lines chosen to give a3.
The assumption of simple substitution in the w-solid solution may be tested by a comparison of the calculated and the observed densities. Table IV gives the densities for a series of compositions calculated on the basis of a face-centered tetragonal lattice of axial ratio 0.520, which has four atoms in the unit cell. These densities are compared with densities obtained from the density-composition curve determined by Maey, 2o
18 An inspection of tetragonal symmetry shows that any face-centered tetragonal lattice is equivalent to a body-centered tetragonal lattice of axial ratio <2 times the axial ratio of the former.
Hull and Davey, Phys. Rev., 17, 569 (1921). 10 Maey, Z. phys ik . Chem., 50, 200 (1905).

Feb., 1928 CADMIUM-MERCURY SYSTEM CRYSTAL STRUCTURE 387
and the agreement is found to be very good, indicating that the assumption of simple substitution is valid.
TABLE I V DENSITY OF CADMIUM-MERCURY ALLOYS
Composition by weight, % cadmium
0.0 23.0 30.0 40.0 50.0
Observed Calcd. density density (Maw! 14.72 (14.6-14.7) 12.48 12.43 11.93 11.96 11.21 11.25 10.58 10.72
The density for pure mercury calculated on the assumption of a face- centered tetragonal lattice of axial ratio 0.520 is 14.72. It is interesting that an extrapolation on Maey’s curve to the mercury axis indicates a density of solid mercury a t room temperature between 14.6 and 14.7. The atomic volume calculated from a density of 14.72 is 13.63, as com- pared with 13.01 for pure cadmium. These atomic volumes are close, in conformity with the extensive solid solution formation observed. The density calculated from the data of McKeehan and Cioffi21 for a tempera- ture of -115’ is 13.97, and the corresponding atomic volume is 14.36. If no solid-solid transitions are assumed, the effect of rising temperature should be to decrease the density and to increase the atomic volume. At room temperature, therefore, the density calculated from the data of McKeehan and Cioffi is much lower than that obtained by an extrapola- tion of Maey’s density curve, and the atomic volume is much further from the atomic volume of cadmium than that calculated from the structure data on the o-solid solution, a condition not favorable to the formation of extensive solid solution.
It seems possible, therefore, that the crystal structure of pure mercury a t its melting point is the same as that observed for the mercury-rich cadmium-mercury solid solutions. If an actual determination of the crystal structure of mercury a t its melting point should show a different lattice, the composition-temperature diagram of the system as proposed by Bijl would have to be modified. At present the weight of evidence seems to be against such a modification.
The 60.1% cadmium alloy comes in the heterogeneous field, a + a, but shows only the lattice of the a-solid solution. The 73% cadmium alloy is in the a-field near the limit of solid solubility. No change in the lattice type or in the lattice dimensions are evident from the spectral lines given in Table I. A change in dimension would be manifested by a progressive change in the positions of the spectral lines with change in composition. No such displacement may be found in the measurements
*I Ref. 10, p. 445.

388 ROBERT FRANKLIN MGHL Vol. 50
given in Table 11. The average positions of the various spectral lines calculated from films 19, 38, 42, 22 and 46 give a spectrum which agrees very closely with that obtained from film 48 for pure cadmium, both of which fit closely to Hull and Davey’s graph for the triangular, close- packed lattice of axial ratio 1.89. The side of the unit triangle is 2.980 A., as found by Hull.’* The density calculated for the 73% cadmium alloy is 9.72 as compared with the value 9.70 derived from Maey’s data, indicating simple substitution in the a-solid solution.
There is no indication in the present work of the existence of any inter- metallic compounds a t room temperature. The composition range from 0 to 23% cadmium, however, has not been investigated, though if the structure of mercury at its melting point should prove to be similar to
that observed for the w-solid solution, the possibility for compound formation in this composition range would be very small. Nor does the pres- ent work afford any basis for the frequent postulation of in- termetallic compounds in the liquid alloys, which if present in the liquid state should also be manifested in the solid state, since temperature rise usually has the effect , of dissociation. So far as the author is aware there is no evidence of any in- termetallic compound existent
in the liquid state which is not also existent in the solid state.22 Although the similar atomic volumes of mercury and cadmium doubt-
less favor the extensive solid solution formation observed, it is difficult to see why two lattices so different as the face-centered tetragonal and the close-packed triangular should show such an extensive isomorphism. The tetragonal lattices pictured in the usual way, with lines drawn parallel to the tetragonal coordinates, do not suggest the presence of any hexagonal arrangement of atoms. It should be distinctly emphasized, however, that these lines are purely artificial, and that important orientations exist in many lattices which they are insufficient to depict and in fact frequently mask.
It may be shown, however, that in the w-solid solution there is actually an hexagonal arrangement closely approximating the unit hexagonal
2 2 Cf. the work of Bornemann, et al., on the electrical conductivity of liquid alloys, Mefallzqie, 7,396, 655, 730,755 (1910); 9,473 (1912); Ferrum, 11,276,289,330 (1913)
B
F
Fig. 2.

Feb., 1928 CADMIUM-MERCURY SYSTEM CRYSTAL STRUCTURE 389
prism in the a-solid solution. Fig. 2 represents six unit cells of the body- centered tetragonal lattice exhibited by the w-solid solution. Cell ABCD- EFGH is such a unit cell. Let us consider, however, atoms DIJKLM, which lie in a plane and form a hexagon. Geometrically it may be shown that for the lattice of the w-solid solution DI = DM = JK = KL = 3.139 A., and that IJ = MI, = 2.910 B.; angle IDM = angle JKL = 125'46', and angle DML = angle MLK = angle KJI = angle JID = 117'7'. It may also be shown that i t is the basal hexagon of an hexagonal prism, half of which is indi- cated in Fig. 2 by dotted lines. Fig. 3 represents the fully developed prism. The similarity between this and the ordinary close-packed hexagonal prism is striking, and would be complete if DIJKLM were a perfect hexagon and if atoms G, N, Q and P were displaced to the left in their plane so that atom P were brought into the center of the tri- angular prism of which JKH is a basal plane. The same is true of the other atoms in the GNQP plane. This de- formed hexagonal prism is repeated throughout the lattice and serves com- pletely to define it, that is, it is a unit cell. The density for the 40% cadmium alloy calculated from it agrees with that given in Table IV. The basal hexagon will be equilateral when the axial ratio for the body-centered tetragonal lattice is 0.816.
The dimensions of the unit cell are uo = 3.139 A,, u,' = 2.910 Hi., co = 5.561 A., whereas the dimensions of the unit hexagonal cadmium prism are uo = 2.980 A. and co = 5.632 A. The a- and the w-solid solutions are therefore very similar both in lattice dimensions and in atomic volume, thus satisfying two of the conditions necessary for solid solutions formation.
The author wishes to acknowledge his indebtedness to Professor Albert Sauveur, whose kindness made available the apparatus used in this work.
Summary
This hexagon is therefore nearly equilateral.
K L
Fig. 3.
The crystal structure of the system cadmium-mercury has been investi- gated by a study of the diffraction of X-rays. It has been shown that there are a t least two, and probably only two, types of lattice in the system, a face-centered tetragonal lattice of axial ratio 0.520 (or a body- centered lattice of axial ratio 0.740) found in alloys of from 23 to 50%

390 HAROLD A. ABRAMSON Vol. 50
cadmium by weight, and a triangular close-packed lattice of axial ratio 1.89, found in alloys of from 60 to 100% cadmium by weight.
The conflicting data on the crystal structure of mercury are discussed and i t is suggested that the present work indirectly indicates a face- centered (or body-centered) tetragonal structure. It is pointed out that the frequent assumption of intermetallic compounds in this system re- ceives no support from the present crystal structure data.
The isomorphism of cadmium and the face-centered tetragonal compo- nent (which may be mercury) is favored by similar atomic volumes and also by the presence in the face-centered tetragonal lattice of an atom arrangement closely approximating the unit hexagonal prism of cadmium both in lattice type and in the unit cell dimensions.
[CONTRIBUTION FROM THE KAISER WILHELM-INSTITUT FOR PHYSIKALISCHE CHEMIE UND ELEKTROCHEMIE]
A NEW METHOD FOR THE STUDY OF CATAPHORETIC PROTEIN MOBILITY
BY HAROLD A. ABRAMSON RECEIVED NOVEMBER 19, 1927 PUBLISRBD FEBRUARY 4, 1928
It has previously been shown2 that the cataphoretic migration of inert particles suspended in gelatin gels represents the movements of the micellae of the gelatin. That is, there seemed to be a rapid formation of a sheath of the gel about the particle which changed its sign a t the iso-electric point of the protein. The study of the migration of the particle, there- fore, afforded a simple means of studying the cataphoresis of the gelatin micellae themselves. This has led to the study of the iduence of proteins on the migration of quartz particles in sols of low concentration. A con- centration of 1 X lo-’ already lowers c, the electrokinetic potential, appreciably. Between concentrations of about l.10-5 and l.10-4 g. per liter the maximum effect of the protein is reached and the particles behave like gelatin.
A suspension of quartz particles in a dilute solution of the proteins men- tioned (within limits of dilution) gives the absolute electrophoretic migra- tion of the protein micellae. The complete data and theory of these phenomena will be presented Svedberg and Tiselius4 have used a rather elaborate method to determine the mobility of egg albumin. It seemed that a comparison of their method with ours was of interest.
The researches here reported were made in part during a tenure of a Medical Fellowship of the National Research Council.
Freundlich and Abramson, 2. physik. Chem., I28,25 (1927). Z . physik. Chem., in press.
Egg albumin shows a similar influence.
4 Svedberg and Tiselius, THIS JOURNAL, 48, 2272 (1926).