the current state of consumer expectations and purchase drivers around sustainability: analysis of...
TRANSCRIPT
Claudia Suárez-Gapp Veridical Lead Public Development and Sustainability - Europe The Nielsen Company
The Current State of Consumer Expectations and Purchase Drivers around Sustainability: Analysis of the Latest Data
#SB15London
THE CURRENT STATE OF CONSUMER EXPECTATIONS AND PURCHASE DRIVERS AROUND SUSTAINABILITY: ANALYSIS OF THE LATEST DATA
THE SUSTAINABILITY IMPERATIVE
Claudia Suárez-‐Gapp The Nielsen Company 17 November 2015
Copyrig
ht ©
2014 The
Nielse
n Co
mpany. Con
fiden
Val and
proprietary.
3
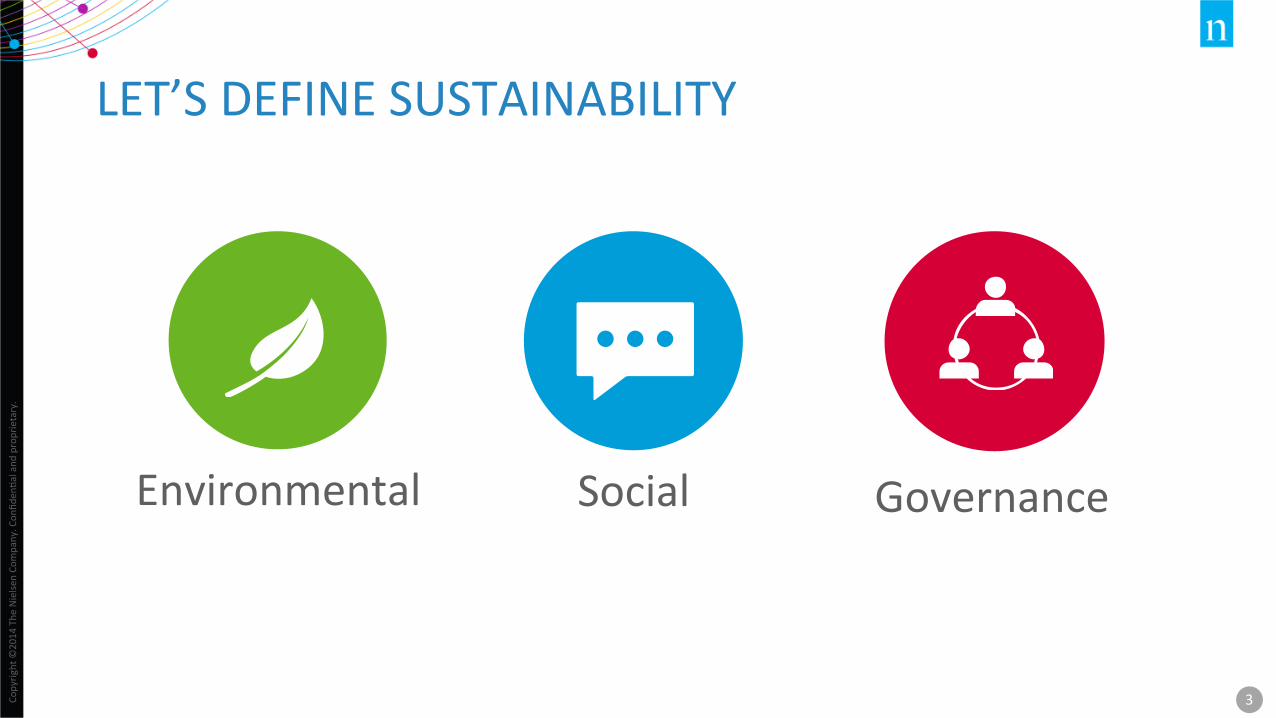
LET’S DEFINE SUSTAINABILITY
Environmental Governance Social
Copyrig
ht ©
2014 The
Nielse
n Co
mpany. Con
fiden
Val and
proprietary.
4
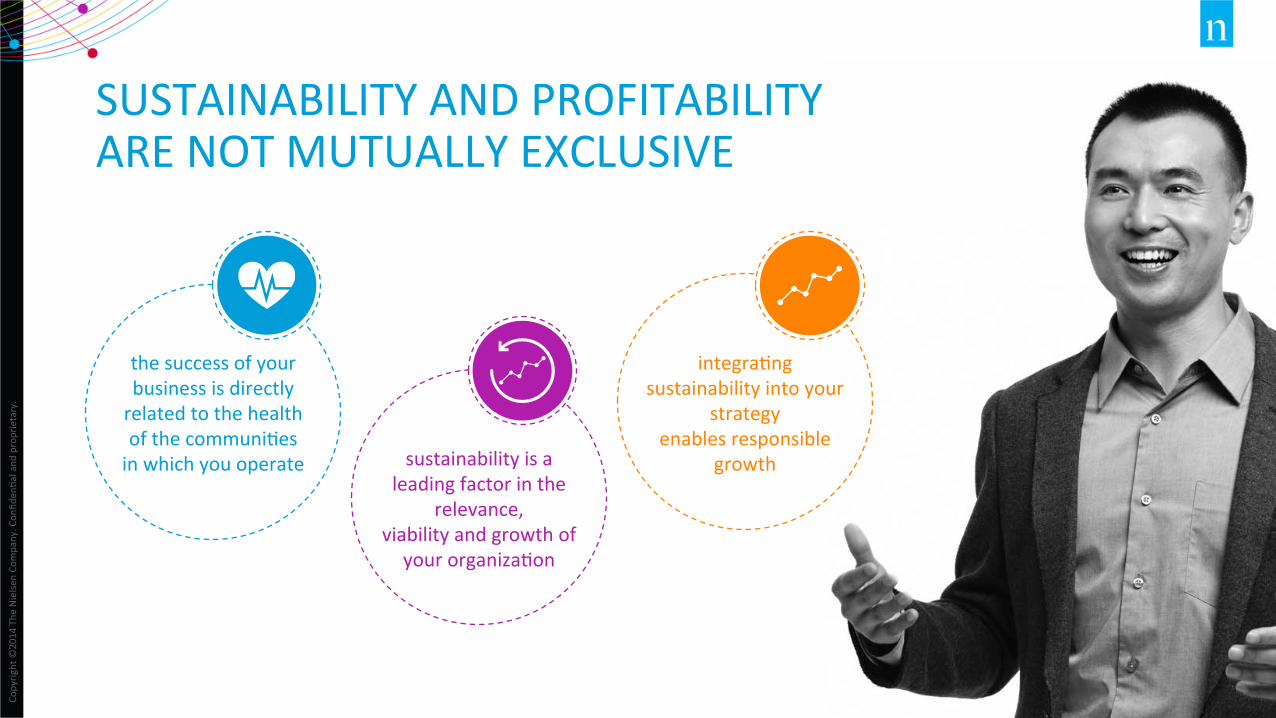
SUSTAINABILITY AND PROFITABILITY ARE NOT MUTUALLY EXCLUSIVE
the success of your business is directly related to the health of the communiVes in which you operate sustainability is a
leading factor in the relevance,
viability and growth of your organizaVon
integraVng sustainability into your
strategy enables responsible
growth
Copyrig
ht ©
2014 The
Nielse
n Co
mpany. Con
fiden
Val and
proprietary.
5
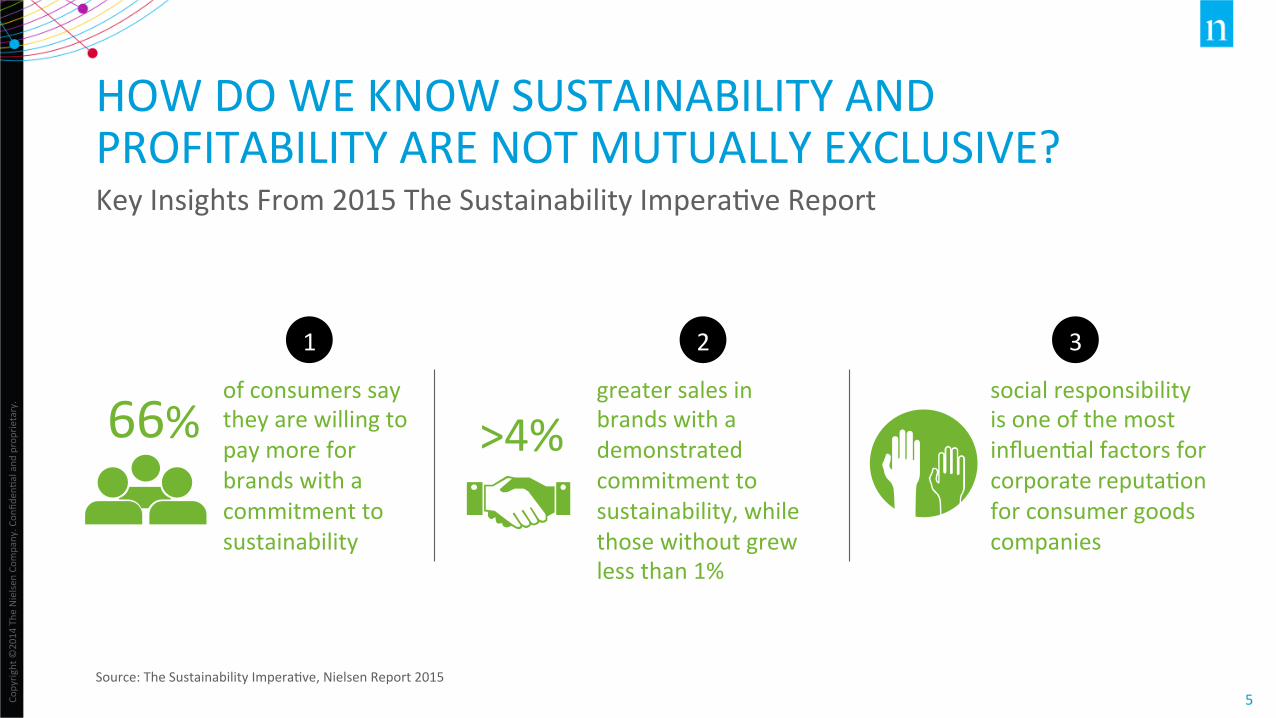
HOW DO WE KNOW SUSTAINABILITY AND PROFITABILITY ARE NOT MUTUALLY EXCLUSIVE? Key Insights From 2015 The Sustainability ImperaVve Report
Source: The Sustainability ImperaVve, Nielsen Report 2015
of consumers say they are willing to pay more for brands with a commitment to sustainability
greater sales in brands with a demonstrated commitment to sustainability, while those without grew less than 1%
social responsibility is one of the most influenVal factors for corporate reputaVon for consumer goods companies
>4% 66% 1 2 3
CONSUMERS ARE WILLING TO PAY MORE
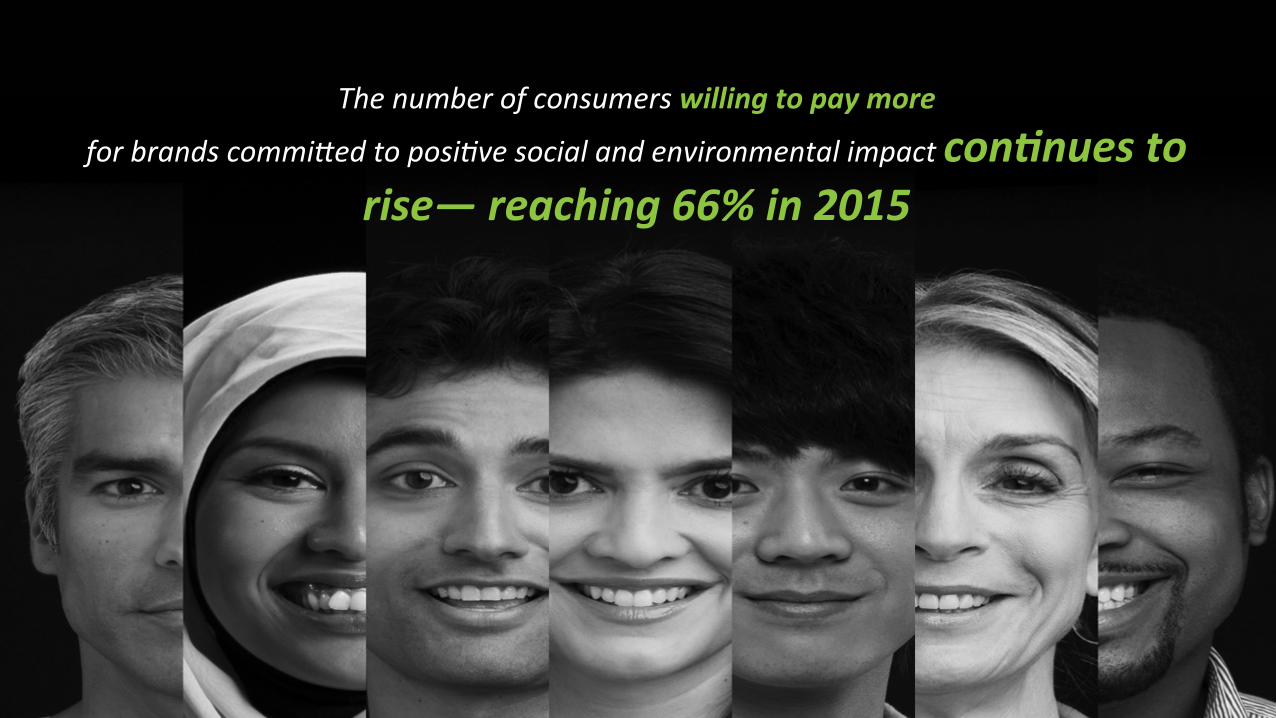
The number of consumers willing to pay more
for brands commi1ed to posi4ve social and environmental impact con0nues to rise— reaching 66% in 2015
Copyrig
ht ©
2014 The
Nielse
n Co
mpany. Con
fiden
Val and
proprietary.
8
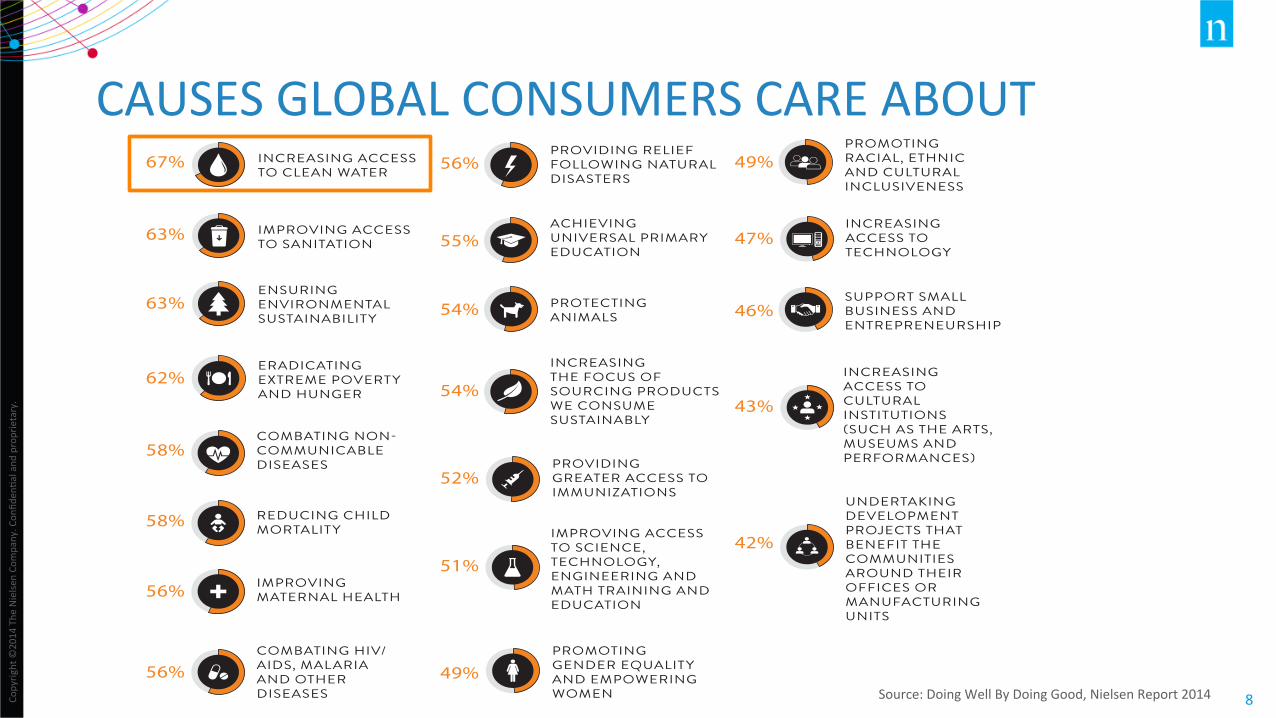
CAUSES GLOBAL CONSUMERS CARE ABOUT
Source: Doing Well By Doing Good, Nielsen Report 2014
THE CAUSES CONSUMERS CARE ABOUT
AMONG GLOBAL RESPONDENTS WILLING TO PAY EXTRA FOR PRODUCTS FROM COMPANIES COMMITTED TO POSITIVE SOCIAL AND ENVIRONMENTAL IMPACT
PERCENT THAT INDICATE EXTREME CONCERN
INCREASING ACCESS TO CLEAN WATER
67%
63% IMPROVING ACCESS TO SANITATION
63%ENSURING ENVIRONMENTAL SUSTAINABILITY
62%ERADICATING EXTREME POVERTY AND HUNGER
52%PROVIDING GREATER ACCESS TO IMMUNIZATIONS
49%PROMOTING GENDER EQUALITY AND EMPOWERING WOMEN
43%
INCREASING ACCESS TO CULTURAL INSTITUTIONS (SUCH AS THE ARTS, MUSEUMS AND PERFORMANCES)58%
COMBATING NON-COMMUNICABLE DISEASES
58% REDUCING CHILD MORTALITY
56% IMPROVING MATERNAL HEALTH
56%COMBATING HIV/ AIDS, MALARIA AND OTHER DISEASES
51%
IMPROVING ACCESS TO SCIENCE, TECHNOLOGY, ENGINEERING AND MATH TRAINING AND EDUCATION
47%INCREASING ACCESS TO TECHNOLOGY
42%
UNDERTAKING DEVELOPMENT PROJECTS THAT BENEFIT THE COMMUNITIES AROUND THEIR OFFICES OR MANUFACTURING UNITS
56%PROVIDING RELIEF FOLLOWING NATURAL DISASTERS
55%ACHIEVING UNIVERSAL PRIMARY EDUCATION
54% PROTECTING ANIMALS
54%
INCREASING THE FOCUS OF SOURCING PRODUCTS WE CONSUME SUSTAINABLY
49%PROMOTING RACIAL, ETHNIC AND CULTURAL INCLUSIVENESS
46%SUPPORT SMALL BUSINESS AND ENTREPRENEURSHIP
Copyrig
ht ©
2015 The
Nielse
n Co
mpany. Con
fiden
Val and
proprietary.
9
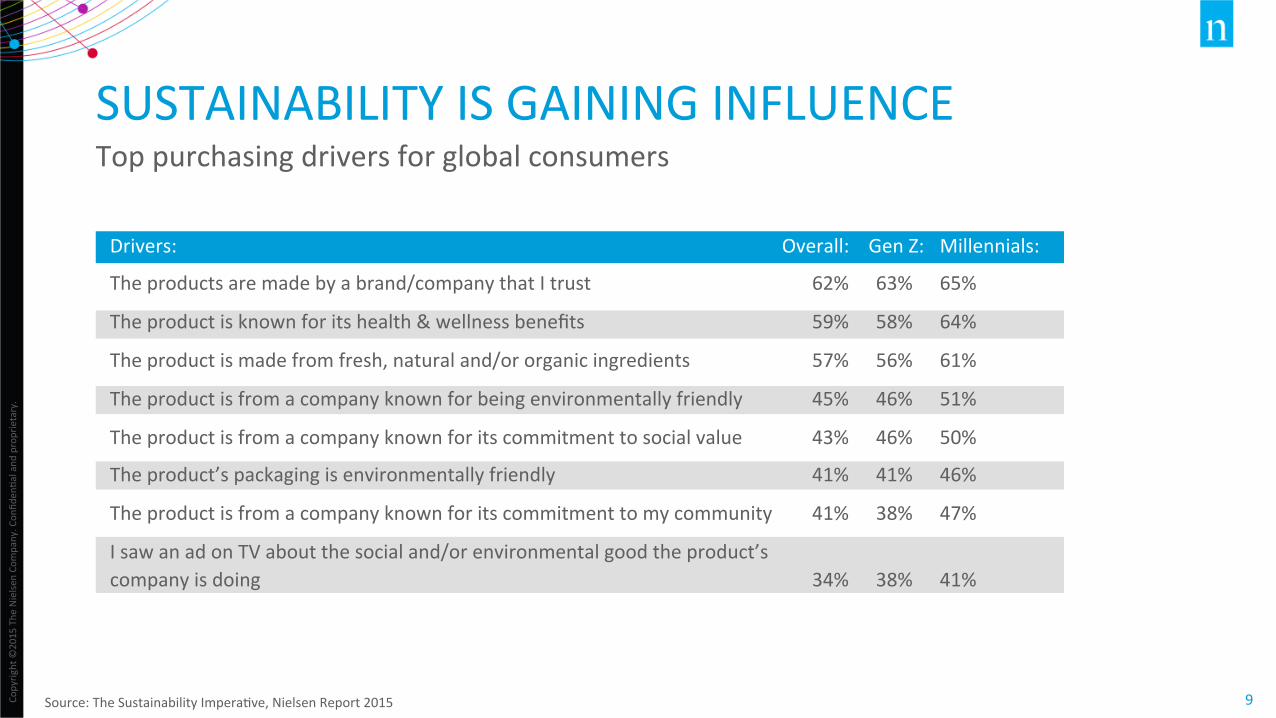
SUSTAINABILITY IS GAINING INFLUENCE Top purchasing drivers for global consumers
Source: The Sustainability ImperaVve, Nielsen Report 2015
Drivers: Overall: Gen Z: Millennials:
The products are made by a brand/company that I trust 62% 63% 65%
The product is known for its health & wellness benefits 59% 58% 64%
The product is made from fresh, natural and/or organic ingredients 57% 56% 61%
The product is from a company known for being environmentally friendly 45% 46% 51%
The product is from a company known for its commitment to social value 43% 46% 50%
The product’s packaging is environmentally friendly 41% 41% 46%
The product is from a company known for its commitment to my community 41% 38% 47%
I saw an ad on TV about the social and/or environmental good the product’s company is doing 34% 38% 41%
Copyrig
ht ©
2015 The
Nielse
n Co
mpany. Con
fiden
Val and
proprietary.
10
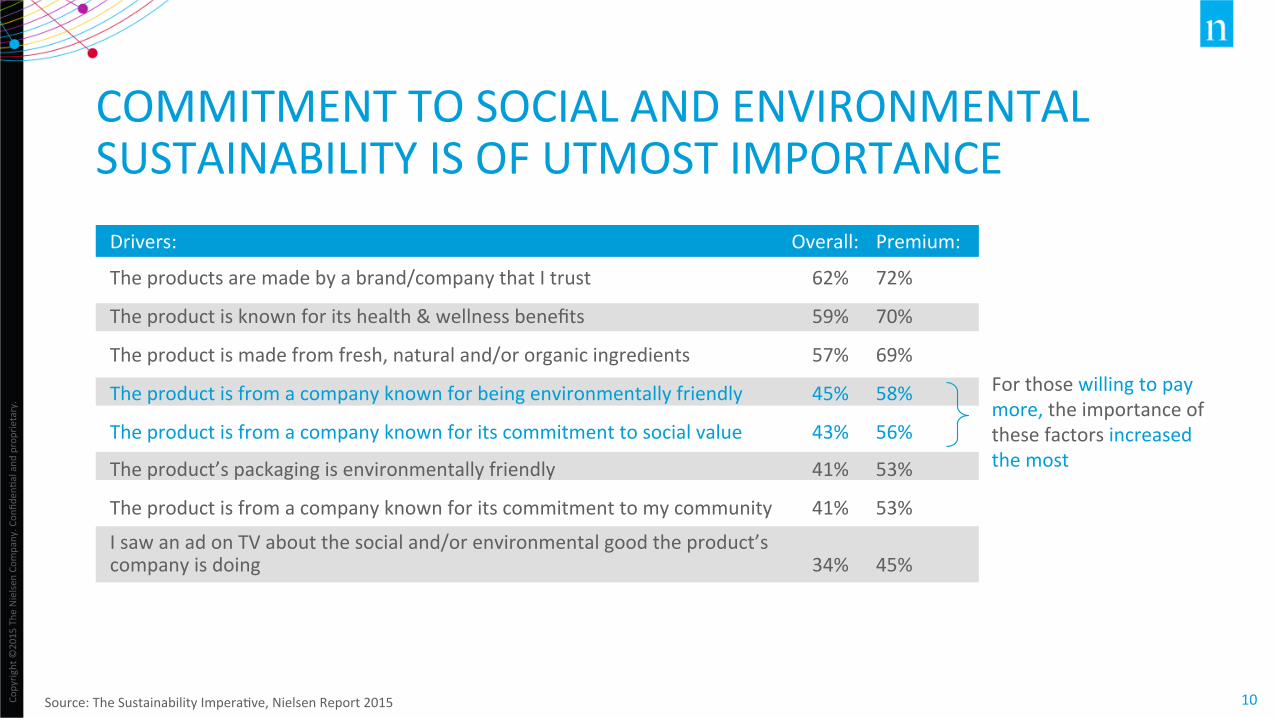
COMMITMENT TO SOCIAL AND ENVIRONMENTAL SUSTAINABILITY IS OF UTMOST IMPORTANCE
Source: The Sustainability ImperaVve, Nielsen Report 2015
For those willing to pay more, the importance of these factors increased the most
Drivers: Overall: Premium:
The products are made by a brand/company that I trust 62% 72%
The product is known for its health & wellness benefits 59% 70%
The product is made from fresh, natural and/or organic ingredients 57% 69%
The product is from a company known for being environmentally friendly 45% 58%
The product is from a company known for its commitment to social value 43% 56%
The product’s packaging is environmentally friendly 41% 53%
The product is from a company known for its commitment to my community 41% 53%
I saw an ad on TV about the social and/or environmental good the product’s company is doing 34% 45%
Copyrig
ht ©
2014 The
Nielse
n Co
mpany. Con
fiden
Val and
proprietary.
11
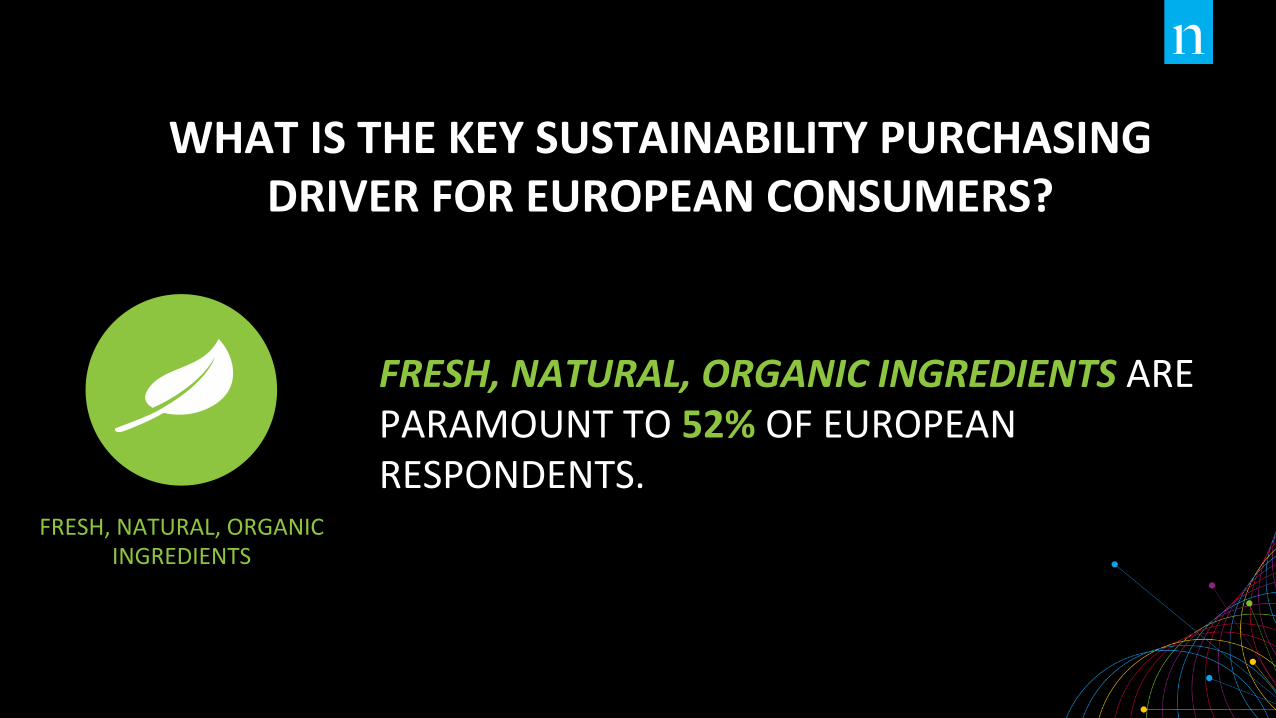
WHAT IS THE KEY SUSTAINABILITY PURCHASING DRIVER FOR EUROPEAN CONSUMERS?
FRESH, NATURAL, ORGANIC INGREDIENTS
FRESH, NATURAL, ORGANIC INGREDIENTS ARE PARAMOUNT TO 52% OF EUROPEAN RESPONDENTS.
Copyrig
ht ©
2014 The
Nielse
n Co
mpany. Con
fiden
Val and
proprietary.
12
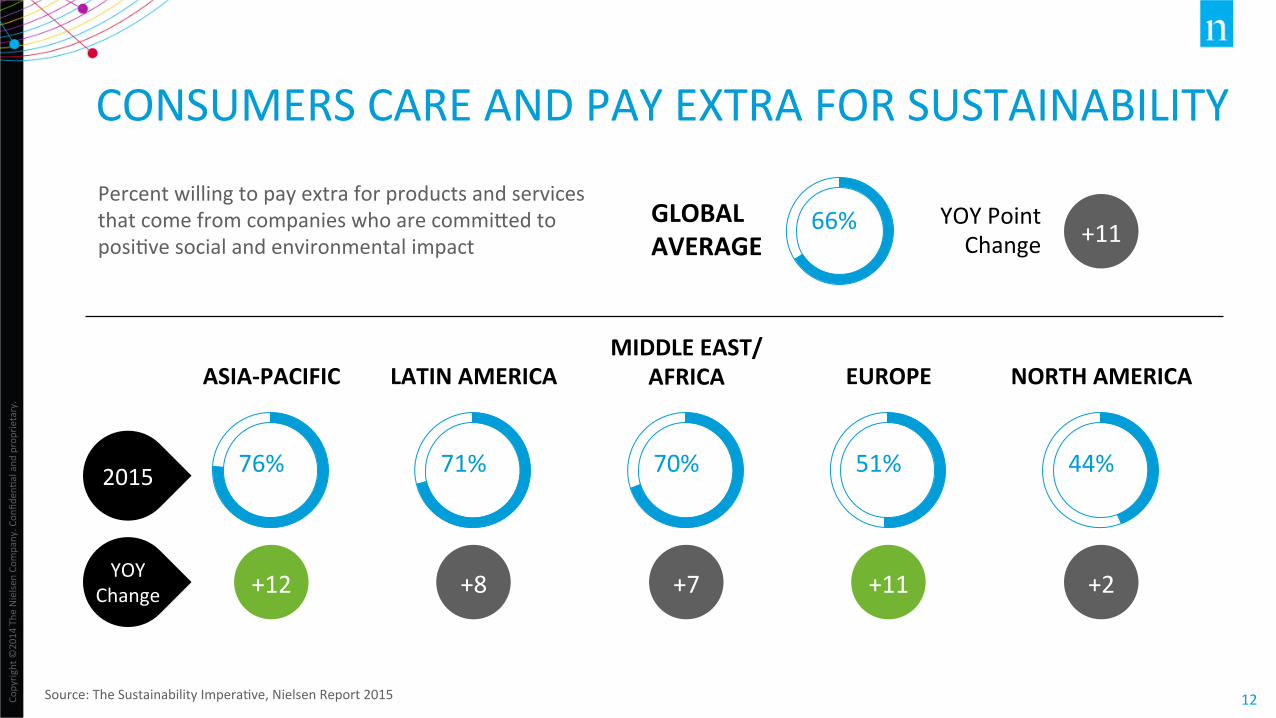
CONSUMERS CARE AND PAY EXTRA FOR SUSTAINABILITY
Percent willing to pay extra for products and services that come from companies who are commiked to posiVve social and environmental impact
ASIA-‐PACIFIC
GLOBAL AVERAGE
66% +11 YOY Point Change
76%
LATIN AMERICA
71%
MIDDLE EAST/AFRICA
70%
EUROPE
51%
NORTH AMERICA
44%
Source: The Sustainability ImperaVve, Nielsen Report 2015
2015
YOY Change +12 +8 +7 +11 +2
Copyrig
ht ©
2014 The
Nielse
n Co
mpany. Con
fiden
Val and
proprietary.
13
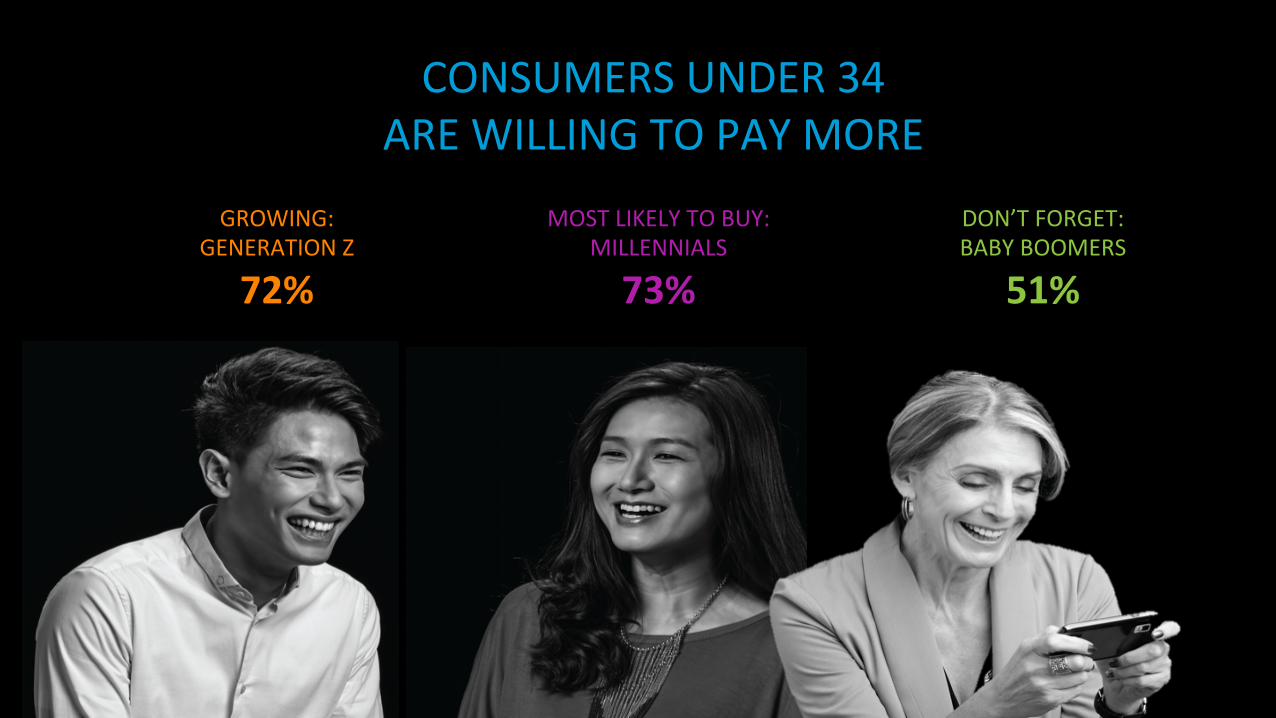
CONSUMERS UNDER 34 ARE WILLING TO PAY MORE
GROWING: GENERATION Z
72%
MOST LIKELY TO BUY: MILLENNIALS
73%
DON’T FORGET: BABY BOOMERS
51%
Copyrig
ht ©
2014 The
Nielse
n Co
mpany. Con
fiden
Val and
proprietary.
14
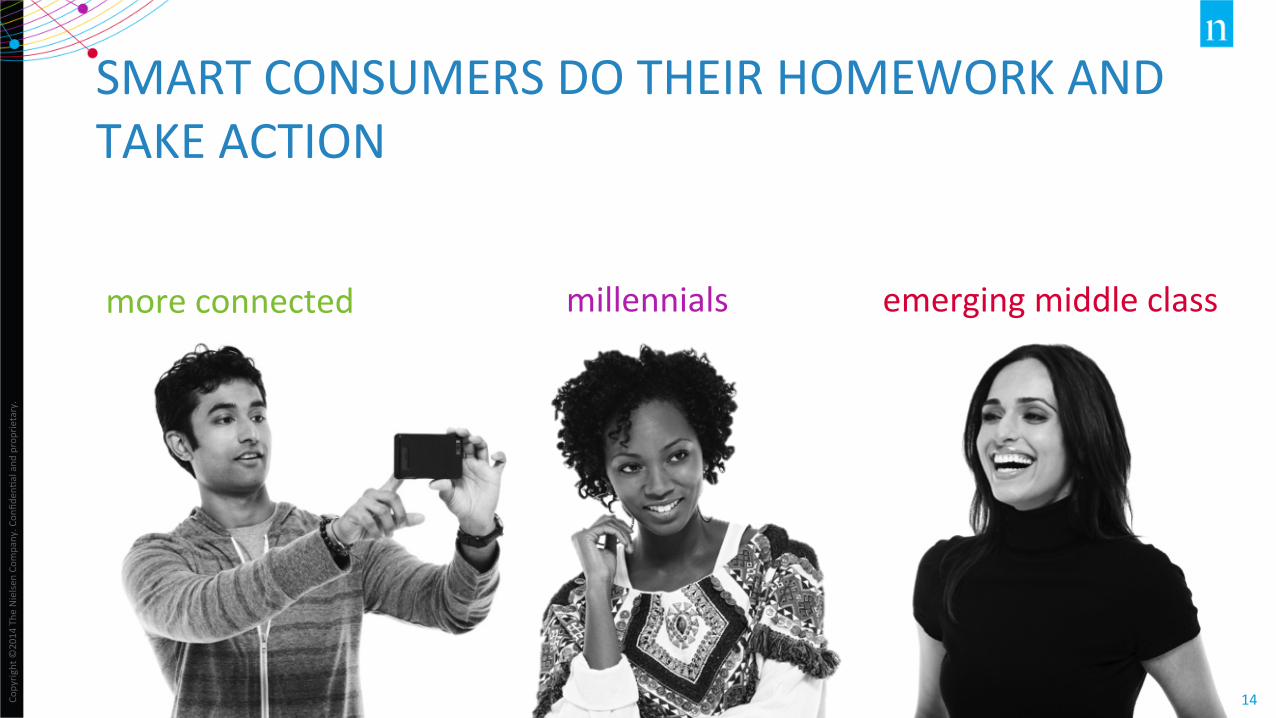
SMART CONSUMERS DO THEIR HOMEWORK AND TAKE ACTION
more connected millennials emerging middle class
SUSTAINABLE BRANDS OUTPERFORM
Copyrig
ht ©
2014 The
Nielse
n Co
mpany. Con
fiden
Val and
proprietary.
16
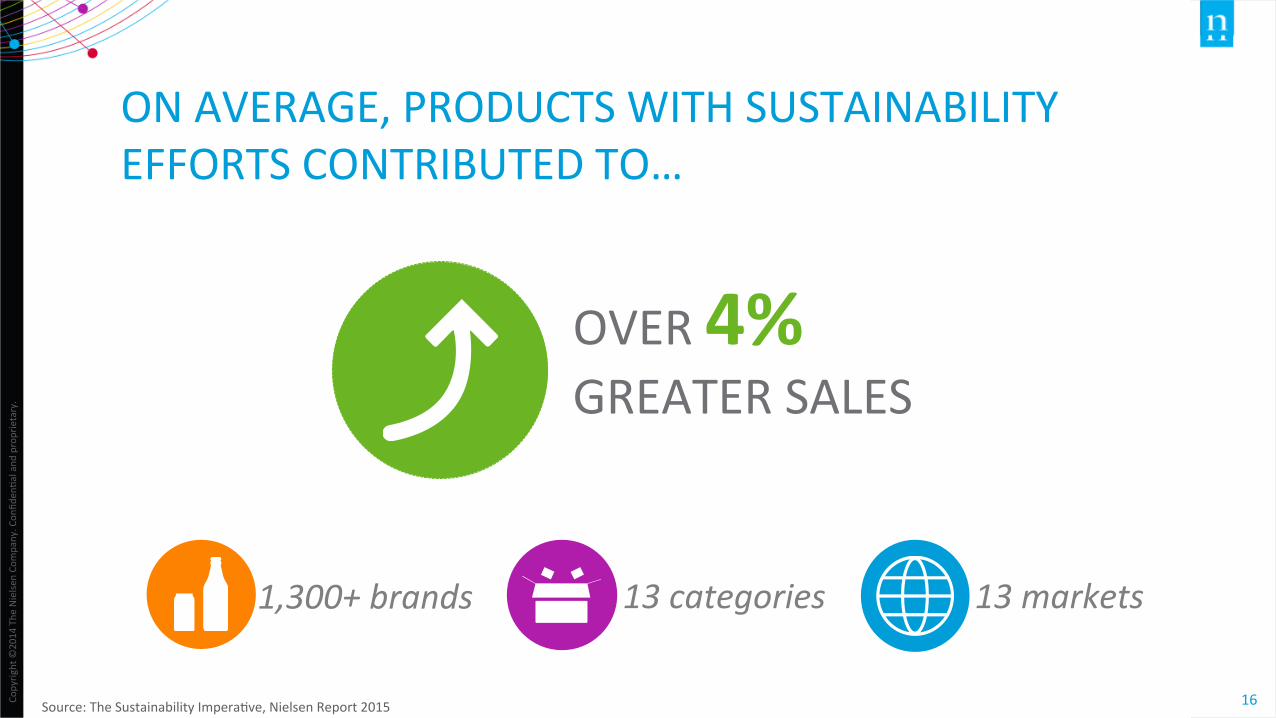
1,300+ brands 13 categories 13 markets
ON AVERAGE, PRODUCTS WITH SUSTAINABILITY EFFORTS CONTRIBUTED TO…
OVER 4% GREATER SALES
Source: The Sustainability ImperaVve, Nielsen Report 2015
Copyrig
ht ©
2014 The
Nielse
n Co
mpany. Con
fiden
Val and
proprietary.
17
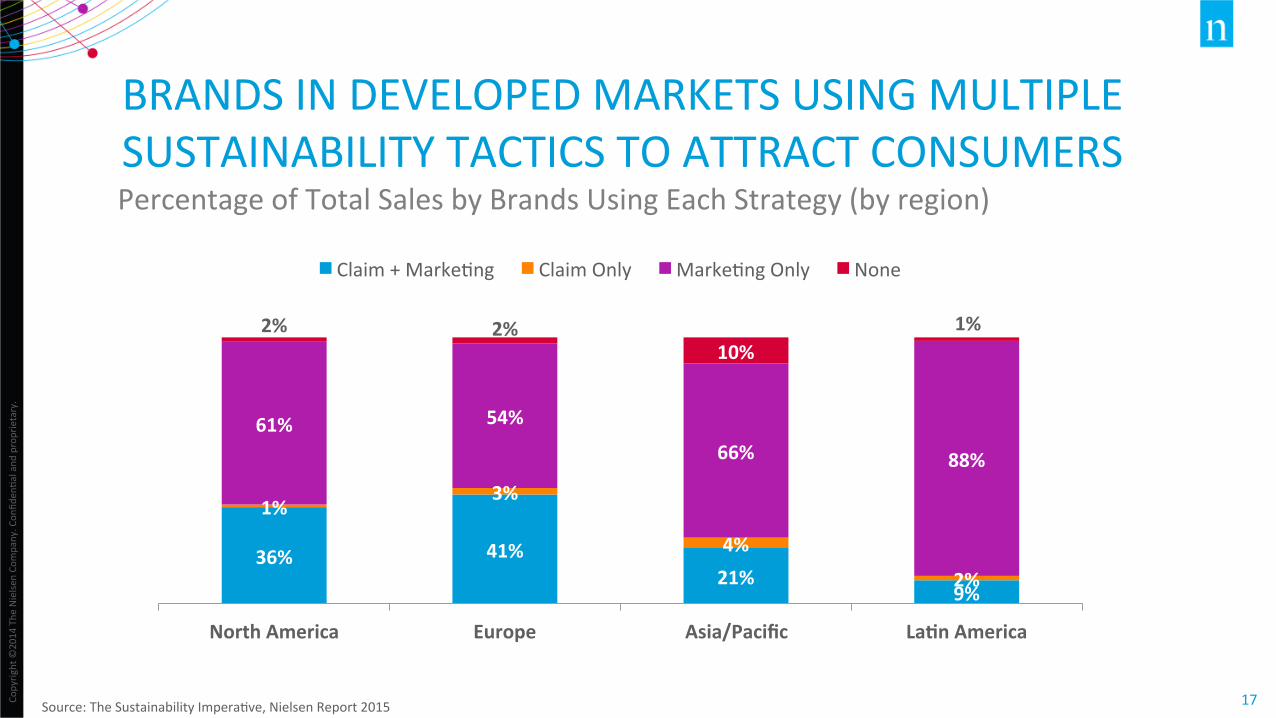
BRANDS IN DEVELOPED MARKETS USING MULTIPLE SUSTAINABILITY TACTICS TO ATTRACT CONSUMERS
36% 41% 21%
9%
1% 3%
4%
2%
61% 54%
66% 88%
2% 2% 10%
1%
North America Europe Asia/Pacific LaSn America
Claim + MarkeVng Claim Only MarkeVng Only None
Percentage of Total Sales by Brands Using Each Strategy (by region)
Source: The Sustainability ImperaVve, Nielsen Report 2015
Copyrig
ht ©
2014 The
Nielse
n Co
mpany. Con
fiden
Val and
proprietary.
18
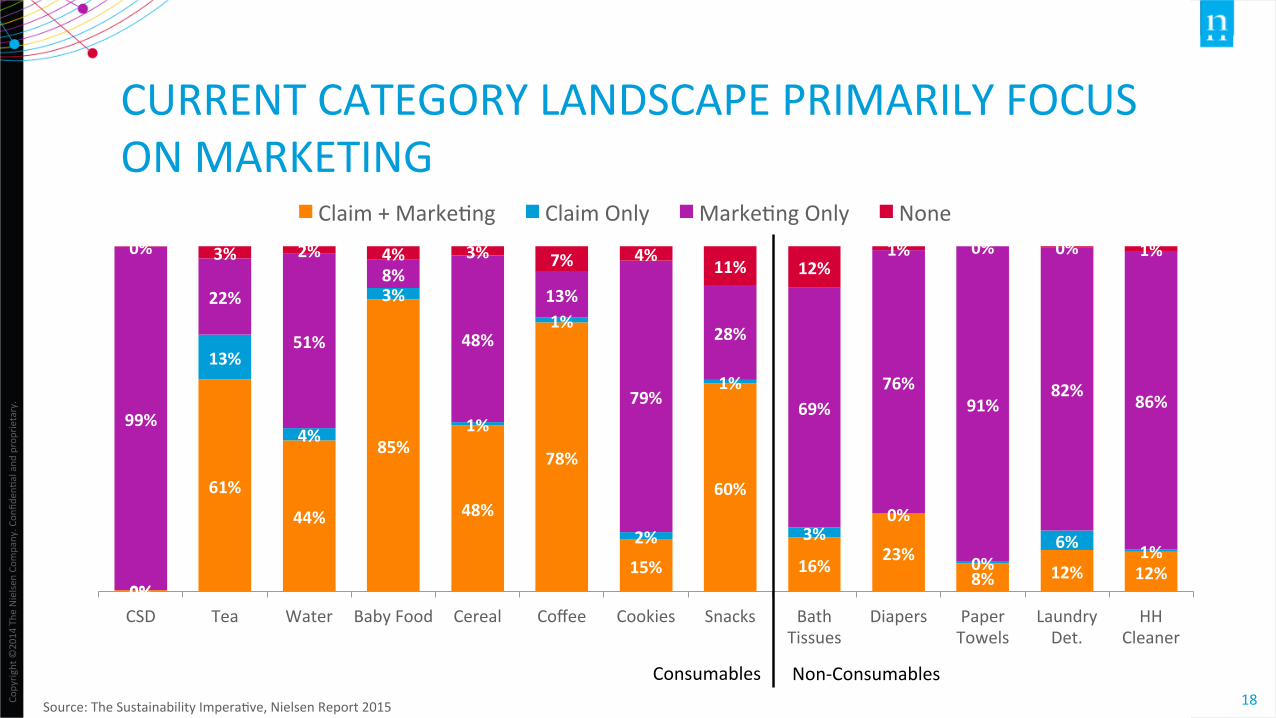
CURRENT CATEGORY LANDSCAPE PRIMARILY FOCUS ON MARKETING
Source: The Sustainability ImperaVve, Nielsen Report 2015
0%
61%
44%
85%
48%
78%
15%
60%
16% 23%
8% 12% 12% 0%
13%
4%
3%
1%
1%
2%
1%
3% 0%
0% 6% 1%
99%
22%
51%
8%
48%
13%
79%
28%
69% 76%
91% 82% 86%
0% 3% 2% 4% 3% 7% 4% 11% 12%
1% 0% 0% 1%
CSD Tea Water Baby Food Cereal Coffee Cookies Snacks Bath Tissues
Diapers Paper Towels
Laundry Det.
HH Cleaner
Claim + MarkeVng Claim Only MarkeVng Only None
Consumables Non-‐Consumables
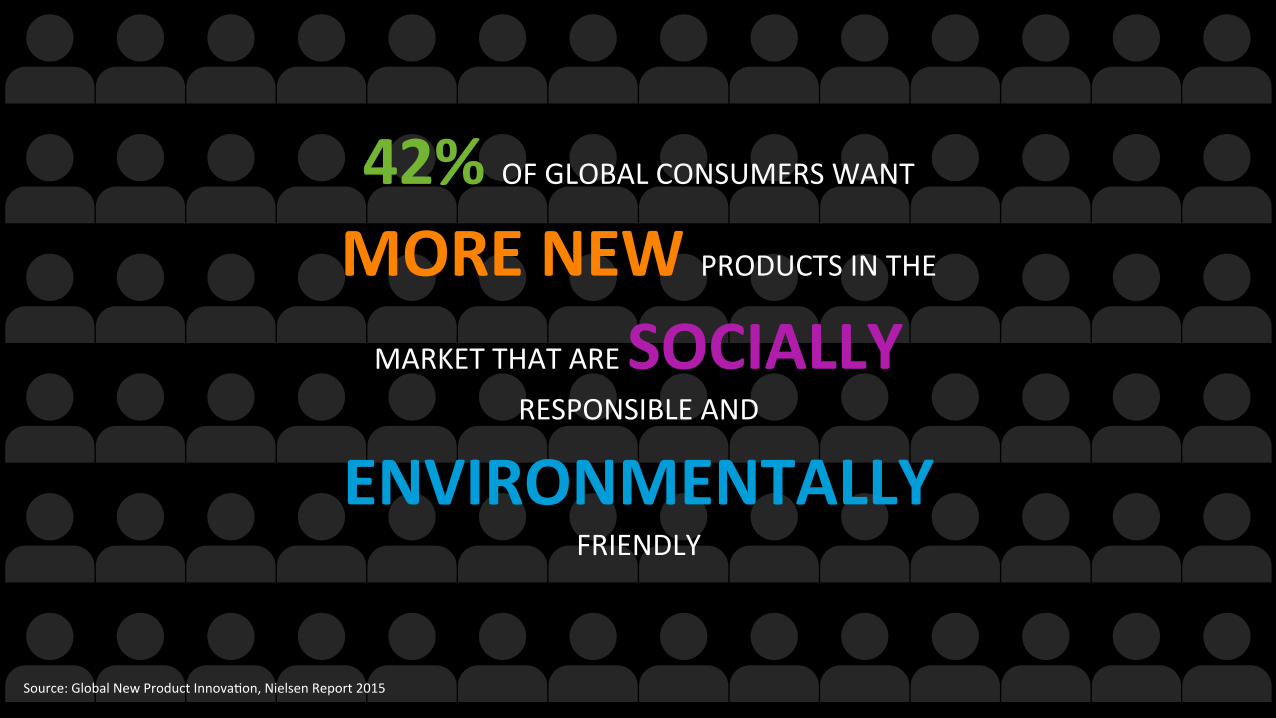
42% OF GLOBAL CONSUMERS WANT
MORE NEW PRODUCTS IN THE MARKET THAT ARE SOCIALLY
RESPONSIBLE AND
ENVIRONMENTALLY FRIENDLY
Source: Global New Product InnovaVon, Nielsen Report 2015
Copyrig
ht ©
2014 The
Nielse
n Co
mpany. Con
fiden
Val and
proprietary.
20
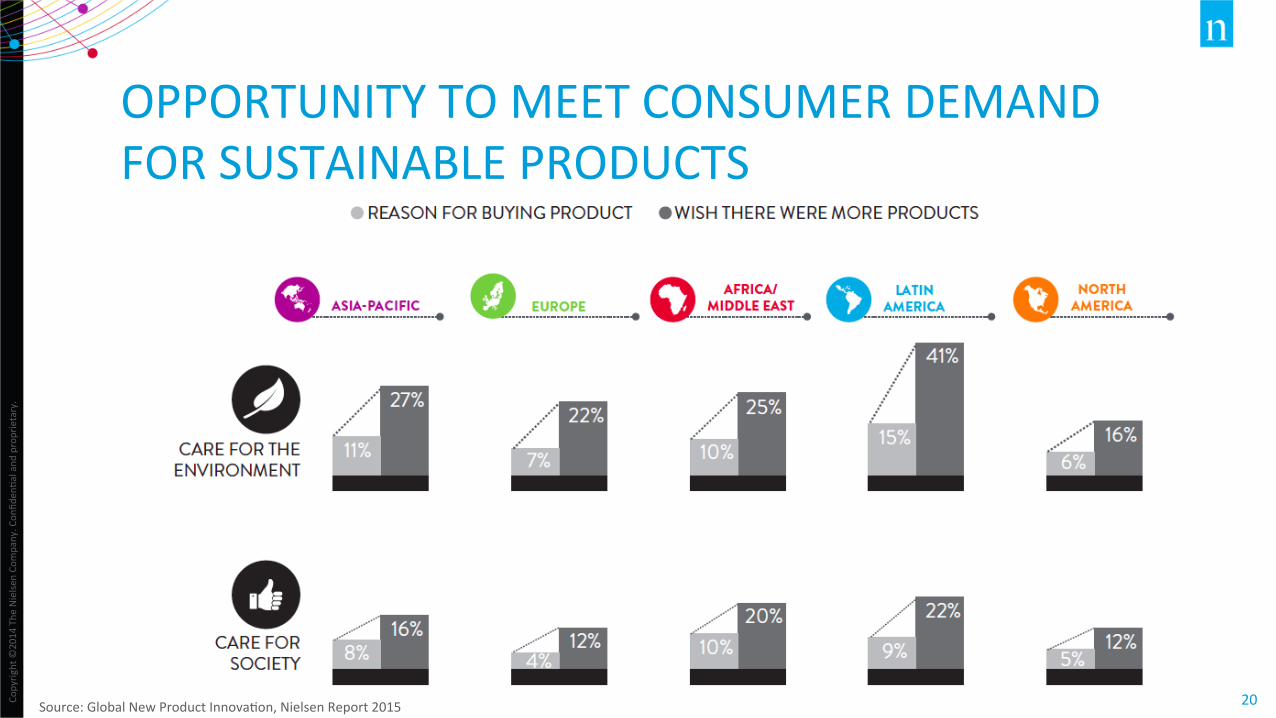
OPPORTUNITY TO MEET CONSUMER DEMAND FOR SUSTAINABLE PRODUCTS
Source: Global New Product InnovaVon, Nielsen Report 2015
Copyrig
ht ©
2014 The
Nielse
n Co
mpany. Con
fiden
Val and
proprietary.
21
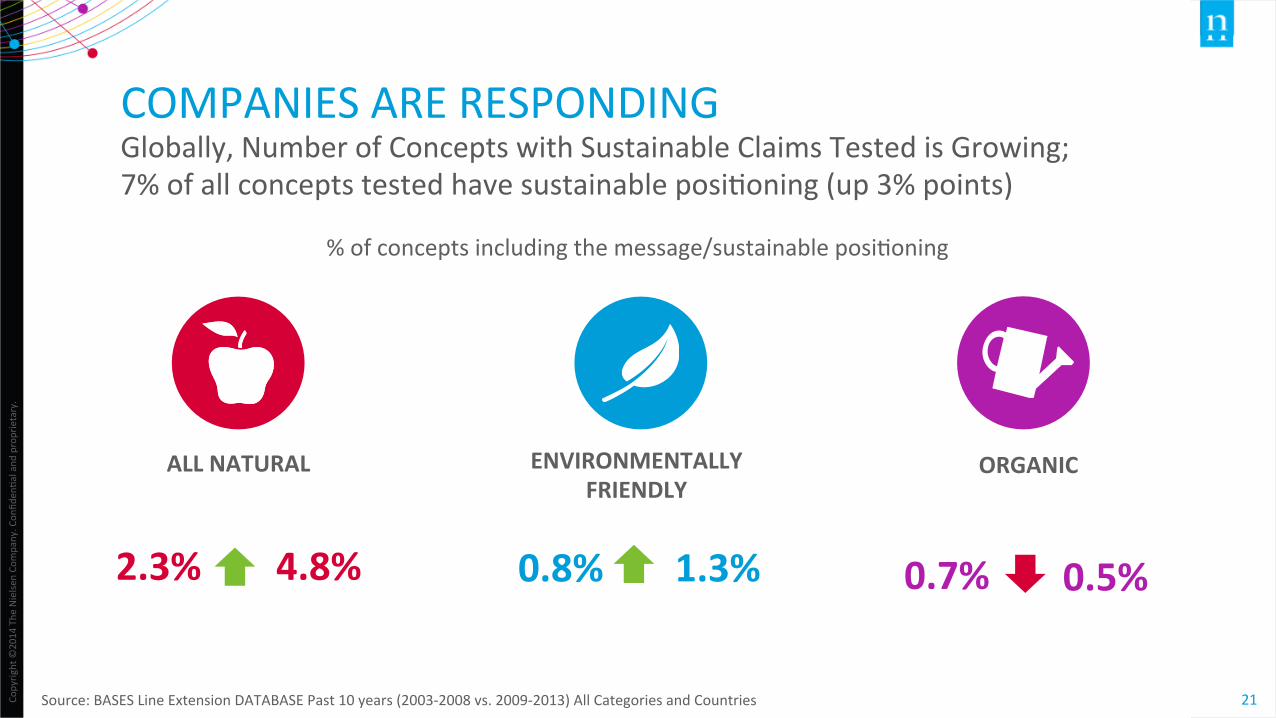
COMPANIES ARE RESPONDING Globally, Number of Concepts with Sustainable Claims Tested is Growing; 7% of all concepts tested have sustainable posiVoning (up 3% points)
ORGANIC ENVIRONMENTALLY FRIENDLY
ALL NATURAL
% of concepts including the message/sustainable posiVoning
0.7% 0.8% 2.3% 4.8% 1.3% 0.5%
Source: BASES Line Extension DATABASE Past 10 years (2003-‐2008 vs. 2009-‐2013) All Categories and Countries
YOUR BUSINESS – AND REPUTATION – DEPEND ON IT
Copyrig
ht ©
2014 The
Nielse
n Co
mpany. Con
fiden
Val and
proprietary.
23
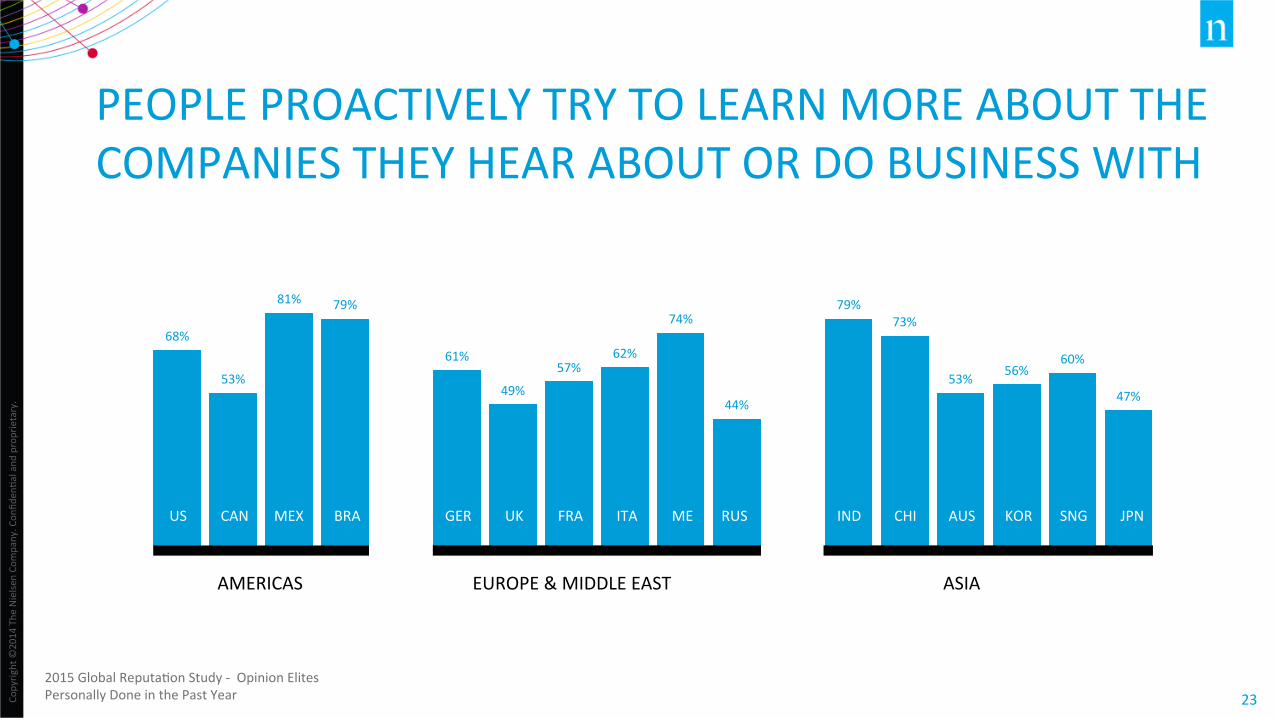
68%
53%
81% 79%
61%
49%
57% 62%
74%
44%
79% 73%
53% 56% 60%
47%
RUS AUS US
AMERICAS
CAN MEX BRA GER UK FRA ITA ME IND CHI KOR SNG JPN
EUROPE & MIDDLE EAST ASIA
2015 Global ReputaVon Study -‐ Opinion Elites Personally Done in the Past Year
PEOPLE PROACTIVELY TRY TO LEARN MORE ABOUT THE COMPANIES THEY HEAR ABOUT OR DO BUSINESS WITH
Copyrig
ht ©
2014 The
Nielse
n Co
mpany. Con
fiden
Val and
proprietary.
24
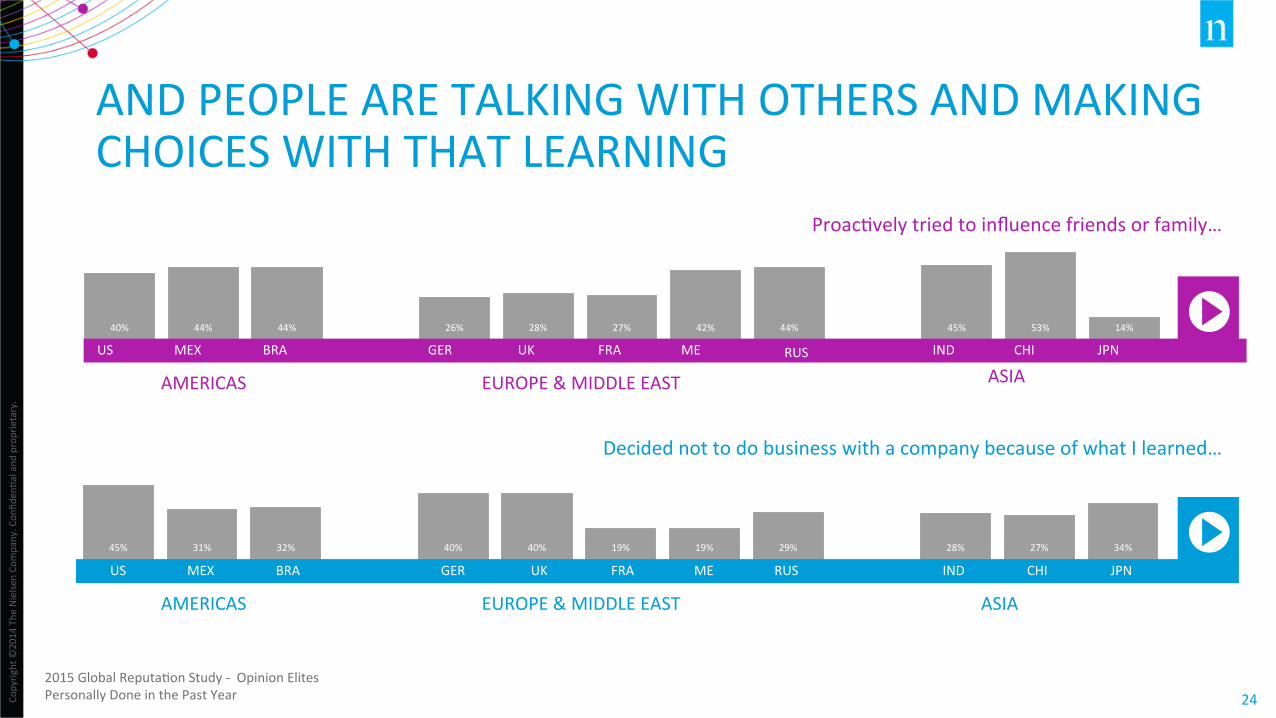
45% 31% 32% 40% 40% 19% 19% 29% 28% 27% 34%
AND PEOPLE ARE TALKING WITH OTHERS AND MAKING CHOICES WITH THAT LEARNING
40% 44% 44% 26% 28% 27% 42% 44% 45% 53% 14%
AMERICAS EUROPE & MIDDLE EAST ASIA
FIN SVC
IND US MEX BRA GER UK FRA ME CHI JPN
ProacVvely tried to influence friends or family…
Decided not to do business with a company because of what I learned…
AMERICAS EUROPE & MIDDLE EAST ASIA
RUS US MEX BRA GER UK FRA ME IND CHI JPN
2015 Global ReputaVon Study -‐ Opinion Elites Personally Done in the Past Year
RUS
Copyrig
ht ©
2014 The
Nielse
n Co
mpany. Con
fiden
Val and
proprietary.
25
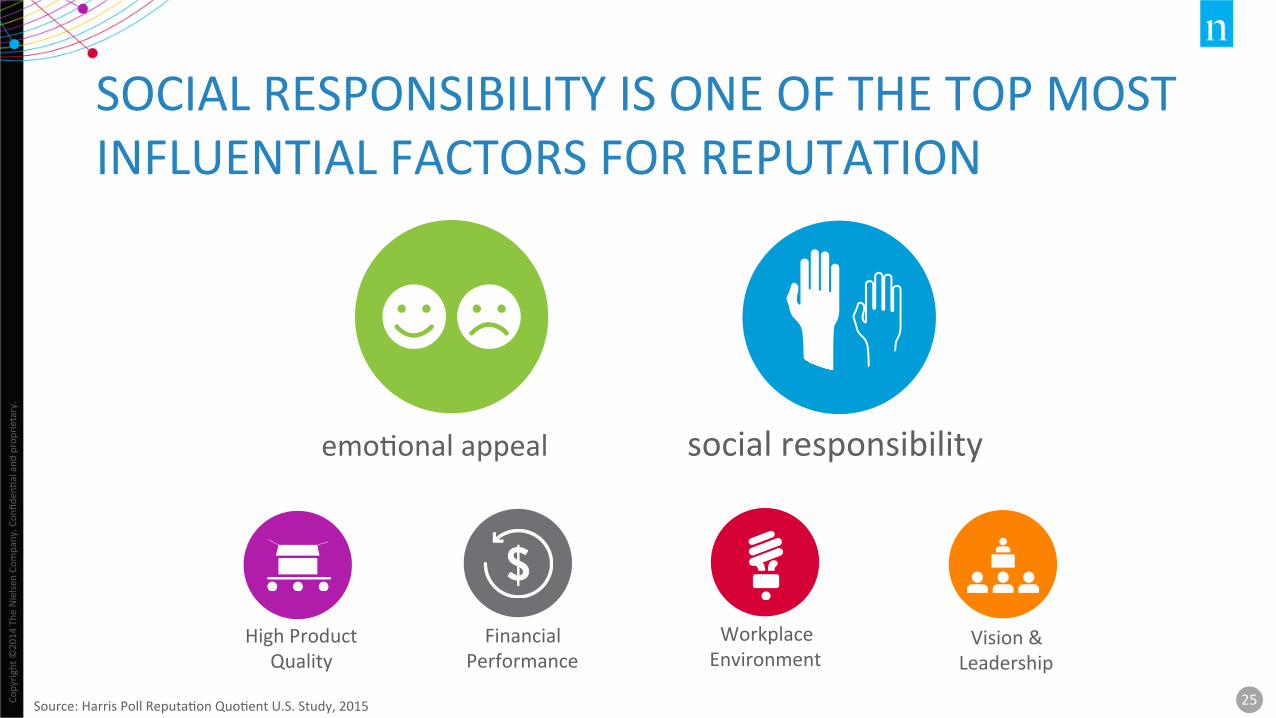
SOCIAL RESPONSIBILITY IS ONE OF THE TOP MOST INFLUENTIAL FACTORS FOR REPUTATION
emoVonal appeal
Financial Performance
Vision & Leadership
Workplace Environment
High Product Quality
social responsibility
Source: Harris Poll ReputaVon QuoVent U.S. Study, 2015
Copyrig
ht ©
2014 The
Nielse
n Co
mpany. Con
fiden
Val and
proprietary.
26
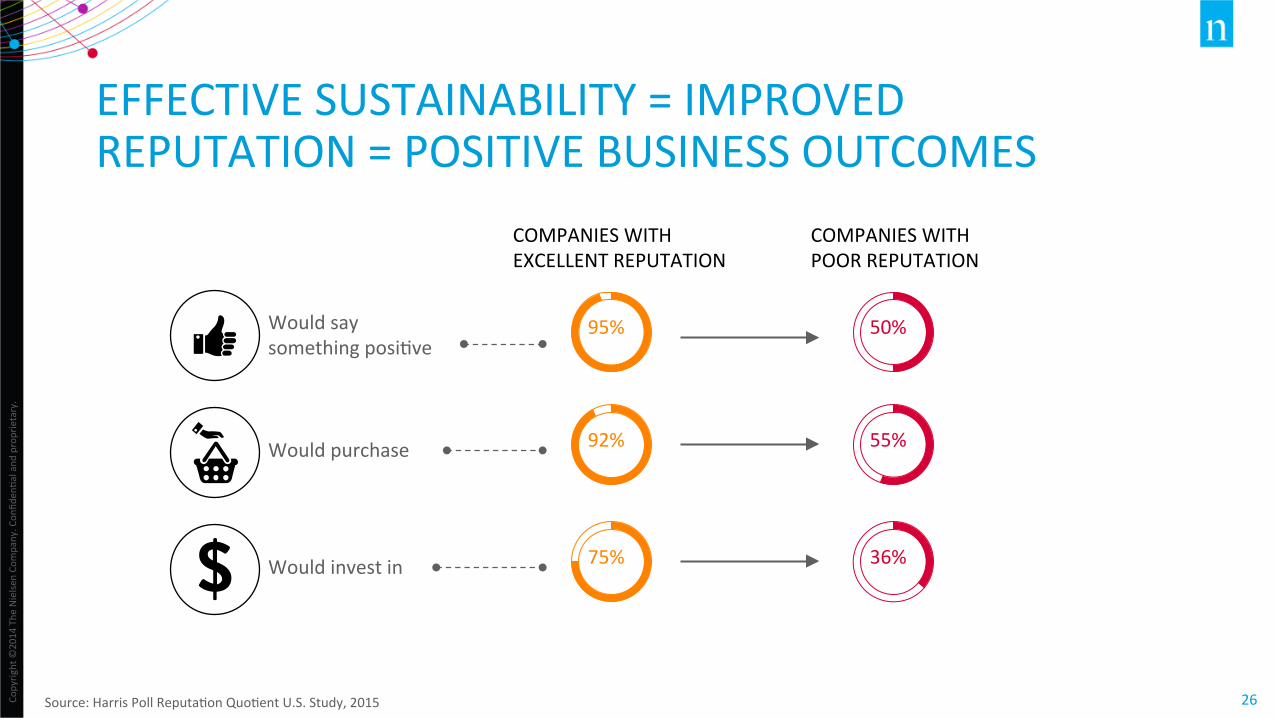
EFFECTIVE SUSTAINABILITY = IMPROVED REPUTATION = POSITIVE BUSINESS OUTCOMES
Source: Harris Poll ReputaVon QuoVent U.S. Study, 2015
Would say something posiVve
Would purchase
Would invest in
COMPANIES WITH EXCELLENT REPUTATION
COMPANIES WITH POOR REPUTATION
95%
92%
75%
50%
55%
36%
SUMMARY AND IMPLICATIONS
Copyrig
ht ©
2014 The
Nielse
n Co
mpany. Con
fiden
Val and
proprietary.
28 Copyrig
ht ©
2014 The
Nielse
n Co
mpany. Con
fiden
Val and
proprietary.
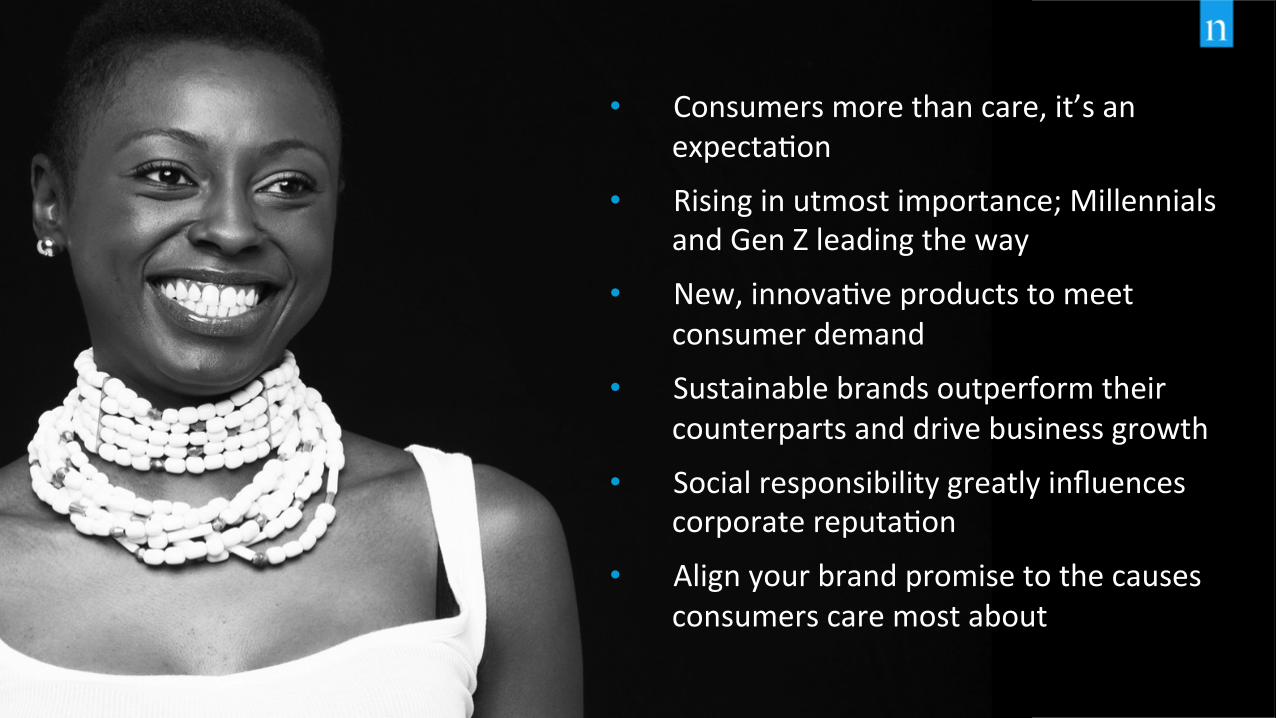
• Consumers more than care, it’s an expectaVon
• Rising in utmost importance; Millennials and Gen Z leading the way
• New, innovaVve products to meet consumer demand
• Sustainable brands outperform their counterparts and drive business growth
• Social responsibility greatly influences corporate reputaVon
• Align your brand promise to the causes consumers care most about
THANK YOU