the current status of outcomes assessment in marketing education
TRANSCRIPT

The Current Status of Outcomes Assessment in Marketing Education
Fred Miller Murray State University
Don Chamberlain Murray State University
Robert Seay Murray State University
Under pressure for accountability and in pursuit of valid measures of their performance, institutions of higher educa- tion are examining outcomes assessment as a means of pro- gram and institutional evaluation. Through a survey of chairs of marketing departments, this study explores the current status of outcomes assessment in marketing educa- tion in universities in the United States. It examines atti- tudes toward several potential measures of educational out- comes as well as current and anticipated collection patterns for these measures.
INTRODUCTION
Outcomes assessment is rapidly emerging as a significant new trend in the evaluation of educational programs. It involves measuring the results of the educational process rather than the inputs (student quality, faculty credentials, resources and facilities) to that process. The trend toward establishing outcomes assessment systems is being fueled by demands for educational accountability by federal and state governments as well as university program accrediting agencies (Lincoln 1990).
At the federal level, the Department of Education (1988) has published regulations requiring accrediting agencies to
Journal of the Academy of Marketing Science Volume 19, Number 4, pages 353-362. Copyright �9 1991 by Academy of Marketing Science. All rights of reproduction in any form reserved. ISSN 0092-0703.
include outcomes assessment components in their accredita- tion programs. Similar requirements are imposed on region- al accrediting agencies by the Council on Postsecondary Accreditation. More significantly for colleges of business, the American Assembly of Collegiate Schools of Business (1987) has endorsed this concept and is pursuing a pilot program to produce an outcomes assessment system for business schools.
Various state agencies and officials across the country are following this path as well. New Jersey, for example, is implementing a comprehensive assessment program (Ad- visory Committee to the College Outcomes Evaluation Pro- gram, 1987). In Tennessee, five percent of regular appropri- ations for higher education is awarded on the basis of performance on seleGted outcomes measures (Banta, 1986). Nearly two-thirds of the states have initiated outcomes mea- surement programs, and several others are considering them (Boyer 1987). Hutchings and Marchese (1990) examine programs in Virginia and New Jersey and identify the need to improve methodologies, overcome faculty resistance and clarify the intended use of outcomes data.
In their joint report on education, Time for Results: The Governors' 1991 Report on Education (1986), the nation's governors express their endorsement of this trend in state- ments such as these.
. Each college and university should implement sys- tematic programs that use multiple measures to as- sess undergraduate student learning. The informa- tion gained from assessment should be used to evaluate institutional and program quality. Infor- mation about institutional and program quality should also be made available to the public.
JAMS 353 FALL, 1991

THE CURRENT STATUS OF OUTCOMES ASSESSMENT MILLER, CHAMBERLAIN, IN MARKETING EDUCATION AND SEAY
. The higher education accrediting community should require colleges and universities to collect and utilize information about undergraduate stu- dent outcomes. Demonstrated levels of student learning and performance should be considered in granting institutional accreditation.
Several institutions, including Northeast Missouri State and Alverno College, have taken the lead in developing comprehensive, institution-specific assessment programs. This approach allows schools to tailor assessment programs specifically to their institutional missions, offering an alter- native to standardized, state level systems. To date, state authorities have generally responded favorably to this ap- proach.
At the level of program evaluation, Simpson (1990) and Courtenay and Holt (1990) discuss the need to identify the desired outcomes of continuing education programs and to use the those outcomes in program evaluation and subse- quent promotion. Faerman and Jablonka (1990) propose a survey method for evaluating outcomes of a Master of Pub- lic Administration program in terms of the overall impact of the program as well as the specific, work related skills of graduates. Kirby and Mullen (1990) describe efforts to mea- sure the results of an internship program cosponsored by the Durham University Business School and Shell UK. Pre- coded and open-ended questionnaires are used to measure participants' self-assessment of their entrepreneurial under- standing and abilities. Finally, Edwards and Brannen (1990) report on the assessment of MBA programs by AACSB member schools, which use testing procedures as well as student and employer evaluations in the process.
Within marketing education, relatively few studies of outcomes assessment appear. At the secondary and voca- tional level, Stone has examined the skills employers seek from program graduates (1985) and the characteristics which five different groups deem most valuable in market- ing education programs (1987). Wilkes and Amason (1983) focus on the area of environmental awareness of students. In their study, marketing students fared poorly in relation to students with other majors on an instrument measuring awareness of general economic, cultural, legal/political and demographic conditions and trends. Trawick and Nolan (1984) focus on satisfaction of graduates and their employ- ers rather than a test of students' knowledge. Theirs is a one time study which asks employers what qualities they seek in marketing graduates and their level of satisfaction with graduates they have hired. Similarly recent graduates are asked to assess their satisfaction with their undergraduate marketing training. Thomas (1981) describes an approach in which students' grades in the capstone marketing course serve as a measure of six of Bloom's (1956) educational objectives. This measure is used as the dependent variable in a multiple regression analysis which includes the other marketing courses in the curriculum, student overall GPA and the capstone course marketing instructor as independent variables. Student GPA is the only variable significantly related to performance in the capstone course, reinforcing the author's view of the necessity for substantial revision of the marketing curriculum. Cooper and Leventhal (1979) describe a comprehensive, longitudinal assessment pro-
cedure which gathers data on all students, not simply mar- keting majors. The system tracks student satisfaction while in school and after graduation in a variety of areas. The results are used to make curriculum and administrative im- provement, and thus becomes a marketing tool for the in- stitution.
In sum, these studies illustrate a variety of approaches to outcomes assessment. However, each focuses on a different type of measurement and most are one time studies related to particular schools. No study of the overall outcomes measurement practices of marketing education in higher education has yet been undertaken. This is the task of the current study.
METHODOLOGY
To assess the current state of outcomes measurement in marketing programs, we identified the measures most com- monly mentioned in the literature. We incorporated these measures into a questionnaire (Appendix 1) which we sent to the chairs of the 662 marketing programs listed in Peter- son's Guide to Four Year Colleges: 1989. We asked chairs to rate the usefulness of each of the measures and tell us if it is currently being collected at his or her institution. ~ We also included some demographic questions for classification pur- poses, questions on chairs' perceptions of trends in this area, and an open-ended question probing for measures not included in the questionnaire. Chairs from 211 institutions returned the instrument, a response rate of 31.8%. A profile of the resulting sample is contained in Table 1.
To facilitate interpretation in crosstabulation procedures,
TABLE 1 Profile of Respondents
Size of Campus (Number of Percentage Regional Percentage Students) of Sample Accreditation of Sample <: 1,500 15.7% Southern 35.8% 1,501-2,500 11.9% North Central 37.3% 2,501-5,000 15.2% New England 4.4% 5,000-10,000 26.2% Middle States I 1.3% 10,001-15,000 11.0% Western 7.8% 15,001-25,000 12.4% Northwest 3.4% > 25,000 7.6%
n = 210 n = 204
Highest Degree AACSB Offered Accreditation Baccalaureate 20.5% Masters 53.3% Doctorate 26.2%
n = 210
Undergraduate No Yes
n = 204
Graduate No Yes
n = 202
61.4% 38.6%
66.0% 34.0%
JAMS 354 FALL, 1991

THE CURRENT STATUS OF OUTCOMES ASSESSMENT MILLER, CHAMBERLAIN, IN MARKETING EDUCATION AND SEAY
TABLE 2 Usefulness Scores and Collection Frequencies
Var Usefulness # Measure Score % Coil
1 General education tests 3.88 61.2% 2 Critical thinking tests 5.01 24.8% 3 Test in major field 5.12 34.7% 4 Communication skills tests 4.79 35.5% 5 College GPA 4.77 89.7% 6 Retention and graduation rates 4.64 85.6% 7 Avg time to complete a degree 3.40 53.1% 8 Job placement rates 5.23 66.3% 9 Senior seminar results 4.94 28.8%
I0 Graduate admission tests 4.72 42.3% 11 % grads entering grad schools 4.13 37.2% 12 Alumni satisfaction 5.45 64.0% 14 Achievements of recent grads 5.37 52.5% 15 % of grads w/ jobs in specified time 4.64 37.9% 16 % of grads getting first job choice 4.23 15.2% 17 Avg starting salary of grads 4.50 45.5% 18 Employers' satisfaction w/grads 5.66 18.8%
we collapsed the size of campus variable into three catego- ries. They are (I) 2,500 or fewer students (27.6% of the sample), (2) 2,501 to 10,000 students (41.4% of the sam- ple) and (3) more than 10,000 students (31% of the sample).
FINDINGS
Raw Scores and Rankings
The raw usefulness scores and the percentage of respon- dents collecting each variable are listed in Table 2. Among the usefulness scores, only two variables (V 1 : General edu- cation tests and V7: Average time to complete a degree) have mean scores below 4.0, the midpoint of the scale range. This would indicate that respondents find value in a variety of outcomes measures, but have not developed a consensus which clearly eliminates any measures.
Question 21 probed for outcomes measures not covered in the questionnaire that respondents either currently collect or perceived to be useful but do not currently collect. Twen- ty six respondents (12.3% of the sample) identified mea- sures in answer to this question. The measures that were mentioned are summarized in Table 3.
Table 4 ranks the variables by their means on the useful- ness scale. In this table, patterns of perceived value emerge. Seven measures have mean values of 4.94 or above. An- other six have mean values which fall between 4.50 and 4.79, while the remaining four have means of 4.23 or be- low. For the overall sample, then, the perceived value of these 17 measures falls into three distinct tiers.
Table 5 ranks the 17 measures on the percentage of schools which collect them. Seven variables are collected by 52.5% or more of respondents. Another six are collected by between 34.7% and 45.5% of respondents. The remain- ing four are collected by 28.8% or fewer of respondents.
Comparison of the most highly valued measures with the most commonly collected measures yields interesting re-
TABLE 3 Other Measures Used or Perceived as Useful
Schools U~'ing Measure or Mentioning
Exit interviews with graduating seniors Student performance in regional/national case
or simulation game competitions Comprehensive achievement exam in last
semester Student evaluations of courses, texts,
instructors, affects and beliefs about program--current, 5 years
AACSB-CCAP outcomes exam covering CBK courses
Locally developed exams in major field Results of student internships--employer
evaluations Types of positions obtained by graduates Student projects within marketing courses Close contact between graduates and major
processor Discussions of grads with AMA members and
other practitioners Graduates who report using course materials in
career Graduate who recommend the program to
prospective students GPA in major
suits. Of the seven most highly valued measures, only three (V8: Job placement rates, VI2: Alumni satisfaction, VI4: Achievements of recent graduates) are among the seven most collected measures. Three of the most highly valued measures (V9: Senior seminar results, V2: Critical thinking skills, V18: Employers' satisfaction with graduates) are among the least frequently collected ones. Conversely two of the seven most frequently collected measures (V 1 : Gen- eral education tests, V7: Average time to complete a degree) have the lowest perceived usefulness scores in the study. This suggests a substantial mismatch between the outcomes measures deemed most useful and those which are actually collected.
TABLE 4 Ranking by Usefulness Score
Var Usefulness # Measure Score Rank
18 Employers' satisfaction w/ grads 5.66 I 12 Alumni satisfaction 5.45 2 14 Achievements of recent grads 5.37 3 8 Job placement rates 5.23 4 3 Test in major field 5.12 5 2 Critical thinking tests 5.01 6 9 Senior seminar results 4.94 7 4 Communication skills tests 4.79 8 5 Collegc GPA 4.77 9
10 Graduate admission tests 4.72 10 15 % of grads w/ jobs in specified time 4.64 I I 6 Retention and graduation rates 4.64 I 1
17 Avg starting salary of grads 4.50 13 16 % of grads getting first job choice 4.23 14 l 1 % grads entering grad schools 4.13 15
1 General education tests 3.88 16 7 Avg time to complete a degree 3.40 17
JAMS 355 FALL, 1991
THE CURRENT STATUS OF OUTCOMES ASSESSMENT MILLER, CHAMBERLAIN, IN MARKETING EDUCATION AND SEAY
TABLE 5 Ranking by Coalition Frequency
Var # Measure % Coil RANK
5 College GPA 89.7% 1 6 Retention and graduation rates 85.6% 2 8 Job placement rates 66.3% 3
12 Alumni satisfaction 64.0% 4 1 General education tests 61.2% 5 7 Avg time to complete a degree 53.1% 6
14 Achievements of recent grads 52.5% 7 17 Avg starting salary of grads 45.5% 8 10 Graduate admission tests 42.3% 9 15 % of grads w/ jobs in specified time 37.9% 10 11 % grads entering grad schools 37.2% 11 4 Communication skills tests 35.5% 12 3 Test in major field 34.7% 13 9 Senior seminar results 28.8% 14 2 Critical thinking tests 24.8% 15
18 Employers' satisfaction w/grads 18.8% 16 16 % of grads getting first job choice 15.2% 17
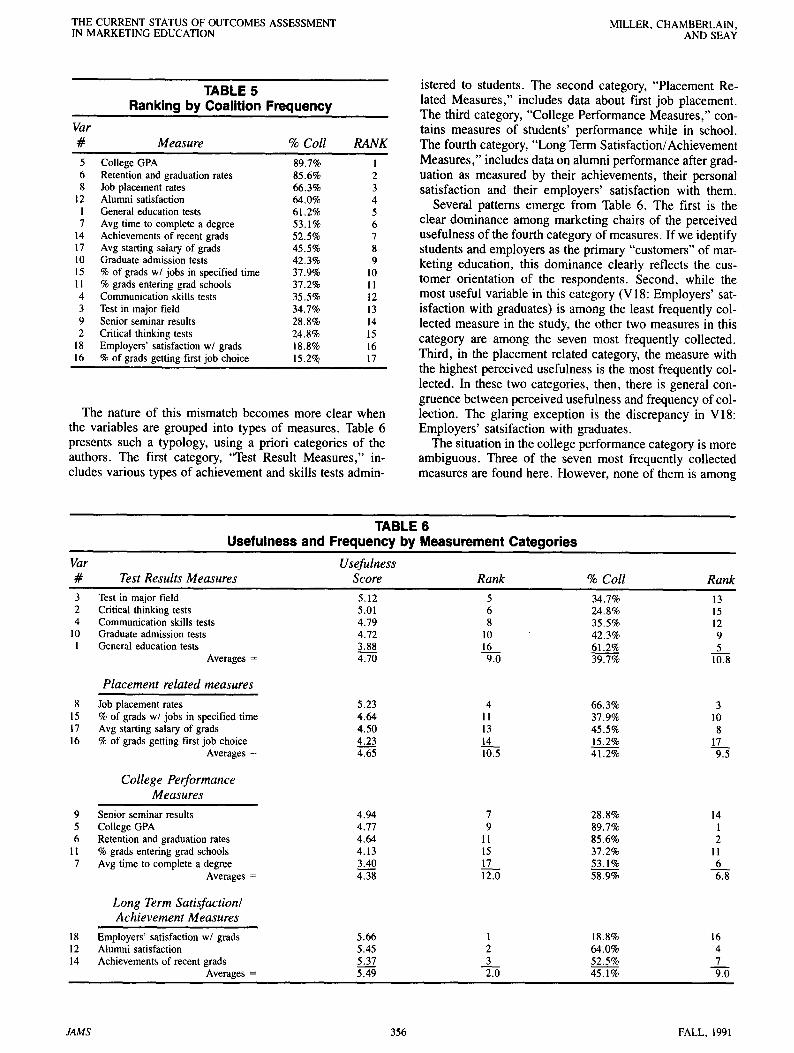
The nature of this mismatch becomes more clear when the variables are grouped into types of measures. Table 6 presents such a typology, using a priori categories of the authors. The first category, "Test Result Measures," in- cludes various types of achievement and skills tests admin-
istered to students. The second category, "Placement Re- lated Measures," includes data about first job placement. The third category, "College Performance Measures," con- tains measures of students' performance while in school. The fourth category, "Long Term Satisfaction/Achievement Measures," includes data on alumni performance after grad- uation as measured by their achievements, their personal satisfaction and their employers' satisfaction with them.
Several patterns emerge from Table 6. The first is the clear dominance among marketing chairs of the perceived usefulness of the fourth category of measures. If we identify students and employers as the primary "customers" of mar- keting education, this dominance clearly reflects the cus- tomer orientation of the respondents. Second, while the most useful variable in this category (V 18: Employers' sat- isfaction with graduates) is among the least frequently col- lected measure in the study, the other two measures in this category are among the seven most frequently collected. Third, in the placement related category, the measure with the highest perceived usefulness is the most frequently col- lected. In these two categories, then, there is general con- gruence between perceived usefulness and frequency of col- lection. The glaring exception is the discrepancy in VI8: Employers' satsifaction with graduates.
The situation in the college performance category is more ambiguous. Three of the seven most frequently collected measures are found here. However, none of them is among
TABLE 6 Usefulness and Frequency by Measurement Categories
Var Usefulness # Test Results Measures Score Rank % Coil Rank
3 Test in major field 5.12 5 34.7% 13 2 Critical thinking tests 5.01 6 24.8% 15 4 Communication skills tests 4.79 8 35.5% 12
10 Graduate admission tests 4.72 10 42.3% 9 1 General education tests 3,88 16 61.2% 5
Averages = 4.70 9.0 39.7% 10.8
Placement related measures
8 Job placement rates 5.23 4 66.3% 3 15 % of grads w/ jobs in specified time 4.64 11 37.9% 10 17 Avg starting salary of grads 4.50 13 45.5% 8 16 % of grads getting first job choice 4.23 14 15.2% 17
Averages = 4.65 10,5 41.2% 9.5
College Performance Measures
9 Senior seminar results 4.94 7 28.8% 14 5 College GPA 4.77 9 89.7% 1 6 Retention and graduation rates 4.64 11 85.6% 2
11 % grads entering grad schools 4.13 15 37.2% 11 7 Avg time to complete a degree 3.40 17 53.1% 6
Averages = 4.38 12.0 58.9% 6.8
Long Term Satisfaction/ Achievement Measures
18 Employers' satisfaction w/grads 5.66 1 18.8% 16 12 Alumni satisfaction 5.45 2 64.0% 4 14 Achievements of recent grads 5.37 ~ 52.5% 7
Averages = 5.49 2.0 45.1% 9.0
JAMS 356 FALL, 1991

THE CURRENT STATUS OF OUTCOMES ASSESSMENT MILLER, CHAMBERLAIN, IN MARKETING EDUCATION AND SEAY
TABLE 7 Type of Institution and Highest Degree Offered
Var ONEWAY CHI SQUARE
# Measure Public Private Sig Public Private Sig
6 Retention and graduation rates 4.44 4,98 * 8 Job pIacement rates 5.02 5,50 *
I 1 % grads entering grad schools 29.4% 46.8% * 12 Alumni satisfaction 5,26 5.65 * 15 % of grads w/ jobs in specified time 29,7% 48,8% *
Highest Degree Offered
ONEWAY CHI- SQ UARE
BACC MAST DOCT SIG;Sch<. 10 BACC MAST DOCT SIG
3 Test in major field 41.0% 28.0% 44.0% ** 9 Senior seminar results 5.55 4.84 4.67 *;1/2,1/3
15 % of grads w/ jobs in specified time 62.0% 31.0% 31.0% * 16 % of grads getting first job choice 26.0% 11.0% 14.0% ** 17 Avg starting salary of grads 44.0% 40.0% 60.0% **
�9 p < .05; **p < .10 For Scheffe tests, p < .10
the seven measures in the top tier of perceived usefulness. Moreover, the measure with the highest usefulness score in this category (V9: Senior seminar results) is also the least frequently collected. On the other hand, two measures from the second tier of usefulness scores (V5: College GPA, V6: Graduation and retention rates) are the two most frequently collected measures in the study.
The clearest discrepancy between perceived usefulness and frequency of collection occurs in the test results catego- ry. The two measures in the top tier of perceived usefulness (V3: Test in major field, V2: Critical thinking skills) are the least frequently collected in this category. Conversely, the most frequently collected variable here (V 1: General educa- tion tests) has one of the lowest perceived usefulness scores in the study.
In short, the discrepancy between perceived usefulness and frequency of collection occurs primarily in the College Performance and Test Results categories and in VI8: Em- ployers's satisfaction with graduates.
Differences among Types of Schools
To examine variations among different types of schools, we compared the perceived usefulness and frequency of collection measures across four categories of institutional demographics. These categories are; (l) size of campus, (2) highest degree offered, (3) public or private status and (4) AACSB accreditation. 2
We used analysis of variance (the ONEWAY procedure in SPSS PC + ) to compare the perceived usefulness mea- sures. When appropriate, we used Scheffe's test (p = . 10) to test pairs of group means. We selected this measure due to the unequal size of the groups. We used the SPSS PC + CROSSTABS procedure and Chi square test to analyze the frequency of collection data. The statistically significant results are reported in Tables 7, 8 and 9.
For only three of the 17 perceived usefulness measures are there significant differences between public and private institutions. For all three, private institutions report a higher
TABLE 8 Size of Institution
ONEWAY CHI SQUARE
Var 2,500 to 2,500 to # Measure < 2,500 10,000 > 10,000 SIG;Sch < .10 < 2,500 10,000 > 10,000 SIG
1 General education tests 33,0% 280% 13.0% * 3 Test in major field 5,36 5,20 4.78 **;1/3 6 Retention and graduation rates 5.04 4.77 4.14 *;l /3,2/3 9 Senior seminar results 35.0% 33_0% 16.0% *
12 Alumni satisfaction 5.50 5.65 5.12 **;2/3 14 Achievements of recent grads 5.62 5,51 4.97 *;1/3,2/3 15 % of grads w/ jobs in specified time 4,89 4,80 4.23 *;1/3 16 % of grads getting first job choice 4,38 4.40 3.86 **; 17 Avg starting salary of grads 290% 490% 55,0% *
�9 p < .05; **p < .10 For Scheffe tests, p < .10
JAMS 357 FALL, 1991

THE CURRENT STATUS OF OUTCOMES ASSESSMENT MILLER, CHAMBERLAIN, IN MARKETING EDUCATION AND SEAY
TABLE 9 Accreditation
ONEWAY CHI-SQUARE Var # Measure ACC Non-ACC Sig ACC Non-ACC Sig
1 Genera[ education tests 3,53 2 Critical thinking tests 6 Retention and graduation rates 4.12 8 Job placement rates 4.99
11 % grads entering grad schools 14 Achievements of recent grads 5.00 15 % of grads w/ jobs in specified time 4.19 16 % of grads getting first job choice 3.90 18 Employers' satisfaction w/ grads 5.35
4.11 * 46.6% 70.9% * 17.6% 30.0% * *
4.97 * 77.0% 91.5% * 5.38 **
24.7% 45.2% * 5.59 * 4.92 * 24.0% 47.4% * 4.42 * 5.84 *
*p < .05; **p < .10
score. Only two measures reveal significant differences in frequency of collection, with a higher percentage of private schools collecting both.
For the highest degree offered classification, one measure reveals a significant difference in perceived usefulness scores, with baccalaureate institutions scoring highest. Four measures have significant differences for frequency of col- lection, with baccalaureate schools reporting the highest percentage on two and doctoral institutions on the other two .
For six of the 17 measures significant differences in per- ceived usefulness scores emerge for schools of differing size. Scheffe's test for differences in group means indicates that these differences occur between schools with more than 10,000 students and one or both groups of smaller institu- tions. Three measures reveal significant differences in fre- quency of collection. For two measures, smaller schools report the higher collection rates. For the third, (VI7: Aver- age starting salary of graduates) larger schools report a higher frequency of collection.
For seven of the 17 measures, the perceived usefulness scores of non-accredited schools are significantly higher than those of accredited schools. For five of the measures, the frequency of collection by non-accredited schools is significantly higher than that for accredited schools.
Clearly size of institution and AACSB accreditation are the institutional demographic variables most strongly related with the evaluation and collection of outcomes measures in this study. Schools with over 10,000 students and schools with undergraduate AACSB accreditation do not value these measures as highly nor collect them as frequently as do smaller or non-accredited institutions. The distinction is much stronger among perceived usefulness scores (with sig- nificant differences for 13 of 34 measures) than for frequency of collection (with significant differences for eight of 34 measures, one of those reflecting a higher frequency of collection among the largest schools in the study).
These findings reflect the strong correlation between size and AACSB accreditation. Sixty percent of the undergrad- uate AACSB accredited schools in the study have more than 10,000 students. Only 11 percent of non-accredited schools fall into this size category. Conversely, only 6.4 percent of undergraduate AACSB accredited schools have
fewer than 2,500 students, while 42 percent of non- accredited schools do.
The Effects of Formal Outcomes Policies
Of the 211 respondents, 47 or 22.3 percent of the sample, reported that their institutions had formal outcomes assess- ment policies. Using the procedures described above, we compared these schools with those that lack a formal policy. Table 10 reports the results of this analysis.
Only two of the 17 measures reveal significant differ- ences in perceived usefulness between schools which have formal policies and those which do not. Of these, schools with a formal policy report a higher value on one measure and a lower score on the other. However, for ten of the 17 variables schools with a formal policy report a significantly higher frequency of collection. In fact, the existence of a formal policy is the variable most highly associated with frequency of collection in this study.
Do the schools with formal policies form the cutting edge of outcomes assessment in marketing education? In the con- text of this study, we can rephrase that question in two ways. First, we can consider the discrepancy between the most highly valued measures and the most frequently col- lected. That is, do schools with formal policies do a better job of overcoming this discrepancy? Second, we can con- sider the a priori types of measures identified in Table 6. Do institutions with formal policies do a better job of collecting a balanced portfolio of measures?
Analysis of the first question produces mixed results. Recall from Tables 4 and 5 that of the seven measures with the highest perceived usefulness scores, only three are among the seven most frequently collected. The other four are among the least frequently collected. For three of these four measures, the frequency of collection is significantly higher for institutions with a formal policy than for those without. This would suggest that these schools are doing a better job of gathering highly valued, infrequently collected data. On the other hand, these schools are also collecting more data that is not perceived as highly useful. Of the six measures with the lowest perceived usefulness scores, five show a significantly higher frequency of collection for schools with formal policies than for those without. Thus
JAMS 358 FALL, 1991

THE CURRENT STATUS OF OUTCOMES ASSESSMENT MILLER, CHAMBERLAIN, IN MARKETING EDUCATION AND SEAY
TABLE 10 Presence/Absence of Written Policy
ANOVA CHI-SQUARE Val" # Measure Absent Present Sig Absent Present Sig
1 General education tests 3 Test in major field 6 Retention and graduation rates 7 Avg time to complete a degree 8 Job placement rates 9 Senior seminar results
10 Graduate admission tests 11 % grads entering grad schools 15 % of grads w/jobs in specified time 17 Avg starting salary of grads 18 Employers' satisfaction w/ grads
5.05 5.47 * *
4.87 4.40 **
55.0% 77.8% * 27.5% 58.7% * 82.7% 95.5% ** 46.6% 75.6% * 62.0% 82.2% * 24.3% 41.9% *
32.4% 55.8% * 33.8% 51.2% ** 38.9% 65.9% * 14.8% 32.6% *
*p < .05; **p < .10
these schools seem to be collecting more measures across the board rather than focusing their efforts on the most highly valued measures.
Consideration of the second question involves analysis of Table 6. Of the ten measures for which these schools exhibit a significantly higher frequency of collection, seven fall within the Placement Related and College Performance categories. On the other hand, at least one of these ten measures falls in each of the four categories. In addition, these ten also include the measure with the highest per- ceived usefulness score in each of the four categories. Thus, while not quantitatively balanced across these four catego- ries, the outcomes measurement portfolio of schools with written policies does do a better job of collecting the most useful measures from each of them.
CONCLUSIONS
In summary, this study lends support to the following conclusions.
1. Marketing chairs report a generally high level of perceived usefulness for the measures in the study, with seven measures more highly valued than the rest.
2. A discrepancy exists between the measures with the highest perceived usefulenss and those most frequently collected.
3. Market based measures are perceived to be more useful than measures in the other three categories.
4. Chairs at large schools (> 10,000 students) and AACSB accredited schools tend to view outcomes measures as less useful than do their counterparts at smaller, non-accredited schools. With one ex- ception (VI7: Average starting salary of grads), they also report a lower frequency of collection.
5. Chairs at schools with written outcomes measure- ment policies do not perceive these measures as more useful than do their counterparts at schools which lack written policies.
6. Schools with written outcomes measurement pol- icies collect several measures with a significantly higher frequency than do schools which lack writ- ten policies. These include several highly valued, infrequently collected measures, but are not con- centrated there. They include measures from each category in the study, including the highest valued measure in each category.
7. Responses to the open-ended question do not re- veal measures that are collected more frequently than those contained in the questionnaire.
These conclusions summarize the current status of out- comes assessment in marketing education. These data also provide some indications of future trends in this area. First, chairs predict greater attention to this effort in the future. Fully 70.1 percent believe that their departments will en- hance their outcomes assessment efforts in the future.
Second, no clear pattern of leadership in this area emerges from the study. Schools with written policies ex- hibit significantly stronger assessment programs. However, the measures they collect with significantly greater frequen- cy exhibit balance, but not focus. Moreover, their programs are not based upon greater perceived usefulness of the mea- sures they employ, hence their philosophical underpinnings are not obvious.
Third, the movement toward more extensive outcomes assessment programs will involve controversy and trade- offs. Several respondents in this study expressed various levels of dissatisfaction with; (1) the measures included, (2) the "shallowness" of assessment efforts, and (3) the implication that outcomes assessment is not accomplished by traditional evaluation, testing and grading procedures. This study was not designed to measure the breadth of these views, but it did produce evidence of their depth of feeling. Additionally, tension could emerge between the broader, longer term, market oriented measures valued highly by marketing chairs and the narrower, shorter term, academ- ically oriented measures sought by university administrators and public policy makers.
JAMS 359 FALL, 1991

THE CURRENT STATUS OF OUTCOMES ASSESSMENT MILLER, CHAMBERLAIN, IN MARKETING EDUCATION AND SEAY
APPENDIX 1 Study of Student Outcomes Measures
Par t A: Demographic Data: Please indicate the correct description of your institution.
Size of campus: _ _ Under 1500 students
1,501 to 2,500 _ _ 2,501 to 5,000 _ _ 5,001 to 10,000
10,001 to 15,000 15,001 to 25,000
_ _ Above 25,000
Highest Degree Offered: _ _ Baccalaureate _ _ Masters _ _ Masters Plus _ _ Doctorate
AACSB Acredited: Type of Institution: Undergr: Grad: _ _ . Public _ _ Yes ..... Yes _ _ Private _ _ No No _ _ Other
Regional Accrediting Agency: _ _ Southern Association of
Colleges and Schools North Central Assoc. of Colleges and Schools
_ _ New England Association of Schools and Colleges
_ _ Middle States Assoc. of Colleges and Schools Western Association of Schools and Colleges
_ _ Northwest Association of Schools and Colleges
Part B: Student Outcomes Measures The following is a list of student outcomes measures frequently cited as potentially important indicators of program
effectiveness. Some of these measures pertain to course instruction delivered outside the marketing or business area, but which nonetheless represents an integral part of the marketing program.
Please indicate the degree to which you believe each student outcome measure would be useful in assessing the marketing program's effectiveness. Then, indicate whether or not your institution or department currently collects information regarding that particular measure. Circle the appropriate responses.
Not Very Currently Useful Useful Collected? + . . . . . . . . . . . . . . . . . . . . . . . +
1. Student scores on tests of general education (ACT COMP, locally developed test, etc.).
1 2 3 4 5 6 7 Yes No
2. Student scores on tests that indicate their ability to apply general or 1 2 3 4 5 6 7 Yes No specialized knowledge to a problem and to implement a solution (critical thinking skills).
3. Student scores on tests in the major field (standardized, locally devel- 1 2 3 4 5 6 7 Yes No oped exams, etc.).
4. Student scores on tests that indicate their ability to read, write, speak 1 2 3 4 5 6 7 Yes No or listen.
5. College grade point average of students.
6. Student retention and graduation rates.
7. Average amount of time it takes a student to earn a degree.
8. Job placement rates.
1 2 3 4 5 6 7 Yes No
1 2 3 4 5 6 7 Yes No
1 2 3 4 5 6 7 Yes No
1 2 3 4 5 6 7 Yes No
.
10.
Results of senior seminars or similar offerings in which students near graduation are evaluated for marketing skills and knowledge.
Results of graduate and professional school admissions exams (GMAT, GRE, LSAT, etc.).
1 2 3 4 5 6 7 Yes No
1 2 3 4 5 6 7 Yes No
11. Percentage of graduates enrolling in graduate school.
12. Alumni satisfaction with the program, per surveys, interviews, etc.
1 2 3 4 5 6 7 Yes No
1 2 3 4 5 6 7 Yes No
JAMS 360 FALL, 1991

THE CURRENT STATUS OF OUTCOMES ASSESSMENT MILLER, CHAMBERLAIN, IN MARKETING EDUCATION AND SEAY
Not Very Currently Useful Useful Collected? + . . . . . . . . . . . . . . . . . . . . . . . +
13. Achievements of recent graduates. 1 2 3 4 5 6 7 Yes No
14. Percentage of graduates employed within a certain period of time 1 2 3 4 5 6 7 Yes No after graduation.
15. Percentage of graduates receiving job of their first choice. 1 2 3 4 5 6 7 Yes No
16. Average starting salary of graduates. 1 2 3 4 5 6 7 Yes No
17. Employers' satisfaction with the performance of graduates, per sur- 1 2 3 4 5 6 7 Yes No veys, interviews, etc.
Part C: General
Please select the most appropriate answer for the following questions.
19. Does your institution have a stated policy requiring the collection of student outcomes data?
_ _ Yes _ _ No 20. In your opinion, will your department enhance its efforts to assess student outcomes in the near future?
_ _ Yes _ _ No 21. Are there other outcome measures that your department currently uses or that you believe would be useful?
_ _ Yes _ _ No (If yes, please list them below or attach them to this questionnaire.)
Currently use:
Don't use but might be useful:
NOTES
1. The instrument is designed for use with chairs from various disci- plines. In the complete questionnaire, measure 13 relates to results from professional certification tests, a relevant measure for ac- counting and finance chairs, but not for marketing chairs. For this reason, it does not appear on the final marketing questionnaire in Appendix 1. To preserve continuity across all the data sets of this study, the variable designation VI3 is reserved for this measure. Thus no measure VI3 appears in the results or discussion of this paper.
2. We use undergraduate accreditation as the defining variable for this purpose. No respondents in the sample reported being accredited at the graduate level and not at the undergraduate level. Thus the undergraduate accreditation category includes all of these schools as well as eight schools accredited only at the undergraduate level.
REFERENCES
Advisory Committee to the College Outcomes Evaluation Program. 1987. Report to the New Jersey Board of Higher Education from the Advisory Committee to the College Outcomes Evaluation Program. New Jersey Board of Higher Education.
American Assembly of Collegiate Schools of Business. 1987. Outcomes Measurement Project: Phase 111 Report. St Louis.
- - . 1986. Accreditation Council Policies, Procedures and Standards. St Louis.
Banta, Trudy W. 1986. Performance Funding in Higher Education: A Critical Analysis of Tennessee's Experience. National Center for Higher Education Management Systems, pp. 1-10.
Boyer, Carol M. et al. 1987. "Assessment and Outcomes Measurement: A View from the States." ECS Working Papers. Education Commission of the States.
JAMS 361 FALL, 1991

THE CURRENT STATUS OF OUTCOMES ASSESSMENT MILLER, CHAMBERLAIN, IN MARKETING EDUCATION AND SEAY
Chamberlain, Don and Robert Seay. "Outcomes Assessment: A New Chal- lenge for Business Educators." Journal of Education for Business (Feb- mary).
Cooper, Edward H. and Richard C. Leventhal. 1979. "Outcomes Re- search: Its Function as a Marketing Tool." Paper presentation for the Association for Instructional Research.
Courtenay, Brad and Margaret E. Holt. 1990. "Using Impact Evaluations to Improve Marketing Plans in Continuing Higher Education." Journal of Continuing Higher Education 38 (Winter): 10-15.
Department of Education. 1988. "Secretary's Procedures and Criteria for Recognition of Accrediting Agencies." Federal Register 53 (July): 127.
Edwards, Donald E. and Dalton E. Brannen. 1990. "Current Status of Outcomes Assessment at the MBA Level." Journal of Education for Business 65 (February): 206-212.
Faerman, Sue R. and Kary D. Jablonka. 1990. "Outcome Assessment: A Tool for Enhancing Quality, Relevance and Accountability." Interna- tional Journal of Public Administration 13 ( 1,2): 257-277.
Hutchings, Patricia A. and Theodore J. Marchese. 1990. "Assessing Cur- ricular Outcomes--The US Experience." Higher Education Journal 2 (March): 20-36.
Kirby, David A. and David Mullen. 1990. "Developing Enterprising Grad- uates." Journal of European Industrial Training 14 (2): 27-32.
Lincoln, Yvonna S. 1990. "Program Review, Accreditation Processes, and Outcomes Assessment: Pressures on Institutions of Higher Education." Evaluation Practice 11 (Feb): 13-23.
National Governors Association, Center for Policy Research and Analysis. 1986. Time for Results: The Governors' 1991 Report on Education. Washington, D.C.
Robon, Nancy C. 1978. "A Comparative Study of the First Full Time Job and Salary after Graduation for Selected Vocational/Technical/Profes- sional Business Graduates from High SchooI, Two-Year Colleges, and Four-Year Colleges." Paper presentation for the Association for Institu- tional Research Forum.
Simpson, Edwin L. 1989. "A Challenge for Higher Education." Adult Learning 1 (26 September): 18-19.
Stone, James R. III. 1985. "Outcome Standards for Secondary Marketing Education." Marketing Educators" Journal 11 (Fall): 32-41.
�9 1987. "Identifying Product Attributes for Marketing Education
Product Design: Implications for the Marketing of Marketing Educa- tion." Marketing Educators' Journal 13 (Fall): 46-62.
Thomas, R. J. 1981. "Academic Program Effectiveness: A Model Building Approach." Proceedings. American Marketing Association, pp. 464- 467.
Trawick, I. F. and J. J. Nolan. 1984. "Are We Training Marketing Gradu- ates for the Marketplace?" Proceedings. Southern Marketing Associa- tion, pp. 239-242.
Wilkes, R. E. and R. D. Amason. 1983. "On the Relative Unawareness of Marketing Majors to Business Environments." Proceedings. American Marketing Association, pp. 174-177.
ABOUT THE AUTHORS
Fred Miller is Associate Professor of Marketing at Murray State University. He received his Ph.D. from Temple Uni- versity. His research interests are international marketing, strategic marketing and marketing education. His work has appeared in International Marketing Review and the Journal o f Market ing Education.
Robert A. Seay is Associate Professor of Accounting at Murray State University. He received his D.B.A. from Mis- sissippi State University in 1986. His research interests in- clude accounting education, accounting history and man- agerial accounting.
Don H. Chamberlain is Assistant Professor of Accounting at Murray State University. He received his Ph.D. from the University of Kentucky. His research interests include gov- ernmental accounting and accounting education.
JAMS 362 FALL, 1991