the data decision-usefulness theory: an exploration of
TRANSCRIPT

The Data Decision-Usefulness Theory:An Exploration of Post-1998
Reported Products and Services Segment Data Decision Usefulness
A DissertationPresented to
The Faculty of the C. T. Bauer College of BusinessUniversity of Houston
In Partial FulfilmentOf the Requirements for the Degree
Doctor of Philosophy
ByCynthia Diane Tollerson
C. T. Bauer College of BusinessUniversity of Houston
May, 2012

ACKNOWLEDGMENTS
God has looked down on me and blessed me with the strength, courage, and tenacity, to
complete this dissertation. To him I owe all praise and honor.
The completion of this dissertation could not have been possible without the help
of the many people that God put in my path for assistance.
First I would like to thank Professor George O. Gamble, my dissertation co-
chairman, for being my mentor throughout my Ph.D. program. He guided me with great
patience, devotion, and understanding. I am grateful to Professor Wynne Chin, dissertation
co-chairman, for sharing his expertise in PLS with me and the enormous amount of time
he spent with me, along with Professor Gamble, in the development of the questionnaire.
Further, I would like to thank them for their unending support and encouragement
throughout the writing of this dissertation; I am forever grateful.
I am also grateful to Professors Francia, Noland, and Singer, for serving on my
committee. They provided invaluable guidance to help successfully bring this dissertation
to fruition. Thank you for being there when I needed your assistance.
God has blessed me with a wonderful family and many friends. I want to thank all
of you for your untiring support throughout this process. In particular, I want to thank my
mother, Grace Morris; sisters Patricia Bush and Michele Mitchell; brother-in-laws, Thomas
Mitchell and David Bush; and friend and mentor Sophronia Williams; they were my
biggest cheerleaders, lifting me up when I felt depressed, praying with me when I needed
i

guidance, and just being there for anything that was needed. I also would like to thank my
bible study class for providing me with invaluable spiritual support, and the KPMG
Foundation for invaluable financial support throughout the process. There are many, many
others that I owe a debt of gratitude for their encouragement and prayers.
Finally, I would like to thank my deceased father, Dr. Tandy Tollerson for planting
the seed and demonstrating to me the importance of learning and being able to share that
knowledge with others; I am forever indebted.
ii

The Data Decision-Usefulness Theory:An Exploration of Post-1998
Reported Products and Services Segment Data Decision Usefulness
A DissertationPresented to
The Faculty of the C. T. Bauer College of BusinessUniversity of Houston
In Partial FulfilmentOf the Requirements for the Degree
Doctor of Philosophy
ByCynthia Diane Tollerson
C. T. Bauer College of BusinessUniversity of Houston
May, 2012
iii

The Data Decision-Usefulness Theory:An Exploration of Post-1998
Reported Products and Services Segment Data Decision Usefulness
ABSTRACT
This study sets forth a conceptual theory–the Data Decision-Usefulness
Theory–and explores it by surveying fundamental-equity analysts, to assay their
decision-usefulness perceptions of post-1998 reported products and services segment
data. Accordingly, a two-phased sequential exploratory mixed methods research design
is employed.
The initial phase is qualitative in nature comprising theory generation and
questionnaire and taxonomy development. The conceptual theory is generated by
drawing on prior accounting literature and two paradigms: formal classical grounded
theory and value-focused thinking. The former is the theory development methodology
and the latter is the over arching abstract model. The mail questionnaire is developed
with the aid of Dillman’sTailored Design Method. Our fundamental-equity analyst
taxonomy is developed, by drawing on: the descriptive literature about investment
professionals, the United States security exchange regulations, and a non-public
database, as well as the grounded theory paradigm.
The second phase is quantitative in nature. One hundred and sixty-three
questionnaire recipients mailed back their questionnaires (10% response rate). Fifty-
five answered questions that measured their decision-usefulness perceptions. Overall,
the measurement model findings for the questionnaire measures of the materiality and
iv

decision-usefulness models are moderately to highly reliable, exhibit both convergent
and discriminate validity, and each has predictive relevance. In comparing our results
for the two models, our most significant finding is that Ease of Comparing is the most
important predictor for both Materiality and Decision Usefulness. However,
surprisingly the relative importance of Relevance and Reliability shifts dramatically.
Our Materiality model predicts that Relevance is the second most important predictor
and Reliability is the least important. In contrast, our Decision Usefulness model
predicts just the opposite
Our results suggest that to have an impact on analysts’ understanding of firms,
relevant disclosures are more important than reliable disclosures. However, to increase
analysts’ understanding of firms, reliable information is more important than relevant
information. Furthermore, the amount of post-1998 reported products and services
segment data being disclosed is insufficient to improve analysts’ understandings of
firms. These findings seem to support the dissenting FASB board member’s assertion
that post-1998 reported segment disclosures are unlikely to facilitate better
understanding firms’ performance, better assessing their prospects for future net cash
flows, and making more informed judgments about firms as a whole.
v

TABLE OF CONTENTS
PageCHAPTER 1
Section 1.1 Introduction 1Section 1.2 Nature of the Problem 2Section 1.3 Rationale for the Study 4Section 1.4 Research Questions 6Section 1.5 Contributions of the Study 7Section 1.6 Summary of the Study 8
CHAPTER 2 LITERATURE REVIEW
Section 2.1 Introduction 9Section 2.2.Historical Background and
Overview of Decision Usefulness Theory 10Section 2.3 Historical Background and
Overview of Segmental Reporting 22Section 2.3.1 SFAS No. 14 27Section 2.3.2 SFAS No. 131 35Section 3.3.2 A Comparison of SFAS No. 131 and SFAS No. 14 39Section 4 Analysts Use of Segmented Reported Information 43Section 5 Summary and Conclusions 55
CHAPTER 3 RESEARCH METHODOLOGY AND DESIGNSection 3.1 Introduction 57 Section 3.2.1 The Value-Focused Thinking Paradigm 58Section 3.2.2 A Description of the Value-Focused
Thinking Paradigm 58Section 3.2.3 The Extent to which this Study Employs
the Value-Focused Thinking Paradigm 59Section 3.2.4 Brief History of the
Value-Focused Thinking Paradigm 59Section 3.2.5 Why We Employ the Value-Focused Thinking Paradigm 62Section 3.2.6 An Explication of the Value-Focused Thinking Framework 63Section 3.2.7 Research Examples of the Value-Focused
Thinking Paradigm 68
Section 3.2.8 Advantages and Disadvantages of Employingthe Value-Focused Thinking Paradigm 74
Section 3.3.1 Classical Grounded Theory 75
vi
PageSection 3.3.2 The Three Types of Classical Grounded Theories 76Section 3.3.3 Our Rationale for Employing
the Classical Grounded Theory Methodology 78Section 3.3.4 Brief History of Classical Grounded Theory 79 Section 3.3.5 The Classical Grounded Theory Methodology 82
Section 3.3.5.1 An Overview of the Theory Generation Process 82
Section 3.3.5.2 The Four Sets of Data 83Section 3.3.5.3 Initially Collected Data 83Section 3.3.5.4 Substantively Coded Data and
The Substantive Coding Process 84Section 3.3.5.5 The Substantive Coding Questions 87Section 3.3.5.6 Theoretical Codes and
the Theoretical Coding Process 88Section 3.3.5.7 Summary 89
Section 3.3.6 Grounded Theory Research Examples 90Section 3.3.7 Strengths of Classical Grounded Theory 91Section 3.3.8 Limitations of Classical Grounded Theory 91Section 3.3.9 Challenges of Employing Classical Grounded Theory 93Section 3.4.1 Mixed Methods Research 95Section 3.4.2 Mixed Methods Research History 96Section 3.4.3 Core Characteristics Mixed Methods
Definitional Description of Our Study 97Section 3.4.4 Phase 1–Qualitative 99
Section 3.4.4.1 Conceptual Theory 100Section 3.4.4.1.1 Decision Usefulness 106 Section 3.4.4.1.2 Ease of Comparing 107Section 3.4.4.1.3 Relevance 108 Section 3.4.4.1.4 Reliability 109Section 3.4.4.1.5 Sufficiency 110Section 3.4.4.1.6 Satiation 111Section 3.4.4.1.7 Antecedent Concepts of
Ease of Comparing 112Section 3.4.4.1.7.1 Ease of Complete
Intelligibility 112Section 3.4.4.1.7.2 Ease of Integrating 113
Section 3.4.4.1.8 Antecedent Concepts Easeof Complete Intelligibility 114
Section 3.4.4.1.8.1 Readableness 114Section 3.4.4.1.8.2 Consistency with
Users’ Accounting Constructs 115
vii

PageSection 3.4.4.1.8.3 Ease of Interpreting
Accounting Estimates 116Section 3.4.4.1.9 Antecedent Concepts Reliability 117
Section 3.4.4.1.9.1 Representational Faithfulness 117Section 3.4.4.1.9.2 Degree of Verification 118 Section 3.4.4.1.9.3 Neutrality 119
Section 3.4.4.1.10 Materiality 120 Section 3.4.4.2 Taxonomy 123
Section 3.4.5 Phase 2–Quantitative Data 142Section 3.4.5.1 Mail Survey Data Collection Method 142Section 3.4.5.2 Questionnaire and UH Mailing System Pretest Procedures 143Section 3.4.5.3 Sample Frame 147Section 3.4.5.4 Stratified Random Sampling Procedures 148Section 3.4.5.5 Survey Administration 149
CHAPTER 4 RESULTSSection 4.1 Partial Least Squares Analysis 153Section 4.2.1 Measurement Model Evaluation:
Measurement Model Results 156Section 4.2.2 Construct to Construct Overlap
Check of Discriminant Validity 156Section 4.2.3 Item to Construct Loading and Cross Loadings
Check of Convergent and Discriminant Validity 159Section 4.3 Model Evaluation: Structural Model Results 160
CHAPTER 5 SUMMARY AND CONCLUSIONSSection 5.1 Introduction 169Section 5.2.1 Significant Findings 169
Section 5.2.2 Materiality Model 170Section 5.2.3 Decision Usefulness Model 175
Section 5.3 Conclusions 178Section 5.4 Limitations of the Study 178Section 5.5 Future Extensions of Present Research 179
LIST OF REFERENCES 180
APPENDICESAppendix 3.0 Additional Structural Equation Models 216Appendix 3.1 Target Population Specification Related Tables 224
viii

PageAppendix 3.2 Post-1998 Construct Definitions and Corresponding
Questionnaire Measures 242Appendix 3.3 Survey Letter and Questionnaire 257
ix

List of Figures
Figure PageFigure 3.2 Value-Focused Thinking Fundamental Analysis
Portfolio Management Framework 67Figure 3.3 Six Decision Contexts for Managing a Portfolio Using
a Value-Focused Thinking Fundamental AnalysisInvestment Decision-Making Approach 103
Figure 3.4 Decision-Usefulness Structural Model 105Figure 3.5 Materiality Structural Model 121Figure 3.6 Target Population Taxonomy 124Figure 3.7 Venn Diagram of the Target Population’s
Investment Decision 141Figure 4.1 Materiality Path Analysis 167Figure 4.2 Decision-Usefulness Path Analysis 168
x

List of Tables
Table PageTable 2..1 Summary of Financial Accounting Information Attributes and Definitions 17 Table 3.1 Industry of Employment Classifications and
Corresponding Definitions per U.S. Securities Laws 126Table 3.2 Investment Decision-Maker Industry Classifications 132Table 3.3 Industry Specialities and Corresponding Value Line
Industries and Target Population Sector Classifications 135Table 3.4 Stratified Random Sampling Plan 149Table 4.1 Item Measure Descriptive Statistics 166Table 4.2 Construct Correlations versus Composite Reliability
and Square Root of Average Variance Extracted 164.Table 4.3 Shared Variance Among Constructs (squared correlations) versus
Composite Reliability and Average Variance Extracted 165Table 4.4 Measurement Item to Construct Loadings and Cross Loadings 162
xi

CHAPTER 1
1.1 INTRODUCTION
The 2008 financial crisis rocked the world. Globally, seemingly, overnight
financial market participants lost confidence. Some scrambled to sell-off their equity and
debt securities. Others refused to provide the working capital firms, desperately, needed
to fund day-to-day operations. Consequently, worldwide, governments–through their
central banks–took actions, to enhance confidence in their financial markets (Bush 2008).
What precipitated this chain of events? The answers to that question are being
investigated; history suggests we may never have a complete answer. However in the
United States (U.S.), almost, immediately financial reporting and accounting standard
setting were challenged (Scannell 2008; FASB and IASB 2008). Accordingly, Congress
demanded enhanced accounting standard setting transparency and oversight. Presently,
the U.S. Senate Banking, Housing, and Urban Affairs Subcommittee on Securities,
Insurance, and Investment (The Senate Subcommittee), is examining the role of
accountants, in helping to prevent another financial crisis (Seidman 2011, 1).
The Senate Subcommittee is monitoring, closely, the Financial Accounting
Standards Board (FASB). Which is the organization that has received delegated
authority, from the Securities and Exchange Commission (SEC), for U.S. accounting
1

2
standard setting. The FASB’s financial accounting standards are recognized as
authoritative. These standards comprise the generally accepted accounting principles
(GAAP), to which U.S. firms must adhere, in order to issue securities, and to have the
same sanctioned, by the SEC, for trading in U.S. financial markets (Seidman 2011, 1-2).
Thus, GAAP is the fundament of U.S. financial reporting data.
Section 1.2 Nature of the Problem
The vitality and efficiency of U.S. financial markets depend on robust financial
reporting data that are useful for decision making, and thus enhance financial market
participants’ confidence. This enhanced confidence level leads to greater financial and
non-financial market activity, and therefore to U.S. economic growth (Seidman 2011, 1-2).
Financial market participants have expressed to the SEC, they could more
confidently employ financial reporting data, if accounting standards were better
(Schapiro 2011). Consequently, the FASB has re prioritized its work (Seidman 2011).
Moreover, the SEC has enhanced its monitoring of firms’ financial reporting data.
Furthermore, it intends to share its findings with the FASB, to facilitate amending
accounting standards (Schapiro 2011), and improving said data.
Notwithstanding the FASB’s and the SEC’s actions, several issues challenge the
FASB’s endeavors to develop better accounting standards. A primary challenging issue
facing the FASB is: what are the accounting data qualites, accounting standard setters
should consider, to advance decision-useful financial reporting? The FASB’s
employment of said qualities, should enhance U.S. accounting standard setting
transparency and oversight; confidence in U.S. accounting standard setting; and financial
reporting data decision usefulness.

3
The aforementioned issue is, also, the fundament of financial analysts’ persistent
discontent with firms’ pre-1998 segment reporting data disclosures. Their principal
concerns were that these financial reporting disclosures were not as understandable,
relevant, reliable, detailed, or frequent as they desired (Knutson 1993). In response, in
1997, the FASB issued, Statement of Financial Accounting Standards Number 131
(SFAS No. 131), Disclosures about Segments of an Enterprise and Related Information
(FASB 1997), to replace its predecessor, SFAS No. 14, Financial Reporting for Segments
of a Business Enterprise (FASB 1976).
Segment reporting data decision usefulness is of particular interest to–one type of
analyst–fundamental-equity analysts. The reason is, these–and only these–analysts,
primarily, identify mispriced equity securities by comparatively analyzing financial
reporting data, inclusive of segment data. Their mispriced equity analyses are supported
by comparative cross-sectional, time series, and financial ratio analyses (AICPA 1994).
Moreover, they derive products and services segment analyses, to support their long-term
firm-wide market value forecasts (Boersema and Van Weelden 1992; AICPA 1994). The
cruxes of fundamental-equity analysts’ analyses are their understandings of firms–which
segment reporting data facilitate (Boersema and Van Weelden 1992).
Whether fundamental-equity analysts perceive, firms’ post-1998 reported
products and services segment disclosures enhance their understandings of firms is an
unanswered question. Prior researchers report post-1998 disclosures, compared to pre-
1998 disclosures, reveal more segments, and more data about each segment (Herrmann
and Thomas 2000; Street et al. 2000). Nevertheless, other researchers report, only, certain
types of firms are disclosing more segments (Ettredge et al. 2000; Berger and Hann 2002;

4
Berger and Hann 2003). Still other researchers, report firms are releasing dissimilar
segment profit measures (Street et al. 2000; Nichols et al. 2002). There is, however, no
current accounting literature that explores fundamental-equity analysts’ perceptions of
post-1998 segment data decision usefulness. A survey study is an apt way to investigate,
whether these analysts perceive that the FASB’s regulatory response, and firms’
responses thereto, are resulting in decision-useful segment data disclosures.
Section 1.3 Rationale for the Study
The purpose of this study is to identify the qualities that differentiate data from
information and to employ them to explore the decision-usefulness of post-1998 reported
products and services segment data. This is accomplished by developing and exploring a
conceptual theory–The Data Decision-Usefulness Theory. The major premise of which is
that five qualities (user information values) differentiate data from information: ease of
comparison, relevance, reliability, sufficiency, and decision usefulness, and possibly a
sixth–satiation.
This study employs a two-phased sequential exploratory mixed methods research
design (Creswell 2009, 211-212; Morgan 1998; Plano Clark and Creswell 2008, 549-
550). The initial phase is qualitative. Wherein the conceptual theory is developed, by
drawing on prior accounting literature (FASB 1989; Snavely 1967; Sterling 1972, 1970;
AICPA 1994a, 1994b; Staubus 2000; Boersema and Van Weelden 1992a, 1992b; FASB
1997) and two paradigms: formal classical grounded theory (Glaser 1978, 1998, 2007)
and value-focused thinking (Keeney 1996). The former is the theory development
methodology and the latter is the theoretical framework.

5
The first level of our conceptual theory is our middle range theory. The middle
range theory addresses financial reporting data; it explicates the requisites accounting
standard setters should consider to assess financial reporting data decision usefulness. It
maintains decision-useful financial reporting data exhibit the aforesaid qualities and
attributes. The second level of our conceptual theory is our practice theory. The practice
theory addresses post-1998 reported products and services segment data; it explicates the
requisites researchers should consider to assess the decision-usefulness of said data. It
maintains, in the primary decision context in which fundamental-equity analysts employ
segment reporting data, to better understand firms (Boersema and Van Weelden 1992a,
1992b), decision-useful segment data exhibit the aforesaid qualities and attributes.
Also included in the first phase of this study, is the development of the
questionnaire which draws on an expression of social exchange theory, and Dillman’s
(2000) Tailored Design Method. Additionally, drawing on analyst literature and United
States security exchange regulations, a fundamental-equity analyst taxonomy is
developed.
The second phase, is quantitative in nature. This phase entails the surveying of
said analysts using Dillman’s (2000) mail survey administration procedures, and by
employing partial least squares (Chin and Newsted 1999; Chin 1998; Wold 1985), the a
priori specified practice theory, and competing variants are assayed (Chin 1998, xii).

6
Section 1.4 Research Questions
The specific research questions addressed in this study are based upon the
conceptual theory developed and the testing of our practice theory. The following
questions are raised with regard to our conceptual theory:
Middle Range Theory Level:
(1) How do financial reporting data differ from financial
reporting information?
(2) What is the most apt a priori specified structural model of
decision-useful financial reporting data?
(3) What is the most apt a priori specified structural model of
the materiality of financial reporting data?
Practice Theory Level:
(1) How do reported products and services segment data differ
from reported products and services segment information?
(2) What is the most apt a priori specified structural model of
decision-useful post-1998 reported products and services
segment data?
(3) What is the most apt a priori specified structural model of
the materiality of post-1998 reported products and services
segment data?

7
Section 1.5 Contributions of the Study
This exploratory study is significant for three reasons. First, its middle range
theory responds to one standard-setter’s call to identify the desirable qualitative
characteristics of accounting information (Barth 2006, 124), and to a call for debating a
comprehensive financial reporting quality model that goes beyond that of standard setters
(Jonas and Blanchet 2000, 354). Hence, its middle range theory is put forward as an
alternative to their characterizations of useful financial information (FASB 2010, 1989).
Second, its practice theory exploration responds to a call, to academics, to
facilitate bringing a user-focus to financial reporting (Jonas and Young 1998, 154).
Accordingly, the exploration examines products and services segment data decision
usefulness and materiality. This is of importance because segment data decision
usefulness is persistently of interest to fundamental-equity analysts (CFA Institute 2007,
14; Fleishman-Hillard Research 2000, 6; Knutson 1993, 88-89; Korn 1989, 1; Mautz
1968, 94-96). Thus, its practice theory, and its exploration thereof, show the utility of the
middle range theory, by demonstrating how future researchers might augment the latter,
to explore the decision-usefulness and materiality, of other data–financial or non-
financial. Additionally, its taxonomy is set forth to facilitate the effort of future
fundamental-equity analyst researchers. Their amendments of the taxonomy will ease
future inter-study analyses.
Lastly, the study introduces, to the accounting literature, an explicit sequential
exploratory mixed method research design (Morgan 1998; Johnson, Onwuegbuzie, and
Turner 2007; Onwuegbuzie, Bustamante, and Nelson 2010). The adoption of these
designs will facilitate accounting standard setting related research (Barth 2006), expedite

8
accounting theory development (Cluskey, Ehlen, and Rivers 2007; Coetsee 2010), and
bring a user-focus to financial reporting (Jonas and Young 1998).
Section 1.6 Summary of the Study
The remainder of the study is organized as follows. Chapter 2 comprises the
literature review. Therein, the literature concerning the historical development of the
decision usefulness theory and related concepts are discussed. Additionally, the
literatures concerning segment reporting and analysts’ use of segment reported
information will also be discussed. Chapter 3 comprises the research methods and design.
Therein, value-focused thinking, our overarching theoretical model is discussed.
Additionally, classical grounded theory, our theory generation method is set forth.
Moreover, mixed methods research and the two-phased sequential exploratory research
designs are defined. Further, we set forth the results of our first phase. This comprises
our conceptual theory and our taxonomy of fundamental analysis investment decision-
makers. Lastly, we set forth our questionnaire development and survey administration
procedures. Chapter 4 comprises the partial least squares analyses and results. Chapter 5
comprises the summary and conclusions.

CHAPTER 2
Literature Review
Section 2.1 Introduction
The objectives of this literature review are: (1) to provide the foundation for the
development of our data decision usefulness theory; (2) to provide an understanding of
the accounting framework developed for the external reporting of segments and; (3) to
provide a review of the accounting literature that has focused on financial analyst use of
segmented reported information. Thus, this chapter is organized as follows; Section 2
provides an historical background and overview of the decision- usefulness theory
developments particular to financial reporting. This section of the literature review will
identify the attributes of accounting information along with their definition(s) that have
been discussed in the accounting literature; Section 3 provides an historical background
and overview of segmental reporting. This section will include a discussion of the major
concerns that have been expressed regarding the deficiencies in contemporary financial
reporting of segmented information; Section 4 reviews the research that has focused on
financial analysts use of segmented reported information and; Section 5 provides a
summary of the chapter.
9

10
Section 2.2.1 Historical background and Overview of Decision Usefulness Theory
The decision-usefulness theory is important because it is the underlying
theoretical basis for the FASB’s conceptual framework, and that of the conceptual
frameworks of the other principal English-speaking countries: Australia, Canada, New
Zealand, and the United Kingdom (Davies et al. 1997; and Staubus 2000 iii).
Additionally, it is the fundament of the International Accounting Standards Committee’s
(ISAC) conceptual framework (Davies et al. 1997). Despite its significance, its
name—the decision-usefulness theory—is not widely recognized, even among those
interested in accounting theory (Staubus 2000).
The decision-usefulness theory “like most social science theories, . . . is made up
of a mixture of normative and descriptive propositions” (Staubus 2000, p.v). The crux of
the theory is the decision-usefulness objective: “The objective of accounting is to provide
financial information regarding an enterprise for use in making decisions” (Staubus 2000,
5). The decision-usefulness objective “is the base on which a coherent, broad structure of
ideas has been built. No other such structure of accounting ideas has been developed”
(Staubus 2000, v). “It is probably fair to say[, however,] that . . . [the decision-
usefulness] objective is not accepted by a majority of those in [either] the . . . [financial
statement] preparer . . . [or the] management community” (Staubus 1995, p.195).
Because “the . . . [the decision-usefulness objective] is not generally accepted by .
. . [enterprise management], the [decision-usefulness] theory can easily be viewed as
normative” (Staubus 2000, v). Nevertheless, “it is substantially accurate as a general
description of current accounting practice, and practice has slowly moved closer to
agreement with the theory” (Staubus 2000, p.v). Without “a theory of generally accepted

11
accounting principles, no alternative to the decision-usefulness theory exists”(Staubus
2000,p. v).
The accounting literature does not comprehensively reflect the evolution of the
decision-usefulness theory (Staubus 2000, iv). The principal reason is that “the major
‘authoritative body’ pronouncements that contributed so much to its acceptance . . . did
not include a report of a literature search” (Staubus 2000, iv). Given the obscurity of its
name and the paucity of its history, a sketch of the evolution of the decision-usefulness
theory is warranted, and is presented next.
In 1954 George J. Staubus’ dissertation, An Accounting Concept of Revenue,
seminally presented “the essence of a specified body of knowledge or belief (a theory), in
particular, one starting with the objective of providing financial information regarding an
enterprise for use in making economic decisions” (Staubus 2000, iii). Staubus referred to
that set of propositions as the theory of accounting to investors. His initial
conceptualization of the theory is, also, given in his 1959 paper entitled The Residual
Equity Point of View of Accounting, which was published in The Accounting Review. A
more comprehensive version of the theory, however, is provided in his 1961 monograph
entitled A Theory of Accounting to Investors.
Surprisingly, prior to 1954 “neither an accounting organization nor an individual
author had . . . ever set forth any objective for accounting” (Staubus 1995, p.195). “It
followed that no one had sought to build a theory, or conceptual framework, on that
basis. Several writers had given attention to users or uses of information, but none tied
his comments to the decision-usefulness objective or to a theory structure" (Staubus
2000, p.3).

12
Staubus’ treatise entitled Making Accounting Decisions, which was published in
1977, reflects the most current and most complete exposition of what he now refers to as
the decision-usefulness theory of accounting to investors. His most recent monograph,
The Decision-Usefulness Theory of Accounting: A Limited History, evidences “how the
theory started in a crude, poorly articulated, and incomplete form, then gradually . . .
developed into a more complete and some what better” (Staubus 2000, iii) exposition.
Therein, Staubus sets forth that the FASB’s conceptual framework is an adaptation of the
decision-usefulness theory. Further, he acknowledges that his discussions of the criteria
of decision useful accounting information benefitted, significantly, from several works
(Chambers 1960, Ijiri and Jaedicke 1966, AAA 1966, McDonald 1967, Snavely 1967,
Sterling 1970, and AICPA 1970).
Two committee reports and one pronouncement greatly contributed to the
evolution of the FASB’s conceptual framework and thereby to the evolution of the1
decision-usefulness theory. The first committee report is A Statement of Basic
Accounting Theory, which was prepared and published in 1966 by a special purpose
committee of the American Accounting Association (AAA). This publication maintained
that the objectives of accounting are to provide information for four purposes: (1) making
economic decisions about an organization, (2) managing an organization’s resources, (3)
maintaining and communicating on the custodianship of those resources, and (4)
facilitating the operations of society for the welfare of all (AAA 1966, pp.4-5). Further,
this document formulated four accounting standards and five guidelines by asking the
See the following for more detailed discussions of the evolution of the conceptual framework: Staubus 2000, Zeff1
1999, Davies et al. 1997, and Gore 1994.

13
following question, “What characteristics should accounting information have in order to
be useful (AAA 1966, 3)?” The standards developed are: (1) relevance–the primary
standard; (2) verifiability; (3) freedom from bias and; (4) quantifiability (pp.7-12). The
guidelines are: (1) appropriateness to expected use; (2) disclosure of significant
relationships; (3) inclusion of environmental information; (4) uniformity of practice
within and among entities and; (5) consistency of practices through time (pp.12-18).
Snavely (1967) expanded the AAA (1966) analysis of the standards that should be
considered to identify useful accounting information. He maintains that useful accounting
information is characterized by a four level hierarchy of accounting criteria. The first
level consists of just one concept: usefulness. The second level consists of six criteria:
relevance, reliability, understandability, significance, sufficiency, and practicality. Level
3 is the definitions of all level 2 concepts except sufficiency. Level 4 is the operational
definitions of verifiability and consistency, which are concepts employed to define
reliability and understandability respectively. Snavely is of the opinion that each criterion
is “mutually exclusive and singularly powerful”. Hence, “information [which] does not
meet any one [the] . . . criteria is not useful, even though it may comply perfectly with all
others” (Snavely 1967, p.232). Further, with regard to freedom from bias, and2
quantifiability his position is that information may be reliable even though it is not
If information is not relevant, it is of no use even though it may be perfectly reliable, understandable, significant,2
sufficient, and practical. Of course, information can be relevant to decisions in different ways. Similarly, ifinformation is not reliable, it is of no use, even where it is perfectly relevant, understandable, significant, sufficient,and practical. Ans so it is with each of the second-level criteria. However, the characteristic of being mutual exclusiveand singularly powerful does not attach to all of the third-level criteria developed in Snavely”s analysis. This isparticularly true of verifiability, freedom from bias, and quantifiability. Information may be reliable even though it isnot absolutely verifiable or free from bias; and information can certainly be understandable even though it is notquantifiable (Snavely 1967, 232).

14
absolutely verifiable or free from bias; and information can certainly be understandable
even though it is not quantifiable” (Snavely 1967, p.232).
The single pronouncement, which is entitled, Basic Concepts and Accounting
Principles Underlying Financial Statements of Business Enterprises, Statement of
Accounting Principles No. 4, was a non-mandatory statement issued by the AICPA’s
Accounting Principles Board in 1970. This Statement maintains that there are seven
qualities or characteristics that make financial information useful--.relevance,
understandability, verifiability, neutrality, timeliness, comparability, and completeness.
However, one quality: relevance is the primary quality. The relative importance of the
other six qualities was not explicated. Instead, the AICPA asserted that determining the
trade-offs requires judgment (AICPA 1970, para. 111). Further, this Committee report
states that “providing information that has each of . . . [those] qualities is an objective of
financial accounting.” The qualities of useful accounting information “are related to the
broad ethical goals of truth, justice, and fairness that are accepted as desirable by society
as a whole” (AICPA 1970, para. 86). “To the extent that the . . . [qualities] are met,
progress is made toward achieving the broad ethical goals as well as toward making
financial information more useful” (AICPA 1970, para. 86). The qualities are, however,
“less abstract than the ethical goals of truth, justice, and fairness and can therefore be
applied more directly to financial accounting” (AICPA 1970, para. 86). This committee
report does not include reliability as one of the qualities of useful accounting
information. Instead, it asserts that the achievement of the qualities of useful accounting
information enhances the reliability of financial statements.

15
“ Reliability does not imply precision of the information in financial statements
because financial accounting involves approximation and judgment” (AICPA 1970, para.
107). This committee report maintains that the preparation of reliable financial
statements is a management responsibility. That responsibility is met when three
conditions exist: (1) generally accepted accounting principles are applied in a manner
that is appropriate to an enterprise’s circumstances, (2) effective systems of accounts and
internal control are maintained, and (3) adequate financial statements are prepared.
The second professional report by the AICPA is entitled, the Objectives of
Financial Statements, Report of the Study Group on the Objectives of Financial
Statements, which was published in 1973. This report maintains that the basic objective
of financial statements is to provide information useful for economic decision making. In
satisfying this basic objective, accounting should serve the goals of both the private and
public sectors of the economy. Users of financial statements “ seek to predict, compare,
and evaluate the cash consequences of their economic decisions” (AICPA, p.61). Further,
this committee report asserts that financial statement information should possess seven
qualitative characteristics to satisfy users’ needs: relevance and materiality, form and
substance, freedom from bias, comparability, consistency, and understandability.
In a 2002 proposal concerning a principles-based approach to standard-setting,
the FASB reaffirmed its commitment to the decision-usefulness theory (FASB 2002,
p.1). However, therein, the FASB states “the framework has not provided all the requisite
tools for resolving accounting and reporting problems” (FASB 2002, 6). For example,3
These publications also identify deficiencies in the FASB’s conceptual framework: Agrawal 1987; Gore 1994;3
Staubus 1995; Davies 1997; Miller et al. 1998; and Storey and Storey 1998.

16
Concepts Statement No. 2 “does not provide conceptual guidance necessary for making
tradeoffs among” (FASB 2002, 6) these criteria of decision-useful information: relevance
and reliability and comparability and consistency. Because of the deficiencies of the
conceptual framework the FASB foresees that it will “need to commit resources to a
project to improve the . . . framework” (FASB 2002, 6).
In September 2010, the FASB issued Concepts Statement No. 8 to replace
Concepts Statement No. 1, Objectives of Financial Reporting by Business Enterprises,
and No. 2, Qualitative Characteristics of Financial Reporting Information. This new
Concepts Statement was issued as a result of a joint research project by the FASB and
the International Accounting Standards Board (IASB) to improve and converge their
conceptual frameworks. As the FASB and the IASB complete additional phases of their
joint project, new chapters will be added to the Concepts Statement. According to
Concepts Statement No. 8, the objective of general purposes financial reporting is:
to provide financial information about the reporting entity that is useful to
existing and potential investors, lenders, and other creditors in making decisions
about providing resources to the entity. Those decisions involve buying, selling,
or holding equity and debt instruments and providing or settling loans and other
forms of credit (Para. OB1).
Furthermore, existing and potential investors, lenders, and other creditors need
information to help them assess the prospects for future net cash inflows to an
entity(Para. OB3). It should be noted that the FASB is of the opinion that:”the
objective of financial reporting acknowledges that users make resource allocation
decisions as well as decisions as to whether management has made efficient and

17
effective use of the resources provided”(Para. BC1.28). Thus, their general objective
not only satisfies providing information to decision-makers in their capacity as capital
providers, but provides information regarding the stewardship of an entity’s resources,
as well.
According to Concepts Statement No. 8, the qualitative characteristics of useful
financial information has two categories: fundamental qualitative characteristics, and
enhancing qualitative characteristics--“if financial information is to be useful, it must be
relevant and faithfully represent what it purports to represent. The usefulness of
financial information is enhanced if it is comparable, verifiable, timely and
understandable” (Para.QC4). Further, because “materiality is an entity-specific aspect
of relevance” (para. QC11) it is also considered a fundamental qualitative characteristic.
Table 2.1 provides a summary of the attributes of financial accounting
information and their definitions by source document.
Table 2.1Summary of Financial Accounting Information Attributes and Definitions by Source
Source
Document
Information Attribute and Definition
ASOBAT
(1966)
Relevance- for information to meet the standard of relevance, it must bear upon
or be usefully associated with the action it is designed to facilitate or the result it
is desired to produce. This requires that either the information or the act of
communicating it exert influence or have the potential for exerting influence on
the designated actions.
Verifiability- Information is verifiable if essentially similar measures or
conclusions would be reached if two or more qualified persons examined the
same data.
Freedom from bias- Free from bias means that the facts have been impartially
determined and reported. Free from bias means that techniques used in
developing data should be free of built-in bias.
Quantifiability- Quantifiability means that numbers are assigned to the

18
Source
Document
Information Attribute and Definition
ASOBAT
(1966)
(Cont.)
information reported.
Snavely
(1967)
Usefulness-Useful information is sufficient for action.
Relevance- Relevant information is that which will assist in (1) valuing a firm,
(2) evaluating management, or (3) valuating management’s policies.
Reliability-Reliability is that criterion which recognizes that for information to
be useful, a user must be able to depend on it as a representation of what it
purports to be.
Understandability-Understandability focuses attention on the need for the users
of information to be able to comprehend the message or messages being
communicated.
Quantifiability-Quantification enables events within and comprising a given
venture to be brought into meaningful relationship with each other.
Consistency-Consistency with user concepts’ recognizes that, for information to
be understandable, it must be in agreement–at least to some degree–with the
existing ideas of statement users as to the meaning of the data being
communicated.
Comparability-The criterion of comparability recognizes that the accounting
information in financial statements is more understandable when it is presented
so that it can be compared with similar information concerning other firms and
also other periods of the same firm.
Simplicity-The criterion of simplicity recognizes the intellectual limitations of
people.
Significance- Significance is usually referred to as materiality. Materiality is
defined in most instances as a combination of the criteria of significance and
sufficiency.
Sufficiency-The word fairly as it is employed in the standard short-
form audit report appears to encompass these two criteria: sufficiency and
reliability.
Practicality-To be practical, information must be worth more than it
costs to present, and second, it must be available on a timely basis. The net
usefulness of information is destroyed if it cannot meet the criterion of
practicality.

19
Source
Document
Information Attribute and Definition
APB No.
4 (1970)
Relevance-Relevant accounting information bears on the economic
decisions for which it is used. The objective of relevance helps in selecting
methods of measuring and reporting in financial accounting that are most likely
to assist users in making the types of economic decisions for which they
use financial accounting data.
Understandability- Requires that the users have some understanding of the
complex economic activities of enterprises, the financial accounting process, and
the technical terminology used in financial statements.
Verifiability-Verifiability means that the attribute or attributes selected for
measurement and the measurement methods used provide results that can be
corroborated by independent measurers.
Neutrality-Neutral financial accounting information is directed towards the
common information needs of users and is independent of presumptions about
particular needs and desires of specific users of the information. Neutral
accounting measurements enhance the relevance of the information to common
needs of users.
Timeliness- Timely financial accounting information is communicated early
enough to be used for the economic decisions which it might influence and to
avoid delays in making those decisions.
Comparability- Comparable financial accounting information presents
similarities and differences that arise from basic similarities and differences in
the enterprise or enterprises and their transactions and not merely from
differences in financial accounting treatments. Comparable financial accounting
information facilitates conclusions concerning relative financial strengths and
weaknesses and relative success, both between periods and for a single
enterprise and between two or more enterprises.
Completeness-Financial information that meets the qualitative objectives of
financial accounting also meets the reporting standard of adequate disclosure.
Adequate disclosure relate particularly to objectives of relevance, neutrality,
completeness, and understandability.
Objectives
of
Financial
Statements
(1973)
Relevance-Relevance is described as being inseparable from the concept of
purposeful information . . . . Information that does not bear on the problems for
which it is intended is not useful, regardless of its other qualities.
Materiality- Materiality is defined as information that is likely to influence
users’ economic decisions. Materiality is characterized as a judgment
concerning the significance of information and its impact on users’economic
decisions.

20
Source
Document
Information Attribute and Definition
Objectives
of
Financial
Statements
(1973)
(Cont.)
Freedom from bias- Freedom from bias is characterized as neutrality and
fairness. Avoidance of bias requires the careful application of conservatism,
because conservatism may introduce bias.
Comparability- Comparability means to have like things reported alike, and
unlike things reported differently.
Consistency- Consistency is a valuable adjunct to comparability.
Understandability-Understandability requires that information be expressed as
simply as permitted by the nature and circumstances of what is being
communicated.
Staubus
(2000)
Understandability-The quality of information that enables users to percieve its
significance. Focuses accounting evaluators’ attention on the receiving phase of
the communication process.
Relevance-Relevance is the primary criterion for evaluating accounting
information. More specifically, it deals only with measurement methods.
Relevance means that a particular number reflects a measure in which users are
interested.
Reliability-Reliability is that criterion which permits users of a datum to
confidently depend on it as an accurate representation of the specific
phenomenon it purports to represent.
Verifiability-Verifiability means that financial accounting information provides
results that would be substantially duplicated by independent measures using the
same measurement methods.
Lack of Bias- A state of mind that permits an observer to perceive phenomena
and record his perceptions without influence either from his personal stake in
the phenomena in question, or from how his record of those phenomena may be
employed.

21
Source
Document
Information Attribute and Definition
Staubus
(2000)
(Cont.)
Comparability-Relationships between accounting practices whichcontribute to the process of relating two or more financial data Staubusidentifies six distinct types of comparability relationships: (1) interperiodcomparability (the comparability of the financial information disclosedby a particular enterprise, and includes the consistent application of theenterprise’s accounting methods), (2) ex ante-ex post comparability (this
criterion is related to the requirement that firms disclose the effect of significant
changes in their accounting policies), (3) intercompany comparability (concerns
the comparability of an enterprise’s financial information with that of other
enterprises), (4) interline comparability (pertains to measuring unitcomparability), (5) intraline comparability (components which comprise adisclosed sum should be of similar or of equivalent analytical interest tofinancial statement users ), and (6) reporting period comparability (refersto the employment of identical reporting periods).
Consistency- The application of similar accounting practices to similarevents..
FASB
(2011)
FASB
(2011)
(Cont.)
Relevance- Relevant financial information is capable of making a difference in
the decisions made by users. Information may be capable of making a difference
in a decision even if some users choose not to take advantage of it or already are
aware of it from other sources. Financial information is capable of making a
difference in decisions if it has predictive value, confirmatory value, or both.
Materiality- Information is material if omitting it or misstating it could
influence decisions that users make on the basis of the financial information of a
specific reporting entity. In other words, materiality is an entity-specific aspect
of relevance based on the nature or magnitude or both of the items to which the
information relates in the context of an individual entity’s financial report.
Faithful Representation-To be a perfectly faithful representation, a depiction
would have three characteristics. It would be complete, neutral, and free from
error.
Enhancing Qualitative Characteristics
Comparability-Comparability is the qualitative characteristic that enables users
to identify and understand similarities in, and differences among, items. Unlike
the other qualitative characteristics, comparability does not relate to a single
item. A comparison requires at least two items.

22
Source
Document
Information Attribute and Definition
Verifiability-Verifiability means that different knowledgeable and independent
observers could reach consensus, although not necessarily complete agreement,
that a particular depiction is a faithful representation. Quantified
information need not be a single point estimate to be verifiable. A range of
possible amounts and the related probabilities also can be verified.
Timeliness-Timeliness means having information available to decision makers
in time to be capable of influencing their decisions.
Understandability- Classifying, characterizing, and presenting information
clearly and concisely makes it understandable.
Section 2.3 Historical Background and Overview of Segmental Reporting
As early as 1937, the SEC required registrants to disclose major classes of gross
sales. By 1965, if practicable, issuers of new securities (issuers) were required to disclose
“the relative importance of each product or service or class of similar products or
services which contributed 15% or more to the gross volume of business done during the
last fiscal year” (Rappaport 1968, 5). Moreover, annually all registrants were required to
report similar information. In addition, registrants which acquired assets of a
“significant” amount were required to, promptly, disclose comprehensive financial and
narrative information regarding the acquisition. Finally, issuers whose products and
services revenues individually composed greater than ten percent of the firm’s total
revenues, were required to report the contribution of each to the firm’s total gross income
(Rappaport 1968, p.5).
Notably, the SEC did not require the disclosure of line of business profitability
until 1969. Specifically, in 1969 issuers were required to disclose in their registration
statements “but not necessarily in their annual reports, a five-year break down of

23
revenues and contribution to pretax profits by material line of business” (Pacter 1993,
p.14). However, the SEC’s guidance for determining a line of business gave firms
considerable latitude, and the line of business materiality test imposed for large issuers
differed from that for small issuers. Further, the SEC required issuers to provide narrative
information concerning the following: (1) major customers, (2) foreign operations, and
(3) inter-segment sales pricing and common cost allocation procedures. Nevertheless, the
SEC’s disclosures were not, necessarily, required to be a part of issuers’ audited financial
statements (Pacter 1993, p.14).
The segment information disclosures imposed by the SEC in 1969 were not
mandated on its own initiative, but rather the disclosures were mandated because of
Congressional prodding. Specifically, from 1965 through 1966 the Subcommittee on
Anti-Trust and Monopoly of the U.S. Senate Committee on the Judiciary held hearings
regarding the conglomerate merger wave of the late 1950's and early 1960's, and the
resultant need for segment profit information. During those hearings witnesses gave two
different, yet, related justifications for the disclosure of segment profitability (Rappaport
1968, pp.2-9).4
First, Dr. Willard F. Muelller, Director of the Federal Trade Commission’s Bureau of Economics, “testified that4
segmented information was a necessity for free competition to be effective. He said that such disclosure wouldindicate to potential competition the desirability of competing in a given market” (Rappaport et al. 1968, 8-9). Hesuggested that such information would prevent an enterprise from overcharging its customers in one geographic area tosubsidize its operations in a geographic area of more intense competition. Morever, he asserted that segmented profitinformation would preclude a firm from improperly using its economic power. Thus, his testimony established froman antitrust viewpoint the need for the disclosure of geographic profitability as well as product-line profitability orother types of segment profitability (Rappaport et al. 1968, 9).
Second, witnesses who addressed the concerns of investors asserted that the conglomerate merger waveresulted in the consolidation of a significant amount of previously disclosed income statement and balance sheetinformation about mergered business enterprises. Those witnesses maintained that “without product-line or otherwisesegmented reporting it is impossible for the investor to make an intelligent investment decision with respect to aconglomerate” (Rappaport et al. 1968, 7). When the SEC Chairman Manuel F. Cohen initially appeared before thesubcommittee he affirmed the SEC’s power to mandate product-line or similar partial activity reporting. Nonetheless,he asserted that for a variety of reasons the SEC had refrained from requiring such disclosures (Rappaport 1968, 3).

24
Mainly, the Subcommittee on Anti-Trust and Monopoly’s segment reporting
inquiry concerned two questions. “To what extent is it necessary or desirable that
additional disclosure be made” (Rappaport et al. 1968, p.7)? “To what extent can such
disclosure be made meaningfully and helpfully” (Rappaport et al. 1968, p.7)? On
September 20, 1966, at the conclusion of his appearance before the subcommittee, SEC
Chairman Cohen asserted that it is evident that conglomerate mergers make it
increasingly difficult for investors and others to reach sound judgments about both the
affairs and the prospects of conglomerates and other companies. He stated, “While the
problems facing us are not insurmountable they are difficult, and I do not believe we will
find simple answers to them. Their difficulty suggests that we must proceed with
deliberation and with a recognition that experience may prove to be our best guide in
reaching the most appropriate solution” (Rappaport 1968, p.16). Furthermore, he
announced that the SEC will reconsider its segment reporting requirements (Rappaport et
al. 1968, p.23).
September 1967 the Accounting Principles Board of the AICPA, the predecessor
of the FASB, issued Statement No. 2, Disclosure of Supplemental Financial Information
by Diversified Companies. That non-binding statement urged diversified companies to
voluntarily disclose supplemental industry segment financial information. Diversified
companies were defined as companies that expand into different industry lines by
acquisition, merger, internal development or a combination thereof (AICPA 1967, para.
11). To provide guidance, the statement identified the segment disclosures that some
firms were voluntarily providing. Moreover, it asserted that "experience derived from

25
voluntary disclosure efforts, together with conclusions to be derived from research
activities and further study should provide . . . a sound basis for making a definitive
pronouncement in the future on the need for, and the extent of, disclosure of
supplemental financial information by diversified companies" (AICPA 1967, para. 13). It
is important to note that though the data gathered by the Accounting Principles Board
showed an increasing trend toward the voluntary disclosure of segment profit (Horwitz
and Kolodny 1982, p.54), hardly any previous research had addressed segmented
information.
Interestingly, Accounting Principles Board Statement No. 2 was not the first
voluntary segment information pronouncement issued by a private sector standard-setter.
In 1939, the Committee on Accounting Procedures, the initial private sector standard-
setter, issued Accounting Research Bulletin No. 4, Foreign Operations and Foreign
Exchange. It urged U. S. enterprises "to follow the 'safe rule' of recognizing earnings
from foreign operations only to the extent of actual cash remittances in light of the
'disturbed conditions abroad' (a euphemism for World War II)" (Pacter 1993, 8). In
addition, it suggested that firms fully disclose the extent of foreign items included in their
financial statements (Pacter 1993, p.8). "In 1953, Accounting Research Bulletin No. 4
was codified into Chapter 12 of Accounting Research Bulletin No. 43, Restatement and
Revision of Accounting Research Bulletins. Chapter 12 eased off a bit on the safe rule of
recognizing foreign earnings only when cash is remitted to the United States" (Pacter
1993, p.8). Instead, it proposed that firms recognize foreign earnings to the extent that
unrestricted funds are available for transmission. Moreover, that pronouncement relaxed

26
guidance concerning the disclosure of foreign items. That is, it put forth that U. S. firms
should fully disclose the extent to which financial statements include significant foreign
items (Pacter 1993, p.8).
Although, Accounting Principles Board Statement No. 2 referred to future
mandated segment reporting disclosures and substantiating research studies, the AICPA
neither completed a follow-on segment reporting study, nor mandated segment reporting
disclosures. However, when the Accounting Principles Board issued Statement No. 2, it
was aware that a segment reporting study (Mautz 1968) had been undertaken by the
Financial Executives Research Foundation, the Financial Executives Institute’s research
affiliate. Further, it was aware that in August 1966, representatives of both the Financial
Executives Research Foundation and the Financial Executives Institute met with SEC
representatives, jointly adumbrated a research proposal, and obtained the SEC’s
commitment to defer new segment reporting disclosure requirements until after the
completion of the study. It is noteworthy that the Financial Analysts Foundation (now the
Association of Investment Management Research) expressed support of the Financial
Executives Research Foundation proposal (Zeff 1972, p.203).
In recognition of the SEC’s intention to reconsider its segment reporting
requirements, groups other than the Financial Executives Institute as well as individual
researchers undertook segment reporting projects. The first completed effort, the Tulane
Symposium on Public Reporting by Conglomerates, was held in November 1967. During
a two day period, papers regarding the pros and cons of segment reporting were
presented and discussed by government officials, corporate officers, certified public

27
accountants, stock exchange officers, security analysts, and academicians (Rappaport
1968,v). That timely comprehensive effort benefitted subsequently completed studies.
Considering the correspondence between the SEC’s 1969 and 1974 segment reporting
mandates, no doubt, the most influential research was that published prior to 1969
(Horngreen 1955; Mautz 1968; Backer and McFarland 1968; and Cramer 1968).
However, it is reasonable to presume that research studies published between 1969 and
1974 (Kinney 1971; Rappaport and Lerner 1972; and Kochanek 1974), influenced the
SEC’s 1974 mandate that registrants disclose segment line of business profitability in
annual reports distributed to their stockholders.
Section 2.3.1 SFAS No. 14
In 1973, the FASB superseded the Accounting Principles Board, and placed
segment reporting along with the development of a conceptual framework on its initial
agenda. Significantly, that same year, the New York Stock Exchange issued a white
paper recommending that stockholders receive annual reports which include segment
disclosures at least as extensive as those in firms’ annual reports to the SEC (FASB 1976,
para. 45). To progress with its technical agenda, in May 1974, the FASB issued a
segment reporting Discussion Memorandum and held related public hearings in August
that same year (FASB 1976, para. 50). An Exposure Draft of the proposed standards was
issued in September 1975 (FASB 1976, para. 51), and the final statement, SFAS No. 14,
was issued in December 1976.
At the outset, SFAS No. 14 required the disclosure of both annual and interim
period information pertaining to an enterprise’s industry segments, geographic area of

28
operations, export sales, and major customers. Briefly, when promulgated SFAS No. 14
provided limited guidance concerning the determination of industry segments and
geographic areas of operations. In addition, it required the disclosure of the following
information by industry segment: types of products and services; external revenue;
intersegment revenue; operating profit or loss; depreciation expense; capital
expenditures; identifiable assets; equity in net income of, and investment in, investees
accounted for by the equity method; and cumulative effects of changes in accounting
principles. Further, SFAS No. 14 required the disclosure of the following geographic area
information: external revenue; intersegment revenue; operating profit or loss, net income,
or some other common measure of profitability between operating profit or loss and net
income; and identifiable assets. SFAS No. 14, also, required the disclosure of certain
quantitative information concerning both export sales and sales to major customers.
Furthermore, SFAS No. 14 required a firm to reconcile certain information and to
disclose its intersegment pricing basis(es) and the effect any changes thereto. Finally, the
FASB’s segment disclosures which were required to be included in the scope of an
independent audit, were more extensive in come cases than the SEC’s (FASB 1976; and
Pacter 1993, pp.14-16).
Shortly after issuing SFAS No. 14, the FASB pronounced four amendments
thereto. Specifically, SFAS No. 18, Financial Reporting for Segments of a Business
Enterprise—Interim Financial Statements (1977), rescinded the requirement to report
interim period segment information. SFAS No. 21, Suspension of the Reporting of
Earning per Share and Segment Information by Nonpublic Enterprises, exempted

29
nonpublic firms from the requirements of SFAS No. 14 (FASB 1978). SFAS No. 24,
Reporting Segment Information in Financial Statements That are Presented in Another
Enterprise’s Financial Report (FASB 1978), exempted reporting entities, whose
consolidated financial statements included certain separable financial statements, from
disclosing segment information about those separable financial statements. Lastly, SFAS
No. 30, Disclosure of Information about Major Customers (1979), amended the SFAS
No. 14 provision concerning the determination of major customers (Pacter 1993, pp.17-
18). Except for SFAS No. 18, the amendments did not, significantly, alter the mandated
segment reporting information available to financial statement users. However, SFAS
No. 18 did set the stage for financial analysts’ future vehement criticisms regarding the
lack of interim period segment information.
Although, the push to disclose line of business information began as an antitrust
issue, the Federal Trade Commission did not find the SEC’s segment reporting data
useful. Hence, the Federal Trade Commission introduced its own line of business
information program in August 1974. Federal Trade Commission personnel justified their
program on the premise that the SEC’s mandates gave firms too much flexibility in the
determination of lines of business. Therefore, to enhance its inter-firm analyses of
domestic manufacturing activities, the Federal Trade Commission required firms to
report information by standard industrial code categories. Thus, the Federal Trade
Commission’s data were based on manufacturing processes and the raw materials
employed therein, rather than on the economic markets in which firms operated.
Comparatively, the data mandated under the Federal Trade Commission’s program was

30
not as extensive as that mandated under the programs of either the SEC or the FASB.
Further, though the Federal Trade Commission required reporting on an as ordered basis,
reporting was only ordered annually. Lastly, unlike the data of the SEC or the FASB, the
Federal Trade Commission’s data did not come under the scope of an auditor’s
examination (Barefield and Holstrum May 1979, pp.108-111).
In December 1977, one year after the FASB’s pronouncement of SFAS No. 14,
the SEC issued Accounting Series Release No. 236 to announce the adoption of
Regulation S-K, an integrated disclosure form. Regulation S-K was established primarily
to integrate the FASB’s SFAS No. 14 industry segment financial statement information
requirements, with the SEC’s registration statement, annual reports, proxy, and
information statement requirements. Moreover, Regulation S-K set forth, for fiscal years
beginning after December 15 1976, that registrants describe their business by focusing on
their industry segments. Regulation S-K required registrants to present historical revenue,
profit, and asset data concerning both industry segments and geographic areas of
operation. (SEC 1997, Accounting Series Release No. 236 summary).
Because the FASB had rescinded its SFAS No. 14 interim period requirements,
the SEC asserted it would be inappropriate to require the disclosure of such data, except
under certain circumstances. Moreover, the SEC asserted that registrants need only
discuss historical segment data which, in the opinion of management, would may not be
indicative of either the current or the prospective operations of the segment. Furthermore,
concerning interim period segment data, the SEC declared that “a more reasoned decision
. . . will be assured by consideration of . . . an analysis of the experiences of registrants

31
and investors alike with . . . segment information (SEC 1977, Accounting Series Release
No. 236).
In March 1978 the SEC issued Accounting Series Release No. 244 (now Financial
Reporting Release No. 503.03) to provide additional guidance concerning the
determination of industry segments. Mainly, Accounting Series Release No. 244
emphasized that firms should employ the segment identification procedures of SFAS No.
14. Moreover, the release pointed out that information on a less-than-total-enterprise
basis is required to provide users with the information needed to evaluate risks and return
on investment (SEC 1978, Accounting Series Release No. 244, para. A).
In 1980 the SEC augmented its earlier MD&A guidelines for narrative
discussions and analyses of registrants’ financial conditions and results of operations. In
addition, the SEC set forth that MD&A guidelines are intentionally general, and reflect
the view that a flexible approach, rather than a restricted approach, elicits more
meaningful disclosures (SEC 1989, FRR No 36 interpretive rule para. I; also in C&L
manual p.1055).
In 1986 as a result of observations made during its audits, Coopers & Lybrand
submitted a proposal to the SEC recommending both increased MD&A business risk
disclosures and the performance of specific related independent auditor review
procedures. Shortly thereafter, a white paper, entitled The Future Relevance, Reliability,
and Credibility of Financial Information, was issued by seven of the largest U.S. public
accounting firms. It, too, called for increased risk disclosure but suggested that the

32
disclosures should be separate from the MD&A and subject to audit coverage (SEC 1989,
FRR No 36 para. I; also in C&L manual pg 1055).
Accordingly, in response to auditors’ business risk disclosure concerns, in 1987
the SEC formally requested comments about the adequacy of MD&A requirements and
the proposals it had received. Not surprisingly, almost all of the 196 commentators
opposed the increased disclosure requirements. Moreover, they put forward that either
stricter enforcement and review or an additional interpretive guidance would improve
compliance. Consequently, the SEC initiated a special review of MD&A disclosures. The
aim of the project was fourfold: (1) to evaluate the adequacy of MD&A disclosures, (2)
to determine widespread deficiencies, (3) to provide guidance regarding the MD&A
requirements, and (4) to determine the need for revisions thereto. Based on the results of
its review the SEC concurred with the majority of the commentators. Accordingly, the
SEC did not amend its MD&A requirements, but in 1989 it issued an interpretive release
(SEC 1989, FRR No 36 interpretive rule para. I; also in C&L manual p.1055).
In 1997, the Financial Accounting Standards Board (FASB) issued a new segment
reporting standard: Statement of Financial Accounting Standard Number 131 (SFAS No.
131), Disclosures about Segments of an Enterprise and Related Information (the
Standard) (FASB 1997). SFAS No. 131 was issued in response to analysts’ discontent
with SFAS No. 14 reported industry segment information. Analysts’ principal concerns
regarding SFAS No. 14 are explicated in the Association of Investment Management
Research’s (AMIR’s) 1993 financial reporting position paper (Knutson 1993). Therein,
the AIMR maintained that most financial analysts find SFAS No. 14 reported industry

33
segment disclosures to be helpful, yet inadequate. The AIMR observed that the SFAS
No. 14 industry segment definition is broadly defined, and thus inherently problematic.
The AIMR asserted that many financial statement preparers both recognized and
exploited the flexibility of that definition. To support its assertion, the AIMR commented
that one of the ten largest firms in the United States, consistently, reported just one very
broadly defined industry segment. The AIMR acknowledged, however, that to develop an
industry segment definition, which would be suitable for different firms, which operate
under dissimilar circumstances, would be difficult (Knutson 1993).
Several factors other than the SFAS No. 14 industry segment definition also led
analysts to express increased discontent with reported industry segment disclosures. First,
analysts perceived that the understandability of reported industry segment information
decreased, when firms implemented SFAS No. 94, Consolidation of All Majority-Owned
Subsidiaries. Implementations of that standard consolidate subsidiaries whose business
activities differ from those of their parent corporations. Hence, the consolidations
obscure important previously disclosed information. Second, segment information has
become more important because of widespread merger and acquisition activity, the ever
increasing globalization of firms’ production and marketing activities, and the
deregulation of certain industries. Third, the relative importance of segment information
has increased because institutional investors are more active in the equity markets and
more analysts are using sophisticated financial modeling technology. Finally, because the
relative importance of segment information has increased, analysts are dissatisfied with,
merely, annual reported industry segment information (FASB and CICA 1993, summary;
34
Knutson 1993).
Besides the AIMR, the AICPA Special Committee on Financial Reporting (the
AICPA Special Committee) also examined analysts’ segment reporting information
needs. The two groups’ suggestions for improving segment disclosures were, generally,
congruent and are as follows: (1) firms should report segment information annually and
quarterly, (2) most firms should disclose more segments, (3) firms should reveal more
information about each segment, (4) firms’ bases of segmentation should correspond
with that of their internal management reports, and (5) firms should provide reported
segment information which is consistent with information disclosed in other parts of their
annual reports (Knutson 1993; AICPA 1994; and FASB 1997). The AIMR, unlike the
AICPA Special Committee, also suggested that firms should disclose internally
employed segment information. The AIMR maintained that, if the such disclosures were
mandated, analysts would “assume more responsibility for making meaningful
comparisons of those data to the unlike data of other firms” (Knutson 1993, p.61).
In general firms employ reporting structures which reflect industry segments, or
geographic areas of operations, or both. Nevertheless, most firms are organized by
industry segment (AICPA 1994). Thus, the AIMR and the AICPA suggestions for
improving reported segment disclosures, in effect, recommend that firms disclose more
information about their industry business activities.

35
Section 2.3.2 SFAS No. 131
SFAS No. 131 is effective for annual financial statement periods beginning after
December 15, 1997 . SFAS No. 131 specifies the provisions which public firms are to5
follow to report: (1) annual and interim period information about their disaggregated
business activities and (2) annual firm-wide information about their products, their
services, their geographic operations, and their major customers. SFAS No. 131 was
issued to compel firms to release more useful segment information. Accordingly, the
FASB made this assertion:
The objective of requiring disclosures about segments of an enterprise and related
information is to provide information about the different types of business
activities in which an enterprise engages and the different economic environments
in which it operates to help users of financial statements:
a. Better understand the enterprise’s performance
b. Better assess its prospects for future net cash flows
c. Make more informed judgments about the enterprise as a whole. (FASB 1997,
para. 3)
To accomplish the FASB’s objective for segment disclosures, SFAS No. 131
requires firms to use the management approach to determine which segments to report
SFAS No. 131 superseded SFAS No. 14, SFAS No. 18, Financial Reporting for Segments of a Business5
Enterprise—Interim Financial Statements, SFAS No. 24, Reporting Segment Information in Financial Statements ThatAre Presented in Another Enterprise’s Financial Report, and SFAS No. 30, Disclosure of Information about MajorCustomers. In addition, it amended SFAS No. 94 to remove its special disclosure requirements for previouslyunconsolidated subsidiaries. Furthermore, it amended Accounting Principles Board Opinion No. 28, Interim FinancialReporting, to require the disclosure of certain segment information in the interim period financial reports issued tostockholders (FASB 1997, para. 2).

36
and what information to report about each segment (FASB 1997, para. 4). The
management approach has two basic premises. The first, is that a firm’s segments should
be evident from its organizational structure. The second, is that the disaggregated
information that a firm discloses should be derived from the information set that its chief
operating decision-maker regularly employs to make resource allocation decisions and to
assess firm performance (FASB 1997, para. 10).
The chief operating decision maker is defined as an activity which may be
performed by a group of people, rather than by a manager with a specific title. The chief
operating decision maker allocates resources to and assesses the performance of the
operating segments of a firm (FASB 1997, para. 12). An operating segment is defined as
a component of a firm’s internal reporting structure which exhibits three attributes: (1) it
operates business activities from which it may earn revenues and incur expenses, (2)
discrete financial information is available for its business activities, and (3) its financial
information is regularly reviewed by the chief operating decision-maker to make resource
allocation decisions and to assess performance (FASB 1997, para. 10).
SFAS No. 131 requires firms to determine their disclosed or reported segments
and the corresponding reported segment disclosures by employing the operating segment
definition. A firm is permitted to voluntarily disclose all of its operating segments, but a
limit of ten is suggested (FASB 1997, para. 24). Accordingly, using stipulated
aggregation criteria and quantitative thresholds a firm may aggregate the information of6
SFAS No. 131 explicates two types of quantitative threshold tests: (1) a 10% test and (2) a 75% test. The purpose of6
the 10% test is to identify a firm’s significant operating segments and to compel the firm to separately report theinformation pertaining to those operating segments. However, the purpose of the 75% test is to ensure that theinformation regarding an adequate number of operating segments is separately reported. See SFAS No. 131paragraphs 18-24 for a detailed discussion of the quantitative thresholds and aggregation criteria.

37
certain operating segments. The components of a firm which do not meet the definition
of an operating segment must be reported in an all other category. Post retirement benefit
plans, inclusive of pension plans, are not operating segments (FASB 1997, para. 11).
SFAS No. 131 also requires a firm to disclose annually the following descriptive
information about its reported segments: (1) the manner in which its segments are
determined, (2) the products and services that are sold by its segments, (3) the differences
between the measurements it uses for its segment disclosures and those it for its
consolidated financial statements, and (4) the changes in the measurements it uses to
determine segment information from period to period (FASB 1997, summary).
Moreover, SFAS No. 131 requires a firm to disclose annually the financial
measures which are employed by its chief operating decision maker for operating
decision making purposes. Specifically, for each reported segment, a firm is to disclose
the following information: (1) a measure of segment profit or loss, (2) certain items
included in that measure of segment profit or loss, (3) a measure of total assets, and (4)
certain items included in that total asset measure (FASB 1997, para. 27). Although,
segment cash flow information is not required, certain information associated with cash
flows is to be disclosed.
Further, SFAS No. 131 requires a firm to disclose annual reconciliations of these
items to the corresponding amounts in its consolidated financial statements: (1) total
segment revenues, (2) total segment profit or loss, (3) total segment assets, and (4) every
other significant total segment disclosure (FASB 1997, para. 32). In addition, significant
reconciling items are to be separately identified and described.

38
If the firm changes its internal structure so that it, also, changes the composition
of its reported segments, then unless it is impracticable, the firm is required to either: (1)
restate the corresponding information for earlier reporting periods or (2) disclose segment
information for both the old and the new bases of segmentation in the year in which the
change occurs (FASB 1997, paras. 35-36).
Limited segment disclosures are also required on an interim period basis (FASB
1997, para. 33). However, it should be noted that both annual and interim period segment
disclosures are intended to provide financial statement users with reliable information
that can be employed for intra-firm analysis purposes (FASB 1997, para. 87).
To help financial statement users develop inter-firm comparative information,
SFAS No. 131, also, requires a firm to disclose certain enterprise-wide information, if its
segment disclosures do not provide it (FASB 1997, para. 7). That is, the firm is required
to report enterprise-wide information regarding the following items: (1) its product and
service (or groups of similar products and services) revenues, (2) the countries in which it
earns revenues or holds long-lived assets, and (3) its major customers (FASB 1997,
paras. 36-39).
In contrast with the required segment disclosures, a firm’s enterprise-wide
disclosures are to be reported even if that information is not employed by its chief
operating decision maker. However, the firm is not required to disclose enterprise-wide
information, which is not used internally, if reporting it would be impracticable (FASB
1997, paras. 37-38).

39
Section 3.3.2 A Comparison of SFAS No. 131 and SFAS No. 14
Several important issues differentiate SFAS No. 131 from SFAS No. 14. The
first, is the manner in which firms disaggregate their business activities. The second, is
the required reported segment disclosures. The third, is the required reporting frequency
of reported segment information.
Under SFAS No. 131 firms disaggregate and determine what information to
report by employing the management approach. The management approach requires the
disclosure of just one basis of segmentation. That basis of segmentation is the basis that
the chief operating decision-maker employs to make operating decisions and to assess
firm performance. Under SFAS No. 14 firms were to disaggregate by employing the
industry and geographic segment approach. Therefore, they were to reveal two bases of
segmentation—their industries of operations and their geographic areas of operations.
Unlike SFAS No. 131, SFAS No. 14 does not explicate procedures for identifying the
segments that firms were to report. Instead, SFAS No. 14 provides a very general
industry segment definition, however, it does not provide a geographic segment
definition. Additionally SFAS No. 14, unlike SFAS No. 131, exempted firms from
disclosing their vertically integrated operations. Although SFAS No. 14 and SFAS No.
131 include quantitative thresholds, those of SFAS No. 14 were of limited usefulness
because of the vagueness of the industry segment definition.
Under the management approach, unlike under the industry and geographic
segment approach, firms derive their reported segment financial measures from the
information set that the chief operating decision-maker employs to make operating

40
decisions. Hence under SFAS No. 131, unlike under SFAS No. 14, a firm’s reported
segment financial measures are not required to be consistent with the generally accepted
accounting principles which the firm employs to derive its consolidated financial
measures. Additionally, firms are permitted to asymmetrically allocate expenses and
assets to reported segments. Further, firms are not required to report the same reported
segment financial measures that other firms report.
Under SFAS No. 14, unlike under SFAS No. 131, all firms were required to
report geographic revenue, profit or loss, and identifiable asset information. Under SFAS
No. 14, all firms were required to report country of domicile export sales in excess of 10
percent of consolidated firm revenue, but SFAS No. 131 does not require firms to
disclose any export sales information. SFAS No. 131 and SFAS No. 14 require firms to
disclose the same information concerning major customers. However, SFAS No. 131,
unlike SFAS No. 14 explicates that the federal government, a state government, a local
government, or a foreign government, are each to be considered a single customer (FASB
1997, para. 39).
The FASB maintains that several benefits should result from the application of
the SFAS No. 131 management approach, rather than the SFAS No. 14 industry and
geographic segment approach. First, “knowledge of the structure of an enterprise’s
internal organization is valuable in itself because it highlights the risks and opportunities
that management believes are important” (FASB 1997, para. 59). Second, “an ability to
see an enterprise ‘through the eyes of management’ enhances a [financial statement]
users ability to predict actions or reactions of management that can significantly affect

41
the enterprise’s prospects for future cash flows” (FASB 1997, para. 60). Third, firm’s
SFAS No. 14 industry segments were determined subjectively, however, “segments
based on an existing internal structure should be less subjective” (FASB 1997, para. 60).
Fourth, firms are likely to report more detailed information about their reported segments
(FASB 1997, para. 59), and some firms will report a greater number of segments (FASB
1997, para. 113). Fifth, reported segments which correspond to the way that a firm is
organized and managed should be consistently employed throughout the annual report
and in other information releases of the firm (FASB 1997, paras. 61 and 113).
Consequently, reported segment disclosures should be more useful.
Nevertheless, the FASB concedes that “segments based on the structure of an
enterprise’s internal organization may not be comparable between enterprises that engage
in similar activities and may not be comparable from year to year for an individual
enterprise” (FASB 1997, para. 62). The FASB also concedes that “comparability between
enterprises and consistency in the application of methods over time increases the
informational value of comparisons of relative economic opportunities or performance.
The significance of information, especially quantitative information, depends to a great
extent on the user’s ability to relate it to some benchmark” (FASB 1980, Summary of
Principal Conclusions).
The FASB observes, however, that “improving comparability may destroy or
weaken relevance or reliability if to secure comparability between two measures, one of
them has to be obtained by a method yielding less relevant or less reliable information.
Historically, extreme examples of this have been provided in some European countries in

42
which the use of standardized charts of accounts has been made mandatory in the interest
of inter-firm comparability but at the expense of relevance and often reliability as well.
That kind of uniformity may even adversely affect comparability of information if it
conceals real differences between enterprises” (FASB 1980, para. 116).
The FASB also emphasizes that when it issued SFAS No. 14 it was concerned
that segments defined using the industry and geographic segment approach might be “of
limited usefulness for comparing an industry segment of one enterprise with a similar
industry segment of another enterprise (i.e., for inter-enterprise comparison). Inter-
enterprise comparison of industry segments would require a fairly detailed prescription of
the basis or bases of disaggregation to be followed by all enterprises, as well as
specification of the basis of accounting for intersegment transfers and methods of
allocating costs common to two or more segments” (FASB 1976, para. 76).
SFAS No. 14 expressed the FASB’s concerns about developing a detailed
prescription of the bases of disaggregation. Therein the FASB maintained that
“differences among enterprises in the nature of their operations and in the extent to which
components of the enterprise share common facilities, equipment, materials and supplies,
or labor force make unworkable the prescription of highly detailed rules and procedures
that must be followed by all enterprises. Moreover, . . . differences in the accounting
systems of business enterprises are a practical constraint on the degree of specificity with
which standards of financial accounting and reporting for disaggregated information can
be established (FASB 1980, para. 74). “Those same considerations persuaded the . . .
[FASB] not to adopt more specific requirements in . . . [SFAS No. 131]. Both relevance

43
and comparability will not be achievable in all cases, and relevance should be the
overriding concern” (FASB 1997, para. 65).
Section 4 Analysts Use of Segmented Reported Information
Analysts’ use of segment reporting information has been directly studied by
employing several research methods: questionnaire/interview, protocol analysis, and
content analysis.
The survey method was the first method used to study analysts’ use of segment
information. One of the earliest studies, Backer and Mc Farland (1968), employed an in-
depth interview method to survey one hundred forty-three financial analysts and
commercial bankers to determine their uses of segment information. The analysts gave
the following principle reasons for using segment information: (1) to gain knowledge of
the business a company is in and the relative size of its various components, (2) to
forecast consolidated profits (to do so sales, contribution margin, and profits are needed),
and (3) to evaluate the success of a firm’s acquisitions (Backer and Mc Farland 1968, pp.
1-14). With regard to the first reason, analysts indicated that operating results are affected
by both risk and prospects for future earnings growth. Thus, operating performance will
differ significantly by industry (Radebaugh 1987 pp. 43-44).
Mautz (1968) employed a mail questionnaire to survey financial analysts and
corporate executives. A principle purpose of the study was to identify the type of
segment information need by analysts and that produced for internal use by firm
management. Mautz found similarities between the two types of information (Mohr
1983).

44
Steedle (1983) interviewed twenty-two users of SFAS No. 14 segment data. All
of the users indicated that they employ segment data to evaluate individual firms, to
predict earnings, and to compare companies. Twenty of the users indicated that they
employ segment information to compare like segments in different companies. Nineteen
indicated that they employ the information to assess risk. Seventeen indicated that they
employ segment data to compare firm data to industry data (42). The general finding of
the study is that analysts percieve that segment data allow them to better understand a
complex firm’s financial statements (41).
Emmanuel and Garrod (1987) personally interviewed sixteen randomly selected
investment analysts to determine how they use segment information. The employed
analysts were a cross-section of London brokerage firms and institutional investment
companies. The interviews were conducted between April-August 1985 and spanned
between one and a half and three hours. The analysts were asked questions and were
allowed to respond without interruption. Then additional prompting questions were
offered to gain information about the frequency, reliance, and criticism of segment
information (p.236). The analysts indicated that the primary reason for using segment
information is to forecast firm earnings 12-24 months into the future (p. 236). All of the
analysts indicated that they consult the segment disclosure for all of the firms that they
follow. However, over 30% of the analysts perceive that 10-40% of the firms which
disclose segment information, do not obey the spirit of the requirements and are
attempting to disclose how components of the firm are performing.

45
A 1989 Financial Analysts Federation (FAF) mail survey concerning quarterly
segment reporting information reported similar findings. That study reported that three
hundred and ninety United States (351) and Canadian (39) investment professionals out
of 1700 returned their questionnaires, for an overall response rate of 23%. The
respondents were portfolio managers (42%), analysts (34%), portfolio manager/analysts
(11%), and other investment professionals (13%). The study found that voluntarily
disclosed quarterly segment data is used for comparison with industry and economic
data. Further, the respondents indicated that such data is useful for the following
purposes: (1) to make comparisons with other companies in comparable industries
(Appendix, Question 12; 90% of the analysts; 54% frequently, 36% sometimes), (2) to
evaluate past performance (Appendix, Question 13; 94% of the analysts; 61% frequently,
32% sometimes), (3) to assess future potential (Appendix, Question 14; 94% of the
analysts; 62% frequently, 32% sometimes), and (4) to measure the degree and type of
risk associated with a firm’s business activities (Appendix, Question 15; 95% of the
analysts; 58% frequently, 37% sometimes). The respondents percieve that quarterly
segment information is necessary to understand the operating results of many firms. They
maintain that the disclosure of quarterly segment information will save them time spent
trying to gather or estimate the information. Further, they maintain that eight quarters of
data are likely to reveal trend information which would be undetectable in two years of
data. Notably, however, less than 20% of the respondents strongly agreed that earnings
estimates developed for firms that provide quarterly segment information are more
accurate than those developed for firms which do not provide such information.

46
Boersema and Van Weelden (1992) personally interviewed thirty-three Canadian
financial analysts to determine among other issues their use of segment reporting
information. The interviews were conducted in the summer of 1990 and averaged two
hours. A mix of open-ended and objective questions were employed to give the analysts
an opportunity to expand on the questions asked and to give the researchers the
opportunity to explore rationale for the answers provided. Of the thirty-three interviewed
analysts only one stated that she did not generally employ segment reporting information
because of its questionable reliability. Each of the other analysts specified how they use
the information. Ninety-four percent of the analysts indicated that they develop an overall
dollar amount of a firm’s earnings forecasts (p. 16).
An open-ended question was employed to determine the importance of the
disclosure of segment information. The second most frequent response to that question
was the prediction or forecasting of earnings. The most frequent response to the question
was to “understanding the company”. (pp. 17-18).
Eighty-eight percent of the analysts said that they either develop point or range
forecasts of a firm’s industry segment earnings (73% always or usually). However, that
percentage probably understates the importance of segment forecasts. The reason is that
one analyst stated that he always develops such a forecast for “the company’s that count”
and explained that he give less attention to the company’s that trade infrequently. Three
of the analysts stated that they would make segment forecasts more frequently if the
requisite information were available (p. 18).

47
All of the analysts stated that they use industry segment disclosures to evaluate
past segment performance prior to making their industry segment forecasts. One analyst
commented that using segment information is “the only way an outsider can analyze the
company’s prospects. The data are essential—otherwise you are just guessing. Lack of
segment data deteriorates the forecast” (p.18).
Geographic data are not used as frequently as industry segment data to make
forecasts. One analysts said that he used geographic data to understand the industry.
However, he noted that by itself it is “not very useful stuff”. Nevertheless, 86% of the
analysts reported that they use geographic data at least sometimes; thus it is important to
most analysts (p. 18).
Before developing their industry or geographic segment forecast, at least some of
the time, most analysts develop an overall forecast for the relevant industry or geographic
region. Several analysts stated that the information required to develop an overall
forecast is not always available or the information may not be directly comparable. Some
analysts who stated that they “rarely” or “never” develop an overall forecast do develop
general assessments of the industry outlook. They characterized the industry outlook as
“more initiative”, rather than as a “forecast”(p.18).
Analysts ranked the following uses of segment reporting information in order of
importance: accountability, risk assessment, comparison, and prediction. Sixty-one
percent of the analysts ranked accountability first and 79% ranked it either first or
second. Some of the analysts commented that the ranking was rather artificial. Several
indicated that the other uses are part of the prediction process. To illustrate, one analysts

48
said “I use the other three to come to prediction” and “accountability and comparisons
are steps in the process leading to prediction; then, I seek to gauge the risk associated
with that prediction” (p. 18).
Boersema and Van Weelden found that analysts employ segment information for
comparison purposes. They noted however that in response to an open-ended question,
concerning the use of segment information, only one analyst mentioned comparison.
They posit that others did not answer similarly because comparison is not an end
purpose. Instead, it is a means for accomplishing other purposes, such as prediction. They
found that most analysts (69%) compare the industry segment earnings of one firm with
those of another firm at least sometimes (58% always or usually). However, less than
half of the analysts (48%) ranked comparison as first or second in order of importance.
Seven analysts indicated that if segment reporting data were more comparable or if there
were a greater number of comparable firms then they would be inclined to make
comparisons more frequently.
Boersema and Van Weelden employed an open-ended question to determine the
aspects of segment disclosures that limit the usefulness of the information for comparison
purposes. The most frequently mentioned limitation (12 times) concerned broad or no
segment definitions. The second most frequently mentioned limitation (9 times) pertained
to perceived variations in the definitions of operating income. The third (5 times) is that
the segment income statement detail lacks sufficient detail. Thus, as Boersema and van
Weelden observe, the second and third limitations are related. The lack of income

49
statement detail makes it difficult to assess the comparability of segment operating
income (Boersema and van Weelden 1992, 21).
Differences concerning the following accounting policies were also mentioned as
limitations: capitalization, deferred taxes, full costs versus successful efforts, corporate
overhead allocations, and selling and administrative expenses (Boersema and van
Weelden 1992, 21). It is of note however that six analysts made unprompted comments
which stressed that in spite of the limitations segment reporting information is useful. For
example, one analysts said, “it doesn’t stop comparison; put in a long-term trend it
becomes useful” (21). Another said, “everything I get is useful” (21). Still another, “I’m
less concerned with not perfect compatible definitions; its never perfect—there are few
‘pure plays’” (21). Yet another stated “I don’t know what they are talking about; I know
the differences in accounting treatment” (21). The last asserted that “comparisons are
always meaningless” (21), but he said that he does “look at overall trends” (21).
Boersema and van Weelden assert that the limitations of segment reporting data
may preclude analysts from making precise comparisons of the profitability of the
segment of one firm with that of another. But the data are used by analysts for at least
trend analysis purposes. Thus, the comparison made are usually relative rather than
absolute (21).
Boersema and Van Weelden observe that Radebaugh’s (1987) analysis of the
international aspects of segment information view risk in three dimensions: (1) country
specific, (2) industry specific, and (3) company specific. Thus, they assert that industry
and geographic segment information should be useful for risk assessment (p. 22). Not

50
surprisingly, most of the analysts (69%) perceive that industry segment data are
important for risk assessment. However, a slightly lower proportion (58%) consider
geographic segment information important for risk assessment. Of the four uses of
segment reporting information risk assessment was ranked either first or second in
importance by 42% of the analysts (p.22).
Boersema and Van Weelden illustrate the importance and the use of industry
segment information for risk assessment purposes by providing the following analyst
comments:
(1) “want to know which industry segment is dominant—where the biggestrisk is”.
(2) “helps reduce error in the estimates; some segments are much morevolatile than others”.
(3) “want to know what percentage of revenue and earnings are from whichsegment and to be aware of possible developments in that segment; forexample, if a large new competition affects that segment or if raw materialis aluminum and a strike is coming. If 85 percent of revenue is from thatbusiness, you worry much more than if it is only 15 percent”.
(4) “would adjust the multiple for individual segments to reflect the degree ofrisk”.
(5) “really trying to see problem areas or areas of high potential” (p.23).
Boersema and Van Weelden observe that if industry segment information is to meet
analysts’ risk assessment needs then firm activities should be segmented based on risk
(p.23).
Boersema and Van Weelden emphasize that though analysts indicated geographic
risk assessment is of less importance than industry segment risk assessment, risk
assessment is an important use of segment information. They stress that for two reasons
Canadian analysts attribute less importance to geographic segment information. First,

51
most of the firms followed by the analysts operate primarily in Canada. Second,
geographic disclosures are usually too broad to be useful. They maintain that for firms
that operate internationally, geographic disclosures would be useful to analysts.
Protocol analysis is a technique that requires subjects to perform a task and to
concurrently orally explain their thought processes. That technique divides the task into a
set of subtasks or protocols. Protocol analysis has been used in several studies which
examine analysts’ decision-making processes and their use of accounting information,
inclusive of segment reporting information. For example, Bouwman et al. (1995) employ
the technique to determine the relevance of GAAP-based and non-GAAP based
information in the investment screening decisions of twenty financial analysts.
Bouwman et al. (1995) assert that the investment screening decision is the first
phase of a financial analysis. The objective of the screening decision is to observe
financial analysts while they were formulating a decision. Financial analysts were asked
to think out loud while evaluating the information. The resulting verbalizations, provide
pictures of what the decision maker goes about the task. This study shows that the
investment screening task consists of two rather distinct components: searching for
reasons to reject the company, and assessing the future earnings potential. The results
suggest that GAAP-based information plays a dominant role in eliminating unattractive
investment candidates. Analysts take advantage of the standardized format and
presentation of GAAP-based information to quickly review the company essentials.
Bouwman et al. (1995) assert that the second part of the screening decision
involves assessing its future earnings potential. In this particular situation, GAAP-based

52
information plays a much less significant role. The assessment of earnings relies, for the
most part, on qualitative information and on information about individual segments. The
analysts evaluated the earnings potential of the company by assessing and accumulating
the earnings potentials of the individual segments.
Frishkoff et al., (1984) employ the protocol analysis technique to analyze twelve
buy-side analysts decision-making processes. They found that segment reporting
information and information about competitors garnered much more attention than did
any other type of information. They asserted that analysts spend more time analyzing
segment reporting information than was suggested by early questionnaire survey studies
of analysts’ use of financial statement information (e.g. Buzby 1974; and Chandra 1974) .
They concluded that the perceived importance and actual importance of accounting
information, as measured by use may be different constructs. Relative to questionnaires
and interviews, protocol analysis facilitates a more comprehensive description of the
types of information employed by analysts. However, protocol analysis is an expensive
time consuming methodology. Thus, the technique employs small sample sizes and the
results are not generalizable (Rogers 1996).
Unlike questionnaires and protocol analysis, content analysis can be employed to
systematically assess the actual information cited by analysts in their reports. Previts et
al. (1994) employ content analysis to identify the most frequently cited information in
479 sell-side analysts’ published reports. They found that on average analysts employed
segment related phases 47.6 times per report. Income-statement-related phrases were the
only other grouping of related word and phrases which were reported more frequently. In

53
addition, they found that analysts frequently disaggregated earnings information into a
greater number of segments than specified by firms’ segment disclosures. Moreover, they
found that analysts frequently discuss the performance of significant products or
individual locations. Furthermore, they found that when forecasting the results for each
segment of a firm, some analysts consider the effects of the relevant industry, the
economy, and the company as a whole (pp. 61-62).
Rogers and Grant (1997) seminally employ context-specific content analysis to
identify the likely source of the annual report information reflected in 187 sell-side
analyst reports. With regard to segment reporting information they found that analysts
reported product, geographic area, and industry segments which differed from SFAS No.
14 required information. They also found that analysts often disaggregated the following
information by segment or division: backlog, capacity, shipment, and volume (p.23).
They conclude that analysts report an extensive amount of disaggregated information, but
most of it is not reflected in the segment reporting disclosure note. Some of the
information was available in the narrative sections of the annual report (primarily the
management discussion and analysis section). However, the source of most of the
information was not determinable (pp.25-26).
Main et al. (1997) employs the experimental method to directly examine the
decision usefulness of two different types of segment definitions: segments defined by a
firm’s internal organizational structure and segments defined by grouping of similar
products and services. They focus on how those types of segment definitions “affect

54
analysts’ perceived reliability of segment disclosures, confidence in their earnings
forecasts and stock valuations, and strength of their stock recommendations” (p. 2).
Main et al. (1997) provided 56 financial analysts with an average of five years of
professional investment experience with two years of financial data for a hypothetical
company which reported information for three operating divisions as two segments in its
annual report” (p. 2). Two variables, congruence and similarity, were factorially crossed
between subjects. To test the congruence factor the analysts were told that evidence
indicates that the reported segments were either congruent or incongruent with those
employed for management reporting purposes. To test the similarity factor the two
aggregated divisions were either similar or dissimilar in terms of products, customers,
and distribution channels. The materials were designed to obscure the below-industry-
average performance of one division when it was combined with a division with
dissimilar products. However, its true performance was revealed when the divisions with
similar products were combined.
Maines et al. found that analysts percieve segment reporting to be more reliable
when there is congruence between external and internal segments and when segments
with similar products are combined. Their study provided the FASB with ex ante
information about the decision usefulness of the disclosures proposed by the exposure
draft that led to SFAS No. 14.

55
Section 5 Summary and Conclusions
The literature review has revealed that the decision-usefulness theory has not
been extensively researched in the accounting literature. The FASB and Staubus have
provided the accounting literature with the only full versions of the decision-usefulness
theory. Both agree that the evaluation of whether the accounting objective is
accomplished is only determinable by individual financial statement users.
The attributes of financial accounting information found in the literature review
have focused on three major themes: relevance, reliability, usefulness. Relevance is also
represented by timeliness. Reliability is represented by attributes such as freedom from
bias, verification, neutrality. The usefulness attribute has been discussed in terms of the
presentation of accounting information–consistency, and comparability; and the attributes
of information needed in order for it to satisfy decision-maker’s needs–understandability,
sufficiency, simplicity, and completeness. The threshold for the information provided in
financial statements is materiality.
There are five major benefits from the application of the SFAS No. 131
management approach, rather than the SFAS No. 14 industry and geographic segment
approach: (1) knowledge of the structure of an enterprise’s internal organization is
provided thus highlighting the risks and opportunities that management believes are
important, (2) an ability to see an entity through the eyes of management improves users
ability to predict actions or reactions of management that can significantly affect the
entity’s prospects for future cash flows, (3) entity’s segments are more objectively
determined because they are based on an existing internal structure, (4) entity’s are likely

56
to report more detailed information about their reported segments as well as a greater
number of segments and, (5) reported segments which correspond to the way that a firm
is organized and managed should be consistently employed throughout the annual report
and in other information releases of the firm. Hence, reported segment disclosures
should be more useful. However, the FASB concedes that segments based on the
structure of an enterprise’s internal organization may not be comparable between
enterprises that engage in similar activities and may not be comparable from year to year
for an individual enterprise. The FASB also concedes that comparability between
enterprises and consistency in the application of methods over time increases the
informational value of comparisons of relative economic opportunities or performance.
The research studies regarding the use of segment disclosures by analysts report
that segment data allow them to better understand a complex firm’s financial statements.
This understanding facilitates: (1) using segment information to forecast firm earnings
12-24 months into the future; (3) making comparisons with other companies in
comparable industries; (4) evaluating past performance; (5) assessing future potential;
and (6) measuring the degree and type of risk associated with a firm’s business activities.

CHAPTER 3
Research Methodology and Design
Section 3.1 Introduction
The objectives of this research and methodology are: (1) to provide an
understanding of the two paradigms we employed to generate our conceptual theory:
value focused thinking and classical grounded theory; (2) and to describe our research
methodology. Thus, this chapter is organized as follows: Section 2 describes the Value-
Focused Thinking Paradigm, the extent to which we employ it, provides its history, why
we employ it, sets forth its framework, provides research examples, and discusses the
advantages and disadvantages of employing it; Section 3 identifies the three types of
classical grounded theories, identifies our rationale for employing the classical grounded
theory methodology, provides a brief history of it, succinctly describes it, provides
research examples, and discusses its strengths and limitations, and the challenges of
employing it. Section 3 provides a brief history of the mixed methods research
methodology, identifies the limitations of mixed methods studies, uses the mixed
methods core characteristics definition to describe our study, and describes the two
phases of our study.
57

58
Section 3.2.1 The Value-Focused Thinking Paradigm
In this section we describe the value-focused thinking paradigm. Further we
identify the extent to which we use its concepts. We do this because, in this study, we
generate an exploratory conceptual theory, which is best understood in the context of the
value-focused thinking paradigm’s decision frame. We stress, however, that our study is
not a value-focused thinking analysis. Rather we use the concepts, of the paradigm, to
facilitate conveying our theory. In keeping with the procedures of our theory generation
method, classical grounded theory, we identified this paradigm as our overarching
conceptual framework after we had generated our theory.
Section 3.2.2 A Description of the Value-Focused Thinking Paradigm
Value-Focused Thinking is a decision analysis paradigm. Therefore, like decision
analysis, it is a philosophy and a methodology for analyzing complex decision problems
(Keeney 1982, 806-807). A decision analysis comprises these steps: (1) structuring the
decision problem, (2) identifying the alternatives, (3) specifying the decision-maker’s
preferences (values), (4) employing the articulated values to evaluate the alternatives, and
(5) employing the articulated values to select an alternative (Keeney 1982, p.830). Utility
theory is employed to quantify decision-maker’s preferences for the alternatives (Keeney
1982, pp.806-807). Keeney (1992, p.iiiv) refers to this sequencing of steps as reactive.
The reason is that alternatives are specified, before values are specified.
A decision analysis executed using the value-focused thinking paradigm, to
examine a decision problem, shifts the initial focus from identifying alternatives to
identifying values (desires). The intent is to have better decision consequences, rather

59
than better alternative evaluations. Thus this paradigm is proactive, rather than reactive
(Keeney 1992, p.iiiv).
Although a complete value-focused thinking decision problem analysis comprises
the aforementioned steps, a decision analyst need not employ each. A partial analyses
that examines aspects of the overall problem where guidance is most needed is typically
sufficient. Partial analyses often include one or more of the following steps: structuring
the decision problem, articulating decision-makers’ values, and clarifying the
consequences of differing alternatives (Keeney 1982, pp.806-807).
Section 3.2.3 The Extent to which this Study Employs the Value-Focused ThinkingParadigm
We employ the value-focused thinking paradigm as the overarching theoretical
model for the theory we generate. Specifically, we accept as given the framework this
paradigm uses to articulate the logical connection between values, objectives, decisions,
and factual information. Further, we employ the terms that describe this framework to
convey our theory and taxonomy. Accordingly, we assert an alike framework articulates
the logical connections among fundamental-equity analysts’ segment disclosure
information values, their objectives, their decision contexts, and segment reporting
information.
Section 3.2.4 Brief History of the Value-Focused Thinking Paradigm
Discerning the history of value-focused thinking is difficult, because it is a
decision analysis paradigm. Thus, its history is entwined with that of decision analysis.
Complicating matters further, the decision analysis content and name have evolved over

60
a long time span (Keeney 1982, pp.825-827). Moreover, this literature has normative and
descriptive origins, but is primarily prescriptive (Smith 2004). The following brief
historical account begins with its normative origins and ends by succinctly differentiating
value-focused thinking and decision analysis.
Subjective probability, utility and game theory, are the normative foundations of
decision analysis. The earliest known papers concerning either subjective probability or
utility were written in the 1700's. The first is a paper written by Bernoulli in 1738, which
explored whether people employ expected value concepts when choosing among
gambles, in particular when buying insurance. In so doing Bernoulli set forth a
logarithmic expected utility function that explained observed deviations from the
expected value model. The second, is one written by Bayes in 1763, which set forth a
method for incorporating observations into probability functions. The result is what is
now known as Bayes Theorem (Smith 2004).
Ramsey (1931) seminally explicated a theory of decision-making based on both
subjective probability and utility. He demonstrated how these two concepts are expressed
by preferences among gambles. DeFinette (1937) advanced key ideas that facilitate
representing beliefs as subjective probabilities. In the 1940's von Neumann and
Morgenstern (1944, 1947) began to use subjective probability and utility to explore
economic issues. In so doing they developed the axioms of what is now known as the
expected utility model. Moreover they laid the foundation for game theory (Smith 2004).
Wald (1950) employed game theory and an expected-loss criterion, instead of
utility theory, in his classic work on statistical decision problems. In doing so, Wald

61
emphasized an important problem: how to consider informal information about specific
states of the world. Other statisticians and decision theorists built on Wald’s work and
advocated using judgmental probabilities to address his statistical decision problems
(Keeney 1982, pp.825-827). Importantly, Savage (1954) provided a philosophical basis
and axiomatic framework for integrating utilities and subjective probabilities into Wald’s
statistical decision problems framework (Keeney 1982, 825-827). Savages’s work led to
what is now known as the subjective expected utility model (Smith 2004).
In the 1960's the study of decision-making took a descriptive turn. This was
advanced by the work of a psychologist, Edwards (1954). Bell reviewed the economics
and statistics literature concerning utility concepts. As a result, psychologists began
studying behavioral decision-making, by employing subjective expected utility as their
baseline and explored observed deviations. This led to the study of biases and heuristics
in judgment and decision-making (Smith 2004).
In the 1960's decision analysis took a prescriptive turn. This occurred when
researchers, especially those at Harvard (Howard Raiffa, Robert Schlaifer, and John
Pratt) and Stanford (Ronald Howard), began to apply statistical decision theory to
examine business problems involving uncertainty (Schlaifer 1959; Raiffa and Schlaifer
1961; Pratt 1964; Pratt et al. 1964, 1965; Howard 1965). Given its applied nature,
initially, this body of work became known as applied statistical decision theory. However
to emphasize its broad nature Howard (1966) coined the term decision analysis (Smith
2004).

62
Keeney and Raiffa (1976) is the first endeavor to set forth analytical tools to
explore the value aspects of decision problems. They introduce two concepts: preferential
and utility independence. Keeney (1992) stresses the importance of values and objectives
in analyzing problems. Hammond, Keeney, and Raffia (2000) argue that decision
analysis has broad applicability and includes value analysis. They emphasize value
oriented problem identification and formation (Raffia 2002, p.185).
Keeney views value-focused thinking as a field of practice distinct from decision
analysis (Raffia 2002, 185; Keeney 1992 pp.iiv-ix). He maintains that value-focused
thinking differs from decision analysis in three important ways. First, an endeavor is
made to articulate the values of decision-makers. Second, value articulation precedes all
other activities. Third, articulated values are clearly employed to identify potential
decision opportunities, rather than to evaluate the alternatives of a quantitative objective
function (Keeney 1992).
Section 3.2.5 Why We Employ the Value-Focused Thinking Paradigm
As was previously stated the value-focused thinking paradigm is our over arching
theoretical model. This paradigm is a prescriptive approach for improving and
understanding complex decision-making. Our study generates and explores a conceptual
theory. We do not seek to both improve and understand complex decision-making.
Therefore, ours study is not a value-focused thinking analysis. Rather, we use concepts of
this paradigm to facilitate our aims.
We searched various literatures (accounting, information systems, economics,
psychology, mathematics, library and information science, and decision sciences) for an

63
explicit definition of information. We did this to enhance our understanding of the
relation between decision-makers, decision-making, and information. Surprisingly we
were not able to locate one, even in the value-focused thinking literature. The value-
focused thinking literature does, however, examine the relations among factual
information, values, objectives, decision contexts, and decision-makers.
We explore the information qualities that decision-makers desire. In value-
focused thinking terminology, we endeavor to understand decision-makers’ information
values. Consequently, we employ the value-focus thinking paradigm to better convey the
relations among reported segment disclosures, the decision usefulness value judgments
thereof, decision contexts and the objectives of fundamental-equity analysts.
Section 3.2.6 An Explication of the Value-Focused Thinking Framework
We use the concepts of the value-focused thinking paradigm to better convey the
concerns of fundamental-equity analysts who employ segment reporting information to
better understand firms. An analytical tool of this paradigm, the Value-Focused Thinking
Framework with Flow of Information Indicated (Keeney 1992, p.46), facilitates
abstracting our theory. We accept as given the underlying assumptions of this
framework, because it articulates the logical connection between decisions, objectives,
values, and information. These assumptions, however, are central to better appreciating
the universality of our theory. Therefore, the terms used to convey these concepts are
defined next.
Value-Focused Thinking Framework with Flow of Information Indicated is a
decision frame. A decision frame is the basis upon which a decision is made. A decision

64
is framed by the alternatives and the values that the decision-maker considers to make a
decision. Jointly, the decision context and the fundamental objectives constitute the
decision frame (Keeney 1992, pp.30-33).
A decision situation is framed when the alternatives and the objectives
correspond. Correspondence is evidenced by objectives that are adequate to evaluate the
considered alternatives, and when the alternatives are adequate to describe the ways in
which the objectives can be achieved. The purpose of explicating the decision frame is to,
clearly, differentiate issues germane to the decision under consideration, from other
decisions facing the decision-maker (Keeney 1992, pp.30-33).
Decisions, decision-makers, decision contexts, and values are central to a decision
frame. A decision is defined as the act of allocating one or more resources (Keeney
1992). The resource can be of any type. This includes time, money, property, etc.
Decisions are made by decision-makers.
A decision-maker is defined as any decision-making entity. Thus, a decision-
maker could be a person, an organization, or a society. Decision-makers make decisions
to further at least one objective. An objective is a statement that identifies a specified
thing that one hopes to achieve, by allocating the resource. An objective has three
distinguishing attributes: (1) a decision context, (2) an object, and (3) a direction of
preference (Keeney 1992, pp.34-40)
The decision context is the contemplated activity. The alternatives follow directly
from that activity. A decision context could be an alternative in a broader decision
context (Keeney 1992, p.35).

65
Values are defined as the things germane to a decision and about which the
decision maker cares (Keeney 1992, p.3). Values are used to evaluate the actual or
potential consequences of an alternative or decision (Keeney 1992, p.7). Some values are
tangible; others are intangible. To increase monetary wealth is a tangible value. To better
understand data is an intangible value. To obtain relevant information is an intangible
value.
Values are made explicit when they are expressed in writing. Values that are
useful for decision-making are those whose meanings are precisely stated. A well
articulated value definition will include the value’s distinguishing attribute(s) and its
objective(s). A qualitative value definition may also be augmented with quantitative
value judgments (Keeney 1992, p.7).
There are fundamental and means objectives–both are dependent on the decision
context (Keeney 1992, pp.34 and 41). The fundamental objectives are the pressing
reasons for considering a decision (Keeney 1992, p.33). Fundamental objectives
delineate both the values of concern in the decision context and the set of consequences
about which the decision-maker is concerned. The fundamental objectives are the end
objectives, rather than the means objectives. The decision context and the fundamental
objectives are mutually dependent–thus they must be compatible (Keeney 1992, p.30).
A means objective is only of interest because of its implications for the extent to
which a more fundamental objective may be achieved. Means objectives may facilitate
analysis and identifying alternatives. However, fundamental objectives are the crucial
objectives (Keeney 1992, p.34).

66
A strategic decision context is the most general decision context facing a
decision-maker (Keeney 1992, p.40). It is the complete set of alternatives available to the
decision-maker. The fundamental objectives of the strategic decision context are the
decision-makers eventual end objectives. These eventual end objectives are defined to be
the strategic objectives. Objectives other than the strategic objectives are merely means
to achieve the strategic objectives (Keeney 1992, pp.40-41).
All decision-makers have strategic objectives, whether or not they are explicated.
These objectives are intended to guide all decision-making. Strategic decisions are made
over time and are the way in which strategic objectives are pursued. Well articulated
strategic objectives increase the likelihood that decision-makers will make decisions over
time that move them closer to achieving their strategic decisions (Keeney 1992, p.41).
In Figure 3.2, the Value-Focused Thinking Strategic Fundamental Analysis
Decision Context Framework, factual information and values link the strategic objectives
to the specific objectives of the other decisions facing the decision-maker. Factual
information is essential for perceiving the logical association between alternatives and
objectives. It is useful to conceive of facts as exogenous, and therefore the result of other
decision situations. In this conceptualization, facts come through the upper, lower, and
side walls of the specific decision frame.

67

68
Values, expressed as value judgements, are the links between the fundamental
objectives of the specific decision situation and the strategic objectives of the decision-
maker. Like facts, it is useful to conceive of values as exogenous to the specific decision
situation (Keeney 1992,p. 47). Unlike values, the value-focused thinking literature does
not explicitly define factual information.
Section 3.2.7 Research Examples of the Value-Focused Thinking Paradigm
Value-Focused thinking analyses like other forms of decision analysis are
generally proposed by those who provide decision analyses services. Accordingly, most
analyses are guided by consulting firm decision analysts. Generally, these analyses entail
classified or confidential data and thus are not published (Edwards 1984, p.10).
Although we searched, in the accounting literature, we were not able to locate any
value-focused thinking studies. Nevertheless, we did locate a number of representations
in other literatures. What follows is a description of a full value-focused thinking analysis
and a few examples of studies that report either a full or partial analysis (Keeney 1982,
pp.806-807). These are intended to demonstrate similarities and differences among
published analyses. Moreover, they evidence the attributes of studies that employ value-
focused thinking as their theoretical models. They illustrate the complexity of the
examined decisions.
A full value-focused thinking analysis develops a value model and possibly a
means-ends model. A facilitator generally oversees the development process, which
starts with identifying the values or issues of concern in the decision situation. Once
identified these values are employed to identify the decision situation objectives. The

69
objectives are specified by individuals interested in and knowledgeable about the
situation. These need not be specified by the decision-makers. This makes possible
analyses involving complex decisions, in which neither the decision-makers, nor their
decision processes are apparent (Keeney 1992, p.56).
The initial objectives, once identified, are classified as either fundamental or
means objectives. Next, the set of fundamental objectives are specified. This entails
decomposing each objective into its logical parts. The specified fundamental objectives
are then structured into an objectives hierarchy. Each part of a fundamental objective
should be mutually exclusive. As a set, the parts of each fundamental objective should be
exhaustive. The values hierarchy is employed to devise a quantitative value model
(Keeney 1992, pp.56-69).
The set of means objectives, on the other hand, are then examined to identify their
relationships with each other. Some of these objectives are the ways (means) in which
other objectives are achieved. Therefore, the means and ends objectives are differentiated
and examined. Next, the network of relationships among the means and ends objectives
is specified. This network constitutes the means-ends network (Keeney 1992, pp.56-69).
Structuring the value hierarchy and the means-end network facilitates identifying
and adding missing objectives. These two types of objective structures are the foundation
for devising two distinct types of quantitative models. The fundamental objectives
structure is employed to devise a value model, which facilitates assessing the
consequences of specified objectives. The means-ends objective structure is employed to

70
a devise means-ends model, which facilitates jointly assessing specified objectives,
alternatives, and consequences (Keeney 1992, pp.56-69).
The aforementioned description of a full value-focused thinking analyses
succinctly describes a set of qualitative and quantitative procedures performed to devise
quantitative models that facilitate making complex decisions. Qualitative research
methods are employed to obtain the data needed to devise the quantitative models. For
example, Keeney (1992) is a case study involving British Columbia Hydro and Power
Authority, which is a publically owned utility company. Therein a value model (utility
function) is devised that conceptualizes the firm’s strategic plan. This value model sets
forth the firm’s strategic objectives and its corresponding value trade-offs. The primary
expected benefit is that future decision-making will be guided by the firm’s articulated
values. Hence, the following are expected to improve: (1) economic opportunity
identification, (2) intra-organization communication, (3) stakeholder input, and (4)
regulatory reviews.
Parnell et al. (1998), another case study, develops a strategic value model for
ensuring U.S. air and space dominance. This model was devised on behalf of the U.S. Air
Force Chief of Staff. Its development involved the participation of better than 200
military experts. A value hierarchy and value model were devised.
Hamill (2005) develops and integrates three distinct value models into a strategic
value model. Moreover a set of software tools that facilitate sensitivity analyses were
also devised. The decision problem is to attain–at an acceptable cost and minimal
operational impact–satisfactory information assurance. Information assurance is defined

71
as protecting, defending, and correcting information and information systems to ensure
the following: (1) that they are available when decision-makers need them, (2) that
control over them is maintained, (3) that information is accurate and complete as
possible, and (4) that if control is lost it will be detected and regained and the information
system will be restored to its prior state. The strategic objective is attaining information
assurance. These are the objectives of the three valuation functions: (1) protecting
information and information systems, (2) detecting loss of information or information
systems, and (3) reacting to regain control over and restore information and information
systems to their prior states. A literature review of Department of Defense (DOD) and
non-DOD documents was performed to identify the strategy objective and those of the
three valuation functions. Experts assessed the valuation framework and supporting
software tools, during their development.
Keeney (2007) analytically illustrates how the U.S. government might devise
value models for anti-terrorist activities. This is accomplished by devising an alike model
for a single terrorist’s theft and misappropriation of plutonium. Accordingly judgments
about the terrorist’s objectives were assessed by working with scientists at Lawrence
Livermore Laboratory. Moreover, these scientists identified attributes that were intended
to measure the extent to which these objectives were attained. Additionally, they
identified a numeric range for each attribute in order to consider a range of potential theft
targets. The preference ranking is specified from the terrorist’s viewpoint. Two value
model forms (additive and multiplicative) are specified and rationalized.

72
Keeney (2007) asserts that it is in the national interest of U.S. citizens to expend
the resources necessary to clearly specify national values and choice alternatives.
Furthermore, these should be used to guide the crucial decisions associated with
terrorism and its aftermath. He points out that only one value model is needed to guide
both identifying and assessing the alternatives.
Partial value-focused thinking analyses stop short of developing quantitative
value models or quantitative means-ends models. Nevertheless, like full analyses, these
studies examine complex decision contexts. For example, Keeney (1999) is a survey
study that puts forward in general equation form the value proposition, from a customer’s
standpoint, of online purchasing. This value proposition is defined as the net value of the
benefits and costs of the both the product and processes costs associated with the
purchase. Processes costs include finding, ordering, and receiving the product.
Keeney (1999) opportunistically identified and surveyed a sample of 100 people.
Some were surveyed individually; others were surveyed in groups. The study participants
were from more than 20 countries, and were at least 18 years old (approximately 75%
were under 35. Some had used the internet; others had not. Some were connected to the
internet others were not.
Keeney’s (1999) general equation value model was devised by interviewing the
participants to determine their online purchase product and processes costs desires. These
values were then converted into objectives and categorized as either fundamental or
means objectives. Finally, the relationships among the categorized objectives were
depicted in a means-ends network. Maximization of customer satisfaction is the overall

73
fundamental objective. Keeney asserts that the value proposition of an online purchase
could be articulated to potential customers by explaining the components of the
fundamental objective. Moreover, the means objectives represent the diverse ways in
which a firm could alter the value proposition.
Merrick et al. (2005) devise an objectives hierarchy and proposed corresponding
attribute measures; they do not set forth a valuation model. The strategic decision context
is organizational safety, within the U.S. oil tanker operations of a undisclosed
multinational firm. This firm generates, distributes, and transports energy. Its strategic
objective was to prevent catastrophes. A framework identifying the following three
decision contexts and their corresponding fundamental objectives was devised: (1)
individual safety, (2) operational vessel safety, and (3) organizational safety. Moreover,
the attributes that could be employed to measure the attainment of these objectives were
specified, but not validated.
Thirteen firm personnel representing four distinct groups (vessel crew, health and
safety, vetting personnel, and top management ) were interviewed to obtain the
information needed to devise the framework. Each group consisted of three to four
individuals. On average these individuals had worked within their domain of expertise
for 19.5 years, with the firm for 19 years, and had both on and offshore experience. The
non-top management interviews spanned three hours. However, top management access
was limited. Consequently, these interviews were just 90 minutes (Merrick et al. 2005).
A final example of a partial analysis is Dhillon and Torkzadeh (2006). They
examine the strategic decision context of maximizing information system security within

74
organizations. They identify fundamental and means objectives, but do not devise a value
hierarchy or value model. They limit their examination to threats within, rather than
external to the organization. They interviewed 103 managers to discern their values
concerning managing information system security. They identified and classified 86
objectives into nine fundamental objectives and 16 means objectives.
Dhillon and Torkzadeh (2006) employed an expert panel of seven information
security experts to validate their objectives and classifications. They assert that most
information system security research is technical, rather than socio-organizational. They
suggest that their objectives classifications could be employed to devise a model for
measuring intra information system security. Moreover, they indicate it could be
employed to facilitate theory development.
Section 3.2.8 Advantages and Disadvantages of Employing the Value-FocusedThinking Paradigm
Employing the value-focused thinking paradigm, as a means for examining
decision problems has advantages and disadvantages. One important advantage is that,
frequently, the essence of the problem is more clearly understood (Keeney 1982, p.822).
Another important advantage is that this paradigm explicitly sets forth, prioritizes, and
processes value judgments in order to enhance decision-making. Subjective judgments
are an integral part of most decision-making and especially of public policy decision-
making.
With a value-focused approach, value judgments are employed to prioritize
facilitating the desired outcome, rather than to prioritize choosing from a set of
alternatives. Hence both the reality and the perception of achieving the desired aim are

75
improved (Keeney 1982, p.829). A related advantage is that the value-focused thinking
framework provides a mechanism that facilitates independently checking important
decision problem elements (Keeney 1982, p.822).
Yet another advantage is that this paradigm can increase the productivity of
multiple-stakeholder teams engaged in addressing decision problems. The reason is that
by making values explicit, stakeholders discussions will make evident disagreements
about likely consequences verus disagreements about the relative desirability of these
consequences. These discussions facilitate conflict identification and reduction (Keeney
1992, p.25).
The most common disadvantage of employing the value-focused thinking
paradigm is that users will claim that the analysis solved the problem. The analysis is
employed to better understand the ‘big picture.’ However users must understand that it is
not designed to solve the problem, rather it is designed to produce insight and further
creativity. Like all analyses, value-focused thinking analyses only focus on an aspect of a
problem (Keeney 1982, p.823). Other problems include poor analysis, decision analysis
team members who have poor interpersonal skills (Keeney 1982, p.823), and effective
but non-implemented analyses (von Winterfeldt and Edwards 1987, pp.527-529).
Section 3.3.1 Classical Grounded Theory
In this section we identify the three types of classical grounded theories, discuss
our rationale for employing the classical grounded theory methodology, provide a brief
history of it, succinctly describe it, provide research examples, and discuss its strengths
and limitations, and the challenges of employing it.

76
Section 3.3.2 The Three Types of Classical Grounded Theories
There are three distinct types of classical grounded theories: substantive, formal,
and general substantive. Substantive grounded theories are theories grounded in data
pertaining to a particular substantive area. These theories are generated using the
classical grounded theory methodology, which is characterized by a distinct constant
comparison process. As a consequence, the generated hypotheses pertain to a particular
substantive area (Glaser 1978, 1998).
The abstraction level of substantive theory hypotheses is a function of the
substantive data employed and what these data convey to the researcher. Substantive
data, are data of any type, that pertain to a specific substantive area (Glaser 1978, p.52).
In the context of the accounting discipline, each of the following are examples of a
substantive area: (1) a retail location, (2) a manufacturing facility, (3) an overhead
function (personnel, accounting, finance, marketing etc.) of a firm, (4) a stakeholder of a
firm, and (5) a firm’s financial statements.
Substantive theories range from being delineative to very abstract. They address
real world concerns, and for that reason are of interest to both researchers and
practitioners. Classical substantive grounded theories have been generated by social
science researchers publishing in disciplines such as health care, political science,
business, sociology, education, and economics (Glaser 1978, 1998).
Classical formal grounded theories, like classical substantive grounded theories,
are generated using the classical grounded theory methodology. The formal theory
generation process is initiated by identifying an important concern (core variable) of a

77
substantive area. However, the data employed to generate these theories are selected
from both the original substantive area and other substantive areas (Glaser 2007, pp.1-4).
For example, in the accounting discipline context, these substantive data would reflect
multiple entities. Moreover, these data might pertain to any of the following or
combinations thereof: (1) retail locations, (2) manufacturing facilities, (3) overhead
functions (personnel, accounting, finance, marketing etc.), (4) stakeholders, (5) financial
reporting information, (6) government regulations, and (7) accounting authoritative
pronouncements.
To generate a formal theory a substantive theory is first generated, in whole or in
part. Then the most important variable (core variable) of the substantive theory is further
examined using data from multiple substantive areas. These data are used to discern the
most important implications of the core variable. The result is a theory composed of
conceptual generalizations that are broadly applicable and context neutral. To employ
formal theories, in a particular context, one merely modifies the hypotheses to reflect the
context. As with substantive theories, the level of abstraction of these hypotheses is a
function of the data employed and what these data convey to the researcher. Few true
formal grounded theories have been published (Glaser 2007, 1-4).
Substantive general grounded theories are theories that are more general than
substantive theories, yet not as broadly applicable as formal theories. These theories are
generated using data from a broadly specified area (Glaser 1978, p.52). In an accounting
context, such an area might be U.S. industry specific financial accounting, managerial
accounting, or auditing practices.

78
All classical grounded theories are, merely, a set of identified, named, and
interrelated hypothesized concepts. These hypotheses are grounded in empirical data,
because they are generated using the classical grounded theory methodology, in whole or
in part. The extent to which the essence of this methodology is grasped and executed has
implications for how likely the generated theory will convey real world phenomena.
These theories are not scientific laws, rather they are empirically generated
conceptualizations of social phenomena. These conceptualizations are intended to be
modified, as necessary, should new empirical data indicate modifications are warranted
(Glaser and Strauss 1967; Glaser 1978, 1998, 2007).
Section 3.3.3 Our Rationale for Employing the Classical Grounded TheoryMethodology
We selected the classical grounded theory methodology because it sets forth
procedures for generating relevant and modifiable theory, which fits the real world.
These procedures foster examining data for their conceptual, rather than descriptive,
import. Employing these procedures, in whole or in part, facilitates generating integrated
concepts, indicators, and hypotheses from data of any type–qualitative, quantitative, or a
combination thereof (Glaser 1998, 4; Glaser 2003, p.91; Glaser and Holton 2005, p.16).
Hence, the classical grounded theory methodology is apt for both empirically generating
and exploring a theory that has real world applicability.
We employ the classical grounded theory methodology to generate a formal
grounded theory, the Data Decision-Usefulness Theory. We modify our formal theory

79
and use it to explore fundamental-equity analysts’ perceptions of the decision usefulness
of post-1998 reported segment disclosures .7
We also employ the classical grounded theory methodology to devise a
taxonomy, the fundamental-equity analysts taxonomy. Our taxonomy explicates the
differentiating criteria of investment professionals who employ both the fundamental
analysis approach and financial reporting information to make equity investment
decisions, pertaining to U.S. domiciled firms. Therefore, our taxonomy is a contextual
typology. A typology is a theory, which sets forth differentiating criteria. A typology
developed using the classical grounded theory methodology is a special class of grounded
theory (Glaser 1978, p.65).
Section 3.3.4 Brief History of Classical Grounded Theory
The Discovery of Grounded Theory, which was written by Glaser and Strauss
(1967), is the first full description of the classical grounded theory methodology. The
seed of this methodology, however, is a published paper: Constant Comparative Method
of Qualitative Analysis (Glaser 1965); it was reprinted verbatim in The Discovery of
Grounded Theory. Theoretical Sensitivity, (Glaser 1978), further develops the
methodology. Doing Formal Grounded Theory, (Glaser 2007), expounds on procedures
for generating a formal theory. Glaser’s works subsequent to 1967, and we have
mentioned but a few, were published with the aim of clarifying both the methodology
and its rationale (Glaser 1998, 1992, 2003, 2007).
We also modify our formal theory to specify several other contexts. These modifications are set forth in Appendix7
3.0. These modifications illustrate how future qualitative or quantitative researchers could employ our formal theory intheir investigations.

80
Glaser (1998, 2007), asserts that his thinking was heavily influenced by his
exposure to Paul Lazarsfeld and Robert Merton. Exposure to the former helped him
develop flexible techniques for constantly comparing data (qualitative, quantitative, or
both) to perceive latent conceptual relations (Glaser 2007,11). Exposure to the latter
helped him appreciate that the best way to convey conceptual theories, is to think about
them abstractly but to write them up using concrete concepts. Consequently, Glaser
stresses that grounded theories should be both substantively and theoretically coded and
exhibit parsimony and scope (Glaser 1998, p.30).
Glaser and Strauss (1967) was written because colleagues read their earlier works,
which were grounded theories, and asked how they were generated. For that reason, its
intended audience is primarily sociologists. Its aim is to facilitate closing the gap
between theory and empirical research. It explicates procedures for generating, rather
than verifying, theory. Nevertheless, it asserts that both are necessary scientific pursuits
(pp.vii-x). Today the grounded theory methodology is used by researchers in a multitude
of disciplines including management, marketing, information systems, psychology,
education, and healthcare. Glaser (2007) asserts that he has made no significant
amendments to his perspective of the methodology, since Theoretical Sensitivity.
While The Discovery of Grounded Theory represents a collaboration between
Glaser and Strauss, Strauss’ subsequent works indicate that their ideas about how to
generate a grounded theory differ. These works include: Qualitative Analysis for Social
Scientists (Strauss 1987); Grounded Theory Research: Procedures, Canons and

81
Evaluative Criteria (Corbin and Strauss 1990); and Basics of Qualitative Research:
Grounded Theory Procedures and Techniques (Strauss and Corbin 1990).
Many non-sociologists find the jargon in The Discovery of Grounded Theory
confusing. Some of the uninitiated, in frustration, just give up trying to execute the
methodology. Others, however, make up their own variants. As a consequence, in
addition to Strauss’s work, there now several grounded theory variants (Stern and Porr
2011, pp.13-20).
Some grounded theory variants are more structured than others. Glaser asserts
that all have added to the confusion; his later works are intended to further explicate the
methodology (Glaser 1978, 1992, 1998, 2003, 2005). He also has established an institute,
which is devoted to helping people learn and improve their classical grounded theory
skills.
The classical grounded theory methodology was introduced as a methodology for
generating conceptual theories using either qualitative data, or quantitative data, or both.
However, it is primarily used by qualitative researchers. Its purpose is to generate
theories. Glaser asserts that some researchers have successfully executed the
methodology, while others have generated rich descriptions. He does not question the
merit of descriptive works, rather he stresses they are not classical grounded theories
(Glaser 1978, 1992, 1998, 2003, 2005).

82
Section 3.3.5 The Classical Grounded Theory Methodology
The reader is referred to Glaser (1978, 1992, 1998, 2003, 2005) for an explication
of the classical grounded theory methodology. What follows is a succinct description of
it. First, we provide an overview of the theory generating process. Then, we differentiate
the data employed to generate a grounded theory. As a consequence, we describe the
results and aim(s) of the two coding processes: substantive coding and theoretical coding.
We, also, identify the principle questions one should ponder while generating the theory.
Lastly, we summarize the methodology and its intended output.
Section 3.3.5.1 An Overview of the Theory Generation Process
The classical grounded theory methodology is a set of procedures for generating
theories that are grounded in data. Such a theory is generated by constantly comparing
and systematically coding data. This systematic process is called the constant comparison
process. It includes a set of questions, rules, and suggested flexible documentation
procedures (Glaser 1978, 1998).
The generated theory may be conveyed diagrammatically, in written form, or a
combination thereof. Theories in narrative form tend to be richer and are recommended
(Glaser 1978; Glaser 2005, 33). The diagrammatic form, however, best suits our
purposes, and will be employed herein.
The constant comparison process starts from the beginning of the theory
generation process. It is non-linear, and parts are guided by the discerned answers to

83
specific questions. It ends, only, when the theory is finally explicated (Glaser 1978,
1998).
Section 3.3.5.2 The Four Sets of Data
Four sets of data are used in the constant comparison process: initially collected
data, substantively coded data, theoretically coded data, and memos. Initial data are
collected as needed. All data, except for initially collected data, are researcher generated.
Memos, which document insights, are generated when inspired. Memos are sorted during
the theory write-up. Memo sorting facilitates developing an outline. Sorting also
facilitates better understanding the implications of the theoretical concepts. Substantively
coded data, theoretically coded data, memos, and the generated theory are outputs of the
constant comparison process (Glaser 1978, 1998).
Section 3.3.5.3 Initially Collected Data
Initially collected data are collected as needed. They are collected because they
are thought to express problems or issues of concern and the resolutions thereof. These
data are coded using the constant comparison process to discern the following: (1) the
population(s) to which these data pertain, (2) their problems, (3) their concerns, and (4)
how the population goes about resolving either or both. The generated theory is grounded
in these data. Hence, the abstraction level of the generated theory is a function the
abstraction found therein (Glaser 1978, 1998).
The type of data initially collected is dependent on the type of theory being
generated. If a substantive theory is being generated then the data will reflect one
substantive area. If a formal theory is being generated then the data will reflect a

84
multitude of substantive areas. If a general substantive theory is being generated, the data
will reflect representations from a broadly defined area (Glaser 2007, 4-5; Glaser 1978,
52).
Initially collected data play a special role in the classical grounded theory
methodology. Unlike other research methodologies, this methodology begins without an
a priori specified research problem. Rather, the research problem is identified by the
constant comparison of the initially collected data. An important problem or concern
expressed in these data becomes the research problem. Until this main concern is
identified all initially collected data is considered to be of equal import (Glaser 1978,
1998).
Initial data are collected as needed, to discern the answers to three kinds
questions. These questions guide the initial data constant comparison process. The
answers to these questions are discerned by executing that comparison process.
Furthermore, these answers facilitate determining what additional initial data are need
and where these initial data might be found. This type of data collection process is called
theoretical sampling. Its purpose is to better understand the research problem and its
resolution (Glaser 1978, 1998).
Section 3.3.5.4 Substantively Coded Data and The Substantive Coding Process
Initially collected data are fractured and substantively coded using the substantive
coding constant comparison process. Fracturing the data facilitates identifying their
conceptual similarities and differences. These similarities and differences are used to

85
classify initial data into categories. The fracturing process differs depending on whether a
substantive, formal, or general substantive theory is being generated.
For each category of import, the data therein are further examined to
conceptualize the category attributes. These attributes represent the category properties.
If necessary, more data are collected to more fully characterize the categories.
Categorized data are conceptually named and conceptually explicitly specified. If
necessary, more initial data are collected to identify more categories. The purpose of
collecting more initial data is to more fully characterize (saturate) the categories and their
properties. The substantive coding process is an inductive reasoning activity (Glaser
1978, 1998).
The process of constant comparison for the purpose of generating conceptual
categories and conceptual properties is called substantive coding. The categories and
their properties are latent patterns . Collectively, these latent patterns are called8
substantive codes. These latent patterns have the special property of being induced
through the constant comparison process. Thus, both correspond to the substantive world.
The aim of substantive coding is conceptual correspondence, not descriptive
correspondence (Glaser 2005, pp.11-12; Glaser 2003, p.82).
The purpose of substantive coding is to discern and to fully generate the core
category. The core category is the latent pattern that reflects the most important discerned
It is of note that in the context of structural equation modeling, the categories would be referred to as latent variables,8
and their properties would be referred to as latent variable indicators. Moreover, properties that conceptually describe acategory would be referred to as formative indicators. While properties that conceptually reflect a category would bereferred to as reflective indicators.

86
problem or concern of the population being studied. The core category is identified by
evaluating eleven specific criteria (Glaser 1978, pp.95-96).
A fully generated core category exhibits four characteristics: (1) fit, (2) relevance,
(3) workability, and (4) modifiability. Fit means the core category is an ideation
generated from the initially collected data. Relevance means the core category is an
ideation associated with an issue of import. Workability means the core category is an
ideation that is capable of being true without contradiction. Hence a category that works
does the following, with regard to the happenings in the area of inquiry: (1) explains, (2)
predicts, and (3) interprets. Modifiability means the core category is an ideation that is
capable of being changed should new data question its workability or relevance. These
four characteristics enable the researcher to perceive how the concepts of the generated
theory transcend the area of inquiry. As a consequence, a fully generated core category
of a substantive theory, will have formal or general substantive theory implications
(Glaser 1978, pp.4-5).
A fully generated core category is rich, full, and complete. Therefore, the
resulting theory makes sense and does not have gaps. When these conditions are
discerned the core category is considered saturated (Morse 1995; Glaser 1978, pp.94-96).
There are ranges of saturation. The more saturated the core category, the more
comprehensive the theory. The substantive coding process stops when enough
substantive codes have been discerned to generate a comprehensive and convincing
theory. The substantive coding process is guided by the answers to three kinds of
questions (Glaser 1978,p. 57).

87
Section 3.3.5.5 The Substantive Coding Questions
During the substantive coding constant comparison process researchers ask
themselves three kinds of questions. The first kind, reminds them that the theory is to be
grounded in the initially collected data, not in their preconceived notions. Moreover, it is
intended to help them become and remain receptive to what the data convey. There is one
question of this kind: “What is this data the study of”?
The second kind, is intended to help researchers perceive and refine substantive
codes and to help them perceive the relations among these codes. There is one question
of this kind, however, it has two forms: short and long. This is the short form: “What
category does this incident indicate” ? This is the long form: “What category or property
of a category, of what part of the emerging theory, does this incident indicate”?
The third kind, is intended to help researchers generate a core category. There are
four questions of this kind , however only the following two are directly related to this
study. “What accounts for the basic problem and process” ? “What is actually happening
in the data” (Glaser 1978, p.57)?
By continually asking themselves the aforementioned three kinds of questions,
researchers both focus and delimit their studies. The answer to the first question
identifies the research question(s). The answers to the second, facilitates assessing when
to stop theorizing. The answers to the third facilitate generating the theory (Glaser, 1978,
p.57).

88
Section 3.3.5.6 Theoretical Codes and the Theoretical Coding Process
Theoretical codes are concepts (abstract models), which illuminate hypothesized
systems. Theoretical codes exist in all literatures. However, the classical grounded theory
literature explicitly identifies more than 30 theoretical coding families. These coding
families are not mutually exclusive (Glaser 1978, pp.72-82; Glaser 1998, pp.163-175;
Glaser 2005, pp.5 and 21-30).
Perhaps the most familiar theoretical code is the independent-dependent variable
model; it is a member of the ‘Six C’s’ theoretical code family. Another family, the
theoretical family, facilitates characterizing the generated theory. This family includes
codes like parsimony, scope, integration, fit, relevance, conceptual level, relationship to
other theory, and explanatory and predictive power. Hence, it can be employed to assay
other theory–whether or not they were generated using the classical grounded theory
methodology (Glaser 1978, p.78).
The theoretical coding process is the process of examining the substantive code to
explicate the relations among the substantive categories. This is accomplished by
analyzing these relations to discern whether they reflect one or more theoretical codes. It
is during this deductive process, that the substantive core category is coded as the core
variable. The purpose of theoretical coding is to conceptually integrate the substantive
code (Glaser 2005, pp.10-15).
Theoretical coding is a conceptual modeling process. If the relation among a set
of substantive categories is not discerned, then a theoretical code is not specified.
Theoretical coding facilitates abstracting the theory. Theoretical coding can occur, or be

89
amended, or both, after at least two substantive categories have been discerned (Glaser
2005, pp.10-15).
The theoretical coding process is a deductive reasoning activity that enhances the
substantive code. The reason is that theoretical codes are an implicit attribute of all
theories. Discerning these codes from the substantive codes, and explicating them, makes
evident the multivariate nature of the theory. As a consequence, the structure of the
theory is easier to understand. Furthermore, the theory is more likely to be perceived as
plausible, relevant, and modifiable (Glaser 2005, pp.10-14).
Section 3.3.5.7 Summary
In short, the classical grounded theory methodology is both an inductive and
deductive theory generation process. If the essence of the methodology has been grasped
and executed, the result is a classical grounded theory. This theory will be a set of
integrated parsimonious hypotheses generated by conceptualizing data of a specified
scope. Its hypotheses will explain, predict, and interpret a problem or concern and its
resolution. The expectation is that these hypotheses will be modified, when and if it is
learned that they do not sufficiently convey real social phenomena. These hypotheses are
non-quantitative probability statements about the relations among concepts. Furthermore,
they will facilitate initiating other studies.

90
Section 3.3.6 Grounded Theory Research Examples
Gurd (2008) identifies and analyzes 24 accounting ground theory studies to
determine whether they exhibit the distinguishing grounded theory attributes. He finds
that, only, four refer to the classical grounded theory methodology. However, none of
these papers exhibited the four grounded theory attributes he expected to find: (1) a
coding and theory building process, (2) an iterative data collection process, (3) the use of
theoretical sampling, and (4) a comparative analysis.
Gurd (2008) finds that the other 20 studies employed one of four other grounded
theory methodologies (Strauss 1987; Strauss and Corbin 1990; Locke 2000; Orton 1997).
However, just one of these studies exhibits all four of the aforementioned attributes. He
questions whether any of the 24 studies are true grounded theory studies.
Joannides and Berland (2008) review the same studies, but assert that the
attributes Gurd (2008) sought are merely points of reference not demarcations. For that
reason they assert that each of the 24 studies is in fact a grounded theory study.
We observe, however, that a close reading of Glaser (1978, 1992, 1998, 2003, and
2005) supports Gurd’s rationale for specifying grounded theory attributes. Moreover, we
maintain that Gurd should have included at least three other attributes–a core variable,
memos, and saturation .9
We have not, however, examined these studies and thus make no evaluation as to whether or not they are true9
grounded theory studies.

91
Section 3.3.7 Strengths of Classical Grounded Theory
As a theory generation methodology, grounded theory is apt for exploring new
concepts and for re-examining previously studied concepts to gain new insights. For
exploratory studies, grounded theory is most fitting when the unidentified variables of
interest are thought to be salient. The reason is that salient variables are more quickly
identified than non-salient variables. Thus, the theory generation task will require less
time.
For re-examining mature research areas, grounded theory is most fitting when
used to better understand important practical problems. The reason is that, in these
situations, the requisite data will be readily available. Moreover, the researcher is likely
to find multiple salient variables that have not been previously examined, or new
relationships among previously identified variables (Stern 1980, p.20).
Section 3.3.8 Limitations of Classical Grounded Theory
Suddaby (2006) provides his perceptions of the shortcomings of grounded theory
papers submitted for review to the Academy of Management Journal. He maintains that
grounded theory is apt for making new discoveries or for providing fresh insights about
familiar issues. However, authors’ submissions reveal apparent misconceptions about the
grounded theory methodology. He discusses the six most common misconceptions, and
provides clarification.
Suddaby (2006) advocates the classical grounded theory methodology for
executing a grounded theory study. He warns however, that “. . . the genius of Glaser and
Strauss’s original methodology is that it outlines a procedure by which formerly tacit

92
processes are made explicit. The simplicity of grounded theory research, however,
creates the misperception that it is easy. . .“ (640).
Suddaby’s (2006) points out that authors should contemplate their intent before
deciding to conduct a grounded theory study. He declares that some research endeavors,
using this methodology, are more likely to be successful than others. Moreover, the most
suited endeavors are those in which the researcher aims to better understand how people
construct meaning from their societal experiences. The least suited endeavors are those in
which the researcher aims to better understand how people construct meaning from
objective reality.
Suddaby (2006) asserts that the successful execution of the classical grounded
theory methodology requires that the researcher make a commitment to both gaining the
skills necessary to successfully execute it and gaining considerable exposure to the
research subject area. He maintains that a successful execution requires both a knowledge
of what constitutes grounded theory and what constitutes the research area. He
acknowledges, however, that the more prior exposure researchers have to the research
area, the more difficult it will be for them to perceive what the data convey rather than
what they expect the data to convey. He cites Isabella (1990) and Sutton (1987) as
exemplars; both generate a conceptual model of a social process. We observe that
Isabella (1990) presents a substantive grounded theory, while Sutton (1987) presents a
general substantive grounded theory.

93
Section 3.3.9 Challenges of Employing Classical Grounded Theory
“Grounded theory has been increasingly adopted as the preferred qualitative
approach in accounting field study environments” (Smith 2003, p.139). Nevertheless
Smith observes, that like researchers in other disciplines, accounting researchers, have
had difficulty executing and publishing classical grounded theory studies.
Smith (2003) asserts that Glaser and Strauss (1967), the seminal explication of the
grounded theory methodology, “. . . emphasizes an individual approach and personal
style” (p.139). Further, this seminal work “. . . has caused confusion over the meaning of
terms . . . and their implications for acceptable procedures”(Smith 2003, p.139. At least
one other accounting publication has made a similar observation (von Alberti-Alhtaybat
and Al-Htaybat 2010).
This confusion has led others to advocate alternative forms of grounded theory.
Nevertheless all forms of grounded theory are questioned by positivists. Their primary
reason has been a perceived lack of external validity. The result has been that few
accounting journals have published explicit grounded theory papers (Smith 2003, p.139).
Gurd (2008) observes that some accounting journals may be re-evaluating their
resistance to non-positivist research. However, future researchers need to explicate their
procedures. He argues that whatever grounded theory variant researchers choose to use,
they should make their procedures transparent and they should execute that variant
appropriately. He contends that, in general, prior researchers have not provided adequate
transparency.

94
Elharidy et. al. (2008) is a theoretical paper that discusses grounded theory and
interpretive management accounting research. They assert that grounded theory can
facilitate the development of theory pertaining to real world management accounting
problems, however, the grounded theory literature does not provide “a simple ‘recipe
book’ which, if followed rigorously, will result in high-quality research” (p.139).
Nevertheless, they state that grounded theory guidelines can provide a way for
interpretive researchers to improve the quality of their research.
Gurd (2008) remarks that grounded theory studies are often re-labeled during the
review and publication process. He cites examples of working and conference papers that
described grounded theory investigations (Bruggeman and Slagmulder 1995; Greenhalgh
2000), but in published form these papers were labeled as something different.
Smith (2003) comments that in the management accounting literature there are
other examples of studies that appear, based on their content, to be re-labeled grounded
theory investigations. He declares that the confusion, about what a grounded theory study
really is, has led reviewers and editors to reject papers because of their labels, rather than
because their lack of merit. Consequently, some grounded theory researchers have
chosen to not label their work as grounded theory.
We maintain as have others (Suddaby 2006; Stern 1980) that the primary reason
researchers have had difficulty executing classical grounded theory studies is that Glaser
and Strauss (1967), the first comprehensive explication of the methodology, does not
fully explain certain aspects of the substantive and the theoretical coding processes.
Moreover, we observe that this seminal work does not indicate that there are three types

95
of grounded theories: substantive, formal, and general substantive. While substantive and
formal theories are discussed, the guidance for generating a formal theory is insufficient.
Further, most of the initially collected data examples are unfamiliar to non-sociologists.
Glaser has recognized these problems and has attempted to correct them.
Section 3.4.1 Mixed Methods Research
State-of-the-art in mixed methods research guidelines are set forth in Creswell
and Plano Clark (2011). For that reason, we employ the mixed methods research
definition and terminology they advocate to describe our methods.
Accordingly, using the core characteristics definition of mixed methods research,
we define mixed methods research as having three orientations: research design,
methods, and philosophy. The research design component states that mixed method
research joins procedures in a manner that represents specific research designs (plans).
The methods component states that mixed method addresses research questions by both
collecting and analyzing two types of data: qualitative and quantitative. Moreover, mixed
methods researchers mix (or integrate or link) these data in one of three ways: (1) by
combining (or merging them) concurrently, (2) by building one on the other sequentially,
or (3) by embedding one within the other. Further, they prioritize (emphasize) one or
both data forms in the procedures they employ to execute these: (1) a single study or (2)
the multiples phases of a long-run research program. They employ their research designs
to facilitate making research decisions. The philosophical component states that
researchers construct their research procedures based on their philosophical worldviews
and theoretical orientations.

96
Section 3.4.2 Mixed Methods Research History
The mixed methods research methodology is evolving. From the late 1980s thru
the early 1990s researchers working in various disciplines, including sociology (Brewer
and Hunter 1989); Fielding and Fielding 1986), evaluation (Greene, Caracelli, and
Graham 1989), management (Bryman 1988), nursing (Morse 1991), and education
(Creswell 1994) began to explicitly explore ways of combining or linking qualitative and
quantitative data collection and data analyses procedures. Some devised and named
specific research designs. Morse (1991) first developed a notation system. As one might
expect, philosophical debates ensued (Reichardt and Rallis 1994). Bryman (2006)
reviews the work from that time period. Creswell and Plano Clark (2007) classified the
types of research designs.
The ideas behind mixed methods have roots in much earlier work. For example,
Campbell and Fiske (1959) discuss using multiple quantitative data sources to validate
psychological traits. Moreover, others called for using qualitative and quantitative data in
experimental studies (Denzin 1978; Campbell 1974; Cronbach 1975). Patton (1980)
suggested mixing experimental and naturalistic designs and set forth diagrams to clarify
his procedures. Today, mixed methods research is becoming much more systematic and
it is increasingly recognized as a distinct research approach (Creswell and Plano Clark
2011).
Our literature review did not locate an explicit mixed method study, in the
accounting literature. Others have had the same result (Grafton, Lillis and Mahama 2011,
p.14), when searching for “accounting” and “mixed methods” or “multiple method”.
97
There do exist, however, accounting studies that use both qualitative and quantitative
data. Most of these studies are survey studies that include open-ended responses or
experiments that include manipulation check questionnaires (Grafton, Lillis and Mahama
2011, p.14). Still others are longitudinal studies (Malina, Norrelkit, and Selto 2011) or
case studies and surveys (Modell 2007). Most are found in the management accounting
literature.
Section 3.4.3 Core Characteristics Mixed Methods Definitional Description of OurStudy
Following Creswell and Plano Clark (2011, p.5) we describe our study as having
three orientations: research design, methods, and philosophical. Our research design is a
two-phased exploratory sequential mixed methods research design. Researchers generally
employ this design in studies that develop these: (1) research instruments, or (2) theories,
or (3) both. Accordingly this design is also known as the instrument development design
and the quantitative follow-up design.
We employ our two-phased exploratory sequential mixed methods research
design to execute research methods that collect and analyze both qualitative and
quantitative data. Our design comprises sequential qualitative and quantitative phases
During the first phase data (text) are collected as needed and analyzed using formal
classical grounded theory procedures. A formal theory is set forth and contextualized.
The value-focused thinking decision frame is the overarching theoretical model.
Corresponding concept measures are also generated and a mail questionnaire is
developed using Dillman’s Tailored Design Method.

98
In addition during the qualitative phase a taxonomy is developed based on the
population that our contextualized theory addresses. Moreover, this taxonomy is the basis
for developing our survey sample frame. Thus, data (text) including a non-public data
base are collected and analyzed. It is of note that a taxonomy is contextualized typology.
Further, a typology is a special case of a substantive grounded theory.
During the quantitative phase, both the questionnaire and the taxonomy are
employed to administer a mail survey. During this phase the contextualized formal theory
is explored. The questionnaire is employed to collect the requisite measures (numeric)
and the sample frame is employed to select a stratified random sample of 1,600 potential
survey participants.
We selected the two-phased exploratory sequential mixed methods research
design, because it is congruous with the purpose of our study. Specifically, it facilitates
exploring the utility of these that we develop herein: (1) the Data Decision-Usefulness
Theory, (2) the questionnaire measures of its contextualized constructs, and (3) the
corresponding population taxonomy and sample frame.
The philosophical component of our study comprises a worldview and an
overarching theoretical model. Following Creswell and Plano Clark (2011) we explicitly
state our philosophical component. We do so recognizing that most qualitative research
methodologists and mixed methods research methodologists advocate explicit
philosophical discussions, but quantitative methodologists do not (Creswell and Plano
Clark 2011, p.279).

99
We employ a multiple worldview orientation. The reason is that our study is
exploratory, in nature. Moreover, we give greater emphasis (priority) to the qualitative
phase (strand) of our study, than to the quantitative phase. Consequently, we prioritize
the explication of our emergent theory and the development of its measures and
supporting taxonomy. During each phase we adopt a worldview that is appropriate for the
corresponding research objective(s).
During the qualitative strand of our study, an effort was made to work from a
pragmatic worldview. Researchers who employ this worldview focus on the importance
of the research question. They employ the research methodology and data collection
methods that facilitate identifying and resolving the research problem (Creswell and
Plano Clark 2011, p.40). This worldview facilitates developing and exploring grounded
theories.
We employ the value-focused thinking paradigm as the overarching theoretical
model for the theory we generate. Specifically, we accept as given the framework this
paradigm uses to articulate the logical connection between values, objectives, decisions,
and factual information. Earlier in this chapter, we set forth the framework and explicated
the corresponding terminology. Later, we structure an alike framework to articulate the
logical connection between fundamental-equity analysts’ values, their objectives, their
decisions, and segment reporting information.
Section 3.4.4 Phase 1–Qualitative
The first phase of our study is qualitative. During this phase we generated our
conceptual theory and taxonomy using the procedures of classical grounded theory.

100
During the process of generating our theory, we also, developed an initial set of
questionnaire questions. We discuss the questionnaire in Phase 2. The classical grounded
theory section of this chapter sets forth the general procedures we employed to develop
our theory. Here we summarize the specifics of our study.
Section 3.4.4.1 Conceptual Theory
We employed the classical grounded theory procedures described earlier in this
chapter, for generating a formal theory and for contextualizing it to address the concerns
of fundamental-equity analysts who follow U.S. domiciled firms. As a check on our
contextualized definitions we conducted eight talk aloud interviews (five with accounting
professors, one with a marketing professor, one with an accounting PhD. student, and one
with a decision sciences PhD. student). Each interviewee was given a set of concept
definitions and the corresponding model. They were asked to express their views, which
were documented with handwritten notes. Where clarifications were indicated, the
definitions were amended.
Our formal theory generation process first required that we devise a substantive
theory of fundamental-equity analysts’ segment reporting concerns. As a result of that
process we came to understand that the primary reason that these analysts employ
segment reporting disclosures is to improve their understandings of firms. Accordingly,
the use of reported products and services segment disclosures to improve fundamental-
equity analysts’ understandings of firms is the core variable of our contextualized theory.
Fundamental-equity analysts are investment professionals who employ the
fundamental analysis approach to make investment decisions. The key principle of

101
fundamental analysis is that the true value of a firm is related to its financial attributes–its
growth prospects, risk profile, and cash flows. A equity security is either under-priced or
over-price, if its market price differs from its true value. Fundamental analysis is a long-
term investment strategy and valuation is its central focus.
We identified the value-focused thinking paradigm as our overarching theoretical
model. We contemplated that fundamental-equity analysts’ objectives for wanting to
better understand firms differ based on distinct decision contexts. We generated our
taxonomy, based on information gathered during our formal theory. That process enabled
us to flush out their decision contexts.
Using value focused-thinking paradigm terminology, we assert that the act of
employing segment reporting disclosures to better understand firms is an allocation of
resources or a decision. Fundamental-equity analysts are investment professionals that
employ the fundamental analysis approach to make equity investment decisions. Thus,
individually and as a group they are decision-makers. These decision-makers make the
decision to employ segment reporting disclosures, to better understand firms, to further at
least one objective. Their objective has at least one decision context, or contemplated
activity.

102
Figure 3.3, Six Decision Contexts for Managing a Portfolio Using a Value-
Focused Thinking Fundamental Analysis Investment Decision-making Approach, depicts
fundamental-equity analysts’ six decision contexts: fundamental analysis research, equity
valuations, equity selections, equity allocations, portfolio strategy, and portfolio
management. The fundamental analysis research decision context is the core decision
context. However, the portfolio management decision context is the strategic one; it is the
most general decision context facing fundamental-equity analysts.
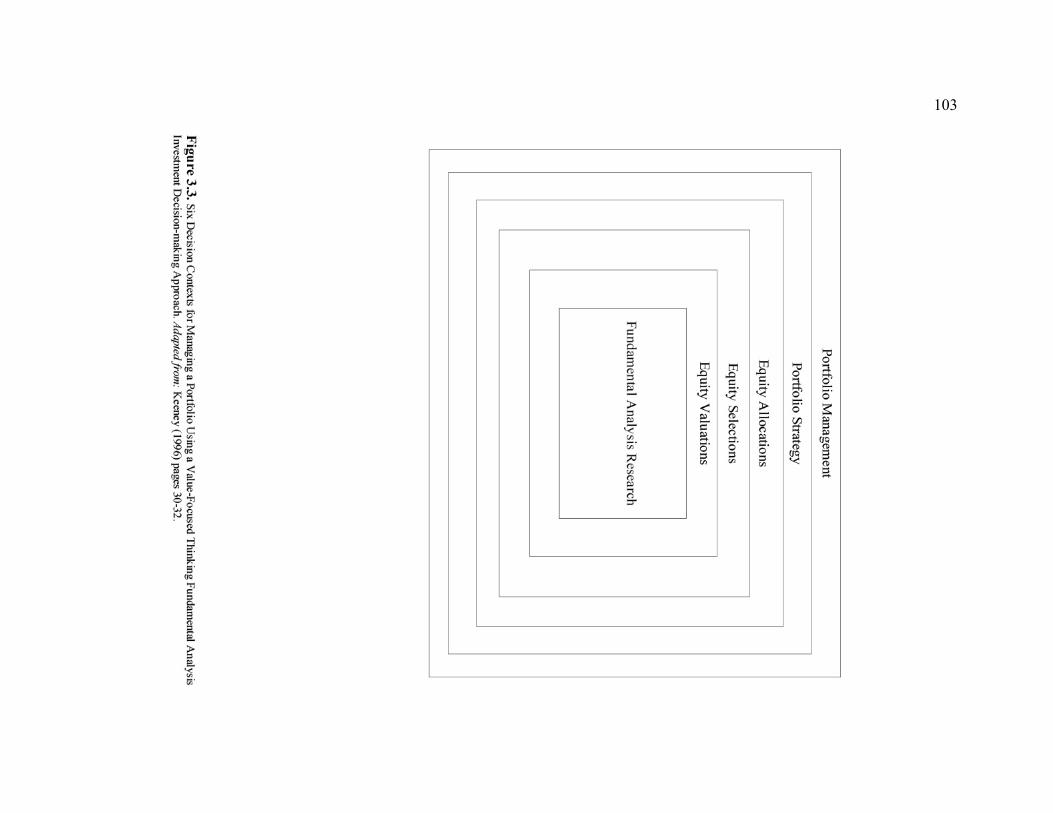
103

104
We have several competing versions of our conceptual theory, which explores the
information qualities that information users desire. These qualities are their information
values. These value are the things germane to fundamental-equity analysts’ decisions to
employ segment reporting disclosures to better understand firms. These values are used
to evaluate the actual or potential consequences of using these disclosures to better
understand firms.
Appendix 3.0 sets forth the competing variants in model form. Here we describe
two variants: decision usefulness and materiality. Both variants share the same core
concepts, or nomological network. For that reason, we first set forth the concepts of our
decision usefulness model and then we merely set forth our materiality concept. Figure
3.4 depicts our decision usefulness model.

105

106
We assert that data are not always information. Moreover, data that exhibit four
characteristics: ease of comparison, relevance, reliability, sufficiency, and possibly
satiation are decision useful. Moreover, these data are information.
Section 3.4.4.1.1 Decision Usefulness
In general, we define decision usefulness as a judgment deduced when
considering whether to utilize knowledge received about a particular fact or
circumstance, to make one or more specific determinations. In an accounting context,
decision usefulness is a judgment deduced by financial reporting disclosure users when
considering whether to use the disclosures for one or more specific determinations. For
the purpose of our theory exploration, decision usefulness is a judgment deduced by
analysts to assess whether reported products and services segment disclosures improve
their understandings of firms.
Below are the six measures we employed to explore decision usefulness. As
indicated, we employed a seven point -3 to +3 Likert scale. Our scale labels were
strongly disagree, disagree, somewhat disagree, neither agree nor disagree, somewhat
agree, agree, and strongly agree.
Q36. Post-1998 reported segment disclosures _____________ my
understanding of firms.
Scale Description
Likert,
7 point, -3 to +3,
Strongly Agree to
Strongly Disagree
Q36a. hinder
Q36b. impede
Q36c. prevent

107
Q36. Post-1998 reported segment disclosures _____________ my
understanding of firms.
Scale Description
Likert,
7 point, -3 to +3,
Strongly Agree to
Strongly Disagree
Q36h. better
Q36i. improve
Q36j. increase
Section 3.4.4.1.2 Ease of Comparing
In general, ease of comparing is the state or quality of facilitating a comparison.
That which facilitates a comparison makes the comparison easier. A comparison is an act
of comparing. In an accounting context, ease of comparing is the quality of financial
reporting disclosures that makes them facilitate users’ comparisons (Random House
2001). For the purpose of our theory exploration, ease of comparing is the extent to
which analysts percieve that reported products and services segment disclosures make
their comparisons easy.
Below are the three measures we employed to explore ease of comparing. As
indicated we employed a seven point -3 to +3 Likert scale. Our scale labels were strongly
disagree, disagree, somewhat disagree, neither agree nor disagree, somewhat agree,
agree, and strongly agree.

108
Scale Description
Likert,
7 point, -3 to +3,
Strongly Agree to
Strongly Disagree
Q25. Post-1998 reported segment disclosures are easy for me to compare.
Q26. I readily compare post-1998 reported segment disclosures.
Q27. Post-1998 reported segment disclosures facilitate my comparisons.
Section 3.4.4.1.3 Relevance
In general, relevance is the state or quality of being relevant. Relevant means that
any two facts to which it is applied are so related to each other that, according to some
common course of events, one taken either by itself or in connection with other facts
proves or renders probable the past, present, or future existence or nonexistence of the
other (Garner 1999).
Knowledge is an organized body of facts (information), or the comprehension and
understanding consequent on having acquired and organized a body of facts. Knowledge
and information are terms for human acquirements through reading, study, and practical
experience (Random House 2001).
Thus, relevant facts have a bearing on one’s knowledge, only, if one has previous
knowledge of related information. If one has knowledge of related information, newly
disclosed relevant facts increases one’s knowledge. However, disclosure of relevant facts
that one is already aware of, merely, confirms one’s knowledge. While knowledge of
relevant facts that contradict one’s knowledge creates incongruity.

109
In an accounting context, relevance is the quality of being relevant. Relevant
means that any two financial reporting disclosures are so related to each other that,
according to common analysis practices, one taken either by itself or in connection with
the other, proves or renders probable the past, present, or future existence or
nonexistence of the other. Relevant financial reporting disclosures have a bearing on
one’s knowledge of a firm. For the purpose of our theory exploration, relevance is the
extent to which analysts perceive that reported products and services segment disclosures
have a bearing on their knowledge of firms.
Below are the three measures we employed to explore relevance. As indicated we
employed a seven point -3 to +3 Likert scale. Our scale labels were strongly disagree,
disagree, somewhat disagree, neither agree nor disagree, somewhat agree, agree, and
strongly agree.
Q9. I believe post-1998 reported segment disclosures _________
my knowledge of firms.
Scale Description
Likert,
7 point, -3 to +3,
Strongly Agree to
Strongly Disagree
Q9a. have a bearing on
Q9b. are relevant to
Q9c. are pertinent to
Section 3.4.4.1.4 Reliability
In general, reliability is the state or quality of being reliable. Reliable means
dependable in achievement, accuracy, honesty, etc. That which is dependable is worthy
of trust. Reliable connotes consistent dependence (Random House 2001). In an

110
accounting context, reliability is the quality of financial reporting disclosures that makes
them suitable for users to depend on them, for one or more specific purposes. For the
purpose of our theory exploration, reliability is the extent to which analysts perceive that
reported products and services segment disclosures are suitable to depend on, to improve
their understandings of firms.
Below are the four measures we employed to explore reliability. As indicated we
employed a seven point -3 to +3 Likert scale. Our scale labels were strongly disagree,
disagree, somewhat disagree, neither agree nor disagree, somewhat agree, agree, and
strongly agree.
Q30. Post-1998 reported segment disclosures are __________ for
improving my understanding of firms.
Scale Description
Likert,
7 point, -3 to +3,
Strongly Agree to
Strongly Disagree
Q30a. dependable
Q30b. reliable
Q30c. trustworthy
Q30d. credible
Section 3.4.4.1.5 Sufficiency
In general, sufficiency is the condition or fact of being sufficient. Sufficient
means to be adequate, that is, to be as much or as good as necessary for some
requirement or purpose. To be sufficient is to be of such quality, number, force, or value
as is necessary for a given purpose (Random House 2001). In an accounting context,
sufficiency is the condition of financial reporting disclosures that makes them adequate

111
for users to use them, for one or more specific decisions. For the purpose of our theory
exploration, sufficiency is the extent to which analysts perceive that reported products
and services segment disclosures provide adequate reported segment disclosures for
improving their understandings of firms.
Below are the three measures we employed to explore sufficiency. As indicated
we employed a seven point -3 to +3 Likert scale. Our scale labels were strongly disagree,
disagree, somewhat disagree, neither agree nor disagree, somewhat agree, agree, and
strongly agree.
Q34. Post-1998 reported segment disclosures ___________ meet
my minimum requirements for improving my understanding of firms.
Scale Description
Likert,
7 point, -3 to +3,
Strongly Agree to
Strongly Disagree
Q34a. adequately
Q34b. sufficiently
Q34c. satisfactorily
Section 3.4.4.1.6 Satiation
In general satiation is the quality of being able to satiate. That which is satiated is
satisfied to the full or lacks nothing desired for one or more purposes (Random House
2001). In an accounting context, satiation is the quality of financial reporting disclosures
that makes them capable of revealing all disclosures users desire for one or more specific
decisions. For the purpose of our theory exploration, satiation is the extent to which
analysts perceive that reported products and services segment disclosures reveal all the
reported segment disclosures they desire for improving their understandings of firms.

112
Below are the three measures we employed to explore satiation. As indicated we
employed a nine point -4 to +4 semantic differential scale; each measure has a distinct set
of anchors.
Nine Point Semantic Differential Scale Questions
Q29. For improving my understanding of firms, post-1998 reported
segment disclosures are_________ what I want.
about
far less than -4 -3 -2 -1 0 1 2 3 4 far more than
Q32. For improving my understanding of firms, post-1998 reported
segment disclosures are________ what I desire.
Q32a. far less about far more
comprehensive than -4 -3 -2 -1 0 1 2 3 4 comprehensive than
Q32b. far less about far more
complete than -4 -3 -2 -1 0 1 2 3 4 complete than
Section 3.4.4.1.7 Antecedent Concepts of Ease of Comparing
Ease of comparing is formed by two concepts: ease of complete intelligibility,
and ease of integrating. We next discuss these.
Section 3.4.4.1.7.1 Ease of Complete Intelligibility
In general, ease of complete intelligibility is the quality or condition facilitating
complete intelligibility. Complete intelligibility is the quality or condition of lucidity
(Random House 2001).
In a general accounting context, ease of complete intelligibility is the quality of
financial reporting disclosures that makes them capable of being lucid. For the purpose of

113
our theory exploration, ease of complete intelligibility is the extent to which analysts
perceive that reported products and services segment disclosures are lucid.
Below are the three measures we employed to explore ease of complete
intelligibility. As indicated, we employed a seven point -3 to +3 Likert scale. Our scale
labels were strongly disagree, disagree, somewhat disagree, neither agree nor disagree,
somewhat agree, agree, and strongly agree.
Q13. For me, post-1998 reported segment disclosures are ______.
Scale Description
Likert,
7 point, -3 to +3,
Strongly Agree to
Strongly Disagree
Q13b. clear
Q13c. comprehensible
Q13d. lucid
Section 3.4.4.1.7.2 Ease of Integrating
Ease of integrating is the state or quality of facilitating integration. That which
facilitates integration makes integration easier. Integration is the act of combining parts
into a complete whole. To integrate is to incorporate.
In an accounting context, ease of integrating is the quality of financial reporting
disclosures that makes them easy to integrate into users’ systems of understanding firms.
For the purpose of our theory exploration, ease of integrating is the extent to which
analysts perceive that reported products and services segment disclosures are easy to
integrate into their system of understanding firms.
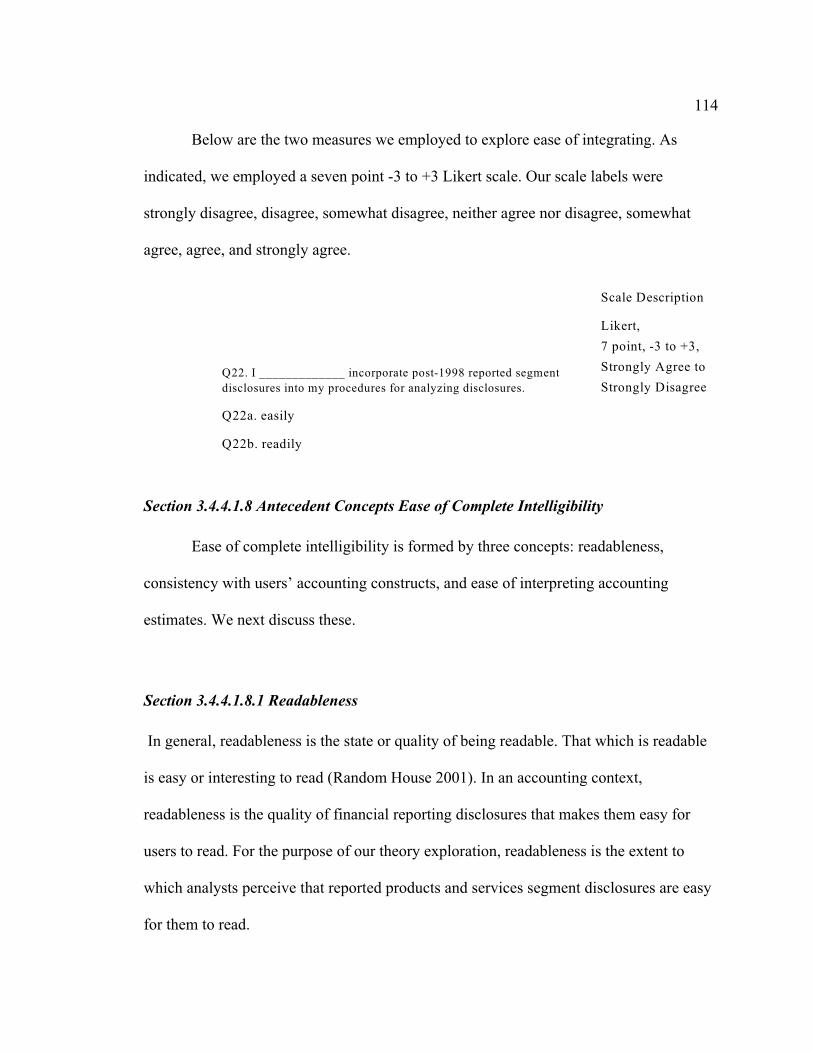
114
Below are the two measures we employed to explore ease of integrating. As
indicated, we employed a seven point -3 to +3 Likert scale. Our scale labels were
strongly disagree, disagree, somewhat disagree, neither agree nor disagree, somewhat
agree, agree, and strongly agree.
Q22. I _____________ incorporate post-1998 reported segment
disclosures into my procedures for analyzing disclosures.
Scale Description
Likert,
7 point, -3 to +3,
Strongly Agree to
Strongly Disagree
Q22a. easily
Q22b. readily
Section 3.4.4.1.8 Antecedent Concepts Ease of Complete Intelligibility
Ease of complete intelligibility is formed by three concepts: readableness,
consistency with users’ accounting constructs, and ease of interpreting accounting
estimates. We next discuss these.
Section 3.4.4.1.8.1 Readableness
In general, readableness is the state or quality of being readable. That which is readable
is easy or interesting to read (Random House 2001). In an accounting context,
readableness is the quality of financial reporting disclosures that makes them easy for
users to read. For the purpose of our theory exploration, readableness is the extent to
which analysts perceive that reported products and services segment disclosures are easy
for them to read.

115
Below are the three measures we employed to explore readableness. As indicated,
we employed a seven point -3 to +3 Likert scale. Our scale labels were strongly disagree,
disagree, somewhat disagree, neither agree nor disagree, somewhat agree, agree, and
strongly agree.
Q12. I ___________ read post-1998 reported segment disclosures.
Scale Description
Likert,
7 point, -3 to +3,
Strongly Agree to
Strongly Disagree
Q12a. easily
Q12b.readily
Q13. For me, post-1998 reported segment disclosures are _____ .
Scale Description
Likert,
7 point, -3 to +3,
Strongly Agree to
Strongly Disagree
Q13a. readable
Section 3.4.4.1.8.2 Consistency with Users’ Accounting Constructs
In general, consistency with users’ accounting constructs is the degree of
agreement, between a sender’s accounting representation (a word or a symbol) and a
receiver’s image (construct) or directly conceived or intuited object of thought (concept)
(Random House 2001). That which has a high degree of agreement is equivalent in
function; it corresponds; it is similar; it is analogous. In an accounting context,
consistency with users’ accounting constructs is the quality of financial reporting
disclosures which enables users to see that the accounting concepts therein, are

116
equivalent in function with users’ accounting concepts. For the purpose of our theory
exploration, consistency with users accounting constructs is the extent to which analysts
perceive that reported products and services segment disclosure accounting concepts are
equivalent in function to their accounting concepts.
Below are the three measures we employed to explore consistency with users’
accounting constructs. As indicated we employed a seven point -3 to +3 Likert scale. Our
scale labels were strongly disagree, disagree, somewhat disagree, neither agree nor
disagree, somewhat agree, agree, and strongly agree.
Q10. I believe the accounting concepts used to determine post-1998
reported segment disclosures are _______ to my accounting
concepts. These concepts focus on how firms determine their
reported segments and what they report about them.
Scale Description
Likert,
7 point, -3 to +3,
Strongly Agree to
Strongly Disagree
Q10a. equivalent in function
Q10b. similar
Q10c. analogous
Section 3.4.4.1.8.3 Ease of Interpreting Accounting Estimates
In general, ease of interpreting accounting estimates is the state or quality of
facilitating the interpretations of accounting estimates. That which facilitates the
interpretations of accounting estimates makes the estimates easier to interpret. To
interpret accounting estimates is provide their meanings, to make their meanings lucid or
clear, to render the estimates understandable or intelligible (Random House 2001). In an
accounting context, ease of interpreting accounting estimates is the quality of financial

117
reporting disclosures that makes them facilitate users’ interpretations of accounting
estimates. For the purpose of our theory exploration, ease of interpreting accounting
estimates is the extent to which analysts perceive that reported products and services
segment disclosure estimates are easy for them to interpret.
Below are the three measures we employed to explore ease of interpreting
accounting estimates. As indicated we employed a seven point -3 to +3 Likert scale. Our
scale labels were strongly disagree, disagree, somewhat disagree, neither agree nor
disagree, somewhat agree, agree, and strongly agree.
Q11. For me, post-1998 reported segment disclosure accounting
estimates are easy to ________.
Scale Description
Likert,
7 point, -3 to +3,
Strongly Agree to
Strongly Disagree
Q11a. interpret
Q11b. comprehend
Q11c. understand
Section 3.4.4.1.9 Antecedent Concepts Reliability
Reliability is formed by three concepts: representational faithfulness, degree of
verification, and neutrality. We next discuss these.
Section 3.4.4.1.9.1 Representational Faithfulness
In general, representational faithfulness is the quality of adhering to a rule, which
is used as the basis for a judgement, to accurately describe an object, so that it is

118
identifiable from knowledge of its appearance or characteristics. In an accounting
context, representational faithfulness is the quality of financial reporting disclosures that
makes them correspond with the phenomenon they purport to represent. For the purpose
of our theory exploration, representational faithfulness is the extent to which analysts
perceive that reported products ans services segment disclosures correspond with the
phenomenon the disclosures claim to describe.
Below are the three measures we employed to explore representational
faithfulness. As indicated we employed a seven point -3 to +3 Likert scale. Our scale
labels were strongly disagree, disagree, somewhat disagree, neither agree nor disagree,
somewhat agree, agree, and strongly agree.
Q14. I believe post-1998 reported segment disclosures correspond
with the segment _________________ they claim to describe.
Scale Description
Likert,
7 point, -3 to +3,
Strongly Agree to
Strongly Disagree
Q14a. phenomena
Q14b. facts
Q14c. events
Section 3.4.4.1.9.2 Degree of Verification
In general, degree of verification is the quality of being verified to an extent. That
which is verified is substantiated. That which is substantiated is established by proof or
by adequate evidence. In an accounting context, degree of verification is the quality of
financial reporting disclosures that makes it possible to establish the extent to which they
are supported by adequate evidence. For the purpose of our theory exploration, degree of

119
verification is the extent to which analysts perceive that reported products and services
segment disclosures are supported by adequate evidence.
Below are the three measures we employed to explore degree of verification. As
indicated we employed a seven point -3 to +3 Likert scale. Our scale labels were strongly
disagree, disagree, somewhat disagree, neither agree nor disagree, somewhat agree,
agree, and strongly agree.
Q15. I believe post-1998 reported segment disclosures are ______
by firms’ independent auditors.
Scale Description
Likert,
7 point, -3 to +3,
Strongly Agree to
Strongly Disagree
Q15a. substantiated
Q15b. verified
Q15c. checked
Section 3.4.4.1.9.3 Neutrality
In general neutrality is the state of being neutral. That which is neutral, is not
aligned with or supportive of any side or position in a debate. In an accounting context,
neutrality is the ideal state of a regulatory environment under which a financial reporting
standard is issued. Such a regulatory environment issue financial reporting standards
which are not unduly influenced by any particular regulatory constituency. The resultant
financial reporting standards require firms to disclose information which is not unduly
supportive of a position in a financial reporting disclosure debate. For the purpose of our

120
theory exploration, neutrality is the extent to which analysts perceive that reported
products and services segment disclosures are not unduly supportive of a particular
position in the segment reporting disclosure debate.
Below are the two measures we employed to explore neutrality. As indicated we
employed a seven point -3 to +3 Likert scale. Our scale labels were strongly disagree,
disagree, somewhat disagree, neither agree nor disagree, somewhat agree, agree, and
strongly agree.
Q17. I believe post-1998 reported segment disclosures are _____ .
Scale Description
Likert,
7 point, -3 to +3,
Strongly Agree to
Strongly Disagree
Q17a. biased
Q17b. neutral
Section 3.4.4.1.10 Materiality
As previously mentioned, our decision usefulness and materiality models both
share the same core concepts, or nomological network. For that reason, except for

121
decision usefulness, the concepts we just set forth also pertain to our materiality model.
Figure 3.5 depicts our materiality model.

122
With our materiality model, we assert that data that are not decision useful may
influence users’ decisions. Moreover, such data exhibit materiality and have four
characteristics: ease of comparison, relevance, reliability, sufficiency, and possibly
satiation.
In general materiality is the quality of being material. Material means to be likely
to influence one or more determinations. In an accounting context, materiality is the
quality of financial reporting disclosures that makes them capable of influencing users’
decisions. For the purpose of our theory exploration, materiality is the extent to which
analysts perceive that their acquired knowledge of reported.
Below are the three measures we employed to explore materiality. As indicated
we employed a seven point -3 to +3 Likert scale. Our scale labels were strongly disagree,
disagree, somewhat disagree, neither agree nor disagree, somewhat agree, agree, and
strongly agree.
Q35. I believe my acquired knowledge from post-1998 reported
segment disclosures_______ my understanding of firms.
Scale Description
Likert,
7 point, -3 to +3,
Strongly Agree to
Strongly Disagree
Q35a. influences
Q35b. affects
Q35c. is material to

123
Section 3.4.4.2 Taxonomy
Our population of interest (target population) is fundamental analysis investment
decision-makers who employ U.S. domiciled firms’ post-1998 reported products and
services segment disclosures to improve their understandings of firms. Our target
population comprises investment decision-makers who: (1) are members of a top 15
membership group; (2) are either a qualified investor or an investment adviser; (3) make
equity investment decisions; (4) are employed in these types of occupations: analysts,
portfolio managers, analysts or portfolio managers related; or a combination thereof; and
(5) make decisions pertaining to U.S. domiciled firms. Figure 3.6, Target Population
Taxonomy, depicts our taxonomy.
We generated our taxonomy using a non-public database and descriptive
information about investment professionals. We employed only data for the largest 15
membership groups. The data included: industry of employment, occupational titles (up
to two), and industry specialties (up to three). There were 15 industries of employment,
45 occupational titles, and 52 industry specialties.

124

125
We identified two target population decision-maker type classifications: qualified
investors and investment advisers. We did so by comparing the industries of employment
data and several U.S. laws (Security Exchange Act of 1934, the Investment Company Act
of 1940, the Investment Advisers Act of 1940, U.S. Code Title 29, Chapter 18).
Industries of employment that do not fall into these two categories are classified as other
and are not part of the target population.
Table 3.1, Industry of Employment Classifications and Corresponding
Definitions per U.S. Securities Laws, sets forth the definitions for the industry of
employment classifications impacted by U.S. securities laws. It also identifies the
specific laws we employed to classify each industry of employment. Furthermore it
identifies those that are regulated by the SEC, or have a fiduciary duty to their clients, or
both.

126
TABLE 3.1 Industry of Employment Classifications and Corresponding Definitions per U.S. Securities Laws
# Classifications
Security Investment Industry LawsSecurity
Exchange
Commission
Regulated?
Fiduciary
Duty?Defined? Citation Definition
1 Academic
Institution
No Not Applicable Not Applicable No No
2 Bank (all) Yes Security Exchange Act of 1934-
Section 3 (6)-Bank
Security Exchange Act of 1934-
Section 3. (a)(54) (A)-QualifiedInvestor (iii)
A bank is any company doing business, under the lawsof any State or of the United States, as a bankinginstitution. Banking institutions provide most or all ofthe following services: (1) receives demand and timedeposits, honors instruments drawn on them, and paysinterest on them; (2) discounts notes, makes loans, andinvests in securities; (3) collects checks, drafts, andnotes; (4) certifies depositor's checks; and (5) issuesdrafts and cashier's checks.
A bank is a qualified investor.
No Possibly

127
TABLE 3.1 Industry of Employment Classifications and Corresponding Definitions per U.S. Securities Laws
# Classifications
Security Investment Industry LawsSecurity
Exchange
Commission
Regulated?
Fiduciary
Defined? Citation Definition Duty?
3 Broker-Dealer,
Investment
Banking
Yes Security Exchange Act of 1934-Section 3 (4)(A)-Broker
Security Exchange Act of 1934-Section 3 (5)(A)-Dealer
Investment Company Act of 1940-Section 2 (21)-Investment Banker
Security Exchange Act of 1934-
Section 3. (a)(54) (A)-QualifiedInvestor (iii)
A broker is “any person engaged in the business ofeffecting transactions in securities for the account ofothers.”
A dealer is “any person engaged in the business ofbuying and selling securities for such person’s ownaccount through a broker or otherwise.”
An investment banker is “any person engaged in thebusiness of underwriting securities issued by otherpersons.” While the following may underwrite securitiesissued by others, they are not investment bankers: (1) aninvestment company, (2) a person who acts as anunderwriter in isolated transactions that are not part of aregular business, and (3) any person that acts as anunderwriter for one or more investment companies.
Brokers, dealers, and broker dealers are qualifiedinvestors.
Yes
Yes
Yes?
No
No
No?
4 Consulting No Not Applicable Not Applicable No No
5 Financial
Publisher
indirectly Investment Advisers Act of 1940-
Section 202. (a)(11)-InvestmentAdviser
A financial publisher is a firm that employs a certaintype of investment adviser. An investment adviser is anyperson who receives compensation for either or both ofthe following services: (1) providing advice directly orthrough publications or writings, about any of thefollowing (a) the value of securities or (b) theadvisability of investing in, purchasing, or sellingsecurities; or (2) issuing or officially announcinganalyses or reports about securities.
Yes Yes

128
TABLE 3.1 Industry of Employment Classifications and Corresponding Definitions per U.S. Securities Laws
# Classifications
Security Investment Industry LawsSecurity
Exchange
Commission
Regulated?
Fiduciary
Defined? Citation Definition Duty?
6 Foundation/
Endowment
Indirectly? Security Exchange Act of 1934-
Section 3. (a)(54) (A)-QualifiedInvestor (vi)
A foundation is an institution founded and supported byan endowment. An endowment is property donated toan institution as a source of income.
Any trust whose security purchases are directed by oneor more of the following qualified investors isconsidered a qualified investor: a bank, a broker-dealer,an insurance company, an investment company, or aplan sponsor.
No No
7 Government/
Regulatory
Agency
No Not Applicable
Security Exchange Act of 1934-
Section 3. (a)(54) (A)-QualifiedInvestor (vi)
Any governmental agency or instrumentality that owns,and discretionarily invests, at least $50,000,000 is aqualified investor.
No No
8 Insurance
Company
Yes Investment Company Act of 1940-
Section 2 (a)(17)-Insurance Company
Security Exchange Act of 1934-
Section 3. (a)(54) (A)-QualifiedInvestor (iii)
An insurance company is a firm that has three attributes.First, it is organized as an insurance company. Second,its main business activity is writing insurance orreinsuring of risks underwritten by other insurancecompanies. Third, it is subject to the supervision of astate insurance commissioner or of a similar stateofficial or state agency.
An insurance company is a qualified investor.
No No

129
TABLE 3.1 Industry of Employment Classifications and Corresponding Definitions per U.S. Securities Laws
# Classifications
Security Investment Industry LawsSecurity
Exchange
Commission
Regulated?
Fiduciary
Defined? Citation Definition Duty?
9 Investment
Company/
Mutual Fund
Yes Investment Company Act of 1940-
Section 3. (a)(1)-InvestmentCompany
Investment Company Act of 1940-
Section 3. (a)(54) (A)-QualifiedInvestor (i)
An investment company is any issuer of securities thatengages in at least one of the three activities. The firstactivity is to hold itself out as an firm that primarilyengages or proposes to engage in the business ofinvesting, reinvesting, or trading in securities. Thesecond, is to engage or propose to engage in thebusiness of issuing installment type face-amountcertificates; or to have been engaged in that businessand to have outstanding certificates. The third, is tohave engaged or to propose to engage in the business ofinvesting, reinvesting, owning, holding, or trading insecurities and to own or propose to acquire investmentsecurities valued at more than forty percent of the firm’stotal consolidated assets, excluding Governmentsecurities and cash items.
An investment company is a qualified investor.
Yes No
10 Investment
Management
Counseling
Indirectly Investment Advisers Act of 1940-
Section 202. (a)(11) Investment Adviser
An investment management counseling firm is a firm that
employs a certain type of investment adviser. An investment
adviser is any person who receives compensation for either or
both of the following services: (1) providing advice directly or
through publications or writings, about any of the following (a)
the value of securities or (b) the advisability of investing in,
purchasing, or selling securities; or (2) issuing or officially
announcing analyses or reports about securities.
Yes Yes
11 Other No Not Applicable Not Applicable No No
12 Plan Sponsor:
Corporate
Indirectly U.S. Code Title 29, Chapter 18,
Subchapter I, Subtitle A, Paragraph 1002
Plan means an employee welfare benefit plan or an employee
pension benefit plan, or a plan which is both an employee
No Yes

130
TABLE 3.1 Industry of Employment Classifications and Corresponding Definitions per U.S. Securities Laws
# Classifications
Security Investment Industry LawsSecurity
Exchange
Commission
Regulated?
Fiduciary
Defined? Citation Definition Duty?
(1)-(3)
U.S. Code Title 29, Chapter 18,
Subchapter I, Subtitle A, Paragraph 1002
(16)(B)
Securities Exchange Act of 1934 Section
3. (a) (54)-Qualified Investor (v)
welfare benefit plan and an employee pension benefit plan. An
employee welfare benefit plan provides benefits other than
pensions on retirement or death, for its participants or their
beneficiaries through the purchase of insurance or otherwise.
An employee pension plan provides either retirement income to
employees or provides for the deferral of employee income
until the employee is terminated or thereafter.
The plan sponsor is the employer that establishes or maintains
an employee benefit plan. A corporation may be a plan
sponsor.
An employee benefit plan is a qualified investor, if the plan
investment decisions are made by a plan fiduciary. A plan
fiduciary may be a bank, a savings and loan association, an
insurance company, or registered investment adviser.
Plan Sponsor:13
Public
Indirectly See corporate plan sponsor. Same as corporate plan sponsor, except the plan is established
by a public entity.
No Yes
14 Plan Sponsor:
Union
Indirectly See corporate plan sponsor. Same as corporate plan sponsor, except the plan is established
by a union.
No Yes
Retired15 No Not Applicable Not Applicable No No

131
It is noteworthy that all investment advisers, except for those within the
consulting industry of employment, are both regulated by the SEC and have a fiduciary
duty to their clients. We included the consulting group in our investment advisers
classification because the database indicated that these investment professionals facilitate
their clients’ aims by working with those in the investment management counseling
group.
For qualified investors no such pattern is evident. Some are regulated by the SEC;
some are not. Some have a fiduciary duty to their clients; some do not. No qualified
investors are both regulated by the SEC and have a fiduciary duty to their clients.
Table 3.2, Investment Decision-Maker Industry Classifications, lists the
aforementioned industries of employment. It also succinctly identifies those classified as
target population members, whether they are qualified investors or investment advisers,
and whether the decisions they make are buy-side, sell-side, or adviser-side.

132
TABLE 3.2 Investment Decision-Maker Industry Classifications
Industry of Employment Classifications
Target or
Non-Target
Population
Classification?
Target Population
# of
Decision
Types
Decision
Type
Decision-maker
Type
Not Disclosed Non-Target 0 Non-Target Non-Target
Academic Institution Non-Target 0 Non-Target Non-Target
Bank (all) Target 1 Buy-side Qualified Investors
Broker-Dealer, Investment Banking Target 1 Sell-side Qualified Investors
Consulting Target 1 Adviser-side Investment Advisers
Financial Publisher Target 1 Adviser-side Investment Advisers
Foundation/Endowment Target 1 Buy-side Qualified Investors
Government/Regulatory Agency Target 1 Buy-side Qualified Investors
Insurance Company Target 1 Buy-side Qualified Investors
Investment Company/Mutual Fund Target 1 Buy-side Qualified Investors
Investment Management Counseling Target 1 Adviser-side Investment Advisers
Other Non-Target 0 Non-Target Non-Target
Plan Sponsor: Corporate Target 1 Buy-side Qualified Investors
Plan Sponsor: Public Target 1 Buy-side Qualified Investors
Plan Sponsor: Union Target 1 Buy-side Qualified Investors
Retired Non-Target 0 Non-Target Non-Target

133
It is of note that we have three decision type classifications: buy-side, sell-side,
and adviser-side. Traditionally, the accounting literature has only discussed two decision
types: buy-side and sell-side. It appears that this literature has not examined investment
advisers. We classify investment advisers as members of the adviser-side. We do so
because investment advisers, with the exception of the consulting group, as mentioned
afore, are regulated by the SEC and have a fiduciary duty to their clients. Thus, we assert
that they constitute a distinct group.
We define the buy-side decision type as decisions made by investment
professionals who are qualified investors with these industry of employment
classifications: banks, foundations/endowments, government/regulatory agencies,
insurance companies, investment companies/mutual funds, plan sponsors: corporate, plan
sponsors: public, and plan sponsors: union. This classification is in keeping with prior
accounting literature. We define the sell-side decision type as decisions made by
investment professionals who are qualified investors with this industry of employment
classification: broker/dealer & investment banks. This classification is in keeping with
prior accounting literature. Lastly, we define the adviser-side decision type as decisions
made by investment professionals who are investment advisers with these industry of
employment classifications: investment management consulting, consulting, and
financial publishers.
Our interest is in those that make equity investment decisions. We employed the
industry specialties information and Value Line industry sector classifications as of

134
November 2006 to identify investment professionals that are equity specialists versus
those that are not.
Table 3.3 Industry Specialities and Corresponding Value Line Industries and
Target Population Sector Classifications identifies the equity and non-equity specialists.
It also identifies the industry specialties and the corresponding with Value Line industries
and sectors. Further, it identifies whether an industry speciality is classified as target or
non-target population speciality. As evidenced by our taxonomy, these five industry
specialities are not part of the target population: asset backed securities, bonds, cash
equivalents, other, and retired.
Our interest is in only those investment professionals who follow U.S. equities.
The industry speciality categories includes a generalist speciality, and a special/emerging
situations specialty. The database generalist speciality identifies those who follow three
or more industries. The specific specialities are not specified. We found, however, that
some entries disclosed three industry specialities. These should have been classified as
generalists, in the database.

135
TABLE 3.3 Industry Specialities and Corresponding Value Line Industries and Target Population Sector Classifications
(Each member may have up to three specialties. Each is discretely classified. Specialties are classified using the Value Line 11-2006 sector classification scheme. )
Industry Specialties Value Line Industries
Target versus
Non-Target
Population
Specialty
Target
Population
Sectors
Specialty A, or B, or C
Specialty A, or B, or C Not Disclosed Specialty A, or B, or C Not Disclosed Non-Target Non-Target
Advertising Advertising Target Consumer-Cyclical
Aerospace Aerospace/Defense Target Industrial
Apparel/Textiles Apparel Target Consumer-Cyclical
Asset Backed Securities Not Applicable Non-Target Non-Target
Automobile and Accessories Auto Parts/ Auto & Truck Target Consumer-Cyclical
Banks Bank/ Bank (M idwest) Target Financial
Beverages Beverage (Alcoholic)/Beverage (Soft Drink) Target Consumer Staples
Bonds (all) Not Applicable Non-Target Non-Target
Cash Equivalents Not Applicable Non-Target Non-Target
Chemicals Chemical (Basic), (Diversified) & (Specialty) Target Basic M aterials
Communications
(Newspaper/Periodicals/Radio/TV) Cable TV & Newspaper, Target Consumer-Cyclical
Computers (Hardware/Software)
Computer & Peripherals, and
Computer Software & Services Target Technology
Construction Homebuilding Target Consumer-Cyclical
Construction-Building M aterial Building M aterial Target Industrial
Construction-M anufactured Housing M anufactured Housing/ Recreational Vehicle Target Consumer-Cyclical
Consulting Information Services Target Industrial
Consumer Products
(Durable/Non-Durable)
Furniture/Home Furnishing and
Home Appliance Target Consumer-Cyclical
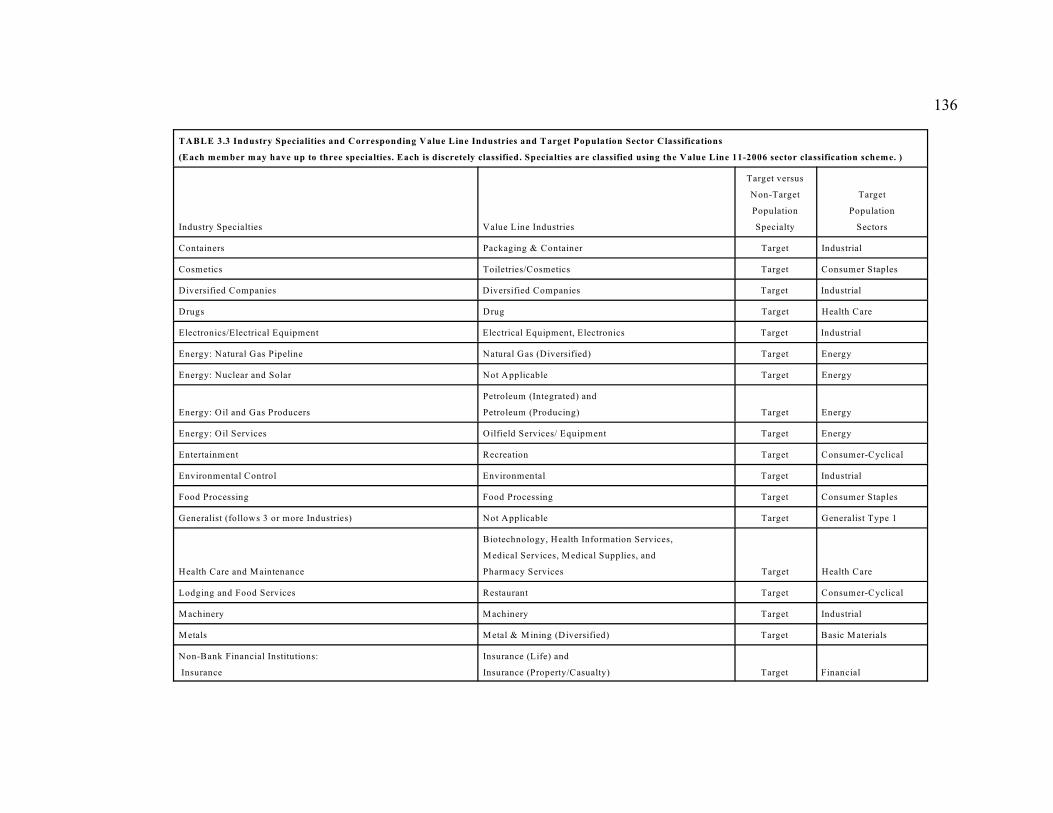
136
TABLE 3.3 Industry Specialities and Corresponding Value Line Industries and Target Population Sector Classifications
(Each member may have up to three specialties. Each is discretely classified. Specialties are classified using the Value Line 11-2006 sector classification scheme. )
Industry Specialties Value Line Industries
Target versus
Non-Target
Population
Specialty
Target
Population
Sectors
Containers Packaging & Container Target Industrial
Cosmetics Toiletries/Cosmetics Target Consumer Staples
Diversified Companies Diversified Companies Target Industrial
Drugs Drug Target Health Care
Electronics/Electrical Equipment Electrical Equipment, Electronics Target Industrial
Energy: Natural Gas Pipeline Natural Gas (Diversified) Target Energy
Energy: Nuclear and Solar Not Applicable Target Energy
Energy: Oil and Gas Producers
Petroleum (Integrated) and
Petroleum (Producing) Target Energy
Energy: Oil Services Oilfield Services/ Equipment Target Energy
Entertainment Recreation Target Consumer-Cyclical
Environmental Control Environmental Target Industrial
Food Processing Food Processing Target Consumer Staples
Generalist (follows 3 or more Industries) Not Applicable Target Generalist Type 1
Health Care and M aintenance
Biotechnology, Health Information Services,
M edical Services, M edical Supplies, and
Pharmacy Services Target Health Care
Lodging and Food Services Restaurant Target Consumer-Cyclical
M achinery M achinery Target Industrial
M etals M etal & M ining (Diversified) Target Basic M aterials
Non-Bank Financial Institutions:
Insurance
Insurance (Life) and
Insurance (Property/Casualty) Target Financial

137
TABLE 3.3 Industry Specialities and Corresponding Value Line Industries and Target Population Sector Classifications
(Each member may have up to three specialties. Each is discretely classified. Specialties are classified using the Value Line 11-2006 sector classification scheme. )
Industry Specialties Value Line Industries
Target versus
Non-Target
Population
Specialty
Target
Population
Sectors
Non-Bank Financial Institutions:
Savings and Loan Thrift Target Financial
Non-Bank Financial Institutions:
Security Brokerage Securities Brokerage Target Financial
Non-U.S. Securities
Canadian Energy and
Investment Company (Foreign) Non-Target Non-Target
Office Equipment Office Equipment & Supplies Target Industrial
Other Not Applicable Non-Target Non-Target
Paper and Forest Products Paper and Forest Products Target Basic M aterials
Publishing Publishing Target Consumer-Cyclical
Real Estate R.E.I.T Target Financial
Retail Trade
Retail Automotive, Retail Building Supply,
Retail (Special Lines), and Retail Store Target Consumer-Cyclical
Retired Not applicable Non-Target Non-Target
Special/Emerging Situations Not applicable Target Generalist Type 1
Steel Steel (General) and Steel (Integrated) Target Basic M aterials
Technology
E-Commerce, Internet, Semiconductor, and
Semiconductor (Capital Equipment) Target Technology
Telecommunications
Telecom Equipment, Telecom Services, and W ireless
Networking Target Telecommunications
Tobacco Tobacco Target Consumer Staples
Transportation (Common Carrier)
M aritime, Railroad, and
Trucking/ Transportation Leasing Target Industrial

138
TABLE 3.3 Industry Specialities and Corresponding Value Line Industries and Target Population Sector Classifications
(Each member may have up to three specialties. Each is discretely classified. Specialties are classified using the Value Line 11-2006 sector classification scheme. )
Industry Specialties Value Line Industries
Target versus
Non-Target
Population
Specialty
Target
Population
Sectors
Utilities (all)
Electric Utility (Central),
Electric Utility (East),
Electric Utility (W est),
Natural Gas (Distributed), and
W ater Utility Target Utilities
Not a distinct industry specialty of target organization. Coal Target Energy
Not a distinct industry specialty of target organization. Educational Services Target Consumer-Cyclical
Not a distinct industry specialty of target organization. Financial Services Diversified Target Financial
Not a distinct industry specialty of target organization. Food W holesalers Target Consumer Staples
Not a distinct industry specialty of target organization. Grocery Target Consumer Staples
Not a distinct industry specialty of target organization. Household Products Target Consumer Staples
Not a distinct industry specialty of target organization. Investment Company Target Financial
Not a distinct industry specialty of target organization. M etal Fabricating Target Industrial
Not a distinct industry specialty of target organization. Power Target Industrial
Not a distinct industry specialty of target organization. Precision Instrument Target Industrial
Not a distinct industry specialty of target organization. Tire and Rubber Target Industrial

139
We classify our target population by Value Line sector. We do so because a close
reading of financial publishers information, in particular Value Line print material,
suggests that many investment professionals do not follow specific industries. Rather,
they seem to follow sectors or groups thereof. For that reason, our taxonomy classifies
investment professionals by Value Line sectors. Moreover, we identify four types of
generalists: type one-four.
Generalists type one are investment professionals identified in the database as
having either a generalist or special/emerging situations speciality. Generalists type two
are investment professionals with two specialities, but these spanned two distinct Value
Line sectors. Generalists type three are investment professionals with three specialities,
however, these three spanned either two or three sectors. Generalists type four are those
with two or three specialities that fall into combinations of these: special/emerging
situations speciality, generalists speciality, any other target industry speciality.
Our interest is in investment professionals employed in these types of
occupations: analysts, portfolio managers, analysts or portfolio managers related; or a
combination thereof. We employed the occupational titles data and descriptive
information about investment professionals to classify the occupational titles into these
classifications. Appendix 3.1 contains tables that identify our final determinations, list
the occupational tiles and the corresponding fundamental analysis investment decision-
maker types, and describe the work experiences that correspond.
In short, our target population comprises U.S. equity decision-makers. They are
either sector specialists or generalists. They make one of these three types of decisions:

140
buy-side, sell-side, or adviser-side. They are qualified investors or investment advisers.
As qualified investors they make buy-side or sell-side decisions. As investment advisers
they make adviser-side decisions. Furthermore, they work in occupations that we classify
as one of these: analysts; portfolio management; analysts or portfolio manager related; or
a combination thereof.
We assert that our target population is likely to employ post-1998 reported
products and services segment disclosures to improve their understandings of U.S.
domiciled firms. Figure 3.7, Venn Diagram of the Target Population’s Investment
Decisions depicts the set of fundamental analysis investment decisions, fundamental
analysis investment decision-makers, and U.S. domiciled Securities and Exchange
Commission registrants’ investment securities that comprise our target population.
The Venn diagram indicates that our target population makes sell-side,
investment adviser-side, and buy-side decisions concerning U.S. domiciled Securities
and Exchange Commission registrants’ equity securities. Furthermore, these decisions
are made in six decision contexts: fundamental analysis research, asset valuation, asset
selection, portfolio strategy, asset allocation, and portfolio management.

141

142
Section 3.4.5 Phase 2–Quantitative Data
Section 3.4.5.1 Mail Survey Data Collection Method
A self administered mail survey was selected as our data collection method. The
mail survey methodology was chosen because neither telephone or e-mail collection
methods were viable because we conducted our survey with subject access restrictions.
Our population of interest is investment professionals in particular those who employ the
fundamental analysis method to make buy-side, sell-side, or adviser-side investment
decisions, concerning U.S. domiciled firms that disclose reported products and services
segments.
Our survey instrument is designed to measure the concepts that comprise our
conceptual theory. These measures were designed concurrently with the development of
our theory. All of the survey questions were developed in this study. Most of our
questions are measured using a Likert scale with seven points (-3 to +3). However, we
did employ some semantic differential scale questions. Appendix 3.2 contains tables that
reflect our construct definitions and the corresponding questionnaire measures. These
measures were generated by considering the following nineteen points raised by Dillman
(2000):
1) Choose simple over specialized words.
2) Choose as few words as possible to pose the question.
3) Use complete sentences to ask questions.
4) Avoid vague quantifiers when more precise estimates can be obtained.
5) Avoid specificity that exceeds the respondent's potential for having anaccurate, ready-made answer.
6) Use equal numbers of positive and negative categories for scalarquestions.
7) Distinguish undecided from neutral by placement at the end of the scale.

143
8) Avoid bias from unequal comparisons.
9) State both sides of attitude scales in the question stems.
10) Elimenate check-all-that-apply question formats to reduce primacyeffects.
11) Develop response categories that are mutually exclusive.
12) Use cognitive design techniques to improve recall.
13) Provide appropriate time referents.
14) Be sure each question is technically accurate.
15) Choose question wordings that allow essential comparisons to be madewith previously collected data.
16) Avoid asking respondents to say yes in order to mean no.
17) Avoid double-barreled questions.
18) Soften the impact of potentially objectionable questions.
19) Avoid asking repondents to make unnecessary calculations (pg. 51-77).
Section 3.4.5.2 Questionnaire and UH Mailing System Pretest Procedures
Dillman (2000) stressed that generally surveyors make no mention of their pre-
test procedures or do not perform them. We pretested our questionnaire several times and
we conducted two pre-tests of the UH mailing system.
The first pre-test of our questionnaire comprised having an investment
professional review the sequential list of questions selected for inclusion in the
questionnaire. Our tester employs SEC and non-SEC disclosures to make investment
decisions on the behave of his employer and has done so for more than 10 years. He is a
chartered financial analyst, the decisions he makes concern fixed income securities rather
than equity securities. However, he had in the past made equity decisions and commented
that his issues of concern at that time were similar to those that he has for fixed income
securities. Hence, we felt that his professional experiences have provided him with the
insight necessary to facilitate making the following appraisals: (1) whether or not the
questions were appropriate for soliciting information about fundamental-equity analysts’

144
perceptions of U.S. domiciled firms’ SEC disclosures; and (2) whether or not the
majority of the potential survey participants who have followed or who continue to
follow the industries about which he is knowledgeable (primarily oil and gas related)
would be able to answer the questions. We also asked him to make comments concerning
the cognitive and motivational aspects of our questions.
Our tester expressed no concerns about the appropriateness of our questions or the
ability of survey participants to answer them. He did however, comment that our
potential respondents are busy people. They have an interest in segment reporting and for
that reason might consider responding. To increase that likelihood he suggested that we
shorten the length of our instructions and ask the more interesting questions first. He
pointed out that our font size was too small and the questionnaire was too bulky. He also
suggested that we change the wording of several questions. We implemented our pre-
tester’s suggestions and revised our sequential list of questions.
Our second pretest, consisted of using our revised instructions and sequential list
of questions to construct a questionnaire that incorporated navigational aids suggested by
Dillman (2000). These aids were intended to reduce measurement and non-response error
by making it easier to interpret our skip pattern intent. We asked two accounting
professors to critique our questionnaire. After each critique the questionnaire was
revised. Jointly, however, their comments concerned the wording of our instructions,
questions, scales, and scale labels and the length of our questionnaire.
After incorporating the comments of our second set of pre-testers we designed our
questionnaire. The purpose was to make the questionnaire more visually appealing and to

145
show regard to our potential survey participants. These individuals are busy people who
make investment decisions concerning funds of substantial size. Dillman (2000) suggests
giving a token financial incentive to potential participants. We decided against that given
the income levels of our potential participants. Instead, we chose to show regard by
employing a questionnaire that is visually appealing and thus less likely to be merely
tossed aside.
Before creating the final version of the questionnaire, several earlier drafts were
created. We asked the University of Houston Cougar Fund, MBA and MS students to
answer and comment on one of the pre-final drafts. These students are studying to
become investment professionals and employ SEC disclosures in the course of managing
their multi-million dollare fund. Thus, they employ fundamental analysis techniques to
identify undervalued equities. Therefore, they have knowledge of the issues about which
we are concerned. Most of them answered their questionnaires in less than fifteen
minutes. However, they did express concern about some of the instructions and some of
the questions. They documented their concerns on their questionnaires. After reviewing
their comments we revised the draft questionnaire. This comprised our third pre-test of
the questionnaire.
We created a final version of our questionnaire, which we asked our investment
professional to answer and to critique. He found it easy to answer and completed it in less
than fifteen minutes. He commented that the potential survey participants would find the
questionnaire itself interesting. He did caution though that the target population does not
generally participate in surveys. However, given that this one being conducted by a

146
student, that may increase the likelihood of getting them to respond. This comprised our
fourth pre-test of the questionnaire. Dillman (2000) indicates that often university
mailing systems do not quickly process mail. For that reason, he suggests testing such a
system before initiating a survey. We did not think that would be a problem for us.
However, we did test the UH mailing system. We did so by mailing two questionnaires to
two locations (Denver and San Antonio), and asked family members to mail them back.
We found that it took more than 30 days for us to receive the mailed back questionnaires.
For that reason we decided to conduct a more extensive pre-test of university mailing
system.
We solicited the help of a public accounting firm, KPMG, to test the mail back
time. KPMG asked fifteen of their employees located in the fifteen cities we identified to
help us conduct our test. We provided the KPMG coordinator with a set of written
instructions and two questionnaires for each employee. The instructions asked each tester
to mail back one questionnaire from their business location and one questionnaire from
their residential location. We asked this because our mailing list included both business
and residential addresses. Our testers received their questionnaires through interoffice
mail and were asked to mail them back within three business days. The questionnaires
were placed in the KPMG interoffice mailing system on June 1, 2005. Each questionnaire
was numbered for identification purposes.
We also solicited the assistance of the UH Manager of Postal Services, who
contacted his counterpart at the Houston main post office. They worked together to
ensure that our self-mailing business reply mail questionnaire was processed in the

147
normal course of business. Eleven of the fifteen employees mailed back the
questionnaires. Hence we received 22 questionnaires. We received five questionnaires
within seven days of the testers’ receipt thereof. The remaining seventeen were received
within eleven days. The median number of days was nine and the mode was ten. There
was no discernable pattern based on geographic location or business or residential
location. Our university postal manager stressed that during our actual survey
administration period he would ensure that alike procedures would be followed to
facilitate our timely receipt of participants’ questionnaires.
Section 3.4.5.3 Sample Frame
This study surveyed 1,600 members of the population of interest. These potential
survey participants were selected from our sample frame. Our sample frame information
was compiled from a non-public database and is based on our population taxonomy. We
modified the population information to take into consideration mailing address access
restrictions. We were restricted to using 2003 addresses. To ensure that we, only,
included in our sample frame those investment professionals with static addresses, we
hand matched the 2003 addresses to a 2006 address database. We took no new addresses
from the 2006 database. In the course of devising the taxonomy, duplicate memberships
had been eliminated.
Further, the UH printing and postal services department subjected our preliminary
sample frame to the address correction procedures approved by the United States Postal
Service. This assured us that the addresses we employed were as current as possible.
Following Dillman (2000), we also employed procedures to personalize the names by

148
adding gender specific courtesy titles (Ms. or Mr.) to our mailings. Our sample frame
address currency and our personalization procedures were implemented to increase our
survey response rate.
Section 3.4.5.4 Stratified Random Sampling Procedures
We selected our sample using stratified random sampling procedures. Our sample
frame consisted of information pertaining to investment professionals. Our stratified
random sampling plan was designed to match obtained responses by both decision type
(buy-side, sell-side, and adviser-side) and breadth of experience (non-generalists and
generalists). This was our ideal. We recognized that our ideal might not be possible. Our
second option was to match responses by either decision type or breadth of experience
(sector specialist or generalist). Our last option, was to not match responses, if an
inadequate number of responses was obtained.
To increase the likelihood that enough responses would be received, to match
responses by decision type and breadth of experience, our stratified random sampling
plan took the following issues into consideration: (1) AIMR studies indicate that more
adviser-side responses are received, than either sell-side or buy-side responses. (2) Our
sample frame includes about 250% more generalists than non-generalists. (3) There are
more buy-side generalists than either adviser-side or sell-side generalists. (4) Likewise,
there are more buy-side non-generalists, than either adviser-side or sell-side non-
generalists. (5) The adviser-side non-generalist group is the smallest non-generalist
group.

149
Our stratified random sampling plan called for 1,600 survey participants. For the
aforementioned reasons we sought to include as many sell-side participants and adviser-
side non-generalists as possible in our sample. Hence, all of those observations in our
sample frame were automatically included in our sample. We then randomly selected
enough adviser-side generalists, buy-side non-generalists, and buy-side generalists to
execute our ideal stratified sampling scheme. Table 3.4.,Stratified Random Sampling
Plan, identifies our observation types, and the number of observations in our sample.
Table 3.4 Stratified Random Sampling Plan
Observation Type
Number of
Observations
in Sample
Sell-Side Non-Generalists 239
Sell-Side Generalists 181
Adviser-Side Non-Generalists 145
Adviser-Side Generalists 445
Buy-Side Non-Generalists 145
Buy-Side Generalists 445
# Total Observations 1600
Section 3.4.5.5 Survey Administration
We had planned to administer our survey during the fall of 2008. However, due to
the 2008 financial crisis we delayed our survey until February 2009. We did so because
we were concerned that our response rate would be lower than we had planned. Our
survey administration period started February 16, 2009 and ended May 4, 2009.
The potential survey participants were not offered anonymity. However, they
were told that their identities, will be kept confidential. To provide for that

150
confidentiality, each potential participant was assigned a unique identity code. Each
identity code was printed on a separate label, the potential participant identity label, and
affixed to the last page of each questionnaire. The location of the label and the
researcher’s intent to keep the respondents’ identities confidential was mentioned in the
questionnaire cover letters. In addition, each questionnaire bore a handwritten
identification number on the front cover. This number personalized the questionnaire and
made it easier to identify the respondent.
The survey correspondence was designed to be salient and to evoke goodwill. All
of the correspondence, was delivered via first class stamped mail. We followed
Dillman’s (2000) recommendations concerning the assembly of and the time span
between mailings. For that reason, the first three mailings were assembled at the same
time. The first mailing, the prenotice letter, was mailed on February 16, 2009. One week
later, the second mailing, a questionnaire was mailed. Approximately one week later, the
third mailing, a thank you postcard was mailed. The final mailing, a replacement
questionnaire was mailed to non-responders, on April 10, 2009. As previously mentioned
the questionnaire itself is a self mailer, which means that respondent required no stamps
or envelope to mail back the questionnaire. The answered questionnaire, merely, needed
to be placed in the mail.
A sample of each survey correspondence is included in Appendix 3.3. Both of
our questionnaire cover letters asked investment professionals to help with our survey,
and stressed that should they prefer not to participate to kindly mail back the blank
questionnaire. Moreover, both the cover letters and the questionnaire stressed that if the

151
financial disclosures of U.S. domiciled firms that disclose only products and services
segments are not employed, then only the demographic section of the questionnaire
should be answered. The questionnaire is included in Appendix 3.3.
Our potential survey respondents are investment professionals. We initially
planned to execute our survey during fall 2008. However, the 2008 stock market crash
caused us to delay our survey administration period until February 2009. We did so out
of concern that the financial crisis, which led to a major downsizing in the number of
employed investment professionals, might adversely impact our survey response rate. For
that reason, we decided to contact a sample of the non-responders, by telephone, to urge
them to respond or to mail back the questionnaire if they had no interest in participating
in our study.
During the April 23, 2009 thru May 4, 2009 time span, we attempted to contact
by telephone 333 randomly selected non-responders The script we used during our
telephone contacts is located in Appendix 3.3. We were unable to speak directly to 266
non-responders. Of the 67 with whom we were able to speak, the following are the
comments they expressed in response to our appeal: SEC information is no longer used
(12) , have questionnaire will respond ( 11), too busy (10), not interested (10), mail a
replacement questionnaire (8), do not participate in surveys due to either company or
personal policy (7), retired (6), questionnaire is too long (3), completed and mailed back
the questionnaire (2). Two respondents made two comments, for that reason the
comments tally sums to 69, rather than 67. Based on our telephone contacts we
concluded that we would likely receive 21 additional responses.

152
In most cases (159), we were not to speak with our non-responders, but we were
able to speak with individuals who worked for their firm. In 131 cases, we discerned that
the mailing addresses we employed were those of the intended recipient. However 28
addresses were no longer valid. In addition, we were told that because of the financial
crisis investment professionals had been counseled to not express their opinions to those
outside of the industry, that companies were going out of business, and many investment
professionals were losing their jobs. All three of these issues were reported in the
financial press.
We employed the principles of Dillman’s Tailored Design Method, because it has
been shown to increase survey response rates. Similar studies have been conducted in the
past by the Association of Investment Management Research (AIMR). The obtained
response rates were in the range of 10-15%. For that reason, we planned for a 15%
response rate.
We surveyed 1,600 investment professionals. We received responses from 163
(10.2% ). Of the 1,600, 66 (4.1%) answered questions pertaining to the problem we
examined: the decision usefulness of post-1998 reported products and services segment
disclosures of U.S. domiciled firms. However, only 55 (3.4%) of those responses were
useable for our analysis purposes. We asked those who were not impacted by our
problem to, merely, answer our demographic questions; as a result, 52 (3.3%) do so.
Another 37 (2.3%) mailed back their questionnaires, as we requested, to indicate that
they declined to participate in our study. In addition 8 (0.5%) did not answer our
questionnaire, but did indicate that they were no longer employed.

153
Of our 55 usable responses, 24 were received from individuals who are
investment advisers. Moreover, 18 were received from individuals who provide sell-side
investment services. Further 10 were received from individuals who provide buy-side
investment services. The remaining 3were received from individual who indicated that
they were either no longer employed or retired.
We examined the response dates of our 55 usable responses. We found that we
had received 40 responses before, April 23, 2009, the date we initiated our telephone
calls to non-responders. We consider the individuals who submitted these to be early
responders. Of the 40 early responders, 19 are investment advisers, 11 are sell-side
investment professionals, 7 are buy-side professionals, and the remaining 3 had recently
retired. We consider the remaining 15, to be late responders. Of these, 5 are investment
advisers, 7 are sell-side investment professionals, and the remaining 3 are buy-side
professionals.
In short, we planned for a 15% response rate, however our obtained response rate
is 10.2%. Which is at the low range of survey studies conducted by AIMR. Given the
comments we heard during our telephone contacts, there is support for asserting that the
2008 financial crisis impacted the willingness of investment professionals to participate
in our study.

CHAPTER 4
ANALYSIS OF RESULTS
In this chapter, we assess the adequacy of the measures and theoretical constructs
described earlier. In particular, we describe the procedure for item level validity
assessment using Partial Least Squares. Then we examine the results of the survey data
on the relative impact of post 1998 reported products and services segment disclosures on
analyst’s perceptions of Materiality and Decision Usefulness.
Section 4.1 Partial Least Squares Analysis
For this dissertation, the decision was made to employ Partial Least Squares
(PLS) for analyzing the adequacy of both the theoretical models as well as the measures
developed for this study. PLS can be a powerful method of analysis because of the
minimal demands on measurement scales, sample size, and residual distributions (Chin
and Newsted, 1999). Although PLS can be used for theory confirmation, it can also be
used to suggest where relationships might or might not exist and to suggest propositions
for later testing.
153

154
As an alternative to the more widely known covariance fitting approach
(exemplified by software such as LISREL, EQS, COSAN, AMOS, and SEPATH), the
component-based PLS avoids two serious problems: inadmissible solutions and factor
indeterminacy (Fornell and Bookstein, 1982). The philosophical distinction between
these approaches is whether structural equation modeling is used for theory testing and
development or for predictive applications. In situations where prior theory is strong and
further testing and development is the goal, covariance based full-information estimation
methods (e.g., using Maximum Likelihood or Generalized Least Squares) may be more
appropriate. Yet, due to the indeterminacy of factor score estimations, there exists a loss
of predictive accuracy. Chin (1995) framed the issues to be similar to that of deciding
whether to use ML factor analysis versus principal components analysis.
For application and prediction, a PLS approach is often more suitable. Under this
approach, it is assumed that all the measured variance is useful variance to be explained.
PLS estimates the latent variables as exact linear combinations of the observed measures,
which avoids the indeterminacy problem and provides an exact definition of component
scores. Using an iterative estimation technique, the PLS approach provides a general
model which encompasses, among other techniques, canonical correlation, redundancy
analysis, multiple regression, multivariate analysis of variance, and principle components
(Chin 1998).
Finally, PLS is considered better suited for explaining complex relationships
(Chin 2010; Fornell and Bookstein, 1982). As stated by Wold (1985, p. 589), “PLS
comes to the fore in larger models, when the importance shifts from individual variables

155
and parameters to packages of variables and aggregate parameters.” Wold states later (p.
590), “In large, complex models with latent variables PLS is virtually without
competition.”
A side benefit of the partial nature of the PLS algorithm is that the sample size
requirements when using PLS for complex models are likely much smaller than required
for CBSEM (Chin and Newsted 1999). This can be ascertained as a first approximation
by determining the specific portion of the model that has the largest number of predictors
for a particular dependent variable and then applying Cohen’s power tables (1988)
relative to the effect sizes one wishes to detect. In other words, the researcher needs to
determine which dependent variable (either at the structural level or item measure level)
has the highest number of predictors (i.e., arrows directed). Since this represents the
largest regression performed during the PLS iterative process, this would be the logical
starting point for choosing an adequate sample to insure an adequate level of accuracy
and statistical power. Ideally, if one wishes to customize the sample size estimation with
specific effect sizes for the structural paths and include a certain amount of measurement
error (normal or nonnormal), running a Monte Carlos simulation would be a better
approach Majchrak, Beath, Lim, R., & Chin (2005) and helpful for their extreme
situation of 26 variables and 17 cases.
In this study, the largest regression performed using the PLS algorithm uses 5
predictors. The study sample size of 55 represents a reasonable level, although ideally a
larger size would be able to detect smaller effects. Descriptive statistics for item
measures are provided in Table 4.1.

156
Section 4.2.1 Model Evaluation: Measurement Model Results
The first part in evaluating the adequacy of the theoretical model is to present
what is termed the measurement model results. Here, we focus on the reliability and
validity of the measures used to represent each construct in the nomological model.
Ideally, we show that the measures we develop are accurate (i.e., reliable) and they also
display convergent and discriminant validities. In other words, measures used to estimate
a construct should be highly related and not with measures used for other constructs. One
approach suggested by Chin (2010) to obtain the measurement results is to first draw all
possible structural links among the constructs you plan to use and then set the PLS inner
weighting option using the factorial scheme. This essentially ignores the directionality of
the arrows among constructs and simply performs pairwise correlations to establish inner
weights.
Section 4.2.2 Construct to Construct Overlap Check of Discriminant Validity
There are two sets of information that results from the preceding setup and are
generally available from standard PLS software. Each set represent tests of discriminant
validity (Chin, 1998b). The first group of results is meant to show that a construct is
more strongly related to its own measures than with any other construct by examining the
overlap in variance. Essentially, the argument is that if a specific construct is more
correlated with another construct than with its own measures, there is the possibility that
the two constructs share the same types of measures and are not conceptually distinct.
Alternatively, it indicates that the two sets of items do a poor job of discriminating or
differentiating the two underlying concepts you believe exists. To test for this, many

157
researchers have compared the square root of the average variance extracted (AVE) with
the correlations among constructs.
AVE was originally proposed by Fornell and Larcker (1981). It attempts to
measure the amount of variance that an estimated construct captures from its indicators
relative to the amount due to measurement error. AVE is only applicable for mode A
(outward-directed) blocks (Chin, 1998). The AVE is calculated as follows:
where li, F, and Qii, are the factor loading, factor variance, and unique/error variance
respectively.
Given that the item measure results are standardized, the AVE would be the same
as the average of the communalities in the block of items used to estimate each construct.
Fornell and Larcker (1981) suggested that this measure can also be interpreted as a
measure of reliability for the LV component score and tends to be more conservative
than composite reliability. Ideally, AVE should be greater than 0.50 meaning that 50% or
more variance of the indicators are accounted for by the PLS estimated construct. As
depicted in both Tables 4.2 and Table 4.3, this was found to be true for all sets of
measures used for each construct in the model.
While many researchers have compared the square root of AVE to construct
correlations, Chin (2010) argued that we should ideally compare the average variance
extracted with the squared correlations among constructs. It provides a more explicit

158
basis to see whether each construct is more highly related to its own measures than with
other constructs. Chin notes that presenting AVE with squared correlations have two
advantages. It provides a more intuitive interpretation since it represents the percentage
overlap (i.e., shared variance) among constructs and construct to indicators and it is tends
to be easier to distinguish the differences. Table 4.3 provides this comparison and shows
this to be true for the items developed for this research.
It is also normally suggested that researchers include the composite reliability
measure, , for each block of indicators. Composite reliability developed by Werts,
Linn, and Jöreskog (1974) is a measure of internal consistency and is calculated as
follows:
where li, F, and Qii, are the factor loading, factor variance, and unique/error variance
respectively.
In comparison to Cronbach’s alpha, this measure does not assume tau equivalency
among the measures with its assumption that all indicators are equally weighted.
Therefore, while alpha tends to be a lower bound estimate of reliability, is a closer
approximation under the assumption that the parameter estimates are accurate. Finally,
like AVE is only applicable for LVs with reflective indicators (i.e., mode A blocks).
In addition, for fuller contextual understanding, the means, standard deviations, skewness
and kurtosis of the items are presented in Table 4.1.

159
Section 4.2.3 Item to Construct Loading and Cross Loadings Check of Convergent and
Discriminant Validity
The second and more detailed set of information examines how each item
measure relates to each construct. We first examine convergent validity which is defined
as the extent to which blocks of items strongly agree (i.e., converge) in their
representation of the underlying construct they were created to measure. In other words,
how high are each of the loadings and are they more or less similar? Chin (2010) note
that measures that are mixed and have a wide range (e.g., varying from 0.5 to 0.9 may
raise concern about whether the measures are truly a homogenous set that primarily
captures the phenomenon of interest. In contrast, higher average loadings and narrower
range such as from 0.7 to 0.9 would provide greater confidence that all items help (i.e.,
converge) in estimating the underlying construct
Beyond that, not only should each measure be strongly related to the construct it
attempts to reflect, but it should not have a stronger connection with another construct.
Otherwise, such a situation would imply that the measure in question is unable to
discriminate as to whether it belongs to the construct it was intended to measure or to
another (ie., discriminant validity problem). Table 4.5 allows us to compare correlations
of each item to its intended construct (i.e., loadings) and to all other constructs (i.e., cross
loadings). As Chin (2010) notes, going down a particular construct column, you should
expect to see item loadings to be higher than the cross loadings. Similarly, if you scan
across a particular item row, you should expect to see that any item be more strongly
related to its construct column than any other construct column. If this is found to be the

160
case, the claim can be made for discriminant validity at the item level. Specifically, we
can say that each item loads more highly on their own construct than on other constructs
and that all constructs share more variance with their measures than with other
constructs. This was found to be the case for the measures developed for this study.
Section 4.3 Model Evaluation: Structural Model Results
Having established the appropriateness of the measures, the next step is to
provide evidence supporting the theoretical model. A major emphasis in PLS analysis is
on variance explained as well as establishing the significance of all path estimates.
Specifically, predictive power of the structural model as assessed by the R2 values of the
endogenous constructs. Similar to its counterparts in OLS regression, PLS R2 results
represent the amount of variance in the construct in question that is explained by the
model.
Thus, for a given PLS model, we can start by looking at the R-squares for each
dependent LV in the structural model provided by PLS. This is obtained because the case
values of the LVs are determined by the weight relations. The corresponding
standardized path estimates can also be examined and interpreted in the same manner. As
to be discussed, our two models which consists of the same core nomological network of
predictors leading to two separate outcomes (Decision Usefulness and Materiality)
yielded reasonably high R-squares. Yet, the relative impact as well as significance among
the predictors varied.
In assessing significance, the conventional wisdom since Chin (1998b) first
introduced its use for PLS estimation is to apply bootstrapping. The bootstrap approach

161
represents a nonparametric approach for estimating the precision of the PLS estimates. N
samples sets are created in order to obtain N estimates for each parameter in the PLS
model. Each sample is obtained by sampling with replacement from the original data set
(typically until the number of cases are identical to the original sample set). Various
approaches for estimating confidence intervals have been developed (see Efron &
Tibshirani, 1993, for more details). The simplest is a semi parametric approach that uses
the N bootstrap estimates for each parameter of interest to calculate the standard error
and associated t-test. But, as noted by Chin (1998), a percentile approach would be
distribution free. We used this approach with a bootstrap resampling of 1000 samples.
This allows us to estimate the p-value for each structural path to the third significant
digit. Figures 4.1 and Table 4.2 provide the estimated structural paths, p-values, and R-
squares for the two models tested: Materiality and Decision Usefulness.
We have two models for assessing the quality of reported products and services
segment disclosures. Using the same set of quality predictors, we find differential impact
on two summary evaluations: Materiality and Decision Usefulness. Each model has the
same core nomological network. However, both the relative impact among and the
significance of the predictors varied. The Materiality path analysis is depicted in Figure
4.1, and the Decision -Usefulness path analysis is depicted in Figure 4.2.

162
Table 4.4 M easurement Item to Construct Loadings and Cross Loadings.
Item CwUAC EoIAE Read EoCI EoI RF Dov Neu EoC Relev Reli Suf SatM ateri-
alityDU1
Q10a 0.786 0.351 0.455 0.562 0.474 0.332 0.148 0.139 0.145 0.395 0.352 0.209 0.321 0.147 0.229
Q10b 0.855 0.403 0.536 0.373 -0.008 0.228 0.348 -0.011 0.252 0.220 0.267 0.307 0.319 0.152 0.419
Q10c 0.840 0.366 0.423 0.419 0.097 0.399 0.195 -0.125 0.198 0.232 0.223 0.202 0.271 0.088 0.277
Q11a 0.404 0.904 0.463 0.337 0.067 0.600 0.249 0.240 0.357 0.394 0.391 0.404 0.417 0.259 0.295
Q11b 0.454 0.972 0.579 0.394 0.103 0.558 0.264 0.289 0.405 0.356 0.423 0.368 0.428 0.362 0.441
Q11c 0.413 0.939 0.537 0.399 0.260 0.369 0.298 0.346 0.462 0.415 0.425 0.452 0.440 0.457 0.493
Q12a 0.526 0.581 0.960 0.621 0.268 0.506 0.175 0.228 0.412 0.400 0.312 0.275 0.333 0.439 0.495
Q12b 0.541 0.462 0.930 0.510 0.189 0.449 0.139 0.175 0.446 0.409 0.351 0.344 0.369 0.453 0.429
Q13a 0.531 0.523 0.902 0.673 0.110 0.575 0.146 0.217 0.325 0.343 0.285 0.252 0.329 0.247 0.596
Q13b 0.472 0.261 0.605 0.919 0.499 0.338 -0.066 0.103 0.193 0.231 0.291 0.384 0.306 0.201 0.436
Q13c 0.545 0.484 0.676 0.883 0.380 0.494 0.214 0.171 0.292 0.215 0.386 0.412 0.451 0.240 0.579
Q13d 0.438 0.297 0.420 0.865 0.394 0.542 -0.031 -0.050 0.274 0.114 0.380 0.401 0.390 0.236 0.399
Q22a 0.185 0.165 0.201 0.477 0.970 0.059 0.049 0.038 0.189 0.223 0.247 0.144 0.216 0.309 0.212
Q22b 0.281 0.135 0.194 0.438 0.965 0.143 -0.009 -0.083 0.076 0.286 0.146 0.053 0.163 0.262 0.189
Q14a 0.196 0.379 0.354 0.324 0.058 0.855 0.102 0.067 0.160 0.286 0.372 0.225 0.368 0.177 0.177
Q14b 0.388 0.417 0.564 0.386 -0.072 0.745 0.080 0.138 0.203 0.371 0.328 0.187 0.311 0.177 0.397
Q14c 0.276 0.428 0.321 0.466 0.252 0.703 0.125 0.042 0.208 0.282 0.403 0.274 0.423 0.235 0.251
Q15a 0.181 0.196 -0.054 -0.088 0.095 0.142 0.834 0.107 0.177 0.152 0.327 0.139 0.324 0.146 0.064
Q15b 0.152 0.197 0.062 -0.005 -0.024 0.154 0.910 0.112 0.243 0.035 0.263 0.097 0.291 0.151 0.083
Q15c 0.337 0.321 0.318 0.170 -0.001 0.079 0.879 0.156 0.320 0.172 0.203 0.213 0.271 0.370 0.379
Q17a 0.296 -0.107 0.086 0.162 0.066 0.109 -0.133 -0.805 -0.120 -0.111 -0.167 -0.128 -0.167 -0.163 -0.037
Q17b 0.111 0.355 0.307 0.169 -0.004 0.174 0.142 0.980 0.180 0.375 0.260 0.253 0.259 0.232 0.180
Q25 0.101 0.261 0.290 0.092 -0.008 0.155 0.299 0.223 0.801 0.145 0.343 0.312 0.288 0.419 0.340
Q26 0.187 0.422 0.347 0.183 0.091 0.349 0.281 0.067 0.896 0.089 0.466 0.237 0.473 0.452 0.470
Q27 0.291 0.414 0.429 0.402 0.227 0.150 0.208 0.177 0.876 0.203 0.422 0.440 0.487 0.575 0.677

163
Table 4.4 M easurement Item to Construct Loadings and Cross Loadings.
Item CwUAC EoIAE Read EoCI EoI RF Dov Neu EoC Relev Reli Suf SatM ateri-
alityDU1
Q9a 0.101 0.261 0.291 -0.052 0.015 0.260 0.040 0.171 0.099 0.620 -0.037 -0.034 -0.103 0.360 0.095
Q9b 0.382 0.437 0.428 0.300 0.317 0.435 0.177 0.331 0.168 0.967 0.193 0.304 0.237 0.401 0.260
Q9c 0.339 0.356 0.351 0.188 0.253 0.360 0.130 0.323 0.173 0.971 0.175 0.315 0.206 0.389 0.256
Q30a 0.355 0.436 0.378 0.428 0.220 0.451 0.354 0.241 0.509 0.138 0.937 0.587 0.977 0.422 0.520
Q30b 0.366 0.455 0.341 0.422 0.164 0.488 0.296 0.251 0.465 0.213 0.953 0.618 0.976 0.361 0.438
Q30c 0.337 0.405 0.344 0.380 0.244 0.432 0.238 0.224 0.491 0.131 0.946 0.520 0.854 0.417 0.411
Q30d 0.171 0.306 0.139 0.193 0.113 0.404 0.144 0.216 0.270 0.086 0.862 0.386 0.731 0.272 0.246
Q34a 0.269 0.434 0.328 0.479 0.161 0.268 0.249 0.250 0.422 0.251 0.558 0.939 0.583 0.460 0.420
Q34b 0.303 0.434 0.291 0.442 0.082 0.276 0.168 0.219 0.355 0.234 0.554 0.981 0.589 0.349 0.302
Q34c 0.258 0.370 0.265 0.358 0.046 0.316 0.098 0.205 0.338 0.294 0.553 0.939 0.593 0.308 0.306
Q29 0.342 0.156 0.198 0.283 -0.052 0.275 -0.037 0.152 0.252 0.095 0.376 0.573 0.924 0.096 0.121
Q32a 0.355 0.436 0.378 0.428 0.220 0.451 0.354 0.241 0.509 0.138 0.937 0.587 0.977 0.422 0.520
Q32b 0.366 0.455 0.341 0.422 0.164 0.488 0.296 0.251 0.465 0.213 0.953 0.618 0.976 0.361 0.438
Q35a 0.019 0.202 0.321 0.080 0.238 0.172 0.086 0.181 0.392 0.354 0.210 0.087 0.157 0.778 0.451
Q35b 0.141 0.401 0.353 0.313 0.226 0.297 0.352 0.185 0.476 0.262 0.382 0.432 0.422 0.886 0.581
Q35c 0.207 0.344 0.365 0.215 0.291 0.179 0.235 0.218 0.566 0.483 0.400 0.407 0.387 0.878 0.483
Q36a -0.177 -0.158 -0.323 -0.315 -0.086 -0.086 -0.018 0.022 -0.295 -0.090 -0.158 -0.246 -0.232 -0.205 -0.728
Q36b -0.148 -0.122 -0.284 -0.282 -0.064 -0.078 -0.004 -0.006 -0.253 -0.089 -0.145 -0.237 -0.221 -0.170 -0.695
Q36c -0.230 -0.295 -0.454 -0.367 -0.099 -0.233 -0.015 -0.080 -0.315 -0.174 -0.147 -0.119 -0.169 -0.296 -0.769
Q36h 0.345 0.449 0.470 0.548 0.209 0.383 0.283 0.191 0.644 0.172 0.543 0.431 0.558 0.646 0.920
Q36i 0.418 0.456 0.579 0.551 0.250 0.439 0.303 0.151 0.593 0.266 0.494 0.306 0.521 0.640 0.950
Q36j 0.395 0.494 0.531 0.510 0.213 0.389 0.306 0.206 0.656 0.350 0.469 0.379 0.508 0.670 0.944

164
Table 4.2 Construct Correlations versus Composite Reliability and Square Root of Average Variance Extracted.
Correlations of Latent Variables
CwUAC EoIAE Read EoCI EoI RF Dov Neu EoC Relev Reli Suf SatM ateri-
alityDU1
CwUAC 1.000
EoIAE 0.452 1.000
Read 0.572 0.562 1.000
EpCI 0.551 0.402 0.647 1.000
EoI 0.239 0.156 0.204 0.474 1.000
RF 0.384 0.537 0.548 0.518 0.103 1.000
Dov 0.278 0.289 0.165 0.058 0.022 0.134 1.000
Neu 0.010 0.313 0.223 0.092 -0.021 0.110 0.149 1.000
EoC 0.239 0.437 0.423 0.288 0.139 0.252 0.297 0.177 1.000
Relev 0.347 0.413 0.413 0.213 0.262 0.414 0.148 0.330 0.174 1.000
Reli 0.344 0.440 0.339 0.399 0.205 0.481 0.290 0.253 0.482 0.159 1.000
Suf 0.291 0.434 0.311 0.450 0.104 0.300 0.184 0.237 0.393 0.271 0.583 1.000
Sat 0.369 0.456 0.369 0.436 0.197 0.480 0.333 0.252 0.499 0.179 0.968 0.617 1.000
M ateri-ality 0.158 0.386 0.408 0.255 0.296 0.259 0.283 0.229 0.571 0.430 0.405 0.395 0.402 1.000
DU1 0.373 0.441 0.545 0.539 0.207 0.370 0.241 0.154 0.602 0.252 0.451 0.363 0.491 0.598 1.000
Square Root of
Average
Variance
Extracted 0.827 0.939 0.931 0.889 0.967 0.770 0.871 0.899 0.858 0.869 0.925 0.953 0.952 0.849 0.841
Composite
Reliability 0.867 0.957 0.951 0.919 0.967 0.813 0.907 0.891 0.894 0.899 0.96 0.967 0.976 0.885 0.934

165
Table 4.3 Shared Variance Among Constructs (squared correlations) versus Composite Reliability and Average Variance Extracted.
Squared Correlations of Latent Variables
CwUAC EoIAE Read EoCI EoI RF Dov Neu EoC Relev Reli Suf SatM ateri-
alityDU1
CwUAC 1.000
EoIAE 0.204 1.000
Read 0.327 0.316 1.000
EpCI 0.303 0.162 0.418 1.000
EoI 0.057 0.024 0.042 0.225 1.000
RF 0.148 0.289 0.300 0.269 0.011 1.000
Dov 0.077 0.083 0.027 0.003 0.000 0.018 1.000
Neu 0.000 0.098 0.050 0.008 0.000 0.012 0.022 1.000
EoC 0.057 0.191 0.179 0.083 0.019 0.064 0.088 0.031 1.000
Relev 0.120 0.171 0.170 0.045 0.069 0.171 0.022 0.109 0.030 1.000
Reli 0.118 0.194 0.115 0.159 0.042 0.232 0.084 0.064 0.232 0.025 1.000
Suf 0.084 0.189 0.097 0.203 0.011 0.090 0.034 0.056 0.154 0.074 0.340 1.000
Sat 0.136 0.208 0.136 0.190 0.039 0.231 0.111 0.064 0.249 0.032 0.937 0.381 1.000
M ateriality 0.025 0.149 0.167 0.065 0.088 0.067 0.080 0.053 0.327 0.185 0.164 0.156 0.161 1.000
DU1 0.139 0.194 0.297 0.290 0.043 0.137 0.058 0.024 0.363 0.064 0.203 0.132 0.241 0.358 1.000
Average
Variance
Extracted 0.6848 0.882 0.867 0.791 0.936 0.593 0.765 0.805 0.737 0.754 0.856 0.908 0.953 0.721 0.707
Composite
Reliability 0.8668 0.957 0.951 0.919 0.967 0.813 0.907 0.891 0.894 0.899 0.96 0.967 0.976 0.885 0.934

166
Table 4.1 Item M easure Descriptive Statistics (n=55)
Item M ean Variance
(n-1)
Standard deviation
(n-1)
Skewness
(Fisher)
Kurtosis (Fisher) Item M ean Variance
(n-1)
Standard
Deviation
(n-1)
Skewness (Fisher) Kurtosis (Fisher)
Q10a 0.721 1.322 1.150 -0.183 -0.399 Q9c 2.067 0.871 0.933 -1.145 1.381
Q10b 1.122 0.966 0.983 -0.113 -0.676 Q25 1.207 1.052 1.025 -0.333 0.864
Q10c 0.782 1.347 1.161 -0.512 0.841 Q26 1.230 1.135 1.065 -0.111 -0.432
Q11a 1.185 1.040 1.020 -0.498 -0.289 Q27 1.541 0.990 0.995 0.116 -1.024
Q11b 1.291 0.896 0.947 -0.288 -0.369 Q29 -0.278 2.403 1.550 0.082 0.293
Q11c 1.309 1.056 1.028 -0.624 0.756 Q30a 1.069 0.798 0.893 -0.248 -0.492
Q12a 1.500 1.020 1.010 -0.519 0.092 Q30b 0.903 0.991 0.996 -0.363 -0.765
Q12b 1.400 1.207 1.099 -0.779 0.744 Q30c 0.793 1.042 1.021 -0.401 -0.347
Q13a 1.590 0.691 0.831 -1.020 1.520 Q30d 0.851 0.812 0.901 -0.225 -0.841
Q13b 1.140 1.277 1.130 -0.921 0.843 Q32a -0.294 1.962 1.401 -0.198 0.696
Q13c 1.338 0.859 0.927 -0.720 0.618 Q32b -0.371 1.893 1.376 -0.196 0.836
Q13d 0.743 1.425 1.194 -0.757 0.784 Q34a 1.016 1.400 1.183 -0.892 0.274
Q14a 0.712 1.030 1.015 -0.387 0.488 Q34b 0.710 1.392 1.180 -1.025 0.924
Q14b 1.162 0.916 0.957 -0.853 1.451 Q34c 0.668 1.328 1.152 -0.723 -0.294
Q14c 0.910 1.206 1.098 -0.967 1.670 Q35a 1.482 0.936 0.967 -1.202 2.361
Q15a 0.578 1.905 1.380 -0.638 0.440 Q35b 1.622 0.451 0.672 -0.473 0.355
Q15b 0.587 1.831 1.353 -0.540 0.667 Q35c 1.589 0.850 0.922 -0.550 0.085
Q15c 0.863 1.642 1.281 -0.564 0.781 Q36a -1.760 1.092 1.045 0.713 0.181
Q16a 1.971 1.086 1.042 0.182 -0.630 Q36b -1.739 1.214 1.102 1.009 1.451
Q16b 2.535 0.842 0.917 -0.105 -0.730 Q36c -1.871 1.017 1.008 0.771 0.038
Q16c 2.405 0.813 0.902 -0.246 -0.132 Q36d 0.524 1.068 1.034 -0.349 -0.242
Q16d 1.811 1.050 1.025 0.161 -0.348 Q36e 0.685 0.993 0.996 -0.662 0.364
Q17a -0.231 1.936 1.391 0.162 -0.260 Q36f 0.870 0.698 0.836 -0.743 1.357
Q17b 0.626 1.533 1.238 0.032 -0.630 Q36g 0.717 0.816 0.903 -0.799 1.409
Q22a 1.016 1.131 1.064 -0.808 0.848 Q36h 1.452 0.737 0.858 -0.164 -0.567
Q22b 1.051 1.339 1.157 -1.151 1.370 Q36i 1.584 0.579 0.761 -0.182 -0.169
Q9a 2.110 1.101 1.049 -1.631 4.227 Q36j 1.608 0.613 0.783 -0.145 -0.267
Q9b 2.073 0.809 0.900 -1.255 2.020

167
Figure 4.1. Materiality Path Analysis.

168
Figure 4.2 Decision Usefulness Path Analysis.

Chapter 5
Summary and Conclusions
Section 5.1 Introduction
This chapter commences with a discussion of the significant findings of the
materiality and decision usefulness models, summarizes our conclusions, outlines the
limitations and strengths of our study, and concludes with some suggestions regarding
future research.
Section 5.2.1 Significant Findings
The first part in evaluating the adequacy of the theoretical model is to present the
measurement model results. We focused on the reliability and validity of the measures
used to represent each construct in the nomological model. We show that the measures
we develop are accurate and they also display convergent and discriminant validity.
Having established the appropriateness of the measures, the next step is to provide
evidence supporting our theoretical model. We have two models for assessing the quality of
products and services segment disclosure reports. Using the same set of quality predictors, we
find differential impact on two summary evaluations: Materiality and Decision Usefulness. Each
169

170
model has the same core nomological network. However, both the relative impact among and the
significance of the predictors varied. Below is a discussion of both models.
Section 5.2.2 Materiality Model
Based upon our theoretical model, the decision usefulness model has the following
hypotheses:
H1: Fundamental equity analysis investment decision-makers’ determination of
materiality is positively influenced by ease of comparing
H1(a): Fundamental equity analysis investment decision-makers’ determination
of ease of comparing is positively influenced by ease of complete intelligibility
1H1(a ): Fundamental equity analysis investment decision-makers’
determination of ease of complete intelligibility is positively influenced by
readableness
2H1 (b ): Fundamental equity analysis investment decision-makers’
determination of ease of complete intelligibility is positively influenced by
consistency with users’ accounting constructs
Hi 3(c ): Fundamental equity analysis investment decision-makers’
determination of ease of complete intelligibility is positively influenced by
ease of interpreting accounting estimates
H1(b): Fundamental equity analysis investment decision-makers’ determination
of ease of comparing is positively influenced by ease of integrating
H2: Fundamental equity analysis investment decision-makers’ determination of
materiality is positively influenced by relevance

171
H3: Fundamental equity analysis investment decision-makers’ determination of
materiality is positively influenced by reliability
H3(a): Fundamental equity analysis investment decision-makers’ determination
of reliability is positively influenced by representational faithfulness
H3(b): Fundamental equity analysis investment decision-makers’ determination
of reliability is positively influenced by degree of verification
H3(c): Fundamental equity analysis investment decision-makers’ determination
of reliability is positively influenced by neutrality
H4: Fundamental equity analysis investment decision-makers’ determination of
materiality is positively influenced by sufficiency
H5: Fundamental equity analysis investment decision-makers’ determination of
materiality is positively influenced by satiation
The Materiality model (R of 0.492) indicate that five qualities of reported products and services2
segment disclosures influence fundamental-equity analysts’ perceptions that these disclosures
influence their knowledge of firms. We find that two of the five factors are the most important:
Ease of Comparing (0.438 at the 0.002 level) and Relevance (0.345 at the 0.014 level).
Respectively, in declining levels of importance, the remaining three qualities are Sufficiency
(0.137 at the 0.084 level), Satiation (-0.122 at the 0.041 level), and Reliability (0.109 at the 0.244
level). Thus except for one of these qualities, Reliability, all are statistically significant at the 0.10
level.
The negative sign for the Satiation path coefficient may be suggestive of a suppresor
effect. The correlation of Satiation and Materiality is positive, but shows up negative when used
in conjunction with the other 4 predictors. In other words, Satiation helps to enhance the overall

172
predictive power of the model. As a alternate explanation, while analysts have persistently
stressed that firms should be required to disclose more information, about their segments, than are
required (FASB 1997, AMIR 1993), the negative path may also suggest a inverted U impact
where more disclosure is initially deemed important, but at some point it reaches a peak and than
more information becomes overload.
The Ease of Comparing (R of 0.086) component of our Materiality model shows weak2
prediction by Ease of Complete Intelligibility (0.278 at the 0.012 level) and Ease of Integrating
(0.030 at the 0.370 level) and suggest other factors may come into play in forming analysts’
perceptions of how easy it is for them to compare reported products and services segment
disclosures. Moreover, of these two disclosure qualities, only the former is statistically significant
the 0.10 level.
Nevertheless, in terms of Ease of Complete Intelligibility (R of 0.489) component of our2
Materiality model, we found good predictors in Readableness (0.506 at the 0.001 level),
Consistency with Users’ Accounting Constructs (0.283 at the 0.018 level), and Ease of
Interpreting Accounting Estimates (-0.011 at the 0.549 level) form analysts’ perceptions of
reported products and services segment disclosure lucidity. The first two disclosure qualities are
both substantive and statistically significant at the 0.01 level.
Even though it is not statistically significant, the Ease of Interpreting Accounting
Estimates disclosure quality path coefficient is of note. The slight negative effect may suggest
that analysts may be having difficulty interpreting the numerical segment reporting data provided
by firms. This is of import because segment reporting regulations, currently, give firms wide
latitude regarding how they derive their segment measures. These measures need only be those
that firms employ internally for resource allocation and segment performance assessment
purposes (FASB 1997, para. 10). This means that segment measures, unlike all other financial

173
statement measures need not be developed in accordance with GAAP (FASB 1997, para. 84). In
fact, this latitude is a factor that caused one FASB board member to issue a dissenting opinion
when the post-1998 segment disclosure standard was issued (FASB 1997, para. 40).
The Reliability (R of 0.320) component of our Materiality model indicate that2
Representational Faithfulness (0.436 at the 0.002 level), Degree of Verification (0.212 at the
0.031 level), and Neutrality 0.187 at the 0.070 level) form fundamental-equity analysts’
perceptions of reported products and services segment disclosures suitability. All of these
disclosure qualities are statistically significant at the 0.10 level. However as previously
mentioned, for our Materiality model, Reliability is the least important predictor of Materiality
and shown not to be statistically significant.
Nevertheless, the just mentioned path coefficients indicate that Representational
Faithfulness is the most important predictor of Reliability. This finding suggests fundamental-
equity analysts perceive that firms’ reported products and services segment reporting disclosures
are corresponding with the non-financial reporting information to which these analysts have
access. This is of import because a lack of representational faithfulness was one of analysts’
primary criticisms of pre-1998 disclosures (AIMR 1993). Hence, the representational faithfulness
of firms’ post-1998 disclosures seem to be positively impacting analysts perceptions of their
acquired knowledge of firms.
Likewise, Degree of Verification is the second most important predictor of Reliability.
This finding indicates that analysts perceive that auditors are verifying firms’ reported products
and services segment disclosures. This too is of import because, unlike pre-1998 reported
products and services segment disclosures, auditors are required to verify post-1998 disclosures.
Moreover, post-1998 segment reporting regulations are structured to facilitate audit verification
(FASB 1997, para. 87).

174
Lastly, Neutrality is the least important predictor of Reliability. This suggests that
analysts perceive that firms’ reported products and services disclosures are biased, in spite of
audit verification. This finding is not surprising. Prior accounting researchers have found that
firms opportunistically disclose and conceal segment reporting data (Botosan and Stanford 2005).
Others find that firms are not transparently conveying data about their segments and that external
auditors are facilitating this lack of transparency (Paul and Largay 2005).
In short, 49% of the variation in our Materiality model is explained by our five
predictors: Ease of Comparing, Relevance, Reliability, Sufficiency, and Satiation. In addition our
model has three endogenous components: Ease of Comparing, Ease of Complete Intelligibility,
and Reliability. The predictors of the last two components respectively explain 48.9% and 32% of
their total component variation. Each of these three variation percentages are moderate, for a PLS
structural model (Chin 1998b). However, the predictors for the Ease of Comparing component
only explain 8.6% of its total variation; this explained variation percentage is weak (Chin 1998b).
Such a weak explained variation suggests that the Ease of Comparing component is a candidate
for future amendment.
Eleven of the thirteen path coefficients in our Materiality model all are larger than 0.10,
and thus merit notice (Urbach and Ahlemann 2010). Two do not: those pertaining to Ease of
Interpreting Accounting Estimates, Ease of Integrating. Furthermore, ten of the thirteen path
coefficients are statistically significant at the 0.10 level; however, three are not. These three
include: the two low magnitude path coefficients, and that for Reliability. The insignificance of
the Reliability path coefficient, and the fact that its magnitude is just above 0.10, suggest the
possibility that had our sample size been larger, this path coefficient would have been statistically
significant.

175
The magnitude and statistical significance of the path coefficients in our Materiality
model suggest that, while Reliability is a predictor of Materiality, it is not nearly as important as
the other four predictors. This finding is somewhat surprising because the guidance that the
FASB used to develop the post-1998 reported products and services segment disclosures, the
Qualitative Characteristics of Accounting Information (FASB 1989), gives a higher relative
weight to issues of reliability than to issues of comparability. Moreover, issues associated with
sufficiency and satiation are not explicitly mentioned.
Nevertheless, the FASB asserted in its post-1998 segment disclosure standard, that
analysts are willing to trade-off reliability for relevance. Moreover, analysts would be willing to
assume more responsibility for making the adjustments required to make intra- and inter-firm
comparisons of segment data (FASB 1997, para. 86; AIMR 1993). Further, the FASB declared
that its post-1998 standard meets its reliability objective (FASB 1997, para. 87), and most firms
would report more segments and more information about each segment (FASB 1997, para. 113).
Moreover, prior researchers’ findings support this latter declaration. Our Materiality model
results support asserting that fundamental-equity analysts perceive post-1998 reported products
and services segment disclosures influence their understandings of firms, and in that respect both
the FASB’s and these analysts’ objectives are being met.
Section 5.2.3 Decision Usefulness Model
Based upon our theoretical model, the decision usefulness model has the following
hypotheses:
H1: Fundamental equity analysis investment decision-makers’ determination of decision
usefulness of data is positively influenced by ease of comparing

176
H1(a): Fundamental equity analysis investment decision-makers’ determination
of ease of comparing is positively influenced by ease of complete intelligibility
1H1(a ): Fundamental equity analysis investment decision-makers’
determination of ease of complete intelligibility is positively influenced by
readableness
2H1 (b ): Fundamental equity analysis investment decision-makers’
determination of ease of complete intelligibility is positively influenced by
consistency with users’ accounting constructs
3Hi(c ): Fundamental equity analysis investment decision-makers’
determination of ease of complete intelligibility is positively influenced by
ease of interpreting accounting estimates
H1(b): Fundamental equity analysis investment decision-makers’ determination
of ease of comparing is positively influenced by ease of integrating
H2: Fundamental equity analysis investment decision-makers’ determination of decision
usefulness of data is positively influenced by relevance
H3: Fundamental equity analysis investment decision-makers’ determination of decision
usefulness of data is positively influenced by reliability
H3(a): Fundamental equity analysis investment decision-makers’ determination
of reliability is positively influenced by representational faithfulness
H3(b): Fundamental equity analysis investment decision-makers’ determination
of reliability is positively influenced by degree of verification

177
H3(c): Fundamental equity analysis investment decision-makers’ determination
of reliability is positively influenced by neutrality
H4: Fundamental equity analysis investment decision-makers’ determination of decision
usefulness of data is positively influenced by sufficiency
H5: Fundamental equity analysis investment decision-makers’ determination of decision
usefulness of data is positively influenced by satiation
The second model using Decision Usefulness (R of 0.451) as the final outcome assesses2
how fundamental-equity analysts’ judgments about whether reported products and segment
disclosures improve their understandings of firms. This model, as previously mentioned, has the
same core nomological predictor network as our Materiality model. Consequently, this model
examines how analysts aggregated the same five disclosure qualities: Ease of Comparing (0.515
at the 0.000 level), Relevance (0.109 at the 0.234 level), Reliability (0.180 at the 0.161 level),
Sufficiency (0.113 at the 0.209 level), and Satiation (-0.152 at the 0.113 level). The path
coefficients of all of these five disclosure qualites are greater than 0.10 and thus merit notice,
however, only that for Ease of Comparing is significant at the 0.10 level. In comparison, our
Materiality model found four of these path coefficients being significant including Ease of
Comparing.
Our Decision Usefulness model, like our Materiality model, has three endogenous components:
Ease of Comparing, Ease of Complete Intelligibility, and Reliability. The explained variation of
the Ease of Comparing (R of 0.096 versus 0.086), and Reliability (R of 0.322 versus 0.320)2 2
components are slightly higher for this model than for our Materiality model. Only the explained
variation of the Ease of Complete Intelligibility (R of 0.489) component did not vary.2
Consequently, as with our Materiality model, the explained variation of the Ease of Comparing
component is weak, but that of the other two components is moderate (Chin 1998b). Nevertheless

178
for each of the three endogenous components, the relative impact of their predictors, and the
significance of the coefficients are comparable to those of our Materiality model.
Section 5.3 Conclusions
In short, in comparing our results for the two models, our most significant finding is that
Ease of Comparing is the most important predictor for both Materiality and Decision Usefulness.
However, surprisingly the relative importance of Relevance and Reliability shifts dramatically.
Our Materiality model predicts that Relevance is the second most important predictor and
Reliability is the least important. In contrast, our Decision Usefulness model predicts just the
opposite
Our results suggest that to have an impact on analysts’ understanding of firms, relevant
disclosures are more important than reliable disclosures. However, to increase analysts’
understanding of firms, reliable information is more important than relevant information.
Furthermore, the amount of post-1998 reported products and services segment data being
disclosed is insufficient to improve analysts’ understandings of firms. These findings seem to
support the dissenting FASB board member’s assertion that post-1998 reported segment
disclosures are unlikely to facilitate better understanding firms’ performance, better assessing
their prospects for future net cash flows, and making more informed judgments about firms as a
whole (FASB 1997, para. 40 and 10). As a consequence, we infer that post-1998 disclosures are
merely data, not information.
Section 5.4 Limitations of the Study
Our study was limited to one group of analysts, fundamental-equity analysts.
Further, because of the small number of respondents, fifty-five, care must be taken in
generalizing the results. The survey questionnaire approach is not a longitudinal study,
and thus is not free of subjectivity by the respondent.

179
The research in this study is being used to predict causal relationships between
the constructs studied. Although PLS analysis provides strong support for the
interpretation due to the fact that all of the relationships are tested simultaneously,
conclusive statements about causality cannot be made since alternative explanations
cannot be ignored.
Section 5.5 Future Extensions of Present Research
In this study, only one class of analysts was examined. The perceptions of other
decision makers should be studied. The research design utilized in this dissertation can
also be used to evaluate other reporting issues in financial accounting.

REFERENCES
Agrawal, S. P. 1987. On the conceptual framework of accounting. Journal of AccountingLiterature 6: 165-78.
Aitken, M., C. Hooper, and J. Pickering. 1997. Determinants of voluntary disclosure ofsegment information: A re-examination of the role of diversification strategy. Accountingand Finance 37: 89-109.
———, R. M. Czernkowski, and C. G. Hooper. 1994. The information content of segmentdisclosures: Australian evidence. Abacus 30 (1): 65-77.
Ajinkya, B. B. 1980. An empirical evaluation of line-of-business reporting. Journal ofAccounting Research 18 (2): 343-61.
Albrecht, W. D., and N. Chipalkatti. 1998. New segment reporting. CPA Journal 68 (5): 46-51.
Alciatore, M. L. 1990. The reliability and relevance of reserve value accounting data: Areview of the empirical research. Journal of Accounting Literature 9: 1-38.
American Accounting Association. 1966. A Statement of Basic Accounting Theory. Sarasota,FL: American Accounting Association.
———. Committee on Concepts and Standards Underlying Corporate Financial Statements.1955. Standards of disclosure for published financial reports: Supplementary Statement No.8. The Accounting Review 30 (3): 400-404.
180

181
———. 1976. Response to the Financial Accounting Standards Board's discussionmemorandum entitled "An analysis of issues related to criteria for determining materiality".The Accounting Review 51 (Supplement): 243-56.
———. 1994. Response to the FASB discussion memorandum 'Reporting disaggregatedinformation by business enterprises'. Accounting Horizons 8 (3): 75-82.
American Institute of Certified Public Accountants. 1994. Improving Business Reporting---ACustomer Focus. Meeting the Information Needs of Investors and Creditors. AComprehensive Report of the Special Committee on Financial Reporting. New York, N. Y.:AICPA.
———. 1976. APB Statement No. 2: Disclosure of supplemental financial information bydiversified companies. in Financial Accounting Standards: Original Pronouncements As ofJuly 1, 1976. Financial Accounting Standards Board Accounting Principles BoardCommittee on Accounting Procedure Chicago: Commerce Clearing House.
———. 1973. Report of the Study Group on the Objectives of Financial Statements.Objectives of Financial Statements. New York: AICPA.
———. 1994. Special Committee on Financial Reporting. Database of Materials on Users'Needs for Information. New York.: AICPA.
———. 1993. The Information Needs of Investors and Creditors. New York: AICPA.
Anderson, R., T. Bates, J. Bizjak, and M. Lemmon. 2000. Corporate governance and firmdiversification. Financial Management 29: 5-22.
Anton, H. R. 1976. Objectives of financial reporting: Review and analysis. Journal ofAccountancy (January): 40-51.
Arnold, J., W. W. Holder, and M. H. Mann. 1980. International reporting aspects of segmentdisclosure. International Journal of Accounting Education and Research (Fall): 125-35.
———, and A. Hope. 1975. Reporting business performance. Accounting and BusinessResearch (18): 96-105.

182
———, and P. Moizer. 1984. A survey of the methods used by UK investment analysts toappraise investments in ordinary shares. Accounting and Business Research 14 (55): 195-207.
Association for Investment Management and Research. 1996. Report of the CorporateInformation Committee, 1994-1995. New York: AIMR.
———. 1992. Report of the Corporate Information Committee: Including Evaluation ofCorporate Financial Reporting in Selected Industries for the Year 1991-1992. New York:AIMR.
———. 1997. Corporate Information Committee. An Annual Review of Corporate ReportingPractices, 1995-96 . New York: AIMR.
Ayres, F. L. 1994. Perceptions of earnings quality: What managers need to know.Management Accounting: 27-29.
Ayres, F. L., and J. L. Rodgers. 1994. Further evidence on the impact of SFAS 52 onanalysts' earnings forecasts. Journal of International Financial Management and Accounting5 (2): 120-141.
Babbie, E. R. 1990. Survey Research Methods. Belmont, CA: Wadsworth Publication Co.
Backer M., and W. McFarland. 1968. External Reporting for Segments of a Business. NewYork: National Association of Accountants.
———. 1988. Financial Accounting: Concepts and Practices. San Diego: Harcourt BraceJovanovich.
———. 1970. Financial Reporting for Security Investment and Credit Decisions. NewYork: National Association of Accountants.
Bagranoff, N. A. 1990. The semantic differential: A prescription for use in accountingresearch. Journal of Accounting Literature 9: 65-80.
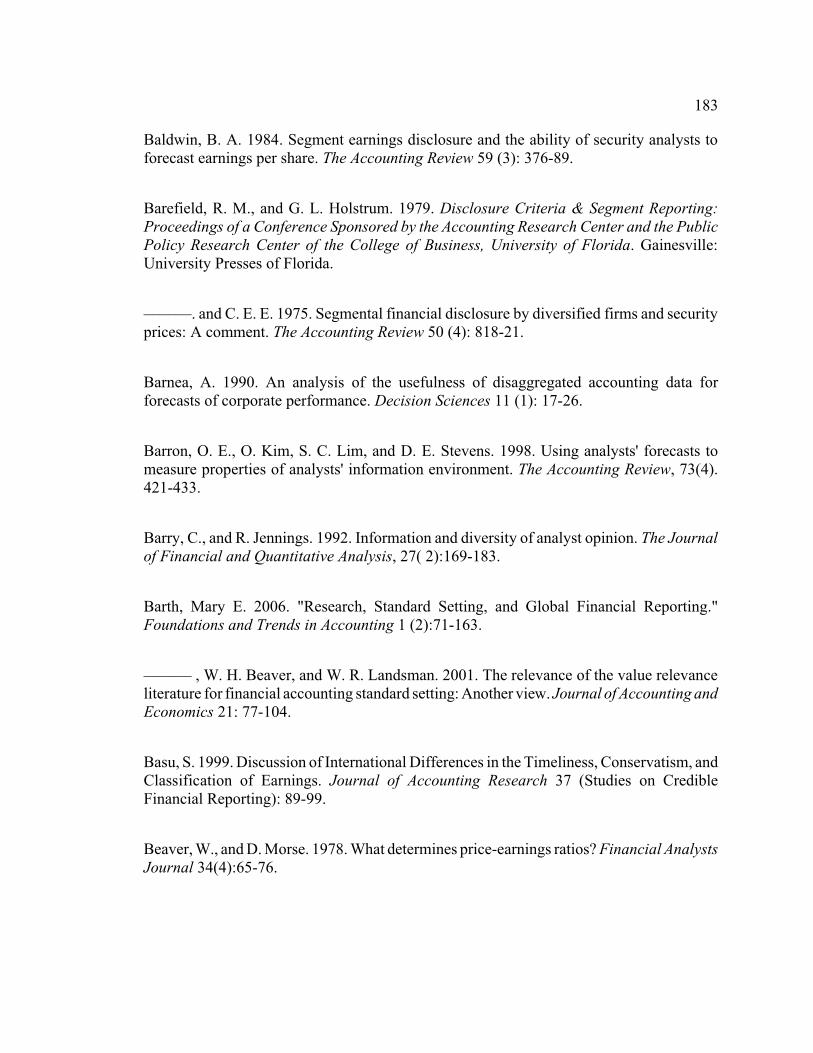
183
Baldwin, B. A. 1984. Segment earnings disclosure and the ability of security analysts toforecast earnings per share. The Accounting Review 59 (3): 376-89.
Barefield, R. M., and G. L. Holstrum. 1979. Disclosure Criteria & Segment Reporting:Proceedings of a Conference Sponsored by the Accounting Research Center and the PublicPolicy Research Center of the College of Business, University of Florida. Gainesville:University Presses of Florida.
———. and C. E. E. 1975. Segmental financial disclosure by diversified firms and securityprices: A comment. The Accounting Review 50 (4): 818-21.
Barnea, A. 1990. An analysis of the usefulness of disaggregated accounting data forforecasts of corporate performance. Decision Sciences 11 (1): 17-26.
Barron, O. E., O. Kim, S. C. Lim, and D. E. Stevens. 1998. Using analysts' forecasts tomeasure properties of analysts' information environment. The Accounting Review, 73(4).421-433.
Barry, C., and R. Jennings. 1992. Information and diversity of analyst opinion. The Journalof Financial and Quantitative Analysis, 27( 2):169-183.
Barth, Mary E. 2006. "Research, Standard Setting, and Global Financial Reporting."Foundations and Trends in Accounting 1 (2):71-163.
——— , W. H. Beaver, and W. R. Landsman. 2001. The relevance of the value relevanceliterature for financial accounting standard setting: Another view. Journal of Accounting andEconomics 21: 77-104.
Basu, S. 1999. Discussion of International Differences in the Timeliness, Conservatism, andClassification of Earnings. Journal of Accounting Research 37 (Studies on CredibleFinancial Reporting): 89-99.
Beaver, W., and D. Morse. 1978. What determines price-earnings ratios? Financial AnalystsJournal 34(4):65-76.

184
———, and J. S. Demski. 1974. The nature of financial accounting objectives: A summaryand synthesis. Studies on Financial Accounting Objectives: Supplement to the Journal ofAccounting Research: 170-182.
———, John W. Kennelly, and William M. Voss. 1968. Predictive ability as a criterion forthe evaluation of accounting data. The Accounting Review 43 (4): 675-83.
Belkaoui, A., A. Kahl, and J. Peyrard. 1977. Information needs of financial analysts: Aninternational comparison. International Journal of Accounting (1): 19-27.
Beresford, D. R. 1995. How should the FASB be judged? Accounting Horizons 9 (2): 56-61.
Bernard, V. L. 1993. Earnings quality, book value, and the state of financial statementanalysis. In Earnings Quality. Editor S. A. Butler, 174-83. Norman: The University ofOklahoma, Center for Economic and Management Research.
Bernstein, L. A. 1992. A financial analysts guide to accounting quality. Business Credit 94(2): 11-13.
———. 1993. Financial Statement Analysis: Theory, Application, and Interpretation.Homewood: Irwin.
———, and J. G. Siegel. 1979. The concept of earnings quality. Financial Analysts' Journal:72-75.
Bhushan, R. 1989. Firm characteristics and analyst following. Journal of Accounting andEconomics 11 (2/3): 255-74.
Biggs, S. F. 1984. Financial analysts' information search in the assessment of corporateearning power. Accounting, Organizations, and Society 9 (3/4): 313-23.
Bird, P. 1975. Objectives and methods of financial reporting: A generalised searchprocedure. Accounting and Business Research (19): 162-67.
Block, S. B. 1999. A study of financial analysts: Practice and theory. Financial AnalystsJournal 55 (4): 86-95.

185
Bodnar, G., C. Tang, and J. Weintrop. 1997. Both Sides of Corporate Diversification: TheValue Impacts of Geographic and Industrial Diversification. Cambridge, MA.: NationalBureau of Economic Research.
Boersema, J. M., and S. J. Van Weelden. 1992. Financial Reporting for Segments. Canada:CICA.
———. 1992. Financial Reporting for Segments: Background Papers. Canada: CICA.
Botosan, C. A., and M. S. Harris. 2000. Motivations for a change in disclosure frequency andits consequences: An examination of voluntary quarterly segment disclosures. Journal ofAccounting Research 38 (2): 329-53.
Bouwman, M., P. Frishkoff, and P. A. Frishkoff. 1995. The relevance of GAAP-basedinformation: A case study exploring some uses and limitations. Accounting Horizons 9 (4):22-47.
———. 1987. How do financial analysts make decisions? A Process model of theinvestment screening decision. Accounting, Organizations, and Society 12 (1): 1-29.
Bradbury, M. E. 1992. Voluntary disclosure of financial segment data: New Zealandevidence. Accounting and Finance 32(1): 15-26.
Breton, G., and R. J. Taffler. 2001. Accounting information and analyst stockrecommendation decisions: A content analysis approach. Accounting and Business Research31 (2): 91-101.
Bricker, R., G. J. Previts, T. Robinson, and S. Young. 1995. Financial analyst assessmentof company earnings quality. Journal of Accounting, Auditing & Finance 10 (3): 541-54.
Brown, P. R. 1997. Financial data and decision-making by sell-side analysts. The Journalof Financial Statement Analysis (Spring): 43-48.
———. 1998. A model for effective financial analysis. The Journal of Financial StatementAnalysis 3 (4): 60-63.

186
Browne, M. W., and R. Cudeck. 1989. Single sample cross-validation indices for covariancestructures. Multivariate Behavioral Research 24: 445-55.
Bujaki, M. L., and A. J. Richardson. 1997. A citation trail review of the uses of firm size inaccounting research. Journal of Accounting Literature 16: 1-27.
Bush, George W. 2008. The Economy & The Bailout: Primetime Address to the Nation.Washington, D.C.
Buzby, S. 1975. Company size, listed versus unlisted stocks and the extent of financialdisclosure. Journal of Accounting Research 13 (1): 16-37.
Byard, D. 1998. Pre-disclosure information inferred from analysts' forecasts: Quality,consensus and firm size. University of Maryland.
Campbell, D. T., and D. Fiske. 1959. Convergent and discriminant validation by themultitrait-multimethod matrix. Psychological Bulletin 56 (2): 81-105.
Canadian Accounting Standards Board, and Financial Accounting Standards Board. 1995.Tentative Conclusions on Financial Reporting for Segments. Norwalk, CT: FASB.
Carnes, G. A., and D. M. Guffey. 2000. The influence of international status and operatingsegments on firms' choice of bonus plans. Journal of International Accounting, Auditing &Taxation 9 (1): 43-57.
Carsberg, B., A. Hope, and R. W. Scapens. 1974. The objectives of published accountingreports. Accounting and Business Research (15): 162-73.
———. 1975. The objectives of published accounting reports: Reply to a comment.Accounting and Business Research (18): 152-56.
Cates, D. C., and W. Lewin. 1999. SFAS No. 131 and the future of bank financial reporting.Bank Accounting & Finance 13 (1): 10-17.

187
CFA Institute CFMI (Chartered Financial Analyst Institute Centre for Financial MarketIntegrity). 2007. A Comprehensive Business Reporting Model: Financial Reporting forInvestors: CFA Institute.
Chambers, R. J. 1951. Disclosure is a matter of managerial policy, not accounting doctrine.Journal of Accountancy 92 (2): 223.
———. 1979. Usefulness - The vanishing premise in standard setting. Abacus 15 (2): 71-92.
Chandra, G. 1975. Information needs of security analysts. Journal of Accountancy 140 (6):65-70.
Chang, L. S., and K. S. Most. 1985. The Perceived Usefulness of Financial Statements forInvestors' Decisions. Miami: Florida International University Press.
———, K. S. Most, and C. W. Brain. 1983. The utility of annual reports: An internationalstudy. Journal of International Business Studies 14 (1): 63-84.
Chen, C. R., K. C. Chan, and T. L. Steiner. 2002. Are all security analysts equal? TheJournal of Financial Research 25 (3): 415-30.
Chin, W. W. 2010. How to Write Up and Report PLS Analyses. in Handbook of PartialLeast Squares: Concepts, Methods and Applications in Marketing and Related Fields, V.E. Vinzi, W. W. Chin, J. Henseler, and H. Wang (eds.). Berlin: Springer: 655-690
———, 1998. The partial least squares approach for structural equation modeling. InGeorge A. Marcoulides (Ed.), Modern Methods for Business Research, LawrenceErlbaum Associates: 295-336.
———. 1995. Partial Least Squares is to LISREL as principal components analysis is tocommon factor analysis. Technology Studies 2: 315-319.
———, and Marcolin, B. 1994. Tutorial - The Partial Least Squares Approach ForCausal Modeling In Information Systems Research. 14th International Conference OnInformation Systems.

188
———, and Newsted, P. R. 1999. Structural Equation Modeling analysis with SmallSamples Using Partial Least Squares. In Rick Hoyle (Ed.), Statistical Strategies for SmallSample Research, Sage Publications: 307-341.
Chugh, L. C., and J. W. Meador. 1984. The stock valuation process: The analysts' view.Financial Analysts Journal 40 (6): 41-48.
Clark, Vicki L. Plano, and John W. Creswell. 2008. The Mixed Methods Reader. LosAngeles: SAGE Publications.
Clement, M. 1999. Analyst forecast accuracy: Do ability, resources, and portfoliocomplexity matter? Journal of Accounting and Economics 27 (3):285-303.
Cluskey, G. R., Jr., Craig R. Ehlen, and Richard Rivers. 2007. "Accounting Theory:Missing in Action?" Management Accounting Quarterly no. 8 (2):24-31.
Coetsee, D. 2010. "The role of accounting theory in the development of accountingprinciples." Meditari Accountancy Research no. 18 (1):1-16.
Coggin, T. D. Ph. D. 1994. The analyst and the investment process: An overview. In TheHandbook of Company Performance and Stock Market Valuation: Corporate EarningsAnalysis. B. R. Bruce, and C. B. Epstein, 39-48. Chicago: Probus Publishing Company.
Cohen, I. 1997. FASB 131 sheds light on company segments. Chain Store Age 73 (10):190.
———. 1992. A power primer. Quantitative Methods In Psychology 112 (1): 155-59.
Coller, M., and B. G. Pierce. 1999. The new segment information: Is it any better? TheJournal of Financial Statement Analysis 4 (2): 65-72.
Collins, D. W. 1976. Predicting earnings with sub-entity data: Some further evidence.Journal of Accounting Research 14 (1): 163-77.
———. 1976. SEC Line-of-business reporting and earnings forecasts. Journal ofBusiness Research 4 (2): 117-30.

189
———, and R. R. Simonds. 1979. SEC line-of-business disclosure and market riskadjustments. Journal of Accounting Research 17 (2): 352-83.
Cook, T. D., and D. T. Campbell. 1979. Quasi-Experimentation: Design & AnalysisIssues for Field Settings. Boston: Houghton Mifflin.
Corbin, Juliet, and Anselm Strauss. 1990. "Grounded theory research: procedures,canons, and evaluative criteria." Qualitative Sociology no. 13 (1):3-21.
Cottle, S., R. F. Murray, and F. E. Block. 1988. Graham and Dodd's Security Analysis.New York: McGraw-Hill.
Cramer, J. 1968. Income reporting by conglomerates. Abacus 4: 17-26.
———, and G. H. Sorter. 1973. Objectives of Financial Statements: Selected Papers.New York: AICPA.
Creswell, John W. 2009. Research Design Qualitative, Quantitative, and Mixed MethodsApproaches. Los Angeles: SAGE Publications.
Davies, Mike, Ron Paterson, and Allister Wilson. 1997. "Segmental reporting." In UKGAAP: Generally Accepted Accounting Practice in the United Kingdom , edited by MikeDavies, Ron Paterson and Allister Wilson, 1059-1105. London: Macmillan.
Day, J. F. S. 1986. The use of annual reports by U.K. investment analysts. Accountingand Business Research 16 (64): 295-307.
Deppe, L., and S. C. Omer. 2000. Disclosing disaggregated information. Journal ofAccountancy 190 (3): 47-54.
———. 1994. Disaggregated information: Time to reconsider. Journal of Accountancy178 (6): 65-70.
DePree, C. M. Jr., and C. T. Grant. 1999. Earnings management and ethical decisionmaking: Choices in accounting for security investments. Issues in Accounting Education14 (4): 613-40.

190
Dhaliwal, D. S., F. M. Mboya, and R. M. Barefield. 1983. Utilization of SFAS No. 14disclosures in assessing operating risk. Journal of Accounting and Public Policy: 83-98.
Dhillon, Gurpreet, and Gholamreza Torkzadeh. 2006. "Value-focused assessment ofinformation system security in organizations." Information Systems Journal no. 16(3):293-314.
Dillman, D. A. 2000. Mail and Internet Surveys: The Tailored Design Method. NewYork: John Wiley & Sons.
Dopuch, N., and S. Sunder. 1980. FASB's statements on objectives and elements offinancial accounting: A review. The Accounting Review 55 (1): 1-21.
Duru, A., and D. M. Reeb. 2002. International diversification and analysts' forecastaccuracy and bias. The Accounting Review 77 (2): 415-33.
———. 2002. Geographic and industrial corporate diversification: The level andstructure of executive compensation. Journal of Accounting, Auditing, & Finance 17 (1):1-24.
Efron, B., and Tibshirani, R. J. (1993). An introduction to the bootstrap (monographs onstatistics and applied probability, #57). New York: Chapman & Hall.
Edwards,.W. 1998. FASB squeezing wiggle out of segments. CFO Alert 5 (47): 1-2.
Ely, K., and G. Waymire. 1999. Accounting standard-setting organizations and earningsrelevance: longitudinal evidence from NYSE common stocks, 1927-93. Journal ofAccounting Research 37 (2): 293-317.
Emmanuel, C., N. Garrod, C. McCallum, and E. Rennie. 1999. The impact of SSAP 25and the 10% materiality rule on segment disclosure in the UK. The British AccountingReview 31 (2): 127-49.
———, and S. Gray. 1977. Segmental disclosures and the segment identificationproblem. Journal of Accounting and Economics (Winter): 37-50.

191
———, and N. Garrod. 1992. Segment Reporting. Hemel Hempstead: Prentice Hall-ICAEW.
———, N. W. Garrod, and C. Frost. 1987. On the segment identification issue.Accounting and Business Research 17: 235-40.
———, and R. H. Pick. 1980. The predictive ability of UK segment reports. Journal ofBusiness Finance & Accounting (Summer): 201-18.
Epps, R. W. 1987. An empirical investigation of the effects of the quality of segmentaldisclosure on the behavior of systematic risk of diversified firms. Ph.D. dissertation.,Virginia Commonwealth University.
Epstein, M. J., and K. G. Palepu. 1999. What financial analysts want. ManagementAccounting 80 (10): 48-52.
Estes, R. W. 1968. An assessment of the usefulness of current cost and price-levelinformation by financial statement users. Journal of Accounting Research 6 (2): 200-207.
Ettredge, M., S. Y. Kwon, and D. Smith. 2002. Competitive harm and companies'positions on SFAS No. 131. Journal of Accounting, Auditing, & Finance 17 (2): 93-109.
Feltham, G. A., F. B. Gigler, and J. S. Hughes. 1992. The effects of line-of-businessreporting on competition in oligopoly settings. Contemporary Accounting Research 9 (1):1-23.
Ferris, S., and A. Sarrin. 2000. Security analysis and corporate diversification. Advancesin Financial Economics 5: 105-37.
Financial Accounting Standards Board. 1975. Criteria for Determining Materiality,Discussion Memorandum. Norwalk, Conn.:FASB.
———. 1975. Exposure Draft: Financial Reporting for Segments of a BusinessEnterprise. Stamford, Conn.: FASB.

192
———. 1996. Exposure Draft Proposed Statement of Financial Accounting Standards:Reporting Disaggregated Information About a Business Enterprise. Norwalk, Conn.:Financial Accounting Foundation.
———. 1979. Exposure Draft: Qualitative Characteristics: Criteria for Selecting andEvaluating Financial Accounting and Reporting Policies. Norwalk, Conn.: FASB.
———. 1989. Statement of Financial Accounting Concepts . 1989/90 ed. Norwalk,Conn: FASB.
———. 2010. "Statement of financial accounting concepts No. 8: Conceptual frameworkfor financial reporting." In Conceptual Framework. Norwalk, Conn.: FASB.
———. 1996. Minutes of October 2, 1996 meeting with field test participants, Compiler.Norwalk, Conn.: FASB.
———. 1996. Minutes of October 9, 1996 roundtable meeting, Compiler. Norwalk,Conn.: FASB.
———. 1996. Responses to "Exposure draft proposed statement of financial accountingstandards: Reporting disaggregated information about a business enterprise". Norwalk,Conn.: FASB.
———. 1991. Special Report: Benefits, Costs, and Consequences of FinancialAccounting Standards. Special Report: Benefits, costs, and consequences of financialaccounting standards. Norwalk, Conn.: FASB.
———. 1978. Statement of Financial Accounting Concepts No. 1: Objectives offinancial reporting by business enterprises. Norwalk, Conn.: FASB.
———. 1980. Statement of Financial Accounting Concepts No. 2: Qualitativecharacteristics of accounting information. 1980. Norwalk, Conn.: FASB.
———. 1984. Statement of Financial Accounting Concepts No. 5: Recognition andmeasurement in financial statements of business enterprises. Norwalk, Conn.: FASB.

193
———. 1997. Statement of Financial Accounting Standards No. 131: Disclosures AboutSegments of an Enterprise and Related Information. Norwalk, Conn.: FinancialAccounting Foundation.
———. 1976. Statement of Financial Accounting Standards No. 14: Financial Reportingfor Segments of As Business Enterprise. Stamford, Conn.: FASB.
———. 1995. Responses to "Invitation to comment: Reporting disaggregatedinformation about a business enterprise". Norwalk, Conn.: FASB.
———, and Accounting Standards Board of the Canadian Institute of CharteredAccountants. 1993. Invitation to Comment: Reporting Disaggregated Information byBusiness Enterprises. Norwalk, Conn.: FASB.
———. 1974. Discussion Memorandum No. 1: Financial Reporting for Segments of aBusiness Enterprise. Norwalk, Conn.: FASB.
———. 1974. Discussion Memorandum No. 2: Conceptual Framework for Accountingand Reporting: Consideration of the Report of the Study Group on the Objectives ofFinancial Statements. Norwalk, Conn.: FASB.
———. 1976. Discussion Memorandum No. 7: Conceptual Framework for FinancialAccounting and Reporting: Elements of Financial Statements and Their Measurement.Norwalk, Conn.: FASB.
———. 1976. Discussion Memorandum No. 8: Tentative Conclusions on the Objectivesof Financial Statements of Business Enterprises. Norwalk, Conn.: FASB.
———. 1976. Discussion Memorandum No. 9: An Analysis of Issues Related toConceptual Framework for Financial Accounting and Reporting: Elements of FinancialStatements and Their Measurement. Norwalk, Conn.: FASB.
———. 1999. International Accounting Standard Setting: A Vision for the Future---Report of the FASB. Norwalk, Conn.: FASB.
———. 1998. Special Report: The Framework of Financial Accounting Concepts andStandards. Norwalk, CT: FASB.

194
———. Statement No. 131---Disclosures about segments of an enterprise and relatedinformation. 2001. Annual Staff Implementation Guide. Norwalk, Conn.: FASB.
Financial Analysts Federation Financial Accounting Policy Committee, D. H. C. Korn,Cope Anthony T. CFA, M. M. ex. o. Hermann, P. H. C. Knutson, and McConnell PatriciaA. CPA (FAPC Co-Chair) . 1989. Interim Report of the Subcommittee on QuarterlySegment Reporting: Results of the Survey of FAF Members and Information AboutOngoing Research. New York: FAF.
Firth, M. 1984. The extent of voluntary disclosure in corporate annual reports and itsassociation with security risk measures. Applied Economics 16 (2): 269-77.
Fischer, P. E., and R. E. Verrecchia. 2000. Reporting bias. The Accounting Review 75 (2):229-45.
Fitzsimons, A. P., and V. L. Shoaf. 1999. SEC adopts amendments to conform to itssegment reporting requirements to GAAP. Bank Accounting & Finance 12 (4): 63-68.
Fleishman-Hillard Research. 2000. AIMR corporate disclosure survey. New York: AIMR
Foran, N. J., and M. F. Foran. 1987. SFAS No. 12 and the conceptual framework.Accounting Horizons (December): 43-50.
Fornell, Claes and Fred L. Bookstein (1982). Two Structural Equation Models: LISRELand PLS Applied to Consumer Exit-Voice Theory. Journal of Marketing Research, 19(November): 440-452.
———, and David F. Larcker (1981). Evaluating Structural Equation Models withUnobserved Variables and Measurement Error. Journal of Marketing Research, 18(February), 39-50.
Francis, J., and D. Philbrick. 1993. Analysts' decisions as products of a multi-taskenvironment. Journal of. Accounting Research 31(2): 216-30..
———, and K. Schipper. 1999. Have financial statements lost their relevance? Journalof Accounting Research 37 (2): 319-52.

195
Fried, D., Schiff, M., and Sondhi, A. C. 92. Quarterly Segment Reporting: Impact onAnalysts' Forecasts and Variability of Security Price Returns. working paper, New YorkUniversity.
Frishkoff, P., P. A. Frishkoff, and M. J. Bouwman. 1984. Use of accounting data inscreening by financial analysts. Journal of Accounting, Auditing & Finance 8 (1): 44-53.
Garrod, N. W., and C. R. Emmanuel. 1987. An empirical analysis of the usefulness ofdisaggregated accounting data for forecasts of corporate performance. OMEGAInternational Journal of Management Science 15 (5): 371-82.
———. 1988. The impact of company profile on the predictive ability of disaggregateddata. Journal of Business, Finance & Accounting 15 (2): 135-54.
———. 1983. Information content in segment reports. Working Paper presented at theEuropean Accounting Association Annual Conference, University of Glasgow.
Gellein, O. S. 1986. Financial reporting: The state of standard setting. Advances inAccounting 3: 3-23.
Gibbs, G. 1973. Accounting fundamentals: Guides to human judgement. Accounting andBusiness Research (11): 205-12.
Gigler, F., and T. Hemmer. 2002. Informational costs and benefits of creating separatelyidentifiable operating segments. Journal of Accounting and Economics 33 (1): 69-90.
Givoly, D., C. Hayn, and J. D'Souza. 1999. Measurement errors and information contentof segment reporting. Review of Accounting Studies 4: 14-43.
———, and J. Lakonishok. 1984. Properties of analysts' forecasts of earnings: A reviewand analysis of the research. Journal of Accounting Literature 3: 117-52.
Glaser, Barney G. 1965. "Constant comparative method of qualitative analysis." SocialProblems no. 12 (4):436-445.

196
———. 1978. Advances in the Methodology of Grounded Theory. Theoretical Sensitivity. Mill Valley, California: The Sociology Press.
———. 1992. Basics of Grounded Theory Analysis. Mill Valley, CA: Sociology Press.
———. 1998. Doing Grounded Theory: Issues and Discussions . Mill Valley, CA:Sociology Press.
———. 2003. "Choosing a methodology." In The Grounded Theory Perspective II.Description's Remodeling of Grounded Theory Methodology , 81-98. Mill Valley, CA:Sociology Press.
———. 2003. The Grounded Theory Perspective II. Description's Remodeling ofGrounded Theory Methodology. Mill Valley, CA: Sociology Press.
———. 2005. The Grounded Theory Perspective III: Theoretical Coding . Mill Valley,CA: Sociology Press.
———. 2007. Doing Formal Grounded Theory: A Proposal. Mill Valley, CA: SociologyPress.
———, and Judith Holton. 2005. "Basic social processes." The Grounded TheoryReview no. 4 (3):1-27.
———, and Anselm L. Strauss. 1967. The Discovery of Grounded Theory. NewYork: Aldine Publishing Company.
Gniewosz G. 1990. The share investment decision process and information use:An exploratory case study. Accounting and Business Research 20 (79): 223-30.
Gray, S. J. 1981. Segmental or disaggregated financial statements. InDevelopments in Financial Reporting. T. A. Lee, 27-56. Deddington, Oxford:Philip Allan.

197
Gray, S. J., and L. H. Radebaugh. 1984. International segment disclosures by U.S.and U.K. multinational enterprises: A descriptive study. Journal of AccountingResearch 22: 351-60.
Grieves, R., and J. C. Singleton. 1987. Analytic methods of the All-AmericanResearch Team. Journal of Portfolio Management 35 (5): 4-8.
Grossman, S., T. Oxner, and R. Rivers. 1978. Financial disclosure for diversifiedcompanies. Atlanta Economic Review 28 (4): 27-31.
Gurd, Bruce. 2008. "Remaining consistent with method? An analysis of groundedtheory research in accounting." Qualitative Research in Accounting &Management no. 5 (2):122-138
Hamill, J. Todd, Richard F. Deckro, and Jack M. Kloeber, Jr. 2005. "Evaluatinginformation assurance strategies." Decision Support Systems 39: 463-484.
Harding, N., and J. McKinnon. 1997. User involvement in the standard-settingprocess: A research note on the congruence of accountant and user perceptions ofdecision usefulness. Accounting, Organizations, and Society 22 (1): 55-67.
Harris, M. S. 1998. The Association between competition and managers' businesssegment reporting decisions . Journal of Accounting Research 36 (1): 111-28.
Hawkins, D. F., and B. A. Hawkins. 1986. The Effectiveness of the Annual ReportAs a Communication Vehicle: A Digest of the Relevant Literature. Morristown:Financial Executives Research Foundation.
Hayes, R. M., and R. Lundholm. 1996. Segment reporting to the capital market inthe presence of a competitor. Journal of Accounting Research 34 (2): 261-79.
Herrmann, D., and W. B. Thomas. 2000. An analysis of segment disclosuresunder SFAS No. 131 and SFAS No. 14. Accounting Horizons 14 (3): 287-302.
———. 2000. A model of forecast precision using segment disclosures:Implications for SFAS No. 131. Journal of International Accounting, Auditing &Taxation 9 (1): 1-18.

198
———. 1997. Reporting disaggregated information: A critique based onConcepts Statement No. 2. Accounting Horizons 11 (3): 35-44.
Hines, R. D. 1991. The FASB's conceptual framework, financial accounting andthe maintenance of the social world. Accounting, Organizations, and Society 16(4): 313-31.
Holder, W., and K. H. Eudy. 1982. A framework for building an accountingconstitution. Journal of Accounting, Auditing, & Finance 5 (2): 110-125.
Holthausen, R. T., and R. L. Watts. 2001. The relevance of the value-relevanceliterature for financial accounting standard setting. Journal of Accounting andEconomics 31: 3-75.
Honea, J. H. 1982. An empirical study of usefulness and communicative ability ofsegment disclosures among sophisticated users of corporate financial statements.Ph. D. diss., Louisiana State University and Agricultural and Mechanical College.
Hopwood, W. S., P. Newbold, and P. A. Silhan. 1982. The potential for gains inpredictive ability through disaggregation: Segmented annual earnings. Journal ofAccounting Research 20 (2): 724-32.
Horngreen, C. T. 1955. Implications for accountants of the uses of financialstatements by security analysts. Ph. D. diss., Unpublished dissertation, Universityof Chicago; Reprinted by Arno Press.
———. 1955. Security analysts and the price-level. The Accounting Review 30(4): 575-81.
———. 1981. Uses and limitations of a conceptual framework. Journal ofAccountancy 151 (4): 86-95.
Horwitz, B., and R. Kolodny. 1977. Line of business reporting and securityprices: An analysis of an SEC disclosure rule. Bell Journal of Economics 8 (1):234-49.

199
———. 1980. Segment reporting: Hindsight after ten years. Journal ofAccounting, Auditing & Finance 4 (1): 20-35.
———. 1989. Discussion of "Attributes of industry, industry segment and firm-specific information in security valuation". Contemporary Accounting Research 5(2): 615-19.
———, and R. Kolodny. 1982. Financial Reporting Rules and CorporateDecisions: A Study of Public Policy. Greenwich: JAI Press, Inc.
Hussain, S., and L. C. L. Skerratt. 1992. Gains from disaggregation and thedefinition of a segment: A note on SSAP 25. Accounting and Business Research22 (88): 370-376.
———. 1997. The impact of segment definition on the accuracy of analysts'earnings forecasts. Accounting and Business Research 27 (2): 145-56.
Hyland, D. C., and D. Diltz. 2002. Why firms diversify: An empiricalexamination. Financial Management 31 (1): 51-81.
Ijiri, Y. 1995. Segment statements and informativeness measures: Managingcapital vs. managing resources. Accounting Horizons 9 (3): 55-67.
———. 1966. Reliability and objectivity of accounting measurements. TheAccounting Review 41 (3): 474-83.
Imhoff, E. A. Jr. 1992. The relation between perceived accounting quality andeconomic characteristics of the firm. Journal of Accounting and Public Policy 11(2): 97-118.
———, and J. K. Thomas. 1994. Accounting Quality. In Asset Valuation. EditorS. A. Butler, 25-58. Norman: The University of Oklahoma, Center for Economicand Management Research.
International Accounting Standards Committee. 1997. International AccountingStandard IAS 14 (Revised), Segment Reporting. London: IASC.

200
———. 1981. International Accounting Standard No. 14, Reporting FinancialInformation by Segment. London: IASC.
Isabella, Lynn A. 1990. Evolving interpretations as a change unfolds: howmanagers construe key organizational events. The Academy of ManagementJournal no. 33 (1):7-41.
Jackson, W. 1998. New segment reporting deemed too revealing. CFO Alert 5(18): 1.
Jacob J., T. Lys, and M. Neale. University of Colorado. Experience, expertise andthe forecast performance of security analysts.
Joannides, Vassili, and Nicolas Berland. 2008. Reactions to reading 'remainingconsistent with method? An analysis of grounded theory research in accounting'.Qualitative Research in Accounting & Management no. 5 (3):253-261.
Johnson, R. Burke, Anthony J. Onwuegbuzie, and Lisa A. Turner. 2007. Towarda Definition of Mixed Methods Research. Journal of Mixed Methods Researchno. 1 (2):112-133.
Jonas, Gregory J., and Jeannot Blanchet. 2000. Assessing Quality of FinancialReporting. Accounting Horizons no. 14 (3):353-363.
———, and S. J. Young. 1998. Bridging the gap: Who can bring a user focus tobusiness reporting? Accounting Horizons 12 (2): 154-59.
Joyce, E. J., R. Libby, and S. Sunder. 1982. Using the FASB's qualitativecharacteristics in accounting policy choices. Journal of Accounting Research 20(2): 654-75.
Kahle, K., and R. Walkling. 1996. The impact of industry classifications onfinancial research. Journal of Financial & Quantitative Analysis 31: 309.
Kahn, R. N. 1999. Modeling analyst behavior. Journal of Investing 8 (2): 7-15.

201
Kaplan, S., and R. Ruback. 1995. The valuation of cash flow forecasts: Anempirical analysis. Journal of Finance 50 (4):1059-93.
Keeney, Ralph L. 1982. Decision Analysis: An Overview. Operations Researchno. 30 (5):803-838.
———. 1992. Value-Focused Thinking: A Path to Creative Decisionmaking .Cambridge, MA: Harvard University Press.
———. 1996. Value-Focused Thinking: A Path to Creative Decisionmaking .Cambridge, MA: Harvard University Press.
———. 1999. The Value of Internet Commerce to the Customer. ManagementScience no. 45 (4):533-542.
———. 2007. Modeling Values for Anti-Terrorism Analysis. Risk Analysis no.27 (3):585-596.
Kinney, W. R. Jr. 1971. Predicting earnings: Entity versus subentity data. Journalof Accounting Research 9 (1): 127-36.
Kirk, D. 1991. Completeness and representational faithfulness of financialstatements. Accounting Horizons 5: 134-41.
———. 1981. Concepts, Consensus, and Compromise: Their roles in standard-setting. Journal of Accountancy 150 (4): 83-86.
———. 1988. "Looking back on fourteen years at the FASB: The education of astandard setter". Accounting Horizons 2: 8-17.
———. 1989. Reflections on a "Reconceptualization of Accounting "Reflectionson ": A commentary on Parts I-IV of Homer Kripke's Paper, "Reflections on theFASB's conceptual framework for accounting and on auditing". Journal ofAccounting, Auditing, & Finance 4 (1): 83-105.

202
Knutson, P. H. 1993. Financial Reporting in the 1990s and Beyond.Charlottesville, VA: AIMR.
Knutson, Peter H., and Gabrielle U. Napolitano. 1998. Criteria Employed by theAIMR Financial Accounting Policy Committee in Evaluating FinancialAccounting Standards. Accounting Horizons 12 (2):170-176.
Kochanek, R. F. 1974. Segmental financial disclosure by diversified firms andsecurity prices: A reply. The Accounting Review 49 (2): 245-58.
Koeppen, D. R. 1988. Using the FASB's conceptual framework: Fitting the piecestogether. Accounting Horizons 2 (2): 18-26.
Koonce, L. 1997. Discussion of implications of proposed segment reportingstandards for financial analysts' investment judgements. Journal of AccountingResearch 35 (Supplement): 25-33.
Kothari, S. P. 2001. Capital markets research in accounting. Journal ofAccounting and Economics 31.
Kripke, H. 1989. Reflections on the FASB's conceptual framework for accountingand on auditing. Journal of Accounting, Auditing, & Finance 4 (1): 3-65.
Kwok, W. C. C., and D. J. Sharp. 1998. A review of construct measurementissues in behavioral accounting research. Journal of Accounting Literature 17:137-74.
Lang, M., and R. Lundholm. 1993. Cross-sectional determinants of analysts'ratings of corporate disclosures. Journal of Accounting Research 31 (2): 246-71.
———. 1996. Corporate disclosure policy and analyst behavior. The AccountingReview 71 (4): 467-92.
Lee, T. A. 1971. Utility and relevance - the search for reliable financialaccounting information. Accounting and Business Research (3): 242-49.

203
Lev, B. 1977. Accounting and Information Theory. Sarasota, FL: AmericanAccounting Association.
Levitt, A. 1998. The importance of high quality accounting standards. AccountingHorizons 12 (1): 79-82.
Libby, R., R. Bloomfield, and M. Nelson. 2002. Experimental research infinancial accounting..Accounting Organizations and Society (December 2002):775-810.
Lobo, G. J., S. S. Kwon, and G. A. Ndubizu. 1998. The impact of SFAS No. 14segment information on price variability and earnings forecast accuracy. Journalof Business Finance & Accounting 25 (7 & 8): 969-85.
Luttman, S. M., and P. A. Silhan. 1993. An empirical analysis of the Value LineEarnings Predictability Index. Journal of Applied Business Research 9 (4): 104-9.
———. 1995. Identifying factors consistently related to Value Line earningspredictability. The Financial Review 30 (3): 445-68.
Macve, R. 1981. A Conceptual Framework for Financial Accounting andReporting: The Possibilities for an Agreed Structure. England: Institute ofChartered Accountants in England and Wales.
Maines, L. A., L. S. Mc Daniel, and M. S. Harris. 1997. Implications of proposedsegment reporting standards for financial analysts' investment judgements.Journal of Accounting Research 35 (Supplement): 1-24.
Majchrak , A., Beath, C., Lim, R., & Chin, W. W. (2005). Managing ClientDialogues During Information Systems Design to Facilitate Client Learning. MISQuarterly, 29(4), 653-672.
Marston, C., and P. Shrives. 1991. The use of disclosure indices in accountingresearch: A review article. British Accounting Review 23: 195-210.
Mautz, R. K. 1968. Financial Reporting by Diversified Companies. New York:Financial Executives Research Foundation.

204
McCaslin, T. E., and K. G. Stanga. 1983. Related qualities of useful accountinginformation. Accounting and Business Research (Winter)1: 35-41.
McConnell, P., and P. Pacter. 1995. IASC and FASB proposals would enhancesegment reporting. The CPA Journal (August): 32-36.
McDonald, D. L. 1967. Feasibility criteria for accounting measures. TheAccounting Review 42 (4): 662-79.
McGowan, A. S., and V. P. Vendrzyk. 2002. The relation between cost shiftingand segment profitability in the defense-contracting industry. The AccountingReview 77 (4): 949-69.
Merrick, Jason R. W., Martha Grabowski, and Premnath Ayyalasomayajula.2005. Understanding Organization Safety Using Value-Focused Thinking. RiskAnalysis 25 (4):1029-1041.
Michel, A., and I. Shaked. 1986. Multinational corporations vs. domesticcorporations: Financial performance and characteristics. Journal of InternationalBusiness Studies 17 (3): 89-100.
Mikhail, M. B., B. R. Walther, and R. H. Willis. 1997. Do security analystsimprove their performance with experience? Journal of Accounting Research35:131-57.
———. 1999. Does forecast accuracy matter to security analysts? TheAccounting Review 74 (2): 185-200.
Miller, P. B. W. 1990. The Conceptual Framework as reformation andcounterreformation. Accounting Horizons 4: 23-32.
———. 1985. The Conceptual Framework: Myths and realities. Journal ofAccountancy (March): 62-71.
———, R. J. Redding, and P. R. Bahnson. 1998. The FASB the People, theProcess, and the Politics. Boston: McGraw Hill.

205
Mohr, R. M. 1983. The segment reporting issue: A review of empirical research.Journal of Accounting Literature 2: 39-71.
———, and P. Pacter. 1993. Review of Related Research. In ReportingDisaggregated Information. P. Pacter, 131-202. Norwalk: FASB.
Molodovsky, N. 1953. A theory of price-earnings ratios. Financial AnalystsJournal 9 (5): 65-80.
Morgan, David L. 1998. "Practical Strategies for Combining Qualitative andQuantitative Methods: Applications to Health Research." Qualitative HealthResearch no. 8 (3):362-376.
Morse, Janice M. 1995. "The significance of saturation." Qualitative HealthResearch no. 5 (2):147-149.
Morris, R. D. 1987. Signalling, agency theory and accounting policy choice.Accounting and Business Research 18 (69): 47-56.
Morton, J. R. 1974. Qualitative objectives of accounting: A comment onrelevance and understandability. Journal of Accounting Research 12 (2): 288-98.
———, and P. B. Shane. 1993. Firm-size and the predictive ability of financialstatement analysis. In Earnings Quality. Editor S. A. Butler, 87-110. Norman:The University of Oklahoma, Center for Economic and Management Research.
Mozes, H. A. 1992. A framework for normative accounting research. Journal ofAccounting Literature 11: 93-120.
———, and P. Williams. 2000. Brokerage firm analysts: How good are theforecasts? Journal of Investing 9 (3): 5-13.
Mozier, P., and J. Arnold. 1984. A comparison of the techniques used by portfolioand non-portfolio managers. Accounting and Business Research 14: 195-207.

206
Nagarajan, N., and S. Sridhar. 1996. Corporate responses to segment disclosurerequirements. Journal of Accounting and Economics: 253-75.
National Association of Accountants. 1972. Segment Reporting for Managers andInvestors. New York: National Association of Accountants.
Nichols, N. B., and Street Donna L. 1999. Segment Information: What earlyadopters reported. Journal of Accountancy 187 (1): 37-41.
O'glove, T. L., and R. Sobel. 1987. Quality of Earnings: The Investor's Guide toHow Much Money a Company Is Really Making. New York: The Free Press.
Ohlson, J. A., and S. H. Penman. 1992. Disaggregated accounting data asexplanatory variables for returns. Journal of Accounting, Auditing & FinanceNew Series 7 (4): 553-73.
Onwuegbuzie, Anthony J., Rebecca M. Bustamante, and Judith A. Nelson. 2010.Mixed Research as a Tool for Developing Quantitative Instruments. Journal ofMixed Methods Research no. 4 (1):56-78.
Organisation for Economic Co-operation and Development. 1990. SegmentedFinancial Information. Paris: OECD.
Pacter, P. 1993. Reporting Disaggregated Information. Norwalk: FASB.
———. 1993. FASB Reexamines Disaggregated Disclosures: Definition theIssues and Alternative Directions. Journal of Corporate Accounting & Financeno. 4 (3):283-293.
———. 1994. Reporting Financial Information by Segment: A Back GroundIssues Paper Prepared for the Committee on Segment Reporting of theInternational Accounting Standards Committee. London: InternationalAccounting Standards Committee.
———. 1983. The Conceptual Framework: Make no mystique about it. Journalof Accountancy: 76-88.

207
Parnell, Gregory S., Dr., Harry W. Conley, Maj., Jack A. Jackson, Col., Lee J.Lehmkuhl, Lt. Col., and John M. Andrew, Col. 1998. "Foundations 2025: AValue Model of Evaluating Future Air and Space Forces." Management Scienceno. 44 (10):1336-1350.
———. 1974. The objectives of published accounting reports: A comment.Accounting and Business Research (17):6.
Penman, S. H. 2001. Financial Statement Analysis and Security Valuation. NewYork: McGraw-Hill.
———, and Xiao-Jun Zhang. 2002. Accounting conservatism, the quality ofearnings, and stock returns. The Accounting Review 77 (2): 237-65.
Philbrick, D. R. R. W. E. 1991. Using Value Line and IBES analyst forecasts inaccounting research. Journal of Accounting Research 29 (2): 397-417.
———, and W. E. Ricks. 1994. Using Value Line and IBES analyst forecasts inaccounting research. In The Handbook of Company Performance and StockMarket Valuation: Corporate Earnings Analysis. B. R. Bruce, and C. B. Epstein,137-52. Chicago: Probus Publishing Company.
Phillips, L. J., and R. L. Brezovec. 1998. The FASB's new segment disclosurerules: What they mean for banks. Bank Accounting & Finance 11 (4): 41-48.
Piotroski, J. D. 1999. The impact of discretionary segment reporting behavior oninvestor beliefs and stock prices. Ph. D. diss., University of Michigan.
Pope, P. F., and M. Walker. 1999. International differences in the timeliness,conservatism, and classification of earnings. Journal of Accounting Research 37(Studies on Credible Financial Reporting): 53-87.
Previts, G. J., R. J. Bricker, T. R. Robinson, and S. J. Young. 1994. A contentanalysis of sell-side financial analyst company reports. Accounting Horizons 8(2): 55-70.

208
Radebaugh, L. H. 1987. International Aspects of Segment Disclosures: Aconceptual approach. Glasgow: University of Glasgow.
Rappaport, A., and E. M. Lerner. 1969. A Framework for Financial Reporting byDiversified Companies. New York: National Association of Accountants.
———. 1972. Segment Reporting for Managers and Investors. New York:National Association of Accountants.
Ravenscraft, D. J. 1983. Structure-profit relationships at the line of business andindustry level. The Review of Economics and Statistics 65: 22-31.
———, and C. L. I. Wagner. 1991. The role of the FTC's line of business data intesting and expanding the theory of the firm. Journal of Law and Economics 34:703-39.
Rayburn, J. 1994. Discussant's comments on: "Accounting Quality". In AssetValuation. Editor S. A. Butler, 59-62. Norman: The University of Oklahoma,Center for Economic and Management Research.
Reason, T. 2001. Picking Apart the Pieces. CFO, The Magazine for SeniorFinancial Executives 17 (10): 75-???
Reither, C. L. 1997. How the FASB approaches a standard-setting issue.Accounting Horizons 11 (4): 91-104.
Rennie, E. D., and C. R. Emmanuel. 1992. Segmental disclosure practice:Thirteen years on. Accounting and Business Research 22 (86): 151-59.
Riahi-Belkaoui, A. 2001. Level of multinationality, growth opportunities, and sizeas determinants of analyst ratings of... American Business Review 19 (2): 115-20.
Robert Morris Associates Accounting Policy Committee. 1990. Summary ofImportant Positions Relating to Accounting Principles and Auditing Standards.Philadelphia: RMA.

209
Roberts, E. S. 1999. In defense of the survey method: An illustration from a studyof user information satisfaction. Accounting and Finance 39: 53-77.
Rogers, K. R., and J. Grant. 1997. Content analysis of information cited in reportsof sell-side financial analysts. The Journal of Financial Statement Analysis 3 (1):17-30.
Rogers, V., and A. Smith. 1998. SFAS No. 131: Disclosures about segments of anenterprise and related information. Ohio CPA Journal 57 (1): 43-45.
Ronen, J., and J. Livnat. 1981. Incentives for segment reporting. Journal ofAccounting Research 19 (2): 459-81.
———, and G. Sorter. 1989. Reflections on "Reflections on the FASB'sconceptual framework for accounting and on auditing". Journal of Accounting,Auditing, & Finance 4 (1): 67-77.
Rumelt, R. 1991. How much does industry matter? Strategic ManagementJournal: 167-85.
Salamon, G. L., and D. S. Dhaliwal. 1980. Company size and financial disclosurerequirements with evidence from the segmental reporting issue. Journal ofBusiness, Finance & Accounting 7 (4): 555-68.
Salter, S. B., E. P. Swanson, A.-K. Achleitner, E. de Lembre, and B. S. Khanna.1996. Reporting financial information by segment: A comment of the AmericanAccounting Association on the IASC draft statement of principles. AccountingHorizons 10 (1): 118-23.
Sanders, J. C. C., S. C. Alexander, and S. C. Clark. 1999. New segment reporting:Is it working? Strategic Finance: 35-38.
Scannell, Kara. 2008. "Crisis on Wall Street: SEC Gives CFOs a Chance ToDefend Asset Values." The Wall Street Journal , October 9, 1.
Schapiro, Mary L., SEC Chairman. 2011. Speech by SEC Chairman: RemarksBefore the Financial Accounting Foundation's 2011 Annual Board of Trustees

210
Dinner [Speech]. U.S. Securities and Exchange Commission, May 24, 2011 2011[cited June 3 2011]. Available fromwww.sec.gov/news/speech/2011/spch052411mls.htm.
Schaefer, T. F. 1993. Discussant's Comments on: "Firm size and the predictiveability of financial statement analysis" . In Earnings Quality. Editor S. A. Butler,111-14. Norman: The University of Oklahoma, Center for Economic andManagement Research.
Schipper, K. 1991. Analysts' forecasts. Accounting Horizons 5 (4): 105-22.
Scott, W. R. 1997. Financial Accounting Theory. Upper Saddle River, NJ:Prentice-Hall Inc.
Seidman, Leslie F. 2011. The Role of the Accounting Profession in PreventingAnother Financial Crisis. In Testimony of Leslie F. Seidman, Chairman FinancialAccounting Standards Board before the U.S. Senate Banking, Housing, andUrban Affairs Subcommittee On Securities, Insurance, and Investment .Washington, D.C.: FASB (Financial Accounting Standards Board)
Shwayder, K. 1968. Relevance. Journal of Accounting Research 6 (1): 86-97.
Siegel, J. G. 1982. The "Quality of earnings" concept-A survey. FinancialAnalysts' Journal 38 (2): 60-68.
———, and J. K. Shim. 1981. Quality of earnings: a key factor in financialplanning. Long Range Planning 14 (6): 68-75.
Silhan, P. A. 1984. Company size and the issue of quarterly segment reporting.Journal of Accounting and Public Policy 3 (1): 185-97.
———. 1983. The effects of segmenting quarterly sales and margins onextrapolative forecasts of conglomerate earnings: Extension and replication.Journal of Accounting Research 21 (1): 341-47.
———. 1982. Simulated mergers of existent autonomous firms: A new approachto segmentation research. Journal of Accounting Research 20 (1): 255-62.

211
Simmons, J. K. 1967. A concept of comparability in financial reporting. TheAccounting Review: 680-692.
Simonds, R. R., and D. W. Collins. 1978. Line of Business Reporting andSecurity Prices: An Analysis of an SEC Disclosure Rule: Comment. The BellJournal of Economics 9 (2): 646-58.
Snavely, H. 1967. Accounting information criteria. The Accounting Review 42(2): 223-32.
Soffer, L. C., and R. J. Soffer. 2002. Financial Statement Analysis: A ValuationApproach. Prentice Hall.
Solomons, D. 1986. The FASB's Conceptual Framework: An evaluation. Journalof Accountancy: 114-24.
———. 1986. Making Accounting Policy. New York: Oxford University Press.
Sorter, G. H., and M. S. Gans. 1974. Opportunities and implications of the reporton objectives of financial statements. Journal of Accounting Research 12 (Studieson Financial Accounting Objectives: 1974): 1-12.
Springsteel, I. 1998. Sliced, diced and still obscure. CFO 14 (2): 85-87.
Sprouse, R. T. 1969. Diversified views about diversified companies. Journal ofAccounting Research 7 (1): 137-59.
———. 1978. The importance of earnings in the conceptual framework. Journalof Accountancy: 64-71.
SRI International. 1987. Investor Information Needs and the Annual Report.Morristown: Financial Executives Research Foundation.
Stanga, K. G. 1976. Disclosure in published annual reports. FinancialManagement 5 (4): 42-51.

212
———. 1980. The relationship between relevance and reliability: Some empiricalresults. Accounting and Business Research ??? (Winter): ???
Staubus, George J. 1977. Making Accounting Decisions . Houston, TX: ScholarsBook Company.
———. 1987. Accounting measurement: Practices in practice. Today's CPA 13(3): 18-20.
———. 1987. Accounting measurements in practice. Today's CPA 13 (3): 24-27.
———. 1972. An analysis of APB Statement No. 4. Journal of Accountancy 133(2): 36-43.
———. 2000. The Decision-Usefulness Theory of Accounting. New York:Garland Publishing, Inc.
———. 1970. Determinants of the value of accounting procedures. Abacus 6 (2):105-9.
———. 1985. An induced theory of accounting measurement. The AccountingReview 60 (1): 53-75.
———. 1995. Issues in the accounting standard-setting process. AccountingTheory: A Contemporary Review. eds. S. e. al. Jones, 191-215. Harcourt Brace.
———. 1977. Making Accounting Decisions. Houston, Texas: Scholars BookCompany.
Steedle, L. F. C. Ph. D. 1983. Disclosure of Segment Information—SFAS # 14.The CPA Journal 53 (10): 34-47.
Sterling, R. R. 1982. The conceptual framework: An assessment. Journal ofAccountancy (November): 103-108.

213
———. 1972. Decision oriented financial accounting. Accounting and BusinessResearch (7): 198-208.
———. 1970. On theory construction and verification. The Accounting Review45 (3): 444-57.
———. 1967. A statement of basic accounting theory: A review article. Journalof Accounting Research 5 (1): 95-112.
———. 1979. Towards a Science of Accounting. Houston, TX: Scholars Book.
Stern, Phyllis Noerager. 1980. Grounded theory methodology: Its uses andprocesses. Image no. 12 (1):20-23.
———, and Caroline Jane Porr. 2011. Essentials of Accessible GroundedTheory. Edited by Janice M Morse, Qualitative Essentials . Walnut Creek,California: Left Coast Press.
Storey, R. K., and S. Storey. 1998. The Framework of Financial AccountingConcepts and Standards. Norwalk, Conn.: Financial Accounting StandardsBoard.
Street Donna L., N. B. Nichols, and S. J. Gray. 2000. Segment disclosures underSFAS 131: Has business segment reporting improved? Accounting Horizons 14(3): 259-85.
Suddaby, Roy. 2006. "From the editors: what grounded theory is not." Academyof Management Journal no. 49 (4):633-642.
Sutton, Robert I. 1987. "The process of organizational death: disbanding andreconnecting." Administrative Science Quarterly no. 32 (4):542-569.
Swaminathan, S. 1991. The impact of SEC mandated segment data on pricevariability and divergence of beliefs. The Accounting Review 66 (1): 23-41.

214
Tezel, A. 1988. The Value Line stock rankings and the option model impliedstandard deviations. Journal of Financial Research 11 (3): 215-25.
Thaler, R. 1999. The end of behavioral finance. Financial Analysts Journal56(6):12-17.
Tse, S. 1989. Attributes of industry, industry segment, and firm-specificinformation in security valuation. Contemporary Accounting Research 5 (2): 592-614.
Tyson, T. N., and F. A. Jacobs. 1987. Segment reporting in the banking industry:Does it meet the criteria of the conceptual framework? Accounting Horizons: 35-41.
Wallace Wanda. 1994. FASB shouldn't cave in on segment reporting. AccountingToday: 14: 21.
Werts, C. E., Linn, R. L., & Jöreskog, K. G. (1974). Intraclass reliabilityestimates: Testing structural assumptions, Educational and PsychologicalMeasurement, 34: 25-33.
Wild, J. J., L. A. Bernstein, and K. R. Subramanyam. 2001. Financial StatementAnalysis. Boston: McGraw-Hill Irwin.
Wold, H. (1985). Partial least squares. In S. Kotz & N. L. Johnson (Eds..),Encyclopedia of statistical sciences (Vol. 6), New York: Wiley, 581-591.
Wulff, J. K., and S. Koski-Grafer. 1998. Characteristics of high qualityaccounting standards: Perspective of the corporate preparer. Accounting Horizons12 (2): 188-91.
Yallapragada, R. R., S. Roa, and D. R. Andrews. 1994. Predictive ability of ValueLine financial analysts' forecasts. American Business Review 12 (1): 37-44.
Yeh, S. 1990. Line of business reporting, the marginal information content ofearnings announcements, and the accuracy of analysts earnings forecasts. Ph. D.diss., University of California.

215
Young, S. M. 1996. Survey research in management accounting: A criticalassessment. In Research Methods in Accounting: Issues and Debates. A.Richardson. CGA Canada Research Foundation.
Zeff, S. A. 1999. The evolution of the conceptual framework for businessenterprises in the United States. 89-131.

Appendix 3.0
Additional Structural Equation Models
216

217
Figure 1. Decision Usefulness and Materiality Structural Model.

218
Figure 2. Alternative Decision Usefulness and Materiality Structural Model.

219
Figure 3. Decision Usefulness Without Materiality Structural Model.

220
Figure 4. Alternative Materiality Structural Model.

221
Figure 5. Alternative Relevance Structural Model.

222
Figure 6. Reliability Structural Model.

223
Figure 7. Comparing Structural Model.

224
Figure 8. Ease of Complete Intelligibility Structural Model.

225
Figure 9. Post-1998 Reported Products and Services Decision Usefulness and
Materiality Structural Model.

Appendix 3.1
Target Population Specification Related Tables
224

225
Table 1 Work Experiences and Occupational Titles with Corresponding Target Population Categories
Work Experiences Occupational Titles
# Categories Descriptions # Names Decision Types
Likely to
Regularly Make
Fundamental
Analysis
Decisions,
Using U.S.
Domiciled SEC
Registrant
Filings?
Target Population
Include? Categories
- --- --- 0
Occupational
Title Not Disclosed --- Indeterminable No ---
15
Professor/
Instructor
Teaches investments,
finance, and or economics
as a full-time college or
university professor or as
an instructor. 1 Academic Instructional No No ---
- --- --- 2
Accountant
/Auditor
Security
Investment Yes Yes
Analysts
or
Portfolio
Managers
Related
- --- --- 3 Actuary Indeterminable No No ---
2
Valuator
of Closely
Held
Businesses
Values firms whose stock
is thinly traded (or
privately held). Analyses
financial statements,
accounting methods,
capital budget projects,
acquisitions, and asset 4
Analyst:
Closely
Held
Companies
Security
Investment No No ---

226
Table 1 Work Experiences and Occupational Titles with Corresponding Target Population Categories
Work Experiences Occupational Titles
# Categories Descriptions # Names Decision Types
Likely to
Regularly Make
Fundamental
Analysis
Decisions,
Using U.S.
Domiciled SEC
Registrant
Filings?
Target Population
Include? Categories
sales.
3
Security
Investment
Analyst
Analyses, values, and
recommends securities in
one or more asset classes
(equity, fixed income,
alternative investments,
or derivatives). 5
Analyst:
Credit
Security
Investment No No ---
3
Security
Investment
Analyst Same as above 6
Analyst:
Emerging
Markets
Security
Investment No No ---
3
Security
Investment
Analyst Same as above 7
Analyst:
Equity
Security
Investment Yes Yes Analysts
3
Security
Investment
Analyst Same as above 8
Analyst:
Fixed
Income
Security
Investment No No ---
3
Security
Investment
Analyst Same as above 9
Analyst:
Mergers
and
Security
Investment Yes Yes Analysts

227
Table 1 Work Experiences and Occupational Titles with Corresponding Target Population Categories
Work Experiences Occupational Titles
# Categories Descriptions # Names Decision Types
Likely to
Regularly Make
Fundamental
Analysis
Decisions,
Using U.S.
Domiciled SEC
Registrant
Filings?
Target Population
Include? Categories
Acquisition
3
Security
Investment
Analyst Same as above 10
Analyst:
Options and
Futures
Security
Investment No No ---
4
Quantitative
Investment
or Risk
Analyst
Conducts either
quantitative research, or
performance attribution
analyses, or both to assist
portfolio managers and
traders with investment
decisions and risk
assessments. Supplies
portfolio managers with
portfolio management
analytic tools. 11
Analyst:
Quantitative
Research
Security
Investment No No ---
3
Security
Investment
Analyst Same as above 12
Analyst:
Real
Estate
Real Estate and Security
Investment Yes Yes Analysts
5
Venture
Capital
Conducts market
research and analyses to 13
Analyst:
Venture
Security
Investment No No ---

228
Table 1 Work Experiences and Occupational Titles with Corresponding Target Population Categories
Work Experiences Occupational Titles
# Categories Descriptions # Names Decision Types
Likely to
Regularly Make
Fundamental
Analysis
Decisions,
Using U.S.
Domiciled SEC
Registrant
Filings?
Target Population
Include? Categories
Analyst
solicit and/or collect
investment funds for, any,
of these purposes: equity
or debt financing,
mergers, capital leasing,
acquisitions, and
divestitures. Capital
- --- --- 14 Attorney Indeterminable No No ---
- --- --- 15
Bank:
Examiner/
Regulator Regulatory No No ---
- --- --- 16
Bank:
Trust
Administrator Indeterminable No No ---
-- --- --- 17
Bank:
Trust
Investments Indeterminable No No ---
- --- --- 18
CEO/Chair/
Partner/
Managerial &
Security Yes Yes
Analysts
or

229
Table 1 Work Experiences and Occupational Titles with Corresponding Target Population Categories
Work Experiences Occupational Titles
# Categories Descriptions # Names Decision Types
Likely to
Regularly Make
Fundamental
Analysis
Decisions,
Using U.S.
Domiciled SEC
Registrant
Filings?
Target Population
Include? Categories
Principal Investment
Portfolio
Managers
Related
- --- --- 19
Chief
Investment
Officer
Managerial &
Security
Investment Yes Yes
Analysts
or
Portfolio
Managers
Related
6
Compliance
Analyst/
Officer
Ensures investment firm
adherence to applicable
laws, regulations, and
professional practice
standards. 20
Compliance
Officer Compliance No No ---
7
Investment
Consultant
Provides investment
consulting services,
inclusive of developing
investment policy
statements, formulating
and delivering investment
reviews, conducting asset
allocation studies, 21
Consultant:
Management Consultant No No ---

230
Table 1 Work Experiences and Occupational Titles with Corresponding Target Population Categories
Work Experiences Occupational Titles
# Categories Descriptions # Names Decision Types
Likely to
Regularly Make
Fundamental
Analysis
Decisions,
Using U.S.
Domiciled SEC
Registrant
Filings?
Target Population
Include? Categories
managing client
relationships, and
monitoring investment
performance.
7
Investment
Consultant Same as above 22
Consultant:
Pension Consultant No No ---
8
Corporate
Chief
Financial
Officer
Determines capital
structure and funding
needs, inclusive of equity,
debt, and alternative
investments. Evaluates
financial fundamentals.
Makes capital investment
decisions. 23
Corporate
Financial
Officer
Managerial &
Capital
Investment No No ---
-- --- --- 24
Corporate
Pension
Officer Indeterminable No No ---
3
Security
Investment
Analyst
Analyses, values, and
recommends securities in
one or more asset classes 25
Derivatives
Specialist
Security
Investment No No ---

231
Table 1 Work Experiences and Occupational Titles with Corresponding Target Population Categories
Work Experiences Occupational Titles
# Categories Descriptions # Names Decision Types
Likely to
Regularly Make
Fundamental
Analysis
Decisions,
Using U.S.
Domiciled SEC
Registrant
Filings?
Target Population
Include? Categories
(equity, fixed income,
alternative investments,
or derivatives).
- --- --- 26
Director of
Research
Managerial &
Security
Investment Yes Yes
Analysts
or
Portfolio
Managers
Related
9 Economist
Develops economic
outlooks to be used to
formulate investment
strategies and portfolio
structuring. 27 Economist
Economic
Forecast No No ---
- --- --- 28
Financial
Journalist Indeterminable No No ---
- --- --- 29
Financial
Planner Indeterminable No No ---
- --- --- 30 Government Indeterminable No No ---

232
Table 1 Work Experiences and Occupational Titles with Corresponding Target Population Categories
Work Experiences Occupational Titles
# Categories Descriptions # Names Decision Types
Likely to
Regularly Make
Fundamental
Analysis
Decisions,
Using U.S.
Domiciled SEC
Registrant
Filings?
Target Population
Include? Categories
- --- --- 31
Investment
Administrator Indeterminable No No ---
10
Investment
Banking
Analyst
Analyzes and values
securities for public
offering; targets and
values mergers and
acquisitions for corporate
clients. 32
Investment
Banker
Security
Investment Yes Yes Analysts
11
Private
Client
Investment
Advisor
Manages portfolios of
high net-worth clients.
Identifies investors’
objectives and develops
investment policies.
Manages client
relationships. 33
Investment
Counselor
Security
Investment Yes Yes
Portfolio
Managers
- --- --- 34
Investment
Firm
Manager
Managerial &
Security
Investment Yes Yes
Analysts
or
Portfolio
Managers
Related

233
Table 1 Work Experiences and Occupational Titles with Corresponding Target Population Categories
Work Experiences Occupational Titles
# Categories Descriptions # Names Decision Types
Likely to
Regularly Make
Fundamental
Analysis
Decisions,
Using U.S.
Domiciled SEC
Registrant
Filings?
Target Population
Include? Categories
- --- --- 35 Mutual Funds Indeterminable Indeterminable No ---
- --- --- 36 Other Indeterminable Indeterminable No ---
- --- --- 37
Performance
Measurement
Specialist Indeterminable No No ---
12
Portfolio
Manager
Manages client
investment portfolios.
Makes investment
decisions, inclusive of
security selection,
industry or sector
selection, and portfolio
construction. 38
Portfolio
Manager
Security
Investment Yes Yes
Portfolio
Managers
13
Investment
Strategist
Applies investment
knowledge to develop and
analyze investment
strategies. These
strategies are designed to
achieve investors’ goals. 39
Portfolio
Strategist
Security
Investment Yes Yes
Analysts
or
Portfolio
Managers
Related

234
Table 1 Work Experiences and Occupational Titles with Corresponding Target Population Categories
Work Experiences Occupational Titles
# Categories Descriptions # Names Decision Types
Likely to
Regularly Make
Fundamental
Analysis
Decisions,
Using U.S.
Domiciled SEC
Registrant
Filings?
Target Population
Include? Categories
- --- --- 40 Retired Indeterminable No No ---
14
Institutional
Sales
Professional/
Business
Development
(Buy and
Sell Side)
Cultivates new business
opportunities by
marketing investment
products to institutional
investors. Executes trades
and conveys research of
securities and strategies
to institutional investors. 41
Sales and
Marketing:
Institutional
Sales and
Marketing No No ---
14
Institutional
Sales
Professional/
Business
Development
(Buy and
Sell Side) Same as above 42
Sales and
Marketing:
Investment
Services
Sales and
Marketing No No ---
15
Client
Service
Representative
Responsible for all
activities related to
servicing investment firm
clients. These activities
include communicating 43
Sales and
Marketing:
Retail Client Service No No ---

235
Table 1 Work Experiences and Occupational Titles with Corresponding Target Population Categories
Work Experiences Occupational Titles
# Categories Descriptions # Names Decision Types
Likely to
Regularly Make
Fundamental
Analysis
Decisions,
Using U.S.
Domiciled SEC
Registrant
Filings?
Target Population
Include? Categories
or Relationship
Manager
investment performance
and strategy to clients,
and serving as the liaison
between clients and
portfolio managers.
- --- --- 44 Student Indeterminable No No ---
16
Securities
Trader
Execute buy and sell
investment security
transactions. Develop for
and disseminate to
securities dealers and
portfolio managers,
information about
markets and the trading
environment. 45
Trader/
Securities
and Other Trading No No ---
17
Investment
Firm
Regulator/
Supervisor
Oversees legal/regulatory
compliance matters.
Performs due diligence
and ensures firm
compliance with all
applicable federal - --- --- --- --- ---

236
Table 1 Work Experiences and Occupational Titles with Corresponding Target Population Categories
Work Experiences Occupational Titles
# Categories Descriptions # Names Decision Types
Likely to
Regularly Make
Fundamental
Analysis
Decisions,
Using U.S.
Domiciled SEC
Registrant
Filings?
Target Population
Include? Categories
securities laws, state
statutes, investment laws,
and regulatory agency
requirements. Reviews
and maintains investment
contracts, registration
statements, regulatory
filings and documents.
18
Real
Estate
Investment
Manager
Specializes in managing
real estate investment
securities. Develops
investment policies and
monitors performance. - --- --- --- --- ---

237
Table 2 Occupational Titles A and B Classifications: Target and Non-Target Population Fundamental Analysis Investment Decision-maker Classifications
(Each individual may have up to two occupational title classifications.)
Occupational Titles A and B Classifications # ofTargetTitles
Fundamental Analysis Investment Decision-maker Classifications
Title A Classifications Title B Classifications Detailed Aggregated
Analysts No Occupational Title B 1 Analysts Analysts
Analysts Analysts 2 Analysts Analysts
Portfolio Managers No Occupational Title B 1 Portfolio Managers Portfolio Managers
Portfolio Managers Portfolio Managers 2 Portfolio Managers Portfolio Managers
Analysts Portfolio Managers 2 Analysts & Portfolio Managers Analysts & Portfolio Managers
Portfolio Managers Analysts 2 Analysts & Portfolio Managers Analysts & Portfolio Managers
Analysts orPortfolio Managers Related No Occupational Title B 1
Analysts orPortfolio Managers Related
Analysts or Portfolio Managers Related
AnalystsAnalysts or Portfolio Managers Related 2
Analysts & Analysts orPortfolio Managers Related
Analysts orPortfolio Managers Related
Analysts orPortfolio Managers Related Analysts 2
Analysts & Analysts orPortfolio Managers Related
Analysts orPortfolio Managers Related
Analysts orPortfolio Managers Related Portfolio Managers 2
Portfolio Managers & Analysts orPortfolio Managers Related
Analysts orPortfolio Managers Related
Portfolio ManagersAnalysts orPortfolio Managers Related 2
Portfolio Managers &Analysts or Portfolio Managers Related
Analysts orPortfolio Managers Related
Analysts orPortfolio Managers Related
Analysts orPortfolio Managers Related 2
Analysts orPortfolio Managers Related
Analysts orPortfolio Managers Related
Non-Target Non-Target 0 Non-Target Non-Target
Non-TargetAny Occupational Title Bother than Non-Target 0 Non-Target Non-Target
Any Occupational Title A other than Non-Target Non-Target 0 Non-Target Non-Target

238
Table 3 Occupational Titles A and B: Fundamental Analysis Investment Decision-maker Classifications(Each individual may have disclosed up to two occupational titles.)
Occupational Titles
Target or Non-Target
Population Occupational Title?
Fundamental Analysis
Investment Decision-maker Type
Occupational Title A
Occupational Title A Not Disclosed Non-Target Non-Target
Academic Non-Target Non-Target
Accountant /Auditor Target Analysts or Portfolio Managers Related
Actuary Non-Target Non-Target
Analyst: Closely Held Companies Non-Target Non-Target
Analyst: Credit Non-Target Non-Target
Analyst: Emerging Markets Non-Target Non-Target
Analyst: Equity Target Analysts
Analyst: Fixed Income Non-Target Non-Target
Analyst: Mergers and Acquisition Target Analysts
Analyst: Options and Futures Non-Target Non-Target
Analyst: Quantitative Research Non-Target Non-Target
Analyst: Real Estate Target Analysts
Analyst: Venture Capital Non-Target Non-Target
Attorney Non-Target Non-Target
Bank: Examiner/Regulator Non-Target Non-Target
Bank: Trust Administrator Non-Target Non-Target
Bank: Trust Investments Non-Target Non-Target

239
Table 3 Occupational Titles A and B: Fundamental Analysis Investment Decision-maker Classifications(Each individual may have disclosed up to two occupational titles.)
Occupational Titles
Target or Non-Target
Population Occupational Title?
Fundamental Analysis
Investment Decision-maker Type
CEO/Chair/Partner/Principal Target Analysts or Portfolio Managers Related
Chief Investment Officer Target Analysts or Portfolio Managers Related
Compliance Officer Non-Target Non-Target
Consultant: Management Non-Target Non-Target
Consultant: Pension Non-Target Non-Target
Corporate Financial Officer Non-Target Non-Target
Corporate Pension Officer Non-Target Non-Target
Derivatives Specialist Non-Target Non-Target
Director of Research Target Analysts or Portfolio Managers Related
Economist Target Analysts or Portfolio Managers Related
Financial Journalist Non-Target Non-Target
Financial Planner Non-Target Non-Target
Government Non-Target Non-Target
Investment Administrator Non-Target Non-Target
Investment Banker Target Analysts
Investment Counselor Target Portfolio Managers
Investment Firm Manager Target Analysts or Portfolio Managers Related
Mutual Funds Non-Target Non-Target
Other Non-Target Non-Target

240
Table 3 Occupational Titles A and B: Fundamental Analysis Investment Decision-maker Classifications(Each individual may have disclosed up to two occupational titles.)
Occupational Titles
Target or Non-Target
Population Occupational Title?
Fundamental Analysis
Investment Decision-maker Type
Performance Measurement Specialist Non-Target Non-Target
Portfolio Manager Target Portfolio Managers
Portfolio Strategist Target Analysts or Portfolio Managers Related
Retired Non-Target Non-Target
Sales and Marketing: Institutional Non-Target Non-Target
Sales and Marketing: Investment Services Non-Target Non-Target
Sales and Marketing: Retail Non-Target Non-Target
Student Non-Target Non-Target
Trader/Securities and Other Non-Target Non-Target
Occupational Title B
Occupational Title B Not Disclosed No Occptnl Ttl B No Occptnl Ttl B
Academic Non-Target Non-Target
Accountant /Auditor Target Analysts or Portfolio Managers Related
Actuary Non-Target Non-Target
Analyst: Closely Held Companies Non-Target Non-Target
Analyst: Credit Non-Target Non-Target
Analyst: Emerging Markets Non-Target Non-Target
Analyst: Equity Target Analysts
Analyst: Fixed Income Non-Target Non-Target

241
Table 3 Occupational Titles A and B: Fundamental Analysis Investment Decision-maker Classifications(Each individual may have disclosed up to two occupational titles.)
Occupational Titles
Target or Non-Target
Population Occupational Title?
Fundamental Analysis
Investment Decision-maker Type
Analyst: Mergers and Acquisition Target Analysts
Analyst: Options and Futures Non-Target Non-Target
Analyst: Quantitative Research Non-Target Non-Target
Analyst: Real Estate Target Analysts
Analyst: Venture Capital Non-Target Non-Target
Attorney Non-Target Non-Target
Bank: Examiner/Regulator Non-Target Non-Target
Bank: Trust Administrator Non-Target Non-Target
Bank: Trust Investments Non-Target Non-Target
CEO/Chair/Partner/Principal Target Analysts or Portfolio Managers Related
Chief Investment Officer Target Analysts or Portfolio Managers Related
Compliance Officer Non-Target Non-Target
Consultant: Management Non-Target Non-Target
Consultant: Pension Non-Target Non-Target
Corporate Financial Officer Non-Target Non-Target
Corporate Pension Officer Non-Target Non-Target
Derivatives Specialist Non-Target Non-Target
Director of Research Target Analysts or Portfolio Managers Related
Economist Target Analysts or Portfolio Managers Related

242
Table 3 Occupational Titles A and B: Fundamental Analysis Investment Decision-maker Classifications(Each individual may have disclosed up to two occupational titles.)
Occupational Titles
Target or Non-Target
Population Occupational Title?
Fundamental Analysis
Investment Decision-maker Type
Financial Journalist Non-Target Non-Target
Financial Planner Non-Target Non-Target
Government Non-Target Non-Target
Investment Administrator Non-Target Non-Target
Investment Banker Target Analysts
Investment Counselor Target Portfolio Managers
Investment Firm Manager Target Analysts or Portfolio Managers Related
Mutual Funds Non-Target Non-Target
Other Non-Target Non-Target
Performance Measurement Specialist Non-Target Non-Target
Portfolio Manager Target Portfolio Managers
Portfolio Strategist Target Analysts or Portfolio Managers Related
Retired Non-Target Non-Target
Sales and Marketing: Institutional Non-Target Non-Target
Sales and Marketing: Investment Services Non-Target Non-Target
Sales and Marketing: Retail Non-Target Non-Target
Student Non-Target Non-Target
Trader/Securities and Other Non-Target Non-Target
Appendix 3.2
Post-1998 Construct Definitions and CorrespondingQuestionnaire Measures
242

243
Table xx.1 Decision Usefulness Construct: Definition and Post-1998 M easurement M odel Indicators, and Questionnaire
Questions and Scale Description
Definition
Decision usefulness is a judgement deduced by analysts to assess whether reported
products and services segment disclosures improve their understandings of firms.
Indicators
Q36. Post-1998 reported segment disclosures _____________ my
understanding of firms.
Scale Description
Likert, 7 point, -3 to +3,Strongly Agree toStrongly Disagree
DU1 Q36a. hinder
DU2 Q36b. impede
DU3 Q36c. prevent
DU4 Q36d. confirm
DU5 Q36e. validate
DU6 Q36f. alter
DU7 Q36g. change
DU8 Q36h. better
DU9 Q36i. improve
DU10 Q36. increase

244
Table xx.2 M ateriality Construct: Definition and Post-1998 M easurement M odel Indicators, and Questionnaire Questions and
Scale Description
Definition
Materiality is the extent to which analysts perceive that their acquired knowledge of
reported products and services segment disclosures influences their understandings of firms.
Indicators
Q35. I believe my acquired knowledge from post-1998 reported
segment disclosures_______ my understanding of firms.
Scale Description
Likert, 7 point, -3 to +3,Strongly Agree toStrongly Disagree
Mat1 Q35a. influences
Mat2 Q35b. affects
Mat3 Q35c. is material to

245
Table xx.3 Ease of Comparing Construct: Definition and Post-1998 M easurement M odel Indicators, and Questionnaire
Questions and Scale Description
Definition
Ease of comparing is the extent to which analysts perceive that reported products and
services segment disclosures make their comparisons easy.
Indicators
Scale Description
Likert, 7 point, -3 to +3,Strongly Agree toStrongly Disagree
EoC1 Q25. Post-1998 reported segment disclosures are easy for me to compare.
EoC2 Q26. I readily compare post-1998 reported segment disclosures.
EoC3 Q27. Post-1998 reported segment disclosures facilitate my comparisons.

246
Table xx.4 Relevance Construct: Definition and Post-1998 M easurement M odel Indicators, and Questionnaire Questions and
Scale Description
Definition
Relevance is the extent to which analysts perceive that reported products and services
segment disclosures have a bearing on their knowledge of firms.
Indicators
Q9. I believe post-1998 reported segment disclosures _________
my knowledge of firms.
Scale Description
Likert, 7 point, -3 to +3,Strongly Agree toStrongly Disagree
Relev1 Q9a. have a bearing on
Relev2 Q9b. are relevant to
Relev3 Q9c. are pertinent to

247
Table xx.5 Reliability Construct: Definition and Post-1998 M easurement M odel Indicators, and Questionnaire Questions and
Scale Description
Definition
Reliability is the extent to which analysts perceive that reported products and services
segment disclosures are suitable to depend on, to improve their understandings of firms.
Indicators
Q30. Post-1998 reported segment disclosures are __________ for
improving my understanding of firms.
Scale Description
Likert, 7 point, -3 to +3,Strongly Agree toStrongly Disagree
Reli1 Q30a. dependable
Reli2 Q30b. reliable
Reli3 Q30c. trustworthy
Reli4 Q30d. credible

248
Table xx.6 Sufficiency Construct: Definition and Post-1998 M easurement Model Indicators, and Questionnaire Questions and
Scale Description
Definition
Sufficiency is the extent to which analysts perceive that reported products and services
segment disclosures provide adequate reported segment disclosures for improving their
understandings of firms.
Indicators
Q34. Post-1998 reported segment disclosures ___________ meet
my minimum requirements for improving my understanding of firms.
Scale Description
Likert, 7 point, -3 to +3,Strongly Agree toStrongly Disagree
Suf1 Q34a. adequately
Suf2 Q34b. sufficiently
Suf3 Q34c. satisfactorily

249
Table xx.7 Satiation Construct: Definition and Post-1998 M easurement M odel Indicators, and Questionnaire Questions
and Scale Description
Definition
Satiation is the extent to which analysts perceive that reported products and services
segment disclosures reveal all the reported segment disclosures they desire for improving
their understandings of firms.
Indicators Nine Point Semantic Differential Scale Questions
Sat1 Q29. For improving my understanding of firms, post-1998 reported
segment disclosures are_________ what I want.
about
far less than -4 -3 -2 -1 0 1 2 3 4 far more than
Q32. For improving my understanding of firms, post-1998 reported
segment disclosures are_________ what I desire.
Sat2 Q32a. far less about far more
comprehensive than -4 -3 -2 -1 0 1 2 3 4 comprehensive than
Sat3 Q32b. far less about far more
complete than -4 -3 -2 -1 0 1 2 3 4 complete than

250
Table xx.8 Representational Faithfulness Construct: Definition and Post-1998 M easurement M odel Indicators, and
Questionnaire Questions and Scale Description
Definition
Representational faithfulness is the extent to which analysts perceive that reported products
and services segment disclosures correspond with the phenomenon the disclosures claim to
describe.
Indicators
Q14. I believe post-1998 reported segment disclosures correspond
with the segment _________________ they claim to describe.
Scale Description
Likert, 7 point, -3 to +3,Strongly Agree toStrongly Disagree
RF1 Q14a. phenomena
RF2 Q14b. facts
RF3 Q14c. events
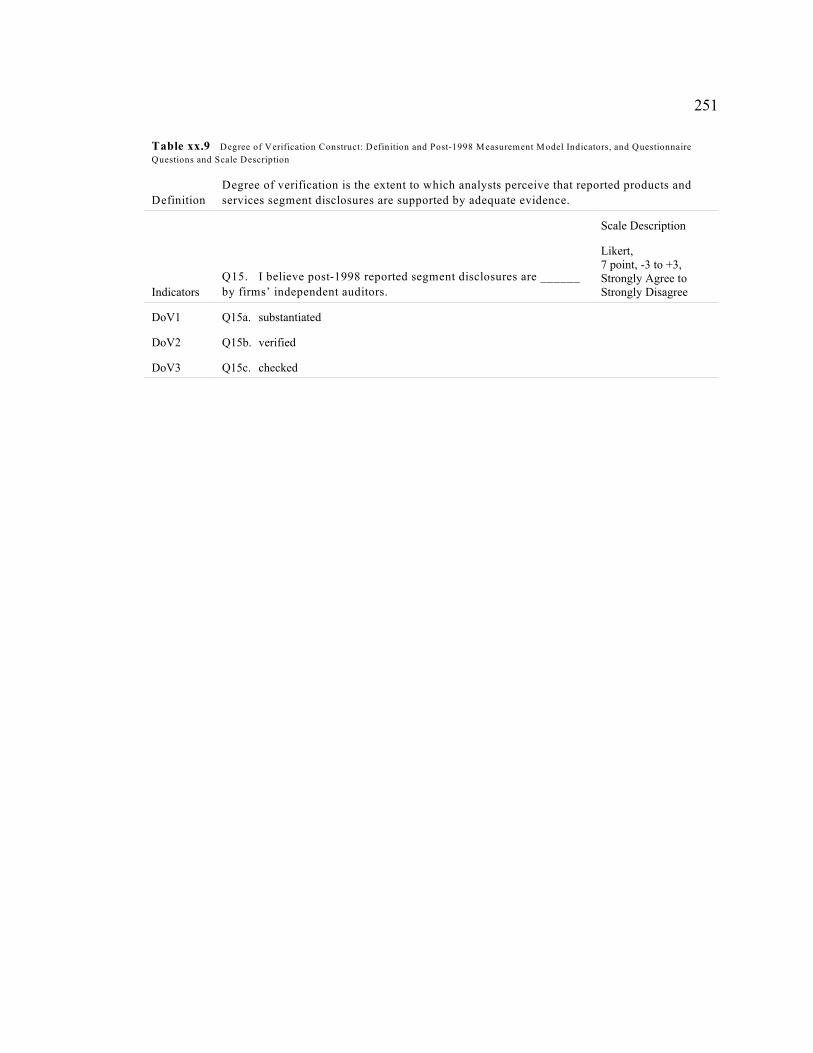
251
Table xx.9 Degree of Verification Construct: Definition and Post-1998 M easurement Model Indicators, and Questionnaire
Questions and Scale Description
Definition
Degree of verification is the extent to which analysts perceive that reported products and
services segment disclosures are supported by adequate evidence.
Indicators
Q15. I believe post-1998 reported segment disclosures are ______
by firms’ independent auditors.
Scale Description
Likert, 7 point, -3 to +3,Strongly Agree toStrongly Disagree
DoV1 Q15a. substantiated
DoV2 Q15b. verified
DoV3 Q15c. checked

252
Table xx.10 Neutrality Construct: Definition and Post-1998 M easurement M odel Indicators, and Questionnaire Questions
and Scale Description
Definition
Neutrality is the extent to which analysts perceive that reported products and services
segment disclosures are not unduly supportive of a particular position in the segment
reporting disclosure debate.
Indicators
Q16. What is your belief about how aligned post-1998 reported
segment disclosures are with the interests of these firm stakeholders?
Scale Description
Likert, 7 point, -3 to +3,Strongly Agree toStrongly Disagree
Neu1F Q16a. individual investors
Neu2F Q16b. management
Neu3F Q16c. professional investors
Neu4F Q16d. all other stakeholders
Q17. I believe post-1998 reported segment disclosures are _____ .
Scale Description
Likert, 7 point, -3 to +3,Strongly Agree toStrongly Disagree
Neu1 Q17a. biased
Neu2 Q17b. neutral

253
Table xx.11 Ease of Complete Intelligibility Construct: Definition, Post-1998 M easurement Model Indicators, and
Questionnaire Questions and Scale Description
Definition
Ease of complete intelligibility is the extent to which analysts perceive that reported
products and services segment disclosures are lucid.
Indicators Q13. For me, post-1998 reported segment disclosures are ______.
Scale Description
Likert, 7 point, -3 to +3,Strongly Agree toStrongly Disagree
EoCI1 Q13b. clear
EoCI2 Q13c. comprehensible
EoCI3 Q13d. lucid

254
Table xx.12 Readableness Construct: Definition, Post-1998 M easurement M odel Indicators, and Questionnaire Questions
and Scale Description
Definition
Readableness is the extent to which analysts perceive that reported products and services
segment disclosures are easy for them to read.
Indicators Q12. I ___________ read post-1998 reported segment disclosures.
Scale Description
Likert, 7 point, -3 to +3,Strongly Agree toStrongly Disagree
Read1 Q12a. easily
Read2 Q12b. readily
Q13. For me, post-1998 reported segment disclosures are _____ .
Scale Description
Likert, 7 point, -3 to +3,Strongly Agree toStrongly Disagree
Read3 Q13a. readable

255
Table xx.13 Consistency with Users’ Accounting Constructs Construct: Definition, Post-1998 M easurement Model
Indicators, and Questionnaire Questions and Scale Description
Definition
Consistency with users’ accounting constructs is the extent to which analysts perceive that
reported products and services segment disclosure accounting concepts are equivalent in
function to their accounting concepts.
Indicators
Q10. I believe the accounting concepts used to determine post-
1998 reported segment disclosures are _______ to my accounting
concepts. These concepts focus on how firms determine their
reported segments and what they report about them.
Scale Description
Likert, 7 point, -3 to +3,Strongly Agree toStrongly Disagree
CwUAC1 Q10a. equivalent in function
CwUAC2 Q10b. similar
CwUAC3 Q10c. analogous

256
Table xx.14 Ease of Interpreting Accounting Estimates Construct: Definition, Post-1998 M easurement Model Indicators, and
Questionnaire Questions and Scale Description
Definition
Ease of interpreting accounting estimates is the extent to which analysts perceive that
reported products and services segment disclosure accounting estimates are easy for them
to interpret.
Indicators
Q11. For me, post-1998 reported segment disclosure accounting
estimates are easy to ________.
Scale Description
Likert, 7 point, -3 to +3,Strongly Agree toStrongly Disagree
EoIAE1 Q11a. interpret
EoIAE2 Q11b. comprehend
EoIAE3 Q11c. understand

257
Table xx.15 Ease of Integrating Construct: Definition, Post-1998 M easurement Model Indicators, and Questionnaire
Questions and Scale Description
Definition
Ease of integrating is the extent to which analysts perceive that reported products and
services segment disclosures are easy to integrate into their system of understanding firms.
Indicators
Q22. I _____________ incorporate post-1998 reported segment
disclosures into my procedures for analyzing disclosures.
Scale Description
Likert, 7 point, -3 to +3,Strongly Agree toStrongly Disagree
EoI1 Q22a. easily
EoI2 Q22b. readily

Appendix 3.3
Survey Letter and Questionnaire
257

258
February 16, 2009
AddresseeCompany NameAddress Line 1Address Line 2City, State Zip Code
Dear Addressee:
In a few days, by mail, you’ll receive a brief University of Houston questionnaire; it’s thecrux of a study regarding an issue important to investment professionals—the decisionusefulness of financial reporting information—in particular, of segment reportinginformation.
Your participation is crucial. I’m writing in advance because we’ve found that manypeople like to know that they’ll be contacted. If enough analysts volunteer their expertise,the information will interest the Financial Accounting Standards Board and theInternational Accounting Standards Board, which are jointly reexamining their respectivefinancial reporting conceptual frameworks. The findings will, also, be of interest to theChartered Financial Analysts Institute.
As a way of saying thank you—all respondents will be eligible to participate in a lottery.A findings summary will, also, be posted at www.bauer.uh.edu/acct/sr_survey.html.
Your participation in this study will help me to fulfill the final requirement of mydoctoral program. Dr. George O. Gamble (713-743-4824), my faculty sponsor, issupervising this study. We both would appreciate your assistance.
Sincerely,
Cynthia Tollerson, Ph. D. Candidate
P.S. It’s only with the support of seasoned investment professionals, such as you, thatindependent research focusing on analysts can be beneficial.

259
February 23, 2009
AddresseeCompany NameAddress Line 1Address Line 2City, State Zip Code
Dear Addressee:
You recently received my letter asking for your help with an independent University ofHouston study concerning the decision usefulness of segment reporting information.Enclosed is the “Analysts’ Perceptions of Reported Segment Disclosures” questionnaire,which I mentioned. It’s my understanding that you’re an investment professional whouses segment reporting information. I’ve randomly selected 1,600 analysts, like you, toask their opinions regarding the qualitative characteristics of U.S. domiciled firms’products and services segment disclosures. I’ll use the study results to better understandanalysts’ conceptualizations of decision useful financial reporting information.
Your participation is crucial. The results will interest the Financial Accounting StandardsBoard and the International Accounting Standards Board, which are jointly reexaminingtheir respective conceptual frameworks—to improve the decision usefulness of financialreporting information. The results will, also, be of interest to the Chartered FinancialAnalysts Institute.
Your answers to the fifteen minute questionnaire will be confidential; your identity willnot be disclosed. If you don’t examine the financial reporting disclosures of U.S.domiciled firms that disclose products and services segments answer section five, only.Should you prefer to not convey your insights, would you let me know by mailing backthe blank questionnaire? It has an identification number, and it is stamped and selfaddressed.
To express my gratitude, the identification numbers of all returned questionnaires will beentered into a lottery. Two prizes will be awarded. Each will be a $250 donation, in thewinner’s name, to a nonprofit organization selected by the winner. The winners’questionnaire numbers and a findings summary will be posted atwww.bauer.uh.edu/acct/sr_survey.html.
This project fulfills the final requirement of my doctoral program. It’s supervised by myfaculty sponsor, Dr. George O. Gamble (713-743-4824). The results may be published, orpresented at professional conferences, or both. If you have questions or concerns aboutthis study, feel free to contact either of us.

260
Sincerely,
Cynthia Tollerson, Ph. D. Candidate

261
March 3, 2009
Last week, I mailed to you a University of Houston questionnaire, which seeks yourinsights about the qualitative characteristics of U.S. domiciled firms’ products andservices segment disclosures.
If you’ve completed and returned the questionnaire, please accept my gratitude. If not,would you, kindly, do so today? It is only by asking professionals, like you, that we cancollect information that will allow us to gain a better understanding of the attributes ofdecision useful financial reporting information.
If you didn’t receive the questionnaire, or if it was misplaced, please call me at 713-743-4845 or email me at [email protected]. I’ll mail another to you immediately.
This project is a requirement of my doctoral program and is supervised by my facultysponsor, Dr. George O. Gamble (713-743-4824).
Cynthia Tollerson, Ph. D. Candidate

262
April 10, 2009
Addressee
Employer Name
Address Line 1
Address Line 2
City, State Zip Code
Dear Addressee:
About six weeks ago, I mailed to you a University of Houston questionnaire concerning the decision
usefulness of segment information. I have not, yet, received your response. For that reason, I’ve mailed to
you the enclosed replacement questionnaire.
This study is part of our long-range project to better understand the attributes composing decision usefulness.
Consequently, this study will have a greater impact on the accounting standard-setting process, than the study
of any issue currently in the press— if enough questionnaire recipients respond.
Some of your colleagues have responded. They’ve expressed varying views about segment information.
Some have commented that several questions are alike. Others have observed that respondents’ answers will
differ, greatly, based on their data usage and on the firms they follow. Each issue is valid; each was
considered in the questionnaire design. Furthermore—to achieve nontrivial results—the latter requires that
we receive numerous responses.
Your response is vital. Our survey results can only be meaningful—to the financial and the accounting
standard-setting communities—if nearly everyone, who received the questionnaire, responds.
Our target survey population is investment professionals who employ firms’ annual reports, 10-K’s, or 10-
Q’s and who follow U.S. domiciled firms that disclose products and services segments. Hence, the target
population includes those who aren’t research analysts.
If you’re not a target population member—would you let me know by, only, completing questionnaire section
five and returning the questionnaire? If you’re a member—but would rather not convey your views—would
you return the blank questionnaire? It is stamped and self-addressed.
Your questionnaire bears an identification number. When I receive your questionnaire, I’ll use the number to
remove your name from our mailing list. I’ll also use it to protect the confidentiality of your responses—your
identity will not be disclosed.
Your participation is voluntary. Ergo, to express my appreciation to the respondents, I’ll enter their
questionnaire numbers into a lottery. Two prizes will be awarded. Each will be a $250 donation, in the
randomly selected winner’s name, to a nonprofit organization chosen by the winner. The winners’
questionnaire numbers and a findings summary will be posted at www.bauer.uh.edu/acct/sr_survey.html.
This project fulfills the final requirement of my doctoral program. The results may be published, or presented
at professional conferences, or both. If you have questions or concerns about this study, E-mail me at
[email protected] or telephone my faculty sponsor, Dr. George O. Gamble (713-743-4824).
Sincerely,
Cynthia Tollerson, Ph. D. Candidate

263
Telephone/Voice Mail Script
Hello. May I speak with [Courtesy Title, First-name, Last_Name]?
My name is Cynthia Tollerson. I’m a doctoral student at the University of Houston. OnApril 10, I mailed to you a questionnaire entitled “ Analysts’ Perceptions of ReportedSegment Disclosures.” It came in a white 6" by 9" envelope, which bears the University ofHouston’s red logo. The questionnaire has a blue hard cover.
I’m calling to determine if you’ve received the questionnaire and to answer questions thatyou may have about our study.
We’ve sent you four mailings. This is the last contact that I will initiate with you. If you’renot interested or are unable to participate in our study, would you mail back thequestionnaire? It’s self addressed and stamped. Or call me on my cell phone, and leave avoice mail message that includes your name and either your company name or yourtelephone number, and just say you’re not interested. My cell phone, the number is xxx-xxx-xxxx.
In terms of questions that you may have, the purpose of our study is to test a theoreticalmodel that I developed, with the help of my dissertation committee. The model representsour conceptualization of the attributes of decision useful information. We’re testing it inthe context of investment professionals’ perceptions of the segment reporting informationdisclosed by U.S. domiciled firms that disclose products and services segments.
The Financial Accounting Standards Board is currently revising its conceptual framework.It’s chosen, however, to not revise it decision useful definition. We feel it should.Furthermore, the FASB has never devised a method for objectively measuring whetherfirms’ financial reporting information is decision useful. We have. Your response to oursurvey will provide the empirical data needed to test our model and will help theinvestment and accounting communities.
If you have additional questions about our study, please call me on my cell phone. Again,that number is xxx-xxx-xxxx.
Thank you for your time.

264

265

266

267
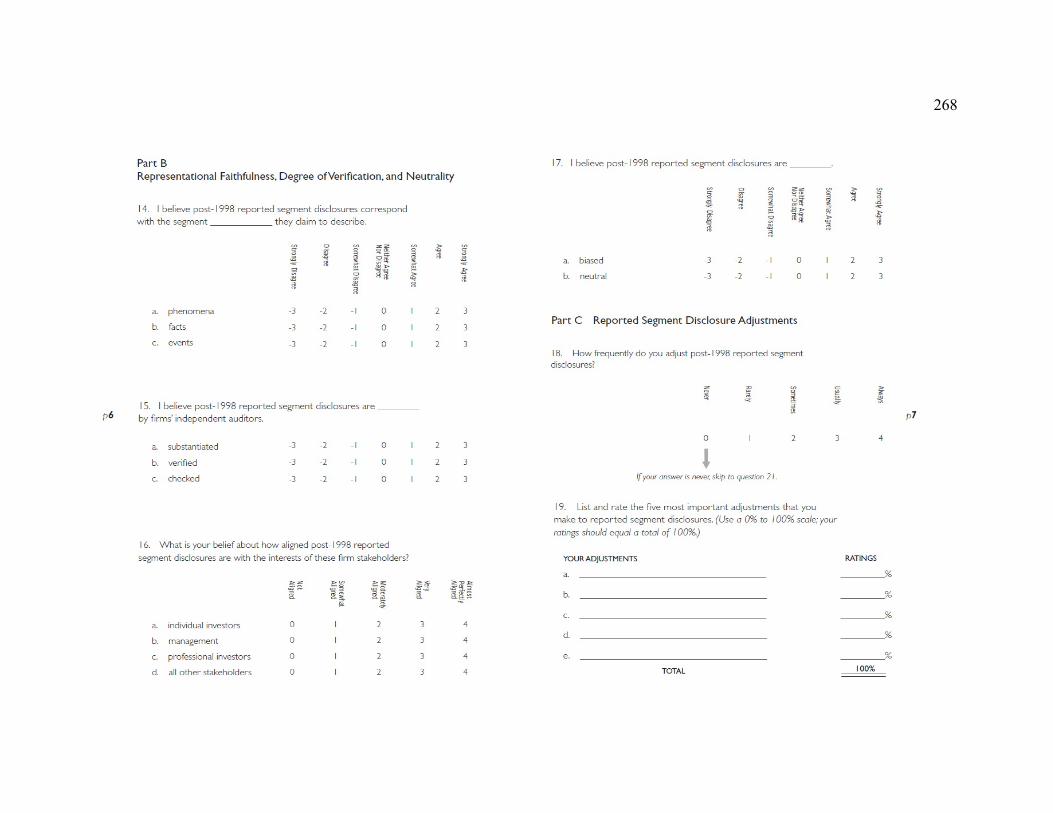
268

269

270

271

272

273

274

275

276

277

278