the declining prospects for parole on life sentences
TRANSCRIPT

DELAYING A SECOND CHANCE:THE DECLINING PROSPECTS FOR
PAROLE ON LIFE SENTENCES
THIRTY-TWO JURISDICTION PROFILES

This report was written by Nazgol Ghandnoosh, Ph.D., Research Analyst at The Sentencing Project. Ashley Nellis, Ph.D., Joshua Rovner, and Morgan McLeod made substantial contributions. Leigh Courtney, Corey Guilmette, Elizabeth McCurdy, Zack Eckles, and Sami Ghubril, former interns, provided research assistance.
We are grateful to the following individuals for their input on the state profiles: Katherine Beckett, Randall C. Berg, Jr., Tessa Bialek, Michele Deitch, Philip Genty, Barbara R. Levine, Walter Lomax, Thomas Master, Scott Paltrowitz, Alan Rosenthal, Heidi L. Rummel, Sarah F. Russell, Bobbin Singh, and Jean Trounstine. We also thank the staff of the state and federal agencies that provided data for this analysis.
The Sentencing Project is a national non-profit organization engaged in research and advocacy on criminal justice issues. Our work is supported by many individual donors and contributions from the following:
Atlantic PhilanthropiesMorton K. and Jane Blaustein Foundation craigslist Charitable FundFord Foundation Bernard F. and Alva B. Gimbel Foundation Fidelity Charitable Gift FundGeneral Board of Global Ministries of the United Methodist ChurchMott PhilanthropyOpen Society FoundationsPetschek FoundationPublic Welfare Foundation Rail Down Charitable TrustDavid Rockefeller FundElizabeth B. and Arthur E. Roswell FoundationSan Francisco FoundationTikva Grassroots Empowerment Fund of Tides FoundationElsie P. van Buren Foundation
Wallace Global Fund
Copyright © 2017 by The Sentencing Project. Reproduction of this document in full or in part, and in print or electronic format, only by permission of The Sentencing Project.
For more information, contact:
The Sentencing Project1705 DeSales Street NW8th FloorWashington, D.C. 20036
(202) 628-0871
sentencingproject.orgtwitter.com/sentencingprojfacebook.com/thesentencingproject

The Sentencing Project
TABLE OF CONTENTS
1. Arizona 12. Arkansas 33. California 54. Colorado 105. Connecticut 136. Florida 157. Georgia 178. Hawaii 199. Illinois 2110. Iowa 2311. Maine 2512. Maryland 2613. Massachusetts 2814. Michigan 3115. Minnesota 3316. Missouri 3517. Montana 3818. Nebraska 4019. New Jersey 4220. New York 4421. North Dakota 4822. Ohio 4923. Oregon 5124. Rhode Island 5325. South Carolina 5426. Texas 5727. Utah 5928. Washington 6229. West Virginia 6530. Wisconsin 6731. Wyoming 7032. Federal 72
To read the primary report which this document supplements, see Delaying a Second Chance: The Declining Prospects for Parole on Life Sentences.

1The Sentencing Project • 1705 DeSales Street NW, 8th Floor • Washington, D.C. 20036 • sentencingproject.org
DELAYING A SECOND CHANCE: STATE PROFILES
ArizonaKEY FINDINGS • Although Arizona’s 1993 truth-in-sentencing law eliminated discretionary parole for offenses commit-
ted after 1994, the state has continued to impose parole-eligible life sentences under a habitual of-fender law and for certain offenses. Its parole-eligible lifer population has doubled between 1994 and 2012.
• Individuals sentenced to life for first-degree murder or for certain aggravated second-degree murder convictions between 1985 and 1994 must serve between 25 and 35 years before being considered for parole. Lifers sentenced after 1994 under the habitual offender law become parole-eligible after serving 25 years, and those convicted of dangerous crimes against children become eligible after 35 years.
• Average time served for the 18 lifers paroled in 2013 with murder convictions was 28.3 years.
• Arizona conducted 179 lifer parole hearings in 2013 and paroled 31 individuals—a grant rate of 17%. Eight of the paroled individuals began consecutive sentences. Seventeen waived their parole hearing that year.
OVERVIEW AND POLICY HIGHLIGHTSThere were 1,053 individuals with parole-eligible life sentences in Arizona prisons in 2012, constituting 2.6% of the state’s prison population.1 This was nearly double the number of parole-eligible lifers in Arizona prisons in 1994.2
Although Arizona’s 1993 truth-in-sentencing law elim-inated discretionary parole for offenses committed after 1994,3 the state has continued to impose pa-role-eligible life sentences under a habitual offender law and for certain offenses. Individuals sentenced to life for first-degree murder or for certain aggravated second-degree murder offenses between 1985 and 1994 must serve 25 years before being considered for parole, or 35 years if the victim was less than 15 years old.4 Since 1994, the state has sentenced a number of people to life with the possibility of parole after serving 25 years under a habitual offender law, and to life with the possibility of parole after serving 35 years for dangerous crimes against children.5 The legislature has not yet defined the release process for these in-dividuals, who will become eligible for parole review starting in 2019.6
In 2014, the legislature passed House Bill 2593 in re-sponse to the Miller and Graham Supreme Court deci-sions, which reestablished the possibility of parole for individuals sentenced to life without parole for crimes committed under age 18.7
Time Served for Paroled Lifers with Murder Convictions in Arizona, 2013
Number released: First-degree murder (12), Second-degree murder (1), Murder unspecified (5)

2The Sentencing Project • 1705 DeSales Street NW, 8th Floor • Washington, D.C. 20036 • sentencingproject.org
DELAYING A SECOND CHANCE: STATE PROFILES
1 Nellis, A. (2013). Life goes on: The historic rise in life sentences in America. Washington, DC: The Sentencing Project. Retrieved from: http://sen-tencingproject.org/wp-content/uploads/2015/12/Life-Goes-On.pdf
2 Nellis, 20133 Arizona State Senate, Truth in Sentencing, S. (Ariz. 2010). Retrieved
from http://www.azleg.gov/briefs/senate/truth%20in%20sentencing.pdf; Omnibus Criminal Code Revisions, S. 1049, 41st Leg., 1st Reg. Sess. (Ariz. 1993). Retrieved from http://azmemory.azlibrary.gov/cdm/ref/collection/azsession/id/69
4 Omnibus Criminal Code Revisions, S.V-1586, 37th Leg., 1st Reg. Sess. (Ariz. 1985). Retrieved from http://azmemory.azlibrary.gov/cdm/sin-gleitem/collection/azsession/id/0/rec/65; Ariz. Rev. Stat. § 13-705, Ariz. Rev. Stat. § 13-706
NUMBER PAROLED AND TIME SERVEDThe average time served for the 12 lifers released in 2013 with first-degree murder convictions was 26.6 years. That year, an individual released with a sec-ond-degree murder conviction had served 24.8 years. The five who were released with unspecified murder convictions had served an average of 33.2 years. Average time served for all of these 18 individuals was 28.3 years.
Outcomes of Arizona’s Scheduled Lifer Parole Hearings, 2013
LIFER PAROLE HEARINGS AND GRANT RATESIn 2013, parole was granted in 31 lifer parole hearings and it was denied in 148 hearings, resulting in a grant rate of 17%. Eight of the paroled individuals began consecutive sentences. Seventeen people waived their parole hearing that year (and were not included in the grant rate calculation).
5 Ariz. Rev. Stat. § 13-604; Ariz. Rev. Stat. § 13-604.016 Correspondence with the Arizona Department of Corrections. 7 The Phillips Black Project. (2015, July). Juvenile life without parole after
Miller v. Alabama. Retrieved from https://static1.squarespace.com/static/55bd511ce4b0830374d25948/t/55f9d0abe4b0ab-5c061abe90/1442435243965/Juvenile+Life+Without+Parole+After+-Miller++.pdf.

3The Sentencing Project • 1705 DeSales Street NW, 8th Floor • Washington, D.C. 20036 • sentencingproject.org
DELAYING A SECOND CHANCE: STATE PROFILES
ArkansasKEY FINDINGS • To qualify for parole, individuals with parole-eligible life-sentences must first have their sentences
commuted by the governor to a term of years. Those sentenced to life without parole remain parole-in-eligible even after a commutation.
• The state has had very few lifer parole hearings, averaging two per year between 1980 and 2014. Across this period, the parole board conducted 68 lifer parole hearings and granted parole to 19 people. During the 2000s, the only parole grants for those with murder convictions were under Act 290 Hear-ings. These hearings occur when an individual is either diagnosed with a terminal illness that will result in death within the year or is incapacitated to the degree that care is not available within the department of corrections.
• Average time served among released lifers with first-degree or capital murder convictions has increased markedly over time. In the 1980s, average time served for this group was 15.8 years; in the 1990s, it was 23.9 years; and in the 2000s it was 29.7 years.
Time Served for Paroled Lifers with First-Degree Murder Convictions in Arkansas, 1980-2014
Note: This analysis includes an individual paroled in 2008 with a capital murder conviction who had served 27.2 years
1980s 1990s 2000s 2010-2014
5 2 4 0
Number of Lifers with First-Degree Murder Convic-tions Paroled from Arkansas Prisons, 1980-2014
OVERVIEW AND POLICY HIGHLIGHTSThe 872 individuals serving parole-eligible life sentenc-es in Arkansas constituted 6.0% of the state’s prison population in 2012.1 In addition, a significant number of people were serving parole-ineligible life sentences.2
Life-sentenced individuals in Arkansas can become parole-eligible only if the governor first commutes their sentence to a term of years by executive clemency, and they have served the statutory minimum sentence.3 Individuals sentenced to life without parole cannot be released on parole, even if the governor commutes their sentence to a term of years.
The parole board can rescind its parole grants in cases where incarcerated individuals fail to complete a program on which their parole grant was conditioned.4
During the 2000s, the only parole grants for those with murder convictions were under Act 290 Hearings. These hearings occur when a physician diagnoses an individual with a terminal illness that will result in death within the year, or when the individual is incapacitated to the degree that care is not available within the de-partment of corrections.5

4The Sentencing Project • 1705 DeSales Street NW, 8th Floor • Washington, D.C. 20036 • sentencingproject.org
DELAYING A SECOND CHANCE: STATE PROFILES
Number of Lifer Parole Hearings and Grant Rates in Arkansas, 1980-2014
1 Nellis, A. (2013). Life goes on: The historic rise in life sentences in America. Washington, DC: The Sentencing Project. Retrieved from: http://sen-tencingproject.org/wp-content/uploads/2015/12/Life-Goes-On.pdf
2 In 2016, Arkansas had 57 individuals sentenced to mandatory life without parole as juveniles who would be resentenced. See: Kauffman, J. (2016, January 25). Supreme Court juvenile life sentences decision & Arkansas legislative battles. Arkansas Public Media. Retrieved from
Note: Grant rate does not include those for whom parole was rescinded
NUMBER PAROLED AND TIME SERVEDSince 1980, 10 people convicted of first-degree murder, one convicted of second-degree murder, and one con-victed of capital murder have been paroled. Five of these individuals were paroled in the 1980s, two in the 1990s, and five in the 2000s. All who were paroled in the 2000s were released under Act 290 Hearings. No lifers were paroled between 2010 and 2014.
Average time served for released lifers with first-degree or capital murder convictions has increased markedly over time. In the 1980s, average time served for this group was 15.8 years; in the 1990s, it was 23.9 years; and in the 2000s it was 29.7 years.
The individual with a second-degree murder conviction who was released in 2005 had served 7.6 years.
LIFER PAROLE HEARINGS AND GRANT RATESThe state has had very few lifer parole hearings, aver-aging two per year between 1980 and 2014. Given the small number of hearings, the parole grant rate has varied significantly across years. Of the 68 total hear-ings conducted during this period, 21 resulted in a parole grant, two of which were rescinded.
0
1
2
3
4
5
6
7
2014
2013
2012
2011
2010
2009
2008
2007
2006
2005
200
420
0320
0220
0120
0019
9919
9819
9719
9619
9519
9419
9319
9219
9119
9019
8919
8819
8719
8619
8519
84
1983
1982
1981
1980
100%
100%
67%
75%
0% 0% 0% 0% 0% 0% 0% 0% 0% 0% 0% 0%
17%
50%
50%
0%
33%
33%
33%
100%
100%
67%
Not granted
Grant rate
Granted
Num
ber o
f hea
rings
http://ualrpublicradio.org/post/supreme-court-juvenile-life-sentenc-es-decision-arkansas-legislative-battles#stream/0
3 Ark. Code Ann. § 16-93-6134 Correspondence with Arkansas Parole Board. 5 Board of Parole, Arkansas Board of Parole Policy Manual, (Ark. 2010).
Retrieved from http://www.sos.arkansas.gov/rulesRegs/Arkansas%20Register/2010/Oct10Reg/158.00.10-001.pdf

5The Sentencing Project • 1705 DeSales Street NW, 8th Floor • Washington, D.C. 20036 • sentencingproject.org
DELAYING A SECOND CHANCE: STATE PROFILES
CaliforniaKEY FINDINGS • California1 leads the nation in the size of its parole-eligible lifer population, with over 34,000 individ-
uals in 2013. The state’s “three strikes and you’re out” law increased the imposition of these sen-tences while policies such as increased minimum sentences before parole eligibility, gubernatorial review of the parole board’s decisions, and increased wait times between hearings have delayed parole.
• Time served for released lifers with murder convictions remained relatively stable between 1984 and 2001, averaging 12.3 years across this period. Average time served then climbed dramatically, reach-ing 24.3 years for those paroled in 2013. State records reveal that more lifers with murder convictions died in prison than were paroled between 2000 and 2011.
• The parole board’s grant rate for lifers increased from 3% to 16% between 2000 and 2009, and in-creased further to 29% by 2013. While earlier governors during this period reversed or requested reconsideration of between 73% and 98% of parole board grants, Governor Jerry Brown did so for just 19% of the board’s decisions by 2013. While the number of hearings conducted climbed during the earlier part of this period, it has declined in recent years.
• The implementation of alternative parole hearings for people convicted under age 18 (later extended to those convicted under age 23) has marginally improved this group’s parole prospects.
OVERVIEW AND POLICY HIGHLIGHTSCalifornia has by far the largest parole-eligible lifer population in the United States: 34,070 individuals in 2013.2 While parole-eligible lifers accounted for 7% of the total US prison population in 2012, they represent-ed one-quarter of California’s prison population in that year.3 (In 2010, before the state began its “Realignment” policy to reduce the number of incarcerated individu-als with low-level convictions, parole-eligible lifers represented 20% of the prison population.)4 Half of these individuals were convicted of homicide, 27% were convicted of aggravated assault, robbery, or kid-napping, 12% of sexual assault, and 11% had property or drug convictions.5 In addition, a significant number of people in California were serving parole-ineligible life sentences or were on death row.6
California leads the country in the size of its lifer pop-ulation because of policies and practices that have both increased the imposition of this sentence and
limited parole. In 1994, California voters approved the “three strikes and you’re out” law, whereby people whose third felony conviction (of any type, until 2012’s Proposition 36)7 was preceded by two serious or violent felonies were mandated to serve a 25-years-to-life sentence. None of the “three strikers”—numbering 7,975 individuals in 2013—have so far come up for parole review.8
Long before the passage of the three-strikes law, Cal-ifornia had begun to restrict parole for lifers. A series of roadblocks erected beginning in 1978 increased the minimum amount of time that these individuals have to serve before becoming eligible for parole (their “minimum eligible parole date,” or MEPD).9 Those con-victed of life crimes prior to 1978 had a MEPD of seven years; afterwards, the MEPD for individuals convicted of first-degree murder became 25 years and the MEPD for those convicted of second-degree murder became

6The Sentencing Project • 1705 DeSales Street NW, 8th Floor • Washington, D.C. 20036 • sentencingproject.org
DELAYING A SECOND CHANCE: STATE PROFILES
15 years.10 The MEPD could be reduced by one-third for good behavior for many individuals, but a number of provisions have restricted this relief.11
The passage of Proposition 89 in 1988 allowed gov-ernors to overturn the parole board’s parole grants for lifers convicted of murder and to demand additional review for others, a secondary review process used by only four other states.12 More recently, Marsy’s Law of 2008 (Proposition 9) has increased possible wait times between parole hearings from 1–5 years to 3–15 years.13 In 2016, the 9th U.S. Circuit Court of Appeals reversed a district court ruling finding that Propositions 9 and 89 violated the Ex Post Facto Clause of the U.S. Constitution , which prohibits retroactively increasing prison sentences.14
Following In re Lawrence and In re Shaputis in 2008, parole denials cannot be based on the commitment offense alone, but rather on inadequate “insight” into the crime. Since the implementation of Senate Bill 260 (“SB 260”) in 2014, lifers convicted of crimes under the age of 18 are given “Youth Offender Parole Hear-ings” which give greater weight to the impact of their youth at the time of the crime and to their potential for change.15 In 2015, Senate Bill 261 extended this reform to those convicted under age 23.
Throughout this period, some incarcerated individuals have successfully challenged parole denials by filing writs of habeas corpus. In 2011, the United States Supreme Court limited the federal courts’ ability to provide this relief.16
Average Time Served for Paroled Lifers with Murder Convictions in California, 1984-2013
1984
1985
1986
1987
1988
1989
1990
1991
1992
1993
1994
1995
1996
1997
1998
1999
2000
2001
2002
2003
2004
2005
2006
2007
2008
2009
2010
2011
2012
2013
69 64 53 71 49 53 42 33 17 14 14 13 12 27 21 15 12 14 10 22 70 49 36 49 86 177 261 388 NA 487
Number of Paroled Lifers with Murder Convictions in California, 1984-2013
Source: National Corrections Reporting Program
Source: National Corrections Reporting Program

7The Sentencing Project • 1705 DeSales Street NW, 8th Floor • Washington, D.C. 20036 • sentencingproject.org
DELAYING A SECOND CHANCE: STATE PROFILES
Number of Lifer Parole Hearings Conducted and Grant Rates in California, 2000-2013
LIFER PAROLE HEARINGS AND GRANT RATESDue to the limited availability of data, this analysis of lifer parole hearings and grant rates begins in the year 2000. Between 2000 and 2013, the parole board has increased its grant rate and governors—particularly Governor Brown—have reversed or requested recon-sideration of fewer of these decisions. But while the number of hearings conducted climbed during the earlier part of this period, it has declined in recent years. The remainder of this section examines these trends in greater detail.
The parole board’s grant rate increased from 3% to 16% between 2000 and 2009, and increased further to 29% by 2013. California governors have varied in their use of the power to challenge the parole board’s grant decisions. Governor Pete Wilson (1991-1999) reversed or requested en banc reviews (in which the full board reconsiders a panel decision) for 27% of cases in which the parole board had granted parole;20 Governor Gray Davis (1999-2003) did so for 98% of cases; Governor Arnold Schwarzenegger’s (2003-2011) rate was 73%, and; Governor Jerry Brown’s (2011-present) rate has been the lowest, at 19% by 2013.21
Although in recent years the parole board has increased its grant rate and the current governor has left the
Sources: California Department of Corrections and Rehabilitation Suitability Hearing Summary, CY 1978 through CY 2012 and Lifer Prisoner Parole Consideration Hearing and Decision Information For Calendar Years 2009-2013; Office of Governor Edmund G. Brown Jr. (via Paul Elias of the Associated Press); Thomas Master provided the count of conducted hearings for years 2000-2008.
NUMBER RELEASED AND TIME SERVEDBetween 1984 and 2013, the number of lifers with murder convictions who were paroled has both declined and increased.17 Between 1984 and 1989, an average of 60 such individuals were released each year. This figure fell to 21 between 1990 and 1999. This annual average number of releases increased to 53 in the 2000s and to 379 between 2010 and 2013.
Average time served for released lifers with murder convictions remained relatively stable in the late 1980s and in the 1990s, then began a dramatic ascent be-ginning in the early 2000s 18 Specifically, time served for these paroled individuals averaged 12.3 years between 1984 and 2001, then gradually reached double this level by 2013, at 24.3 years.
Given that these estimates are based on the population that is released from prison, they understate the in-creased punitiveness of the state by omitting the large number of people who died in prison before being paroled. In an interview with Nancy Mullane, a press spokesman for the corrections department stated that “most lifers will die in prison before they get out on parole,” and state records reveal that more lifers with murder convictions died in prison than were paroled between 2000 and 2011.19
0
500
1000
1500
2000
2500
3000
3500
4000
20132012201120102009200820072006200520042003200220012000
2% 2% 2% 2% 4% 2% 3% 0%
6% 8%
21% 25
%
24%
8%
Not granted
Granted by parole boardGranted following gubernational review
Num
ber o
f hea
rings
Net grant rate

8The Sentencing Project • 1705 DeSales Street NW, 8th Floor • Washington, D.C. 20036 • sentencingproject.org
DELAYING A SECOND CHANCE: STATE PROFILES
California Governor Rates of Parole Grant Reversals and En Banc Reviews, 1991-2013
Note: Periods listed above are years of data that do not fully overlap with years in officeSource: Office of Governor Edmund G. Brown Jr. (via Paul Elias of the Associated Press)
Outcomes of Scheduled Parole Hearings in California, 2013
majority of these decisions intact, the number of con-ducted hearings has been falling. The annual number of conducted hearings grew from 1,680 in 2000 to 3,640 in 2006, and then gradually fell to 2,069 in 2013.22 The recent decline stems in part from: 1) a decline in the number of scheduled hearings; and 2) a decline in the proportion of scheduled hearings that are conduct-ed. Marsy’s Law of 2008, a victim’s bill of rights statute passed at referendum, increased wait times between parole hearings and thus may be contributing to both of these trends:
• The number of scheduled hearings declined from 7,121 in 2009 to 4,171 in 2013. All else equal, an increase in the wait time between hearings reduces the number of scheduled hearings. One analysis found that the average wait until subsequent hear-ings more than doubled from 2.0 years in 2007 to 4.6 years in 2009.23
• Although most scheduled lifer parole hearings were conducted during the 1980s and 1990s, since 2000, a growing proportion of lifers have opted out of their hearings potentially to avoid a long wait for a subsequent hearing if they are denied parole.24 In 2000, 78% of 2,164 scheduled hearings were conducted.25 In 2013, the board conducted just 50% of its 4,171 scheduled hearings.26 Twenty percent of scheduled hearings were postponed by either the parole board or the life-sentenced indi-vidual. In addition, lifers voluntarily waived 17% of hearings and stipulated their unsuitability for parole in 9% of scheduled hearings. Robert Weisberg and colleagues note that a key factor contributing to the growing decline in the proportion of scheduled hearings that are conducted “appears to be a dis-incentive built into the system: If an inmate antic-ipates a high probability of denial of parole at a hearing, s/he often chooses to cancel the hearing as a formal denial by the Board could greatly delay his or her entitlement to a subsequent hearing.”27 Marsy’s Law is one such disincentive.
Total number of hearings: 4,171
0
20%
40%
60%
80%
100%
% Reveresed
% En Banc
Wilson(1991-1998)
Davis(1999-2003)
Schwarzenegger(2004-2010)
Out
com
es o
f par
ole
boar
d gr
ants
Brown (2011 through 2013)
12%16% 15%
3%
12%
61%
24%
74%

9The Sentencing Project • 1705 DeSales Street NW, 8th Floor • Washington, D.C. 20036 • sentencingproject.org
DELAYING A SECOND CHANCE: STATE PROFILES
JUVENILE LIFERSBeth Caldwell’s study of the 2014 reform diverting lifers convicted of crimes under age 18 to Youth Of-fender Parole Hearings found that at first the new policy “created at least marginally more meaningful opportunities for release.”28 The 109 individuals who had such hearings in the first six months of the year had served an average of 24.7 years in prison. Although the majority of these hearings resulted in denials, the 43% grant rate was higher than for hearings of those convicted as adults. The governor overturned 24% of these grants.
Those convicted under age 18 continued to have a higher parole grant rate than those convicted as adults for the first eleven months of 2014, but this trend re-versed the following year. In the first four months of 2015, the parole board granted parole to youth offend-ers at a lower rate than it did to their adult-convicted counterparts. This may be partly attributable to the changing characteristics of youth offenders who had parole hearings during these periods.29
1 All California data presented here were either publicly available or re-trieved from researchers, attorneys, or reporters, as specified. We did not undergo the requisite institutional review board process to direct-ly receive data from the California Department of Corrections and Rehabilitation.
2 New York ranks second, with just under 10,000 people serving parole-el-igible life sentences. California Department of Corrections and Reha-bilitation Offender Information Services Branch. (2013, September). Prison census data as of June 30, 2013 (Reference No. CENSUS1). Re-trieved from http://www.cdcr.ca.gov/reports_research/offender_infor-mation_services_branch/Annual/Census/CENSUSd1306.pdf; Nellis, A. (2013). Life goes on: The historic rise in life sentences in America. Washington, DC: The Sentencing Project. Retrieved from: http://sen-tencingproject.org/wp-content/uploads/2015/12/Life-Goes-On.pdf
3 Nellis, 2013. In 2010, before Realignment reduced the number of people imprisoned with lower-level convictions, these lifers represented 20% of the state’s total prison population. See: California Department of Corrections and Rehabilitation Offender Information Services Branch. (2011, February). Prison census data as of December 31, 2010 (Reference No. CENSUS1). Retrieved from http://www.cdcr.ca.gov/reports_re-search/offender_information_services_branch/Annual/Census/CENSUSd1012.pdf
4 California Department of Corrections and Rehabilitation Offender In-formation Services Branch. (2011, February). Prison census data as of December 31, 2010 (Reference No. CENSUS1). Retrieved from http://www.cdcr.ca.gov/Reports_Research/Offender_Information_Services_Branch/Annual/Census/CENSUSd1012.pdf.
5 Nellis, 2013.6 California Department of Corrections and Rehabilitation Offender In-
formation Services Branch, 20137 Progress report: Three strikes reform (Proposition 36). (2013, September).
Retrieved from Stanford Law School Three Strikes Project & NAACP Legal Defense and Education Fund website: http://www.naacpldf.org/files/publications/ThreeStrikesReport_v6.pdf
8 Weisberg, R., Mukamal, D. A., & Segall, J. D. (2011, September). Life in limbo: An examination of parole release for prisoners serving life sentenc-es with the possibility of parole in California. Retrieved from Stanford Criminal Justice Center website: http://law.stanford.edu/wp-content/uploads/sites/default/files/child-page/164096/doc/slspublic/SCJC_report_Parole_Release_for_Lifers.pdf
9 Prison Law Office. (2016, January). Life parole suitability information letter. Retrieved from http://prisonlaw.com/wp-content/uploads/2016/01/LiferCNAJan2016-withHB.pdf
10 Mock, C. R. (2008). Parole suitability determinations in California: Ambiguous, arbitrary and illusory. Review of Law and Social Justice, 17(3), 889-918. Retrieved from http://weblaw.usc.edu/why/students/orgs/rlsj/assets/docs/issue_17/03_Mock_macro.pdf
11 Mock, 2008; Prison Law Office. (2016, January). Life parole suitability information letter. Retrieved from http://prisonlaw.com/wp-content/uploads/2016/01/LiferCNAJan2016-withHB.pdf
12 The other states are: Louisiana, Maryland, Oklahoma, and Washington. See Weisberg, Mukamal, & Segall, 2011; Washington State Office of the Attorney General. (2013, November 7). Washington Supreme Court issues 9-0 ruling in parole review case [Press release]. Retrieved from http://www.atg.wa.gov/news/news-releases/washington-supreme-court-issues-9-0-ruling-parole-review-case (see Wash. Rev. Code Ann. § 9.95.160)
13 California Proposition 9, Marsy’s Law (2008). (n.d.). In Ballotpedia. Retrieved September 15, 2016, from https://ballotpedia.org/Califor-nia_Proposition_9,_Marsy%27s_Law_(2008)
14 Walsh, D. (2016, February 22). Appeals court reverses judge’s decision invalidating state parole laws. The Sacramento Bee, Crime. Retrieved from http://www.sacbee.com/news/local/crime/article61886167.html
15 UnCommon Law. (n.d.). Frequently asked questions about Senate Bill 260 [Fact sheet]. Retrieved September 15, 2016, from UnCommon Law w e b s i t e : h t t p : / / u n c o m m o n l a w. o rg / w p - c o n t e n t / u p -loads/2013/10/13.10.15-Frequently-Asked-Questions-about-SB-260.pdf
16 Swarthout v. Cooke, 562 U.S. (Jan. 24, 2011).17 Based on data from the National Corrections Reporting Program18 Based on data from the National Corrections Reporting Program. See
also Weisberg, Mukamal, & Segall, 2011 19 Mullane, N. (2012). Life after murder: Five men in search of redemption.
New York, NY: Public Affairs, p. 147.20 During these years, the board scheduled an annual average of 1,985
hearings in contrast to the annual average of 4,813 hearings scheduled during subsequent administrations. During Wilson’s administration, board granted parole in 1% of scheduled parole hearings (data were not available to determine the grant rate for hearings that were conducted).
21 Source: Office of Governor Edmund G. Brown Jr. (via Paul Elias of the Associated Press). The office did not have any Proposition 89 records from Governor George Deukmejian (1983-1991).
22 Lifer Prisoner Parole Consideration Hearing and Decision Information For Calendar Years 2009-2013; Thomas Master provided the count of conducted hearings for years 2000-2008.
23 Weisberg, Mukamal, & Segall, 201124 Weisberg, Mukamal, & Segall, 201125 Thomas Master; California Department of Corrections and Rehabilita-
tion Board of Parole Hearings. (2013, April). Suitability hearing summary: CY 1978 through CY 2012. Retrieved from http://www.cdcr.ca.gov/BOPH/docs/BPH_Hearing_Results_CY_1978_to_2012.pdf. We consider con-ducted hearings to be those that resulted in denials, grants, split deci-sions, or continuances. For definitions of these terms, see: http://www.cdcr.ca.gov/BOPH/pshResults.html.
26 See: California Department of Corrections and Rehabilitation Board of Parole Hearings. (2014, August). Lifer scheduling and tracking system: Lifer prisoner parole consideration hearing and decision information for the calendar year 2013. Retrieved from http://www.cdcr.ca.gov/BOPH/docs/LSTS_Workload_CY2013.pdf.
27 Weisberg, Mukamal, & Segall, 2011, p.1128 Caldwell, B. (2016). Creating meaningful opportunities for release:
Graham, Miller, and California’s youth offender parole hearings. N.Y.U Review of Law & Social Change, 40, 245-304, p. 272
29 Caldwell, 2016, p. 273

10The Sentencing Project • 1705 DeSales Street NW, 8th Floor • Washington, D.C. 20036 • sentencingproject.org
DELAYING A SECOND CHANCE: STATE PROFILES
ColoradoKEY FINDINGS • For life-sentenced individuals convicted of certain Class One felonies and those convicted of certain
habitual offender enhancements, Colorado legislators increased minimum sentences before parole eligibility from 10 years for those convicted before 1977 to 20 years for those convicted between 1977 and 1985. Lifers whose convictions occurred between 1985 and 1991 must serve 40 years before becoming eligible for parole and those convicted after this period receive parole-ineligible life sen-tences.
• The length of time served for paroled lifers with first-degree murder convictions has increased from an average of 17.6 years for the three paroled between 1991 and 1999 to 28.6 years for the 27 paroled between 2000 and 2013.
• A total of four lifers with first-degree murder convictions were paroled between 1991 and 2005. For 11 years in this 15-year period, no such lifers were paroled. Between 2006 and 2013, an average of three such lifers were paroled annually.
• The number of lifer parole hearings has increased gradually from 36 in 1991 to 59 in 2013. The parole grant rate increased from 3% between 1991 and 2007 to 13% between 2008 and 2013.
OVERVIEW AND POLICY HIGHLIGHTS Colorado prisons had 2,105 individuals with parole-el-igible life sentences in 2012, constituting 9.8% of the state prison population.1 In 2012, 81% of Colorado’s parole-eligible lifer population had sex offense convic-tions while 13% had murder convictions.2
Among life-sentenced individuals convicted of the Class One felonies of first-degree murder and first-de-gree kidnapping, and those convicted of certain habit-ual offender enhancements, the period of years that must be served before parole eligibility increased start-ing in 1977. For such crimes committed before 1977, the minimum sentence before parole eligibility was 10 years. For such crimes committed between 1977 and 1985, parole eligibility began after 20 years. For such crimes committed between 1985 and 1991, parole eligibility begins after 40 years. Class One felonies committed on or after September 20, 1991 receive parole-ineligible life sentences.3
Colorado’s parole board consists of seven full-time members who are appointed by the governor and confirmed by the senate. Terms are three years and members can serve consecutive terms.4 Certain re-quirements are necessary to serve on the board, as outlined in statute: “The board shall be composed of representatives from multidisciplinary areas of exper-tise. Two members shall have experience in law en-forcement and one member shall have experience in offender supervision, including parole, probation, or community corrections. Four members shall have experience in other relevant fields.”5 Colorado has a statutory presumption in favor of granting parole to certain individuals including those with certain drug convictions and Immigration and Customs Enforce-ment detainees.6

11The Sentencing Project • 1705 DeSales Street NW, 8th Floor • Washington, D.C. 20036 • sentencingproject.org
DELAYING A SECOND CHANCE: STATE PROFILES
NUMBER PAROLED AND TIME SERVEDA total of four lifers with first-degree murder convictions were paroled between 1991 and 2005. For 11 years in this 15-year period, no such lifers were paroled. Between 2006 and 2013, an average of three such lifers were paroled annually.
Lifers with first-degree murder convictions paroled between 1991 and 2013 served increasingly longer sentences. The three such individuals paroled between 1991 and 1999 had served an average of 17.6 years. Average time served increased to 28.6 years for the 27 who were paroled between 2000 and 2013. Average time served for the three such individuals who were paroled in 2013 was the highest yet, at 31.6 years.
Time Served for Paroled Lifers with First-Degree Murder Convictions in Colorado, 1991-2013
LIFER PAROLE HEARINGS AND GRANT RATESBetween 1991 and 1999, Colorado conducted an average of 29 parole hearings annually for the life-sen-tenced population. Between 2000 and 2008, this number increased to 50 hearings per year, on average. Between 2009 and 2013, this average increased further to 67 hearings per year.
Between 1991 and 2007, 3% of conducted hearings resulted in parole grants. The grant rate then increased to 13% between 2008 and 2013.
1991
1992
1993
1994
1995
1996
1997
1998
1999
2000
2001
2002
2003
2004
2005
2006
2007
2008
2009
2010
2011
2012
2013
1 1 0 0 0 0 0 1 0 0 0 0 0 1 0 1 2 3 5 4 5 3 3
Number of Paroled Lifers with First-Degree Murder Convictions in Colorado, 1991-2013
0
5
10
15
20
25
30
35
2013
2012
2011
2010
2009
2008
2007
2006
2005
200
4
2003
2002
2001
2000
1999
1998
1997
1996
1995
1994
1993
1992
1991
Year
s

12The Sentencing Project • 1705 DeSales Street NW, 8th Floor • Washington, D.C. 20036 • sentencingproject.org
DELAYING A SECOND CHANCE: STATE PROFILES
1 Nellis, A. (2013). Life goes on: The historic rise in life sentences in America. Washington, DC: The Sentencing Project. Retrieved from: http://sen-tencingproject.org/wp-content/uploads/2015/12/Life-Goes-On.pdf
2 Nellis, 2013. Another 3% were convicted of aggravated assault, robbery, or kidnapping and 2% were convicted of property crimes.
3 Colo. Rev. Stat. § 17-22.5-104. See also Colorado Department of Cor-rections (2004). Offenders serving life sentences. Denver: Colorado De-partment of Corrections.
4 Colo. Rev. Stat. § 17-2-201
Number of Lifer Parole Hearings and Grant Rates in Colorado, 1991-2013
0
10
20
30
40
50
60
70
80
2013
2012
2011
2010
2009
2008
2007
2006
2005
200
4
2003
2002
2001
2000
1999
1998
1997
1996
1995
1994
1993
1992
1991
Granted parole
Denied parole
Grant rate
8%
18%
11%
11
6% 11%
7%
0% 0% 0% 0% 0% 0%
8% 2% 2%0%
4% 2%
5% 4%
14% 12
%
12%
12% 17
%
8%
Num
ber o
f hea
rings
5 Colo. Rev. Stat. § 17-2-2016 O’Keefe, M. & Barr, B. (2013). Presumptive parole: FY 2013 report.
Colorado State Board of Parole. Retrieved from: https://www.colorado.gov/pacific/sites/default/files/Presumptive%20Parole%20Report%20FY%2013.pdf.

13The Sentencing Project • 1705 DeSales Street NW, 8th Floor • Washington, D.C. 20036 • sentencingproject.org
DELAYING A SECOND CHANCE: STATE PROFILES
ConnecticutKEY FINDINGS • In 1981, Connecticut significantly restricted the imposition of parole-eligible life sentences. For lifers
convicted of murder prior to this date, time served has increased from 13.6 years for the three who were paroled in 1995 and 1996 to 30.4 years for the 26 who were paroled between 1999 and 2013. The shrinking pool of parole-eligible lifers may be partly driving the growth in time served over this period.
• With very few lifer parole hearings each year—on average, three per year from 1994 to 2013—the annual grant rate has often varied between 0% and 100%. Of the 51 lifer parole hearings conducted during this period, 29 resulted in a parole grant. Between 2010 and 2013, the number of hearings increased slightly to an average of eight per year.
Time Served for Paroled Lifers with Murder Convictions in Connecticut, 1994-2013
Number of Lifers with Murder Convictions Paroled in Connecticut, 1994-2013
1994 1995 1996 1997 1998 1999 2000 2001 2002 2003 2004 2005 2006 2007 2008 2009 2010 2011 2012 2013
0 1 2 0 0 1 1 1 1 0 1 2 2 0 3 1 2 6 3 2
OVERVIEW AND POLICY HIGHLIGHTS Connecticut prisons held 289 individuals with parole-el-igible life sentences in 2012, constituting 2.3% of the state’s prison population.1
Effective July 1, 1981, Connecticut shifted from an indeterminate to a determinate sentencing structure,
until reintroducing parole for certain convictions in 1990. 2 The state eliminated parole for individuals convicted of murder, capital felony, felony murder, arson murder, or aggravated sexual assault in the first degree.3 Individuals convicted of these crimes prior to July 1,
0
5
10
15
20
25
30
35
40
2013
2012
2011
2010
2009
2008
2007
2006
2005
200
4
2003
2002
2001
2000
1999
1998
1997
1996
1995
1994
14.0 13.3
33.9
30.6
25.3
33.4
22.324.2
38.9
28.0 28.3 27.7
31.6 32.1 32.8
Year
s

14The Sentencing Project • 1705 DeSales Street NW, 8th Floor • Washington, D.C. 20036 • sentencingproject.org
DELAYING A SECOND CHANCE: STATE PROFILES
1981, remain eligible for parole—and these are the people for whom data were provided. This analysis does not include life-sentenced individuals with crim-inal attempt or conspiracy to murder convictions since 1981, who remain parole-eligible.4
In 2015, Connecticut abolished juvenile life without parole sentences.5 S.B. 796 (2015) created new youth-specific criteria for parole eligibility.
Time served for the 26 lifers with murder convictions paroled between 1999 and 2013 averaged 30.4 years— with annual averages ranging from 22.3 to 38.9 years. In contrast, the three who were paroled in 1995 and 1996 had served an average of 13.6 years.
Number of Lifer Parole Hearings and Grant Rates in Connecticut, 1994-2013
Note: Analysis is limited to those who received parole-eligible life sentences prior to 1981.
LIFER PAROLE HEARINGS AND GRANT RATESConnecticut has conducted few lifer parole hearings: on average, three per year from 1994 to 2013. As a result, the annual grant rate often varies between 0% and 100%. Of the 51 lifer parole hearings conducted during this period, 29 resulted in a parole grant. Between 2010 and 2013, the number of hearings has increased slightly to an average of eight per year. Of the 23 lifer parole hearings conducted during this period, 10 have resulted in a parole grant.
1 Nellis, A. (2013). Life goes on: The historic rise in life sentences in America. Washington, DC: The Sentencing Project. Retrieved from: http://sen-tencingproject.org/wp-content/uploads/2015/12/Life-Goes-On.pdf
2 Coppolo, G. (2008, February 14). Parole during the 1980s. Retrieved January 19, 2016, from https://www.cga.ct.gov/2008/rpt/2008-R-0126.htm.
3 Conn. Gen. Stat. § 54-125a(b)(1); Conn. Gen. Stat. § 53a-35b.
0
1
2
3
4
5
6
7
8
2013
2012
2011
2010
2009
2008
2007
2006
2005
200
4
2003
2002
2001
2000
1999
1998
1997
1996
1995
1994
100%
100%
100%
100%
100%
100%
100%
100%
0% 0% 0%
67%
29%
75%
13%
43%
Denied parole
Granted parole
Grant rate
Num
ber o
f hea
rings
4 Correspondence with the Planning and Research Division of the Con-necticut Board of Pardons & Parole.
5 See: An Act Concerning Lengthy Sentences for Crimes Committed by a Child or Youth and the Sentencing of a Child or Youth Convicted of Certain Felony Offenses, S. 796, 2015 Gen. Assem. (Conn.). Retrieved from https://www.cga.ct.gov/2015/ACT/PA/2015PA-00084-R00SB-00796-PA.htm

15The Sentencing Project • 1705 DeSales Street NW, 8th Floor • Washington, D.C. 20036 • sentencingproject.org
DELAYING A SECOND CHANCE: STATE PROFILES
FloridaKEY FINDINGS • By 1995, Florida legislators had effectively eliminated the sentence of life with the possibility of parole,
though since 2014 people convicted under age 18 for crimes that carried mandatory life without parole sentences have been eligible for alternative sentences. Parole-eligible lifers must serve 25 years before they can be released. In 2010, wait times for parole consideration re-interviews was increased from within five years to within seven years for certain convictions.
• In 2016, the Florida Supreme Court ruled that the Florida Commission on Offender Review, which sets parole dates based on guidelines that are statutorily required to give primary weight to the severity of the crime and criminal history, does not offer a meaningful chance of being paroled as required for those convicted as juveniles.
• Between 2005 and 2014, average time served for paroled Florida lifers with first-degree murder con-victions increased slightly, from 27.4 to 29.4 years (based on 14 releases in each of those years). Average time served for paroled lifers with second-degree murder convictions has ranged between 22.3 years (based on five releases in 2008) and 34.3 years (based on five releases in 2007).
• In 2014 and some preceding years, paroled lifers convicted of second-degree murder had served longer sentences than those paroled with first-degree murder convictions.
• Florida conducts a small number of lifer parole hearings relative to the size of its lifer population, averaging 65 hearings annually between 2006 and 2014, and falling well below this average in 2013 and 2014. Perhaps because of this small number of hearings, the state has had a relatively high grant rate, in the range of 39% to 68%.
OVERVIEW AND POLICY HIGHLIGHTS In Florida, the 4,157 individuals with parole-eligible life sentences constituted 4.2% of the state’s prison pop-ulation in 2012.1 Almost twice as many people were serving sentences of life without the possibility of parole.2
Over the past few decades, Florida legislators have enacted a number of changes that have delayed parole eligibility for lifers, and eventually eliminated this sen-tence for adults. In 1983, Florida abolished parole except for capital crimes.3 Individuals who received life sentences as a result of a capital crime would henceforth be eligible for parole after serving 25 years.4 Legislative changes in 1994 and 1995 effectively elim-inated parole for all capital offenses as well, though since 2014 people convicted under age 18 may receive
other sentences and those already sentenced may be resentenced.5 In 2010, the state increased the waiting period for parole consideration re-interviews from within five years to within seven years for those con-victed of murder, attempted murder, sexual battery, or attempted sexual battery.6
In 2016, the Florida Supreme Court ruled that because the state’s parole process precluded the possibility of parole for an individual who had received a mandato-ry life sentence as a juvenile, it violated the U.S. Supreme Court’s requirement to give individual sen-tencing consideration to juveniles. 7 Angelo Atwell had been sentenced to life imprisonment with the possi-bility of parole after 25 years for having committed first-degree murder in 1990. Based on parole guidelines

16The Sentencing Project • 1705 DeSales Street NW, 8th Floor • Washington, D.C. 20036 • sentencingproject.org
DELAYING A SECOND CHANCE: STATE PROFILES
that are statutorily required to give primary weight to the severity of the crime and criminal history, the Florida Commission on Offender Review had determined that Atwell could not be paroled until 2130, which the Court noted was “one hundred and forty years after the crime and far exceeding Atwell’s life expectancy.” 8
According to the Florida Commission on Offender Review, life-sentenced individuals may not be present at their parole hearings, but their legal representative and family/friends may attend. A representative of the parole commission visits the incarcerated individual to conduct an interview, the recording of which is re-viewed by the parole commissioners and contributes to their votes.
2005
2006
2007
2008
2009
2010
2011
2012
2013
2014
First-degree murder 14 12 3 8 8 13 15 12 14 14
Second-degree murder 4 10 5 5 8 5 12 11 3 2
0
5
10
15
20
25
30
35
2014201320122011201020092008200720062005
First-degree murder
Second-degree murder
Year
s
Time Served for Paroled Lifers with Murder Convictions in Florida, 2005-2014
Number of Paroled Lifers with Murder Convictions in Florida, 2005-2014
NUMBER PAROLED AND TIME SERVEDBetween 2005 and 2014, average time served for paroled lifers convicted of first-degree murder in-creased slightly, from 27.4 to 29.4 years. Between 2005 and 2008, average time served for paroled lifers with second-degree murder convictions reached a high of 34.0 years and dropped back to 22.3 and years. It then climbed gradually to 33.4 years in 2014.
In the years when time served for those paroled with second-degree murder convictions exceeded 30 years (2006, 2007, and 2014), these individuals had served longer sentences than those paroled with first-degree murder convictions.
LIFER PAROLE HEARINGS AND GRANT RATESBetween 2006 and 2012, there were on average 72 lifer parole hearings conducted annually. In 2013 and 2014, this average fell to 39. Throughout this period, the state has had a relatively high annual grant rate, ranging from 39% to 68%.
Number of Lifer Parole Hearings and Grant Rates in Florida, 2006-2014
1 Nellis, A. (2013). Life goes on: The historic rise in life sentences in America. Wash-ington, DC: The Sentencing Project. Retrieved from: http://sentencingproject.org/wp-content/uploads/2015/12/Life-Goes-On.pdf
2 Nellis, 20133 Florida Department of Corrections Bureau of Research and Data Analysis. (2003,
March). Historical summary of sentencing and punishment in Florida. Retrieved from http://www.dc.state.fl.us/pub/history/
4 Capital felonies include: first-degree murder; sexual battery upon a child less than 12 years old; drug trafficking; and the killing of another by distribution of cocaine or opium or derivatives. Florida Commission on Offender Review. (2015, December). Annual report 2015. Retrieved from https://www.fcor.state.fl.us/docs/reports/FCORannualreport201415.pdf
5 Florida Department of Corrections Bureau of Research and Data Analysis, 2014; Fla. Stat. § 775.082; Fla. Stat. § 921.1402. A report by the Robina Institute of Criminal Law and Criminal Justice confirms that “Florida currently practices discretionary release only for offenders who were sentenced prior to the effective
0
20
40
60
80
100
201420132012201120102009200820072006
Denied parole
Granted parole
53%
42% 47
% 47%
57%
68%
73%
54%
64%
Grant rate
Num
ber o
f hea
rings
date of the determinate sentencing statute” and not for incarcerated individuals whose crimes were committed after 1994. See: Alper, M. E. (2016). By the numbers: Parole release and revocation across 50 states. Retrieved from Robina Institute of Criminal Law and Criminal Justice website: https://robinainstitute.umn.edu/publications/numbers-parole-release-and-revocation-across-50-states, p. 33
6 Florida Commission on Offender Review. (2014, December). Annual report 2014. Retrieved https://www.fcor.state.fl.us/docs/reports/FCORannualreport201314.pdf; Florida Commission on Offender Review. (2004, December). Annual report 2003-2004. Retrieved from https://www.fcor.state.fl.us/docs/reports/FCORan-nualreport200304.pdf
7 Ovalle, D. (2016, May 26). Ruling gives hundreds of juvenile murderers shot at new sentences. Miami Herald, Broward County. Retrieved from http://www.mi-amiherald.com/news/local/community/broward/article80040602.html; Atwell v. Florida, No. SC14-193 (Fla. May 26, 2016).
8 Atwell v. Florida, No. SC14-193 (Fla. May 26, 2016), p. 2.

17The Sentencing Project • 1705 DeSales Street NW, 8th Floor • Washington, D.C. 20036 • sentencingproject.org
DELAYING A SECOND CHANCE: STATE PROFILES
GeorgiaKEY FINDINGS • Georgia ranks fourth in the nation in the size of its parole-eligible lifer population. Since 1995, the
state has enacted statutory changes that delay parole eligibility for lifers convicted of serious violent felonies, gradually increasing the required minimum sentence from seven to 30 years.
• In 2015, time served for paroled lifers with first-degree murder convictions was 27.2 years, slightly above the averages for the two preceding years for which data were provided.
• The state increased the average annual number of lifer parole hearings from about 700 between 2001 and 2008 to about 1,000 between 2010 and 2014. During these periods, the parole grant rate fell from 23% to 19%.
OVERVIEW AND POLICY HIGHLIGHTSGeorgia ranks fourth in the nation in the size of its parole-eligible lifer population, with 7,125 people serving this sentence in 2012—12.7% of the state’s prison population.1 In 2016, 4,852 individuals were serving parole-eligible life sentences for serious violent felonies, also known as the “seven deadly sins”: armed robbery, kidnapping, rape, murder, aggravated sodomy, aggravated sexual battery, and aggravated child mo-lestation.2
Since 1995, Georgia has enacted statutory changes that delay parole eligibility for lifers convicted of a “seven deadly sin”:3
• If the crime was committed prior to 1995, the in-dividual is likely eligible for parole after serving seven years.
• If the crime was committed between 1995 and July 1, 2006, the individual is eligible for parole after serving 14 years.
• If the crime was committed on or after July 1, 2006, the individual is eligible for parole after serving 30 years.
In a 1998 press release titled “More Violent-Crime Lifers Die in Prison than Are Paroled,” the Georgia State Board of Pardons and Parole stated: “Parole for a life sentence is a rare commodity.”4
Those who are convicted of a second “seven deadly sin” offense receive mandatory sentences of life without the possibility of parole.5 A 2008 Department of Corrections report noted (emphasis in original):6
Georgia’s ‘Seven Deadly Sins’ law, for those seven crimes, is the toughest in the nation. Not three strikes, but two—and the second strike results in life without possibility of parole.
Time Served for Paroled Lifers with First-Degree Murder Convictions* in Georgia, 2013-2015
2013 2014 2015
41 43 65
Number of Paroled Lifers with First-Degree Murder Convictions* in Georgia, 2013-2015
* “Murder” convictions are distinct from “second-degree murder” convictions in Georgia and are similar to “first-degree murder” convictions in other states.
0
5
10
15
20
25
30
201520142013
25.4 24.527.2
Year
s

18The Sentencing Project • 1705 DeSales Street NW, 8th Floor • Washington, D.C. 20036 • sentencingproject.org
DELAYING A SECOND CHANCE: STATE PROFILES
LIFER PAROLE HEARINGS AND GRANT RATESSince 2001, the number of lifer parole hearings has increased while the grant rate has fallen.7 Lifer parole hearings increased from an annual average of 714 between 2001 and 2008 to 1,027 between 2010 and 2014 (2009 data were unavailable). Between 2001 and 2008, annual parole grant rates fluctuated considerably between 15% and 30% (averaging 23%). This range has since fallen: between 2010 and 2014, grant rates have been between 11% and 24% (averaging 19%).
1 Only California, New York, and Texas have larger parole-eligible lifer populations. Nellis, A. (2013). Life goes on: The historic rise in life sen-tences in America. Washington, DC: The Sentencing Project. Retrieved from: http://sentencingproject.org/wp-content/uploads/2015/12/Life-Goes-On.pdf
2 Figure provided by Georgia Department of Corrections; O.C.G.A. § 17-10-6.1.
3 State Board of Pardons and Paroles. (n.d.). The parole process in Georgia. Retrieved September 30, 2016, from https://pap.georgia.gov/parole-pro-cess-georgia-0; State Board of Pardons and Paroles. (n.d.). Life sen-tences. Retrieved September 30, 2016, from https://pap.georgia.gov/life-sentences
Number of Lifer Parole Hearings and Grant Rates in Georgia, 2001-2014
Note: Data not available for 2009
NUMBER PAROLED AND TIME SERVEDIn Georgia, the crime of murder is distinct from sec-ond-degree murder and is comparable to first-degree murder in other states. Time served for lifers with such murder convictions paroled between 2013 and 2015 has averaged 25.9 years. The annual number of such individuals paroled increased from an average of 42 in 2013 and 2014 to 65 in 2015.
0
300
600
900
1200
1,500
20142013201220112010200920082007200620052004200320022001
Denied parole
Granted parole
19% 27
%
30%
15% 28
%
17%
21% 30
%
20%
24%
21%
11%
19%
Grant rate
Num
ber o
f hea
rings
N/A
4 News release, Georgia State Board of Pardons and Paroles, “More Vi-olent-Crime Lifers Die in Prison than Are Paroled,” June 1, 1998, quoted in Mauer, M., King, R., & Young, M. (2004). The meaning of ‘life’: Long prison sentences in context. Washington, DC: The Sentencing Project. Retrieved from https://www.opensocietyfoundations.org/sites/default/files/lifers.pdf
5 Carr, T. S. (2008, May 14). “Truth in sentencing” in Georgia. Retrieved September 30, 2016, from Georgia Department of Corrections website: http://www.dcor.state.ga.us/sites/all/files/pdf/Research/Standing/Truth_in_sentencing.pdf
6 Carr, 20087 Number of lifer parole hearings and grant rates were drawn from the
annual reports of the Georgia Board of Pardons and Paroles.
19The Sentencing Project • 1705 DeSales Street NW, 8th Floor • Washington, D.C. 20036 • sentencingproject.org
DELAYING A SECOND CHANCE: STATE PROFILES
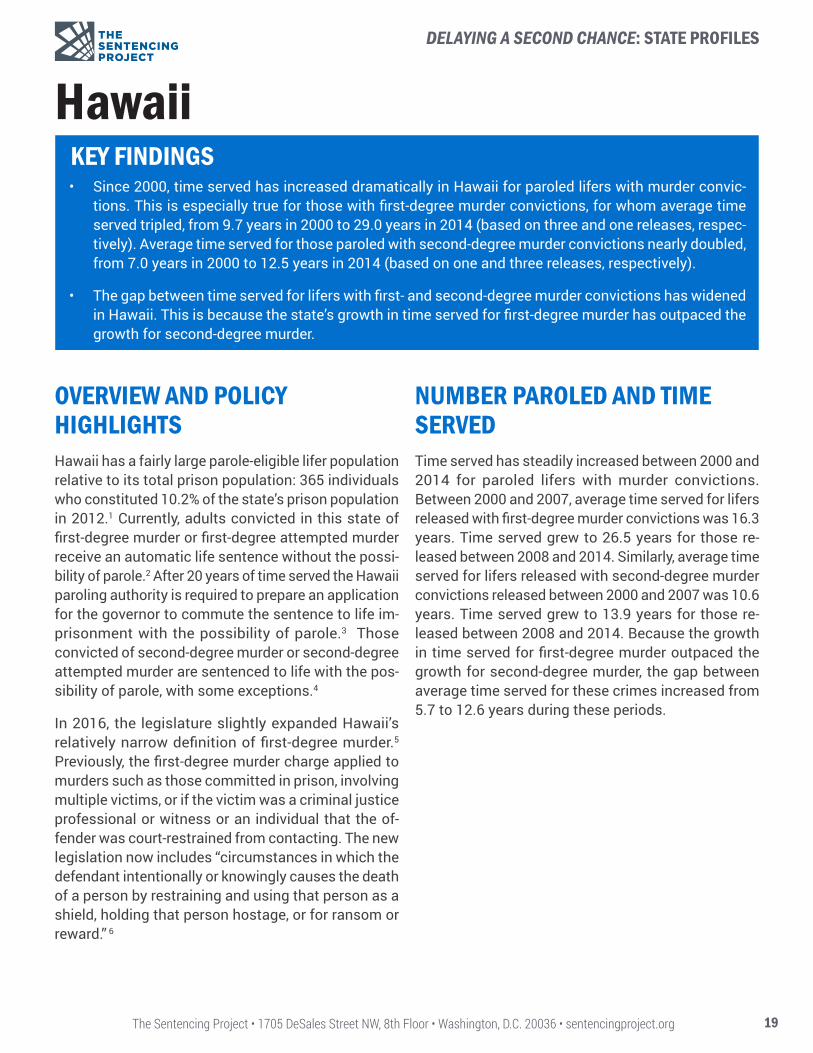
HawaiiKEY FINDINGS • Since 2000, time served has increased dramatically in Hawaii for paroled lifers with murder convic-
tions. This is especially true for those with first-degree murder convictions, for whom average time served tripled, from 9.7 years in 2000 to 29.0 years in 2014 (based on three and one releases, respec-tively). Average time served for those paroled with second-degree murder convictions nearly doubled, from 7.0 years in 2000 to 12.5 years in 2014 (based on one and three releases, respectively).
• The gap between time served for lifers with first- and second-degree murder convictions has widened in Hawaii. This is because the state’s growth in time served for first-degree murder has outpaced the growth for second-degree murder.
OVERVIEW AND POLICY HIGHLIGHTS Hawaii has a fairly large parole-eligible lifer population relative to its total prison population: 365 individuals who constituted 10.2% of the state’s prison population in 2012.1 Currently, adults convicted in this state of first-degree murder or first-degree attempted murder receive an automatic life sentence without the possi-bility of parole.2 After 20 years of time served the Hawaii paroling authority is required to prepare an application for the governor to commute the sentence to life im-prisonment with the possibility of parole.3 Those convicted of second-degree murder or second-degree attempted murder are sentenced to life with the pos-sibility of parole, with some exceptions.4
In 2016, the legislature slightly expanded Hawaii’s relatively narrow definition of first-degree murder.5 Previously, the first-degree murder charge applied to murders such as those committed in prison, involving multiple victims, or if the victim was a criminal justice professional or witness or an individual that the of-fender was court-restrained from contacting. The new legislation now includes “circumstances in which the defendant intentionally or knowingly causes the death of a person by restraining and using that person as a shield, holding that person hostage, or for ransom or reward.” 6
NUMBER PAROLED AND TIME SERVEDTime served has steadily increased between 2000 and 2014 for paroled lifers with murder convictions. Between 2000 and 2007, average time served for lifers released with first-degree murder convictions was 16.3 years. Time served grew to 26.5 years for those re-leased between 2008 and 2014. Similarly, average time served for lifers released with second-degree murder convictions released between 2000 and 2007 was 10.6 years. Time served grew to 13.9 years for those re-leased between 2008 and 2014. Because the growth in time served for first-degree murder outpaced the growth for second-degree murder, the gap between average time served for these crimes increased from 5.7 to 12.6 years during these periods.

20The Sentencing Project • 1705 DeSales Street NW, 8th Floor • Washington, D.C. 20036 • sentencingproject.org
DELAYING A SECOND CHANCE: STATE PROFILES
1 Nellis, A. (2013). Life goes on: The historic rise in life sentences in America. Washington, DC: The Sentencing Project. Retrieved from: http://sen-tencingproject.org/wp-content/uploads/2015/12/Life-Goes-On.pdf
2 In 2014, Hawaii eliminated juvenile life without parole sentences. Those convicted of first-degree murder and first-degree attempted murder will be sentenced to life with the possibility of parole. Khon2 Web Staff. (2014, July 2). Hawaii abolishes life without parole sentence for juveniles [Newsgroup post]. Retrieved from http://khon2.com/2014/07/02/ha-waii-abolishes-life-without-parole-sentence-for-juveniles/
3 Haw. Rev. Stat. Ann. § 706-656
Number of Lifers with Murder Convictions Paroled in Hawaii, 2000-2014
2000 2001 2002 2003 2004 2005 2006 2007 2008 2009 2010 2011 2012 2013 2014
First-degree murder 3 1 1 1 1 4 0 5 2 3 1 0 1 1 1
Second-degree murder 1 4 1 1 1 2 4 6 2 4 4 3 2 3 3
Time Served for Paroled Lifers with Murder Convictions in Hawaii, 2000-2014
LIFER PAROLE HEARINGS AND GRANT RATESData were not provided on lifer parole hearing out-comes.
0
5
10
15
20
25
30
201420132012201120102009200820072006200520042003200220012000
First-degree murder
Second-degree murder
Year
s
4 Haw. Rev. Stat. Ann. § 706-656. The court may sentence an individual to life without parole for second degree murder if the crime was espe-cially “heinous” or if the person was previously convicted of murder. See: Haw. Rev. Stat. Ann. § 706-606.5.
5 Khon2 Web Staff. (2016, July 6). New law broadens definition of first-de-gree murder in Hawaii [Newsgroup post]. Retrieved from http://khon2.com/2016/07/06/new-law-broadens-definition-of-first-degree-murder-in-hawaii/
6 Khon2 Web Staff, 2016

21The Sentencing Project • 1705 DeSales Street NW, 8th Floor • Washington, D.C. 20036 • sentencingproject.org
DELAYING A SECOND CHANCE: STATE PROFILES
IllinoisKEY FINDINGS • Having eliminated parole for life sentences in 1977, Illinois reported having only five individuals still
serving parole-eligible life sentences in 2014.
• Between 1989 and 2014, death in prison was the most likely outcome for the 16 parole-eligible lifers for whom data were provided. Ten of these individuals died in prison, having served an average sen-tence of 33.9 years. Four remained incarcerated in 2014, having served an average of 48.3 years until that point. Only two of these lifers were paroled, one in 2005 and the other in 2007, having served an average sentence of 45.2 years.
OVERVIEW AND POLICY HIGHLIGHTSIn 2014, there were five individuals serving parole-eli-gible life sentences in Illinois, constituting 0.1% of the state’s prison population.1 A much larger number of people, 1,609, were serving sentences of life without the possibility of parole (3.3% of the prison population).2
In 1977, Illinois shifted to a determinate sentencing system and eliminated parole for life sentences.3 In 1995, the state passed truth-in-sentencing policies requiring those convicted of murder to serve 100% of
their sentence, and those convicted of other violent crimes to serve 85% of their sentence. Prior to this policy change, individuals sentenced to murder typi-cally served less than 40% of their sentence as a result of various good time credits.4 The sentence for first-de-gree murder is 20 to 60 years, or life without parole (or death, until 2011 when the state abolished the death penalty). In 2015, the legislature eliminated mandato-ry life without parole sentences for juveniles, as re-quired by Miller v. Alabama in 2012.5
Average Time Served Among Lifers in Illinois , 1989-2014
0 10 20 30 40 50
Released
Died
Remained incarcerated
45.2
33.9
48.3
Years

22The Sentencing Project • 1705 DeSales Street NW, 8th Floor • Washington, D.C. 20036 • sentencingproject.org
DELAYING A SECOND CHANCE: STATE PROFILES
1 Illinois Department of Corrections. (2015, June). Fiscal year 2014 annual report (D. Short, Ed.). Retrieved from https://www.illinois.gov/idoc/re-portsandstatistics/Documents/FY2014%20Annual%20Report.pdf
2 Illinois Department of Corrections, 2015 3 Illinois State Commission on Criminal Justice and Sentencing Reform.
(n.d.). Illinois prison overview. Retrieved October 3, 2016, from http://www.icjia.org/cjreform2015/research/illinois-prison-overview.html
4 The impact of Illinois’ truth-in-sentencing law on sentence lengths, time to serve and disciplinary incidents of convicted murderers and sex offenders (D. E. Olson, M. Seng, J. Boulger, & M. McClure, Comps.). (2009, June).
Retrieved from Illinois Criminal Justice Information Authority website: http://www.icjia.state.il.us/assets/pdf/ResearchReports/FINAL%20REPORT%20The%20Impact%20of%20Illinois%20Truth-in-Sentenc-ing%20Law%200609.pdf
5 H.B. 2471 (2015)6 We did not calculate parole grant rates due to the challenges of inter-
preting the data. 7 This count of four is one less than the population count cited above
from the Department of Corrections annual report.
LIFER PAROLE HEARINGS AND GRANT RATESData were provided for 16 life-sentenced individuals whose release required the parole board’s approval between 1989 and 2014.6 Only two of these individuals were paroled, one in 2005 and the other in 2007. Both began having parole hearings as early as 1988. Ten of the 16 parole-eligible lifers died while incarcerated, and four remained in prison in 2014.7
NUMBER PAROLED AND TIME SERVEDAverage time served for the two paroled lifers parole was 45.2 years (44.8 for the individual released in 2005 and 45.5 years for the individual released in 2007). Average time served for the 10 who died was 33.9 years (ranging from 15.3 years to 65.5 years). Finally, average time served for the four who remained incar-cerated in 2014 was 48.3 years (ranging from 39.1 years to 60.8 years).

23The Sentencing Project • 1705 DeSales Street NW, 8th Floor • Washington, D.C. 20036 • sentencingproject.org
DELAYING A SECOND CHANCE: STATE PROFILES
IowaKEY FINDINGS • Iowa, a state that eliminated parole for life sentences, has recently begun implementing reforms to
comply with the Supreme Court’s prohibition of life-without-parole sentences for many juveniles.
• Between 2011 and 2014, the state had a low grant rate for its small but growing number of lifer parole hearings, with annual grant rates between 0% and 13%
• During this period, the state paroled two individuals whose previous life-without-parole sentences for first-degree murder were modified to life with the possibility of parole. In 2013, an individual who was resentenced for a juvenile conviction was paroled, having served 17.9 years. In 2014, an individ-ual whose sentence for an adult conviction was commuted was paroled, having served 39.2 years.
OVERVIEW AND POLICY HIGHLIGHTS Iowa prisons had 45 people with parole-eligible life sentences in 2012, constituting 0.5% of its prison population.1 A much larger number of people, 635, were serving parole-ineligible life sentences—7.7% of the prison population.2 The state is one of six that has abolished parole for life sentences.3 First-degree murder is a Class A felony and carries a mandatory life without parole sentence.4 Individuals convicted of a Class A felony are eligible for parole only if the gov-ernor first commutes their sentence to a term of years.5 Legislators and the courts have taken several steps in recent years to create the possibility of parole for people convicted as juveniles, as described next.
To comply with Graham v. Florida, Iowa revised its laws in 2011 so that people convicted under age 18 of a Class A felony other than first-degree murder would not be sentenced to life without parole (LWOP).6 Instead, these individuals would be required to serve 25 years before they could be parole-eligible. In 2015, the legislature eliminated this requirement: Juveniles convicted of a Class A felony other than first-degree murder would be sentenced to life with the possibility of parole, with or without a minimum term of confine-ment determined by the court.7
To comply with Miller v. Alabama, Governor Terry Bran-stad commuted of all juvenile LWOP sentences for a Class A felony of first-degree murder to life with the
possibility of parole after serving 60 years.8 The Iowa Supreme Court effectively challenged this revised sentence in 2014’s State v. Lyle, when it struck down all mandatory minimum penalties for juveniles, includ-ing for those who had been previously sentenced.9 In 2015, Iowa passed new laws stipulating that juveniles convicted of first-degree murder could be sentenced to life without parole (with the possibility of a governor commutation), or life with the possibility of parole (with or without a minimum term of confinement determined by the court).10 In 2016, the Iowa Supreme Court ruled that life without parole sentences for juveniles amount-ed to cruel and unusual punishment and were therefore unconstitutional.11
NUMBER PAROLED AND TIME SERVEDBetween 2011 and 2014, the state paroled two indi-viduals whose previous life-without-parole sentences were modified to life with the possibility of parole. In 2013, an individual who was resentenced for a juvenile conviction was paroled, having served 17.9 years. In 2014, an individual whose sentence for an adult con-viction was commuted was paroled, having served 39.2 years. Both had been convicted of first-degree murder.

24The Sentencing Project • 1705 DeSales Street NW, 8th Floor • Washington, D.C. 20036 • sentencingproject.org
DELAYING A SECOND CHANCE: STATE PROFILES
1 Nellis, A. (2013). Life goes on: The historic rise in life sentences in America. Washington, DC: The Sentencing Project. Retrieved from: http://sen-tencingproject.org/wp-content/uploads/2015/12/Life-Goes-On.pdf
2 Nellis, 20133 Iowa Legislative Services Agency. (2015). Legislative Guide: Legal Services
Division. Retrieved from https://www.legis.iowa.gov/docs/publications/LG/14969.pdf
4 Iowa Code § 707.25 Iowa Code § 902.16 Iowa Legislative Services Agency, 20157 Iowa Legislative Services Agency, 2015
Number of Lifer Parole Hearings and Grant Rates in Iowa, 2011-2014
Time Served for Paroled Lifers in Iowa, 2011-2014
2011 2012 2013 2014
0 0 1 1
Number of Paroled Lifers in Iowa, 2011-2014
Note: One person released in both 2013 and 2014 .
0
10
20
30
40
2014201320122011
39.2
17.9
No releases
Year
s
LIFER PAROLE HEARINGS AND GRANT RATESIowa has had a low parole grant rate for its small but growing number of lifer parole hearings: an annual range of 0% to 13%.
0
2
4
6
8
10
12
2014201320122011
No hearings 0%
13%
9%
Denied parole
Granted parole
Grant rateNum
ber o
f hea
rings
8 Wiser, M. (2014, March 31). Branstad commutes life sentences for 38 Iowa juvenile murderers. The Gazette. Retrieved from http://www.the-gazette.com/2012/07/16/branstad-commutes-life-sentences-for-38-io-wa-juvenile-murderers
9 State v. Lyle, 854 N.W.2d 378 (Iowa 2014)10 Iowa Legislative Services Agency, 201511 Philipps, D. (2016, May 27). Iowa court rejects life without parole for
juveniles. New York Times. Retrieved from http://www.nytimes.com/2016/05/28/us/life-sentences-juveniles-iowa-isaiah-sweet.html?_r=0

25The Sentencing Project • 1705 DeSales Street NW, 8th Floor • Washington, D.C. 20036 • sentencingproject.org
DELAYING A SECOND CHANCE: STATE PROFILES
MaineKEY FINDINGS • Maine1 had four remaining parole-eligible lifers in 2016 that had been in prison for four decades. Their
first-degree murder convictions predated 1976, when the state abolished parole for life sentences.
OVERVIEW AND POLICY HIGHLIGHTSMaine has one of the smallest lifer populations in the country, with its four parole-eligible lifers constituting 0.2% of the state’s prison population in 2012.2 The state eliminated parole entirely for life sentences in 1976 and replaced it with determinate sentencing.3 Sentences for murder convictions have ranged from 25 years to life in prison without parole.4 In 2012, 55 people were serving sentences of life without the possibility of parole.5
NUMBER PAROLED AND TIME SERVEDGiven that the state’s four parole-eligible lifers were sentenced for first-degree murders committed before 1976, they had been incarcerated for four decades by 2016.
1 Data for this state received from Neale Duffett, former Chair of the State of Maine Parole Board.
2 Nellis, A. (2013). Life goes on: The historic rise in life sentences in America. Washington, DC: The Sentencing Project. Retrieved from: http://sen-tencingproject.org/wp-content/uploads/2015/12/Life-Goes-On.pdf
LIFER PAROLE HEARINGS AND GRANT RATESData were not provided on lifer parole hearing out-comes.
3 Anspach, D., Lehman, P., & Kramer, J. (1983). Maine rejects indetermina-cy - A case study of flat sentencing and parole abolition. National Institute of Justice.
4 Me. Rev. Stat. Ann. § 12515 Nellis, 2013

26The Sentencing Project • 1705 DeSales Street NW, 8th Floor • Washington, D.C. 20036 • sentencingproject.org
DELAYING A SECOND CHANCE: STATE PROFILES
MarylandKEY FINDINGS • Although a considerable percentage of Maryland’s prison population (9.8%) is sentenced to life with
the possibility of parole, the state did not parole any of these individuals between 1996 and 2014.
• Gubernatorial authority to reverse the Parole Commission’s decisions has all but eliminated the prac-tical possibility of parole for lifers in this state. Between 2006 and 2014, the Parole Commission recommended five parole-eligible lifers for parole, 66 for commutation, and eight for medical parole. Between 1996 and 2014, governors did not accept any of the Parole Commission’s parole recommen-dations and commuted only a handful of sentences.
• Maryland requires life-sentenced individuals to serve a minimum of 15 to 25 years before being con-sidered for release.
• Time served for the 26 lifers paroled between 1990 and 1995 was in the range of 18.3 and 21.9 years.
OVERVIEW AND POLICY HIGHLIGHTS A considerable percentage of Maryland’s prison pop-ulation, 9.8%, was serving a parole-eligible life sentence in 2012: 2,090 individuals.1
Parole-eligible lifers face three major hurdles to qual-ifying for parole:
• First, they must serve a minimum of 15 years—or 25 years for certain individuals convicted of first-de-gree murder—before being considered for release.2
• Second, the Parole Commission must recommend them for parole. Between 2006 and 2014, the Parole Commission recommended five parole-eligible lifers for parole; in addition, it recommended 66 for commutation and eight for medical parole.3
• Finally, Maryland is one of just five states where governors must approve the Parole Commission’s recommendation before an individual serving a life sentence can be paroled.4 Following a high-profile murder in 1993, Governor Parris Glendening initi-ated a policy of uniformly denying all lifer parole applications. The three governors in office between 1996 and 2014—Glendening, Robert Ehrlich, and
Martin O’Malley—did not accept any of the Parole Commission’s parole recommendations and com-muted a handful of recommended cases. Specifi-cally, Glendening commuted none, Ehrlich com-muted five, and O’Malley commuted three.5 Glen-dening later publicly expressed regret about his approach.6
In 2011, the General Assembly passed legislation re-quiring that the governor act upon the Parole Commis-sion’s recommendations within 180 days. A 2015 bill sought to eliminate gubernatorial approval of the Parole Commission’s decisions.7
In 2012, the Maryland Court of Appeals found in Unger v. State that a jury instruction used by Maryland courts until 1981 had denied defendants due process.8 Since then, over 130 elderly lifers have been released.9

27The Sentencing Project • 1705 DeSales Street NW, 8th Floor • Washington, D.C. 20036 • sentencingproject.org
DELAYING A SECOND CHANCE: STATE PROFILES
1990 1991 1992 1993 1994 1995 1996-2014
Number paroled – all lifers 2 0 12 7 1 4 0
Number paroled with murder convictions 2 0 12 5 0 3 0
1 Nellis, A. (2013). Life goes on: The historic rise in life sentences in America. Washington, DC: The Sentencing Project. Retrieved from: http://sen-tencingproject.org/wp-content/uploads/2015/12/Life-Goes-On.pdf
2 Md. Code Ann. § 7-301(d)3 Lomax, W., & Kumar, S. (2015, January). Still blocking the exit. Retrieved
from http://www.abell.org/sites/default/files/publications/afr-still-blockingexit215.pdf
4 The other states are: California, Louisiana, Oklahoma, and Washington. See: Weisberg, R., Mukamal, D. A., & Segall, J. D. Life in limbo. Retrieved from http://static.prisonpolicy.org/scans/SCJC_report_Parole_Release_for_Lifers.pdf; Washington State Office of the Attorney General. (2013, November 7). Washington Supreme Court issues 9-0 ruling in parole review case [Press release]. Retrieved from http://www.atg.wa.gov/news/news-releases/washington-supreme-court-issues-9-0-ruling-parole-review-case (See: Wash. Rev. Code Ann. § 9.95.160)
5 The Maryland Restorative Justice Institute and the ACLU of Maryland have produced profiles of many of the 79 people who were recommend-ed for release by the Maryland Parole Commission between 2006 and 2015 but were not released. Lomax & Kumar, 2015; correspondence with Walter Lomax.
6 Rodricks, D. (2011, February 20). Glendening: ‘Life means life’ absolut-
Time Served for All Paroled Lifers in Maryland, 1990-2014
*No length-of-stay data were available for this year
Number of Paroled Lifers in Maryland, 1990-2014
Note: Length-of-stay data were only provided for all lifers and was not available for the individual released in 1994.
NUMBER PAROLED AND TIME SERVEDBetween 1990 and 1995, 26 lifers were paroled. The annual average time served for these individuals was between 18.3 and 21.9 years.10 Twenty-two people in this group had murder convictions. Between 1996 and 2014, the state did not parole anyone with a parole-el-igible life sentence.
LIFER PAROLE HEARINGS AND GRANT RATESData were not provided on lifer parole hearing out-comes. See “Overview and Policy Highlights” section for an aggregate count of parole recommendations by the Parole Commission between 2006 and 2014 as well as gubernatorial actions between 1996 and 2014.
0
5
10
15
20
25
30
2014
2013
2012
2011
2010
2009
2008
2007
2006
2005
200
4
2003
2002
2001
2000
1999
1998
1997
1996
1995
1994
*
1993
1992
1991
1990
21.920.7
21.8
18.3
No releases
Year
s
ism was wrong. Baltimore Sun. Retrieved from http://articles.baltimore-sun.com/2011-02-20/news/bs-ed- rodr icks-g lendening-oped-20110220_1_life-without-parole-death-penalty-maryland-pa-role-commission
7 Rabner, N. (2015, February 20). Bill Would Remove Governor from De-cision-Making on Parole for Lifers. Capital News Service. Retrieved from http://cnsmaryland.org/2015/02/20/bill-would-remove-governor-from-decision-making-on-parole-for-lifers/
8 Unger v. State, 427 Md. 383 (2012)9 Siegel, R. & Ozug, M. (2016, February 18). From a life term to life on the
outside: When aging felons are freed. National Public Radio. Retrieved from http://www.npr.org/2016/02/18/467057603/from-a-life-term-to-life-on-the-outside-when-aging-felons-are-freed
10 For the years 1990-1995, we relied on data from the Office of Grants, Policy, and Statistics (GPS). The Maryland Parole Commission (MPC) reported a slightly different number of individuals released for these years but was unable to provide length-of-stay information. MPC staff cautioned that GPS data were maintained by non-MPC staff and could not be validated by their office. We decided to use these data since they contained length-of-stay information. There was no discrepancy between GPS and MPC data for the years 1996-2014.

28The Sentencing Project • 1705 DeSales Street NW, 8th Floor • Washington, D.C. 20036 • sentencingproject.org
DELAYING A SECOND CHANCE: STATE PROFILES
MassachusettsKEY FINDINGS • People serving a parole-eligible life sentence in Massachusetts qualify for parole after serving 15 to
25 years and may be required to wait up to five years for a subsequent hearing if they are denied parole at their initial hearing.
• Following a high-profile murder in 2010, Massachusetts’s then-governor overhauled the state’s parole process. Consequently, the release of parole-eligible lifers with second-degree murder convictions dropped precipitously in 2011, from an average of 28 annual releases in the previous five years to eight annually for the following three years. The total number of lifers granted parole, regardless of conviction, increased from five to 17 between 2011 and 2013.
• The parole grant rate for all parole-eligible lifers increased from 6% to 20% between 2011 and 2013. The grant rate in 2013 is estimated to be below the rate in 2010. Moreover, the grant rate fell back to 6% between October 2015 and May 2016.
• Between 2006 and 2013, time served for released lifers with second-degree murder convictions re-mained relatively stable, averaging 19.7 years.
OVERVIEW AND POLICY HIGHLIGHTSMassachusetts prisons held 930 people with parole-el-igible life sentences in 2012, constituting 9.1% of the state’s prison population.1 In addition, a significant number of people were serving parole-ineligible life sentences.
The state’s 1993 truth-in-sentencing law raised the point of parole eligibility for all sentences from one-third or two-thirds of the minimum term to the full minimum term.2 Currently, people serving parole-eligi-ble life sentences qualify for parole after serving 15 to 25 years.3 If the parole board denies parole after the initial hearing, the individual is provided with a subse-quent review hearing five years later, or earlier at the discretion of the board.
Following a high-profile killing of a police officer in December 2010, and a Boston Globe analysis of recid-ivism rates, then-Governor Deval Patrick overhauled the state’s parole process.4 His changes included appointing a former prosecutor to chair the parole
board—who adopted more stringent release guide-lines—and replacing five of the seven parole board members with new members, four of whom had law enforcement backgrounds.5
First-degree murder carries a mandatory sentence of life without parole for adults.6 As of December 24, 2013, individuals who committed first-degree murder under the age of 18 are eligible for parole after serving 20 to 30 years in prison.7 In 2014, legislators established a commission to study if and how the state should create a process for the parole board to evaluate the devel-opmental progress of parole-eligible lifers convicted as juveniles.8 In 2016, the commission issued a report concluding that “current practice and procedures are sufficient such that the creation of a specialized eval-uation process for all cases of murder committed by juveniles is not necessary.”9

29The Sentencing Project • 1705 DeSales Street NW, 8th Floor • Washington, D.C. 20036 • sentencingproject.org
DELAYING A SECOND CHANCE: STATE PROFILES
Time Served for Paroled Lifers with Second-Degree Murder Convictions in Massachusetts, 2006-2013
Number of Paroled Lifers with Second-Degree Murder Convictions in Massachusetts, 2006-2013
NUMBER PAROLED AND TIME SERVEDBetween 2006 and 2013, time served for paroled lifers with second-degree murder convictions remained stable, with released lifers having served an average of 19.7 years in prison during this period. However, the number of individuals paroled dropped precipitously during this period. Between 2006 and 2010, the state paroled between 24 and 32 people with second-degree murder convictions each year. But between 2011 and 2013, that number fell to 8 per year.
In addition, the average wait time for a parole decision after a hearing increased from 1.4 months in 2010 to 10.4 months in early 2013.10 Finally, while individuals who were paroled between 2006 and 2010 waited an average of 9.6 months to be released after being granted parole, this wait increased to almost one and a half years for those paroled between 2011 and 2013.
0
5
10
15
20
25
30
35
20132012201120102009200820072006
Num
ber o
f Peo
ple
0
5
10
15
20
25
20132012201120102009200820072006
Year
s
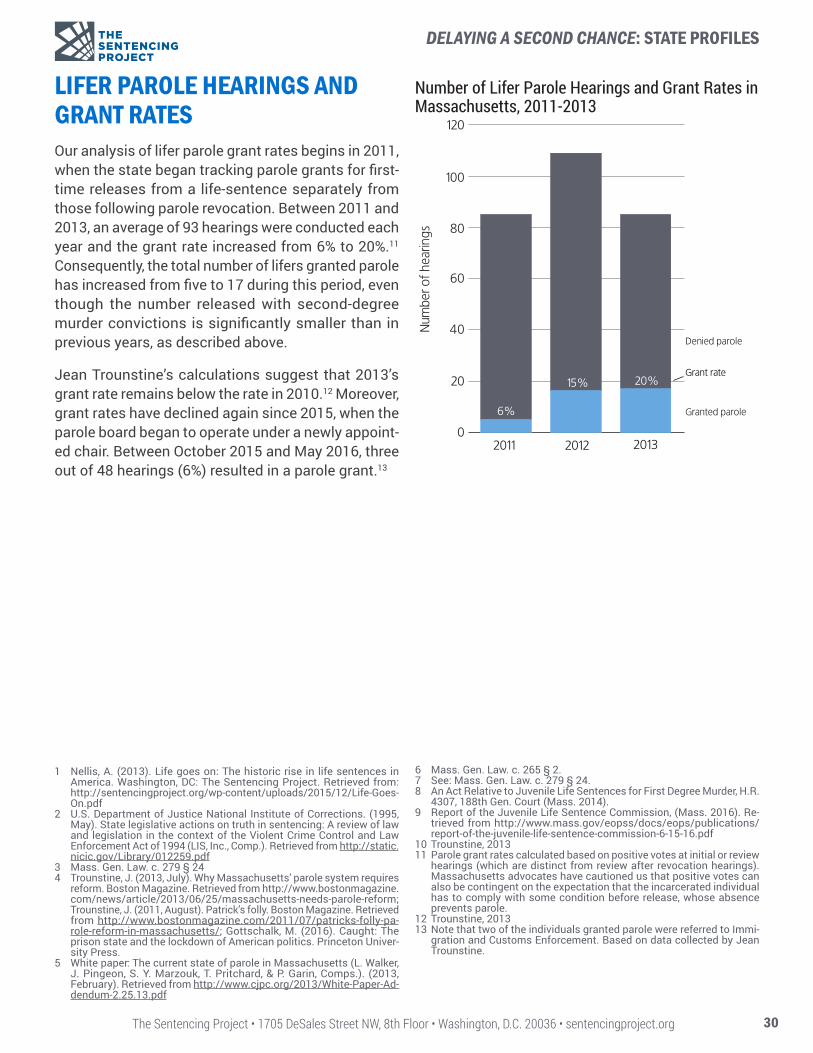
30The Sentencing Project • 1705 DeSales Street NW, 8th Floor • Washington, D.C. 20036 • sentencingproject.org
DELAYING A SECOND CHANCE: STATE PROFILES
1 Nellis, A. (2013). Life goes on: The historic rise in life sentences in America. Washington, DC: The Sentencing Project. Retrieved from: http://sentencingproject.org/wp-content/uploads/2015/12/Life-Goes-On.pdf
2 U.S. Department of Justice National Institute of Corrections. (1995, May). State legislative actions on truth in sentencing: A review of law and legislation in the context of the Violent Crime Control and Law Enforcement Act of 1994 (LIS, Inc., Comp.). Retrieved from http://static.nicic.gov/Library/012259.pdf
3 Mass. Gen. Law. c. 279 § 244 Trounstine, J. (2013, July). Why Massachusetts’ parole system requires
reform. Boston Magazine. Retrieved from http://www.bostonmagazine.com/news/article/2013/06/25/massachusetts-needs-parole-reform; Trounstine, J. (2011, August). Patrick’s folly. Boston Magazine. Retrieved from http://www.bostonmagazine.com/2011/07/patricks-folly-pa-role-reform-in-massachusetts/; Gottschalk, M. (2016). Caught: The prison state and the lockdown of American politics. Princeton Univer-sity Press.
5 White paper: The current state of parole in Massachusetts (L. Walker, J. Pingeon, S. Y. Marzouk, T. Pritchard, & P. Garin, Comps.). (2013, February). Retrieved from http://www.cjpc.org/2013/White-Paper-Ad-dendum-2.25.13.pdf
LIFER PAROLE HEARINGS AND GRANT RATESOur analysis of lifer parole grant rates begins in 2011, when the state began tracking parole grants for first-time releases from a life-sentence separately from those following parole revocation. Between 2011 and 2013, an average of 93 hearings were conducted each year and the grant rate increased from 6% to 20%.11 Consequently, the total number of lifers granted parole has increased from five to 17 during this period, even though the number released with second-degree murder convictions is significantly smaller than in previous years, as described above.
Jean Trounstine’s calculations suggest that 2013’s grant rate remains below the rate in 2010.12 Moreover, grant rates have declined again since 2015, when the parole board began to operate under a newly appoint-ed chair. Between October 2015 and May 2016, three out of 48 hearings (6%) resulted in a parole grant.13
0
20
40
60
80
100
120
6%
15% 20%
Granted parole
Denied parole
2011 2012 2013
Num
ber o
f hea
rings
Grant rate
Number of Lifer Parole Hearings and Grant Rates in Massachusetts, 2011-2013
6 Mass. Gen. Law. c. 265 § 2. 7 See: Mass. Gen. Law. c. 279 § 24.8 An Act Relative to Juvenile Life Sentences for First Degree Murder, H.R.
4307, 188th Gen. Court (Mass. 2014).9 Report of the Juvenile Life Sentence Commission, (Mass. 2016). Re-
trieved from http://www.mass.gov/eopss/docs/eops/publications/report-of-the-juvenile-life-sentence-commission-6-15-16.pdf
10 Trounstine, 201311 Parole grant rates calculated based on positive votes at initial or review
hearings (which are distinct from review after revocation hearings). Massachusetts advocates have cautioned us that positive votes can also be contingent on the expectation that the incarcerated individual has to comply with some condition before release, whose absence prevents parole.
12 Trounstine, 201313 Note that two of the individuals granted parole were referred to Immi-
gration and Customs Enforcement. Based on data collected by Jean Trounstine.

31The Sentencing Project • 1705 DeSales Street NW, 8th Floor • Washington, D.C. 20036 • sentencingproject.org
DELAYING A SECOND CHANCE: STATE PROFILES
MichiganKEY FINDINGS • Changes in the parole review process in Michigan since the early 1990s—such as restructuring the
parole board’s membership from civil service members to political appointees and increasing wait times between hearings from two to five years—have delayed parole for many lifers. Moreover, the state allows presiding judges to prevent the parole board from granting parole and until 2017, it had granted this authority to successor judges. Since the mid-2000’s, the parole board has shown greater willingness to parole some of the individuals caught in this backlog.
• The number of paroled lifers with non-drug convictions has increased from two in 2005 to 36 in 2015.
• Between 2005 and 2014, the annual average time served for all released lifers with non-drug convic-tions was in the range of 23.0 and 34.1 years. During this period, the annual average time served for lifers released with second-degree murder convictions was in the range of 19.4 and 36.2 years.
OVERVIEW AND POLICYThere were 1,502 individuals with parole-eligible life sentences in Michigan in 2012, constituting 3.5% of the state’s prison population.1 In addition, a significant number of people were serving parole-ineligible life sentences.
Most individuals serving life sentences for crimes other than first-degree murder are eligible for parole after serving 10 years if the crime was committed before October 1, 1992, or after 15 years if the crime was committed afterwards.2 However, individuals serving life sentences for drug offenses who had their sentences reduced from life without parole following reforms to the “650 Lifer Law” are usually parole-eligi-ble after 17.5 years, though eligibility can be increased to 20 years or decreased to 15 years depending on statutorily proscribed factors.3 Life without parole is mandatory for adult first-degree murder convictions.4
Beginning in 1992, the state implemented several structural and procedural changes so that its parole board would follow a “life means life” policy—granting parole to very few lifers, against the expectations of sentencing judges up until that point.5 This included changing the board’s membership from civil service members to political appointees, increasing wait times between reviews from every two to every five years,
allowing “file reviews” that do not involve in-person interviews, and permitting issuance of “no interest” decisions that do not require explanation.6 Lifers con-victed before 1992 won a federal class action lawsuit in 2007 finding that the new parole policies violated the Ex Post Facto Clause of the U.S. Constitution, which prohibits increasing penalties after a sentence has been imposed, but the Sixth Circuit reversed this de-cision in 2010.7
Since 1953, Michigan law has allowed presiding judges or their successors to prevent the parole board from granting parole.8 Citizens Alliance on Prisons and Public Spending (CAPPS) notes that between January 2005 and December 2013, the parole board cancelled 50 of the 223 hearings for non-drug lifers in response to judicial objections that prohibited the board from having jurisdiction to release.9 With the passage of HB 5273 in 2016 and its enactment in 2017, successor judges can no longer prevent the board from granting parole.10
Since the late 2000’s, the parole board has shown greater willingness to parole some of the lifers caught in this backlog. According to Barbara Levine, “the problem has shifted from being a policy of no lifer paroles to being a process that is way too slow, opaque and arbitrary.”11

32The Sentencing Project • 1705 DeSales Street NW, 8th Floor • Washington, D.C. 20036 • sentencingproject.org
DELAYING A SECOND CHANCE: STATE PROFILES
NUMBER PAROLED AND TIME SERVED12
The number of released lifers with non-drug convictions increased substantially between 2005 and 2014, from two to 22 in those years. CAPPS estimates that the number of non-drug lifers paroled in 2015 was 36.13 The small number of releases at the beginning of this period was a continuation of the parole board’s “life means life” policy dating from the early-1990s.14 But this pattern changed by the late-2000s, as “litigation, budget pressures and parole board leadership com-bined to stimulate a modest but marked increase in lifer paroles.”15
The average time served for the two lifers with non-drug convictions released in 2005 was 23.0 years. The annual average time served for lifers with these con-victions then increased to between 28.2 and 34.1 years between 2006 and 2014. More specifically:
• The average time served for the lifer released in 2005 with a second-degree murder conviction was 19.4 years. Between 2006 and 2014, the annual average time served for lifers released with sec-ond-degree murder convictions ranged between 28.4 and 36.2 years.
• The average time served for the lifer released in 2005 with a non-drug conviction other than sec-ond-degree murder was 26.5 years. Between 2006 and 2014, the annual average time served for lifers released with such convictions ranged between 26.4 and 34.1 years.
CAPPS has estimated that in 2013, 863 non-drug lifers had served enough time to be eligible for parole.16 On average, these individuals had served 29 years.17
Time Served for Non-Drug Lifers Paroled in Michigan, 2005-2014
PAROLE HEARINGS AND GRANT RATESData were not provided on lifer parole hearing out-comes.
1 Nellis, A. (2013). Life goes on: The historic rise in life sentences in America. Wash-ington, DC: The Sentencing Project. Retrieved from: http://sentencingproject.org/wp-content/uploads/2015/12/Life-Goes-On.pdf
2 Mich. Comp. Laws § 791.2343 Personal correspondence with Barbara Levine. 4 Levine, B. R. (2015, June). 10,000 fewer Michigan prisoners: Strategies to reach the
goal. Retrieved from Citizens Alliance on Prisons and Public Spending website: http://2015capps.capps-mi.org/wp-content/uploads/2015/06/CAPPS-re-port-10000-fewer-prisoners.pdf. Juveniles convicted of first-degree murder may be sentenced to 25 to 60 years or life without parole. See: Mich. Comp. Laws § 769.25
5 Levine, B. R. (2014, February). Parolable lifers in Michigan: Paying the price of un-checked discretion. Retrieved from Citizens Alliance on Prisons and Public Spend-ing website: http://www.capps-mi.org/wp-content/uploads/2014/02/Parolable-Lif-ers-in-Michigan-Paying-the-price-of-unchecked-discretion.pdf; Levine, B. R. (2006, September). When “life” did not mean life: A historical analysis of life sentences imposed in Michigan since 1900. Retrieved from Citizens Alliance on Prisons and Public Spending website: http://www.capps-mi.org/wp-content/up-loads/2013/03/5.5-When-life-did-not-mean-life-CAPPS-report-2006.pdf; Levine, 2015
Number of Lifers Paroled in Michigan, 2005-2014
0
5
10
15
20
25
30
35
40
2014201320122011201020092008200720062005
Second-degreemurder convictions
All non-drug convictions
Other non-drug convictions
Year
s
0
5
10
15
20
25
30
2014201320122011201020092008200720062005
8
24
8
4
10
13
Second-degreemurder convictions
Other non-drug convictions
3
11
1
6
5
9
16
11
8
8
15
9
Num
ber o
f Peo
ple
6 Levine, 2015; Levine, 2014 7 Foster-Bey v. Rubitschun, No. 05-71318, 2007 U.S. Dist. LEXIS 95748 (E.D.Mich.
Oct. 23, 2007); Foster v. Booker, 595 F.3d 353 (6th Cir. 2010). 8 Levine, 20159 Levine, 201410 H.R. 5273, 2016 Leg. (Mich.). Retrieved from http://www.legislature.mi.gov/
(S(pjwiug3chzynfoqbeo4clqyl))/mileg.aspx?page=getobject&objectnam-e=2016-HB-5273
11 Personal correspondence with Barbara Levine. 12 Data provided by Barbara R. Levine of Citizens Alliance on Prisons and Public
Spending (CAPPS).13 Personal correspondence with Barbara Levine. 14 Citizens Alliance on Prisons and Public Spending. (2013, June). Michigan’s paro-
lable lifers: The cost of a broken process. Retrieved from http://www.capps-mi.org/wp-content/uploads/2014/02/The-cost-of-a-broken-process.pdf
15 Citizens Alliance on Prisons and Public Spending, 201316 Citizens Alliance on Prisons and Public Spending, 2013. Since this calculation,
another 90 individuals who had consecutive sentences have also become eligi-ble for parole (source: Barbara Levine).
17 Citizens Alliance on Prisons and Public Spending, 2013

33The Sentencing Project • 1705 DeSales Street NW, 8th Floor • Washington, D.C. 20036 • sentencingproject.org
DELAYING A SECOND CHANCE: STATE PROFILES
MinnesotaKEY FINDINGS • Beginning in 1989, the Minnesota legislature increased minimum sentences for parole eligibility from
17 to 30 years for life sentences for first-degree murder convictions. In subsequent years, the legis-lature enhanced the sentencing in certain first-degree murder convictions to require life without parole.
• Time served for paroled lifers with first-degree murder convictions grew by 34% from 1990 and 1991 to 2012 and 2013, from an average of 17.4 to 23.4 years, with two individuals released in each period. These were the only years for which such data were provided.
• Between 1982 and 2013, the state gradually increased its number of lifer parole hearings while its parole grant rate has ranged between 0% and 25% annually.
OVERVIEW AND POLICY HIGHLIGHTSThe 426 individuals serving parole-eligible life sentenc-es in Minnesota represented 4.5% of the state’s prison population in 2012.1
In 1989, the legislature began increasing the minimum sentences that lifers with first-degree murder convic-tions must serve before becoming eligible for parole, from 17 to 30 years.2 In subsequent years, the legis-lature has also begun requiring life without parole for certain first-degree murder convictions.3
An advisory panel reviews each case and makes release decisions based in part on a series of meetings with the victim’s family and the incarcerated individual who participates via teleconference.4 Incarcerated individ-uals may choose to have an advocate of their choos-ing (including an attorney) present during the proceed-ings for support and to speak on their behalf.
NUMBER PAROLED AND TIME SERVEDAverage time served for all lifers granted parole between 1982 and 2013 was 22.5 years. The state could not break this information down for each year
0
5
10
15
20
25
30
35
2013201219911990
17.1 17.7
23.3 23.5
Year
s
Time Served for Paroled Lifers with First-Degree Murder Convictions in Minnesota, 1990, 1991, 2012, 2013
Note: Based on one individual released each of these years
but was able to provide data on lifers with first-degree murder convictions released in four years. For the one individual paroled each year in 1990 and 1991, time served was 17.1 and 17.7 years, respectively. Time served grew to 23.3 and 23.5 years for the single indi-vidual paroled each year in 2012 and 2013, respective-ly. This represented a 34% increase across these two periods.

34The Sentencing Project • 1705 DeSales Street NW, 8th Floor • Washington, D.C. 20036 • sentencingproject.org
DELAYING A SECOND CHANCE: STATE PROFILES
1 Nellis, A. (2013). Life goes on: The historic rise in life sentences in America. Washington, DC: The Sentencing Project. Retrieved from: http://sen-tencingproject.org/wp-content/uploads/2015/12/Life-Goes-On.pdf
2 Minnesota Department of Corrections. (n.d.). DOC Background/History: 1984 - 1999. Retrieved October 13, 2016, from http://www.doc.state.mn.us/pages/index.php/about/agency-background-history/1984-1999/
3 Minn. Stat. § 244.05
LIFER PAROLE HEARINGS AND GRANT RATESBetween 1982 and 2013, the state gradually increased its number of lifer parole hearings while its parole grant rate has ranged from 0% to 25% annually. Specifically:
• Between 1982 and 1989, there were an average two parole hearings each year, and no lifers were granted parole.
• Between 1990 and 1999, there were an average 15 parole hearings each year, and 10% of hearings resulted in grants.
Number of Lifer Parole Hearings and Grant Rates in Minnesota, 1982-2013
• Between 2000 and 2009, there were an average 31 parole hearings each year, and 12% of hearings resulted in grants.
• Between 2010 and 2013, the average annual number of hearings remained at the previous de-cade’s level, 31, while the grant rate fell to 9%.
Eight percent of those who were granted parole over this time period began a consecutive sentence.
0
10
20
30
40
50
60
2013
2012
2011
2010
2009
2008
2007
2006
2005
200
4
2003
2002
2001
2000
1999
1998
1997
1996
1995
1994
1993
1992
1991
1990
1989
1988
1987
1986
1985
198
4
1983
1982
0% 9%
25%
13% 17
%
18%
4%
0%
20% 16
% 13%
12%
6% 4%
19%
10%
15%
11%
0%
0% 0%
0%
0% 4%
17%
8% 5%
25%
3% 3%Denied parole
Granted parole
Grant rate
Num
ber o
f hea
rings
4 Minnesota Department of Corrections. (2015, March). Life sentence review process (Policy No. 203.060). Retrieved from http://www.doc.state.mn.us/DocPolicy2/html/DPW_Display_TOC.asp?Opt=203.060.htm; personal correspondence with Deb Kerschner, Director of Planning & Performance at Minnesota Department of Corrections.

35The Sentencing Project • 1705 DeSales Street NW, 8th Floor • Washington, D.C. 20036 • sentencingproject.org
DELAYING A SECOND CHANCE: STATE PROFILES
MissouriKEY FINDINGS • In 1994, Missouri overhauled its sentencing laws to require lifers convicted of a “dangerous felony”
to wait 23 years for their first parole hearing—10 years longer than under the previous law. Because none of these individuals had yet become parole-eligible by 2015, this analysis focuses on lifers con-victed of violent offenses prior to this date. This includes individuals with first-degree murder convic-tions predating 1984, when the state abolished parole for this offense.
• Between 1991 and 2014, average time served for all released lifers grew by 68%, from 15.0 to 25.2 years. The growth in time served was even more dramatic for those with murder convictions: 83% for first-degree murder and 106% for second-degree murder.
• The state has increased its number of lifer parole hearings from an average annual of 113 between 1991 and 1999 to 185 between 2000 and 2013. The net parole grant rate has varied over time, aver-aging 13% during this entire period—this rate excludes the board’s reversal of 24% of its initial grant decisions.
OVERVIEW AND POLICY HIGHLIGHTSThe 1,744 individuals serving parole-eligible life sen-tences in Missouri represented 5.6% of the state’s prison population in 2012.1 In addition, a significant number of people were serving parole-ineligible life sentences.
Individuals convicted of first-degree murder before 1984 could receive sentences of life with the possibil-ity of parole.2 After 1984, the sentence for that offense became life without parole or the death penalty.3 Fol-lowing the passage of SB 590 in 2016, anyone sen-tenced to life without parole for juvenile convictions before August 28, 2016, may petition for parole after serving 25 years.4 Juveniles convicted after that date may be sentenced to life without parole, life with parole, or a term between 30 and 40 years; all can petition for resentencing after serving 25 years.5
The legislature’s passage of a truth-in-sentencing law in 1994, SB763, significantly increased the minimum time that lifers have to serve before becoming eligible for parole. Under the new law, individuals convicted of a “dangerous felony”—arson 1, assault 1, forcible
rape, forcible sodomy, kidnapping, murder 2, and robbery 1—would become parole-eligible after serving 85% of their prison term.6 Lifers serving 85% of their time for a dangerous felony would be required to wait 23 years for their first hearing (and to serve 25.5 years before being released) whereas lifers convicted of violent offenses prior to this law had their first hearings scheduled at 13 years.7 No lifer sentenced under the new law had been released by 2015.8
Missouri allows a select few individuals sentenced to “life with no parole for fifty years” or life without parole to become parole-eligible after serving 15 years.9 These individuals must satisfy a variety of criteria to be eli-gible, including having no prior felony convictions and having a history of being victimized. These individuals are excluded from the analyses below, unless they were resentenced to life with the possibility of parole.

36The Sentencing Project • 1705 DeSales Street NW, 8th Floor • Washington, D.C. 20036 • sentencingproject.org
DELAYING A SECOND CHANCE: STATE PROFILES
NUMBER PAROLED AND TIME SERVEDOn average, 20 parole-eligible lifers were released annually between 1991 and 2014. This level fell by half between 1996 and 2002 but has since increased. The average time served for all paroled lifers grew by 68% between 1991 and 2014, from 15.0 years to 25.2 years. The growth in time served has been most dramatic for those with second-degree murder convictions—more
1991
1992
1993
1994
1995
1996
1997
1998
1999
2000
2001
2002
2003
2004
2005
2006
2007
2008
2009
2010
2011
2012
2013
2014
First-degree murder 13 8 14 11 9 5 5 10 2 1 0 4 6 10 8 2 7 7 6 6 5 5 2 4
Second-degree murder 5 9 5 4 6 4 3 2 5 0 6 1 3 7 9 8 6 15 8 18 15 18 30 27
Other 4 8 5 1 5 3 1 4 3 4 5 4 7 2 6 6 4 2 12 5 3 8 9 6
All lifers 22 25 24 16 20 12 9 16 10 5 11 9 16 19 23 16 17 24 26 29 23 31 41 37
Number of Lifers Paroled from Missouri Prisons, 1991-2014
Time Served for Paroled Lifers in Missouri, 1991-2014
0
5
10
15
20
25
30
35
40
201320112009200720052003200119991997199519931991
First-degree murder
All lifers
Other
Second-degree murder
Year
s
than doubling from 11.9 years to 24.6 years during this period. Time served for first-degree murder grew by 83% across these years, from 16.6 years to 30.3 years. Throughout this period, lifers waited an average of 2.2 years to be released from prison after being granted parole.

37The Sentencing Project • 1705 DeSales Street NW, 8th Floor • Washington, D.C. 20036 • sentencingproject.org
DELAYING A SECOND CHANCE: STATE PROFILES
LIFER PAROLE HEARINGS AND GRANT RATESOne average, 113 lifer parole hearings were conducted annually between 1991 and 1999. This figure increased to 185 between 2000 and 2013. The net parole grant rate, excluding the board’s reversal of its initial grant decisions, was 18% between 1991 and 1994; dropped to 7% between 1995 and 2004; and increased to 16%
Number of Lifer Parole Hearings and Grant Rates in Missouri, 1991-2013
between 2005 and 2013. Of 606 grants between 1991 and 2013, 146 (24%) were reversed by the parole board for reasons including negative behavior during incar-ceration and the acquisition of a new sentence for an additional crime.
*Note: These figures exclude individuals sentenced to “life with no parole for fifty years” or life without parole unless they were resentenced to life with the possibility of parole. Grant rate is net of reversals.
17% 22
%
4%
10%
2%
11%
15%
11%
31%
19% 14
%
3% 0%
8%
12% 15
%
7% 9% 10% 13
% 19%
17%
24%
Denied parole
Granted parole
Grant rate
0
50
100
150
200
250
300
Num
ber o
f hea
rings
2013
2012
2011
2010
2009
2008
2007
2006
2005
200
420
0320
0220
0120
0019
9919
9819
9719
9619
9519
9419
9319
92
1991
1 Nellis, A. (2013). Life goes on: The historic rise in life sentences in America. Washington, DC: The Sentencing Project. Retrieved from: http://sen-tencingproject.org/wp-content/uploads/2015/12/Life-Goes-On.pdf
2 Missouri 79th General Assembly, 1st Regular Session and 1st Extraor-dinary Session 7-740, p. 720.
3 Missouri 82nd General Assembly, 1st Regular Session 7-980, p. 926.4 Modifies Provisions Related to First Degree Murder, S. 590, 98th Gen.
Assem., 2nd Reg. Sess. (Mo. 2016). 5 Missouri SB 590 (2016).6 U.S. Department of Justice National Institute of Corrections. (1995,
May). State legislative actions on truth in sentencing: A review of law and legislation in the context of the Violent Crime Control and Law Enforcement Act of 1994 (LIS, Inc., Comp.). Retrieved from http://static.nicic.gov/
Library/012259.pdf. People with dangerous felony convictions may also be considered for release when they reach age 70 and have served 40% of their time and elderly individuals in need of full-time care may be eligible for medical parole.
7 Personal correspondence with Missouri Department of Corrections8 Personal correspondence with Missouri Department of Corrections9 Mo. Stat. § 217.692

38The Sentencing Project • 1705 DeSales Street NW, 8th Floor • Washington, D.C. 20036 • sentencingproject.org
DELAYING A SECOND CHANCE: STATE PROFILES
MontanaKEY FINDINGS • Life-sentenced individuals convicted of crimes since 1997 must serve 30 years before becoming eli-
gible for parole.
• Among paroled lifers with deliberate homicide convictions, time served increased from 15.1 years for the eight individuals released in the 1980s to 25.3 years for the four released between 2003 and 2013.
• Between 1991 and 2013, the state has conducted an average of four lifer parole hearings annually. Grant rates over this period have ranged from 0% to 44% in any given year, averaging 14% throughout this period.
OVERVIEW AND POLICY HIGHLIGHTSThe 44 individuals with parole-eligible life sentences in Montana constituted 1.8% of the state’s prison population in 2012.1 Life sentences with parole are allowable for “deliberate homicide,” an offense cate-gory that is similar to first- and second-degree murder in other states.2
Life-sentenced individuals convicted of crimes on or after January 31st, 1997, must serve 30 years before becoming eligible for parole.3
The Montana Board of Pardons and Paroles is com-posed of seven part-time members, all of whom the governor appoints.4
Number of Paroled Lifers with Deliberate Homicide Convictions in Montana, 1980-2013
1980
1981
1982
1983
1984
1985
1986
1987
1988
1989
1990
1991
1992
1993
1994
1995
1996
1997
1998
1999
2000
2001
2002
2003
2004
2005
2006
2007
2008
2009
2010
2011
2012
2013
1 0 1 1 0 2 3 0 0 0 0 2 0 2 0 0 0 0 0 0 0 0 0 1 1 0 0 0 0 0 0 0 1 1
Time Served for Paroled Lifers with Deliberate Homicide Convictions in Montana, 1980-2013
0
5
10
15
20
25
30
35
2013
2012
2011
2010
2009
2008
2007
2006
2005
200
420
0320
0220
0120
0019
9919
9819
9719
9619
9519
9419
9319
9219
9119
9019
8919
8819
8719
8619
8519
84
1983
1982
1981
1980
Year
s 18.3
16.2 17
.8
29.5
8.8 11
.1
19.9 22
.6
16.2 18
.530
.4

39The Sentencing Project • 1705 DeSales Street NW, 8th Floor • Washington, D.C. 20036 • sentencingproject.org
DELAYING A SECOND CHANCE: STATE PROFILES
1 Nellis, A. (2013). Life goes on: The historic rise in life sentences in America. Washington, DC: The Sentencing Project. Retrieved from: http://sen-tencingproject.org/wp-content/uploads/2015/12/Life-Goes-On.pdf
2 Mon. Code Ann. § 45-5-102: “Deliberate homicide. (1) A person commits the offense of deliberate homicide if: (a) the person purposely or know-ingly causes the death of another human being; (b) the person attempts to commit, commits, or is legally accountable for the attempt or com-mission of robbery, sexual intercourse without consent, arson, burglary, kidnapping, aggravated kidnapping, felonious escape, assault with a weapon, aggravated assault, or any other forcible felony and in the
NUMBER PAROLED AND TIME SERVEDA total of 16 lifers with deliberate homicide convictions were granted parole between 1980 and 2013. Average time served for these individuals increased from 15.1 years for the eight released in the 1980s, to 18.9 years for the four released in the 1990s, to 25.3 years for the four released between 2003 and 2013.
0
1
2
3
4
5
6
7
8
9
10
2013
2012
2011
2010
2009
2008
2007
2006
2005
200
4
2003
2002
2001
2000
1999
1998
1997
1996
1995
1994
1993
1992
1991
0% 0% 0% 0% 0% 0%0%0% 0%0%0% 0%0%
44%
17%
33%
33%
40%
40%
25%
20%
Denied parole
Grant Rate
Granted parole
Num
ber o
f hea
rings
Number of Lifer Parole Hearings and Grant Rates in Montana, 1991-2013
LIFER PAROLE HEARINGS AND GRANT RATESBetween 1991 and 2013, the state has conducted an average of four lifer parole hearings annually. Grant rates over this period have ranged from 0% to 44% in any given year, averaging 14% throughout this period.
course of the forcible felony or flight thereafter, the person or any person legally accountable for the crime causes the death of another human being; or (c) the person purposely or knowingly causes the death of a fetus of another with knowledge that the woman is pregnant.”
3 Montana Department of Corrections. (n.d.). 2015 biennial report to the people of Montana. Retrieved from https://cor.mt.gov/Portals/104/Resources/Reports/2015BiennialReport.pdf
4 Montana Department of Corrections, n.d.

40The Sentencing Project • 1705 DeSales Street NW, 8th Floor • Washington, D.C. 20036 • sentencingproject.org
DELAYING A SECOND CHANCE: STATE PROFILES
NebraskaKEY FINDINGS • Average time served for paroled lifers with first- or second-degree homicide convictions has increased
slightly from 15.9 years in the 1980s to 18.4 years between 2010 and 2013.
• Between 2000 and 2009, the state paroled fewer lifers with first- or second-degree homicide convic-tions than it had in the previous two decades. This level has increased during the period between 2010 and 2013.
OVERVIEW AND POLICY HIGHLIGHTSThe 95 individuals with parole-eligible life sentences in Nebraska constituted 2% of the state’s prison pop-ulation in 2012.1 Life sentences can be applied to those convicted of Class 1A and 1B felonies. First-degree and second-degree homicides fall under these cate-gories.
The Nebraska parole board is composed of five full-time members who are appointed by the governor and
serve six-year terms. Only one of the five members must have a professional background in corrections.2 In 2014, the legislature held hearings to learn more about reported pressure by Governor Dave Heineman’s administration since 2008 to increase parole rates to ease prison overcrowding.3
Time Served for Paroled Lifers with First-or Second-Degree Homicide Convictions in Nebraska, 1980-2013
1980
1981
1982
1983
1984
1985
1986
1987
1988
1989
1990
1991
1992
1993
1994
1995
1996
1997
1998
1999
2000
2001
2002
2003
2004
2005
2006
2007
2008
2009
2010
2011
2012
2013
1 1 0 0 4 1 0 4 4 4 4 3 3 8 3 1 2 1 0 0 0 0 1 1 0 0 0 2 4 1 1 2 1 5
Number of Paroled Lifers with First-or Second-Degree Homicide Convictions in Nebraska, 1980-2013
0
5
10
15
20
25
30
35
2013
2012
2011
2010
2009
2008
2007
2006
2005
200
420
0320
0220
0120
0019
9919
9819
9719
9619
9519
9419
9319
9219
9119
9019
8919
8819
8719
8619
8519
84
1983
1982
1981
1980
Year
s

41The Sentencing Project • 1705 DeSales Street NW, 8th Floor • Washington, D.C. 20036 • sentencingproject.org
DELAYING A SECOND CHANCE: STATE PROFILES
1 Nellis, A. (2013). Life goes on: The historic rise in life sentences in America. Washington, DC: The Sentencing Project. Retrieved from: http://sen-tencingproject.org/wp-content/uploads/2015/12/Life-Goes-On.pdf
2 Nebraska Board of Parole. (2016, September). Nebraska Board of Parole rules. Retrieved from https://parole.nebraska.gov/rules
NUMBER PAROLED AND TIME SERVEDBetween 2000 and 2009, the state paroled fewer lifers with first- or second-degree homicide convictions than it had in the previous two decades. Nineteen such individuals were paroled in the 1980s, 25 were paroled in the 1990s, and only nine such individuals were paroled between 2000 and 2009. During the period between 2010 and 2013, nine such lifers were paroled.
Time served for paroled lifers with first- or second-de-gree homicide convictions has increased since the 1980s. The average time served among those paroled in the 1980s was 15.9 years. Time served fell to 14.9 years for those paroled in the 1990s. It then increased to 16.0 years for those paroled between 2000 and 2009 and increased further to 18.4 years for those paroled between 2010 and 2013.
LIFER PAROLE HEARINGS AND GRANT RATESData were not provided on lifer parole hearing out-comes.
3 Winter, D. (2014, November 25). Nebraska parole chair: ‘I felt pressured’ to parole more prisoners [Newsgroup post]. Retrieved from http://watchdog.org/185015/parole-board/

42The Sentencing Project • 1705 DeSales Street NW, 8th Floor • Washington, D.C. 20036 • sentencingproject.org
DELAYING A SECOND CHANCE: STATE PROFILES
New JerseyKEY FINDINGS • People currently sentenced to life become parole-eligible after serving any judicial or statutory man-
datory-minimum term, or 25 years when no minimum term applies.
• In 2013, the only year for which data were provided, ten lifers were released and their average time served was 31.7 years. Among the seven with murder convictions, average time served was 34.1 years.
• Between 1985 and 2013, the state conducted an average of 92 parole hearings per year for lifers with murder convictions. The parole grant rate fell dramatically during this period, from 42% in the late 1980s to 31% in the 1990s and 2000s, to 12% between 2010 and 2013.
OVERVIEW AND POLICY HIGHLIGHTSNew Jersey prisons held 1,096 individuals with pa-role-eligible life sentences in 2012, constituting 4.6% of the state’s prison population.1 People currently sentenced to life become parole-eligible after serving any judicial or statutory mandatory-minimum term, or 25 years when no minimum term applies.2 The major-ity (88%) of lifers in New Jersey have been convicted of a homicide.
The New Jersey Parole Board has 18 members, with
15 acting members at any given time.3 An experimen-tal 1999 study found that conviction offense was the most influential factor in simulated parole decisions in New Jersey.4 This result appeared to conflict with the provisions under the New Jersey Parole Act of 1979, whereby crime of conviction is listed as a factor that is not supposed to influence parole board deci-sions since “punishment for the crime was to be meted out by the judiciary at the time of sentencing and not taken into account by the board.”5
Lifer Parole Hearings and Grant Rates for Individuals with Murder Convictions in New Jersey, 1985-2013
66%
46%
49% 50
%
16% 25
% 28%
33%
32%
32%
30%
27%
22%
49%
37%
29% 4
0%
36%
32%
32%
30%
30%
28%
26% 27
%
11% 20
%
8% 11%
Grant rate
Denied parole
Granted parole
2013
2012
2011
2010
2009
2008
2007
2006
2005
200
4
2003
2002
2001
2000
1999
1998
1997
1996
1995
1994
1993
1992
1991
1990
1989
1988
1987
1986
1985
0
20
40
60
80
100
120
140
160
180
200
Num
ber o
f hea
rings

43The Sentencing Project • 1705 DeSales Street NW, 8th Floor • Washington, D.C. 20036 • sentencingproject.org
DELAYING A SECOND CHANCE: STATE PROFILES
1 Nellis, A. (2013). Life goes on: The historic rise in life sentences in America. Washington, DC: The Sentencing Project. Retrieved from: http://sen-tencingproject.org/wp-content/uploads/2015/12/Life-Goes-On.pdf
2 See N.J.S. § 2C:11-3, N.J.S. § 2C:14-6, N.J.S. § 2C:43-6, N.J.S. § 2C:43-7: commutation and work credits shall not in any way reduce any ju-dicial or statutory mandatory minimum term and such credits accrued shall only be awarded subsequent to the expiration of the term.
3 New Jersey State Parole Board. (2012, February). The parole book: A handbook on parole procedures for adult and young adult inmates. Retrieved from http://www.state.nj.us/parole/docs/AdultParoleHandbook.pdf
NUMBER PAROLED AND TIME SERVEDDuring 2013, ten lifers were released and the average time served among them was 31.7 years, with a range of 17 to 38 years. Among the seven with murder con-victions, the average time served was 34.1 years.
LIFER PAROLE HEARINGS AND GRANT RATESNew Jersey provided data on parole hearing outcomes only for lifers with murder convictions. Between 1985 and 2013, the state conducted an average of 92 such parole hearings annually, ranging between 33 hearings in 1986 and 174 hearings in 1992. The parole grant rate has fallen dramatically during this period, from 42% in the late 1980s to 31% in the 1990s and 2000s, to 12% between 2010 and 2013.
4 Turpin-Petrinoso, C. (1999). Are limiting enactments effective? An ex-perimental test of decision making in a presumptive parole state. Journal of Criminal Justice, 27(4), 328-329.
5 Turpin-Petrinoso, 1999, p. 323.
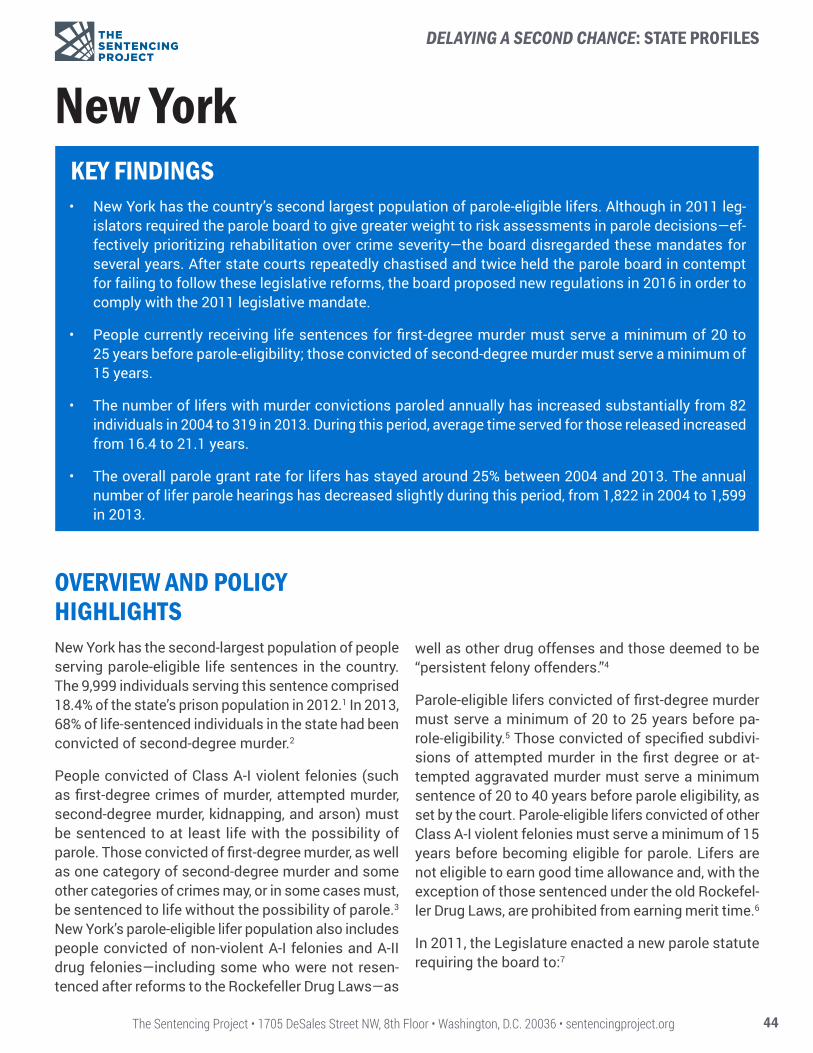
44The Sentencing Project • 1705 DeSales Street NW, 8th Floor • Washington, D.C. 20036 • sentencingproject.org
DELAYING A SECOND CHANCE: STATE PROFILES
New YorkKEY FINDINGS • New York has the country’s second largest population of parole-eligible lifers. Although in 2011 leg-
islators required the parole board to give greater weight to risk assessments in parole decisions—ef-fectively prioritizing rehabilitation over crime severity—the board disregarded these mandates for several years. After state courts repeatedly chastised and twice held the parole board in contempt for failing to follow these legislative reforms, the board proposed new regulations in 2016 in order to comply with the 2011 legislative mandate.
• People currently receiving life sentences for first-degree murder must serve a minimum of 20 to 25 years before parole-eligibility; those convicted of second-degree murder must serve a minimum of 15 years.
• The number of lifers with murder convictions paroled annually has increased substantially from 82 individuals in 2004 to 319 in 2013. During this period, average time served for those released increased from 16.4 to 21.1 years.
• The overall parole grant rate for lifers has stayed around 25% between 2004 and 2013. The annual number of lifer parole hearings has decreased slightly during this period, from 1,822 in 2004 to 1,599 in 2013.
OVERVIEW AND POLICY HIGHLIGHTSNew York has the second-largest population of people serving parole-eligible life sentences in the country. The 9,999 individuals serving this sentence comprised 18.4% of the state’s prison population in 2012.1 In 2013, 68% of life-sentenced individuals in the state had been convicted of second-degree murder.2
People convicted of Class A-I violent felonies (such as first-degree crimes of murder, attempted murder, second-degree murder, kidnapping, and arson) must be sentenced to at least life with the possibility of parole. Those convicted of first-degree murder, as well as one category of second-degree murder and some other categories of crimes may, or in some cases must, be sentenced to life without the possibility of parole.3 New York’s parole-eligible lifer population also includes people convicted of non-violent A-I felonies and A-II drug felonies—including some who were not resen-tenced after reforms to the Rockefeller Drug Laws—as
well as other drug offenses and those deemed to be “persistent felony offenders.”4
Parole-eligible lifers convicted of first-degree murder must serve a minimum of 20 to 25 years before pa-role-eligibility.5 Those convicted of specified subdivi-sions of attempted murder in the first degree or at-tempted aggravated murder must serve a minimum sentence of 20 to 40 years before parole eligibility, as set by the court. Parole-eligible lifers convicted of other Class A-I violent felonies must serve a minimum of 15 years before becoming eligible for parole. Lifers are not eligible to earn good time allowance and, with the exception of those sentenced under the old Rockefel-ler Drug Laws, are prohibited from earning merit time.6
In 2011, the Legislature enacted a new parole statute requiring the board to:7

45The Sentencing Project • 1705 DeSales Street NW, 8th Floor • Washington, D.C. 20036 • sentencingproject.org
DELAYING A SECOND CHANCE: STATE PROFILES
establish written procedures for its use in making parole decisions as required by law. Such written procedures shall incorporate risk and needs prin-ciples to measure the rehabilitation of persons appearing before the board, the likelihood of success of such persons upon release, and assist members of the state board of parole in determin-ing which inmates may be released to parole su-pervision.
According to Philip Genty, these changes sought to “shift the primary focus of Parole Board decisionmak-ing away from the static factors of criminal history and seriousness of the crime, to a more dynamic and nuanced set of risk-assessment ‘procedures.’”8 But the board resisted implementing these reforms. In testi-mony before the Assembly’s Corrections Committee in 2013, the Correctional Association of New York stated that the board “denies parole release, often repeatedly to far too many people, frequently based on the nature of applicants’ crimes of conviction or past criminal history while failing to consider people’s accomplishments, readiness for reentry, or objective risk.”9 State courts have chastised the board for failing to follow laws guiding parole decisionmaking, and the board has twice been held in contempt of court for ignoring directives to give greater weight to factors other than the underlying offense and to provide its reasoning behind parole denials.10
In 2011, the Legislature also directed the parole board to develop and implement a risk assessment instru-ment.11 After some delay, the board developed the COMPAS Reentry Risk Assessment Instrument but it has not consistently used the instrument or applied its results to guide its decisions.12
With pressure from the courts, advocates, and the Governor, the board proposed new regulations in 2016 to comply with the 2011 statutory requirements.13 The proposed regulation requires that the parole candi-date’s risk and needs score guide the board’s release decision and that the board provide an explanation when it departs from the risk assessment to deny parole. The regulation would also require the board to consider the reduced culpability and demonstrated maturity of lifers who committed their crimes under age 18.14
New York’s parole board consists of up to 19 members15 and is currently composed of fourteen members, all of whom are appointed by the governor and confirmed by the Senate. Members serve a six-year term. Robert Dennison, a former parole board chairman and com-missioner, spoke with the media about an unwritten rule: “If you let someone out and it’s going to draw media attention, you’re not going to be re-appointed.”16 Thomas Grant, another former parole board commis-sioner who shares this view, has recommended instat-ing a one-term limitation for parole board commission-ers to eliminate their incentive to depart from the statute to maintain low parole rates and improve odds of reappointment.17 In January 2016, nearly all members of the parole board had been appointed or reappoint-ed by Governor Andrew Cuomo.18
Time Served for Paroled Lifers with First- Or Second-Degree Homicide Convictions in New York, 2004-2013
0
5
10
15
20
25
2013201220112010200920082007200620052004
Year
s
2004 2005 2006 2007 2008 2009 2010 2011 2012 2013
82 92 146 230 213 215 288 262 336 319
Number of Paroled Lifers with First- Or Second-Degree Homicide Convictions in New York, 2004-2013

46The Sentencing Project • 1705 DeSales Street NW, 8th Floor • Washington, D.C. 20036 • sentencingproject.org
DELAYING A SECOND CHANCE: STATE PROFILES
NUMBER PAROLED AND TIME SERVEDThe number of lifers paroled annually with first- or second-degree murder convictions quadrupled between 2004 and 2012, increasing from 82 to 336 individuals, and dropped slightly to 319 in 2013. Given that these data begin in 2004, during a gubernatorial administra-tion that was averse to granting parole to people with violent convictions as described in the subsequent section, it is unclear how the more recent elevated levels of releases compare with earlier periods. The backlog created by this reluctance to grant parole likely contributed to the increase in average time served among those who were paroled: from 16.4 years in 2004 to 21.2 years in 2013, hitting a peak of 22.4 years in 2007.
These figures do not reflect the time served by indi-viduals who remain incarcerated or who have died in prison. This group includes John MacKenzie, who was sentenced in 1975 to 25 years to life for killing a police officer after a burglary.21 Despite evidence of rehabil-itation, a notable record of accomplishments, and support letters from prison guards, judges, clergy members, and prosecutors, MacKenzie was denied parole for the tenth time in 2016. Days later, he killed himself in prison. At age 70, he had spent over 40 years incarcerated.
LIFER PAROLE HEARINGS AND GRANT RATESThe annual number of parole hearings for all lifers has decreased slightly between 2004 and 2014. An average of 1,877 hearings were conducted each year between 2004 and 2008. That annual average number of hear-ings fell to 1,698 between 2009 and 2013. An annual average of 325 scheduled hearings (15%) were post-poned (until later that year or a subsequent year), and were therefore omitted from the grant rate calculations below.
The parole grant rate has hovered around 25% between 2004 and 2013, with a drop to 19% in 2008.19
Given that these data begin in the final years of Gov-ernor George Pataki’s administration (January, 1995 – December, 2006), this level of parole grants may rep-resent a significant reduction from earlier years. Governor Pataki’s goal was reportedly to “make sure . . . that people convicted of violent crimes serve the longest possible sentences.”20
Number of Lifer Parole Hearings and Grant Rates in New York, 2004-2013
0
500
1000
1500
2000
2500
2013201220112010200920082007200620052004
29%
26%
25%
26%
19%
21% 22
%
24% 28
%
27%
Grant rate
Granted parole
Denied parole
Num
ber o
f hea
rings

47The Sentencing Project • 1705 DeSales Street NW, 8th Floor • Washington, D.C. 20036 • sentencingproject.org
DELAYING A SECOND CHANCE: STATE PROFILES
1 Only California has a larger population of parole-eligible lifers. Nellis, A. (2013). Life goes on: The historic rise in life sentences in America. Washington, DC: The Sentencing Project. Retrieved from: http://sen-tencingproject.org/wp-content/uploads/2015/12/Life-Goes-On.pdf
2 The remaining lifers were convicted of aggravated assault, robbery, or kidnapping (12.7%), property offense (7.3%), first-degree murder (3.6%), other murder (1.5%), sex offense (3.0%), drug offense (1.4%), or other offenses (2.6%).
3 See N. Y. Penal Law § 70.00(5). 4 Correspondence with Alan Rosenthal; See N. Y. Penal Law § 70.00(5);
N.Y. Penal Law § 70.40(1).5 N. Y. Penal Law § 70.006 New York Department of Corrections and Community Supervision.
(2010, November). New York State parole handbook: Questions and answers concerning parole release and supervision. Retrieved from http://www.doccs.ny.gov/Parole_Handbook.html
7 N.Y. Executive Law § 259-c(4)8 Hearings before the N.Y.S. Assembly’s Standing Committee on Correction,
2013 Leg. (N.Y.) (testimony of Philip M. Genty, Professor, Columbia Law School.)
9 Hearings before the N.Y.S. Assembly’s Standing Committee on Correction, 2013 Leg. (N.Y.) (testimony of Scott Paltrowitz, Prison Vision Project.) Retrieved from http://www.correctionalassociation.org/wp-content/uploads/2013/12/CA-Parole-Testimony-12-4-13-Hearing-FINAL.pdf
10 Bedell, B. (2015, June 1). Parole board held in contempt for failure to explain denial. New York Law Journal. Retrieved from http://www.newyorklawjournal.com/id=1202727884570/Parole-Board-Held-in-Contempt-for-Failure-to-Explain-Denial?slreturn=20160820120842; Stashenko, J. (2016, June 1). Judge finds parole board in contempt for ignoring order. New York Law Journal. Retrieved from http://www.newyorklawjournal.com/this-weeks-news/id=1202758944784/Judge-F inds-Parole -Board- in -Contempt- for - Ignor ing-Order?m-code=1202615036097&curindex=38
11 N. Y. Correction Law § 112(4)12 Correspondence with Alan Rosenthal.13 Department of Corrections and Community Supervision. (2016, Sep-
tember). Rule making activities: Parole board decision making (I.D. No. CCS-39-16-00004-P) (NYS Register). Retrieved from http://docs.dos.ny.gov/info/register/2016/sept28/pdf/rulemaking.pdf
14 Governor Cuomo announces proposal of new regulations to ensure consideration of risk and rehabilitation during parole decisions [News-group post]. (2016, October 18). Retrieved from New York Office of the Governor website: https://www.governor.ny.gov/news/governor-cuo-mo-announces-proposal-new-regulations-ensure-consider-ation-risk-and-rehabilitation. For the case motivating this reform, see Hawkins v. DOCCS 140 A.D.3d 34 (3rd Dept. 2016).
15 New York State Corrections and Community Supervision. (2015, June). Board of Parole (No. 8600). Retrieved from http://www.doccs.ny.gov/pdf/Board-of-Parole-Directive.pdf
16 Hughes, B. (2014, September 17). Even model NYS inmates face step barriers to parole [Newsgroup post]. Retrieved from http://citylimits.org/2014/09/17/even-model-nys-inmates-face-steep-barriers-to-parole/; see also the history of Kathy Boudin’s release and former commission-ers S. Earl Eichelberger and Henri C. Raffalli’s remarks: Caher, J. (2016, January 31). Dismantling parole: Parole release rates plunge under Pataki’s tough policy. New York Law Journal. Retrieved from http://prisonaction.blogspot.com/2006/03/dismantling-parole-john-ca-her-01-31.html.
17 Schwartzapfel, B. (2015, July 11). How parole boards keep prisoners in the dark and behind bars. The Washington Post. Retrieved from https://www.washingtonpost.com/national/the-power-and-politics-of-parole-boards/2015/07/10/49c1844e-1f71-11e5-84d5-eb37ee8eaa61_story.html; Re-thinking Reentry. (2010). “The ones with life after their name”: An interview with former New York State Parole Board member, Tom Grant [Blog post]. Retrieved from http://rethinkingreentry.blogspot.com/2010/10/ones-with-life-after-their-name.html
18 The Editorial Board (2016, January 15). Gov. Cuomo’s push on justice reform. New York Times. Retrieved from http://www.nytimes.com/2016/01/16/opinion/gov-cuomos-push-on-justice-reform.html?_r=0
19 Alan Rosenthal and Patricia Warth estimated that in fiscal year 2009, the parole grant rate for lifers with A-1 violent felonies (of which there were over 9,100 people), was 8% at initial hearings and 13% at subse-quent hearings. See Rosenthal, A., & Warth, P. (2011, September). NYSACDL supports call for parole reform. Retrieved from Center for Community Alternatives website: http://www.communityalternatives.org/pdf/ATTICUS-ParoleReform.pdf.
20 Caher, 201621 The Editorial Board (2016, June 13). A challenge to New York’s
broken parole board. New York Times. Retrieved from http://www.nytimes.com/2016/06/13/opinion/a-challenge-to-new-yorks-broken-parole-board.html?_r=1; Wegman, J. (2016, September 6). False hope and a needless death behind bars. New York Times. Retrieved from http://www.nytimes.com/2016/09/06/opinion/false-hope-and-a-needless-death-behind-bars.html

48The Sentencing Project • 1705 DeSales Street NW, 8th Floor • Washington, D.C. 20036 • sentencingproject.org
DELAYING A SECOND CHANCE: STATE PROFILES
North DakotaKEY FINDINGS • North Dakota has a small number of parole-eligible lifers, and the state granted parole to two such
individuals between 2003 and 2014. Time served averaged 24.0 years for these two individuals who both had murder convictions. One was released in 2005, and the other was expected to be released in 2016.
• Between 2003 and 2014, the North Dakota parole board reviewed six people with life sentences for possible parole release. Two of these six were granted parole.
OVERVIEW AND POLICY HIGHLIGHTS The 38 individuals serving parole-eligible life sentenc-es in North Dakota represented 2.5% of the state’s prison population in 2012.1
Class AA felonies are the most serious criminal of-fenses and carry a sentence of life imprisonment with or without parole. Individuals convicted of a Class AA felony must serve 30 years, minus time reduced for good behavior, before they can become parole-eligible.2 In 1995, North Dakota enacted truth-in-sentencing laws requiring individuals convicted of violent offens-es to serve 85% of their sentence before they could become parole-eligible.3 Those sentenced to life im-prisonment must serve 85% of their remaining life expectancy on the date of sentencing.
NUMBER PAROLED AND TIME SERVEDThe state granted parole to two people with parole-el-igible life sentences between 2003 and 2014. An indi-vidual paroled in 2005 had served 23.1 years upon being released, which occurred 1.5 months after his/her parole hearing. The second individual, who was expected to be released in November 2016, would have served 25.0 years and waited 2.5 years after his parole hearing to be released. There was a small (8%) increase in the length of time served between these releases. Both individuals had murder convictions.4
Time Served for All Paroled Lifers in North Dakota, 2003-2016 (Expected)
2003 2004 2005 2006-2016
0 0 1 1
Number of Paroled Lifers in North Dakota, 2003-2016 (Expected)
LIFER PAROLE HEARINGS AND GRANT RATESBetween 2003 and 2014, the North Dakota parole board reviewed six people with life sentences for possible parole release. Two of these six were granted parole. Grant rate analysis is not possible since the state did not provide data on annual hearing outcomes.
1 Nellis, A. (2013). Life goes on: The historic rise in life sentences in America. Washington, DC: The Sentencing Project. Retrieved from: http://sen-tencingproject.org/wp-content/uploads/2015/12/Life-Goes-On.pdf
2 N.D. Cent. Code §12.1-32
0
5
10
15
20
25
30
2016201520142013201220112010200920082007200620052004
23.1
25.0
No releases
Year
s
2003
3 N.D. Cent. Code § 12.1-32-09.1 4 North Dakota does not distinguish between first- and second-degree
murder. See: N.D. Cent. Code § 12.1-16-01.

49The Sentencing Project • 1705 DeSales Street NW, 8th Floor • Washington, D.C. 20036 • sentencingproject.org
DELAYING A SECOND CHANCE: STATE PROFILES
OhioKEY FINDINGS • Ohio law requires lifers convicted of murder after 1996 to serve 15 years before becoming parole-eli-
gible and those convicted of aggravated murder to serve a minimum of 20 years. Courts may also further postpone parole eligibility by setting minimum time served at 25 or 30 years.
• Between 1998 and 2014, time served increased somewhat for paroled lifers with murder convictions (from 18.1 to 21.2 years) and increased significantly for those with aggravated murder convictions (from 20.2 to 30.3 years).
• The number of paroled lifers with murder and aggravated murder convictions fell dramatically begin-ning in 2010. Between 2010 and 2014, an average of 34 such individuals were paroled annually, com-pared to 113 annually in the five previous years.
• The state’s lifer parole grant rate was 5% in 2014.
OVERVIEW AND POLICY HIGHLIGHTSThe 5,667 individuals serving parole-eligible life sen-tences in Ohio accounted for 11.1% of the state’s prison population in 2012.1 In 1996, Ohio abolished parole except for those convicted of murder and aggravated murder.2 Individuals serving a life sentence for a murder
Time Served for Paroled Lifers with Murder and Aggravated Murder Convictions in Ohio, 1998-2014
Number of Paroled Lifers with Murder Convictions in Ohio, 1998-20141998 1999 2000 2001 2002 2003 2004 2005 2006 2007 2008 2009 2010 2011 2012 2013 2014
Aggravated Murder 9 10 27 21 34 36 50 28 41 30 28 35 7 10 25 11 4
Murder 20 32 55 66 62 74 110 86 89 69 67 91 34 11 39 17 10
committed on or after July 1, 1996, are parole-eligible after serving 15 years, while those convicted of aggra-vated murder on or after July 1, 1996, are parole-eligi-ble after serving 20 years—unless the court specifies that parole eligibility is to be after 25 years or 30 years.3
0
5
10
15
20
25
30
3520
14
2013
2012
2011
2010
2009
2008
2007
2006
2005
200
4
2003
2002
2001
2000
1999
1998
Aggravated murder
Year
s
Murder

50The Sentencing Project • 1705 DeSales Street NW, 8th Floor • Washington, D.C. 20036 • sentencingproject.org
DELAYING A SECOND CHANCE: STATE PROFILES
1 Nellis, A. (2013). Life goes on: The historic rise in life sentences in America. Washington, DC: The Sentencing Project. Retrieved from: http://sen-tencingproject.org/wp-content/uploads/2015/12/Life-Goes-On.pdf
2 Ohio Rev. Code Ann. § 2967.133 Ohio Admin. Code § 5120-2-10. People serving a life sentence for
first-degree murder or aggravated murder committed prior to October 19,1981 are parole-eligible after serving 15 years, while those serving a life sentence for an offense other than first-degree murder or aggra-vated murder committed prior to October 19, 1981 are eligible after serving 10 years.
There has been a significant drop in the state’s overall parole rate over the last decade.4 State authorities claim that this has occurred because in the years since parole was abolished, all the individuals sentenced prior to 1996 who were most eligible for discretionary parole were likely to have already been released. The state was reportedly testing new risk assessment tools to help effectively increase parole rates.5
NUMBER PAROLED AND TIME SERVED6
The number of paroled lifers with murder and aggra-vated murder convictions increased from 29 in 1998 to 160 in 2004. Between 2005 and 2009, an average of 113 such individuals were paroled annually. Between 2010 and 2014, this annual average fell to 34.
Between 1998 and 2014, time served increased by 17% for paroled lifers with murder convictions: from 18.1 to 21.2 years. During this period, time served increased by 51% for paroled lifers with aggravated murder con-victions: from 20.2 to 30.3 years. Given that average time served was anomalously high for this second group in 2014, it may be more informative to examine trends between 1998 and 2013: during this period, time served increased by 30% for paroled lifers with aggravated murder convictions: from 20.2 to 26.3 years.
Denial rate
Grant rate
95%
5%
Number of hearings: 535
Ohio Parole Hearing Outcomes for Life-Maximum Sentences, 2014
LIFER PAROLE HEARINGS AND GRANT RATESIn 2014, the only full year for which data were provid-ed, the state granted parole in 25 of 535 lifer parole hearings, resulting in a grant rate of 5%.
4 Unknown. (2012, June 28). Changes may help more state prisoners get parole. Dayton Daily News. Retrieved from http://www.daytondaily-news.com/news/news/crime-law/changes-may-help-more-state-pris-oners-get-parole/nPgwm/
5 Prison breakthrough: Big data can help states decide whom to release from prison. (2014, April 19). The Economist. Retrieved from http://www.economist.com/news/united-states/21601009-big-data-can-help-states-decide-whom-release-prison-prison-breakthrough
6 Time served data retrieved from Time Served Reports from calendar years 1998 to 2014 available at http://www.drc.ohio.gov/reports/time-served

51The Sentencing Project • 1705 DeSales Street NW, 8th Floor • Washington, D.C. 20036 • sentencingproject.org
DELAYING A SECOND CHANCE: STATE PROFILES
OregonKEY FINDINGS • Current law requires that individuals 15 years of age and older who committed murder on or after June
30, 1995 be sentenced to life imprisonment and to serve a minimum of 25 years before becoming parole-eligible. Oregon law states that rehabilitation must be the only consideration during parole review.
• Between 2012 and 2014, the only years for which data were provided, average time served for paroled lifers with murder convictions was 26 years.
• Between 2012 and 2014, Oregon conducted an average of 35 lifer parole hearings annually. The state granted parole in 40 of the 105 total hearings conducted during this period, resulting in an overall grant rate of 38%.
OVERVIEW AND POLICY HIGHLIGHTSOregon’s 627 parole-eligible lifers constituted 4.4% of the state’s prison population. Virtually all lifers in 2012 (99%) had been convicted of murder.1
Current law requires that individuals 15 years of age and older who committed murder on or after June 30, 1995 be sentenced to life imprisonment and to serve a minimum of 25 years before becoming parole-eligi-ble.2 Life-sentenced individuals convicted of aggravat-ed murder in adult court who are at least 15 years of age must be confined for a minimum of 30 years before parole eligibility, unless they are sentenced to life without the possibility of parole.3 Those 18 and older also face the death penalty, and those under the age of 15 (if waived into adult court) must serve at least 30 years before becoming parole-eligible.4
Subsequent parole hearings can be scheduled no earlier than two years and no later than 10 years after the date of a denial.5
Oregon law states that rehabilitation must be the only consideration during parole review: “The sole issue is whether or not the prisoner is likely to be rehabilitated within a reasonable period of time.”6
NUMBER PAROLED AND TIME SERVEDBetween 2012 and 2014, average time served for paroled lifers with first- or second-degree murder con-victions remained stable, hovering around 26 years. The annual number of releases during this period ranged between nine and 20.
2012 2013 2014
11 20 9
0
5
10
15
20
25
30
201420132012
26.1
Year
s
25.9 25.1
Time Served for Paroled Lifers with Murder Convictions in Oregon, 2012-2014
Number of Paroled Lifers with Murder Convictions in Oregon, 2012-2014

52The Sentencing Project • 1705 DeSales Street NW, 8th Floor • Washington, D.C. 20036 • sentencingproject.org
DELAYING A SECOND CHANCE: STATE PROFILES
1 Nellis, A. (2013). Life goes on: The historic rise in life sentences in America. Washington, DC: The Sentencing Project. Retrieved from: http://sen-tencingproject.org/wp-content/uploads/2015/12/Life-Goes-On.pdf
2 Or. Rev. Stat. § 163.115. Also, those sentenced to life imprisonment for murder of a pregnant victim committed on or after January 1, 2010 must serve a minimum of 30 years before being eligible for parole. Or. Rev. Stat. § 163.155(5)
3 Or. Rev. Stat. § 161.620; Correspondence with Bobbin Singh. These
LIFER PAROLE HEARINGS AND GRANT RATESBetween 2012 and 2014, Oregon conducted an average of 35 lifer parole hearings each year. It granted parole in 40 of the 105 total hearings conducted during this period, resulting in an overall grant rate of 38%.
0
8
16
24
32
40
201420132012
33%
51%
27%
Granted parole
Denied parole
Grant rateNum
ber o
f hea
rings
Number of Lifer Parole Hearings and Grant Rates in Oregon, 2012-2014
statutes have not been amended since the Supreme Court’s Miller v. Alabama and Montgomery v. Louisiana decisions.
4 Or. Rev. Stat. § 163.105(1)(c); O.A.R. § 255-032-0010(2); Or. Rev. Stat. § 163.105(1)(a); Or. Rev. Stat. § 137.707.
5 ORS 161.620 (1999)6 Or. Admin. R. § 255-032-00357 Or. Rev. Stat. § 163.105

53The Sentencing Project • 1705 DeSales Street NW, 8th Floor • Washington, D.C. 20036 • sentencingproject.org
DELAYING A SECOND CHANCE: STATE PROFILES
Rhode IslandKEY FINDINGS • Rhode Island has gradually increased minimum sentences before parole eligibility for lifers convicted
of first- or second-degree murder, from 15 years for those convicted after 1989 to 25 years for those convicted after 2015.
• On average, two lifers with murder convictions were paroled each year between 2004 and 2012.
• Between 2004 and 2012, average time served for released lifers with first-degree murder convictions has ranged between 9.0 and 32.7 years, averaging 20.6 years between 2008 and 2012. Time served for released lifers with second-degree murder convictions has ranged between 18.4 and 26.2 years during this period, averaging 18.8 years between 2007 and 2012.
OVERVIEW AND POLICY HIGHLIGHTSThe 175 individuals serving sentences of life with the possibility of parole in Rhode Island represented 7.2% of the state’s prison population in 2012.1
Individuals serving life sentences for first- or second-de-gree murder become parole-eligible as follows:2
• Those convicted after July 10, 1989, are eligible after serving a minimum of 15 years
• Those convicted after June 30, 1995, are eligible after serving a minimum of 20 years
• Those convicted after July 1, 2015, are eligible after serving a minimum of 25 years.
NUMBER PAROLED AND TIME SERVEDOn average, two lifers with murder convictions were paroled each year between 2004 and 2012. For those with first-degree murder convictions, time served jumped from 9.0 years for the individual released in 2004 to 32.7 years for the one released in 2006. It then averaged 20.6 years for the 16 who were paroled between 2008 and 2012.
For those with second-degree murder convictions, time served has fallen from a peak of 26.2 years for
0
5
10
15
20
25
30
35
201220112010200920082007200620052004
Year
s
First-degree murder
Second-degree murder
Time Served for Paroled Lifers with Murder Convic-tions in Rhode Island, 2004-2012
Number of Paroled Lifers with Murder Convictions in Rhode Island, 2004-2012
the individual released in 2005 to an average of 18.8 years for the three released in 2007 and 2009.
LIFER PAROLE HEARINGS AND GRANT RATESData were not provided on lifer parole hearing out-comes.
1 Nellis, A. (2013). Life goes on: The historic rise in life sentences in America. Wash-ington, DC: The Sentencing Project. Retrieved from: http://sentencingproject.org/wp-content/uploads/2015/12/Life-Goes-On.pdf
2 R.I. Gen. Laws § 13-8-13
2004
2005
2006
2007
2008
2009
2010
2011
2012
First-degree murder 1 0 1 0 1 7 3 2 3
Second-degree murder 0 1 0 1 0 2 0 0 0

54The Sentencing Project • 1705 DeSales Street NW, 8th Floor • Washington, D.C. 20036 • sentencingproject.org
DELAYING A SECOND CHANCE: STATE PROFILES
South CarolinaKEY FINDINGS • Among the state’s 1,042 parole-eligible lifers in 2016, 62% were required to serve 20 years before
becoming eligible for parole consideration, 27% were required to serve 10 years, and 11% had to serve 30 years.
• Between 1980 and 2013, average time served for paroled lifers increased from 12 to 28 years for those with murder convictions and increased from 10 to 26 years for those with non-murder convictions.
• The total number of paroled lifers fell from 74 in the 1980s to 17 in the 1990s. It then increased to 249 in the 2000s. Between 2010 and 2013, 59 such individuals were paroled.
• While the state’s lifer parole grant rate averaged 10% in the 1980s, it dropped to 1% in the 1990s and then climbed to 5% in the 2000s. Between 2010 and 2013, the lifer parole grant rate was 3%. The number of lifer parole hearings increased significantly during this period.
OVERVIEW AND POLICY HIGHLIGHTSSouth Carolina prisons held 1,042 individuals with parole-eligible life sentences in 2016, constituting 4.9% of the state’s prison population.1 In addition, a signif-icant number of people were serving parole-ineligible life sentences or had sentences that exceeded 30 years.
Among parole-eligible lifers, 62% were required to serve 20 years before becoming eligible for parole consid-eration, 27% were required to serve 10 years, and 11% had to serve 30 years.2 Since 2010, the state legislature has mandated that people convicted of murder would be sentenced to a minimum of 30 years without the possibility of parole.3
In 2013, the South Carolina Supreme Court ruled that retroactive application of a law increasing the required number of votes from the parole board for a parole grant constituted an ex post facto violation.4
The South Carolina Department of Probation, Parole, and Pardon Services website explains that while victims “or anyone opposing parole” can attend hear-
ings in person, the parole board communicates with incarcerated individuals and their family member and supporters via videoconferencing.5
NUMBER PAROLED AND TIME SERVEDBetween 1980 and 2013, time served increased dra-matically for paroled lifers. For those paroled with murder convictions, average time served increased from 12 to 28 years during this period.6 For those with non-murder convictions, it increased from 10 to 26 years.
The number of paroled lifers has varied significantly across these decades. In the 1980s, a total of 74 lifers were paroled. Throughout the 1990s, only 17 were paroled. In the 2000s, 249 lifers were paroled. Between 2010 and 2013, 59 such individuals were paroled.

55The Sentencing Project • 1705 DeSales Street NW, 8th Floor • Washington, D.C. 20036 • sentencingproject.org
DELAYING A SECOND CHANCE: STATE PROFILES
Time Served for Paroled Lifers in South Carolina, 1980-201319
80
1981
1982
1983
1984
1985
1986
1987
1988
1989
1990
1991
1992
1993
1994
1995
1996
1997
1998
1999
2000
2001
2002
2003
2004
2005
2006
2007
2008
2009
2010
2011
2012
2013
Murder 10 2 12 6 5 8 12 4 5 3 0 2 3 2 2 0 1 0 0 1 51 38 14 10 21 11 20 7 5 6 10 7 15 12
Other 1 1 1 1 0 1 1 0 1 0 0 2 1 1 1 1 0 0 0 0 9 9 8 4 10 13 4 6 1 2 10 1 2 2
0
5
10
15
20
25
30
35
2013
2012
2011
2010
2009
2008
2007
2006
2005
200
420
0320
0220
0120
0019
9919
9819
9719
9619
9519
9419
9319
9219
9119
9019
8919
8819
8719
8619
8519
84
1983
1982
1981
1980
Murder
Other
Year
s
Number of Paroled Lifers in South Carolina, 1980-2013
LIFER PAROLE HEARINGS AND GRANT RATESThe drop in the number of paroled lifers in the 1990s and the subsequent increase in the 2000s were driven largely by changes in the number of hearings and parole grant rates. In 2000, the total number of lifer hearings increased to 591, from 241 in the previous year, and it averaged 480 until 2013.
The lifer parole grant rate averaged 10% in the 1980s—reaching as high as 42% in 1980. The average grant rate dropped to 1% in the 1990s—with no lifers paroled in 1990, 1997, and 1998. The grant rate then climbed to 5% in the 2000s. Between 2010 and 2013, the grant rate was 3%.
56The Sentencing Project • 1705 DeSales Street NW, 8th Floor • Washington, D.C. 20036 • sentencingproject.org
DELAYING A SECOND CHANCE: STATE PROFILES
1 South Carolina Department of Corrections. (2016, August). Sentence length distribution of total inmate population as of June 30, fiscal years 2012 - 2016. Retrieved from http://www.doc.sc.gov/pubweb/research/InmatePopulationStatsTrend/ASOFTrendSentenceLengthDistribution-FY12-16.pdf
2 South Caroline Department of Corrections, 20163 S.C. Code Ann. § 16-3; Omnibus Crime Reduction and Sentencing
Reform Act, S. 1154, 118th Gen. Assem. (S.C. 2010). Retrieved from http://www.scstatehouse.gov/billsearch.php?billnumbers=1154&ses-sion=118&summary=B
Number of Lifer Parole Hearings and Grant Rates in South Carolina, 1980-201342
%
17%
31%
13%
6% 7% 10%
3%5% 8% 3% 0% 3% 2% 1% 0% 1% 0%0% 0%
10%
10%
4% 3%
6% 6%
8%
3% 1% 2% 2%
4% 4% 3%
Denied parole
Granted parole
Grant rate
2013
2012
2011
2010
2009
2008
2007
2006
2005
200
420
0320
0220
01
2000
1999
1998
1997
1996
1995
1994
1993
1992
1991
1990
1989
1988
1987
1986
1985
198
419
8319
8219
8119
80
0
100
200
300
400
500
600
Num
ber o
f hea
rings
4 Barton v. South Carolina Department of Probation, Parole, and Pardon Services. 404 S.C. 395, 745 S.E.2d 110 (2013).
5 South Carolina Department of Probation, Parole and Pardon Services. (2015). Parole hearing explanation. Retrieved October 25, 2016, from http://www.dppps.sc.gov/Victim-Services/Parole-Hearing-Explanation
6 “Murder” in South Carolina is comparable to first-degree murder in other states.

57The Sentencing Project • 1705 DeSales Street NW, 8th Floor • Washington, D.C. 20036 • sentencingproject.org
DELAYING A SECOND CHANCE: STATE PROFILES
TexasKEY FINDINGS • Texas ranks third in the nation in the size of its parole-eligible lifer population. In 1993, the state in-
creased its statutory minimum sentence before parole eligibility for lifers with capital felony convictions to 40 years; since 2005, adults with these convictions have been ineligible for parole. Also since 1993, lifers with non-capital murder convictions and several other convictions must serve a minimum of 30 years before becoming eligible for parole consideration. Since 1995, adults serving life sentences for aggravated sexual crimes must serve 35 years before becoming parole-eligible.
• The average length of time served for paroled lifers with murder convictions increased from 21 to 26 years between 2003 and 2013.
• The number of paroled lifers with murder convictions has gradually increased from 30 in 2003 to 74 in 2013. No lifers were paroled in 2005 and a high of 97 were paroled in 2012.
OVERVIEW AND POLICY HIGHLIGHTSTexas ranks third in the nation in the size of its pa-role-eligible lifer population, with 8,493 individuals serving this sentence in 2012—5.6% of the state’s prison population.1 Just over half (55%) were convict-ed of murder, another 23% were convicted of a sex offense, and 15% were convicted of either aggravated assault, robbery, or kidnapping. The remainder were convicted of a drug offense (2%), a property offense (3%), or other crime (2%).
The Texas Code of Criminal Procedure determines the minimum amount of time that must be served before lifers are eligible to apply for parole, based on the offense type and date. These requirements include:
• For those with capital felony convictions, including capital murder, the minimum sentence before parole eligibility increased to 40 years in 1993; since 2005, adults with these convictions have been ineligible for parole.2 Individuals convicted of capital murder as juveniles become parole-eli-gible after serving 40 years.3
• Lifers convicted of an offense classified as “3(g)” other than capital murder and aggravated sexual offenses since 1993 must serve a minimum of 30
years (50% of the life sentence, double the previous requirement).4 3(g) offenses currently include murder, burglary, aggravated kidnapping, and the commitment of any felony offense with a deadly weapon.5 Lifers convicted of aggravated sexual offenses since 1995 must serve 35 calendar years before they become eligible for parole. 6
The Texas Board of Pardons and Paroles is composed of seven members who serve a six-year term. They are appointed by the governor with the advice and consent of the Senate.7 Fourteen parole commissioners, hired by the board, assist in the parole decisionmaking process. If a person is denied parole, the Board sets a new review date within one to five years.
NUMBER PAROLED AND TIME SERVEDThe number of paroled lifers with murder convictions has gradually increased from 30 in 2003 to 74 in 2013. No lifers were paroled in 2005 and a high of 97 were paroled in 2012. Average time served for these indi-viduals has ranged from 21 years for those paroled in 2003 to 26 years in 2013.

58The Sentencing Project • 1705 DeSales Street NW, 8th Floor • Washington, D.C. 20036 • sentencingproject.org
DELAYING A SECOND CHANCE: STATE PROFILES
1 Only California and New York have larger parole-eligible lifer populations. Nellis, A. (2013). Life goes on: The historic rise in life sentences in America. Washington, DC: The Sentencing Project. Retrieved from: http://sen-tencingproject.org/wp-content/uploads/2015/12/Life-Goes-On.pdf.
2 These are “flat years” and are therefore ineligible for good time credits. Texas Department of Criminal Justice Parole Division & Texas Board of Pardons and Parole. (2011). Parole in Texas. Retrieved from https://www.tdcj.state.tx.us/documents/parole/PIT_English.pdf; Justice for Veterans Campaign. (2012). Determining your parole eligibility. Retrieved from http://www.texascjc.org/sites/default/files/jc_files/TCRP,_JFVC_Determining_Your_Parole_Eligibility_(June_2012).pdf.
3 Chammah, M. (2013, May 13). House panel OKs parole after 40 years for young murderers [Newsgroup post]. Retrieved from https://www.texastribune.org/2013/05/13/house-panel-approves-parole-after-40-years-17-year/.
LIFER PAROLE HEARING AND GRANT RATESData were not provided on lifer parole hearing out-comes.
2003
2004
2005
2006
2007
2008
2009
2010
2011
2012
2013
30 15 0 12 39 40 58 71 83 97 74
Time Served for Paroled Lifers with Murder Convictions in Texas, 2003-2013
Note: There were no releases in 2005.
Number of Paroled Lifers with Murder Convictions in Texas, 2003-2013
0
5
10
15
20
25
30
20132012201120102009200820072006200520042003
Year
s
4 Tex. Government Code Ann. § 508.145(d)(1). Must be 30 “flat years” that are therefore ineligible for good time credits. Texas Department of Criminal Justice Parole Division & Texas Board of Pardons and Parole, 2011.
5 Tex. Criminal Code Ann. § 42.12(3)(g).6 Tex. Government Code Ann. § 508.145(c).7 Texas Board of Pardons and Parole. (2014). Annual statistical report FY
2014. Retrieved from http://www.tdcj.state.tx.us/bpp/publications/FY2014%20BPP%20StatisticalReport.pdf.

59The Sentencing Project • 1705 DeSales Street NW, 8th Floor • Washington, D.C. 20036 • sentencingproject.org
DELAYING A SECOND CHANCE: STATE PROFILES
UtahKEY FINDINGS • With 1,943 individuals serving parole-eligible life sentences in 2012, Utah’s prisons have the highest
proportion of such lifers in the country, at 27.7%. Unlike most states, the majority of lifers in Utah (62%) have been convicted of a sex offense, while 19% have been convicted of a homicide, and 16% have been convicted of aggravated assault, robbery, or kidnapping.
• The Utah Board of Pardons and Parole stands out for its restrictive parole policies and practices. It can impose “natural life” sentences potentially amounting to a lifelong parole denial without recon-sideration. The board also determines when original hearings are held—reportedly not until 22 to 24 years for those with murder convictions. It can also set lengthy waits for subsequent hearings: in one case, the board required a 28-year wait.
• After the release of one parole-eligible lifer with a murder conviction in 1993 who had served 9.9 years, no such lifers were released for another 10 years. Time served among the 14 people released between 2003 and 2015 averaged 25.0 years.
• Between 1992 and 2014, the parole board conducted an average of three lifer parole hearings each year for lifers with murder convictions, the only group whose parole outcomes were analyzed. The grant rate increased during this period, from 13% between 1992 and 1999, to 23% between 2000 and 2009, to 43% between 2000 and 2014.
OVERVIEW AND POLICY HIGHLIGHTSUtah prisons have the highest proportion of parole-el-igible lifers in the country. The 1,943 individuals with these sentences in 2012 constituted 27.7% of the state’s prison population.1 This is due to the state’s indeterminate sentencing system. Unlike most states, the majority of lifers in Utah (62%) have been convict-ed of a sex offense, while 19% have been convicted of a homicide, and 16% have been convicted of aggra-vated assault, robbery, or kidnapping.
The Utah Board of Pardons and Parole stands out compared to other states for its restrictive parole policies and practices. Between 2008 and 2012, the board issued 73 “natural life” sentences, which can amount to lifelong parole denial without reconsider-ation.2 Individuals who receive a decision of natural life in prison are eligible for redetermination at ten-year intervals.3 The increased number of these decisions
in recent years has raised the total number of people serving natural life sentences to 108. The board can impose natural life sentences to individuals with any of the following first-degree felonies: murder, rape, child kidnapping, aggravated burglary, aggravated robbery, arson, and possession of a controlled sub-stance with intent to distribute near a school.
The parole board also has great latitude in setting initial and subsequent hearing dates. The Board’s website states, “In cases where a life has been taken, the Board will review each case and schedule the original hearing based upon the unique facts of the case.”4 In 2012, a Board spokesperson stated that in-dividuals with sex offense convictions, who are com-monly sentenced to five years to life, typically come before the board after serving three years.5 Most indi-viduals convicted of murder, however, serve 22 to 24

60The Sentencing Project • 1705 DeSales Street NW, 8th Floor • Washington, D.C. 20036 • sentencingproject.org
DELAYING A SECOND CHANCE: STATE PROFILES
years before being eligible for their first hearings. After a parole denial, those not sentenced to natural life by the Board may request a redetermination hearing in five years.6 The Board has in the past set a 28-year wait for a subsequent hearing.7
The parole board has five full-time members and up to five part-time members who serve on the Board as needed. The governor appoints Board members who are then confirmed by the Senate. Board members serve staggered five-year terms.
0
5
10
15
20
25
30
35
40
45
2015
2014
2013
2012
2011
2010
2009
2008
2007
2006
2005
200
4
2003
2002
2001
2000
1999
1998
1997
1996
1995
1994
1993
1992
Year
s
Time Served for Paroled Lifers with Murder Convictions in Utah, 1992-2015
1992
1993
1994
1995
1996
1997
1998
1999
2000
2001
2002
2003
2004
2005
2006
2007
2008
2009
2010
2011
2012
2013
2014
2015
0 1 0 0 0 0 0 0 0 0 0 1 0 2 1 0 2 1 1 1 0 2 2 1
Number of Paroled Lifers with Murder Convictions in Utah, 1992-2015
NUMBER PAROLED AND TIME SERVEDBetween 1992 and 2015, 15 parole-eligible lifers with murder convictions were released. Following the release of an individual in 1993 who had served 9.9 years, no one was released for another 10 years. Time served among those released between 2003 and 2015 averaged 25.0 years, ranging between 18.3 and 43.3 years.

61The Sentencing Project • 1705 DeSales Street NW, 8th Floor • Washington, D.C. 20036 • sentencingproject.org
DELAYING A SECOND CHANCE: STATE PROFILES
1 Nellis, A. (2013). Life goes on: The historic rise in life sentences in America. Washington, DC: The Sentencing Project. Retrieved from: http://sen-tencingproject.org/wp-content/uploads/2015/12/Life-Goes-On.pdf
2 Adams, B. (2012, October 15). ‘Natural life’ sentence on the rise for Utah inmates. The Salt Lake Tribune. Retrieved from http://archive.sltrib.com/story.php?ref=/sltrib/news/54485777-78/board-prison-in-mates-natural.html.csp
3 Redetermination is a process whereby the Department of Corrections or the incarcerated individual may request that the parole board review new, material, and significant information, or reconsider a prior decision. Hamilton, K. N. (2015, April). Sentence TBD: A practical primer on Utah’s
LIFER PAROLE HEARINGS AND GRANT RATESFor greater comparability with other states, this anal-ysis is narrowed to parole hearing outcomes for lifers with murder convictions. Between 1992 and 2014, the parole board conducted an average of three such hearings each year. The annual grant rate has ranged from 0% to 100%. When examined across several years, the grant rate has increased during this period, from 13% between 1992 and 1999, to 23% between 2000 and 2009, to 43% between 2000 and 2014.
0
2
4
6
8
2014
2013
2012
2011
2010
2009
2008
2007
2006
2005
200
4
2003
2002
2001
2000
1999
1998
1997
1996
1995
1994
1993
1992
Denied parole
Granted parole
Grant rate
0% 0% 0%0%0%0%0% 0%0%
100%
20%
67%
14%
33%
17%
33%
50%
67%
40%N
umbe
r of h
earin
gs
Number of Lifer Parole Hearings and Grant Rates for Individuals with Murder Convictions in Utah, 1992-2014
indeterminate sentencing structure and the Board of Pardons and Parole. Powerpoint presented at Utah Law and Justice Center Public Forum, Salt Lake City, UT. Retrieved from http://www.acluutah.org/about-us/item/download/39_efd463d723f717dcd0455e2c6b62e55e; see Utah Admin. Code § R671-316-1
4 State of Utah Board of Pardons and Parole. (2016). Hearing types. Retrieved from http://bop.utah.gov/index.php/hearings-top-public-menu/types
5 Adams, 20126 Utah Admin. Code § R671-316-17 Adams, 2012; State of Utah v. Todd, 231 UT App (2013)

62The Sentencing Project • 1705 DeSales Street NW, 8th Floor • Washington, D.C. 20036 • sentencingproject.org
DELAYING A SECOND CHANCE: STATE PROFILES
WashingtonKEY FINDINGS • One in nine people in Washington’s prisons—2,000 in total—were serving parole-eligible life sentenc-
es in 2012. In 2011, there were 325 parole-eligible lifers with convictions predating 1984, meaning that they had served at least 28 years in prison.
• During the 1980s an average of 17 lifers were paroled annually with first- or second- degree murder convictions. This figure fell to eight annually between 2000 and 2013. Average time served for paroled lifers with first- and second- degree murder convictions rose steadily from six years in 1980 to 34 years in 2013. This overall increase in time served may be driven in part by the shrinking pool of pa-role-eligible lifers since the state significantly curbed discretionary parole for offenses committed after 1984.
• Between 1980 and 2013, the gap in time served for those paroled with first- and second-degree murder has not only diminished, it has inverted. In several recent years, the period of time served by paroled lifers with second-degree murder convictions has exceeded the period of imprisonment of paroled lifers with first-degree murder convictions.
• The total number of lifer parole hearings plummeted between 1984 and 2012, from a high of nearly 1000 hearings in 1986 to a low of 20 in 2012. Amidst this dramatic reduction in number of parole hearings, Washington’s paroling authority has maintained a high parole rate, falling only as low as 65% between 1984 and 2012.
• In 2013, the state Supreme Court ruled unanimously that the Governor could revoke the paroling au-thority’s grant decisions.
OVERVIEW AND POLICY HIGHLIGHTSThere were 2,000 individuals with parole-eligible life sentences in Washington in 2012, constituting 11.7% of the state’s prison population.1 Eighty-eight percent of these individuals had sexual assault convictions, 8% were convicted of murder, and 4% were convicted of aggravated assault, robbery, or kidnapping.2 In ad-dition, a significant number of people were serving parole-ineligible life sentences—many of whom were convicted under the state’s pioneering “three strikes” law3—or de facto life-without-parole sentences.4
With the enactment of the Sentencing Reform Act in 1981, which established the state’s determinate sen-tencing system, Washington eliminated its official parole board and replaced it with the Indeterminate Sentence Review Board (ISRB).5 The ISRB consists of four members, appointed by the governor, who serve five-year terms.6 The ISRB has jurisdiction over indi-
viduals with three types of sentences: those who were sentenced for crimes committed before July 1, 1984 (the implementation date of the Sentencing Reform Act), those convicted of certain sex offenses commit-ted after September 1, 2001, and those convicted under the age 18 for certain crimes.7 In 2011, 325 individuals under the ISRB’s jurisdiction had convictions predating 1984, meaning that they had served at least 28 years in prison.8
In 2013, the state Supreme Court ruled unanimously that the governor could revoke the ISRB’s parole grants.9 The case involved then-Governor Chris Gregoire’s invocation of a rarely used executive power to overturn parole granted to an individual convicted of attacking a police officer with a knife and gun. Ac-cording to a governor spokeswoman, “no governor had overruled a parole-board decision in at least 30 years.”10

63The Sentencing Project • 1705 DeSales Street NW, 8th Floor • Washington, D.C. 20036 • sentencingproject.org
DELAYING A SECOND CHANCE: STATE PROFILES
NUMBER PAROLED AND TIME SERVEDThe number of paroled lifers with first- or second- degree murder convictions has gradually fallen since 1980. During the 1980s, 17 such individuals were paroled annually, on average. This figure dropped to 12 in the 1990s and has averaged eight each year between 2000 and 2013.
Average time served for paroled lifers with first- and second- degree murder convictions has risen steadily, from six to 34 years between 1980 and 2013.
As the figure below shows, the gap in time served for those paroled with first- and second-degree murder has not only diminished, it has inverted—meaning that those with the less serious conviction (second-degree
1980
1981
1982
1983
1984
1985
1986
1987
1988
1989
1990
1991
1992
1993
1994
1995
1996
1997
1998
1999
2000
2001
2002
2003
2004
2005
2006
2007
2008
2009
2010
2011
2012
2013
First-degree murder 1 3 4 2 1 7 6 4 13 3 1 2 6 5 7 12 5 10 5 6 7 3 6 9 9 6 2 5 9 6 6 8 9 4
Second-degree murder 14 2 1 4 7 24 12 26 25 13 6 7 11 9 13 7 5 3 0 2 1 0 1 3 2 4 1 0 3 2 0 2 0 1
murder) are serving longer sentences than those with the more serious conviction (first-degree murder.) In the 1980s and 1990s, average time served was 15 years for lifers paroled with first-degree murder con-victions, and 9 years for those with second-degree murder convictions. Between 2000 and 2013, average time served was 25 years for those with first-degree murder convictions, and 27 years for those with sec-ond-degree murder convictions.11 In several recent years, the period of time served by paroled lifers with second-degree murder convictions has exceeded the period of imprisonment of paroled lifers with first-de-gree murder convictions.
0
5
10
15
20
25
30
35
40
45
50
2013
2012
2011
2010
2009
2008
2007
2006
2005
200
420
0320
0220
0120
0019
9919
9819
97
1996
1995
1994
1993
1992
1991
1990
1989
1988
1987
1986
1985
198
419
8319
8219
8119
80
First-degree murder
Second-degree murder
Year
s
Time Served for Paroled Lifers with First- and Second-Degree Murder Convictions in Washington, 1980-2013
Number of Paroled Lifers with First- and Second-Degree Murder Convictions in Washington, 1980-2013

64The Sentencing Project • 1705 DeSales Street NW, 8th Floor • Washington, D.C. 20036 • sentencingproject.org
DELAYING A SECOND CHANCE: STATE PROFILES
1 Nellis, A. (2013). Life goes on: The historic rise in life sentences in America. Washington, DC: The Sentencing Project. Retrieved from: http://sen-tencingproject.org/wp-content/uploads/2015/12/Life-Goes-On.pdf
2 Nellis, 2013 3 The Persistent Offender Accountability Act (POAA) of 1993 mandates
a life-without-parole sentence for individuals convicted of three felony offenses that are classified as “most serious offenses,” which include all Class A felonies and certain Class B felonies. Since the passage of the law, the legislature has expanded the “most serious offenses” category as well as the definition of “persistent offender.” See Lee, M. (n.d.). Washington’s Three Strikes Law: Public safety & cost implications of life without parole. Retrieved from Columbia Legal Services website: http://www.columbialegal.org/sites/default/files/3Strikes.pdf; Boerner, D., & Lieb, R. (2001). Sentencing reform in the other Washington. Crime and Justice, 71-136. Retrieved from: http://www.wsipp.wa.gov/Report-File/731/Wsipp_Sentencing-Reform-in-the-Other-Washington_Full-Re-port.pdf
4 Nellis, 2013; Blagg, D., Brown, M., Buchanan, A., Ellis, B., Gee, O., Hewitt, A., . . . Scott, N. (2015, May). Life without parole sentences in Washington State. Retrieved from https://lsj.washington.edu/undergraduate/life-without-parole-sentences-washington-state
LIFER PAROLE HEARINGS AND GRANT RATESThe number of parole hearings for all lifers has dropped significantly from an annual average of 679 between 1984 and 1989 to 30 between 2000 and 2012. Amidst this dramatic reduction in number of parole hearings, Washington’s paroling authority has maintained a high parole rate, falling only as low as 65% over this 29-year period.
0
200
400
600
800
1000
2012
2011
2010
2009
2008
2007
2006
2005
200
4
2003
2002
2001
2000
1999
1998
1997
1996
1995
1994
1993
1992
1991
1990
1989
1988
1987
1986
1985
198
4
Granted parole
Denied parole
Grant rate
91%
85%
77%
74%
65%
75%
80%
93%
83%
88%
74%
75%
95%
92%
79%
82%
78%
82%
85%
85%
94%
87%
92%
92%
95%
100%
86%
88%
76%
Num
ber o
f hea
rings
Number of Lifer Parole Hearings and Grant Rates in Washington, 1984-2012
5 State of Washington Sentencing Guidelines Commission, The Sentenc-ing Reform Act at Century’s End: An Assessment of Adult Felony Sentencing Practices in the State of Washington, (Wash. 2000). Re-trieved from http://www.cfc.wa.gov/PublicationSentencing/Research/SentencingReformActReportCenturyEnd.pdf
6 Washington State Department of Corrections. (n.d.). Indeterminate Sentence Review Board (ISRB) - Board members. Retrieved from http://doc.wa.gov/corrections/isrb/docs/isrb-board-members.pdf
7 State of Washington Department of Corrections. (2016, March). Inde-terminate Sentence Review Board (ISRB) (Policy No. DOC 320.100). Re-trieved from http://www.doc.wa.gov/information/policies/files/320100.pdf
8 Blagg, D. et al., 20159 Sullivan, J. (2013, November 7). State Supreme Court: Governor can
cancel parole. The Seattle Times. Retrieved from http://www.seattle-times.com/news/state-supreme-court-governor-can-cancel-parole/
10 Sullivan, 201311 Excluding the individual paroled in 2000 that had served 47 years for
second-degree murder, time served for lifers paroled with this offense between 2000 and 2013 was only 3% lower than for those with first-de-gree murder convictions.

65The Sentencing Project • 1705 DeSales Street NW, 8th Floor • Washington, D.C. 20036 • sentencingproject.org
DELAYING A SECOND CHANCE: STATE PROFILES
West VirginiaKEY FINDINGS • Individuals with “Life with Mercy” sentences must serve a minimum of 10 years before becoming
eligible for parole consideration, unless their conviction is for first-degree murder committed after 1994 or they have two prior felony convictions, in which case the minimum sentence is 15 years.
• The state significantly increased its annual number of parole hearings beginning in 2005. For the seven prior years, it had conducted an annual average of 12 hearings. Between 2005 and 2013, the annual average number of hearings increased to 69. The parole grant rate also increased from 5% in the first period to 17% in the second.
• Between 1998 and 2005, an average of one lifer was paroled each year. Between 2006 and 2013, 12 lifers were paroled each year, on average. Average time served for these individuals increased from 17.6 years in the first period to 19.4 years in the second.
OVERVIEW AND POLICY HIGHLIGHTSWest Virginia prisons held 359 individuals with pa-role-eligible life sentences in 2012, constituting 5.1% of the state’s prison population.1
People with indeterminate sentences become eligible for parole consideration after serving the minimum term of their sentence.2 Those with “Life with Mercy” sentences must serve a minimum of 10 years unless they were convicted of first-degree murder after June 9, 1994, or if they have two prior felony convictions, in which case the minimum sentence is 15 years.
The West Virginia Parole Board consists of nine full-time members who serve six-year terms. Members are appointed by the governor and confirmed by the Senate.3 Representation of both political parties, as well as a balance of congressional districts, is required.4
Under H.B. 4210 (2014), the parole board created new youth-specific criteria for parole eligibility.
1998
1999
2000
2001
2002
2003
2004
2005
2006
2007
2008
2009
2010
2011
2012
2013
0 2 0 0 1 0 1 5 16 18 9 11 5 10 10 20
0
5
10
15
20
25
30
2013
2012
2011
2010
2009
2008
2007
2006
2005
200
4
2003
2002
2001
2000
1999
Year
s
1998
Number of Paroled Lifers in West Virginia, 1998-2013
Time Served for All Paroled Lifers in West Virginia, 1998-2013

66The Sentencing Project • 1705 DeSales Street NW, 8th Floor • Washington, D.C. 20036 • sentencingproject.org
DELAYING A SECOND CHANCE: STATE PROFILES
1 Nellis, A. (2013). Life goes on: The historic rise in life sentences in America. Washington, DC: The Sentencing Project. Retrieved from: http://sen-tencingproject.org/wp-content/uploads/2015/12/Life-Goes-On.pdf
2 West Virginia Parole Board. (2006, July). Rules of the West Virginia Parole Board. Retrieved from http://www.paroleboard.wv.gov/SiteCollection-Documents/West%20Virginia%20Parole%20Board%20Procedural%20Rules.pdf
NUMBER PAROLED AND TIME SERVEDBetween 1998 and 2005, one lifer was paroled each year, on average. Between 2006 and 2013, 12 lifers were paroled each year, on average. Average time served for these individuals increased from 17.6 years in the first period to 19.4 years in the second.
0
10
20
30
40
50
60
70
80
90
2013201220112010200920082007200620052004200320022001200019991998
0% 0%17%
9%
25% 27
%
6%
13%
24%
Granted parole
Denied parole
Grant rateNum
ber o
f hea
rings
0% 0% 8%
9%
17% 19%
12%
Number of Lifer Parole Hearings and Grant Rates in West Virginia, 1998-2013
LIFER PAROLE HEARINGS AND GRANT RATESBetween 1998 and 2004, the state conducted an average of 12 lifer parole hearings each year. Between 2005 and 2013, the annual average number of hearings increased to 69. The parole grant rate was 5% in the first period and increased to 17% in the second.
3 West Virginia Parole Board. (n.d.). General information. Retrieved from http://www.paroleboard.wv.gov/aboutus/Pages/Brendatestpage.aspx
4 West Virginia Parole Board. (2009, July). West Virginia Parole Board annual report July 1, 2008 – June 30, 2009. Retrieved from http://www.paroleboard.wv.gov/SiteCollectionDocuments/55th%20Annual%20Report%20FY%2008.09.pdf

67The Sentencing Project • 1705 DeSales Street NW, 8th Floor • Washington, D.C. 20036 • sentencingproject.org
DELAYING A SECOND CHANCE: STATE PROFILES
WisconsinKEY FINDINGS • The Wisconsin legislature requires that individuals sentenced to life with the possibility of parole for
crimes committed after 1999 serve at least 20 years before courts can evaluate their eligibility for extended supervision. This analysis is focused on individuals convicted prior to this date.
• Between 1989 and 2013, average time served has doubled for paroled lifers with first- or second-de-gree murder convictions, from 15.2 years to 30.0 years. Time served has more than doubled for the small number of lifers with non-murder convictions, from 10.6 years for those paroled in the early 1990s to 23.5 years for those paroled in the mid-2000s.
• Between 1989 and 2013, the average number of lifers with first- or second-degree murder convictions paroled each year has fluctuated between two and ten.
• The state increased its annual number of lifer parole hearings from an average of 182 between 1989 and 2002 to 265 from 2003 to 2013. Throughout this period, the parole grant rate has ranged between 0% and 9%. Between 2011 and 2013, it has been between 1% and 2%.
OVERVIEW AND POLICY HIGHLIGHTSWisconsin prisons held 956 individuals with parole-el-igible life sentences in 2012, constituting 4.3% of the state’s prison population.1 Virtually all of the life-sen-tenced individuals (99%) were convicted of murder.
The Wisconsin legislature requires lifers to serve at least 20 years if convicted of crimes committed on or after December 31, 1999.2 After that period courts can evaluate the individual’s eligibility for extended super-vision.
The parole board in Wisconsin is composed of seven commissioners and a chair.3 The governor appoints the chair, and the remaining commissioners are civil servants. Media reports note that under Governor Scott Walker, parole grant rates have plummeted for all in-carcerated individuals convicted of crimes before the “truth-in-sentencing” law took effect in 2000, which eliminated discretionary parole release.4 Governor Walker authored the state’s truth-in-sentencing legis-lation when he was in the state Assembly.
NUMBER PAROLED AND TIME SERVED Between 1989 and 1994, an average of 10 lifers with first- or second-degree murder convictions were paroled each year. Between 1995 and 2003, an average of two such lifers were paroled each year. This average in-creased to 10 per year between 2004 and 2010 and fell to four per year between 2011 and 2013.
Average time served has doubled during this period for paroled lifers with first- or second-degree murder convictions: from 15.2 years in 1989 to 30.0 years in 2013.
Time served has also more than doubled for paroled lifers with non-murder convictions. The two such in-dividuals released in the early 1990s had served an average of 10.6 years while the two released in the mid-2000s had served an average of 23.5 years.

68The Sentencing Project • 1705 DeSales Street NW, 8th Floor • Washington, D.C. 20036 • sentencingproject.org
DELAYING A SECOND CHANCE: STATE PROFILES
1989
1990
1991
1992
1993
1994
1995
1996
1997
1998
1999
2000
2001
2002
2003
2004
2005
2006
2007
2008
2009
2010
2011
2012
2013
First- and Second-Degree Murder 5 6 10 16 12 8 3 1 3 4 2 2 1 0 5 10 16 8 8 11 11 9 6 3 3
Non-Murder 0 0 0 1 1 0 0 0 0 0 0 0 0 0 0 1 1 0 0 0 0 0 0 0 0
Total 5 6 10 17 13 8 3 1 3 4 2 2 1 0 5 11 17 8 8 11 11 9 6 3 3
Time Served for Paroled Lifers with First- and Second-Degree Murder Convictions in Wisconsin, 1989-2013
0
5
10
15
20
25
30
35
2013
2012
2011
2010
2009
2008
2007
2006
2005
200
4
2003
2002
2001
2000
1999
1998
1997
1996
1995
1994
1993
1992
1991
1990
1989
Year
s
Number of Paroled Lifers in Wisconsin, 1989-2013
LIFER PAROLE HEARINGS AND GRANT RATESThe annual number of lifer parole hearings has in-creased from an average of 182 between 1989 and 2002 to 265 from 2003 to 2013. Throughout this period, the parole grant rate ranged between 0% and 9% of conducted hearings. Between 2011 and 2013, it was between 1% and 2%. On average, 11 individuals waived their parole hearings each year (and were therefore not included in this analysis).
0
5
10
15
20
25
20052004200320022001200019991998199719961995199419931992No releases
Year
s
10.111.1
23.2 23.8
Time Served for Paroled Lifers with Non-Murder Convictions in Wisconsin, 1992-2005

69The Sentencing Project • 1705 DeSales Street NW, 8th Floor • Washington, D.C. 20036 • sentencingproject.org
DELAYING A SECOND CHANCE: STATE PROFILES
1 Nellis, A. (2013). Life goes on: The historic rise in life sentences in America. Washington, DC: The Sentencing Project. Retrieved from: http://sen-tencingproject.org/wp-content/uploads/2015/12/Life-Goes-On.pdf
2 Wis. Stat. § 973.0143 Four commissioner positions were vacant at the time of this writing.
Wisconsin Department of Corrections. (n.d.). Parole commission. Retrieved October 25, 2016, from http://doc.wi.gov/about/parole-co mission. See also: Wisconsin Department of Corrections. (2016, January
0
50
100
150
200
250
300
350
2013
2012
2011
2010
2009
2008
2007
2006
2005
200
4
2003
2002
2001
2000
1999
1998
1997
1996
1995
1994
1993
1992
1991
1990
1989
Granted parole
Denied parole
Grant rate
3% 3% 5%
9% 7% 4%
1% 1% 2% 2% 1% 1% 1% 2%0%
5% 7%
3% 3% 4% 4% 3% 2% 1% 1%
Num
ber o
f hea
rings
Number of Lifer Parole Hearings and Grant Rates in Wisconsin, 1989-2013
25). State of Wisconsin Parole Commission. Retrieved October 25, 2016, from http://doc.wi.gov/Documents/WEB/ABOUT/PAROLECOMMIS-SION/PC%20Org%20Chart%20-%20Current.pdf
4 Hall, D. J. (2014, March 2). Parole plummet under Scott Walker. Wis-consin State Journal. Retrieved from http://host.madison.com/wsj/news/local/crime_and_courts/paroles-plummet-under-scott-walker/article_afd603f4-7fec-5cf9-9e07-a336182e834a.html

70The Sentencing Project • 1705 DeSales Street NW, 8th Floor • Washington, D.C. 20036 • sentencingproject.org
DELAYING A SECOND CHANCE: STATE PROFILES
WyomingKEY FINDINGS • The Wyoming Board of Parole cannot grant parole to individuals serving life sentences; rather, the
board can recommend a sentence commutation to the governor after the individual has served 10 years and then evaluate parole eligibility if the governor commutes the sentence to a term of years. Individuals serving life-without-parole sentences may not have their sentences commuted.
• During fiscal year 2015, the board significantly restricted its commutation policies to reduce the fre-quency of hearings and to eliminate the in-person participation of lifers.
• By 2014, the state had paroled 11 individuals who had been sentenced to life since 1980 for murder convictions. Among those with first-degree murder convictions, average time served increased from 16 years for the two individuals paroled in the 1990s, to 26 years for the seven paroled between 2004 and 2014.
OVERVIEW AND POLICY HIGHLIGHTSWyoming prisons held 154 individuals with life sen-tences1 in 2012, constituting 7.8% of the state’s prison population.2
Since the Wyoming Board of Parole lacks legal author-ity to grant parole to life-sentenced individuals, “The distinction between a sentence of life and a sentence of life without parole is that the governor may commute a sentence of life to a term of years, while a sentence of life without parole may not be commuted.”3 For in-dividuals with life sentences, the parole board can only recommend a sentence commutation to the governor and then evaluate parole eligibility for individuals whose sentences have been commuted to a term of years.4 The governor cannot commute life-without-pa-role sentences for adults.5
During fiscal year 2015, the board significantly restrict-ed its commutation policies to reduce the frequency of hearings and to eliminate the in-person participation of lifers. Whereas previously lifers could begin seeing the parole board yearly or every other year after serving 10 years, the new policy permits them:
to petition the Board for a commutation once every 5 years. If, after a 3-member panel of the Board
reviews the petition and agrees by majority deci-sion, the petition is forwarded to the full Board of 7 members for a hearing to be held via tele-con-ference to discuss a possible recommendation for commutation. 6
The board states that it ended in-person hearings for these individuals and reduced their frequency of hear-ings in order to reduce the impact on victims. Before implementing the new policy, the board granted one last “courtesy” hearing to individuals who will no longer see the board with the same regularity as in the past.
NUMBER PAROLED AND TIME SERVEDBy 2014, the state had paroled 11 individuals who had been sentenced to life since 1980 for murder convic-tions.
Time served gradually increased for this small group. The two individuals paroled in the 1990s with first-de-gree murder convictions served an average of 16 years. Average time served increased to 26 years for the seven such lifers paroled between 2004 and 2014.

71The Sentencing Project • 1705 DeSales Street NW, 8th Floor • Washington, D.C. 20036 • sentencingproject.org
DELAYING A SECOND CHANCE: STATE PROFILES
1 “Life sentences” and “lifers” hereon refers only to life sentences that are eligible for parole after commutation.
2 Nellis, A. (2013). Life goes on: The historic rise in life sentences in America. Washington, DC: The Sentencing Project. Retrieved from: http://sen-tencingproject.org/wp-content/uploads/2015/12/Life-Goes-On.pdf
3 Fetsco, D. M. (2011). Early release from prison in Wyoming: An overview of parole in Wyoming and elsewhere and an examination of current and future trends. Wyoming Law Review, 11(1), 99-124. Retrieved from http://www.uwyo.edu/law/_files/docs/wy%20law%20review/v11%20n1/fetsco.pdf, 106-107.
1994
1995
1996
1997
1998
1999
2000
2001
2002
2003
2004
2005
2006
2007
2008
2009
2010
2011
2012
2013
2014
First-degree murder 1 0 1 0 0 0 0 0 0 0 1 0 0 0 1 1 3 0 0 0 1
Second-degree murder 0 0 0 0 0 0 0 0 0 1 0 0 0 0 0 0 0 1 0 0 0
Time Served for Paroled Lifers with Murder Convictions in Wyoming, 1994-2014
Number of Paroled Lifers with Murder Convictions in Wyoming, 1994-2014
Two individuals were paroled with second-degree murder convictions in this period. The individual paroled in 2003 had served 20 years and the second who was paroled in 2011 had served 26 years.
LIFER PAROLE HEARINGS AND GRANT RATESReliable data were not provided on lifer parole hearing outcomes.
Note: Figures pertain only to individuals sentenced to life since 1980.
0
5
10
15
20
25
30
201420132012201120102009200820072006200520042003200220012000199919981997199619951994
Year
s
First-degree murder
Second-degree murder
Note: Figures pertain only to individuals sentenced to life since 1980.
4 Wyoming Board of Parole. (n.d.). 2015 annual report. Retrieved from https://sites.google.com/a/wyo.gov/bop/about-us/annual-report
5 Wyo. Stat. Ann. § 6-10-301(c); The only decision a governor can make to alter adult sentences of life without parole is to pardon.
6 Wyoming Board of Parole, n.d. See also: Wyoming Board of Parole. (2013, July). Policy and procedure manual. Retrieved from http://www.justiceacademy.org/iShare/Library-Parole/WY-PBG.pdf

72The Sentencing Project • 1705 DeSales Street NW, 8th Floor • Washington, D.C. 20036 • sentencingproject.org
DELAYING A SECOND CHANCE: FEDERAL PROFILE
FederalKEY FINDINGS • Over the past twenty-five years, average time served has nearly doubled for lifers with murder con-
victions paroled in the federal system, increasing from 14.6 years in 1990 to 27.4 years in 2015 (based on three and four releases in these years, respectively). This increase is likely driven in part by the shrinking pool of parole-eligible lifers since the abolition of parole in this system—in 1987 for those with federal convictions and in 2000 for those with D.C. Code convictions.
• On average, United States Parole Commission conducted 71 lifer parole hearings annually between 1990 and 2000. This annual average increased to 178 between 2001 and 2015. This increase was driven in part by the Commission’s assumption of jurisdiction, beginning in 1998, over individuals with D.C. Code felony violations.
• The lifer parole grant rate increased from an average of 5% between 1990 and 2000 to 17% between 2001 and 2015.
OVERVIEW AND POLICY HIGHLIGHTSThere were 1,362 individuals with parole-eligible life sentences in federal prisons in 2012, constituting 0.6% of the prison population.1 Nearly three times as many people in this system were serving sentences of life without the possibility of parole.2
The Sentencing Reform Act of 1984 eliminated parole eligibility for people convicted of federal crimes on or after November 1, 1987.3 Beginning in 1998, the United States Parole Commission assumed jurisdiction over parole release decision for individuals incarcerated for D.C. Code felony violations.4 Those imprisoned for D.C. Code violations on or after August 5, 2000, are ineligible for parole.
In 2008, the D.C. District Court ruled that the Parole Commission’s retroactive application of year 2000 guidelines to individuals convicted of D.C. Code of-fenses violated the Ex Post Facto Clause of the U.S. Constitution, which prohibits the practice of retroac-tively increasing sentences.5 With regards to parole more broadly for individuals with D.C. Code violations, the Commission has been criticized for requiring com-pletion of programs that are not readily available in prisons.6
NUMBER PAROLED AND TIME SERVEDTime served has increased dramatically for paroled lifers with murder convictions, potentially driven in part by the characteristics of the shrinking pool of parole-eligible lifers. Beginning at 8.8 years in 1985 and increasing to 14.6 years in 1990, average time served for this group has remained above 20 years since 2001 and reached 27.4 years in 2015. The annual average number of such individuals paroled increased from two annually between 1990 and 2000, to eight each year between 2001 and 2015.
LIFER PAROLE HEARINGS AND GRANT RATESThe number of lifer parole hearings increased gradu-ally from three in 1980 to 91 in 2000. Between 2001 and 2015, there have been an average of 178 hearings each year. The parole grant rate has also gradually increased, from an average of 2% in the 1980s, to 5% between 1990 and 2000, and finally to 17% between 2001 and 2015.

73The Sentencing Project • 1705 DeSales Street NW, 8th Floor • Washington, D.C. 20036 • sentencingproject.org
DELAYING A SECOND CHANCE: FEDERAL PROFILE
Number of Lifer Parole Hearings and Grant Rates in the Federal System, 1980-2015
Note: Because the annual grant rate was calculated using releases rather than parole grants in this case, 2010’s unusually high grant rate likely results from the timing mismatch between releases in that year associated with the high number of hearings in the previous year.
0
50
100
150
200
250
300
2015
2014
2013
2012
2011
2010
2009
2008
2007
2006
2005
200
4
2003
2002
2001
2000
1999
1998
1997
1996
1995
1994
1993
1992
1991
1990
1989
1988
1987
1986
1985
198
4
1983
1982
1981
1980
15%
16%
16%21
%23%
51%
19%
18%
11%
12%
13%17
%
11%
5%8%
7%5%3%6%5%5%3%2%7%7%8%0%0%0%0%
25%
0%0%
0%0%
Denied parole
Granted parole
Grant rate
Num
ber o
f hea
rings
1980
-19
84
1985
1986
1987
1988
1989
1990
1991
1992
1993
1994
1995
1996
1997
1998
1999
2000
2001
2002
2003
2004
2005
2006
2007
2008
2009
2010
2011
2012
2013
2014
2015
0 2 0 0 0 0 3 3 1 0 1 2 3 2 1 1 5 5 5 9 9 6 5 3 15 7 6 14 11 5 10 4
0
5
10
15
20
25
30
2014
2012
2010
2008
2006
200
4
2002
2000
1998
1996
1994
1992
1990
1988
1986
198
4
1982
1980
Year
sTime Served for Paroled Lifers with Murder Convictions in the Federal System, 1980-2015
Number of Lifers with Murder Convictions Paroled in the Federal System, 1980-2015

74The Sentencing Project • 1705 DeSales Street NW, 8th Floor • Washington, D.C. 20036 • sentencingproject.org
DELAYING A SECOND CHANCE: FEDERAL PROFILE
Time Served for Paroled Lifers with D.C. Code Murder Convictions in Federal Prisons, 1998-2015
Number of Paroled Lifers with D.C. Code Murder Convictions in Federal Prisons, 1998-20151998 1999 2000 2001 2002 2003 2004 2005 2006 2007 2008 2009 2010 2011 2012 2013 2014 2015
0 0 0 0 0 2 1 1 0 1 1 0 3 1 0 0 1 0
1 Nellis, A. (2013). Life goes on: The historic rise in life sentences in America. Washington, DC: The Sentencing Project. Retrieved from: http://sen-tencingproject.org/wp-content/uploads/2015/12/Life-Goes-On.pdf
2 Nellis, 20133 United States Parole Commission, History of the Federal Parole System
(2003). Retrieved from https://www.justice.gov/sites/default/files/uspc/legacy/2009/10/07/history.pdf
4 United States Parole Commission, 2003. In August 1998, the Parole Commission assumed jurisdiction over parole grant hearings for those with D.C. Code felony convictions; in 2000, it also assumed jurisdiction
D.C. CODE VIOLATIONSOf the 121 lifers paroled with murder convictions between 1998 and 2015, 11 had D.C. Code violations. The average time served for these individuals was 26.9 years. While those paroled until 2010 had served about 25 years, the two paroled in 2011 and 2014 had served 36.3 and 32.0 years, respectively.
over supervision and revocation decisions for those with D.C. Code convictions.
5 Sellmon v. Reilly, 551 F. Supp. 2d 66 (D.D.C. 2008) 6 Rodd, S. (2016, September 30). D.C.’s Broken Parole System. Washing-
ton City Paper. Retrieved from http://www.washingtoncitypaper.com/news/city-desk/article/20835466/dcs-broken-parole-system
0
5
10
15
20
25
30
35
40
2015
2014
2013
2012
2011
2010
2009
2008
2007
2006
2005
200
4
2003
2002
2001
2000
1999
1998
25.524.0
25.825.0
25.9 25.3
36.3
32.0
Year
s

Delaying a Second Chance: The Declining Prospects for Parole on Life Sentences
Nazgol Ghandnoosh, Ph.D.
January 2017
1705 DeSales Street NW, 8th FloorWashington, D.C. 20036Tel: 202.628.0871Fax: 202.628.1091sentencingproject.org
The Sentencing Project works for a fair and effective U.S. justice system by promoting reforms in sentencing policy, addressing unjust racial disparities and practices, and advocating for alternatives to incarceration.
Related publications by The Sentencing Project:
• Juvenile Life Without Parole: An Overview (2016)• Testimony to the Senate Judiciary Committee on the Sentencing
Reform and Corrections Act of 2015 (2015)• Life Goes On: The Historic Rise in Life Sentences in America (2013)