the defense industry in connecticut
TRANSCRIPT


The Defense Industry in Connecticut
UMass Donahue Institute Economic & Public Policy
i
Sponsors
This study was funded in part by the Connecticut Center for Advanced Technology, Inc.; MassDevelopment
on behalf of the Massachusetts Executive Office of Housing and Economic Development; and The Rhode
Island Economic Development Corporation and The Newport County Chamber of Commerce.
About the Defense Technology Initiative
Founded in 2003, DTI was originally created by the Massachusetts High Technology Council to protect
Massachusetts’ military bases through the 2005 Base Realignment and Closure (BRAC) process. Following
that successful and nationally-recognized effort, DTI evolved into an economic development and sector
advocacy organization that represents the region’s leading defense technology firms, research labs,
universities, and military bases.
Produced by the Economic and Public Policy Research Unit, University of Massachusetts Donahue Institute
Copyright 2012 University of Massachusetts Donahue Institute The contents of this publication may not be reproduced without permission.

The Defense Industry in Connecticut
UMass Donahue Institute Economic & Public Policy
ii
Letter
Dear Colleague: The Defense Technology Initiative (DTI) is pleased to release a set of three detailed state reports on the economic significance of the defense industry in New England. This document is one of three related reports, each of which focuses on Connecticut, Massachusetts, and Rhode Island and is a follow up to the New England Defense Industry Summary we released in June 2012. When these reports are viewed together, a clear sense of the interconnectedness of the New England defense technology cluster emerges. Copies of all state reports, conducted by the University of Massachusetts Donahue Institute, can be found on our website, www.defensetech.net. The defense industry’s importance to the Connecticut economy has only grown in recent years. In 2011, 1,100 companies were awarded nearly $12.7 billion in Department of Defense (DoD) or the Department of Homeland Security (DHS) contracts, a 51% increase since 2003. These companies employ more than 101,000 employees, which represents approximately 6.3% of employment in the state. These employees exemplify industry expertise in precision manufacturing and sophisticated scientific and technical support, producing cutting edge ships, aircrafts, and specialty engines to the military. With large prime contractors like United Technologies and General Dynamics, the state supports a complex and interconnected network of small businesses and subcontractors throughout the region to supply high technology to our military. Yet today, defense firms are already adjusting to the current and potential (sequestration) defense spending reductions that could total over $1 trillion dollars over the next 10 years. Without Congressional intervention before January 2013, job losses throughout New England among contactors and the supply chain could total 90,000 jobs across New England and over 36,000 jobs in Connecticut. Despite these cuts, opportunities exist. As illustrated in the three state reports, the Pentagon’s focus on science and technology, research and development, unmanned air systems and cyber security remain aligned with New England’s strengths. A coordinated New England leadership effort is necessary in order to take advantage of these opportunities, and to ensure that the region remains the leader into the future. I hope you find this report of interest and that it helps you fully understand the significant economic impact of the defense industry in Connecticut, and more broadly throughout New England. Best,
Christopher Anderson Charlie Benway President Executive Vice President Defense Technology Initiative, Inc. Defense Technology Initiative, Inc.

The Defense Industry in Connecticut
UMass Donahue Institute Economic & Public Policy
iii
Contents
Letter .................................................................................................................................... ii
Contents ............................................................................................................................... iii
Tables and Figures .................................................................................................................. v
New England Overview .......................................................................................................... vi
Connecticut Introduction ........................................................................................................ 1
Part I: Defense Contracting in Connecticut ................................................................................ 3
Overview .................................................................................................................... 3
Top Defense Industry Sectors ....................................................................................... 5
Transportation Equipment Manufacturing .........................................................................5
Professional, Scientific, and Technical Services ...................................................................6
Top Products and Services ............................................................................................ 7
Top Purchases from Connecticut Contractors .....................................................................7
Top Defense Products .......................................................................................................7
Top Research & Development Services...............................................................................8
Top Defense Services ........................................................................................................9
Major Corporate and Institutional Contractors ............................................................. 11
Major Defense Contractors ............................................................................................ 11
The Role of Educational Institutions ............................................................................... 11
The Importance of the Defense Sector to Connecticut ................................................... 13
Part 2: Economic Impacts of Defense in Connecticut ................................................................ 15
Introduction ............................................................................................................. 15
Total Economic Contributions ..................................................................................... 16
Taxes Generated by Defense Contracts ........................................................................ 18
Conclusion ........................................................................................................................... 19
Appendix I. Executive Summary ............................................................................................ 22
Appendix II. Defense Work in Connecticut by Originating State ............................................... 25
Appendix III. Tax Analysis Categories ..................................................................................... 28
Appendix IV. Input-Output Analysis and the IMPLAN Software ................................................ 29
Input-Output Analysis and the IMPLAN software .......................................................... 29
Direct, indirect, and induced effects ............................................................................... 29
IMPLAN ....................................................................................................................... 30
Methodology ............................................................................................................ 30
Multi-regional Input-Output (MRIO) Analysis .................................................................. 30
NAICS to IMPLAN Crosswalk .......................................................................................... 30

The Defense Industry in Connecticut
UMass Donahue Institute Economic & Public Policy
iv
Missing NAICS Codes ..................................................................................................... 30
Missing IMPLAN Sectors ................................................................................................ 31
Appendix V. New England’s Top Products: State Rankings ....................................................... 32

The Defense Industry in Connecticut
UMass Donahue Institute Economic & Public Policy
v
Tables and Figures
Figure 1: Procurement from In-State Contractors, FY2003-FY2011 3
Figure 2: Connecticut In-State Defense Contractors, DoD and DHS, FY2003– FY2011 4
Figure 3: Top Ranked States, DoD and DHS Contract Awards, FY2011 4
Figure 4: Top Connecticut Defense Sectors, 2003 - 2011 6
Figure 5: Top Connecticut Product Subsectors by Contract Value 8
Figure 6: Top Connecticut R&D Services Subsectors by Contract Value 9
Figure 7: Top Connecticut Services Subsectors by Contract Value 10
Figure 8: Top Connecticut Recipients of DoD and DHS Contracts, FY2011 11
Figure 9: Top Higher Education Contractors, FY2011 12
Figure 10: Top Contracting Agencies and Sub-Agencies to Connecticut, FY2011 13
Figure 11: Top Federal Contract Recipients in Connecticut in FY2011 14
Figure 12: Top Connecticut Products Sold to the Federal Government, FY2011 14
Figure 13: Connecticut Economic Output, Employment, Labor Income, and Average Wage, 2011 17
Figure 14: Top 10 Connecticut Sectors Impacted by Federal Defense Contracts Performed in New England in
2011 18
Figure 15: Federal, State, and Local Tax Impacts of Direct, Indirect, and Induced Defense-Related Economic
Contributions in Connecticut, 2011 18
Figure 16: Value of FY2011 Defense Contract Work Performed in Connecticut, by Contractor Location 25
Figure 17: Value of Contracts Performed in Connecticut, by Both In- and Out-of-State Vendors in FY2003 and
FY2011 26
Figure 18: Place of Performance Map FY2011 27
Figure 19: Tax Category Breakdown 28
Figure 20: State and New England Rankings of New England's Top Ten Products and Services, 2011 Contract
Values 32

The Defense Industry in Connecticut
UMass Donahue Institute Economic & Public Policy
vi
New England Overview
The defense industry is a major contributor to the economy of New England and to each of its six states. In
2011, New England vendors received nearly $34 billion in Department of Defense (DoD) and Department of
Homeland Security (DHS) contracts, an 85 percent increase to the region since 2003. In total, New England
captured about 9 percent of U.S. defense and homeland security contracts in 2011. Connecticut plays a
particularly strong role within the regional defense industry. More than 1,100 Connecticut firms and
institutions (more than 21 percent of the defense contractors in New England) receive defense contracts to
provide essential equipment, supplies, and technical services in support of national and regional defense
operations. In 2011, nearly $12.7 billion, or 38 percent of defense purchases from New England, went to
Connecticut vendors representing a 51 percent increase in purchases since 2003.
The defense industry in New England has driven economic growth for the region over the last decade. In
2011, defense and homeland security contracting was responsible for a total of more than 319,000 jobs and
a total payroll of more than $22.6 billion across the region. Thirty-two percent of these jobs – a total of
101,359 – are in Connecticut. And while the overall direct, indirect and induced economic activities
generated by the resulting work performed in New England exceeds $62 billion, 36 percent of this total
contribution (more than $22.4 billion) accrued to Connecticut in 2011. This includes $1.1 billion in indirect
and induced economic contributions that came to Connecticut as a result of federal defense contracting
performed in other New England states. In all, $4.9 billion in economic activity within New England
occurred as indirect or induced effects across state lines, as federal defense contractors and employees
relied on goods and services from across the region. The value added to the New England economy from
defense spending (both directly and from the indirect and induced economic activity from this spending)
represents, conservatively, 4.1 percent of regional GDP, and 5.1 percent of GDP in Connecticut.

The Defense Industry in Connecticut
UMass Donahue Institute Economic & Public Policy
vii
New England states contribute to each others’ defense economies
Figure i: Economic Contributions of Federal Defense Spending in New England States, 2011
Sources: UMDI Calculations; IMPLAN Economic Analysis Software, Minnesota IMPLAN Group
A large portion of the defense product line in New England requires the regional presence of highly skilled
and well-educated workers along with mature, technically advanced vendors and a strong local supply chain,
particularly in manufacturing. Connecticut which has these assets, consequently serves as a major hub of
New England defense-related activities. The highest levels of defense-related spending in New England flow
into the transportation equipment manufacturing sector for ships (for example, General Dynamics’ U.S.
Navy DDG 1000 Zumwalt-class destroyer); submarines (General Dynamics’ U.S. Navy’s 14th Virginia-class
submarine, SSN-787); rotary wing aircraft (Sikorsky Black Hawk helicopters); guided missile systems
(Raytheon); engines, turbines and components (including General Electric and Pratt & Whitney); and aircraft
components. Drawing on the strength of the supply chain around transportation equipment manufacturing,
New England vendors also excel in providing communication, detection, and coherent radiation equipment
along with the manufacturing of many types of components, equipment, systems, and supplies. New
England is also a strong provider of services for equipment maintenance, repair, and rebuilding.
Direct Contribution
(Federal Defense
Work Performed in
State)
Indirect + Induced
Contributions from
Work Performed in
State
Indirect + Induced
Contributions from Work
Performed Elsewhere in
New England Total Contribution
Connecticut $12,394,237,512 $8,877,866,951 $1,147,382,937 $22,419,487,399
Maine $5,066,340,901 $3,038,194,234 $200,168,078 $8,304,703,214
Massachusetts $12,495,984,465 $11,024,774,023 $2,324,842,833 $25,845,601,322
New Hampshire $1,297,533,547 $936,121,752 $750,297,963 $2,983,953,262
Rhode Island $812,328,960 $617,765,363 $307,572,678 $1,737,667,001
Vermont $393,601,690 $217,594,576 $172,722,755 $783,919,021
Total $32,460,027,075 $24,712,316,899 $4,902,987,245 $62,075,331,219

The Defense Industry in Connecticut
UMass Donahue Institute Economic & Public Policy
viii
New England is a key provider of advanced technology products and R&D services
Figure ii: Top Products and Services, New England, FY2011
Source: USAspending.gov; DoD and DHS contract actions
New England has emerged as a critical supplier of professional, scientific and technical services related to
defense. New England vendors in general, including Connecticut vendors in particular, are particularly
strong in providing advanced professional, scientific, and technical services – especially related to defense
systems R&D and defense materials, and supplies R&D. Drawing on its highly educated workforce, New
England also excels in providing professional support services including advanced engineering, technical, and
management support.
As shown in Figure iii, on the following page, in sectors in which multiple New England states excel, New
England despite its relatively smaller size, competes well with the largest defense-producing states, like
Texas, California and Florida. As a region, New England ranks above all states as a producer of ships and
engines, turbines, and components. New England ranks second to Texas in both the production of
communication, detection, and coherent radiation equipment as well as in the production of aircraft
components and accessories.
Rank Product or Service Value of Contracts % of Total Value
1 Ships, Small Craft, Pontoons, and Floating Docks $8,407,935,287 24.8%
2 Research and Development $5,190,885,953 15.3%
3 Engines, Turbines, and Components $3,378,787,016 10.0%
4 Aircraft and Airframe Structural Components $2,821,389,095 8.3%
5 Guided Missiles $1,754,368,561 5.2%
6 Communication, Detection, and Coherent Radiation Equipment $1,703,347,590 5.0%
7 Support (Professional/Administrative/Management) $1,602,364,022 4.7%
8 Maintenance, Repair, and Rebuilding Of Equipment $1,211,415,878 3.6%
9 Aircraft Components and Accessories $1,001,057,940 3.0%
10 Ammunition and Explosives $597,162,504 1.8%
All Other (Includes N/A) (n=93) $6,247,697,607 18.4%
Total $33,916,411,453 100.0%

The Defense Industry in Connecticut
UMass Donahue Institute Economic & Public Policy
ix
New England competes with top defense states in technology and R&D services
Figure iii: State and New England Rankings of New England’s Top Products and Services, FY2011
Source: USAspending.gov; DoD and DHS contract actions
Large-scale defense production involves both primary contractors as well as many hundreds of sub-
contractors and supplier contractors across the region. So while major contractors stand out as leaders, as
do dominant states like Connecticut and Massachusetts, in reality companies and workers from every part
of the region are involved in the production of defense systems. The interaction of the supply chain and its
workers across New England creates a strong cluster of defense production activities across the region.
Rank State Contract Value Rank State Contract Value Rank State Contract Value Rank State Contract Value RankState Contract Value
N.E. $8,407,388,142 1 CA $8,225,569,024 N.E. $3,379,985,176 1 TX $8,936,460,556 1 AZ $2,475,907,747
1 ME $4,476,109,532 N.E. $5,190,389,720 1 CT $1,959,237,283 2 CA $6,285,023,576 2 CA $1,850,329,042
2 MS $4,433,480,502 2 VA $4,770,278,083 2 MA $1,419,688,169 3 WA $4,012,164,575 N.E. $1,754,368,561
3 CT $3,924,591,559 3 MA $3,608,124,372 3 OH $554,143,025 4 GA $3,558,075,977 3 MA $1,721,303,093
4 VA $2,205,079,869 4 AL $3,108,684,232 4 IN $337,269,205 N.E. $2,821,389,095 4 FL $491,382,483
5 AL $1,410,331,149 5 TX $2,995,473,812 5 AZ $293,092,279 5 CT $2,719,016,918 5 TX $382,701,038
6 MD $963,051,248 6 MD $2,766,453,230 6 FL $59,643,735 6 MO $2,618,701,537 6 MO $171,584,925
7 CA $685,136,126 7 NY $1,903,415,146 7 CA $54,541,102 7 AZ $1,267,376,000 7 MN $149,609,150
8 LA $297,194,507 8 NJ $1,632,980,372 8 TX $36,124,078 8 VA $1,199,479,020 8 MD $119,552,246
9 WA $50,679,286 9 AZ $1,479,519,028 9 VA $26,687,584 9 PA $1,154,509,160 9 NY $66,519,287
10 FL $42,756,717 10 CT $1,271,546,251 10 MI $23,808,202 10 MD $807,672,948 10 PA $42,501,200
11 WI $41,655,764 11 CO $1,229,893,490 11 WI $23,134,531 11 KS $588,313,459 11 IN $34,355,048
12 MN $26,663,329 12 MO $1,220,777,297 12 NY $19,030,034 12 NY $531,287,546 12 AL $33,658,236
Rank State Contract Value Rank State Contract Value Rank State Contract Value Rank State Contract Value RankState Contract Value
1 TX $1,736,377,806 1 VA $17,915,728,397 1 VA $3,589,138,479 1 TX $1,130,409,393 1 TX $1,669,363,257
N.E. $1,703,348,209 2 TX $5,496,795,725 2 TX $3,493,165,184 N.E. $1,001,057,940 2 MO $1,046,839,863
2 CA $1,341,247,922 3 CA $3,618,994,065 3 FL $2,345,760,157 2 CT $496,642,748 3 VA $701,933,244
3 NY $1,332,531,320 4 MD $3,240,999,494 4 CA $1,653,736,417 3 MO $495,729,411 4 AZ $651,755,139
4 MA $1,186,647,316 5 SC $2,714,955,267 N.E. $1,211,774,439 4 FL $429,652,843 5 FL $606,136,207
5 VA $987,011,785 6 NJ $2,320,673,682 5 OK $693,124,718 5 NV $368,405,704 N.E. $597,162,504
6 MD $931,339,844 N.E. $1,603,154,276 6 NJ $665,949,835 6 CA $362,704,650 6 PA $383,209,722
7 FL $530,898,830 7 AL $1,599,765,160 7 CT $595,324,205 7 NY $328,124,758 7 MN $367,604,249
8 NJ $505,900,109 8 FL $1,495,642,351 8 MD $590,153,902 8 AZ $291,792,593 8 VT $337,397,863
9 IN $451,656,023 9 OH $1,446,454,272 9 MA $568,386,619 9 MS $241,239,396 9 IL $275,949,484
10 NH $405,737,902 10 CO $1,186,375,119 10 AL $504,618,915 10 MA $228,791,147 10 CO $269,175,988
11 IA $362,457,623 11 MA $1,131,508,667 11 GA $352,182,208 11 IN $172,823,830 11 MA $236,925,075
12 OH $348,833,065 12 GA $708,057,749 12 KS $294,551,956 12 NH $133,489,026 12 TN $219,478,864
Communication, Detection,
And Coherent Radiation
Equipment(58)
Support (Professional /
Administrative /
Management)
Maintenance, Repair, And
Rebuilding Of Equipment(J)
Aircraft Components And
Accessories (16)
Ammunition And
Explosives(13)
Ships, Small Craft, Pontoons,
And Floating Docks(19)
Research And
Development(A)
Engines, Turbines, And
Components(28)
Aircraft And Airframe
Structural Components(15) Guided Missiles(14)
The Defense Industry in Connecticut
UMass Donahue Institute Economic & Public Policy
1
Connecticut Introduction
The defense industry is an important contributor to the Connecticut economy. In 2011, the majority of
federal contract awards to Connecticut vendors (nearly 95 percent of the total), went towards the purchase
of defense products and services.1 Vendors in the state were awarded nearly $12.7 billion in Department of
Defense (DoD) and Department of Homeland Security (DHS) contracts, a 51 percent increase since 2003.2
Defense and Homeland Security contracting is responsible for a total of more than 101,000 jobs
(approximately 6.3% of employment in the state) and a total payroll of more than $7.9 billion across the
state (about 8.0 percent of wages in 2011).3 The overall direct, indirect, and induced economic activity
generated for Connecticut by defense-related work performed in New England exceeds $22.4 billion. We
calculate that the value added to the state's economy from defense spending (both directly and from the
indirect and induced economic activity from this spending) would represent, conservatively, 5.1 percent of
state GDP.4
More than 1,100 Connecticut firms and institutions have contracts with DoD and DHS to provide essential
equipment, supplies and technical services in support of defense operations. Much of this activity requires
highly skilled workers, precision manufacturing, and sophisticated scientific and technical support. While
major contractors appear distinct, in reality multiple companies are involved in the production of advanced
defense systems. Large-scale production involves primary contractors as well as many hundreds of sub-
contractors and supplier contractors; Connecticut vendors play a major role at all of these levels. The state
is also home to organizations offering targeted support, including applied technology assistance provided by
the Advanced Manufacturing Center at the Connecticut Center for Advanced Technology (CCAT).5 The
interaction of the supply chain across the state and within New England creates a strong cluster of
businesses and workers linked to defense production activities across the region.
1 The data used in this study are analyzed and reported by federal fiscal year. The federal fiscal year runs from October 1 of the prior
year through September 30 of the year being described. The latest annual data available for analysis during the study period are for federal fiscal year 2011. 2 The data we use in this analysis of contract values are in nominal dollars rather than in inflation adjusted dollars.
3 Total covered employment in Connecticut in 2011 was 1,612,372 with wages of $98.5 billion (BLS CEW series).
4 Total GDP in Connecticut in 2011 was nearly $230.1 billion (BEA). Defense spending is not reported directly in the BEA figures on
GDP for states; the value-added numbers come out of the IMPLAN models run for this report. 5 For more information about The Connecticut Center for Advanced Technology (CCAT): http://www.ccat.us

The Defense Industry in Connecticut
UMass Donahue Institute Economic & Public Policy
2
This examination of the Connecticut defense industry and economic contributions to the state is structured
in two parts. In the first part we examine the nature of defense contract awards to Connecticut firms and
organizations, as well as the role of institutions of higher education that work with the defense industry. In
the second part, we analyze the impacts generated by the defense industry in the region, including
economic, employment, payroll, and tax impacts on the Connecticut economy.
The Defense Industry in Connecticut
UMass Donahue Institute Economic & Public Policy
3
Part I: Defense Contracting in Connecticut
Overview
The Department of Defense is by far the top federal contracting agency to Connecticut, with awards totaling
nearly $12.6 billion in fiscal year 2011. The Department of Health and Human Services ($215.4 million), the
Department of State ($172.8 million), and the Department of Homeland Security ($79.3 million) ranked
second, third, and fourth in terms of total contract values. This profile of the Connecticut defense industry is
based on an aggregate analysis of contract awards by DoD and DHS due to their primary roles in national
security and defense. Figure 1 illustrates the total numbers of defense contractors (vendors) and contract
values to Connecticut based vendors by agency between 2003 and 2011.
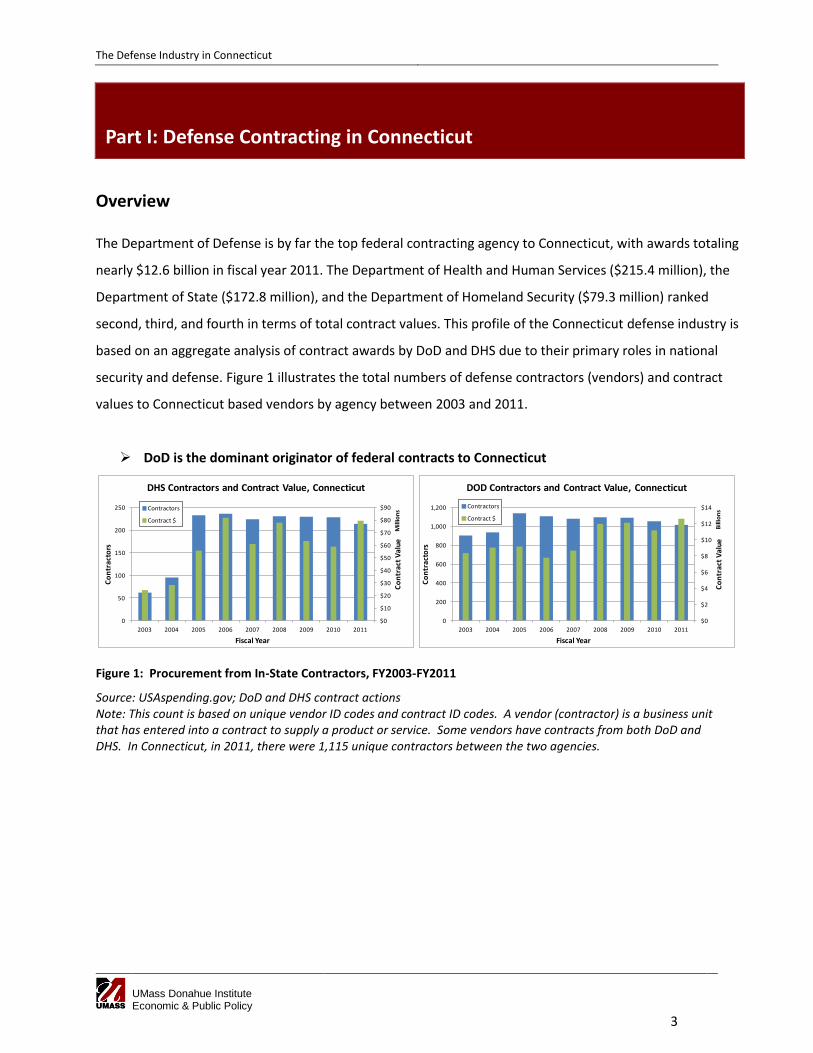
DoD is the dominant originator of federal contracts to Connecticut
Figure 1: Procurement from In-State Contractors, FY2003-FY2011
Source: USAspending.gov; DoD and DHS contract actions Note: This count is based on unique vendor ID codes and contract ID codes. A vendor (contractor) is a business unit that has entered into a contract to supply a product or service. Some vendors have contracts from both DoD and DHS. In Connecticut, in 2011, there were 1,115 unique contractors between the two agencies.
$0
$10
$20
$30
$40
$50
$60
$70
$80
$90
0
50
100
150
200
250
2003 2004 2005 2006 2007 2008 2009 2010 2011
Co
ntr
act
Val
ueM
illio
ns
Co
ntr
acto
rs
Fiscal Year
DHS Contractors and Contract Value, Connecticut
Contractors
Contract $
$0
$2
$4
$6
$8
$10
$12
$14
0
200
400
600
800
1,000
1,200
2003 2004 2005 2006 2007 2008 2009 2010 2011
Co
ntr
act
Val
ueB
illio
ns
Co
ntr
acto
rs
Fiscal Year
DOD Contractors and Contract Value, Connecticut
Contractors
Contract $

The Defense Industry in Connecticut
UMass Donahue Institute Economic & Public Policy
4
Connecticut defense contract purchases have increased by 51 percent since 2003
Figure 2: Connecticut In-State Defense Contractors, DoD and DHS, FY2003– FY2011
Source: USAspending.gov; DoD and DHS contract actions Note: Counts are based on unique vendor ID codes and contract ID codes. A vendor (contractor) is a business unit that has entered into a contract to supply products or services.
In 2011, 1,115 contractors supplied defense products to DoD and DHS, a 20 percent increase since 2003 (187
more contractors than were involved in 2003). As shown in Figure 3, the vast majority of contract spending
to Connecticut came from DoD.
Connecticut ranked 7th and 23rd for DoD and DHS contracts in 2011
Figure 3: Top Ranked States, DoD and DHS Contract Awards, FY2011
Source: USAspending.gov; DoD and DHS contract actions
Since 2003, in every year but 2006, Connecticut has ranked among the top 10 states for contract awards
from DoD.6 Defense contracting has become vital to Connecticut. Approximately 95 percent of federal
contract spending to the state comes from DoD and DHS.
6 For state rankings at the product group level see Appendix IV.
Fiscal Year DHS DoD DHS and DoD DHS DoD DHS and DoD DHS DoD DHS and DoD
2003 61 905 928 293 10,971 11,264 $24,222,353 $8,356,290,431 $8,380,512,784
2004 95 938 987 490 11,667 12,157 $28,268,669 $9,013,588,840 $9,041,857,509
2005 233 1,138 1,260 1,107 81,644 82,751 $55,516,407 $9,176,736,946 $9,232,253,353
2006 236 1,109 1,234 1,097 89,771 90,868 $81,754,281 $7,792,162,433 $7,873,916,714
2007 224 1,083 1,190 1,065 95,706 96,771 $60,848,584 $8,655,507,214 $8,716,355,798
2008 231 1,098 1,201 1,188 103,649 104,837 $77,634,100 $11,989,085,008 $12,066,719,108
2009 230 1,094 1,194 1,259 130,338 131,597 $63,347,883 $12,135,197,562 $12,198,545,445
2010 229 1,054 1,158 1,201 153,075 154,276 $58,707,224 $11,132,702,693 $11,191,409,916
2011 214 1,016 1,115 1,213 159,724 160,937 $79,260,413 $12,586,640,373 $12,665,900,786
Number of contractors Number of Contract Actions Total Value of Contracts
Virginia 1 $56,688,567,483 15.2% Virginia 1 $5,077,157,706 35.7%
California 2 $43,093,461,706 11.5% Maryland 2 $1,744,825,269 12.3%
Texas 3 $36,449,140,146 9.7% Mississippi 3 $1,069,959,008 7.5%
Maryland 4 $15,127,416,034 4.0% California 4 $743,602,895 5.2%
Florida 5 $13,531,873,193 3.6% Massachusetts 5 $686,695,705 4.8%
Massachusetts 6 $13,039,291,755 3.5% Texas 6 $540,735,366 3.8%
Connecticut 7 $12,586,640,373 3.4% Florida 7 $463,858,451 3.3%
Arizona 8 $11,929,182,337 3.2% Georgia 8 $344,895,922 2.4%
Pennsylvania 9 $11,196,829,994 3.0% New Jersey 9 $336,947,705 2.4%
Missouri 10 $9,180,312,902 2.5% Washington 10 $271,589,141 1.9%
Connecticut 23 $79,260,413 0.6%
Percent of U.S. Total
DHS AwardsState Name
DoD Awards DHS Awards
DoD Rank
Value of DoD
ContractsState Name
Percent of U.S. Total
DoD Awards DHS Rank
Value of DHS
Contracts

The Defense Industry in Connecticut
UMass Donahue Institute Economic & Public Policy
5
Top Defense Industry Sectors
Taken as a whole, the defense industry in Connecticut is characterized by activities in one dominant sector -
the Transportation Equipment Manufacturing sector (NAICS 336) - which has consistently ranked as the top
sector in the state since 2003. In 2011, three-quarters of total defense purchases made in the state were
made in this sector. Establishments in this sector – which include ship and boat building and repairing firms;
aerospace product and parts manufacturers (including producers of aircraft products and parts and guided
missiles in their entirety and as separate parts); and motor vehicle parts manufacturers – make intensive
use of technology, science and engineering in their development and production activities. These
establishments also rely on a state- and region-wide cluster of manufacturing suppliers – including
machinery manufacturers, electrical equipment and component manufacturers, fabricated metal product
manufacturers, and machinery repair and maintenance firms – to provide components, maintenance and
other support for manufacturing production activities. The other major player in Connecticut’s defense
industry is Professional, Scientific and Technical Services (NAICS 541), which, since 2003 has ranked
consistently as the second-ranked earning sector in the state. Two additional sectors – Support Activities for
Transportation (NAICS 488) and Machinery Manufacturing (NAICS 333) – which play direct, supportive roles
to transportation equipment manufacturing activities in the state, are currently the third and fourth ranked
sectors in Connecticut.
Transportation Equipment Manufacturing
Over time, the defense industry in Connecticut has become increasingly intensive in transportation
equipment manufacturing activities: the total value of contract purchases to this sector nearly doubled
between 2003 and 2011 (from a total value of $4.9 billion 2003 to $9.5 billion in 2011). This sector was the
top ranked sector in the state in each of those years. In 2011, seventy-five percent of defense purchases in
Connecticut went to this broad sector, up from 58 percent of total purchases in 2003. In 2011, major
purchases were made in Aerospace Product and Parts Manufacturing (NAICS 3364), which earned $5.7
billion, up 95 percent since 2003; and Ship and Boat Building (NAICS 3366), which earned $3.8 billion, up 96
percent since 2003. Important activities within these sectors in Connecticut, based on contract values,
include the manufacturing of submarines; aircraft; aircraft components; and engines, turbines and
components.

The Defense Industry in Connecticut
UMass Donahue Institute Economic & Public Policy
6
Professional, Scientific, and Technical Services
Contracting patterns also point to a continued interest in the purchase of specialized technical services and
research and development services from Connecticut vendors, although defense purchases from this sector
in Connecticut have decreased somewhat since 2003. The professional, scientific and technical services
sector is comprised of establishments that provide expertise in multiple fields such as engineering,
architecture and scientific research and development. In 2011, Connecticut vendors in this sector were
awarded more than $1.4 billion worth of contracts, 11.3 percent of the Connecticut total, down from nearly
18 percent of contracts valued at $1.5 billion in 2003. In 2011, major purchases were made in Architectural,
Engineering and Related Services (NAICS 5413), which earned $851 million, up 199 percent since 2003; and
Scientific Research and Development Services (NAICS 5417), which earned $535 million, down 46 percent
since 2003.
The Connecticut defense industry is dominated by the transportation equipment manufacturing sector
Figure 4: Top Connecticut Defense Sectors, 2003 - 2011
Source: USAspending.gov; DoD and DHS contract actions
Fiscal Year 2003 2004 2005 2006 2007 2008 2009 2010
Industry Sector Rank Rank Rank Rank Rank Rank Rank Rank Rank Value of Contracts Percent of Total
Transportation Equipment Manufacturing (336) 1 1 1 1 1 1 1 1 1 $9,511,802,971 75.1%
Professional, Scientific, and Technical Services (541) 2 2 2 2 2 2 2 2 2 $1,427,345,189 11.3%
Support Activities for Transportation (488) 10 16 17 10 10 3 3 3 3 $408,987,643 3.2%
Machinery Manufacturing (333) 8 8 9 7 4 9 5 4 4 $342,199,878 2.7%
Merchant Wholesalers, Nondurable Goods (424) 11 12 4 4 5 7 4 6 5 $161,280,393 1.3%
Food Manufacturing (311) 31 50 31 18 19 17 12 7 6 $130,241,808 1.0%
Chemical Manufacturing (325) 15 9 15 13 11 12 13 10 7 $86,688,126 0.7%
Computer and Electronic Product Manufacturing (334) 5 7 7 6 7 8 7 9 8 $79,950,541 0.6%
Construction of Buildings (236) 9 10 16 11 12 11 11 5 9 $77,826,283 0.6%
Electrical Equipment, Appliance, and Component Manufacturing (335) 6 6 8 9 9 4 6 8 10 $72,094,396 0.6%
All others (Includes N/A) $367,483,559 2.9%
Total $12,665,900,786 100.0%
2011

The Defense Industry in Connecticut
UMass Donahue Institute Economic & Public Policy
7
Top Products and Services
Products, services, and R&D purchased by the federal government are classified according to a set of codes
that indicate the predominant type of product or service purchased through a contract action.7 In this
section, contract spending is analyzed by product and service categories and codes to determine top
spending areas and indicate relative strengths within the Connecticut defense economy. See Appendix V for
an analysis of U.S. state rankings for top defense products in New England.
Top Purchases from Connecticut Contractors
Connecticut excels in the production of defense-related transportation equipment. More than 80 percent of
defense purchases from the state in 2011 ($10.2 billion) went towards manufactured products, and nearly
90 percent of this total ($9.1 billion) went towards defense-related transportation products. Major products
include submarines and related equipment (for example, the U.S. Navy’s 14th Virginia-class submarine, SSN-
787); rotary wing aircraft (Sikorsky Black Hawk helicopters) and aircraft components; and engines, turbines
and components. Purchases related to these large-scale production activities involve dominant primary
contractors as well as many hundreds of sub-contractors and supplier contractors in Connecticut and across
the region. An additional, major strength in Connecticut is its ability to provide defense systems research
and development services.
Top Defense Products
Connecticut provides a variety of complex defense-related products and components related to defense
transportation systems including ships; aircraft; engines, and turbines and components. The production of
the state’s top defense products flows from the presence of a mature and advanced manufacturing sector,
comprised of highly-trained and well-educated workers. The state’s top three manufactured defense
products in 2011 (which have remained in the top three since 2003), include Ships; Aircraft and Airframe
Structural Components; and Engines, Turbines, and Components. Contracts for Ships, the largest area of
purchasing in the state, accounted for over $3.9 billion in 2011, a growth rate of 113 percent since 2003.
Contracts for Aircraft and Airframe Structural Components ranked number two among product-types sold by
state vendors and accounted for more than $2.7 billion in purchases in 2011, a growth rate of more than
300 percent over 2003. Purchases of Engines, Turbines and Components ranked number three in 2011, with
sales of more than $1.95 billion in 2011, approximately 2 percent more than purchases made in 2003. The
fourth ranked product area in 2011 was Aircraft Components and Accessories, which experienced a 33
7 This section is based on federal product and service categories which are comprised of detailed product codes. For more information see the
Federal Procurement Data System Product and Service Codes Manual, August 2011 Edition, at https://www.acquisition.gov.

The Defense Industry in Connecticut
UMass Donahue Institute Economic & Public Policy
8
percent decline in contract purchases from 2003. As Appendix V illustrates, Connecticut is positioned as a
strong competitor in the nation for the production of all of these types of defense transportation
equipment.
Connecticut is a key provider of ships, aircraft and transportation-related equipment and
components
Figure 5: Top Connecticut Product Subsectors by Contract Value
Source: USAspending.gov; DoD and DHS contract actions
Top Research & Development Services
The leading type of R&D provided by Connecticut vendors is Defense Systems R&D (related to aircraft,
missile and space systems; ships; tanks; weapons; electronics and communications and hard goods) - nearly
$1.1 billion in this category was sold in 2011. Sales to Connecticut decreased in this area by 31 percent since
2003. Contracts for ‘Defense Other’ R&D (including research and development related to ammunition;
services; subsistence; textiles, clothing and equipage; fuels and lubricants, construction and other defense)
is the second major type of R&D services provided by Connecticut contractors. This product area garnered
more than $167 million in contracts in 2011, a 396 percent increase in sales since 2003. Together, in 2011,
these two areas made up more than 98 percent of total R&D contract awards to vendors in the state.
Product 2003 2004 2005 2006 2007 2008 2009 2010 Rank Contract Amount
Ships, Small Craft, Pontoons, And Floating Docks 2 1 2 1 2 2 1 1 1 $3,924,591,559
Aircraft And Airframe Structural Components 4 3 3 2 3 1 2 2 2 $2,719,016,918
Engines, Turbines, And Components 1 2 1 3 1 3 3 3 3 $1,959,237,283
Aircraft Components And Accessories 3 4 4 4 4 4 4 4 4 $496,642,748
Subsistence 29 26 7 6 7 8 6 5 5 $267,343,145
Electric Wire, And Power And Distribution Equipment 5 5 6 7 6 5 7 6 6 $95,688,749
Maintenance And Repair Shop Equipment 25 23 14 12 8 11 12 9 7 $92,550,786
Fuels, Lubricants, Oils, And Waxes 7 24 5 10 33 29 9 13 8 $75,860,899
Instruments And Laboratory Equipment 8 9 12 13 9 14 14 11 9 $40,059,583
Engine Accessories 6 8 13 9 13 20 11 10 10 $39,320,661
All other Products(n=61) $487,988,946
Total $10,198,301,278
2011Rank

The Defense Industry in Connecticut
UMass Donahue Institute Economic & Public Policy
9
Defense agencies rely on Connecticut for highly specialized R&D services
Figure 6: Top Connecticut R&D Services Subsectors by Contract Value
Source: USAspending.gov; DoD and DHS contract actions
Note: Defense Other Research and Development includes research of Ammunition; Services; Subsistence; Textiles;
Clothing and Equipage; Fuels and Lubricants; Construction; and Other. Other Research and Development includes
Basic & Applied Research, Advanced & Engineering Development, Operational Systems Development, and
Management and Support.
Top Defense Services
Providers of defense services products play an important role in the Connecticut economy providing jobs for
individuals with skills in the trades as well as those with specialized professional and technical expertise.
Purchases of Maintenance, Repair, and Rebuilding of Equipment services were the most common type of
service purchased from Connecticut contractors. Forty-eight percent of services spending took place in this
product line, with a total of $567 million in contract purchases in 2011. Spending on this category of
services has increased by 283 percent since 2003. Support-Management services, with more than $199
million in purchases (a growth rate of 1,377 percent since 2003), and Support-Professional services, with
more than $116 million in purchases in 2011 (a growth rate of 62 percent since 2003), rounded out the top
three services types purchased from Connecticut vendors in 2011.
Research Type 2003 2004 2005 2006 2007 2008 2009 2010 Rank Contract Amount
R&D- Defense Systems 1 1 1 1 1 1 1 1 1 $1,082,056,910
R&D- Defense Other 2 2 2 2 2 2 2 2 2 $167,264,733
R&D- Other Research And Development 3 3 4 4 4 5 7 5 3 $9,168,804
R&D- Space 13 7 5 4 4 $5,522,356
R&D- Medical 8 6 9 3 7 8 9 9 5 $3,276,827
R&D- Environmental Protection 10 7 10 7 8 12 4 7 6 $3,111,688
R&D- Economic Growth 7 5 6 11 6 10 10 10 7 $2,030,689
R&D- Natural Resource 11 10 9 8 8 8 $797,258
R&D- Energy 4 11 8 6 5 4 6 6 9 $68,032
R&D- Education 10 13 12 11 10 $45,299
All other Products(n=2) -$1,796,345
Total $1,271,546,251
Rank 2011

The Defense Industry in Connecticut
UMass Donahue Institute Economic & Public Policy
10
Top services are based on trade-related skills and specialized professional and technical expertise.
Figure 7: Top Connecticut Services Subsectors by Contract Value
Source: USAspending.gov; DoD and DHS contract actions
Services 2003 2004 2005 2006 2007 2008 2009 2010 Rank Contract Amount
Maintenance, Repair, And Rebuilding Of Equipment 2 2 3 2 1 1 1 1 1 $578,364,389
Support- Management 9 11 14 11 8 2 3 2 2 $199,666,003
Support- Professional 4 3 2 3 2 3 2 4 3 $116,305,769
Environmental Systems Protection 16 18 17 18 11 8 8 6 4 $45,637,049
Maintenance Of Structures And Facilities 13 10 13 10 10 11 13 5 5 $43,388,461
Construction Of Structures And Facilities 3 6 7 6 3 4 5 3 6 $36,307,519
Transportation/Travel/Relocation- Transportation 5 4 4 7 6 15 14 15 7 $31,950,066
Housekeeping 11 8 10 9 5 9 9 9 8 $21,216,197
Architect And Engineering- Construction 25 22 24 33 31 6 7 14 9 $20,334,713
Information Technology And Telecommunications 7 7 8 8 7 10 6 7 10 $20,165,039
All other Products(n=32) $82,744,820
Total $1,196,080,024
Rank 2011

The Defense Industry in Connecticut
UMass Donahue Institute Economic & Public Policy
11
Major Corporate and Institutional Contractors
Major Defense Contractors
In 2011, two major entities – United Technologies Corporation and General Dynamics Corporation –
received more than $11.2 billion in contract purchases, which amounted to more than 88 percent of total
contract awards to Connecticut vendors by DoD and DHS. United Technologies is a diversified company with
businesses that include Otis; Pratt & Whitney; Sikorsky; UTC Aerospace Systems; UTC Climate, Controls and
Security and UTC Power.8
In FY11, the top two Connecticut contractors received more than 88 percent of all contracts awarded to vendors in the state
Figure 8: Top Connecticut Recipients of DoD and DHS Contracts, FY2011
Source: USAspending.gov; DoD and DHS contract actions
Note: The above analysis is based on unique parent company identification codes, reported directly by the
contractor, which sometimes encompass multiple sub-units. The figure includes contract awards to Connecticut-
based facilities only. Many contractors have facilities in other geographic locations; defense awards to these out-
of-state facilities are not included in this analysis.
The Role of Educational Institutions
Among higher education recipients of contract awards,9 Yale University ranked first with nearly $4 million in
2011, representing 80 percent of defense contract awards to higher education institutions in Connecticut.
8 UTC businesses that appear in the USASpending database since 2003 include Carrier Corporation; Hamilton Sundstrand Corporation; North American Elevator Services Company; Otis Elevator Company; Sikorsky Aircraft Corporation; and United Technologies Corporation Pratt & Whitney Division. 9 This section provides a look at awards supporting research in a higher education setting only. Only vendors that indicate that they are a higher education institution using the field ‘educationalinstitutionflag’ are included in the analysis.
Rank Company/Institution Amount % of all State Contracts
1 United Technologies Corporation $6,856,621,380 54.13%
2 General Dynamics Corporation $4,350,933,298 34.35%
3 Eurpac Service Incorporated $138,282,895 1.09%
4 Stichting Administratiekantoor Unilever N.V. $122,612,313 0.97%
5 Goodrich Corporation $78,217,579 0.62%
6 Finmeccanica Spa $50,121,043 0.40%
7 Cabrera Services Inc. $47,975,411 0.38%
8 Kaman Corporation $47,218,945 0.37%
9 Merlin Petroleum Company Inc. $43,034,928 0.34%
10 SPX Corporation $40,722,605 0.32%
All others(n=933 contractors) $890,160,390 7.03%
Total $12,665,900,786 100.00%

The Defense Industry in Connecticut
UMass Donahue Institute Economic & Public Policy
12
University of Connecticut and the United States Coast Guard ranked second and third among Connecticut
educational institutions awarded defense contracts in FY2011. Basic biomedical research was the top
product type purchased from educational institutions in Connecticut ($2.6 million in purchases in 2011),
followed by purchases of research and development services, including miscellaneous basic research (valued
at more than $993 million) and research and development related to environmental protection (valued at
$596,000).
Yale receives the highest levels of defense contract funding among Connecticut institutions of higher education
Figure 9: Top Higher Education Contractors, FY2011
Source: USAspending.gov; DoD and DHS contract actions
Note: This table provides a look at awards supporting research in a higher education setting only. Only vendors that
indicate that they are a higher education institution using the field ‘educationalinstitutionflag’ are included in this table.
These data do not include grants for research received from DoD or DHS.
Rank School Amount % of all state contracts
1 Yale University $4,045,450 0.0319%
2 University of Connecticut $906,551 0.0072%
3 United States Coast Guard $110,991 0.0009%
4 University of New Haven $12,500 0.0001%
5 Security University LLC $5,250 0.0000%

The Defense Industry in Connecticut
UMass Donahue Institute Economic & Public Policy
13
The Importance of the Defense Sector to Connecticut
DoD and DHS contract awards account for the largest pool of federal contract funding to the state –
approximately 95 percent of all federal contract payments to Connecticut vendors in 2011. United
Technologies Corporation receives the highest dollar amount of defense contract awards of any vendor in
the state. The top five federal contract recipients in Connecticut are defense contractors. Each of the top
five products or services sold to the federal government is directly related to defense. Clearly the defense
industry plays a vital and significant role in the Connecticut economy.
Ninety-five percent of all federal contracts to Connecticut came from DoD and DHS
Figure 10: Top Contracting Agencies and Sub-Agencies to Connecticut, FY2011
Source: USAspending.gov; DoD and DHS contract actions as of September 19, 2012
Top Five Contracting Agencies, by Value, FY2011
Agency Amount
Department of Defense $12,597,414,079
Department of Health and Human Services $215,380,558
Department of State $172,834,526
Department of Homeland Security $79,260,413
Department of Veterans Affairs $78,453,330
All other Agencies $239,036,167
Top Five Contracting Sub Agencies, by Value, FY2011
Sub Agency Amount
Department of the Navy $6,946,573,787
Department of the Army $3,125,911,050
Department of the Air Force $1,170,832,984
Defense Logistics Agency $898,819,612
Defense Commissary Agency (Deca) $338,382,461
All other Sub Agencies $901,859,179

The Defense Industry in Connecticut
UMass Donahue Institute Economic & Public Policy
14
The top five federal contract recipients in Connecticut are defense contractors
Figure 11: Top Federal Contract Recipients in Connecticut in FY2011
Source: USAspending.gov; DoD and DHS contract actions as of September 19, 2012
The top five Connecticut products sold to the federal government are directly related to
defense technology
Figure 12: Top Connecticut Products Sold to the Federal Government, FY2011
Source: USAspending.gov; DoD and DHS contract actions as of September 19, 2012
Note: The product codes used in this table are individual product codes rather than the broader product categories
discussed in the earlier analysis.
Company/Institution Amount
United Technologies Corporation $7,046,822,788
General Dynamics Corporation $4,352,996,201
Eurpac Service Incorporated $138,282,895
Stichting Administratiekantoor Unilever N.V. $122,612,313
Goodrich Corporation $78,217,579
All other Companies/Institutions $1,643,447,297
Product or Service Amount
Submarines $3,855,006,791
Aircraft, Rotary Wing $2,737,918,711
Gas Turbines & Jet Engines Aircraft $1,950,167,098
Defense Aircraft (Operational) $837,879,341
Maint-Rep of Engines & Turbines $365,840,714
All other Products or Services $3,635,566,418
The Defense Industry in Connecticut
UMass Donahue Institute Economic & Public Policy
15
Part 2: Economic Impacts of Defense in Connecticut
Introduction
This section presents an analysis of economic contributions to Connecticut resulting from defense industry
activities performed in New England. We use IMPLAN input-output analysis software to measure economic
contributions of federal defense contracts performed in New England.
Economic contribution analysis seeks to estimate the ongoing effects of an initial stimulus (i.e. federal
defense contracts) within a regional economy. The premise is that an initial investment in one sector of an
economy spurs additional economic activity in other sectors as the money is re-spent within the region. The
total economic contribution of the initial investment is estimated by tracing the flow of money among
industries and households until all of the initial investment eventually leaves the region through foreign or
domestic trade, or is collected as a tax.
The IMPLAN modeling system, a widely used and respected proprietary software, combines the U.S. Bureau
of Economic Analysis’ Input-Output Benchmarks with regional employment and wage data to construct
quantitative models of the flow of goods and services among a region’s businesses and households. The
system estimates direct, indirect, and induced effects of the original investment. Direct impacts are inputs
into the regional economy – in this case, the total dollar value of defense contract work performed in New
England. Indirect impacts are the ripple effects that result from spending to supplier firms in other sectors.
For example, a defense contract to a manufacturer would lead that manufacturer to contribute additional
spending on supplies in the form of goods and services from other sectors. Finally, induced effects are those
generated as defense contractor employees spend their wages.
We analyze the economic contributions to Connecticut of defense contracts performed in Connecticut, and
contracts performed in the rest of New England.10 Connecticut defense contractors perform the vast
majority of contracts awarded to them in-state, but Connecticut also serves as the principal place of
10 We use the total dollar value of all contract activities with work performed in Connecticut, regardless of where the contractor is headquartered. As a result, the dollar values for each year differ from the value of Connecticut contracts reported elsewhere in this report for the same year.

The Defense Industry in Connecticut
UMass Donahue Institute Economic & Public Policy
16
performance for contracts awarded to out-of-state contractors. 11 In 2011, contractors based in the rest of
the United States relied on Connecticut facilities for contract work totaling $284.4 million. Figure 16 in
Appendix II illustrates that Illinois, Florida and Virginia are the states that sent the highest values of
contracts to be performed in Connecticut in 2011.
Total Economic Contributions
Overall, economic contributions to Connecticut from federal defense contracts performed in New England
totaled $22.4 billion in 2011. This included nearly $12.4 billion in direct impacts, or contracts performed in
Connecticut. Work performed in other New England states contributed to more than $1.1 billion in indirect
and induced effects in Connecticut. Additionally, federal defense contracts performed in Connecticut
provided for the direct employment of an estimated 40,900 workers in 2011, while work performed in
Connecticut and elsewhere in New England indirectly supported the employment of an additional 55,000
and 4,000 workers, respectively, in related industries. Defense contracts performed in Connecticut directly
supported nearly $4.2 billion in labor income for Connecticut defense workers and indirectly supported an
additional nearly $3.4 billion in labor income for workers in related industries. Work performed elsewhere
in New England indirectly supported an additional $343 million in labor income for Connecticut workers.
Average wages for direct employees of firms performing defense contracts in Connecticut were estimated at
more than $102,000, significantly higher than the 2011 state average of $61,110. Average annual wages in
jobs indirectly supported by defense contracts performed in Connecticut were estimated at $60,673, much
closer to the state average, while estimated average wages in jobs indirectly supported by contracts
performed in the rest of New England at nearly $74,400 were also higher than the state average, perhaps
reflecting neighboring states’ interdependence on Connecticut for defense-related goods and services
produced by Connecticut’s unique mix of high-skilled workers. Figure 13 shows Connecticut economic
contributions, employment, labor income, and average wages resulting from defense contracts performed
in New England.
11 In 2011, for example, 2.3 percent of all contract work performed in Connecticut came from out-of-state vendors.

The Defense Industry in Connecticut
UMass Donahue Institute Economic & Public Policy
17
Figure 13: Connecticut Economic Output, Employment, Labor Income, and Average Wage, 2011
Source: UMDI Calculations; IMPLAN Economic Analysis Software, Minnesota IMPLAN Group
Note: Dollar values have been adjusted to 2011 dollars.
Figure 14 illustrates the industry sectors in the Connecticut economy for which federal defense contracts
have the greatest total economic contributions.12 Federal defense work performed in New England results
in significant contributions to high-tech sectors. “Ship building and repairing” is the Connecticut industry
sector the most impacted by federal defense within the state, with more than $3.7 billion in total economic
contributions (including direct, indirect and induced effects of work performed anywhere in New England).
“Aircraft manufacturing” is the second most impacted sector, with over $3.1 billion in total economic
contributions. In total, economic contributions to the top four industry sectors, all with contributions well
more than $1 billion, add up to more than 47 percent – nearly half – of all federal defense contract
contributions within the state.
12
Industry sectors in this discussion refer to the 440 industry sectors used by the IMPLAN software, which are based on, but not the same as, NAICS sectors discussed elsewhere in this report. The sector “Residential and commercial real estate” is a combination of IMPLAN sectors 360, Real estate establishments, and 361, Imputed rental activity for owner-occupied dwellings.
Direct Contribution
of Work Performed
in Connecticut
Indirect + Induced
Contribution from
Work Performed in
Connecticut
Contributions to
Connecticut from
Work Performed
Elsewhere in New
England (Indirect +
Induced)
Total
Contributions to
Connecticut
Total Output $12,394,237,512 $8,877,866,951 $1,147,382,937 $22,419,487,399
Employment 40,964 55,773 4,621 101,359
Labor Income (included in Total) $4,195,005,637 $3,383,940,474 $343,887,773 $7,922,833,885
Average Wage $102,407 $60,673 $74,411

The Defense Industry in Connecticut
UMass Donahue Institute Economic & Public Policy
18
Figure 14: Top 10 Connecticut Sectors Impacted by Federal Defense Contracts Performed in New England in 2011
Sources: UMDI Calculations; IMPLAN Economic Analysis Software, Minnesota IMPLAN Group
Taxes Generated by Defense Contracts
Federal defense contracts to New England make substantial federal state and local tax payments. As shown
in Figure 15, federal taxes paid in accordance with direct, indirect and induced contributions of federal
defense contract work performed in New England totaled nearly $1.7 billion in 2011, while state and local
taxes in Connecticut totaled an nearly $859 million.13
Figure 15: Federal, State, and Local Tax Impacts of Direct, Indirect, and Induced Defense-Related Economic Contributions in Connecticut, 2011
Sources: UMDI Calculations; IMPLAN Economic Analysis Software, Minnesota IMPLAN Group
With more than 101,000 jobs generated and $22.4 billion in total economic impact in FY2011, the defense
industry remains an integral part of the Connecticut economy.
13
See Appendix II for details on tax categories included in these two groups.
Sector
Indirect + Induced
Contributions to Sector from
Work Performed in New
England
Ship building and repairing $3,701,897,738
Aircraft manufacturing $3,131,224,333
Aircraft engine and engine parts manufacturing $2,540,748,562
Residential and commercial real estate $1,164,357,467
Architectural, engineering, and related services $929,086,528
Other aircraft parts and auxiliary equipment manufacturing $854,283,855
Scientific research and development services $646,234,139
Wholesale trade businesses $632,401,406
Scenic and sightseeing transportation and support activities for transportation $388,647,688
Management of companies and enterprises $334,644,392
Federal Taxes $1,741,942,053
State and Local Taxes $858,905,212

The Defense Industry in Connecticut
UMass Donahue Institute Economic & Public Policy
19
Conclusion
Connecticut’s unique qualities – home to a highly trained and educated workforce and a density of mature
defense technology companies along with a broad-based supply chain – make Connecticut a uniquely
strategic location for federal defense contracting. The industry is responsible for billions of dollars in
contract awards to Connecticut each year, as well as the generation of significant employment, payroll, and
taxes. Not only is the defense industry important in the state, but the growing number and value of
contracts awarded to Connecticut in the past decade illustrates the increasingly important role the state
plays in meeting the needs of the DoD and DHS.
Contract awards associated with specialized technology production and professional and technical services
continue to dominate the defense industry in Connecticut, and will likely be increasingly important for the
future development and cultivation of the industry within the state. According to the 2010 Quadrennial
Defense Review Report,14 any defense priorities and initiatives will lean heavily on new technology
development and technology-based research and development. A review of current science and technology
priorities, recent developments and recommendations can be found in the Defense Science Board’s Basic
Research Task Force report of January 2012.15
Impacts generated by the defense industry to the state have increased in the past decade. In particular,
increasing revenues along with increases in employment and payroll are especially important to the
Connecticut economy. A major risk to the continued growth of the defense industry in the region comes
with the requirements of the 2011 Budget Control Act. Defense budget cuts related to the requirements of
the Budget Control Act will impact the New England economy in both the short- and long-term.16 To remain
consistent with the Budget Control Act in the long-term, the DoD is in the process of reducing spending on
its base budget by $487 billion, over ten years starting in FY2012. To meet new budget targets while also
maintaining national security responsibilities, the DoD has reshaped defense spending priorities based on a
14
Quadrennial Defense Review Report, February 2010 (QDR) 2010. http://www.defense.gov/qdr/ 15
The Report of the Defense Science Board Task Force on Basic Research. Office of the Under Secretary of Defense for Acquisition, Technology and Logistics Washington, D.C. January 2012. http://www.acq.osd.mil/dsb/reports/BasicResearch.pdf. An archive of current documents related to DoD applied and basic research priorities are available at the following American Association of Universities web page: http://www.aau.edu/policy/department_of_defense.aspx?id=7316 16
The DoD has created a page on its website related to defense budget plans that contains useful news articles, budget reports, speeches and transcripts. To access this information see: U.S. Department of Defense Special Feature: FY2013 Budget Proposal. http://www.defense.gov/home/features/2012/0212_budget

The Defense Industry in Connecticut
UMass Donahue Institute Economic & Public Policy
20
new defense strategy. Guided by the strategy, every part of the budget was examined, and a final budget
was developed.17 Proposed cost savings targeted in four areas of the defense budget: efficiencies, force
structure reduction, procurement adjustments, and compensation.18
Cost savings initiatives along with investment priorities related to the new strategy will have potential short-
and long-term impacts on the New England economy. According to statements from Secretary of Defense
Leon E. Panetta, the President will likely request that Congress authorize the Base Realignment and Closure
(BRAC) process for 2015. Force structure reductions will be made to emphasize geographic focus on Asia
and the Middle-East; and cuts and readjustments will be made to the air and navy fleets, which could impact
the New England product line. At the same time, key investments will be made in space, in cyberspace, in
long-range precision strike-capabilities and in special operations forces. Investments will be made to insure
retention of the military’s technological strength with funding for science and technology research, including
significant funding for basic research; other investments will be made to develop unmanned air systems as
well as cyber activities and operations.19
In the immediate term, significant budget cuts, if enacted, will likely pose a challenge for many defense
contractors and their supply chain both within New England and across the nation. In order for DoD to
comply with the spending limits set forth in the Budget Control Act of 2011, its FY2013 budget (starting
October 1, 2012), has been reduced from FY2012. Pentagon spending has shifted in several key areas that
are generally relevant to the New England product line. According to the February 2012 Financial Summary
Tables, in FY2013 the procurement budget is reduced by 13 percent; research, development, testing, and
evaluation spending will be reduced by 5.5 percent. 20 Additional budgetary challenges loom if
Sequestration requirements are imposed on top of the existing, planned cuts. The Budget Control Act’s
sequestration provision would require an additional $500 billion reduction to the defense budget over the
next nine years if Congress does not pass budget reduction legislation. Absent further congressional action,
the first round of these significant reductions is scheduled to be ordered on January 2, 2013.21
17 Defense Budget Priorities and Choices. January 2012. Page 3. http://www.defense.gov/news/Defense_Budget_Priorities.pdf; 18 Information from Opening Summary – Senate Budget Committee (Budget Request) as delivered by Secretary of Defense Leon E. Panetta. Capitol Hill, Washington D.C., February 28, 2012. http://www.defense.gov/speeches/speech.aspx?speechid=1654. 19 Information from Opening Summary by Secretary of Defense Leon E. Panetta. More detailed information on DoD’s current strategic guidance for budget choices can be found in Sustaining U.S. Global Leadership: Priorities for 21st Century Defense. January 2012. http://www.defense.gov/news/Defense_Strategic_Guidance.pdf; also in Defense Budget Priorities and Choices. http://www.defense.gov/news/Defense Budget_Priorities.pdf; and in various Fiscal FY13 Budget Request Overview documents. http://comptroller.defense.gov/budget.html; 20 Financial Summary Tables – Department of Defense Budget for Fiscal Year 2013. February 2012. http://comptroller.defense.gov/defbudget/fy2013/FY2013_Financial_Summary_Tables.pdf 21 See page 3, OMB Report Pursuant to the Sequestration Transparency Act of 2012 (P. L. 112–155).

The Defense Industry in Connecticut
UMass Donahue Institute Economic & Public Policy
21
A study by George Mason University (GMU) estimates that the combined effects of statutory spending limits
and automatic spending reductions imposed by the Budget Control Act would reduce total DoD spending
nationally by a total of $56.7 billion in FY2012 and FY2013, a total that includes $7.1 billion in payroll
reductions and $49.6 billion in procurement reductions.22 According to the estimates presented in the GMU
study, the effect of these two types of cuts to the defense budget in FY2012 and FY2013 could lead to job
losses totaling more than 90,000 across New England and labor income losses of more than $3.8 billion.
Connecticut alone could stand to lose in excess of 36,000 jobs, $1.5 billion in labor income, and $3.1 billion
in GDP.23
22 Fuller, Stephen S. The Economic Impact of the Budget Control Act of 2011 on DoD & non-DoD Agencies. Center for Regional Analysis, George Mason University. July 17, 2012. Page 5. http://www.aia-aerospace.org/assets/Fuller_II_Final_Report.pdf 23 Totals in this section assume that state totals can be added together to come up with a total New England regional impact.

The Defense Industry in Connecticut
22
Appendix I. Executive Summary
The defense industry is an important and expanding component of the Connecticut economy. Since 2003, the
Department of Defense and the Department of Homeland Security have engaged thousands of Connecticut
firms and institutions to provide essential equipment, supplies and technical services in support of national
defense operations. Connecticut ranks among the top ten states (ranked number 7 in 2011) as a provider of
goods and services, and contract awards to Connecticut vendors have risen in value by 83 percent since 2003.
The report provides an overview of the nature and scale of the defense industry within Connecticut. The
analysis provides a look at the unique aspects of the defense industry in Connecticut and looks at important
trends over the period between 2003 and 2011. Findings from the analysis include the following key points.
The defense industry is a major contributor to the economy of New England and to its six states. Defense contract awards to New England firms and institutions totaled nearly $34 billion, representing 9
percent of U.S. defense and homeland security contracts in 2011. New England-led defense awards have risen 85 percent since 2003, but growth trends have varied by state.
Direct spending by the defense industry in New England totaled $32.5 billion. New England vendors spent $30.7 billion within the region and another $1.7 billion in work was brought in by out-of-state vendors
This defense industry spending in the region generated more than $62 billion within the region and its activities supported more than 319,000 jobs.
The value added to the regional economy from defense spending (both directly and from the indirect and induced economic activity from this spending) represents, conservatively, 4.1% of New England regional GDP.
New England has measurable strengths. The region excels in three major types of activities The largest cluster of activity (in terms of total sales) revolves around transportation equipment
manufacturing (including producers of ships; aircraft; engines and components; and missile systems). Related machinery manufacturing and equipment maintenance sub-sectors are also strong.
Another key sector is professional, scientific & technical services (which includes providers of scientific research and development services and engineering services).
A third major strength in New England is in computer and electronic product manufacturing (especially providers of navigational, measuring and control instruments and communications equipment).
Each state has different strengths when it comes to industry sectors and these strengths are discussed in detail in the individual state reports.

The Defense Industry in Connecticut
UMass Donahue Institute Economic & Public Policy
23
New England’s major product lines flow out of its three major clusters of activity. New England excels in providing a range of advanced manufactured products (top sales include: ships;
engines, turbines and components; aircraft and airframe structural components; guided missiles and communication, detection and coherent radiation equipment.
Research and development is a major product line in New England and contracts in this area go to a variety of private firms; institutions of higher education; and specialized research and consulting organizations. The leading type of R&D in the region is defense systems R&D which covers aircraft, missile and space systems; ships; tanks; weapons; electronics and communications; and hard goods. Research and development related to on-the-ground equipment and materials (defense ‘other’ R&D) is another a major area for New England.
The defense industry in Connecticut is an important cluster of activities within the state and is by far the major recipient of federal contracts. Defense contract awards to Connecticut firms and institutions totaled nearly $12.7 billion in 2011 and
represented 95 percent of all federal contract awards to Connecticut. Direct spending by defense contractors in 2011 generated $22.4 billion within the state and its activities
supported more than 101,000 jobs. o Defense contract work performed in the state translated into nearly $21.3 billion in total economic
activity for the state. o Work performed in other parts of New England generated an additional $1.1 billion in indirect and
induced effects in Connecticut. The value added to the state's economy from defense spending (both directly and from the indirect and
induced economic activity of this spending) represents, conservatively, 5.1% of Connecticut GDP. The top five federal contract recipients in Connecticut are defense contractors. The top five products or services sold to the federal government are defense products: submarines; rotary
wing aircraft; gas turbines and jet engines aircraft; defense aircraft; and maintenance and repair of engines & turbines.
The defense industry in Connecticut has been a source of remarkable economic expansion. However, defense budget cuts related to the requirements of the 2011 Budget Control Act have the potential to impact growth. During a period of serious economic decline in many areas of the economy, the defense industry has been a
source of growth. Defense awards to Connecticut firms have risen 51 percent from nearly $8.4 billion in 2003 to more than
$12.6 billion in 2011.
Defense contracts, which support technical, high value-added sectors of the economy, employ large numbers of highly educated and trained workers. Federal defense contracts support work in advanced manufacturing and specialized technical and
professional services: o The Transportation Equipment Manufacturing sector – including aerospace product and parts
manufacturers and manufacturers of ships – earned $9.5 billion in federal contracts in 2011 and purchases in this sector have nearly doubled since 2003.

The Defense Industry in Connecticut
UMass Donahue Institute Economic & Public Policy
24
o The Professional, Scientific and Technical Services sector – including providers of architecture,
engineering and related services and scientific research and development services – earned more than $1.4 billion in federal contracts, an increase of 93 percent since 2003.
Defense contract work in New England supported more than $7.9 billion in labor income for Connecticut workers.
o Work in Connecticut directly supported nearly $4.2 billion in labor income for Connecticut defense workers, and indirectly supported an additional nearly $3.4 billion in labor income for workers in related industries.
o Defense work located elsewhere in New England indirectly supported an additional $343 million in labor income for Connecticut workers.
Defense-related contracts support some of the state’s largest manufacturers and employers. In 2011 two major corporations were awarded a combined total of more than $11.2 billion, which
amounted to 88 percent of federal defense contract awards to Connecticut: o United Technologies Corporation: $6.9 billion o General Dynamics Corporation: $4.4 billion

The Defense Industry in Connecticut
UMass Donahue Institute Economic & Public Policy
25
Appendix II. Defense Work in Connecticut by Originating State
Connecticut defense contractors perform approximately 96 percent of their contract work, valued at more than
$12.1 billion, within Connecticut. But the state also serves as the ‘principal place of performance’24 for contracts
awarded to out-of-state contractors. In 2011, contractors from nearly every other state utilized Connecticut
facilities to perform defense contract work valued at $284.4 million. 25
The economic impact analysis in this study combines the value of the work done in the state by Connecticut
contractors with the value of the work done by out-of-state contractors (which adds to a total of nearly $12.4
billion) to approximate direct spending by the defense industry within the state.
The vast majority of defense work performed in Connecticut comes from in-state contractors
Figure 16: Value of FY2011 Defense Contract Work Performed in Connecticut, by Contractor Location
Source: USAspending.gov; DoD and DHS contract actions
24
The ‘Principal Place of Performance State’ is the state where the majority of the work on the contract is performed. 25
This total is not the same as work performed in the state by in-state sub-contractors. The USA Spending database is only beginning to offer data on work awarded to sub-contractors.
Rank Vendor State Value of Contracts
1 Connecticut $12,102,490,016
2 Illinois $69,070,586
3 Florida $51,914,034
4 Virginia $38,824,766
5 Washington $25,626,887
6 Massachusetts $18,550,778
12 Maine $4,568,353
14 Rhode Island $4,301,003
19 New Hampshire $2,180,619
41 Vermont $85,007
All Other States $69,296,821
Total $12,386,908,869
Work done by outside vendors $284,418,853
2.3 percent of total

The Defense Industry in Connecticut
UMass Donahue Institute Economic & Public Policy
26
Out-of-State vendors brought more than $284 million in defense work to Connecticut in 2011
Figure 17: Value of Contracts Performed in Connecticut, by Both In- and Out-of-State Vendors in FY2003 and FY2011
Source: USAspending.gov; DoD and DHS contract actions *Note: Includes other countries
FY2003 FY2011
Rank State Contract Values Rank State Contract Values
1 Connecticut $7,925,142,538 1 Connecticut $12,102,490,172
2 Washington $38,013,901 2 Ill inois $69,070,586
3 Virginia $29,241,572 3 Florida $51,914,034
4 Massachusetts $22,740,123 4 Virginia $38,733,676
5 New Jersey $13,152,935 5 Washington $25,626,887
6 Minnesota $11,913,650 6 Massachusetts $18,550,778
7 New York $9,761,144 7 Pennsylvania $14,609,330
8 California $8,883,091 8 Texas $11,487,580
9 Kentucky $6,712,177 9 Maryland $8,459,525
10 Maryland $5,754,543 10 California $6,226,909
11 Rhode Island $4,816,998 11 Colorado $4,763,897
12 Colorado $3,250,656 12 Maine $4,568,353
13 New Hampshire $2,935,971 13 New Jersey $4,384,245
14 Ill inois $2,733,756 14 Rhode Island $4,301,003
15 District of Columbia $2,397,635 15 Alabama $3,416,665
16 Ohio $1,920,160 16 New York $2,708,674
17 Alabama $1,402,707 17 Kentucky $2,396,189
18 Georgia $1,298,497 18 Missouri $2,211,654
19 Florida $1,082,593 19 New Hampshire $2,180,619
20 Pennsylvania $1,077,272 20 Oklahoma $1,798,181
21 North Carolina $1,031,955 21 Alaska $1,361,480
22 Louisiana $998,270 22 Ohio $946,583
23 Missouri $331,372 23 Minnesota $468,029
24 Michigan $249,396 24 Indiana $465,494
25 South Carolina $217,300 25 Georgia $403,272
Other* $1,441,436 Other* $3,273,963
Total $8,098,501,648 Total $12,386,817,779

The Defense Industry in Connecticut
UMass Donahue Institute Economic & Public Policy
27
Figure 18: Place of Performance Map FY2011
Source: USAspending.gov; DoD and DHS contract actions

The Defense Industry in Connecticut
UMass Donahue Institute Economic & Public Policy
28
Appendix III. Tax Analysis Categories
State/ Local Government Non-Education Federal Government Non-DefenseCorporate Profits Tax Corporate Profits TaxDividends Indirect Business Tax: Custom DutyIndirect Business Tax: Motor Vehicle Licesnse Indirect Business Tax: Excise TaxesIndirect Business Tax: Other Taxes Indirect Business Tax: Federal Non TaxesIndirect Business Tax: Property Tax Interest (Gross)Indirect Business Tax: S/L Non Taxes Personal Tax: Estate and Gift TaxIndirect Business Tax: Sales Tax Personal Tax: Income TaxIndirect Business Tax: Severance Tax Personal Tax: Non TaxesInterest (Gross) Social Security Tax Employee ContributionPersonal Tax: Estate and Gift Tax Social Security Tax Employer ContributionPersonal Tax: Income TaxPersonal Tax: Motor Vehicle LicensePersonal Tax: Non TaxesPersonal Tax: Other TaxPersonal Tax: Property TaxesSocial Security Tax Employee ContributionSocial Security Tax Employer Contribution
Tax Category Breakdown
Figure 19: Tax Category Breakdown
Source: Using Social Accounts to Estimate Tax Impacts, by Douglas C. Olson, MIG, Inc, June 11, 1999

The Defense Industry in Connecticut
UMass Donahue Institute Economic & Public Policy
29
Appendix IV. Input-Output Analysis and the IMPLAN Software
Input-Output Analysis and the IMPLAN software
The goal of economic contribution analysis is to estimate the ongoing effects of an initial stimulus (i.e.
federal defense contracts) within a regional economy. The premise is that an initial investment in one
sector of an economy spurs additional economic activity in other sectors as the money is re-spent within
the region. The total economic contribution of the initial investment is estimated by tracing the flow of
money among industries and households until all of the initial investment eventually leaves the region
through foreign or domestic trade, or is collected as a tax.
This study presents economic contributions estimated using IMPLAN Professional input-output analysis
software. Input-output models estimate the level of economic exchange among various industries in a
regional economy. This analysis measures the importance of economic activity primarily in terms of
output impacts, employment impacts, and tax impacts:
Output is the total value of spending in the region attributable to spending in an industry (in this
case, the defense industry).
Employment refers to the number of people employed in the state as a result of defense
contracting. This includes wage and salary employees and self-employed individuals.
Labor income (Payroll) is the total estimated salary generated by defense spending in the
regional economy.
Tax Impact is the total estimated federal, state, and local tax contributions generated by
defense spending
Direct, indirect, and induced effects
Direct impacts are inputs into the state economy – in this case, we express them as the total dollar value
of the defense contract work performed in the region (Connecticut). Indirect impacts are purchases of
Connecticut goods or services made by New England defense contractors as a result of receiving the
contract(s). Induced effects are the impacts of household expenditures from wages and salaries for
both direct and indirect employees.

The Defense Industry in Connecticut
UMass Donahue Institute Economic & Public Policy
30
IMPLAN
The IMPLAN modeling system, a widely used and respected proprietary software, combines the U.S.
Bureau of Economic Analysis’ Input-Output Benchmarks with regional employment and wage data to
construct quantitative models of the flow of goods and services among a region’s businesses and
households, and estimates direct, indirect and induced effects of the original investment. IMPLAN’s
proprietary database details economic activity in 440 industry sectors; “institutions” such as local, state
and federal governments; and households. IMPLAN models are highly customizable by the analyst to
reflect the best, most up-to-date knowledge about local spending patterns.
Methodology
Multi-regional Input-Output (MRIO) Analysis
Recent improvements in IMPLAN’s proprietary data structure and software now allow multi-regional
input-output analysis, meaning that the effects of initial inputs to one region – in this case, a New
England state – can be modeled throughout the entire region. This enables, for instance, the estimation
of indirect and induced economic contributions to Massachusetts from defense contracts performed in
New Hampshire (as well as Connecticut, Maine, Rhode Island, and Vermont). This study presents the
first multi-regional analysis of federal defense contracts in New England.
NAICS to IMPLAN Crosswalk
NAICS codes were aligned to IMPLAN codes for each of the years using an IMPLAN bridge. Since federal
spending data are not standardized to single version of NAICS (i.e. 1997, 2002 or 2007), several different
versions of NAICS codes were used to match to IMPLAN codes for each of the years. Earlier NAICS codes
(i.e. 1997 or 2002) were bridged to NAICS 2007 before being matched to IMPLAN codes.
Missing NAICS Codes
Federal contract data contained contractual actions that had no specified NAICS codes. One method to
assign NAICS codes to these expenditures would be to use federal spending product codes, company
names, and other information to assign a NAICS code. However, this method is laborious, time-
intensive, and in many cases still does not allow for a meaningful assignment. In order to capture the
full extent of economic activity these contracts initiated, we assumed that expenditures with missing
NAICS codes occurred in the same NAICS codes, and in the same share, as the expenditures with

The Defense Industry in Connecticut
UMass Donahue Institute Economic & Public Policy
31
specified NAICS codes. For instance, if four percent of federal defense spending to specified NAICS
codes in the region was for missile manufacturing, then four percent of unassigned expenditures were
assumed to be for missile manufacturing.
Missing IMPLAN Sectors
IMPLAN sectors are specific for each geographic region and all of the subsequent economic activity is
generated for sectors that exist within that region. Each year, a small number of IMPLAN sectors are
assumed not to exist within the Connecticut economy. In the few cases where a NAICS code matched to
an IMPLAN sector was assumed not to exist in Connecticut, a closely related IMPLAN sector was used to
model the contract actions.

The Defense Industry in Connecticut
UMass Donahue Institute Economic & Public Policy
32
Appendix V. New England’s Top Products: State Rankings
Figure 20: State and New England Rankings of New England's Top Ten Products and Services, 2011 Contract Values
Rank State Contract Value Rank State Contract Value Rank State Contract Value Rank State Contract Value Rank State Contract Value
N.E. $8,407,388,142 1 CA $8,225,569,024 N.E. $3,379,985,176 1 TX $8,936,460,556 1 AZ $2,475,907,747
1 ME $4,476,109,532 N.E. $5,190,389,720 1 CT $1,959,237,283 2 CA $6,285,023,576 2 CA $1,850,329,042
2 MS $4,433,480,502 2 VA $4,770,278,083 2 MA $1,419,688,169 3 WA $4,012,164,575 N.E. $1,754,368,561
3 CT $3,924,591,559 3 MA $3,608,124,372 3 OH $554,143,025 4 GA $3,558,075,977 3 MA $1,721,303,093
4 VA $2,205,079,869 4 AL $3,108,684,232 4 IN $337,269,205 N.E. $2,821,389,095 4 FL $491,382,483
5 AL $1,410,331,149 5 TX $2,995,473,812 5 AZ $293,092,279 5 CT $2,719,016,918 5 TX $382,701,038
6 MD $963,051,248 6 MD $2,766,453,230 6 FL $59,643,735 6 MO $2,618,701,537 6 MO $171,584,925
7 CA $685,136,126 7 NY $1,903,415,146 7 CA $54,541,102 7 AZ $1,267,376,000 7 MN $149,609,150
8 LA $297,194,507 8 NJ $1,632,980,372 8 TX $36,124,078 8 VA $1,199,479,020 8 MD $119,552,246
9 WA $50,679,286 9 AZ $1,479,519,028 9 VA $26,687,584 9 PA $1,154,509,160 9 NY $66,519,287
10 FL $42,756,717 10 CT $1,271,546,251 10 MI $23,808,202 10 MD $807,672,948 10 PA $42,501,200
11 WI $41,655,764 11 CO $1,229,893,490 11 WI $23,134,531 11 KS $588,313,459 11 IN $34,355,048
12 MN $26,663,329 12 MO $1,220,777,297 12 NY $19,030,034 12 NY $531,287,546 12 AL $33,658,236
13 OR $9,358,074 13 PA $934,460,219 13 PA $18,178,921 13 IL $311,563,636 13 NH $27,802,579
14 UT $8,474,383 14 FL $775,931,482 14 IL $16,984,263 14 IN $165,824,677 14 VA $10,390,682
15 MA $6,415,100 15 OH $733,395,291 15 CO $15,745,535 15 FL $87,061,137 15 WV $5,883,442
16 NJ $5,725,152 16 IL $522,781,311 16 NV $10,137,864 16 MN $67,957,550 16 UT $4,467,264
17 SC $3,766,908 17 WA $500,441,651 17 MO $8,157,471 17 MA $67,676,519 17 SC $4,202,173
18 DC $3,238,538 18 TN $338,581,269 18 AL $8,115,762 18 AL $44,075,667 18 RI $3,904,434
19 TX $2,821,002 19 NM $253,345,226 19 GA $7,726,343 19 OH $36,765,228 19 OH $3,853,491
20 MI $2,630,056 20 GA $251,146,634 20 OK $7,241,167 20 NV $33,581,325 20 CT $1,314,762
21 HI $2,356,429 21 NH $196,462,012 21 NJ $7,168,015 21 OK $26,595,323 21 NJ $1,025,619
22 NY $1,560,752 22 IN $182,044,930 22 UT $6,891,079 22 NM $26,487,816 22 OK $457,500
23 AZ $1,407,919 23 IA $167,939,407 23 WA $5,306,053 23 VT $21,585,844 23 IL $431,231
24 GA $720,854 24 NC $160,921,427 24 MD $5,300,239 24 TN $16,453,080 24 TN $218,442
25 AR $678,581 25 NV $152,846,012 25 LA $5,005,081 25 NJ $13,163,281 25 MI $188,887
26 MO $374,777 26 UT $141,016,801 26 TN $2,047,748 26 NH $12,136,143 26 NE $186,495
27 AK $368,669 27 MN $117,723,362 27 NC $2,040,223 27 CO $9,203,831 27 WA $165,416
28 NC $290,089 28 MI $110,327,809 28 SC $1,530,913 28 UT $7,875,640 28 GA $118,182
29 IA $264,649 29 KS $107,356,743 29 KY $1,477,287 29 SC $7,185,287 29 KS $114,234
30 RI $248,864 30 AK $86,015,183 30 NM $677,764 30 IA $6,433,214 30 AR $61,987
31 TN $237,789 31 HI $74,990,837 31 MN $560,641 31 AR $5,094,863 31 NV $49,424
32 OK $181,746 32 ME $73,240,490 32 VT $515,154 32 MI $3,536,193 32 VT $43,694
33 IN $133,630 33 MS $70,286,446 33 AK $419,653 33 SD $3,205,679 33 WI $36,540
34 IL $97,055 34 OR $67,179,619 34 AR $384,406 34 MS $1,860,396 34 HI $33,168
35 OH $91,308 35 DC $63,348,745 35 NH $324,589 35 NE $1,491,237 35 MS $30,729
36 KY $91,053 36 WI $59,717,477 36 RI $219,980 36 RI $973,671 36 CO $12,000
37 GU $59,642 37 OK $49,595,982 37 OR $205,663 37 WV $935,735 37 AK $11,500
38 CO $25,513 38 SC $46,315,722 38 MS $195,548 38 OR $879,886 38 ID $8,743
39 NH $23,087 39 WV $26,459,742 39 ND $179,684 39 NC $730,780 39 OR $7,200
40 ND $19,392 40 LA $24,801,877 40 WV $111,771 40 DE $709,708 40 NC $7,191
41 ID $16,142 41 RI $23,548,757 41 HI $100,690 41 WI $562,324 41 MT $2,850
42 WV $5,316 42 NE $22,476,355 42 MT $92,169 42 LA $361,872
43 NM $3,998 43 VT $17,467,839 43 DE $73,040 43 AK $62,370
44 KS $1,550 44 MT $13,605,959 44 KS $58,884 44 ND $60,689
45 PA -$197,261 45 KY $10,002,235 45 IA $17,383 45 KY $57,806
46 DE $7,273,616 46 ID $12,179 46 HI $34,250
47 AR $6,787,070 47 SD $6,138 47 WY $33,872
48 ID $6,692,058 48 PR $4,586 48 ID $29,222
49 SD $3,261,309 49 NE $0 49 MT $25,359
50 ND $2,577,437 50 DC -$75,443
51 WY $2,029,987
52 PR $1,917,525
53 N/A $70,307
54 GU $68,215
55 VI $40,530
Ships, Small Craft, Pontoons,
And Floating Docks(19) Research And Development(A)
Engines, Turbines, And
Components(28)
Aircraft And Airframe
Structural Components(15) Guided Missiles(14)

The Defense Industry in Connecticut
UMass Donahue Institute Economic & Public Policy
33
Source: USAspending.gov; DoD and DHS contract actions
Rank State Contract Value Rank State Contract Value Rank State Contract Value Rank State Contract Value Rank State Contract Value
1 TX $1,736,377,806 1 VA $17,915,728,397 1 VA $3,589,138,479 1 TX $1,130,409,393 1 TX $1,669,363,257
N.E. $1,703,348,209 2 TX $5,496,795,725 2 TX $3,493,165,184 N.E. $1,001,057,940 2 MO $1,046,839,863
2 CA $1,341,247,922 3 CA $3,618,994,065 3 FL $2,345,760,157 2 CT $496,642,748 3 VA $701,933,244
3 NY $1,332,531,320 4 MD $3,240,999,494 4 CA $1,653,736,417 3 MO $495,729,411 4 AZ $651,755,139
4 MA $1,186,647,316 5 SC $2,714,955,267 N.E. $1,211,774,439 4 FL $429,652,843 5 FL $606,136,207
5 VA $987,011,785 6 NJ $2,320,673,682 5 OK $693,124,718 5 NV $368,405,704 N.E. $597,162,504
6 MD $931,339,844 N.E. $1,603,154,276 6 NJ $665,949,835 6 CA $362,704,650 6 PA $383,209,722
7 FL $530,898,830 7 AL $1,599,765,160 7 CT $595,324,205 7 NY $328,124,758 7 MN $367,604,249
8 NJ $505,900,109 8 FL $1,495,642,351 8 MD $590,153,902 8 AZ $291,792,593 8 VT $337,397,863
9 IN $451,656,023 9 OH $1,446,454,272 9 MA $568,386,619 9 MS $241,239,396 9 IL $275,949,484
10 NH $405,737,902 10 CO $1,186,375,119 10 AL $504,618,915 10 MA $228,791,147 10 CO $269,175,988
11 IA $362,457,623 11 MA $1,131,508,667 11 GA $352,182,208 11 IN $172,823,830 11 MA $236,925,075
12 OH $348,833,065 12 GA $708,057,749 12 KS $294,551,956 12 NH $133,489,026 12 TN $219,478,864
13 UT $269,024,382 13 AZ $576,781,576 13 CO $292,165,173 13 KY $128,154,674 13 CA $133,974,711
14 MO $262,076,450 14 KY $537,698,330 14 WA $237,861,898 14 IL $111,162,528 14 WI $128,165,346
15 GA $191,736,214 15 PA $534,617,013 15 MS $227,071,262 15 OH $104,784,271 15 OH $76,622,822
16 AZ $187,922,630 16 DC $485,092,022 16 OH $219,426,999 16 NJ $95,921,089 16 AR $21,259,379
17 WA $168,802,373 17 NY $474,247,622 17 MI $214,153,384 17 VA $93,749,632 17 AL $20,537,594
18 OR $154,528,885 18 TN $465,711,985 18 HI $192,845,571 18 PA $91,139,287 18 IA $19,871,894
19 CO $103,088,676 19 AK $412,591,735 19 AZ $149,209,818 19 RI $86,427,484 19 SD $17,479,715
20 RI $100,937,825 20 CT $317,350,312 20 SC $146,279,729 20 IA $67,993,114 20 NY $14,309,196
21 PA $94,862,343 21 NC $285,293,798 21 NE $142,603,895 21 VT $55,707,534 21 NH $13,340,590
22 IL $93,288,811 22 IN $246,852,972 22 PA $126,147,516 22 MI $54,818,278 22 KS $12,050,502
23 NV $91,178,427 23 KS $243,205,308 23 MO $126,108,454 23 AL $50,993,524 23 WA $10,574,728
24 DC $80,378,789 24 IL $220,925,705 24 IL $107,210,625 24 UT $49,276,923 24 CT $9,403,694
25 AL $73,369,923 25 OK $220,476,389 25 AK $102,245,599 25 NC $37,989,716 25 MD $8,326,522
26 MN $50,699,324 26 MI $201,120,229 26 NY $98,531,159 26 WA $34,525,095 26 LA $7,370,156
27 KY $48,363,111 27 NV $194,246,348 27 IN $57,640,118 27 OK $29,335,692 27 ID $6,582,316
28 AK $38,667,911 28 WA $177,722,205 28 NC $48,413,593 28 CO $24,760,490 28 NJ $5,254,886
29 NC $35,049,741 29 NM $169,991,063 29 DC $39,030,503 29 MD $23,777,026 29 GA $4,315,516
30 TN $24,623,057 30 IA $154,998,204 30 OR $38,264,378 30 AK $23,715,845 30 WY $4,250,268
31 NM $23,920,951 31 NE $119,802,502 31 IA $33,848,775 31 GA $19,650,293 31 WV $4,194,306
32 SC $22,616,592 32 MO $103,885,250 32 NV $30,432,809 32 SC $13,509,596 32 IN $3,983,529
33 MI $7,809,634 33 MS $103,583,743 33 NH $29,654,901 33 SD $12,386,016 33 MS $3,563,336
34 WV $6,753,447 34 UT $83,177,964 34 UT $28,343,170 34 TN $11,842,608 34 KY $3,363,805
35 MS $6,224,083 35 RI $71,356,981 35 GU $28,227,740 35 HI $11,360,219 35 OR $3,326,454
36 CT $5,828,358 36 NH $68,845,347 36 LA $18,109,605 36 MN $10,131,514 36 NC $1,847,894
37 ID $5,754,503 37 LA $65,736,404 37 MN $17,676,897 37 KS $6,233,846 37 MI $1,368,665
38 ME $4,049,346 38 HI $55,296,364 38 NM $12,889,667 38 NM $5,531,193 38 NM $712,581
39 OK $3,643,322 39 MT $48,934,585 39 WI $11,494,700 39 DE $5,466,846 39 NV $709,975
40 HI $3,391,433 40 WI $44,312,213 40 TN $11,405,616 40 WI $2,498,436 40 MT $700,340
41 KS $2,271,258 41 ID $34,303,962 41 RI $11,372,913 41 ID $1,812,389 41 SC $125,865
42 AR $2,076,794 42 MN $29,505,936 42 ME $6,616,032 42 OR $1,409,754 42 OK $114,902
43 NE $1,792,950 43 WV $20,728,399 43 KY $4,520,868 43 AR $1,173,302 43 RI $84,604
44 WI $1,133,969 44 ME $12,412,131 44 MT $3,526,109 44 MT $1,032,455 44 AK $68,150
45 LA $1,071,257 45 OR $7,950,383 45 AR $3,018,210 45 WV $828,089 45 NE $33,671
46 MT $770,185 46 ND $5,499,716 46 PR $1,949,284 46 ND $407,177 46 ME $10,678
47 PR $747,747 47 DE $3,724,748 47 DE $1,887,981 47 WY $235,017 47 DC -$11,673
48 DE $443,823 48 VT $1,680,837 48 ID $1,779,165 48 LA $152,860 48 UT -$1,346,733
49 GU $433,244 49 PR $1,679,289 49 ND $1,142,212 49 NE $2,916
50 SD $350,165 50 AR $1,118,856 50 VT $419,770
51 ND $301,393 51 GU $611,786 51 WV $324,943
52 VT $147,463 52 SD $496,149 52 SD $305,281
53 AS $40,800 53 WY $183,412 53 WY $247,988
54 VI $29,754 54 VI $95,537 54 MP $9,555
55 N/A $42,565 55 N/A $5,100
56 VI -$5,315
Support
(Professional/Administrative/M
Maintenance, Repair, And
Rebuilding Of Equipment(J)
Aircraft Components And
Accessories
Ammunition And
Explosives(13)
Communication, Detection,
And Coherent Radiation