the definitive guide to employee surveys and
TRANSCRIPT
Technical WhitepaperIBM Software
Beyond engagementThe definitive guide to employee surveys and organizational performance
Employee engagement surveys have grown in acceptance in the last 10 years because organizations believe they can leverage employee engagement for higher employee retention, greater customer satisfaction and improved financial performance (Harter, Schmidt, & Hayes, 2002). It is estimated three of every four large firms in the United States survey their employees (Kraut, 2006). Worldwide research by IBM reveals surveys are more common in large organizations: 72 percent of organizations with more than 10,000 employees regularly conduct surveys, compared to only 50 percent of small organizations (those with between 100 and 249 employees, described in the Appendix). This same research reveals that, over the last 15 years in the United States among organizations with at least 100 employees, the percent conducting employee surveys has increased from 50 percent to 60 percent (Wiley, 2010).
Employee engagementDefinitions of employee engagement vary, but recent literature reviews reveal most are similar in terms of key components. These common components include enthusiasm for work, commitment, organizational pride, employee alignment with organizational goals and a willingness to exert discretionary effort (Robinson, 2007; Schneider, Macey, Barbera, & Martin, 2009; Vance, 2006). In this context, our definition of employee engagement is mainstream. We define employee engagement as: “The extent to which employees are motivated to contribute to organizational success, and are willing to apply discretionary effort to accomplishing tasks important to the achievement of organizational goals.”
Our approach to measuring employee engagement treats engagement as a desired state (Macey & Schneider, 2008), measured by an equally weighted combination of four individual elements: pride, satisfaction, advocacy and commitment. The rationale is straightforward: An engaged workforce is one whose employees have pride in and are satisfied with their organization as a place to work, and who advocate for and intend to remain with their organization. Thus, in this conceptualization, employee engagement is a result of organizational policies and practices, as well as leadership and managerial behaviors
Contents:1 Employee engagement
2 Employee engagement country comparison
3 Employee engagement drivers
3 Country-level drivers of employee engagement
4 Consistency with published research
4 Employee engagement and business performance
6 Performance excellence
7 Performance excellence industry comparison
8 Performance excellence and business performance
9 The high performance-engagement model
10 Is the high performance-engagement model a valid model of organization effectiveness?
11 A client example
12 Summary
12 About WorkTrends™
13 Simplified version of the high performance-engagement model
13 References
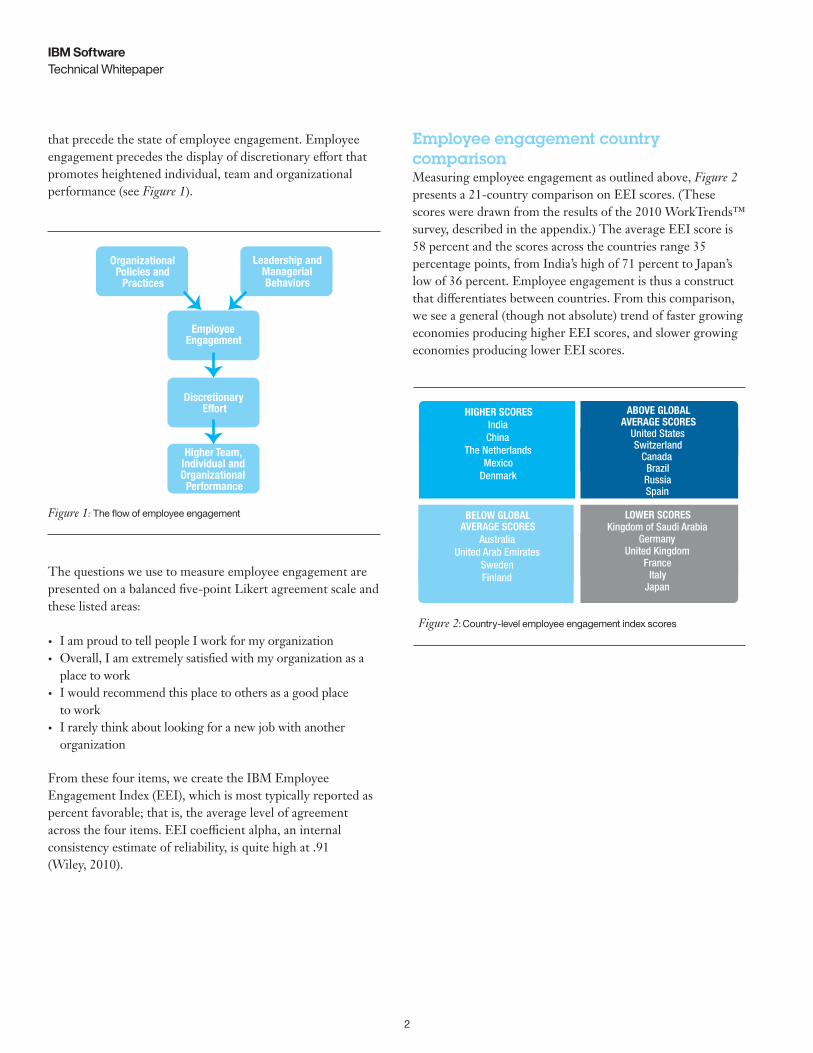
that precede the state of employee engagement. Employee engagement precedes the display of discretionary effort that promotes heightened individual, team and organizational performance (see Figure 1).
The questions we use to measure employee engagement are presented on a balanced five-point Likert agreement scale and these listed areas:
• I am proud to tell people I work for my organization• Overall, I am extremely satisfied with my organization as a
place to work• I would recommend this place to others as a good place
to work• I rarely think about looking for a new job with another
organization
From these four items, we create the IBM Employee Engagement Index (EEI), which is most typically reported as percent favorable; that is, the average level of agreement across the four items. EEI coefficient alpha, an internal consistency estimate of reliability, is quite high at .91 (Wiley, 2010).
Employee engagement country comparisonMeasuring employee engagement as outlined above, Figure 2 presents a 21-country comparison on EEI scores. (These scores were drawn from the results of the 2010 WorkTrends™ survey, described in the appendix.) The average EEI score is 58 percent and the scores across the countries range 35 percentage points, from India’s high of 71 percent to Japan’s low of 36 percent. Employee engagement is thus a construct that differentiates between countries. From this comparison, we see a general (though not absolute) trend of faster growing economies producing higher EEI scores, and slower growing economies producing lower EEI scores.
Technical WhitepaperIBM Software
Figure 1: The flow of employee engagement
Figure 2: Country-level employee engagement index scores
Organizational Policies and
Practices
Leadership and Managerial Behaviors
Employee Engagement
Discretionary Effort
Higher Team, Individual and Organizational
Performance
HIGHER SCORESIndiaChina
The NetherlandsMexico
Denmark
BELOW GLOBAL AVERAGE SCORES
AustraliaUnited Arab Emirates
Sweden Finland
LOWER SCORESKingdom of Saudi Arabia
GermanyUnited Kingdom
FranceItaly
Japan
ABOVE GLOBAL AVERAGE SCORES
United StatesSwitzerland
CanadaBrazilRussiaSpain
2
Technical WhitepaperIBM Software
This listing of 10 drivers can be reduced to a shorter list of four “macro” drivers, or pillars, of employee engagement. In broad terms, it appears employees are engaged by:
• Leaders who inspire confidence in the future (drivers 1, 2 and 8)
• Managers who recognize employees and emphasize quality and improvement as top priorities (drivers 4 and 10)
• Exciting work and the opportunity to grow and develop (drivers 5 and 6)
• Organizations that demonstrate a genuine responsibility to their employees and the communities in which they operate (drivers 3, 7 and 9)
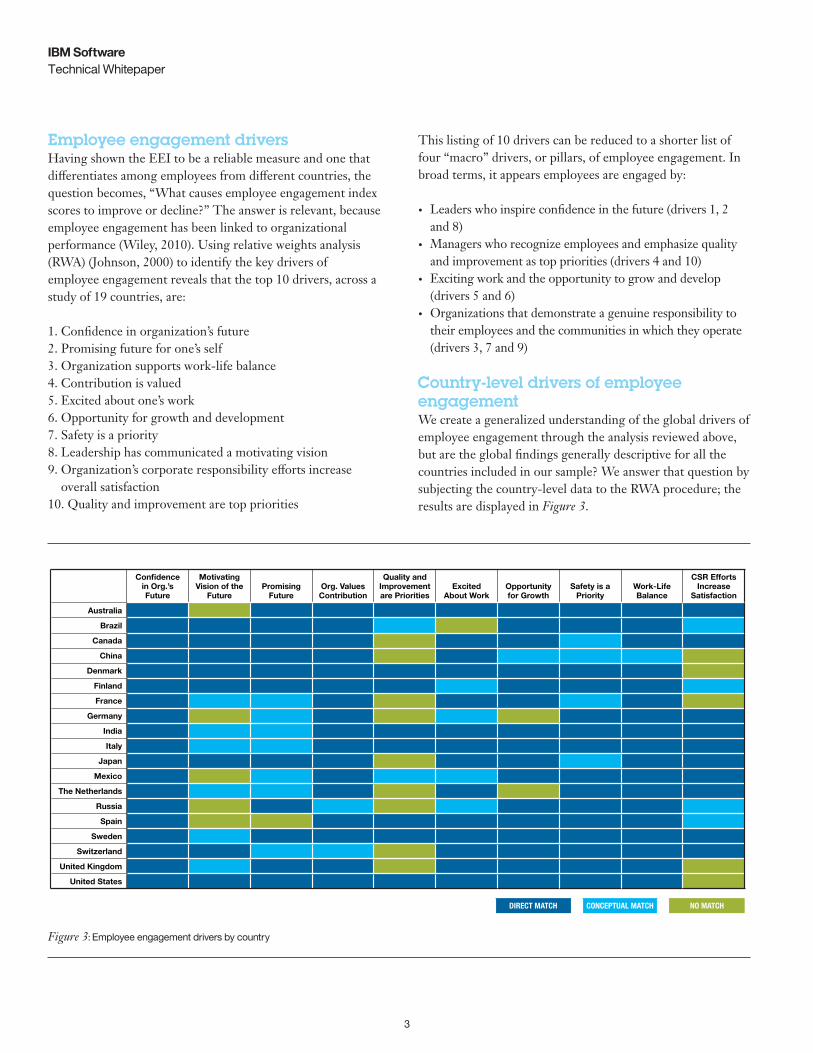
Country-level drivers of employee engagementWe create a generalized understanding of the global drivers of employee engagement through the analysis reviewed above, but are the global findings generally descriptive for all the countries included in our sample? We answer that question by subjecting the country-level data to the RWA procedure; the results are displayed in Figure 3.
Employee engagement driversHaving shown the EEI to be a reliable measure and one that differentiates among employees from different countries, the question becomes, “What causes employee engagement index scores to improve or decline?” The answer is relevant, because employee engagement has been linked to organizational performance (Wiley, 2010). Using relative weights analysis (RWA) (Johnson, 2000) to identify the key drivers of employee engagement reveals that the top 10 drivers, across a study of 19 countries, are:
1. Confidence in organization’s future 2. Promising future for one’s self 3. Organization supports work-life balance 4. Contribution is valued 5. Excited about one’s work 6. Opportunity for growth and development 7. Safety is a priority 8. Leadership has communicated a motivating vision 9. Organization’s corporate responsibility efforts increase overall satisfaction 10. Quality and improvement are top priorities
Figure 3: Employee engagement drivers by country
Confi dence in Org.’s Future
Motivating Vision of the
FuturePromising
FutureOrg. Values Contribution
Quality and Improvement are Priorities
Excited About Work
Opportunity for Growth
Safety is a Priority
Work-Life Balance
CSR Efforts Increase
Satisfaction
Australia
Brazil
Canada
China
Denmark
Finland
France
Germany
India
Italy
Japan
Mexico
The Netherlands
Russia
Spain
Sweden
Switzerland
United Kingdom
United States
DIRECT MATCH CONCEPTUAL MATCH NO MATCH
3

Technical WhitepaperIBM Software
4
From our own research we would add to this list the construct of work-life balance. In all of our global studies over the past five years (2007-2011), work-life balance has emerged as a top 10 driver of employee engagement. Based on our research, we believe this construct should be measured in future studies undertaken to document the antecedents of employee engagement (see appendix for more information).
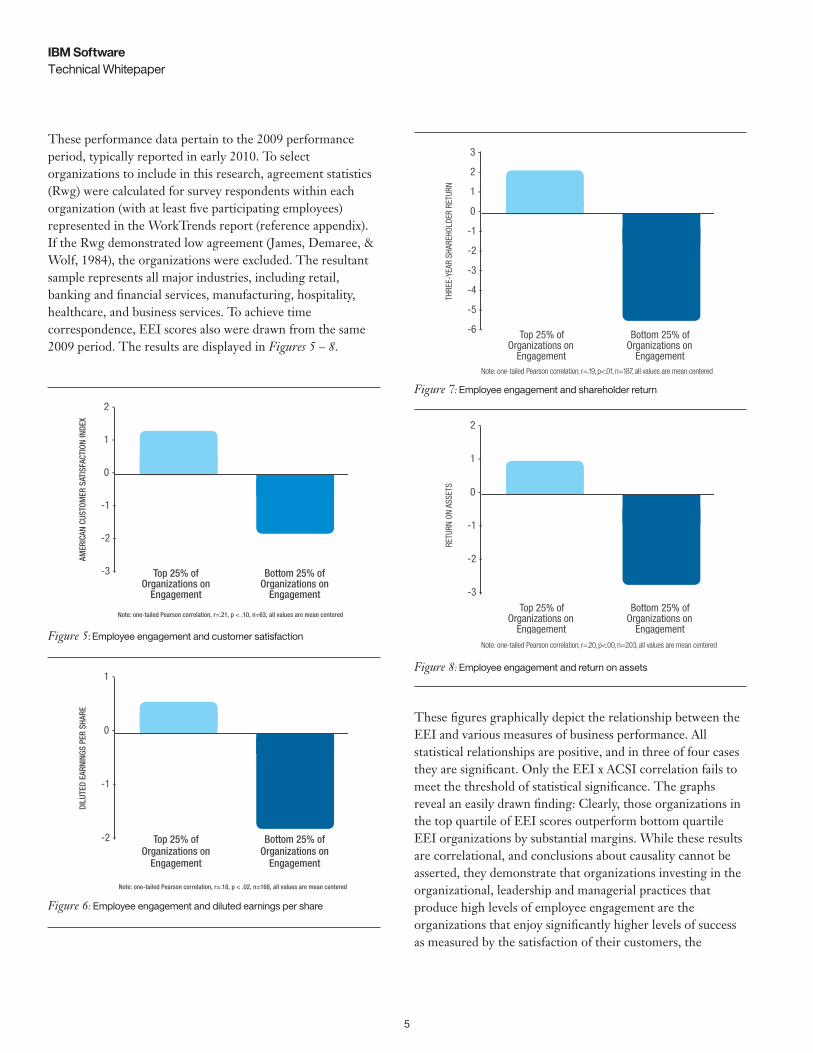
Employee engagement and business performanceTo validate that the employee engagement construct significantly relates to measures of business success, we correlated EEI scores with:
• American Customer Satisfaction Index (ACSI) scores for 63 companies
• Diluted Earnings Per Share (DEPS) for 168 companies• Return on Assets (ROA) for 203 companies• Three-year Total Shareholder Return (TSR) for 187
companies
By definition, the American Customer Satisfaction Index (ACSI) is an economic indicator based on customer evaluations of US and foreign-owned entities selling products in the United States. Companies use ACSI evaluations to improve and help maximize their customer relationships, and this, in turn, drives customer loyalty and profitability. Diluted earnings per share takes into account standard earnings per share (income divided by outstanding shares), but also accounts for what earnings would be if all outstanding stock options and warrants were exercised. It is seen by analysts as an accurate assessment of the health and profitability of an organization. Total shareholder return is a measure of the change in a company’s stock price plus dividends paid. Return on assets is net income divided by assets, and provides an indication of how efficiently management uses the organization’s assets to generate earnings.
The analysis reveals that the global drivers of employee engagement are an excellent predictor of the drivers of employee engagement for given countries. In fact, for 12 of the 19 countries included in this analysis, the global list of drivers matches at least nine or 10 of their drivers.
Special note: A “conceptual” match occurs when the country-level driver conceptually matches the same construct under consideration in the global driver. For example, the global driver of “excited about work” is a conceptual match to “liking the kind of work I do.”
For another six countries, the match between the global driver list and the country driver list is 80 percent. Only for Germany does the match drop to 70 percent. On average, the country-to-global driver match is 87.9 percent. In effect, the four macro drivers, or pillars, of engagement are universal.
Consistency with published researchThese findings are highly consistent with information reported in the academic literature. Figure 4 summarizes what others have identified as the antecedents or drivers of employee engagement. Based on this summary, it seems reasonable to conclude that employee engagement is based on senior leaders who build trust and confidence, direct line managers providing recognition and demonstrating respect, employee-perceived opportunities for growth and development and, finally, enthusiasm generated by the work itself. When organizations meet these conditions, employee engagement levels will be at their highest.
Summary concept References
Leaders who build trust
Tims, Bakker, & Xanthopoulou, 2011; Xu & Thomas, 2011
Managers who recognise and respect subordinate employees
Bakker & Bal, 2010; Bakker, Hakanen, Demerouti, & Xanthopoulou, 2007; Mauno & Kinnunen, 2007; Schaufeli, Bakker, & Rhenen, 2009; Schneider et al., 2009; Xanthopoulou, Bakker, Demerouti, & Schaufeli, 2009a
Growth and development opportunities
Bakker & Bal, 2010; Coetzer & Rothmann, 2007; Schaufeli et al., 2009
Work itself Bakker & Bal, 2010; Crawford, LePine, & Rich, 2010; Kühnel, J., Sonnentag, & Westman, 2009; Mauno & Kinnunen, 2007; May, Gilson, & Harter, 2004; Parker, Jimmieson, & Amiot, 2010; Richardsen & Burke 2006; Schaufeli & Bakker, 2004; Schaufeli et al., 2009; Xanthopoulou, Bakker, Demerouti, & Schaufeli, 2009b
Figure 4: Summary of employee engagement antecedents
Technical WhitepaperIBM Software
These figures graphically depict the relationship between the EEI and various measures of business performance. All statistical relationships are positive, and in three of four cases they are significant. Only the EEI x ACSI correlation fails to meet the threshold of statistical significance. The graphs reveal an easily drawn finding: Clearly, those organizations in the top quartile of EEI scores outperform bottom quartile EEI organizations by substantial margins. While these results are correlational, and conclusions about causality cannot be asserted, they demonstrate that organizations investing in the organizational, leadership and managerial practices that produce high levels of employee engagement are the organizations that enjoy significantly higher levels of success as measured by the satisfaction of their customers, the
These performance data pertain to the 2009 performance period, typically reported in early 2010. To select organizations to include in this research, agreement statistics (Rwg) were calculated for survey respondents within each organization (with at least five participating employees) represented in the WorkTrends report (reference appendix). If the Rwg demonstrated low agreement (James, Demaree, & Wolf, 1984), the organizations were excluded. The resultant sample represents all major industries, including retail, banking and financial services, manufacturing, hospitality, healthcare, and business services. To achieve time correspondence, EEI scores also were drawn from the same 2009 period. The results are displayed in Figures 5 – 8.
Figure 5: Employee engagement and customer satisfaction
Figure 7: Employee engagement and shareholder return
Figure 6: Employee engagement and diluted earnings per share
Figure 8: Employee engagement and return on assets
2 -
1 -
0 -
-1 -
-2 -
-3 - Top 25% of Organizations on
Engagement
Bottom 25% of Organizations on
Engagement
AMER
ICAN
CUS
TOM
ER S
ATIS
FACT
ION
INDE
X
Note: one-tailed Pearson correlation, r=.21, p < .10, n=63, all values are mean centered
3 -
2 -
1 -
0 -
-1 -
-2 -
-3 -
-4 -
-5 -
-6 - Top 25% of Organizations on
Engagement
Bottom 25% of Organizations on
Engagement
THRE
E-YE
AR S
HARE
HOLD
ER R
ETUR
N
Note: one-tailed Pearson correlation, r=.19, p < .01, n=187, all values are mean centered
1 -
0 -
-1 -
-2 - Top 25% of Organizations on
Engagement
Bottom 25% of Organizations on
Engagement
DILU
TED
EARN
INGS
PER
SHA
RE
Note: one-tailed Pearson correlation, r=.18, p < .02, n=168, all values are mean centered
2 -
1 -
0 -
-1 -
-2 -
-3 -
Top 25% of Organizations on
Engagement
Bottom 25% of Organizations on
Engagement
RETU
RN O
N AS
SETS
Note: one-tailed Pearson correlation, r=.20, p < .00, n=203, all values are mean centered
Note: one-tailed Pearson correlation, r=.19, p<.01, n=187, all values are mean centered
Note: one-tailed Pearson correlation, r=.20, p<.00, n=203, all values are mean centered
5
Technical WhitepaperIBM Software
earnings they deliver to shareholders (in both immediate and mid-term timeframes) and return on assets. No employee engagement linkage research study involving a sample of organizations this size has been previously published.
Performance excellenceFor the last decade, employee engagement has been “top of mind” among Human Resources professionals thinking about conducting employee opinion surveys. Our internal survey practitioners estimate 90 percent of our clients who conduct employee surveys refer to their surveys as employee engagement surveys (reference appendix). Even pre-dating the employee engagement survey wave, however, another wave of survey activity had begun in the 1980s that focused on linking employee opinions about their place of work with productivity, customer satisfaction and financial performance measures. This research started with the specific performance outcome researchers better wanted to understand (e.g., customer satisfaction); it then worked upstream to identify the elements of the working environment (as measured through an employee survey) most consistently associated with higher levels of that performance outcome. Multiple summaries of this research were produced (Wiley, 1996; Wiley & Brooks, 2000; Wiley & Campbell, 2006).
The fundamental perspective of this research can be characterized as follows: Employees are, for the most part, extremely well informed, and when asked about topics pertaining to the operational effectiveness of the organization, will supply observations that, if acted upon, will identify a path forward for organizational improvement. The research conducted from this perspective produced the performance excellence construct. Depending upon the segment of the marketplace in which a particular organization operates, the construct might alternatively be labeled as “service excellence,” “customer centricity,” “climate for service” or even “performance enablement.”
We define the construct as follows: “Performance excellence is the extent to which an organization is strongly committed to high levels of customer service and product quality and relies upon continuous improvement practices to achieve superior organizational results.” The definition makes obvious the fact that performance excellence is about product quality and customer service in the context of a continuous improvement work environment.
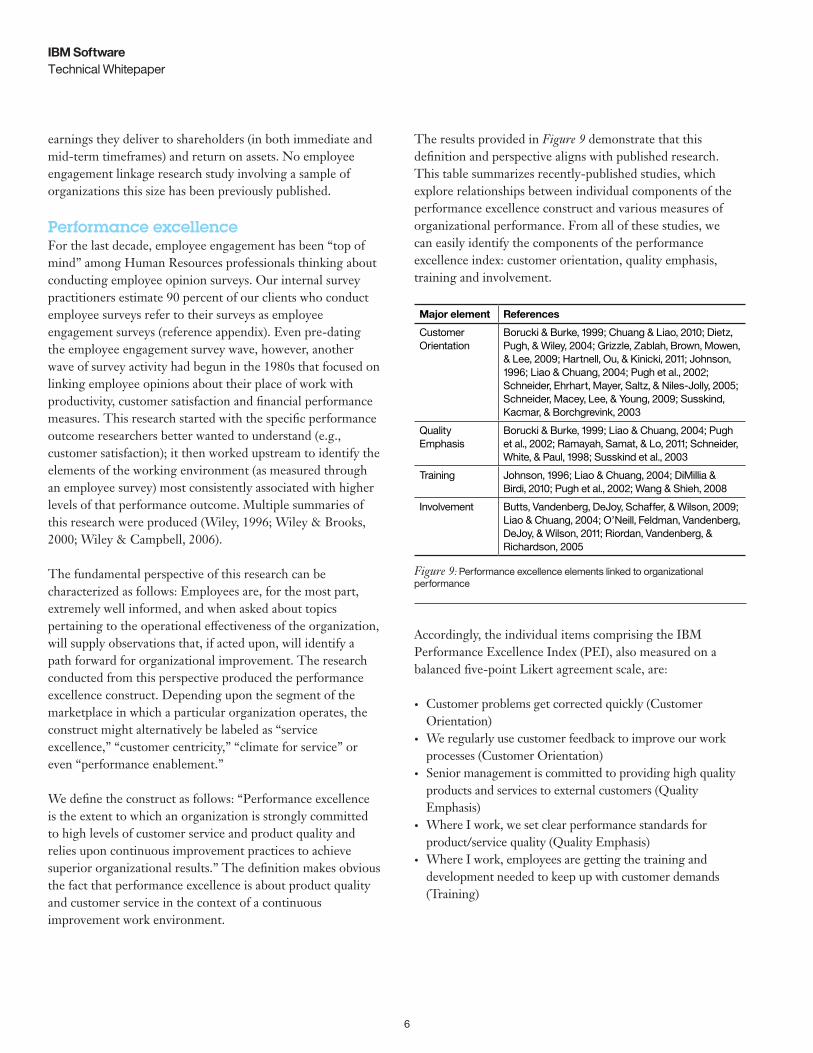
The results provided in Figure 9 demonstrate that this definition and perspective aligns with published research. This table summarizes recently-published studies, which explore relationships between individual components of the performance excellence construct and various measures of organizational performance. From all of these studies, we can easily identify the components of the performance excellence index: customer orientation, quality emphasis, training and involvement.
Major element References
Customer Orientation
Borucki & Burke, 1999; Chuang & Liao, 2010; Dietz, Pugh, & Wiley, 2004; Grizzle, Zablah, Brown, Mowen, & Lee, 2009; Hartnell, Ou, & Kinicki, 2011; Johnson, 1996; Liao & Chuang, 2004; Pugh et al., 2002; Schneider, Ehrhart, Mayer, Saltz, & Niles-Jolly, 2005; Schneider, Macey, Lee, & Young, 2009; Susskind, Kacmar, & Borchgrevink, 2003
Quality Emphasis
Borucki & Burke, 1999; Liao & Chuang, 2004; Pugh et al., 2002; Ramayah, Samat, & Lo, 2011; Schneider, White, & Paul, 1998; Susskind et al., 2003
Training Johnson, 1996; Liao & Chuang, 2004; DiMillia & Birdi, 2010; Pugh et al., 2002; Wang & Shieh, 2008
Involvement Butts, Vandenberg, DeJoy, Schaffer, & Wilson, 2009; Liao & Chuang, 2004; O’Neill, Feldman, Vandenberg, DeJoy, & Wilson, 2011; Riordan, Vandenberg, & Richardson, 2005
Figure 9: Performance excellence elements linked to organizational performance
Accordingly, the individual items comprising the IBM Performance Excellence Index (PEI), also measured on a balanced five-point Likert agreement scale, are:
• Customer problems get corrected quickly (Customer Orientation)
• We regularly use customer feedback to improve our work processes (Customer Orientation)
• Senior management is committed to providing high quality products and services to external customers (Quality Emphasis)
• Where I work, we set clear performance standards for product/service quality (Quality Emphasis)
• Where I work, employees are getting the training and development needed to keep up with customer demands (Training)
6
Technical WhitepaperIBM Software
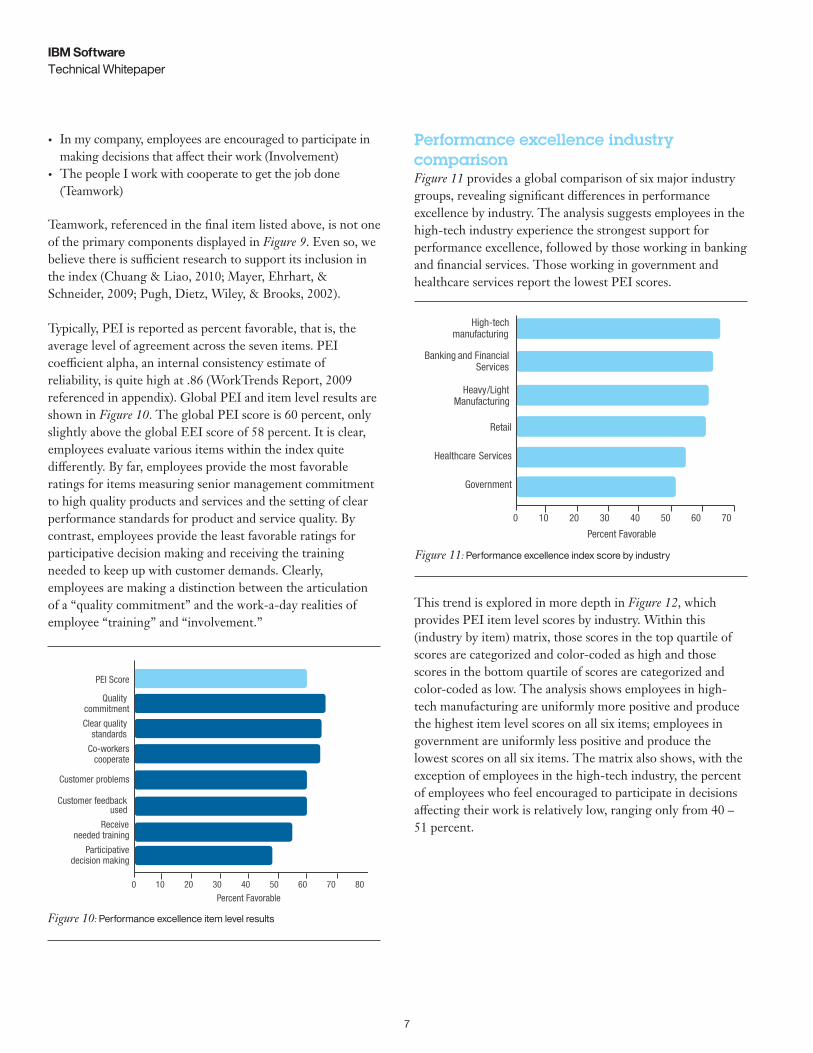
Performance excellence industry comparisonFigure 11 provides a global comparison of six major industry groups, revealing significant differences in performance excellence by industry. The analysis suggests employees in the high-tech industry experience the strongest support for performance excellence, followed by those working in banking and financial services. Those working in government and healthcare services report the lowest PEI scores.
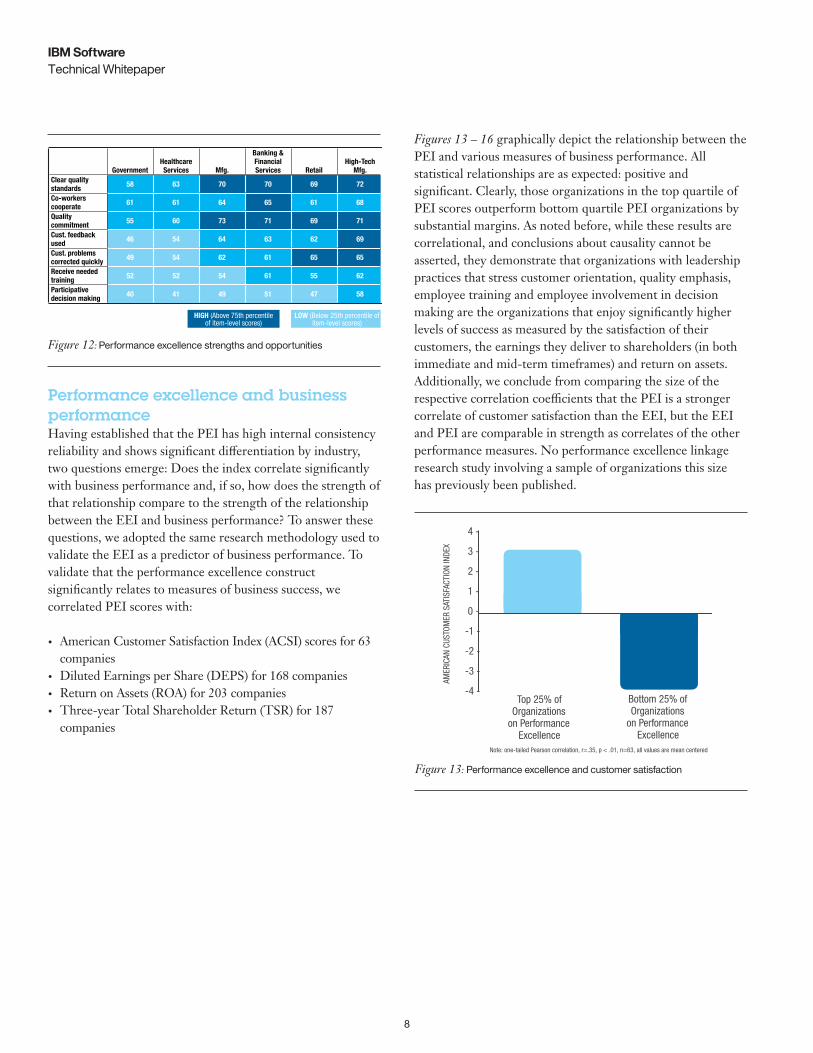
This trend is explored in more depth in Figure 12, which provides PEI item level scores by industry. Within this (industry by item) matrix, those scores in the top quartile of scores are categorized and color-coded as high and those scores in the bottom quartile of scores are categorized and color-coded as low. The analysis shows employees in high-tech manufacturing are uniformly more positive and produce the highest item level scores on all six items; employees in government are uniformly less positive and produce the lowest scores on all six items. The matrix also shows, with the exception of employees in the high-tech industry, the percent of employees who feel encouraged to participate in decisions affecting their work is relatively low, ranging only from 40 – 51 percent.
• In my company, employees are encouraged to participate in making decisions that affect their work (Involvement)
• The people I work with cooperate to get the job done (Teamwork)
Teamwork, referenced in the final item listed above, is not one of the primary components displayed in Figure 9. Even so, we believe there is sufficient research to support its inclusion in the index (Chuang & Liao, 2010; Mayer, Ehrhart, & Schneider, 2009; Pugh, Dietz, Wiley, & Brooks, 2002).
Typically, PEI is reported as percent favorable, that is, the average level of agreement across the seven items. PEI coefficient alpha, an internal consistency estimate of reliability, is quite high at .86 (WorkTrends Report, 2009 referenced in appendix). Global PEI and item level results are shown in Figure 10. The global PEI score is 60 percent, only slightly above the global EEI score of 58 percent. It is clear, employees evaluate various items within the index quite differently. By far, employees provide the most favorable ratings for items measuring senior management commitment to high quality products and services and the setting of clear performance standards for product and service quality. By contrast, employees provide the least favorable ratings for participative decision making and receiving the training needed to keep up with customer demands. Clearly, employees are making a distinction between the articulation of a “quality commitment” and the work-a-day realities of employee “training” and “involvement.”
Figure 10: Performance excellence item level results
Figure 11: Performance excellence index score by industry
0 10 20 30 40 50 60 70 80
PEI Score
Quality commitment
Clear quality standards
Co-workerscooperate
Customer problems
Customer feedback used
Receiveneeded training
Participativedecision making
Percent Favorable
0 10 20 30 40 50 60 70
High-tech manufacturing
Banking and Financial Services
Heavy/Light Manufacturing
Retail
Healthcare Services
Government
Percent Favorable
7
Technical WhitepaperIBM Software
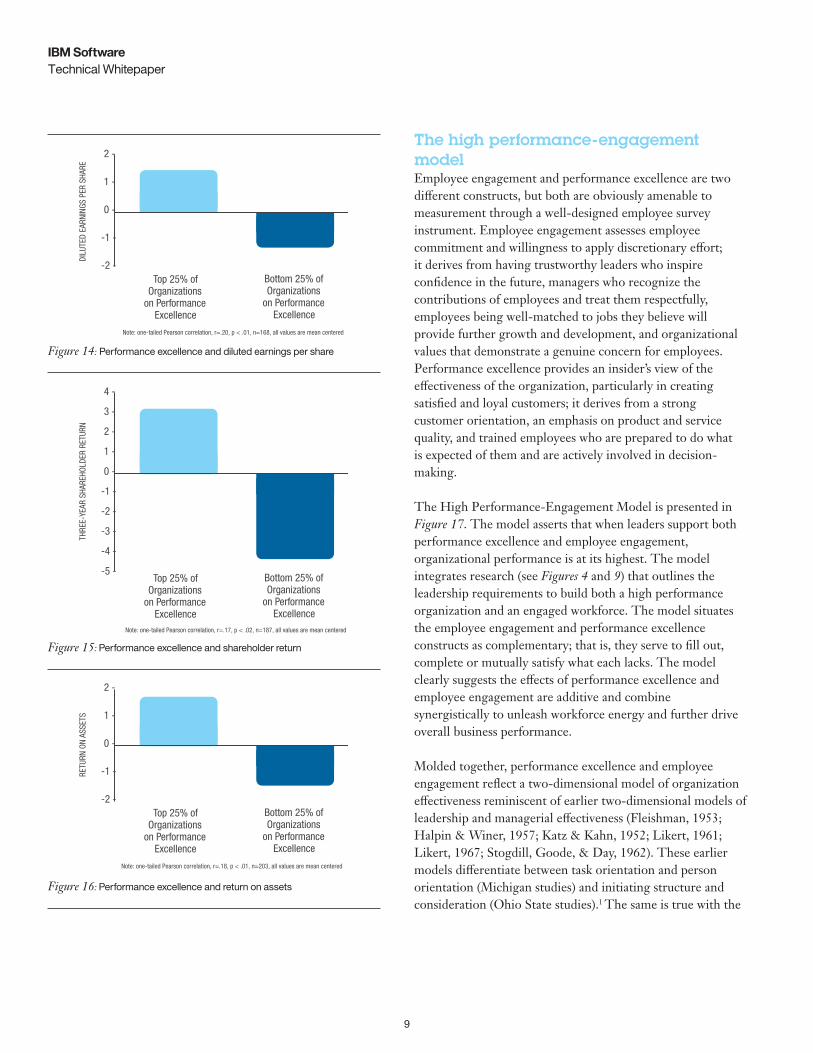
Figures 13 – 16 graphically depict the relationship between the PEI and various measures of business performance. All statistical relationships are as expected: positive and significant. Clearly, those organizations in the top quartile of PEI scores outperform bottom quartile PEI organizations by substantial margins. As noted before, while these results are correlational, and conclusions about causality cannot be asserted, they demonstrate that organizations with leadership practices that stress customer orientation, quality emphasis, employee training and employee involvement in decision making are the organizations that enjoy significantly higher levels of success as measured by the satisfaction of their customers, the earnings they deliver to shareholders (in both immediate and mid-term timeframes) and return on assets. Additionally, we conclude from comparing the size of the respective correlation coefficients that the PEI is a stronger correlate of customer satisfaction than the EEI, but the EEI and PEI are comparable in strength as correlates of the other performance measures. No performance excellence linkage research study involving a sample of organizations this size has previously been published.
Performance excellence and business performanceHaving established that the PEI has high internal consistency reliability and shows significant differentiation by industry, two questions emerge: Does the index correlate significantly with business performance and, if so, how does the strength of that relationship compare to the strength of the relationship between the EEI and business performance? To answer these questions, we adopted the same research methodology used to validate the EEI as a predictor of business performance. To validate that the performance excellence construct significantly relates to measures of business success, we correlated PEI scores with:
• American Customer Satisfaction Index (ACSI) scores for 63 companies
• Diluted Earnings per Share (DEPS) for 168 companies• Return on Assets (ROA) for 203 companies• Three-year Total Shareholder Return (TSR) for 187
companies
Figure 12: Performance excellence strengths and opportunities
GovernmentHealthcare Services Mfg.
Banking & Financial Services Retail
High-Tech Mfg.
Clear quality standards 58 63 70 70 69 72
Co-workers cooperate 61 61 64 65 61 68
Quality commitment 55 60 73 71 69 71
Cust. feedback used 46 54 64 63 62 69
Cust. problems corrected quickly 49 54 62 61 65 65
Receive needed training 52 52 54 61 55 62
Participative decision making 40 41 49 51 47 58
HIGH (Above 75th percentileof item-level scores)
LOW (Below 25th percentile of item-level scores)
Figure 13: Performance excellence and customer satisfaction
4 -
3 -
2 -
1 -
0 -
-1 -
-2 -
-3 -
-4 -Top 25% of
Organizations on Performance
Excellence
Bottom 25% of Organizations
on Performance Excellence
AMER
ICAN
CUS
TOM
ER S
ATIS
FACT
ION
INDE
X
Note: one-tailed Pearson correlation, r=.35, p < .01, n=63, all values are mean centered
8
Technical WhitepaperIBM Software
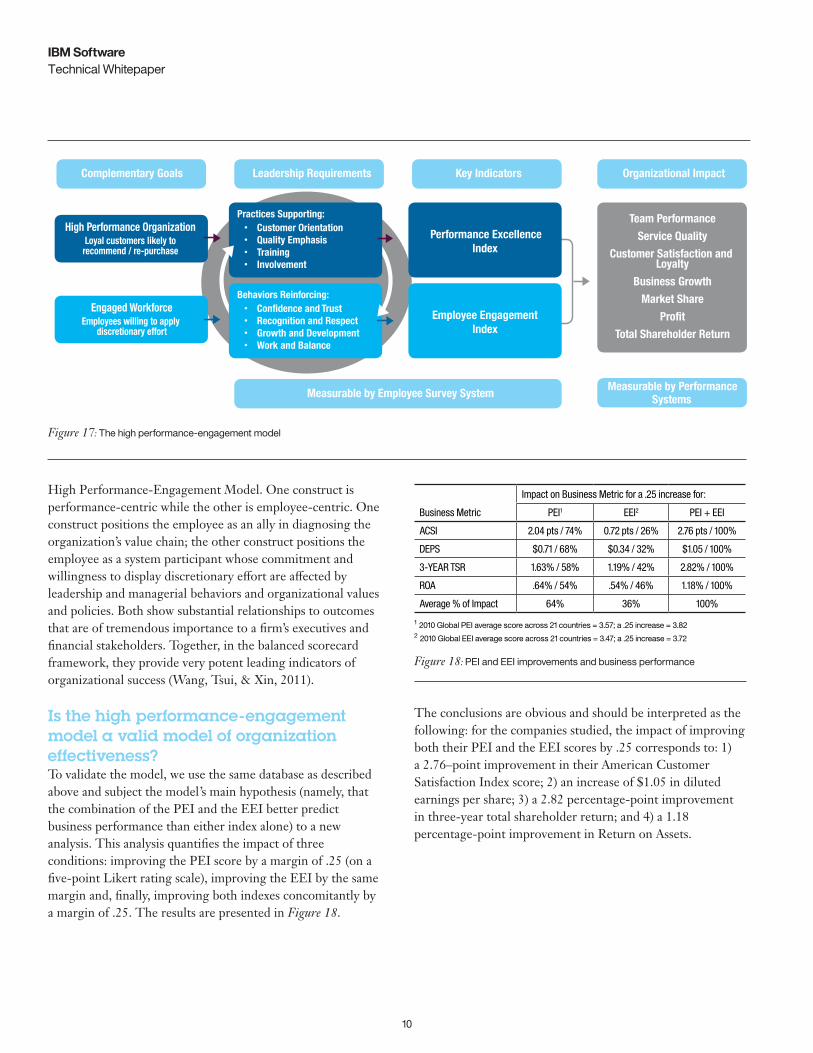
The high performance-engagement modelEmployee engagement and performance excellence are two different constructs, but both are obviously amenable to measurement through a well-designed employee survey instrument. Employee engagement assesses employee commitment and willingness to apply discretionary effort; it derives from having trustworthy leaders who inspire confidence in the future, managers who recognize the contributions of employees and treat them respectfully, employees being well-matched to jobs they believe will provide further growth and development, and organizational values that demonstrate a genuine concern for employees. Performance excellence provides an insider’s view of the effectiveness of the organization, particularly in creating satisfied and loyal customers; it derives from a strong customer orientation, an emphasis on product and service quality, and trained employees who are prepared to do what is expected of them and are actively involved in decision-making.
The High Performance-Engagement Model is presented in Figure 17. The model asserts that when leaders support both performance excellence and employee engagement, organizational performance is at its highest. The model integrates research (see Figures 4 and 9) that outlines the leadership requirements to build both a high performance organization and an engaged workforce. The model situates the employee engagement and performance excellence constructs as complementary; that is, they serve to fill out, complete or mutually satisfy what each lacks. The model clearly suggests the effects of performance excellence and employee engagement are additive and combine synergistically to unleash workforce energy and further drive overall business performance.
Molded together, performance excellence and employee engagement reflect a two-dimensional model of organization effectiveness reminiscent of earlier two-dimensional models of leadership and managerial effectiveness (Fleishman, 1953; Halpin & Winer, 1957; Katz & Kahn, 1952; Likert, 1961; Likert, 1967; Stogdill, Goode, & Day, 1962). These earlier models differentiate between task orientation and person orientation (Michigan studies) and initiating structure and consideration (Ohio State studies).1 The same is true with the
Figure 14: Performance excellence and diluted earnings per share
Figure 15: Performance excellence and shareholder return
Figure 16: Performance excellence and return on assets
2 -
1 -
0 -
-1 -
-2 -Top 25% of
Organizations on Performance
Excellence
Bottom 25% of Organizations
on Performance Excellence
DILU
TED
EARN
INGS
PER
SHA
RE
Note: one-tailed Pearson correlation, r=.20, p < .01, n=168, all values are mean centered
4 -
3 -
2 -
1 -
0 -
-1 -
-2 -
-3 -
-4 -
-5 -Top 25% of
Organizations on Performance
Excellence
Bottom 25% of Organizations
on Performance Excellence
THRE
E-YE
AR S
HARE
HOLD
ER R
ETUR
N
Note: one-tailed Pearson correlation, r=.17, p < .02, n=187, all values are mean centered
2 -
1 -
0 -
-1 -
-2 -Top 25% of
Organizations on Performance
Excellence
Bottom 25% of Organizations
on Performance Excellence
RETU
RN O
N AS
SETS
Note: one-tailed Pearson correlation, r=.18, p < .01, n=203, all values are mean centered
9
Technical WhitepaperIBM Software
Business Metric
Impact on Business Metric for a .25 increase for:
PEI1 EEI2 PEI + EEI
ACSI 2.04 pts / 74% 0.72 pts / 26% 2.76 pts / 100%
DEPS $0.71 / 68% $0.34 / 32% $1.05 / 100%
3-YEAR TSR 1.63% / 58% 1.19% / 42% 2.82% / 100%
ROA .64% / 54% .54% / 46% 1.18% / 100%
Average % of Impact 64% 36% 100%
1 2010 Global PEI average score across 21 countries = 3.57; a .25 increase = 3.822 2010 Global EEI average score across 21 countries = 3.47; a .25 increase = 3.72
Figure 18: PEI and EEI improvements and business performance
The conclusions are obvious and should be interpreted as the following: for the companies studied, the impact of improving both their PEI and the EEI scores by .25 corresponds to: 1) a 2.76–point improvement in their American Customer Satisfaction Index score; 2) an increase of $1.05 in diluted earnings per share; 3) a 2.82 percentage-point improvement in three-year total shareholder return; and 4) a 1.18 percentage-point improvement in Return on Assets.
High Performance-Engagement Model. One construct is performance-centric while the other is employee-centric. One construct positions the employee as an ally in diagnosing the organization’s value chain; the other construct positions the employee as a system participant whose commitment and willingness to display discretionary effort are affected by leadership and managerial behaviors and organizational values and policies. Both show substantial relationships to outcomes that are of tremendous importance to a firm’s executives and financial stakeholders. Together, in the balanced scorecard framework, they provide very potent leading indicators of organizational success (Wang, Tsui, & Xin, 2011).
Is the high performance-engagement model a valid model of organization effectiveness? To validate the model, we use the same database as described above and subject the model’s main hypothesis (namely, that the combination of the PEI and the EEI better predict business performance than either index alone) to a new analysis. This analysis quantifies the impact of three conditions: improving the PEI score by a margin of .25 (on a five-point Likert rating scale), improving the EEI by the same margin and, finally, improving both indexes concomitantly by a margin of .25. The results are presented in Figure 18.
Practices Supporting:• Customer Orientation• Quality Emphasis• Training• Involvement
Performance Excellence Index
High Performance Organization Loyal customers likely to recommend / re-purchase
Engaged Workforce Employees willing to apply
discretionary effort
Behaviors Reinforcing:• Confidence and Trust• Recognition and Respect• Growth and Development• Work and Balance
Employee Engagement Index
Complementary Goals Leadership Requirements Key Indicators Organizational Impact
Team Performance
Service Quality
Customer Satisfaction and Loyalty
Business Growth
Market Share
Profit
Total Shareholder Return
Measurable by Employee Survey SystemMeasurable by Performance
Systems
Figure 17: The high performance-engagement model
10
Technical WhitepaperIBM Software
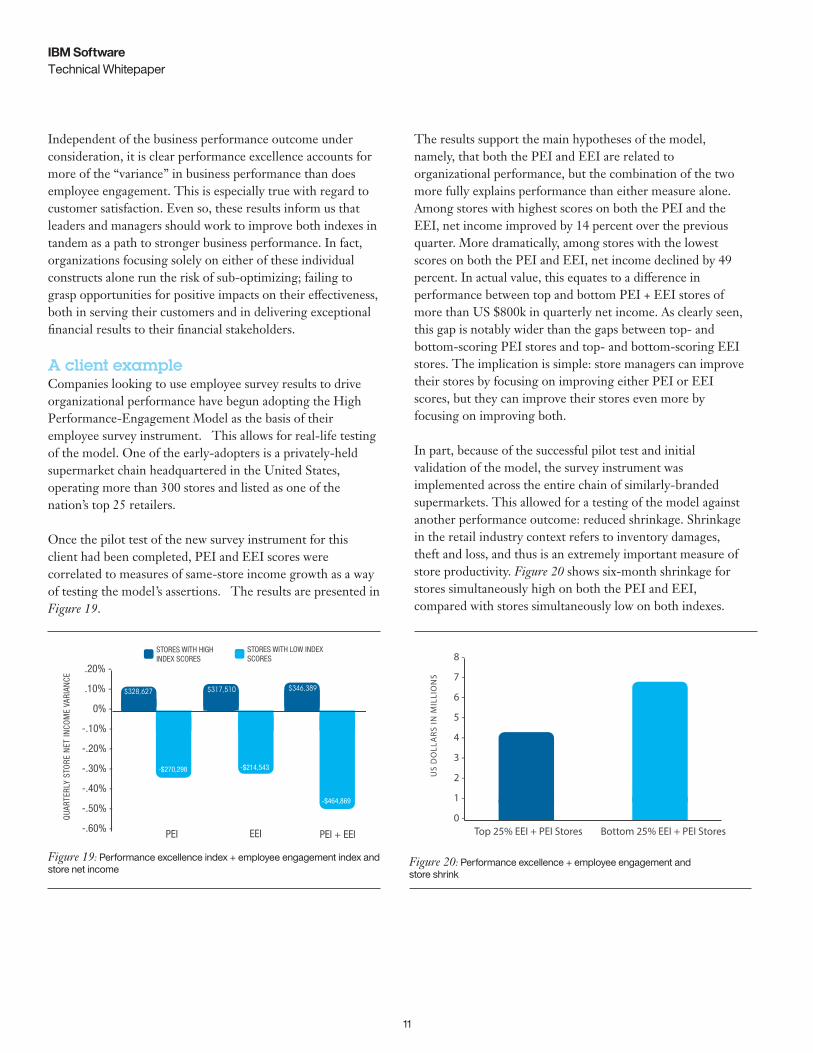
The results support the main hypotheses of the model, namely, that both the PEI and EEI are related to organizational performance, but the combination of the two more fully explains performance than either measure alone. Among stores with highest scores on both the PEI and the EEI, net income improved by 14 percent over the previous quarter. More dramatically, among stores with the lowest scores on both the PEI and EEI, net income declined by 49 percent. In actual value, this equates to a difference in performance between top and bottom PEI + EEI stores of more than US $800k in quarterly net income. As clearly seen, this gap is notably wider than the gaps between top- and bottom-scoring PEI stores and top- and bottom-scoring EEI stores. The implication is simple: store managers can improve their stores by focusing on improving either PEI or EEI scores, but they can improve their stores even more by focusing on improving both.
In part, because of the successful pilot test and initial validation of the model, the survey instrument was implemented across the entire chain of similarly-branded supermarkets. This allowed for a testing of the model against another performance outcome: reduced shrinkage. Shrinkage in the retail industry context refers to inventory damages, theft and loss, and thus is an extremely important measure of store productivity. Figure 20 shows six-month shrinkage for stores simultaneously high on both the PEI and EEI, compared with stores simultaneously low on both indexes.
Independent of the business performance outcome under consideration, it is clear performance excellence accounts for more of the “variance” in business performance than does employee engagement. This is especially true with regard to customer satisfaction. Even so, these results inform us that leaders and managers should work to improve both indexes in tandem as a path to stronger business performance. In fact, organizations focusing solely on either of these individual constructs alone run the risk of sub-optimizing; failing to grasp opportunities for positive impacts on their effectiveness, both in serving their customers and in delivering exceptional financial results to their financial stakeholders.
A client exampleCompanies looking to use employee survey results to drive organizational performance have begun adopting the High Performance-Engagement Model as the basis of their employee survey instrument. This allows for real-life testing of the model. One of the early-adopters is a privately-held supermarket chain headquartered in the United States, operating more than 300 stores and listed as one of the nation’s top 25 retailers.
Once the pilot test of the new survey instrument for this client had been completed, PEI and EEI scores were correlated to measures of same-store income growth as a way of testing the model’s assertions. The results are presented in Figure 19.
Figure 19: Performance excellence index + employee engagement index and store net income
.20% -
.10% -
0% -
-.10% -
-.20% -
-.30% -
-.40% -
-.50% -
-.60% - PEI EEI
QUA
RTER
LY S
TORE
NET
INCO
ME
VARI
ANCE
PEI + EEI
STORES WITH HIGH INDEX SCORES
STORES WITH LOW INDEX SCORES
$328,627 $317,510 $346,389
-$270,298 -$214,543
-$464,869
8 -
7 -
6 -
5 -
4 -
3 -
2 -
1 -
0 -Top 25% EEI + PEI Stores Bottom 25% EEI + PEI Stores
US
DO
LLA
RS IN
MIL
LIO
NS
Figure 20: Performance excellence + employee engagement and store shrink
11
Technical WhitepaperIBM Software
population in terms of industry mix, job type, gender, age and other key organizational and demographic variables. In most countries, survey takers must be adults who work full-time for an organization of 100 employees or more; this threshold drops to 25 employees or more in countries with smaller economies or hard-to-reach populations. The survey has over 200 items that cover a wide range of workplace issues, including senior leader and direct manager effectiveness, recognition, growth and development, employee engagement, customer orientation, quality emphasis, innovation, corporate social responsibility, workplace safety, work stress and performance confidence. In 2012, over 33,000 employees were surveyed, representing 28 countries.
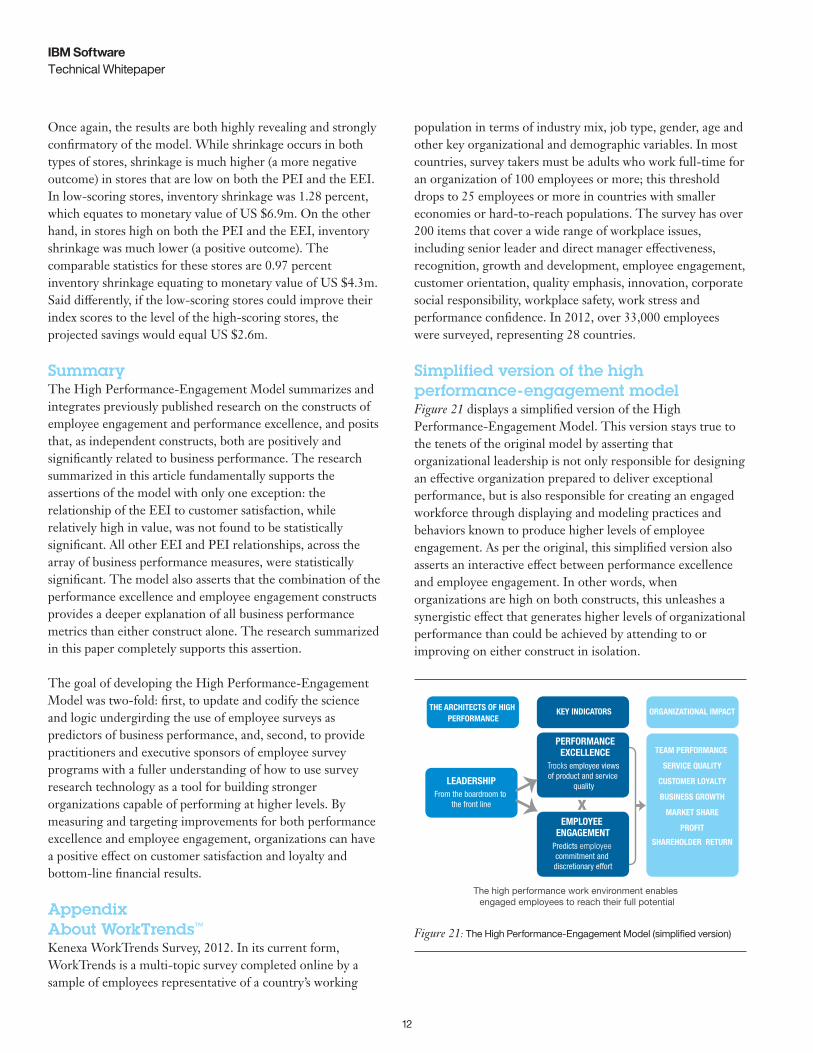
Simplified version of the high performance-engagement modelFigure 21 displays a simplified version of the High Performance-Engagement Model. This version stays true to the tenets of the original model by asserting that organizational leadership is not only responsible for designing an effective organization prepared to deliver exceptional performance, but is also responsible for creating an engaged workforce through displaying and modeling practices and behaviors known to produce higher levels of employee engagement. As per the original, this simplified version also asserts an interactive effect between performance excellence and employee engagement. In other words, when organizations are high on both constructs, this unleashes a synergistic effect that generates higher levels of organizational performance than could be achieved by attending to or improving on either construct in isolation.
Once again, the results are both highly revealing and strongly confirmatory of the model. While shrinkage occurs in both types of stores, shrinkage is much higher (a more negative outcome) in stores that are low on both the PEI and the EEI. In low-scoring stores, inventory shrinkage was 1.28 percent, which equates to monetary value of US $6.9m. On the other hand, in stores high on both the PEI and the EEI, inventory shrinkage was much lower (a positive outcome). The comparable statistics for these stores are 0.97 percent inventory shrinkage equating to monetary value of US $4.3m. Said differently, if the low-scoring stores could improve their index scores to the level of the high-scoring stores, the projected savings would equal US $2.6m.
SummaryThe High Performance-Engagement Model summarizes and integrates previously published research on the constructs of employee engagement and performance excellence, and posits that, as independent constructs, both are positively and significantly related to business performance. The research summarized in this article fundamentally supports the assertions of the model with only one exception: the relationship of the EEI to customer satisfaction, while relatively high in value, was not found to be statistically significant. All other EEI and PEI relationships, across the array of business performance measures, were statistically significant. The model also asserts that the combination of the performance excellence and employee engagement constructs provides a deeper explanation of all business performance metrics than either construct alone. The research summarized in this paper completely supports this assertion.
The goal of developing the High Performance-Engagement Model was two-fold: first, to update and codify the science and logic undergirding the use of employee surveys as predictors of business performance, and, second, to provide practitioners and executive sponsors of employee survey programs with a fuller understanding of how to use survey research technology as a tool for building stronger organizations capable of performing at higher levels. By measuring and targeting improvements for both performance excellence and employee engagement, organizations can have a positive effect on customer satisfaction and loyalty and bottom-line financial results.
Appendix About WorkTrends™
Kenexa WorkTrends Survey, 2012. In its current form, WorkTrends is a multi-topic survey completed online by a sample of employees representative of a country’s working
LEADERSHIPFrom the boardroom to
the front line
PERFORMANCE EXCELLENCE
Tracks employee views of product and service
quality
EMPLOYEE ENGAGEMENT
Predicts employee commitment and discretionary effort
TEAM PERFORMANCE
SERVICE QUALITY
CUSTOMER LOYALTY
BUSINESS GROWTH
MARKET SHARE
PROFIT
SHAREHOLDER RETURN
THE ARCHITECTS OF HIGH PERFORMANCE
KEY INDICATORS ORGANIZATIONAL IMPACT
The high performance work environment enables engaged employees to reach their full potential
x
Figure 21: The High Performance-Engagement Model (simplified version)
12
Technical WhitepaperIBM Software
Grizzle, J. W., Zablah, A. R., Brown, T. J., Mowen, J. C., & Lee, J. M. (2009). Employee customer orientation in context: How the environment moderates the influence of customer orientation on performance outcomes. Journal of Applied Psychology, 94, 1227-1242. http://www.ncbi.nlm.nih.gov/pubmed/19702367
Halpin, A. W., & Winer, B. J. (1957). A factorial study of the leader behavior descriptions. In R.M. Stogdill and A.E. Coons (Eds.), Leader behavior: Its description and measurement. Columbus, OH: Bureau of Business Research, Ohio State University. http://changingminds.org/disciplines/leadership/actions/ohio_state.htm
Harter, J. K., Schmidt, F. L., & Hayes, T. L. (2002). Business-unit-level relationship between employee satisfaction, employee engagement, and business outcomes: A meta-analysis. Journal of Applied Psychology, 87, 268-279. http://www.apaexcellence.org/resources/research/detail/1048
Hartnell, C. A., Ou, A. Y., & Kinicki, A. (2011). Organizational culture and organizational effectiveness: A meta-analytic investigation of the competing values framework’s theoretical suppositions. Journal of Applied Psychology, 96, 677-694. http://psycnet.apa.org/journals/apl/96/4/677/
James, L. R., Demaree, R. G., & Wolf, G. (1984). Estimating within-group interrater reliability with and without response bias. Journal of Applied Psychology, 69, 85-98. http://psycnet.apa.org/index.cfm?fa=search.displayRecord&uid=1984-11275-001
Johnson, J. W. (1996). Linking employee perceptions of service climate to customer satisfaction. Personnel Psychology, 49, 831-851. http://onlinelibrary.wiley.com/doi/10.1111/j.1744-6570.1996.tb02451.x/abstract
Johnson, J. W. (2000). A heuristic method for estimating the relative weight of predictor variables in multiple regression. Multivariate Behavioral Research, 35, 1-19. http://www.tandfonline.com/doi/abs/10.1207/S15327906MBR3501_1
Katz, D., & Kahn, R. L. (1952). Some recent findings in human relations research. In E. Swanson, T. Newcombe & E. Hartley (Eds.), Readings in social psychology. New York: Holt, Reinhart and Winston.
Kraut, A. I. (2006). Moving the needle: Getting action after a survey. In A. Kraut (Ed.), Getting action from organizational surveys: New concepts, technologies and applications. San Francisco: Jossey-Bass.
Kühnel, J., Sonnentag, S., & Westman, M. (2009). Does work engagement increase after a short respite? The role of job involvement as a double-edged sword. Journal of Occupational and Organizational Psychology, 82, 575-594. http://onlinelibrary.wiley.com/doi/10.1348/096317908X349362/abstract?deniedAccessCustomisedMessage=&userIsAuthenticated=false
References Bakker, A. B., & Bal, M. P. (2010). Weekly work engagement and performance: A study among starting teachers. Journal of Occupational and Organizational Psychology, 83, 189-206. http://onlinelibrary.wiley.com/doi/10.1348/096317909X402596/abstract
Bakker, A. B., Hakanen, J. J., Demerouti, E., & Xanthopoulou, D. (2007). Job resources boost work engagement, particularly when job demands are high. Journal of Educational Psychology, 99, 274-284. http://psycnet.apa.org/?fa=main.doiLanding&doi=10.1037/0022-0663.99.2.274
Borucki, C. C., & Burke, M. J. (1999). An examination of service-related antecedents to retail store performance. Journal of Organizational Behavior, 20, 943-962. http://onlinelibrary.wiley.com/doi/10.1002/(SICI)1099-1379(199911)20:6%3C943::AID-JOB976%3E3.0.CO;2-9/abstract
Butts, M. M., Vandenberg, R. J., DeJoy, D. M., Schaffer, B. S., & Wilson, M. G. (2009). Individual reactions to high involvement work processes: Investigating the role of empowerment and perceived organizational support. Journal of Occupational Health Psychology, 14, 122-136. http://www.ncbi.nlm.nih.gov/pubmed/19331475
Chuang, C., & Liao, H. (2010). Strategic human resource management in service context: Taking care of business by taking care of employees and customers. Personnel Psychology, 63, 153-196. http://onlinelibrary.wiley.com/doi/10.1111/j. 1744-6570.2009.01165.x/abstract
Coetzer, C. F., & Rothmann, S. (2007). Job demands, job resources and work engagement of employees in a manufacturing organization. Southern African Business Review, 11, 17-32. http://www.unisa.ac.za/contents/faculties/service_dept/docs/Sabvie11-3-07.pdf
Crawford, E. R., LePine, J. A., & Rich, B. L. (2010). Linking job demands and resources to employee engagement and burnout: A theoretical extension and meta-analytic test. Journal of Applied Psychology, 95, 834-848. http://psycnet.apa.org/journals/apl/95/5/834/
Dietz, J., Pugh, S. D., & Wiley, J. W. (2004). Service climate effects on customer attitudes: An examination of boundary conditions. Academy of Management Journal, 47, 81-92. http://amj.aom.org/content/47/1/81.short
Driving Success Through Performance Excellence and Employee Engagement A 2009 Kenexa® Research Institute WorkTrends™ Report. (2009). Minneapolis, MN: Kenexa. http://www.kenexa.com/getattachment/adb7d198-b3f1-4a75-9b09-d508469e42cc/Beyond-Engagement.aspx
Fleishman, E. A. (1953). The description of supervisory behavior. Personnel Psychology, 37, 1-6. http://psycnet.apa.org/journals/apl/37/1/1/
13
Technical WhitepaperIBM Software
Liao, H., & Chuang, A. (2004). A multilevel investigation of factors influencing employee service performance and customer outcomes. Academy of Management Journal, 47, 41-58. http://amj.aom.org/content/47/1/41.short
Likert, R. (1961). New patterns of management. New York: McGraw-Hill.
Likert, R. (1967). The human organization: Its management and value. New York: McGraw-Hill.
Macey, W. H., & Schneider, B. (2008). The meaning of employee engagement. Industrial and Organizational Psychology, 1, 3-30. http://onlinelibrary.wiley.com/doi/10.1111/j.1754-9434. 2007. 0002.x/abstract?deniedAccessCustomisedMessage=&userIsAuthenticated=false
Mauno, S., & Kinnunen, U. (2007). Job demands and resources as antecedents of work engagement: A longitudinal study. Journal of Vocational Behavior, 70, 149-171. http://www.sciencedirect.com/science/article/pii/S0001879106000935
May, D. R., Gilson, R. L., & Harter, L. M. (2004). The psychological conditions of meaningfulness, safety and availability and the engagement of the human spirit at work. Journal of Occupational and Organizational Psychology, 77, 11-37. http://onlinelibrary.wiley.com/doi/10.1348/096317904322915892/abstract
Mayer, D. M., Ehrhart, M.G., & Schneider, B. (2009). Service attribute boundary conditions of the service climate-customer satisfaction link. Academy of Management Journal, 53, 1034-1050. http://amj.aom.org/content/52/5/1034.short
DiMilia, L. D., & Birdi, K. (2010). The relationship between multiple levels of learning practices and objective and subjective organizational financial performance. Journal of Organizational Behavior, 31, 481–498. http://onlinelibrary.wiley.com/doi/10.1002/job.623/abstract?deniedAccessCustomisedMessage=&userIsAuthenticated=false
O’Neill, O. A., Feldman, D. C., Vandenberg, R. J., DeJoy, D. M., & Wilson, M. G. (2011). Organizational achievement values, high-involvement work practices, and business unit performance. Human Resource Management, 50, 541-558. http://onlinelibrary.wiley.com/doi/10.1002/hrm.20437/abstract
Parker, S. L., Jimmieson, N. L., & Amiot, C. E. (2010). Self-determination as a moderator of demands and control: Implications for employee strain and engagement. Journal of Vocational Behavior, 76, 52-67. http://www.sciencedirect.com/science/article/pii/S0001879109000864
Pugh, S. D., Dietz, J., Wiley, J. W., & Brooks, S. M. (2002). Driving service effectiveness through employee-customer linkages. Academy of Management Executive, 16(4), 73-84. http://emeraldinsight.com/bibliographic_databases.htm?id=1439142&PHPSESSID=mlh9jl9bfnd21m2kj6edlbri05
Ramayah, T., Samat, N., & Lo, M. (2011). Market orientation, service quality and organizational performance in service organizations in Malaysia. Asia-Pacific Journal of Business Administration, 3(1), 8-27. http://www.emeraldinsight.com/journals.htm/journals.htm?issn=1757-4323&volume=3&issue=1&articleid=1922001&show=pdf
Richardsen, A. M, & Burke, R. J. (2006). Work and health outcomes among police officers: The mediating role of police cynicism and engagement. International Journal of Stress Management, 13, 555-574. http://psycnet.apa.org/journals/str/13/4/555/
Robinson, D. (2007, May 3). Staff engagement is marriage of various factors at work. Employee Benefits, 37. http://www.employeebenefits.co.uk/resource-centre/trends-and-issues/staff-engagement-is-marriage-of-various-factors-at-work/2304.article
Riordan, C. M., Vandenberg, R. J., Richardson, H. A. (2005). Employee involvement climate and organizational effectiveness. Human Resource Management, 44, 471-488. http://onlinelibrary.wiley.com/doi/10.1002/hrm.20085/abstract
Schaufeli, W. B., & Bakker, A. B. (2004). Job demands, job resources, and their relationship with burnout and engagement: A multi-sample study. Journal of Vocational Behavior, 25, 293-315. http://www.beanmanaged.com/doc/pdf/arnoldbakker/articles/articles_arnold_bakker_101.pdf
Schaufeli, W. B., Bakker, A. B., & Rhenen, W. V. (2009). How changes in job demands and resources predict burnout, work engagement, and sickness absenteeism. Journal of Organizational Behaviour, 30, 893-917. http://www.beanmanaged.com/doc/pdf/arnoldbakker/articles/articles_arnold_bakker_189.pdf
Schneider, B., Ehrhart, M. G., Mayer, D. M., Saltz, J. L., & Niles-Jolly, K. (2005). Understanding organization-customer links in service settings. Academy of Management Journal, 48, 1017-1032. http://www.emeraldinsight.com/bibliographic_databases.htm?id=1548415
Schneider, B., Macey, W. H., Barbera, K. M., & Martin, N. (2009). Driving customer satisfaction and financial success through employee engagement. People & Strategy, 32, 22-27. http://www.emeraldinsight.com/bibliographic_databases.htm?id=17079444
Schneider, B., Macey, W. H., Lee, W. C., & Young, S. A. (2009). Organizational service climate drivers of the American Customer Satisfaction Index (ACSI) and financial and market performance. Journal of Service Research, 12, 3-14. http://jsr.sagepub.com/content/12/1/3.abstract?ijkey=43830905b97409f61c4a4e229d5ce17f8cc916d7&keytype2=tf_ipsecsha
Schneider, B., White, S. S., & Paul, M. C. (1998). Linking service climate and customer perceptions of service quality: Test of a causal model. Journal of Applied Psychology, 83, 150-163. http://mres.gmu.edu/pmwiki/uploads/Main/Schneider1998.pdf
14
Technical WhitepaperIBM Software
Wiley, J. W. (2010). Strategic employee surveys: Evidence-based guidelines for driving organizational success. San Francisco: Jossey-Bass.
Wiley, J. W., & Brooks, S.M. (2000). The high-performance organizational climate: How workers describe top-performing units. In N. S. Ashkanasy, C. Wilderom, & M. F. Peterson (Eds.), The handbook of organizational culture and climate. Thousand Oaks, Calif: Sage. http://espace.library.uq.edu.au/view/UQ:224765
Wiley, J. W., & Campbell, B. H. (2006). Using linkage research to drive high performance. In A. I. Kraut (Ed.), Getting action from organizational surveys: New concepts, technologies and applications. San Francisco: Jossey-Bass.
Xanthopoulou, D., Bakker, A. B., Demerouti, E., & Schaufeli, W. B. (2009a). Work engagement and financial returns: A diary study on the role of job and personal resources. Journal of Occupational and Organizational Psychology, 82, 183-200. http://onlinelibrary.wiley.com/doi/10.1348/096317908X285633/abstract
Xanthopoulou, D., Bakker, A. B., Demerouti, E., & Schaufeli, W. B. (2009b). Reciprocal relationships between job resources, personal resources, and work engagement. Journal of Vocational Behaviour, 74, 235-244. http://www.academia.edu/861166/Reciprocal_relationships_between_job_resources_personal_resources_and_work_engagement
Xu, J., & Thomas, H. C. (2011). How can leaders achieve high employee engagement?. Leadership & Organization Development Journal, 32, 399-416. https://researchspace.auckland.ac.nz/handle/2292/10614
For more information To learn how to build a smarter workforce, visit: ibm.com/smarterworkforce
Stogdill, R. M., Goode, O. S., & Day, D. R. (1962). New leader behavior description subscales. Journal of Psychology, 54, 259-269. http://www.tandfonline.com/doi/abs/10.1080/00223980.1962.9713117?journalCode=vjrl20
Susskind, A. M., Kacmar, K. M., & Borchgrevink, C. P. (2003). Customer service providers’ attitudes relating to customer service and customer satisfaction in the customer-server exchange. Journal of Applied Psychology, 88, 179-187. http://psycnet.apa.org/?&fa=main.doiLanding&doi=10.1037/0021-9010.88.1.179
Tims, M., Bakker, A. B., & Xanthopoulou, D. (2011). Do transformational leaders enhance their followers’ daily work engagement? The Leadership Quarterly, 22, 121-131. http://www.sciencedirect.com/science/article/pii/S1048984310001918
Vance, R. J. (2006). Employee engagement and commitment: A guide to understanding, measuring and increasing engagement in your organization. Alexandria, VA: SHRM Foundation. http://www.vancerenz.com/researchimplementation/uploads/1006EmployeeEngagementOnlineReport.pdf
Wang, I., & Shieh, C. J. (2008). Effect of human capital investment on organizational performance. Social Behavior and Personality, 36, 1011-1022. http://www.ingentaconnect.com/content/sbp/sbp/2008/00000036/00000008/art00002
Wang, H., Tsui, A. S., & Xin, K. R. (2011). CEO leadership behaviors, organizational performance, and employees’ attitudes. The Leadership Quarterly, 22, 92-105. http://www.sciencedirect.com/science/article/pii/S104898431000189X
Wiley, J. W. (1996). Linking survey results to customer satisfaction and business performance. In A. I. Kraut (Ed.), Organizational surveys: Tools for assessment and change. San Francisco: Jossey-Bass. http://www.getcited.org/pub/100110673
15

LOW14043-USEN-03
Please Recycle
© Copyright IBM Corporation 2014
IBM Corporation Software Group Route 100 Somers, NY 10589
Produced in the United States of America February 2014
IBM, the IBM logo and ibm.com are trademarks of International Business Machines Corporation in the United States, other countries or both. If these and other IBM trademarked terms are marked on their first occurrence in this information with a trademark symbol (® or TM), these symbols indicate U.S. registered or common law trademarks owned by IBM at the time this information was published. Such trademarks may also be registered or common law trademarks in other countries. Other product, company or service names may be trademarks or service marks of others. A current list of IBM trademarks is available at “Copyright and trademark information” at: ibm.com/legal/copytrade.shtml
The content in this document (including currency OR pricing references which exclude applicable taxes) is current as of the initial date of publication and may be changed by IBM at any time. Not all offerings are available in every country in which IBM operates.
The performance data discussed herein is presented as derived under specific operating conditions. Actual results may vary. THE INFORMATION IN THIS DOCUMENT IS PROVIDED “AS IS” WITHOUT ANY WARRANTY, EXPRESS OR IMPLIED, INCLUDING WITHOUT ANY WARRANTIES OF MERCHANTABILITY, FITNESS FOR A PARTICULAR PURPOSE AND ANY WARRANTY OR CONDITION OF NONINFRINGEMENT. IBM products are warranted according to the terms and conditions of the agreements under which they are provided.
1 The Michigan Studies and the Ohio State Studies are a group of studies in leadership and management history. A summary can be found at: http://www.tlu. ee/~sirvir/Leadership/Leadership%20Models/the_university_of_michigan_studies. html