the demand for health: theory and applications · journalofepidemiologyand communityhealth, 1986,...
TRANSCRIPT

Journal of Epidemiology and Community Health, 1986, 40, 1-11
The demand for health: theory and applicationsADAM WAGSTAFFFrom the Centre for Health Economics, University of York, Heslington, York YOI SDD
SUMMARY The concern of this paper lies with the economic theory of the "demand for health". Itdevelops a conceptual apparatus for analysing the interaction of socioeconomic determinants ofhealth and indicates how this can be used to shed light on a variety of topical policy issues such associoeconomic inequalities in health and the design of prevention policies. It is written with the aimof making what has hitherto been a mathematically sophisticated literature accessible to thenon-economist.
The last few years have seen a growing appreciationof the fact that health is determined by many factorsamong which medical care is only one. Indeed, it hasbecome increasingly accepted that medical care is notusually the major determinant of health. Otherdeterminants, such as food, heating, housingconditions, and work environment, play equally if notmore important roles than medical care.' There hasalso been a growing realisation that very little isknown about the effectiveness of much of modernmedicine.2 Such evidence that does exist indicatesthat modern sophisticated techniques are often lesseffective than the simpler techniques they replace.3Some go further and argue that medical carefrequently impairs health rather than improves it.4
Partly as a result of the growing realisation of theimportance of non-medical influences on health,there has been a noticeable shift of emphasis indiscussions concerning health policy away fromstrictly medical issues. One issue currently receiving agood deal of attention is that of prevention. It is oftenasserted that one of the most effective and, possibly,efficient ways to achieve further improvements in thequality and length of life in the developed worldwould be to concentrate efforts on trying toencourage a switch from health-endangering tohealth-enhancing consumption patterns.5 However,in order to assess the relative efficiency of alternativeprevention-orientated policy measures, the costs andbenefits associated with each measure must beknown. In order to ascertain the benefits of aprevention strategy aimed at reducinglifestyle-related morbidity and mortality, one wouldneed to know inter alia how the proposed measureswill alter health-related behaviour.
Another issue currently of concern is that ofsocioeconomic inequalities in health. The recent
Black Report6 indicated that inequalities in healthbetween social classes in Britain are in some respectsas pronounced as they were 50 years ago despite theintroduction in 1948 of a National Health Serviceaimed explicitly at eliminating inequalities in accessto health care. It has been argued by the authors ofthe Report and others that class differences in healthalmost certainly stem more from class differences inlifestyles and living conditions than from differencesin health care utilisation. However, to attempt todetermine whether it is differences in lifestyles ordifferences in living conditions which are responsiblefor class differences in health makes little sense froman economist's perspective, since individuals'lifestyles are likely to depend in part on theirresources (ie, "living conditions"), in both a narrowsense (income and financial wealth) and a broadsense (educational attainment, for example).7 Thusclass differences in lifestyle almost certainly stempartially from class differences in resourceavailability.Another issue currently under debate concerns the
impact of unemployment on health. It has beenargued that involuntary unemployment may result inserious deteriorations in the mental and physicalhealth of those concerned.8 Such effects are thoughtto arise in part from the financial hardshipsassociated with unemployment and in part from thestress that it generates (which may be due partly tothe financial hardships). Seeking to assess the extentto which unemployment does carry risks to health isnot an easy task, in part because those who arerelatively disadvantaged in terms of unemploymenthistories also tend to be disadvantaged in otherrespects, for example, having low, incomes when inwork, living in poor housing conditions, and havinghad comparatively little education.9 Failure to take
Protected by copyright.
on May 2, 2020 by guest.
http://jech.bmj.com
/J E
pidemiol C
omm
unity Health: first published as 10.1136/jech.40.1.1 on 1 M
arch 1986. Dow
nloaded from

2
into account these confounding influences will resultin wrongly attributing to unemployment poor healthbrought about by the omitted factors.10The shift in emphasis in policy debate away from
strictly medical matters towards issues such as thesehas resulted in a recognition of the need to bring intothe debate others from outside the medicalprofession. None of the issues of prevention,inequalities in health, and the health consequences ofunemployment can be addressed in a satisfactorymanner without an understanding of health-relatedbehaviour: the relative efficiency of alternativeprevention strategies cannot be established in theabsence of information on their capacity to modifyhealth behaviour; the relative importance ofinequalities in different types of resources cannot bedetermined unless there is an understanding of thelinks between resources, behaviour, and health;nor can the magnitude of any adverse healthconsequences on unemployment be ascertained inthe absence of a behavioural model indicating thestrength of the relationships between other healthdeterminants and health. The purpose of this paper isto develop the economics approach to analysinghealth behaviour and to indicate the insights itaffords into each of the issues discussed above. Thepaper is written with the non-economist in mind andrequires no previous knowledge of economics. Itbegins by introducing the basic concepts of theapproach and then indicates how these concepts canbe brought together to analyse the effects ofpreventive policies, the causes of inequalities inhealth, and the impact of unemployment on health.The paper ends with a brief discussion of theusefulness of the approach.
Basic concepts of the economics approach
The economics approach emphasises the role ofeconomic factors in shaping health-relatedbehaviour. It is referred to as the "demand forhealth" approach'1 12 since it views the individual as"demanding" a commodity "health". It is built uparound three concepts.
THE INDIFFERENCE MAP
Health (or good health) is assumed to be desirable; itis assumed not to be the only desirable thing in life,.nor valued above all else. There are various reasonswhy good health might be thought to be desirable: forone, it is in itself pleasant (or, equivalently, ill-healthmay be viewed as being in itself unpleasant). Being ingood health also permits one to engage in one'snormal activities-social activities, work, and so on.It is clear too, however, trom our behaviour both asindividuals and collectively that good health is not
Adam Wagstaff
valued above all else. Every year patients in hospitalsare denied life-saving treatments because theresources society has made available to the hospitalsector are insufficient to "save" every life that couldfrom a purely technological point of view be "saved".The resources are devoted instead to other thingsthat society values, such as good roads, sportsfacilities, education, and defence. At an individuallevel, if people valued their health above all else, theywould not over-eat, smoke or drive too fast. Thatpeople do engage in such activities, and that societydoes spend money on sports facilities and roads whenpeople are left to die before they need to, makes itclear that although people do value their health, theydo not place an over-riding value on it.
This idea can be stated more precisely. Supposehealth can be measured in terms of "units of health".For brevity, the "other things in life" from whichpleasure is derived can be labelled "consumption".In what follows "consumption" means a bundle ofconsumption activities. Figure 1 shows units of healthplotted along the horizontal axis and units ofconsumption plotted along the vertical axis. Anypoint on the graph represents a combination of healthand consumption. Thus point a represents thecombination 1 unit of health and 2 units ofconsumption. Above, it was assumed that peoplederive pleasure from being in good health and fromundertaking consumption activities. Thus a personwould experience a higher level of well-being at pointb, for example, than at a, since at b he enjoys betterhealth and consumes more than at point a. In general,the further the individual is away from the origin 0,the higher will be his well-being.The assumption above can be expressed in
diagrammatic form using an "indifference curve" or
6-
5-
4-a.
3 -
_ I
1-
0 1 2 3 4Health
Fig 1
- -b
-00I
-r
Protected by copyright.
on May 2, 2020 by guest.
http://jech.bmj.com
/J E
pidemiol C
omm
unity Health: first published as 10.1136/jech.40.1.1 on 1 M
arch 1986. Dow
nloaded from

The demand for health: theory and applications"welfare contour". In the same way as a contour on amap links all places of the same height, the welfarecontour in fig 2 links all points giving rise to the samelevel of well-being. Because all the combinations ofhealth and consumption along the contour yield thesame level of welfare, the individual is "indifferent"between them all. Hence the term "indifferencecurve
The indifference curve slopes downwards becausepeople value both health and consumption but do notview being in good health as so important that it takespriority over everything else. At point a in fig 2 theindividual has 4 units of health and 1-8 units ofconsumption. The indifference curve indicates that ifhe were to move to point b-2-6 units of consumptionand 3 of health- he would be just as well off as he hadbeen at a. His health would be worse, but the increasein consumption of 08 units would be sufficientlylarge to compensate for this deterioration in health.The welfare contour slopes downwards, therefore,because to compensate for a reduction in health,consumption has to increase and vice versa. Theindifference curve indicates that to compensate for areduction in health from 3 to 2 units the individualwould require 1-4 (4-0-1-6) units of consumption. Atc the individual would be as well off as at b and a.However, as one moves down the indifference curveit becomes increasingly difficult to induce theindividual to accept further deteriorations in hishealth. To part voluntarily with 1 unit of healthstarting at point a, he has to be compensated with 0-8units of consumption. Starting from point b,however, he has to be compensated with 1-4 units ofconsumption. This reflects the assumption that assuccessively more units of health are taken away fromthe individual, he will require successively more unitsof consumption in compensation. (Or, equivalently,as the individual is given successively more units ofhealth, he will require successively fewer units ofconsumption in compensation.) It is this (not
6- \
cCL.o
E
c0
5
4 --- -cI.3
2- __ __ a
1- 11 1____
3
unreasonable) assumption that gives the indifferencecurve its bowed shape.The indifference curve in fig 2 is just one possible
indifference curve. Any number of these curves canbe drawn, all with the same shape, some closer to theorigin than that in fig 2 and some further out. Whilethe individual is indifferent between points along agiven curve, he is not indifferent between the curvesthemselves. He will prefer IC2 to IC1 in fig 3, forexample, since IC2 offers him more consumption fora given level of health. The individual will thereforeseek to attain the highest possible indifference curve.It cannot be said yet, however, on which indifferencecurve he will operate. In order to determine that, theother elements of the economics approach have to beintroduced.
THE HEALTH PRODUCTION FUNCTIONThe second assumption on which the presentapproach is based may be stated as follows.Individuals exert a relatively high degree of controlover their health by virtue of the fact that they caninfluence their health-affecting consumptionpatterns, their health care utilisation, and theirenvironment. This assumption can be expressedrather more precisely using the concept of the"health production function". In economics onespeaks of firms "producing" their outputs bycombining "factor inputs", chiefly labour andmachines. The relationship linking these inputs to thefinal output is known as the "production function".The "demand for health" approach utilises theseideas and conceives of the individual "producing" hishealth by combining "health inputs". Medical care isan example of a health input, but, as was emphasisedearlier, it is only one example of a determinant ofhealth. As was the case with consumption activities, itis useful to talk in terms of a "bundle" of healthinputs comprising food, heating, health care, andother inputs. The "health production function" links
6*li4 \b
E3-\ \
021-+-
0 1 2 3 4 5 6 7 8 9HealthFig 3
0 1 2 3 4 5 6 7 8 9Health
Fig 2
Protected by copyright.
on May 2, 2020 by guest.
http://jech.bmj.com
/J E
pidemiol C
omm
unity Health: first published as 10.1136/jech.40.1.1 on 1 M
arch 1986. Dow
nloaded from

4
these inputs to the output, health. The healthproduction function is illustrated in figure 4. Theoutput-health-is measured along the vertical axisand the health inputs along the horizontal axis.Figure 4 indicates, for example, that 1 unit of healthinput produces 1 8 units of health. As more units ofhealth input are used, more health is produced.Figure 4 also indicates that successive additions to thequantity of health inputs employed result insuccessively smaller increments in health. Forexample, increasing the amount of health input from1 to 2 units results in an increase in health of 15 units.Increasing the amount of health input from 5 to 6units, however, results in an increase in health of only0-5 units. This phenomenon is termed the "law ofdiminishing marginal product", the term "marginalproduct" referring to the extra number of units ofoutput resulting from the use of one extra unit ofinput. (The marginal product of health inputs in therange 1 to 2 along the horizontal axis, for example, isequal to 1-5.) That this principle applies in the'production of health is clear from, for example, thediffering experiences of developing and developedcountries. At the low levels of health and health inputcurrently prevailing in the Third World, even quitemodest increases in the quantities of health inputemployed (food, sanitation, etc) have relatively largeimpacts on life expectancy. At higher levels of healthand health input, such as those enjoyed by citizens ofdeveloped countries, even quite large increases in theresources devoted to the promotion of health appearto have relatively small impacts on the quantity andquality of life.The health production function shows how much
health can be obtained from a given quantity ofhealth input for a given state oftechnical knowledge.
7-
6-
5-
4-
3-
2-
1 -
0
Adam Wagstaff
Technical knowledge is not, however, constant overtime; it changes in response to breakthroughs inmedical science. As medical science progresses, ourunderstanding of the health production processincreases. One would expect that, as a result of thisenhanced understanding, it should be possible toproduce health more efficiently, that is, more healthought to be produced per unit of health input thanformerly. (A good example here is the increasedunderstanding of the role of environmental factors inthe role of infectious diseases.) When the state oftechnical knowledge changes, the position of thehealth production function changes. As knowledgeincreases, so the production function shifts upwards.This is illustrated in figure 5. With theold-lower-health production function, 4 units ofhealth input yielded 4-4 units of health. On the newproduction function, however, 4 units of health inputproduce 5 4 units of health.As well as considering the effects of knowledge
increasing over time, one can consider theimplications of some individuals being moreknowledgeable about the technology of healthproduction than others. One might reasonablysuppose that the better educated are in a betterposition to assimilate information about healthmatters from the mass-media and their physicianthan the poorly educated, thereby being betterequipped to produce a healthy diet from a givenoutlay on food, to acquaint themselves with the mostefficient ways to heat their homes, and to digestinformation about possible health hazards in theirworkplace. One may presume therefore that theposition of an individual's health production functionwill depend on his education.
7-
6-
*
-5.EU 3-
2 -/1I ~I
I
/2 52 3 4 s 6 7
Health inputs
Fig 4
I I I I I
0 1 2 3 4 5Health inputsFig 5
6 7 8
I
IIII
II
I I I I I I I I
Protected by copyright.
on May 2, 2020 by guest.
http://jech.bmj.com
/J E
pidemiol C
omm
unity Health: first published as 10.1136/jech.40.1.1 on 1 M
arch 1986. Dow
nloaded from
The demand for health: theory and applicationsTHE BUDGET CONSTRAINT
We come now to the third and fourth assumptions onwhich the economic approach is based. The third isthis: neither health inputs nor consumption activitiesare costless. Heating, food, housing, and health careall cost money, although the price an individual paysfor each obviously varies. The significance of thisthird assumption becomes apparent when the finalassumption is introduced: individuals have onlylimited resources at their disposal. The simplestversion of this assumption is that individuals have agiven income with which to finance their healthproduction and consumption activities.
Suppose, for example, that the individual has an
income of £40-00, that the price of a unit ofconsumption is £10-00 and that the price of a unit ofhealth input is £5-00. If he wanted, the individualcould spend all his £40-00 income on improving hishealth. This would give him 8 units of health input.Alternatively, he could spend all his income on
consumption activities. Doing so would give him 4units of consumption. Clearly, though, he couldspend part of the £40-00 on consumption and part onhealth inputs. He could, for example, purchase 2units of health input and 3 units of consumption.The various possibilities open to the individual can
be illustrated by means of the "budget constraint",which indicates all combinations of health inputs andconsumption which exactly exhaust the individual'sincome. The budget constraint is illustrated in figure6. The diagram indicates, for example, that if all£40-00 were spent on health inputs, the individualcould purchase 8 units. He could, however, operateat point a. Here he purchases 3 units of consumptionand 2 of health input. Or he could operate at point b,where he purchases 2 - 5 units of consumption (costing£25 00) and 3 units of health input (costing £15-00).
43-
E 2-~3i%A
01
a
- - - bI..I<I I1_qI_ I ___
0 1 2 3 4 5 6Health inputs
7 8
Fig 6
The slope of the budget constraint has a simpleinterpretation: it indicates the number of units ofconsumption which must be given up to obtain one
more unit of health input. Starting from point a, for
5
example, the individual has to give up 0 5 unit ofconsumption to obtain one extra unit of health input.This is in fact the slope of the budget line: the slope ofa downward sloping line is the amount by which onedescends the vertical axis to move one unit along thehorizontal axis. The slope is therefore (-)0 5. This isin fact the ratio of the price of a unit of health input tothe price of a unit of consumption, ie, 5/10=0 5.
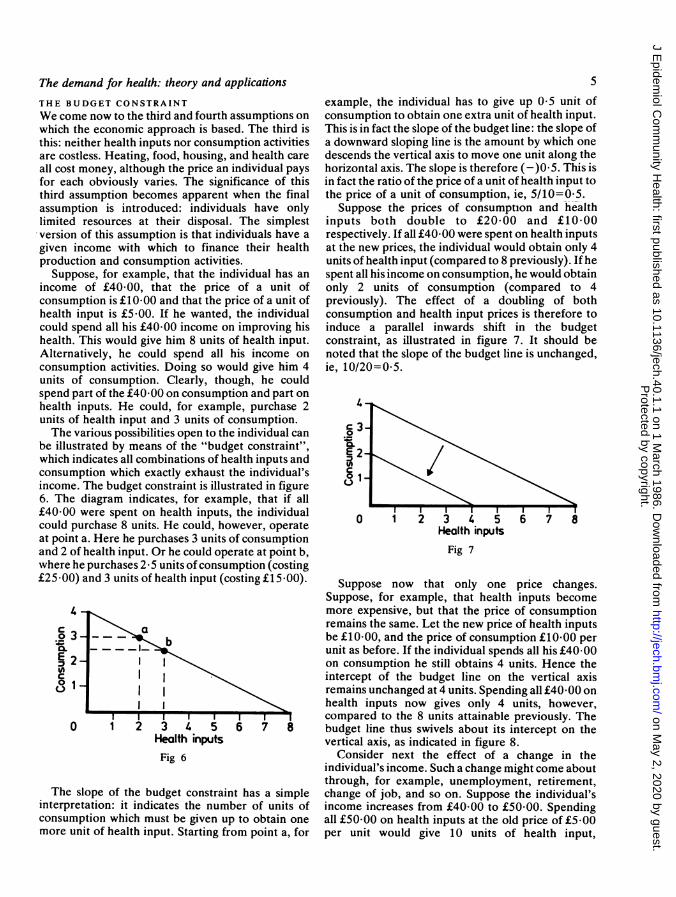
Suppose the prices of consumption and healthinputs both double to £20-00 and £10-00respectively. If all £40-00 were spent on health inputsat the new prices, the individual would obtain only 4units of health input (compared to 8 previously). If hespent all his income on consumption, he would obtainonly 2 units of consumption (compared to 4previously). The effect of a doubling of bothconsumption and health input prices is therefore toinduce a parallel inwards shift in the budgetconstraint, as illustrated in figure 7. It should benoted that the slope of the budget line is unchanged,ie, 10/20=0 5.
ik~ ~~~Fi
E.2a.
c1
0 1 23 4 5 67 8Health inputs
Fig 7
Suppose now that only one price changes.Suppose, for example, that health inputs becomemore expensive, but that the price of consumptionremains the same. Let the new price of health inputsbe £10-00, and the price of consumption £10-00 perunit as before. If the individual spends all his £40-00on consumption he still obtains 4 units. Hence theintercept of the budget line on the vertical axisremains unchanged at 4 units. Spending all £40-00 onhealth inputs now gives only 4 units, however,compared to the 8 units attainable previously. Thebudget line thus swivels about its intercept on thevertical axis, as indicated in figure 8.
Consider next the effect of a change in theindividual's income. Such a change might come aboutthrough, for example, unemployment, retirement,change of job, and so on. Suppose the individual'sincome increases from £40-00 to £50-00. Spendingall £50-00 on health inputs at the old price of £5-00per unit would give 10 units of health input,
Protected by copyright.
on May 2, 2020 by guest.
http://jech.bmj.com
/J E
pidemiol C
omm
unity Health: first published as 10.1136/jech.40.1.1 on 1 M
arch 1986. Dow
nloaded from

6
3-c
E 2-
1-
,I/0 1 2 3 4 5
Health inputs
I 1
6 7 8
Fig 8
compared to 8 previously. Spending all £50-00 on
consumption at £10 00 per unit would give 5 units ofconsumption, compared to 4 previously. The effecton the budget constraint is to shift it outwards, asindicated in figure 9. Note that the slope isunchanged, since the (relative) prices of consumptionand health inputs are unchanged.
Health inputsFig 9
USING THE ECONOMICS APPROACH
To summarise briefly, the demand for healthapproach is built up around three basic concepts-theindifference map, the health production function,and the budget constraint. The indifference map is ameans of representing diagrammatically theassumption that people value both health and otherthings in life but do not place an overriding value on
their health. The health production functionexpresses the idea that people "produce" their healthby utilising "health inputs", such as nutritious foods,health care, exercise, etc. Utilising more healthinputs results in improved health, but successiveadditions to the quantity of health inputs employedresult in successively smaller improvements in health.The budget constraint indicates that individuals haveonly limited incomes with which to finance theirhealth production and other activities, and thatneither their health production nor their otheractivities are costless.
Adam Wagstaff
Using these concepts, one can see how theindividual will behave. How much health and howmuch consumption will he "demand"? Of moreinterest is to examine how he behaves in response tochanges in the factors affecting his behaviour. Whatwould happen, for example, if a policy supplementingthe incomes of low-income families were introduced?Would this help to reduce socioeconomic inequalitiesin health? Even if it would, might there not be othermore effective ways? For example, might notsubsidising the prices of health inputs, such asheating, milk, etc, be a more efficient way to combatinequality? How should one go about designing aprevention-orientated health policy? Should anyresources released from the hospital sector be used tofinance price subsidies, or should they be used tofinance health education programmes?
CONSUMER EQUILIBRIUMFirstly, it is necessary to establish how the individualwill behave. In particular, how much health will he"demand" and how much "health input" will heutilise? It can reasonably be assumed that he will tryto do the best he can for himself, in the sense that hewill organise his expenditures on health inputs andconsumption so as to give himself the highest possiblelevel of well-being. In terms of the diagrams of theprevious section, this means that he will seek to attainthe highest indifference curve available to him. Indoing this he will be constrained by his limitedincome, the prices he has to pay for health inputs andconsumption activities, and the opportunities open tohim for transforming health inputs into health. Interms of the diagrams introduced earlier, the budgetconstraint and the production function act asconstraints on his behaviour. The former summarisesthe financial constraints the individual faces and thelatter the technological constraints facing him. Insum, then, the individual's objective will be to attainthe highest possible welfare contour, subject to theconstraint that he operates on both his budgetconstraint and his health production function.To examine the individual's behaviour therefore
one requires a diagram which brings together figures3, 4, and 6. This is done in figure 10. Each of the fourquadrants are considered in turn, starting withquadrant II. Quadrant II reproduces the healthproduction function of figure 4. Health is stillmeasured south to north, but health inputs aremeasured east to west. Quadrant III shows thebudget constraint of figure 6. Health inputs aremeasured from east to west and consumption froninorth to south. In this example, the individual has anincome of £40*00, the price of consumption is£10-00, and the price of a unit of health input is equalto £8-00. (He could spend all his income on health
Protected by copyright.
on May 2, 2020 by guest.
http://jech.bmj.com
/J E
pidemiol C
omm
unity Health: first published as 10.1136/jech.40.1.1 on 1 M
arch 1986. Dow
nloaded from

The demand for health: theory and applications
Health61, \ 0D
Fig 10
inputs, thereby obtaining 5 units of health input, orall on consumption, thereby obtaining 4 units ofconsumption. Alternatively, he could buy 3, forexample, units of health input and 1-6 units ofconsumption.)By including the budget constraint and health
production function in the same diagram one can see,for each amount of health input, (i) how much healthcan be produced and (ii) how many units ofconsumption could be purchased with the income leftover. Employing 3 units of health input, for example,would produce 3-5 units of health and would leaveenough income over to purchase 1-6 units ofconsumption. To see which combination of healthand consumption the individual will actually choose,one needs a quadrant of the diagram showing whatcombinations of health and consumption areavailable to him, given his financial and healthtechnology constraints, and which combinations heprefers. This is done in quadrant I, where health ismeasured from south to north and consumption fromwest to east.
Before discussing quadrant I in detail it is useful toexplain quadrant IV. Here consumption is measuredon both axes. The straight line going through theorigin is a "45-degree" line, a device for enabling oneto read units of consumption off the vertical axis inquadrant III onto the horizontal axis of quadrant I.
(For example, taking 4 units of consumption on thevertical axis in quadrant III and following itanticlockwise through quadrant IV, one arrives at 4units of consumption on the horizontal axis ofquadrant I. This merely indicates that 4 units ofconsumption in quadrant III are the same as 4 units ofconsumption in quadrant I.)
7
The curves IC, and IC2 in quadrant I are theindifference curves of figure 3. The bowed-outshaped curve in quadrant I is the individual's"welfare possibility frontier" (WPF). It indicates allcombinations of health and consumption whichsatisfy both the budget constraint and the healthproduction function and is derived from the budgetconstraint and the health production function. Thiscan be seen by following the dotted lines in figure 10.Suppose, for example, all the individual's income wasspent on health inputs. From quadrant III one can seethat he would obtain 5 units of health input.Following the dotted line up into quadrant II andthen rightwards across to the vertical axis, one seesthat the 5 units of health input would produce 4-7units of health. This, then, is one of the end-points ofthe WPF. The other is obtained by considering thesituation where all the individual's income is spent onconsumption. From quadrant III one can see thatspending all his income on consumption would givehim 4 units of consumption. Tracing the dotted linearound through quadrant IV brings us, as we wouldexpect, to 4 units of consumption on the horizontalaxis in quadrant I. This is the other end-point of theWPF. Suppose now some intermediate point on thebudget constraint is taken, for example, 3 units ofhealth input. Reading off on the health productionfunction, it is seen that 3 units of health input produce3-5 units of health. From the budget constraint it isseen, too, that purchasing 3 units of health inputwould leave the individual with sufficient income topurchase 1-6 units of consumption. This gives,therefore, another feasible combination for theWPF-3-5 units of health and 1-6 units ofconsumption. If this process were to be continued forall combinations of health input and consumptionsatisfying the budget constraint, one would end upwith the WPF indicated in figure 10.
It is known now which combinations of health andconsumption are available to the individual, namely,those on (or within) the WPF. Which of them,however, will he choose? Above it was argued thatthe individual would be expected to seek to attain thehighest indifference curve he can, for this will givehim his highest level of welfare. He will thereforeoperate at point a in fig 10 on the indifference curveICi. At this point indifference curve IC, is tangentialto the WPF. This indifference curve is the highest hecan attain while still remaining on the WPF. If hechose to operate on indifference curve ICo, forexample, he could still operate on the WPF-either atb or at c-but his well-being would be lower than thatexpected at point a. Indifference curve IC2 is clearlynot attainable, since operating on it would involve theindividual operating outside his WPF. In otherwords, given the technology of health production, his
Protected by copyright.
on May 2, 2020 by guest.
http://jech.bmj.com
/J E
pidemiol C
omm
unity Health: first published as 10.1136/jech.40.1.1 on 1 M
arch 1986. Dow
nloaded from

8
income, and the prices he faces, he would be spendingmore on health inputs and consumption than hecould afford.
EFFECTS OF CHANGES IN INCOMEIn the previous section it was seen how the'interaction of prices, income, and health productionopportunities gives rise to an "optimal" combinationof health and consumption. This section considershow this optimal combination changes when factorsaffecting behaviour change. This involves examiningthe effects of a change in one variable at a time,holding all other factors constant; for example, theeffects of changing the individual's income, holdingprices and health production opportunities constant.
Consider first the effects of changing theindividual's income. Suppose, for example, that theindividual's income falls from £40-00 to £32 00. Thisresults in the parallel inwards shift of the budgetconstraint illustrated in figure 11. Because the budgetline has changed its position, the WPF changes itsposition and shape. Tracing round all the possiblepoints on the new budget line gives a new WPFindicated by the dashed bowed-out curve in quadrantI. Not surprisingly, a lower income means that thenumber of feasible combinations of health andconsumption open to the individual is reduced. Theold optimal combination-point a-is now no longeravailable. The best the individual can do for himselfwith his new income is to operate at point b. Here hehas a lower level of health (2-4 units compared to2-65 previously) and consumes less. His health islower because he has less to spend on health inputsand on consumption. Tracing the dotted line from b
Adam Wagstaffwestwards into quadrant II one sees that he nowemploys only 2- 9 units of health compared to the 3 - 1he employed previously. Thus a fall in income ispredicted to result in a reduction in the quantity ofhealth inputs employed and a deterioration in theindividual's health status.These predictions are of interest from a policy
stand-point. From the point of view of preventivemeasures, they suggest that one possible strategy fora prevention-orientated health policy would involvesupplementing the incomes of those on low incomes.If low incomes are a causal factor in poor health, asthe analysis above suggests may be the case,improving the health of those in poor health could beachieved by supplementing their incomes. From theinequality perspective, the predictions above suggestthat socioeconomic inequalities in health stem, atleast in part, from inequalities in income. One wouldexpect, therefore, that changes in socioeconomicinequalities in health over time will reflect changes inthe distribution of income between socioeconomicgroups. In Britain, the distribution of income hasremained relatively stable over the course of the last15 years. In the light of the prediction derived above,it should come as little surprise, therefore, thatinequalities in health have shown so little tendency todiminish. Finally, from the point of view of theunemployment health debate, the analysis aboveleads us to expect that, to the extent thatunemployment is associated with a fall in income, it islikely to lead to some deterioration in the health ofthe individual concerned, regardless of whether anystress effects are operating.
Suppose the individual's income falls yet further,say, to £24-00. The effect of a drop in income from£40-00 to £24-00 is illustrated in fig 12, which
Health
Fig 12Fig 1 1
Protected by copyright.
on May 2, 2020 by guest.
http://jech.bmj.com
/J E
pidemiol C
omm
unity Health: first published as 10.1136/jech.40.1.1 on 1 M
arch 1986. Dow
nloaded from

The demand for health: theory and applications
indicates that at an income of £24-00 the individualdemands 3 units of health. Thus reducing theindividual's income from £40-00 to £24-00 results ina larger deterioration in health than reducing hisincome from £40-00 to £32-00. Thus the larger thedrop in income, the larger will be the reduction inutilisation of health inputs and the greater will be thedeterioration in the individual's health status. Thisprediction is also of some interest from a policyperspective. It suggests, for example, that the impactof unemployment on health will depend on thegenerosity of the unemployment benefit systemoperating in the individual's country.
If the process of taking income away from theindividual is continued, one can see how much healthhe demands for different amounts of income. Figure13 plots the resultant relationship between healthand income. It indicates that the higher theindividual's income, the greater will be his demandfor health. It indicates too, however, that therelationship between health and income is not asimple linear one. If £10-00 are taken from anindividual with an income of £40g00, for example, hisdemand for health is reduced by 0-35 units(2.65-2.30). If, however, £10-00 are taken from aperson with £30 00 income, his demand for healthfalls by 0-55 units (2.301-75). This result derivesfrom the assumption of diminishing marginal productof health inputs. At low levels of income people canafford only relatively few units of health input; thecontribution of the "marginal" unit of health input is,however, quite large. Taking a given number ofpounds' income away in these circumstancestherefore has a more dramatic effect than taking agiven number of pounds away from a high-incomefamily. Thus a given reduction in an individual'sincome will result in a larger deterioration in health,the lower the individual's income. This prediction is
3.0-
2.0-
a
10-
0
9
also of interest from the policy perspective. Itsuggests that income-supplements will be especiallyeffective as a preventive measure among low-incomegroups. It is of interest, too, from the inequalitiesstandpoint, suggesting that redistributing incomefrom high-income groups to low-income groups willresult in relatively small deteriorations in the healthof those in the high-income groups but relativelylarge improvements in the health of those in thelow-income groups, and that inequalities in healthwill be more pronounced in countries with low percapita incomes than in those with high per capitaincomes. Finally, from the unemployment healthperspective, the analysis above suggests thatunemployment will lead to smaller impairments tohealth in richer countries than in poorer countries,even if the unemployment benefit systems are nomore generous in the richer countries than in thepoorer countries.
EFFECTS OF CHANGES IN PRICESAlso of interest are the effects of a change in the priceof health inputs. Figure 14 illustrates the effects of afall in the price of a unit of health input from £8-00 to£5-90. The effect on the budget line is to make itswivel outwards about the intercept on theconsumption axis. This results in an outwards swivelof the WPF in quadrant. The end-point on theconsumption axis remains unchanged. (If all incomewere devoted to consumption, the number of units ofconsumption attainable are the same before and afterthe health input price change.) The new optimalcombination of health and consumption is indicatedby point b in quadrant I. Here the individual is inbetter health and, to achieve this, employs more
Heathhpu
N
10 20Income
Fig 13
30 40
(0
\1 2 3 4 5 6 7Consumption
450
Fig 14
Protected by copyright.
on May 2, 2020 by guest.
http://jech.bmj.com
/J E
pidemiol C
omm
unity Health: first published as 10.1136/jech.40.1.1 on 1 M
arch 1986. Dow
nloaded from

10
health inputs. Thus, a reduction in the price of a unitof health input results in an increased utilisation ofhealth inputs and, as a consequence, an improvementin the individual's health status. This predictionsuggests that subsidising the prices of health inputssuch as milk, heating, housing costs, etc, is likely toresult in an improvement in the health of individualsreceiving such subsidies and may therefore be aneffective, although not necessarily efficient,promotion strategy.
CHANGES IN THE STATE OF TECHNICALKNOWLEDGEIt was indicated earlier that advances in the medicalsciences ought to result in the efficiency of healthproduction. It was suggested, too, that differencesbetween individuals in their levels of education maybe associated with differences in the efficiency withwhich health inputs can be transformed into health.Figure 15 illustrates the effect of an upwards shift inthe health production function. The upwards shift inthe health production function in quadrant II resultsin a change in the shape of the WPF, as indicated inquadrant I. At the new position, b, the individual is inbetter health. His utilisation of health inputs isreduced, however, since he obtains more health perunit of health input than was the case previously.Thus an increase in the state of technical knowledgeresults in a reduction in the utilisation of health inputsbut an increase in the demand for health.
These predictions are of interest from the policyperspective. They suggest that education and/orhealth-education programmes might be used inpreventive health policies to secure healthimprovements. It is worth noting that the predictionthat utilisation of health inputs is likely to decrease
Heafh
sI7 6 5\ 3 2 1 \Health input 1
2
@ \~~~3
5
6Conswmnption
Fig 15
Adam Wagstaff
following an improvement in the state of knowledge,contrasts with the prediction for an increase inincome. There, both health and health inpututilisation were predicted to increase. This suggeststhat using general and/or health-educationprogrammes as a health policy tool ought to improvean individual's health but reduce his demand onhealth services and other health inputs (at least atthat stage in his life). The prediction suggests, too,that inequalities in education are indeed likely to be acausal factor in generating inequalities in health. Thisis especially true when one bears in mind the impactof education on income. Above, it was seen that, tothe extent that the better educated are more efficientproducers of health, they will demand more healththan the poorly educated. In deriving this predictionit was assumed that the better educated and thepoorly educated had the same incomes. In reality thisis most unlikely to be the case: they are also likely toreceive higher incomes than the poorly educated.
Discussion
The purpose of this paper has been to provide anintroduction to the economic theory of the demandfor health and to indicate some of its possibleapplications. The demand for health approach hasbeen seen to yield a whole range of testablepredictions which shed light on a variety ofhealth-related issues. Some of the predictionsderived may seem somewhat self-evident. Theprediction that an increase in the price of healthinputs should lead to a deterioration in health statusis perhaps an example. Other predictions, however,are less self-evident. The predictions that a reductionin income of £10-00 will cause larger deteriorationsin health at lower levels of income than at higherincome levels and that the better educated shouldutilise fewer health inputs and yet be in better healththan the poorly educated are examples. A strength ofthe demand for health approach to health-relatedbehaviour, then, is its ability to yield a variety oftestable predictions from relatively simple and notunreasonable assumptions. Because of this, it wouldseem to provide a useful conceptual apparatus withwhich to investigate health policy issues of the typediscussed in the paper.
It should be emphasised, however, that generatingpredictions is only part of the exercise. The next stageinvolves testing the predictions against the data toexamine the extent to which they are consistent withthe evidence. In fact empirical work on the demandfor health is only in its infancy, and it is too early yetto pronounce a final verdict. Confronting thepredictions with the evidence serves also to provideestimates of the likely effect of various policy
Protected by copyright.
on May 2, 2020 by guest.
http://jech.bmj.com
/J E
pidemiol C
omm
unity Health: first published as 10.1136/jech.40.1.1 on 1 M
arch 1986. Dow
nloaded from

The demand for health: theory and applications
measures. It was seen, for example, thatincome-supplements and price-subsidies are bothlikely to result in health improvements. The theorycannot predict, however, which would be the moreeffective measure. It merely indicates the direction ofchanges, not their magnitudes.
It should be emphasised, too, that the demand forhealth approach provides only part of the,information required by policy-makers. Theoreticaland empirical analyses of the demand for health canindicate which policy measures are likely to be themost effective in tackling particular problems, butthey cannot indicate by themselves which measuresare likely to be most cost-effective. The demand forhealth framework provides information on only thebenefits of particular policy measures. It thereforeneeds to be used in conjunction with other tools, suchas cost-benefit analysis and cost-effectivenessanalysis.
I wish to thank Dick Brooks, Peter Hertzman, GavinMooney, and Alan Williams for helpful comments onearlier drafts of this paper written while I wasworking at the Swedish Institute of Health
11
Economics and the Health Economics ResearchUnit, Aberdeen. The usual disclaimer applies.
References
'McKeown T. The role of medicine: dream, mirage ornemesis? Oxford: Basil Blackwell, 1976.
2Cochrane AL. Effectiveness and efficiency: randomreflections on health services. London: NuffieldProvincial Hospitals Trust, 1972.
3Bunker JP, Barnes BA, Mosteller F. Costs, risks, andbenefits ofsurgery. New York: Oxford University Press,1977.
4Illich I. Limits to medicine: medical nemesis-theexpropriation of health. Harmondsworth: Penguin,1977.
5Department of Health and Social Security. Prevention andhealth everybody's business. London: HMSO, 1976.
6Townsend P, Davidson N. Inequalities in health: TheBlack Report. London: Penguin, 1982.
7LeGrand J. Inequalities in health and health care. London:Nuffield/York Portfolio 5, 1984.
'Moser KA, Fox AJ, Jones DR. Unemployment andmortality in the OPC Longitudinal Study. Lancet 1984:ii: 1324-9.
9Nickell S. A picture of male unemployment in Britain.Econ J 1980; 90: 776-94.
"Stern J. The relationship between unemployment,morbidity, and mortality in Britain. Pop Stud 1983; 37:61-74.
Grossman M. The demand for health: a theoretical andempirical investigation. New York: NBER, 1972.
"Grossman M. On the concept of health capital and thedemand for health. J Polit Econ 1972; 80: 223-55.
Protected by copyright.
on May 2, 2020 by guest.
http://jech.bmj.com
/J E
pidemiol C
omm
unity Health: first published as 10.1136/jech.40.1.1 on 1 M
arch 1986. Dow
nloaded from