the design and testing of a 500 lbf liquid oxygen/liquid
TRANSCRIPT
University of Texas at El PasoDigitalCommons@UTEP
Open Access Theses & Dissertations
2019-01-01
The Design And Testing Of A 500 Lbf LiquidOxygen/liquid Methane EngineManuel Jesus HerreraUniversity of Texas at El Paso, [email protected]
Follow this and additional works at: https://digitalcommons.utep.edu/open_etdPart of the Aerospace Engineering Commons
This is brought to you for free and open access by DigitalCommons@UTEP. It has been accepted for inclusion in Open Access Theses & Dissertationsby an authorized administrator of DigitalCommons@UTEP. For more information, please contact [email protected].
Recommended CitationHerrera, Manuel Jesus, "The Design And Testing Of A 500 Lbf Liquid Oxygen/liquid Methane Engine" (2019). Open Access Theses &Dissertations. 86.https://digitalcommons.utep.edu/open_etd/86

THE DESIGN AND TESTING OF A 500 LBF LIQUID OXYGEN/LIQUID
METHANE ENGINE
MANUEL JESUS HERRERA
Master’s Program in Mechanical Engineering
APPROVED:
Ahsan R. Choudhuri, Ph.D., Chair
John F. Chessa, Ph.D.
Luis Rene Contreras, Ph.D.
Stephen Crites, Ph.D.
Dean of the Graduate School

Copyright ©
by
Manuel Jesus Herrera
2019

Dedication
I dedicate this thesis to my family and friends. In particular to my partner, Aleena Montoya, my
son, Giovanni Herrera, and all of my parents who have supported and motivated me throughout
my education.

THE DESIGN AND TESTING OF A 500 LBF LIQUID OXYGEN/LIQUID
METHANE ENGINE
by
MANUEL JESUS HERRERA, B.S.M.E
THESIS
Presented to the Faculty of the Graduate School of
The University of Texas at El Paso
in Partial Fulfillment
of the Requirements
for the Degree of
MASTER OF SCIENCE
Department of Mechanical Engineering
THE UNIVERSITY OF TEXAS AT EL PASO
May 2019

v
Acknowledgements
I would like to acknowledge Dr. Ahsan Choudhuri and Dr. Jack Chessa for their continued
guidance and support throughout my research at the Center for Space Exploration and Technology
Research (cSETR). Their genuine care for student success and professional development is
unparalleled by any other organization. I would also like to acknowledge and extend my gratitude
to Ms. Luz Bugarin, Ms. Gloria Salas, the entire cSETR staff, and to all the LOX/LCH4 team
members for their continued support throughout my research. Lastly, I would like to acknowledge
one of my closest mentors: Mr. Charles Hill. Mr. Hill has been a grand asset to me and has always
provided me with genuine advice, support, and has undoubtedly aided in my development as an
engineer. I’ve cherished my time at cSETR and aspire to make everyone proud with my future
accomplishments.

vi
Abstract
The development of liquid oxygen/liquid methane (LOX/LCH4) propulsion systems has
recently become a topic of interest ever since this particular propellant combination was
determined to be a suitable candidate for use in space exploration, more specifically missions to
Mars. This propellant combination is unique because the propellants can be synthesized from local
resources on Mars, a process called In-situ Resource Utilization (ISRU). ISRU would allow for
spacecrafts to be lighter and/or increase its payload capacity to Mars-bound missions because the
vehicle would not have to store the propellants required for the voyage back to earth.
For this reason, The University of Texas at El Paso’s (UTEP) Center for Space Exploration
and Technology Research (cSETR) is currently conducting research in liquid oxygen and liquid
methane propulsion. The Centennial Restartable Oxygen Methane Engine (CROME) is a 500 –
125 lbf pressure fed engine. CROME serves as a platform to further understand and advance
LOX/LCH4 propulsion technology, but also to give student’s knowledge, exposure, and relevant
experience in the process of designing, developing, and hot-fire testing a LOX/LCH4 rocket
engine. This engine is being designed in three phases: D1, D2 and D3. Currently, CROME is in
the initial design/development phase, D1, which is a ground test engine whose intent is to
demonstrate successful operation, validate design operating conditions, and characterize engine
performance through hot-fire testing at the D1 Test Facility located at the tRIAc facility.
This thesis describes the engine design, gives an overview of the D1 Test Facility, reviews
the objectives of the engine test campaign, explains how the engine will be tested, and gives
detailed results of any testing conducted on the facility and/or engine before the submission of this
thesis. It also lists recommendations that should be made to the test facility that will not be used
during initial testing and future engine development plans.
vii
Table of Contents
Acknowledgements ..........................................................................................................................v
Abstract .......................................................................................................................................... vi
Table of Contents .......................................................................................................................... vii
List of Tables ................................................................................................................................. ix
List of Figures ..................................................................................................................................x
Chapter 1: Introduction ....................................................................................................................1
1.1 Why Methane? ...............................................................................................................1
1.2 Scope of Thesis .................................................................................................................2
Chapter 2: Engine Design ................................................................................................................3
2.1 Engine Overview ..............................................................................................................3
2.2 Injector Selection and Design .........................................................................................11
2.3 Engine Ignition System ...................................................................................................22
2.4 Combustion Chamber & Nozzle Design.........................................................................24
2.5 Engine Interfaces and Seals ............................................................................................30
2.6 Engine Acoustic Cavities ................................................................................................38
2.7 Engine Instrumentation ...................................................................................................43
2.7.1 Engine Temperature Measurement Sensors........................................................43
2.7.2 Engine Pressure Measurement Sensors ..............................................................45
2.7.3 Engine Manifold Instrumentation .......................................................................46
2.8 Engine Assembly ............................................................................................................47
Chapter 3: D1 Test Facility ............................................................................................................49
3.1 D1 Test Facility Overview ..............................................................................................49
3.2 Tank Manifolding ...........................................................................................................50
3.2.1 Tank Manifolds ...................................................................................................52
3.2.2 Tank Lines ..........................................................................................................55
3.3 Oxygen Cleaning ............................................................................................................57
3.3 Measuring Mass Flow Rates ...........................................................................................58
3.3.1 Sizing an Orifice .................................................................................................61
3.4 Characterizing Pressure Drop Across Facility Lines ......................................................64

viii
3.4 Test Facility Insulation Method ......................................................................................68
Chapter 4: Engine Testing Campaign ............................................................................................70
4.1 Engine Testing Objectives ..............................................................................................70
4.2 Fluids Used .....................................................................................................................71
4.3 Engine Testing Procedures .............................................................................................74
4.3.1 Facility and Engine Leak Check Overview ........................................................75
4.3.2 Facility and Engine Cryoshock Overview ..........................................................78
4.3.3 Torch Igniter Check Overview ...........................................................................82
4.3.4 Cold Flow Overview ...........................................................................................83
4.3.5 Engine Hot Fire Test Overview ..........................................................................85
4.4 Hot-Fire Automatic Control Sequence ...........................................................................88
4.4.1 Redline Parameters and Facility Shutdown Sequence ........................................89
Chapter 5: Conclusion....................................................................................................................92
5.1 System recommendations ...............................................................................................94
5.1 Future Work ....................................................................................................................97
References ......................................................................................................................................98
Appendix A: Engine Component Drawings ..................................................................................99
Appendix B: Thrust Chamber Assembly Drawings ....................................................................109
Appendix C: Test Facility and Engine P&ID ..............................................................................112
Appendix D: UNC and UNF Bolt Diameter and Area Table ......................................................114
Appendix E: SAE Specification for Steel Bolts ..........................................................................115
Vita 116

ix
List of Tables
Table 2.1 Engine Requirements ...................................................................................................... 4 Table 2.2 Engine Derived Requirements ........................................................................................ 5 Table 2.3 Injection Resistance of Propellant Flow Area at Different Thrusts .............................. 12 Table 2.4 Summary of Injector Design ......................................................................................... 13
Table 2.5 Injector Pressure Drop Calculation Results .................................................................. 21 Table 2.6 Torch Igniter Operating Conditions and Limitations ................................................... 22 Table 2.7 CROME Chamber Parameters ...................................................................................... 27 Table 2.8 Thrust Chamber Assembly Interface Specifications .................................................... 33 Table 2.9 Acoustic Cavity Orientation and Required Length Table ............................................ 40
Table 2.10 Copper Washer Displacement Experiment Results .................................................... 42 Table 3.1 Tank Flange Assembly Interface Specifications .......................................................... 54
Table 3.2 Facility Venturi Specifications ..................................................................................... 60 Table 3.3 Fuel Film Cooling at 30% Fuel Flow ........................................................................... 64 Table 3.4 Parameters Used for Determining Head Loss ............................................................... 67 Table 4.1 Fluids Used During Test Campaign.............................................................................. 72
Table 4.2 CROME Hot-Fire Testing Redlines ............................................................................. 89

x
List of Figures
Figure 2.1 Engine Component Assembly Cross Section and Isometric View ............................... 4 Figure 2.2 Fuel Film Cooling Injection Orifice Locations and Injection Orientation .................... 7 Figure 2.3 Effect of Nozzle Flow on Thrust F [1] .......................................................................... 9 Figure 2.4 Simplified Sketch of Exhaust Gas Behavior of Nozzle Flow [3] ................................ 10
Figure 2.5 Pintle Injection Spray Behavior................................................................................... 11 Figure 2.6 Injector Assembly Section View ................................................................................. 13 Figure 2.7 Injector Assembly Exploded View .............................................................................. 14 Figure 2.8 Pintle Tip Image .......................................................................................................... 15 Figure 2.9 Injector Water Test Setup ............................................................................................ 17
Figure 2.10 Water Tank Pressurization System ............................................................................ 18 Figure 2.11 Water Tank Connection to System ............................................................................ 19
Figure 2.12 Water Flow Through the Pintle Annulus................................................................... 20 Figure 2.13 Torch Igniter Hot Fire Test (Pc = 150 psia and MR = 2) .......................................... 23 Figure 2.14 Igniter Position and Orientation on Thrust Chamber ................................................ 23 Figure 2.15 Elements of a Cylindrical Combustion Chamber ...................................................... 26
Figure 2.16 Bell-Shaped Nozzle and Parameter Profile [1] ......................................................... 29 Figure 2.17 RPA Generated Engine Hot-wall Profile .................................................................. 30
Figure 2.18 Exploded View and Seal Placement of Thrust Chamber Assembly ......................... 32 Figure 2.19 Lock Nut Bolt and Oval Lock Nut ............................................................................ 36 Figure 2.20 Thrust Chamber Assembly Image ............................................................................. 37
Figure 2.21 Acoustic Cavity Orientation ...................................................................................... 39 Figure 2.22 Thermocouple Hole Placement on Thrust Chamber ................................................. 43
Figure 2.23 Isometric View of the Thrust Chamber with the Pc Pressure Transducer ................ 45 Figure 2.24 Engine Module Assembly ......................................................................................... 48
Figure 3.1 Propellant Run Tanks .................................................................................................. 50 Figure 3.2 Tank Load Cell Assembly ........................................................................................... 51 Figure 3.3 Tank Flange/Blind Flange Assembly .......................................................................... 53
Figure 3.4 Compressed Tank Flange Gasket ................................................................................ 53 Figure 3.5 Fuel Tank Assembly .................................................................................................... 54
Figure 3.6 Venturi Internal Geometry .......................................................................................... 59 Figure 3.7 Compression Union and Tee Orifice Assemblies ....................................................... 63 Figure 3.8 Cryogel Z Insulation Installed on Industrial LNG Piping System .............................. 69
Figure 4.1 LNG Micro-Fueler....................................................................................................... 74 Figure 4.2 Engine Throat Plug Assembly ..................................................................................... 76 Figure 4.3 Engine Throat Plug Installed Cross Section ................................................................ 77

1
Chapter 1: Introduction
1.1 WHY METHANE?
The development of liquid oxygen/liquid methane (LOX/LCH4) propulsion systems has
recently become a topic of interest ever since this particular propellant combination was
determined to be a suitable candidate for use in space exploration. Although methane provides a
lower specific impulse (ISP) as compared to hydrogen, it has a higher density and saturation
temperature, which makes it easier to store and requires smaller propellant tanks (i.e. it decreases
vehicle mass). However, the most interesting advantage of methane, from a space travel
perspective, is that this particular propellant combination can be produced from local sources via
in-situ resource utilization (ISRU). Recent robotic missions to Mars have reported the presence of
water ice in subsurface deposits. The water ice deposit can be mined to extract hydrogen and
oxygen that can be used for the production of propellants (i.e. LOX and LCH4), as well as drinking
water and oxygen for life support systems [2].
Current aerospace companies developing LOX/LCH4 propulsion technologies is SpaceX
with its 440,000 lbf LOX/LCH4 Raptor Engine and Blue Origin with its 550,000 lbf LOX/LCH4
BE-4 Engine, which will power the first stage of ULA’s Vulcan rocket. NASA is also developing
LOX/LCH4 propulsion systems; for example, META – 4, a 4000 lbf bi-metallic LOX/LCH4
engine developed at NASA’s Marshall Space Flight Center or the main propulsion system of the
project Morpheus, a lunar lander, which was developed at NASA’s Johnson Space Flight Center.
It is clear that a large portion of spaceflights future will consist of LOX/LCH4 propulsion systems,
but presently there have been no LOX/LCH4 spaceflight engines.
The Center for Space Exploration and Technology Research (cSETR) at the University of
Texas at El Paso (UTEP) is currently working towards developing LOX/LCH4 propulsion

2
technology. One of the main objectives for the center is to design and develop the fist methane-
fueled propulsion system fired in space. The current LOX/LCH4 propulsion projects working
towards that goal is a gaseous oxygen/methane torch igniter, a 5 lbf reaction control engine (RCE),
and a 500 and 2000 lbf rocket engine. More importantly, these projects serve as a platform for
students to gain knowledge, experience, insight and exposure in the process of engine design,
propellant delivery system design, and engine testing in order to prepare them and equip them with
the relevant skill sets for a future career as an aerospace/propulsion engineer.
1.2 SCOPE OF THESIS
This thesis will focus on detailing the engine design. It will review the major components
that comprise the engine and discuss the thought process of the design parameters chosen. It will
not however give a full background or theoretical rocket engine review.
Furthermore, it will discuss the design of the D1 Test Facility, which is the horizontal test
stand that will be used to hot-fire test CROME. The selection of components and their details will
be discussed as well as how components were sized (e.g. orifices and pressure relief valves).
Lastly, the test campaign and its goals will be detailed. Hot-fire test matrixes and expected
results will be shown and an explanation on how to reduce test data will be given in the event that
test data is not available or published in this thesis.

3
Chapter 2: Engine Design
2.1 ENGINE OVERVIEW
The Centennial Restartable Oxygen Methane Engine, or CROME, is a pressure-fed
throttleable liquid oxygen and liquid methane engine. It has a throttle ratio of 4:1 with a
corresponding thrust range of 500 – 125 lbf, respectively. CROME is throttled through the main
engine valves. The engine will serve as a viable propulsion system for upper stages that require a
low but throttleable thrust.
CROME is being developed in three stages: D1, D2 and D3. It is currently in the first stage
of its development phase, D1, whose intent is to demonstrate successful and repeatable operation,
validate operating conditions, and characterize the engine performance (i.e. specific impulse and
c* efficiency) at different firing conditions (i.e. MR, Pc, and burn time) through hot-fire testing
the engine at the D1 horizontal test stand located at UTEP’s tRIAc facility. D2, will take the data
and lessons learned from the prior test campaign to design a flight-like engine. Finally, D3, will
be the flight ready engine, which will go through the appropriate qualification testing to be used
as the main propulsion system of a rocket.
The current engine design is a heavy ground test article, which is depicted in figure 2.1. It
features a bolt on injector and chamber, to maintain the ability to closely inspect the hardware
during testing; it has 17 acoustic cavities which will be used to dampen out certain combustion
instabilities, and it has the igniter mounted onto the side of the chamber. It also has three dynamic
pressure transducers which will be threaded off the side of the chamber flange and a pressure
transducer mounted off the side of the chamber to measure chamber pressure, Pc, during a hot-fire
test.

4
Figure 2.1 Engine Component Assembly Cross Section and Isometric View
CROME’s requirements are listed in table 2.1 and derived requirements are in table 2.2.
Table 2.1 Engine Requirements
Requirement Value
Thrust 500 – 125 lbf
Operation / Ambient Pressure Steady State / 12.8 psia
Propellants LOX / LCH4
Max Tank Pressure 425 psig
The engine was required to have a maximum thrust of 500 lbf which could throttle down to 125
lbf to enable vehicle dynamic control during spaceflight. However, since the engine is being tested
at the tRIAc facility it was designed as a sea level engine. The ambient pressure is approximately
12.8 psia according to the altitude of Fabens, Texas. Future modifications can be made to the
engine for spaceflight. This thrust class was selected based on the size of vehicles the engine would

5
be powering; it would also increase the thrust level an order of magnitude larger than what was
previously developed and tested at cSETR.
As aforementioned, the propellants will be liquid oxygen (LOX) and liquid methane
(LCH4). The saturation temperature of LOX & LCH4 is approximately -300 and -260 °F at
ambient pressure, respectively. The design criteria, including materials selection for engine
systems using cryogenic propellants, must consider the very low temperatures involved [1].
Table 2.2 Engine Derived Requirements
Requirement Value
Mixture Ratio 2.7
Fuel Film Cooling (FFC) 30 % of Fuel Flow
Chamber Pressure (Pc) 235 – 70 psia
Component Materials Chamber/Nozzle: Inconel 718
Injector Assembly: Inconel 625
Manifolds and lines: SS 316
Expansion Ratio (ER) ER: 1.7
Table 2.2 outlines the derived requirements of the engine. These engine operational parameters
were chosen such that the original engine requirement would be achieved. They are not universally
the most optimal values for their corresponding requirement but are acceptable for the engine’s
application.
A liquid-bipropellant system, such as CROME, employs two different propellants, an
oxidizer and a fuel. These propellants are fed to the engine (i.e. the injector) where they are
injected, mixed, and atomized in the combustion chamber. The ratio of oxidizer to fuel weight

6
injected and mixed in the chamber is the mixture ratio (MR). Optimum MR is the ratio of oxidizer
weight to fuel weight in a bipropellant combustion chamber that yields maximum performance,
and as a rule of thumb is slightly lower than the stoichiometric MR which is approximately 4 for
a LOX/LCH4 engine [1]. The MR selected for CROME is 2.7, which is not the optimal MR for
this propellant combination but it allows for equal volume tanks. Furthermore, the combustion
temperature at this MR is lower than at the optimum MR, which reduces the cooling requirement.
Liquid oxygen is approximately 2.7 times denser than liquid methane, so when operating at a MR
of 2.7 the volumetric flow rate of fuel and oxidizer required by the engine is the same. Meaning,
that for a specific burn time the volume of propellant expended/required is the same.
As seen in the engine requirements, CROME will be operated as a steady state engine.
Meaning, that it should theoretically be able to run for an infinite duration test or for as long as
propellants are being fed to the engine. In order to operate as a true steady state engine special
consideration must be made, like adequately cooling the combustion chamber/nozzle. Because of
high combustion temperatures (4000 to 6000 °F) and high heat-transfer rates from the hot gases to
the chamber wall, thrust-chamber cooling is a major requirement [1]. This engine is a heavy test
article with a massive chamber and for short-duration hot-fire tests (e.g. 3 – 5 seconds) the heat
will be absorbed by the chamber walls acting as a heat sink. However, to protect the integrity of
the hardware and to achieve long duration test (i.e. tests longer than 5 seconds) a cooling method
must be employed to cool the chamber/nozzle. CROME will be fuel film cooled (FFC). Film
cooling is a cooling method where a thin film of coolant is injected onto the chamber’s hot wall to
act as a thermal barrier between the hot combustion gas and the wall. As the name implies, fuel or
LCH4 will be bled from the engine’s fuel line and injected onto the wall of the chamber as coolant.

7
This cooling method is not the most effective as it decreases the engine’s overall performance (i.e.
specific impulse), but is a very simple way of cooling the chamber.
Figure 2.2 Fuel Film Cooling Injection Orifice Locations and Injection Orientation
As depicted in figure 2.2, there are 17 FFC injection points around the injector faceplate periphery.
The liquid methane that is bled from the main fuel line is delivered to the coolant manifold where
it is injected onto the chamber wall by 17 holes which are drilled at a 20° inclination from the axial
axis. This allows for a smooth transition of the coolant flow onto the chamber wall and thus
forming a thin film. CROME will initially start at a 30% FFC, per recommendations made by
engineers at NASA’s Johnson Space Center. 30% FFC is considered to be a high percentage of
fuel to be used as coolant which should maintain the temperature of the hot wall below the melting
temperature of the chamber. Usually 10 – 15 % is a common amount of FFC, which is why during
initial testing the film cooling percentage will be lowered via changing the FFC orifice while still
delivering adequate coolant to the chamber walls for any given mainstage conditions (i.e. Pc and
burn duration).

8
Chamber pressure (Pc) is a very important parameter for a rocket engine since thrust is
proportional to the chamber pressure for a given engine design. The high-end chamber pressure
(i.e. 235 psia) was chosen for convenience, as it allows for ample pressure drop margin for the
facility, main engine valve, and engine plumbing pressure drop. This chamber pressure and
corresponding thrust level in conjunction with the theoretical thrust coefficient were used to size
the throat of the engine. After the throat diameter was found and fixed the chamber pressure for
different thrust levels were derived. The resulting low end thrust chamber pressure is 70 psia.
As mentioned before, there are many considerations when choosing engine component and
manifolding materials. For instance, the facility lines (i.e. the plumbing) must be compatible in an
oxygen rich environment and have a high corrosion resistance. Furthermore, the material must be
able to withstand a wide variety of temperatures and temperature gradients (i.e. thermal stresses).
As seen in table 2.2, the engine manifold is made out of stainless steel 316, the injector is made
out of Inconel 625 and the chamber/nozzle is made out of Inconel 718. Stainless steel 316 is an
austenitic stainless steel which contains nickel in addition to chromium. It possesses good
cryogenic toughness, good fabricability and weldability, excellent corrosion resistance and
resistance to stress-corrosion cracking, and is compatible with oxygen [1]. Furthermore, it was
selected as the plumbing material because it is relatively cheap and very accessible. Inconel is a
nickel-base alloy which provides superior corrosion resistance, high-temperature oxidation
resistance, and high physical properties. Inconel 625 was the material selected for the injector
because of its superior corrosion resistance, but it is also easier to machine than Inconel 718
because of its reduced hardness and strength. Inconel 718 was the material selected for the thrust
chamber and nozzle because it retains a high strength at elevated temperatures up to 1300 °F and
good weldability. Inconel in general is also relatively cheap and accessible when compared to other

9
common engine materials like monel alloys, electro-deposited nickel or columbium also known as
niobium.
The prime function of a engine nozzle is to convert efficiently the enthalpy of the
combustion gases into kinetic energy and thus create high exhaust velocity of the gas [1]. Nozzles
are generally of the De Laval type which converges from the chamber to the throat and diverges
from the throat to the nozzle exit. The size and shape of the engine nozzle is based largely on its
application. For example, CROME was designed as a sea level engine which means that the nozzle
was sized such that at one of its thrust levels the pressure of the hot gas will be expanded down to
atmospheric pressure (i.e. 12.8 psia). Throttling an engine warrants special consideration when
sizing the nozzle because optimum thrust will only be achieved at one thrust level; that is when pe
= pa. When the exit pressure at the nozzle exit plane is higher than the ambient pressure (i.e. pe >
pa) then the gas is considered under expanded. Conversely, when the exit pressure is smaller than
the ambient pressure (i.e. pe < pa) the gas is considered over expanded. This can be seen in figure
2.4.
Figure 2.3 Effect of Nozzle Flow on Thrust F [1]

10
As depicted in Figure 2.3, being in the over expanded region decreases the thrust generated by the
engine and can induce shock waves in the nozzle at the point of flow separation between the gas
and nozzle wall. Flow separation is undesirable as it produces loads that are potentially destructive.
For this reason, CROME’s nozzle was sized to be optimally expanded at low end thrust, 125 lbf.
Throttling up from low end thrust would result in an under expanded nozzle, which although
reduces performance (i.e. thrust and specific impulse) it is more favorable than operating in the
over expanded region. The resulting expansion ratio (ε), which is the ratio of the nozzle to throat
area is 1.7. With the expansion ratio of 1.7 and Pc of 70 psia the hot gas will be expanded such
that it equals ambient pressure as seen in the center case of figure 2.4.
Under Expansion
Pe > Pa
Optimum Expansion
Pe = Pa
Over Expansion
Pe < Pa
Figure 2.4 Simplified Sketch of Exhaust Gas Behavior of Nozzle Flow [3]
11
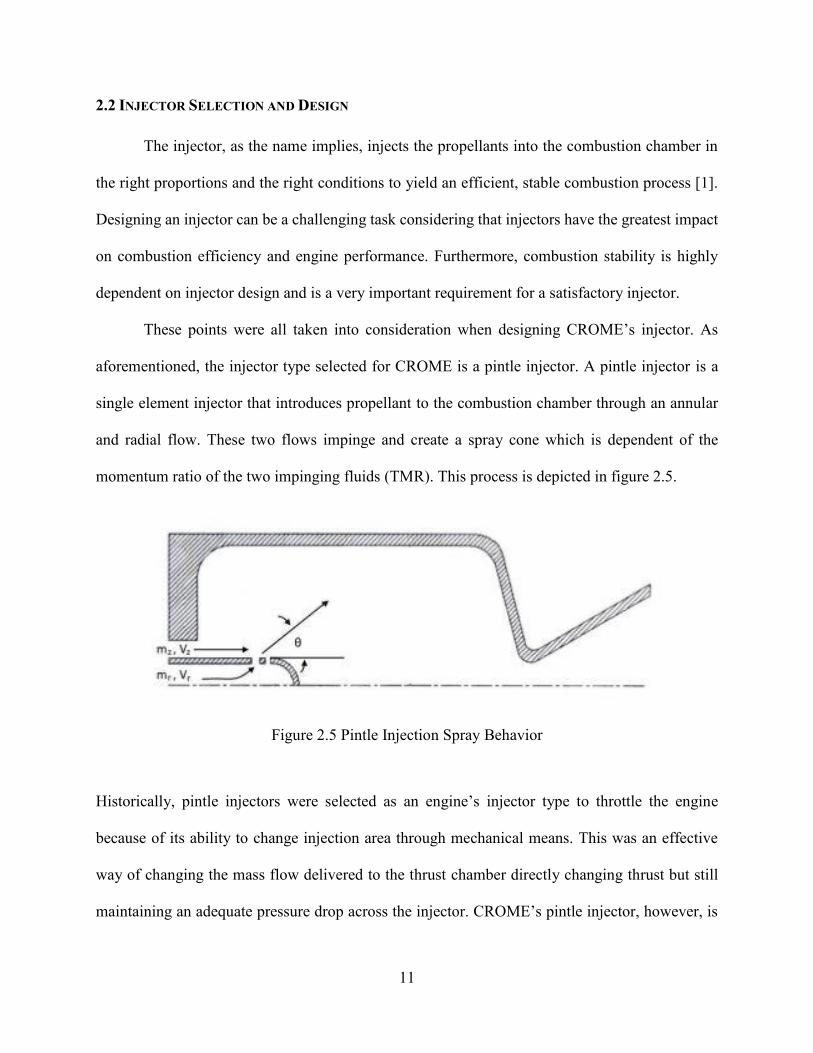
2.2 INJECTOR SELECTION AND DESIGN
The injector, as the name implies, injects the propellants into the combustion chamber in
the right proportions and the right conditions to yield an efficient, stable combustion process [1].
Designing an injector can be a challenging task considering that injectors have the greatest impact
on combustion efficiency and engine performance. Furthermore, combustion stability is highly
dependent on injector design and is a very important requirement for a satisfactory injector.
These points were all taken into consideration when designing CROME’s injector. As
aforementioned, the injector type selected for CROME is a pintle injector. A pintle injector is a
single element injector that introduces propellant to the combustion chamber through an annular
and radial flow. These two flows impinge and create a spray cone which is dependent of the
momentum ratio of the two impinging fluids (TMR). This process is depicted in figure 2.5.
Figure 2.5 Pintle Injection Spray Behavior
Historically, pintle injectors were selected as an engine’s injector type to throttle the engine
because of its ability to change injection area through mechanical means. This was an effective
way of changing the mass flow delivered to the thrust chamber directly changing thrust but still
maintaining an adequate pressure drop across the injector. CROME’s pintle injector, however, is
12
not a variable area injector, it is a fixed area pintle. Throttling of the engine will be achieved by
actuating the engine main valves in the propellant delivery system upstream of the injector.
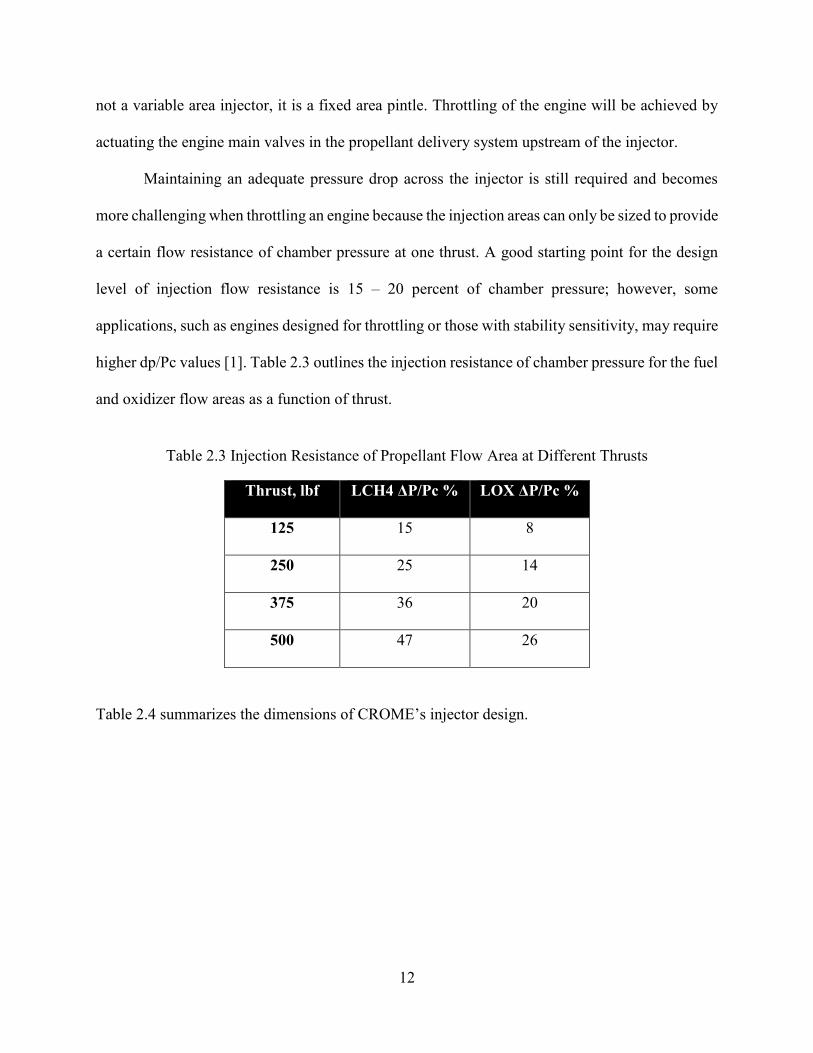
Maintaining an adequate pressure drop across the injector is still required and becomes
more challenging when throttling an engine because the injection areas can only be sized to provide
a certain flow resistance of chamber pressure at one thrust. A good starting point for the design
level of injection flow resistance is 15 – 20 percent of chamber pressure; however, some
applications, such as engines designed for throttling or those with stability sensitivity, may require
higher dp/Pc values [1]. Table 2.3 outlines the injection resistance of chamber pressure for the fuel
and oxidizer flow areas as a function of thrust.
Table 2.3 Injection Resistance of Propellant Flow Area at Different Thrusts
Thrust, lbf LCH4 ΔP/Pc % LOX ΔP/Pc %
125 15 8
250 25 14
375 36 20
500 47 26
Table 2.4 summarizes the dimensions of CROME’s injector design.

13
Table 2.4 Summary of Injector Design
Injector Parameter Value
LOX Pintle O. D 0.375
LOX Pintle I.D 0.25
LOX Hole Diameter, in 16 x 0.062
LOX Flow Area (radial flow), in^2 0.049
LCH4 Annulus Width, in 0.02
LCH4 Flow Area (annular flow), in^2 0.022
FFC Hole Diameter, in 17 x 0.031
FFC Flow Area, in^2 0.013
Injection TMR 1.35
Propellant Injection Angle, deg 53.5
* Flow areas calculated do not include a Cd value
The injector assembly, seen in figure 2.6 and 2.7, is comprised of two bolted components: the
injector body which houses the fuel and fuel film cooling manifolds and the pintle manifold cap
which is inserted into the injector body and consequently closes out the manifolds.
Figure 2.6 Injector Assembly Section View
Pintle
Injector Body
Pintle Cap
FFC Injection Hole
Annulus
FFC Mfd
Acoustic Cavity
Fuel Mfd

14
Figure 2.7 Injector Assembly Exploded View
The injector body also houses the acoustic cavity tubes, which will be explained in another section.
There are also two Teflon seals between the pintle cap and injector body located between the two
manifolds to prevent any leaks or inappropriate flow communication.
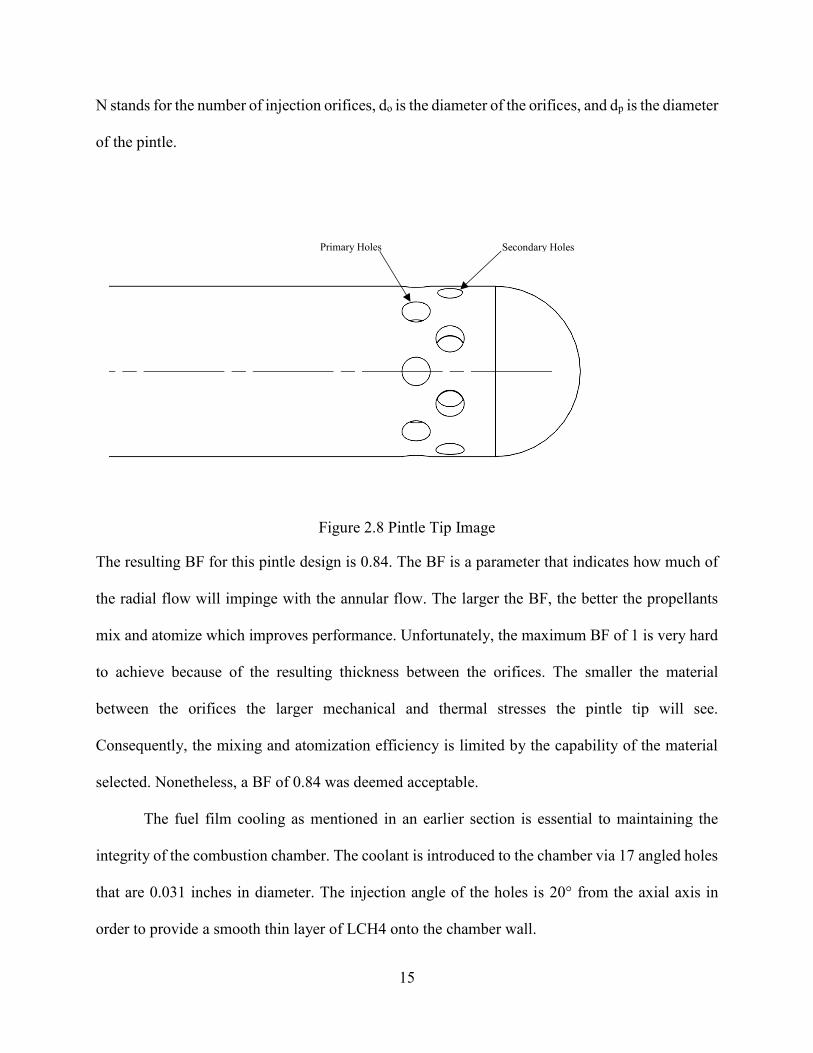
A detailed view of the pintle is shown in Figure 2.8. There are two rows of injection holes
on the pintle: a primary row and a secondary row. The orifices on the second row were staggered
in an effort to increase the blockage factor (BF). The BF is the ratio of the total radial hole diametric
length to the circumference of the pintle post [4]. This is shown in the equation below.
𝑩𝑭 = 𝑵𝒅𝒐
𝝅𝒅𝒑 (2.1)
Injector Body
Acoustic Cavity Tube
Pintle Cap
Face/Gasket Seal
15
N stands for the number of injection orifices, do is the diameter of the orifices, and dp is the diameter
of the pintle.
Figure 2.8 Pintle Tip Image
The resulting BF for this pintle design is 0.84. The BF is a parameter that indicates how much of
the radial flow will impinge with the annular flow. The larger the BF, the better the propellants
mix and atomize which improves performance. Unfortunately, the maximum BF of 1 is very hard
to achieve because of the resulting thickness between the orifices. The smaller the material
between the orifices the larger mechanical and thermal stresses the pintle tip will see.
Consequently, the mixing and atomization efficiency is limited by the capability of the material
selected. Nonetheless, a BF of 0.84 was deemed acceptable.
The fuel film cooling as mentioned in an earlier section is essential to maintaining the
integrity of the combustion chamber. The coolant is introduced to the chamber via 17 angled holes
that are 0.031 inches in diameter. The injection angle of the holes is 20° from the axial axis in
order to provide a smooth thin layer of LCH4 onto the chamber wall.
Primary Holes Secondary Holes

16
The design of an injector can be improved by proper application of experimental results
obtained in nonreactive testing (cold-flow) …. much valuable information can be obtained at
considerably lower cost and risk by use of nonreactive techniques (e.g. water flow testing) [1].
Water testing of the injector took place at the tRIAc test facility and was conducted to characterize
the flow resistance (i.e. the discharge coefficient, Cd) of the fuel and oxidizer flow area. The Cd is
a measure of flow performance versus the theoretical flow through an orifice or flow area and is
always lower than 1. Ideally both flow areas would have been tested at the same time and the
resulting spray cone could have been visually evaluated with a camera system but because of time
constraints each flow area was individually tested only to obtain flow resistance data. Various
injector inlet pressures were tested to obtain a wide variety of discharge coefficients and were
averaged for a nominal Cd value of the flow area. Also, it is important to note that the fuel film
cooling flow area was not tested since the FFC orifices had not yet been acquired. Figure 2.9
depicts the system that was used to water test the injector.

17
Figure 2.9 Injector Water Test Setup
The system utilized a 10-gallon water tank that was pressurized with GN2 to achieve the required
injector inlet pressure. The GN2 was regulated from the nitrogen k-bottle and hard lined into the
tank as depicted in figure 2.10.

18
Figure 2.10 Water Tank Pressurization System
19
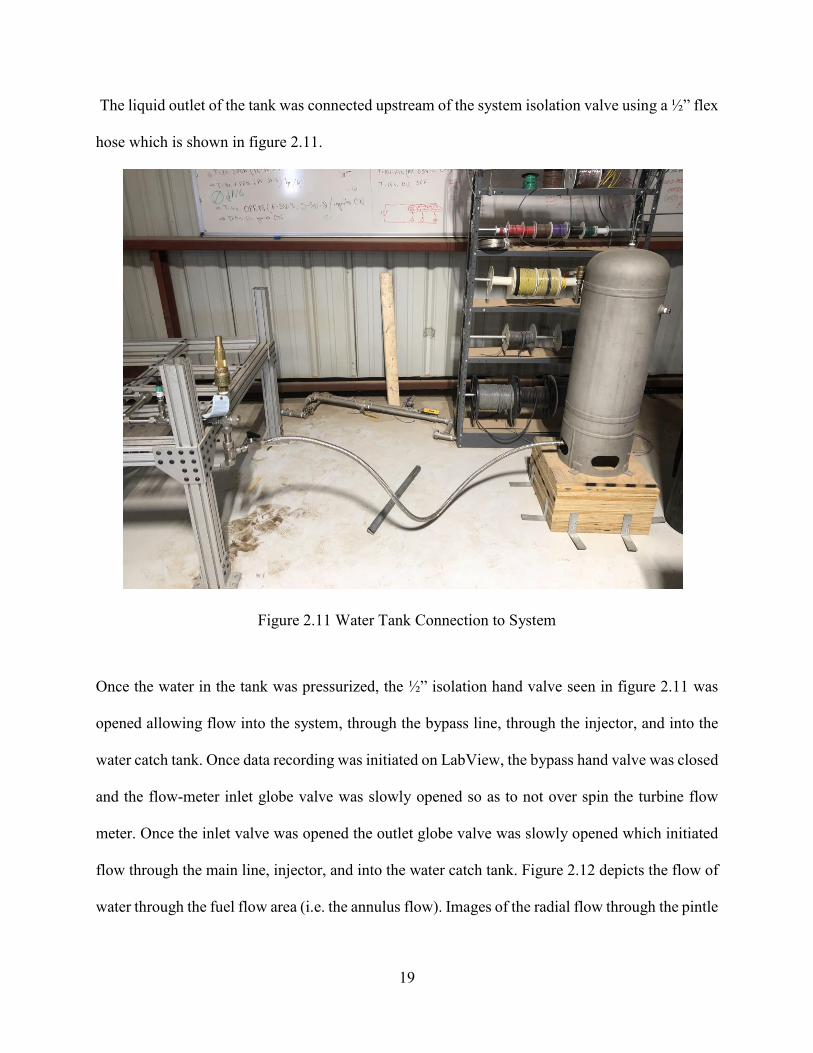
The liquid outlet of the tank was connected upstream of the system isolation valve using a ½” flex
hose which is shown in figure 2.11.
Figure 2.11 Water Tank Connection to System
Once the water in the tank was pressurized, the ½” isolation hand valve seen in figure 2.11 was
opened allowing flow into the system, through the bypass line, through the injector, and into the
water catch tank. Once data recording was initiated on LabView, the bypass hand valve was closed
and the flow-meter inlet globe valve was slowly opened so as to not over spin the turbine flow
meter. Once the inlet valve was opened the outlet globe valve was slowly opened which initiated
flow through the main line, injector, and into the water catch tank. Figure 2.12 depicts the flow of
water through the fuel flow area (i.e. the annulus flow). Images of the radial flow through the pintle

20
were not taken as the injector was submerged into the water catch tank since the flow is injected
radially and would otherwise have made a mess within HQ.
Figure 2.12 Water Flow Through the Pintle Annulus
The data from this test was reduced using NI DIAdem. The injector inlet pressure, flow-meter inlet
pressure, ambient reference temperature, flow-meter inlet temperature and flow-meter volumetric
flow data was plotted. From this plot, average values were taken during the time that water was
delivered through the main line and the flow-meter was measuring flow (i.e. during the actual test).
The flow-meter inlet temperature and pressure were used to obtain the density of water at the flow-
meter inlet and used in the calculation for the mass flow. The injector inlet pressure and reference

21
ambient pressures were used to calculate the pressure drop across the injector and in conjunction
with the known flow area and mass flow the discharge coefficient was obtained. This data
reduction process was conducted for each data point (i.e. different injector inlet pressures)
executed on the fuel and oxidizer flow area. The resulting nominal discharge coefficient obtained
for the fuel and oxidizer flow area is 0.72 and 0.59, respectively. Since the FFC flow area was not
tested a discharge coefficient of 0.6 will be assumed. These Cd values are very common for sharp
edged orifices.
Since the injector flow area resistances have been characterized a more representative
pressure drop across the manifolds were calculated assuming the mass flow and the state of the
propellant. Table 2.5 summarizes the pressure drops across the injector that were calculated using
the experimentally obtained discharge coefficients.
Table 2.5 Injector Pressure Drop Calculation Results
Parameter Values
Thrust, lbf 125 250 375 500
Pc, psia 70 125 180 235
Fuel Flow (lbm/s) 0.18 0.31 0.45 0.59
FFC Flow (lbm/s) 0.054 0.093 0.135 0.177
LOX Flow (lbm/s) 0.48 0.85 1.22 1.59
LCH4 Cd 0.72
LOX Cd 0.59
FFC Cd 0.6
LCH4 Density (lbm/ft^3) 24 24 24 24
LOX Density (lbm/ft^3) 66 66 67 67
LCH4 deltaP (psi) 12 35 74 127
LOX deltaP (psi) 9 29 60 102
FFC deltaP (psi) 5 13 28 47

22
LCH4 deltaP/Pc 17 28 41 54
LOX deltaP/Pc 13 23 33 43
FFC deltaP/Pc 6 10 16 20
This data along with the engine manifold pressure drop data was used to determine the required
main engine valves downstream pressure.
2.3 ENGINE IGNITION SYSTEM
All ignition methods particularly those for bipropellant systems, have one overriding
requirement in common: rapid reliable ignition of incoming propellants before accumulation of
reactive material [1]. If the ignition system does not operate reliably and upon command the
propellant mixture will fill the combustion chamber and cause a hard start upon ignition.
The ignition system selected for CROME is the cSETR torch igniter. This igniter has been
previously tested and qualified at a wide range of operating conditions. Table 2.6 summarizes the
igniter’s operating conditions and limitations. Furthermore, it has been successfully used as the
main ignition system in other projects within cSETR, thus increasing the confidence of the system
to be used as CROME’s ignition source. Figure 2.13 depicts the torch igniter during a hot-fire test.
Table 2.6 Torch Igniter Operating Conditions and Limitations
Igniter Parameter Value
Inlet Valve Pressure 120 - 200
Chamber Pressure (Pc), psia 80 - 150
Total Mass flow, lbm/sec 0.01 – 0.02
Mixture Ratio, MR 1 - 3
Maximum Burn Time, sec 5
Igniter Body Temperature, °F -185 - 1000
Flame Length, inches 3 - 14

23
The igniter is mounted onto the side of the thrust chamber via a welded adapter. It uses an off the
shelf spark plug to ignite small flows of gaseous methane and oxygen that results in a torch passing
through the tube adapter and into the chamber, which then ignites the propellant mixture delivered
by the injector. The igniter adapter is angled 10 degrees from the horizontal so that the flame
exiting the adapter impinges with the propellant mixture sooner than if it was mounted
perpendicular to the chamber at the same axial location.
Figure 2.13 Torch Igniter Hot Fire Test (Pc = 150 psia and MR = 2)
Figure 2.14 depicts the positioning of the igniter onto the chamber
Figure 2.14 Igniter Position and Orientation on Thrust Chamber

24
The operation and sequencing of the igniter will be discussed in a later chapter.
2.4 COMBUSTION CHAMBER & NOZZLE DESIGN
The thrust chamber undeniably embodies the essence of rocket propulsion: the acceleration
and ejection of matter, the reaction to which imparts propulsive force to the vehicle [1]. The thrust
chamber is a pressure vessel whose purpose is to contain the injection of propellants while they
mix, atomize, and vaporize; that mixture is then ignited causing the gaseous products of the
combustion process to pass towards the throat, where they are accelerated to sonic, and then to
supersonic velocities within the diverging nozzle section, and are finally ejected [1]. This section
will outline how the combustion chamber and nozzle was designed and what design criteria was
used in the process.
The chamber is responsible for containing the turbulent combustion gasses but also to
completely burn the propellant mixture in a relatively short or small volume. Moreover, during
this process shocks and detonation waves, known as combustion instabilities, can be generated by
local disturbances of the combustion chamber. It is imperative that the profile of the
chamber/nozzle be designed so that instability not be generated but also so that complete
combustion is achieved, which directly affects the performance of the engine. If the propellant
droplets are not completely vaporized or burnt then the residing chemical energy will not be
transferred to kinetic energy, which would lower the thrust produced by the engine and reduce its
performance (i.e. specific impulse).
Stay time, also known as residence time, is the time required for the propellants to
completely mix and burn within the combustion chamber. The achieved stay time within a
combustion chamber is a function of the chamber volume (Vc), propellant mass flow rate (Wtc),

25
and the average specific volume (V). The required stay time is a parameter that is hard to quantify;
instead, L* (pronounced L – star) a useful parameter relative to volume chamber and residence
time is used. When L* increases the performance of the engine c* and consequently specific
impulse also increases up to a maximum. However, increasing L* will also increase the chamber
volume and weight, which increases the required amount of cooling required to cool the chamber.
The L* used to size the volume of CROME’s chamber was selected based on a recommended range
of values from engineers at JSC whom were also working on a similar size LOX/LCH4 rocket
engine. The recommended L* range was 20 to 30. The selected L* value for the determination of
the chamber’s volume was 22. This value was within the range recommended and would yield a
smaller chamber volume (i.e. smaller surface area) directly reducing the amount of coolant
required to cool the chamber during a hot-fire test. The trade-off here was selecting a small L*
which consequently would reduce engine performance, but conversely would increase
performance because a smaller chamber requires less coolant. The resulting chamber volume when
using an L* of 22 and the chambers throat diameter of 1.46 inches was approximately 36 inches
cubed.

26
Figure 2.15 Elements of a Cylindrical Combustion Chamber
As seen from Figure 2.15, the chamber volume (Vc) is the volume from plane I to plane II.
The diameter of the chamber, also known as the barrel section of the chamber, was determined
based on the minimum diameter needed to accommodate for the injector and its features.
CROME’s chamber diameter is 3.5 inches, resulting in a contraction ratio of 5.75. The contraction
ratio is the area ratio of the combustion chamber to the throat and can be seen in the equation 2.2.
𝜺𝒄 = 𝑨𝒄
𝑨𝒕 , (𝒊𝒏) (2.2)
The contraction angle (θ) was arbitrarily selected to be 45 degrees. The approximate chamber
volume can also be calculated with equation 2.3.
𝑽𝒄 = 𝑨𝒕 [𝑳𝒄𝜺𝒄 +𝟏
𝟑√𝑨𝒕
𝝅𝐜𝐨𝐭 𝜽 (𝜺𝒄
𝟏
𝟑 − 𝟏)] , (𝒊𝒏𝟑) (2.3)

27
Where Vc is the chamber volume, At is the throat area, Lc is the chamber cylindrical length, εc is
the contraction ratio and θ is the contraction angle. The total length of the chamber, 4.75 inches,
was selected based on chamber length relationships used in a scaling program. The resulting
chamber cylinder length and the converging cone frustrum of the nozzle is 2.77 and 1.98 inches,
respectively. The combustion chamber parameters are summarized in table 2.7.
Table 2.7 CROME Chamber Parameters
Chamber Parameter Value
Overall Chamber Length, in 4.75
Overall Length, in 5.2
Volume from injector face to throat, in3 36
L*, in 22
Chamber Diameter (Dc), in 3.5
Throat Diameter (Dt), in 1.46
Nozzle Exit Diameter (De), in 1.9
Cylindrical Chamber Area (Ac), in2 9.6
Throat Area (At), in2 1.7
Nozzle Exit Area (Ae), in2 2.8
Contraction Ratio, Ac/At 5.75
Expansion Ratio, Ae/At 1.7
As seen from table 2.7, the throat diameter of the engine is 1.46 inches. The throat was sized by
using the following expressions.
𝑭𝒕 = 𝑨𝒕𝑷𝒄𝑪𝒇 → 𝑨𝒕 = 𝑭𝒕
𝑷𝒄𝑪𝒇 , (𝒊𝒏𝟐) (2.4)
Ft is the thrust generated by the engine, At is the area of the throat, Pc is the chamber pressure, and
Cf is the thrust coefficient. At full thrust (i.e. 500 lbf) a Pc of 235 psia was selected, which would
28
allow sufficient pressure drop margin between the propellant tank and the engine. The thrust
coefficient is a parameter that measures the thrust augmentation of the engine by using a nozzle to
further expand the combustion gas. The expression for Cf is shown in equation 2.5.
𝑪𝒇 = 𝑭𝒕
𝑨𝒕𝑷𝒄= √𝟐 𝒌𝟐
𝒌−𝟏(
𝟐
𝒌+𝟏)
𝒌+𝟏
𝒌−𝟏[𝟏 − (
𝑷𝒆
𝑷𝒄)
𝒌−𝟏
𝒌] + (
𝑷𝒆−𝑷𝒂
𝑷𝒄)
𝑨𝒆
𝑨𝒕 (2.5)
Using a software package called Chemical Equilibrium Analysis (CEA), the
thermodynamic properties of the hot gas were obtained by specifying the mixture ratio of the
propellants and the desired chamber pressure. With these parameters Cf was obtained using the
far-right expression in equation 2.5 which is only dependent of the specific heat ratio (k), the
chamber pressure, ambient pressure and expansion ratio (ε).
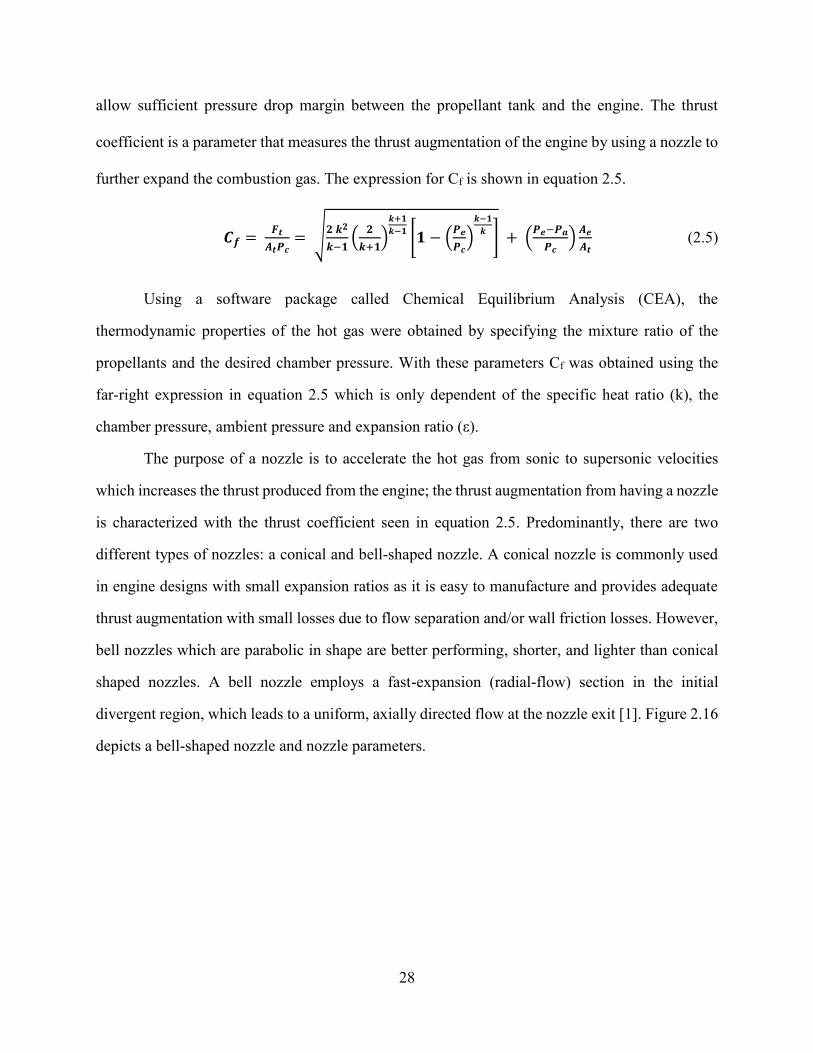
The purpose of a nozzle is to accelerate the hot gas from sonic to supersonic velocities
which increases the thrust produced from the engine; the thrust augmentation from having a nozzle
is characterized with the thrust coefficient seen in equation 2.5. Predominantly, there are two
different types of nozzles: a conical and bell-shaped nozzle. A conical nozzle is commonly used
in engine designs with small expansion ratios as it is easy to manufacture and provides adequate
thrust augmentation with small losses due to flow separation and/or wall friction losses. However,
bell nozzles which are parabolic in shape are better performing, shorter, and lighter than conical
shaped nozzles. A bell nozzle employs a fast-expansion (radial-flow) section in the initial
divergent region, which leads to a uniform, axially directed flow at the nozzle exit [1]. Figure 2.16
depicts a bell-shaped nozzle and nozzle parameters.

29
Figure 2.16 Bell-Shaped Nozzle and Parameter Profile [1]
In order to gain higher performance and a shorter nozzle length, a bell-shaped nozzle was selected
for CROME. Originally the nozzle was designed for microgravity conditions (i.e. an expansion
ratio of 30) and was later altered for sea level testing. The nozzle was designed based on an
equivalent 15-deg-half-angle conical nozzle which is commonly used as a standard to specify bell
nozzles. CROME’s nozzle was designed using an 80% fractional nozzle length of the equivalent
15-deg-half angle nozzle. Furthermore, an expansion ratio of 30 was chosen for space flight
engine. This expansion ratio was chosen based on envelope constraints but still provided an
acceptable increase of thrust and specific impulse. From literature, at an expansion ratio of 30 and
an 80% fractional nozzle length (Lf) the initial and exit parabola angles were selected based off of
data provided by literature and are approximately 30 and 13 degrees, respectively. The throat
diameter, expansion ratio, initial and exit parabola contraction ratios were then inputted into RPA
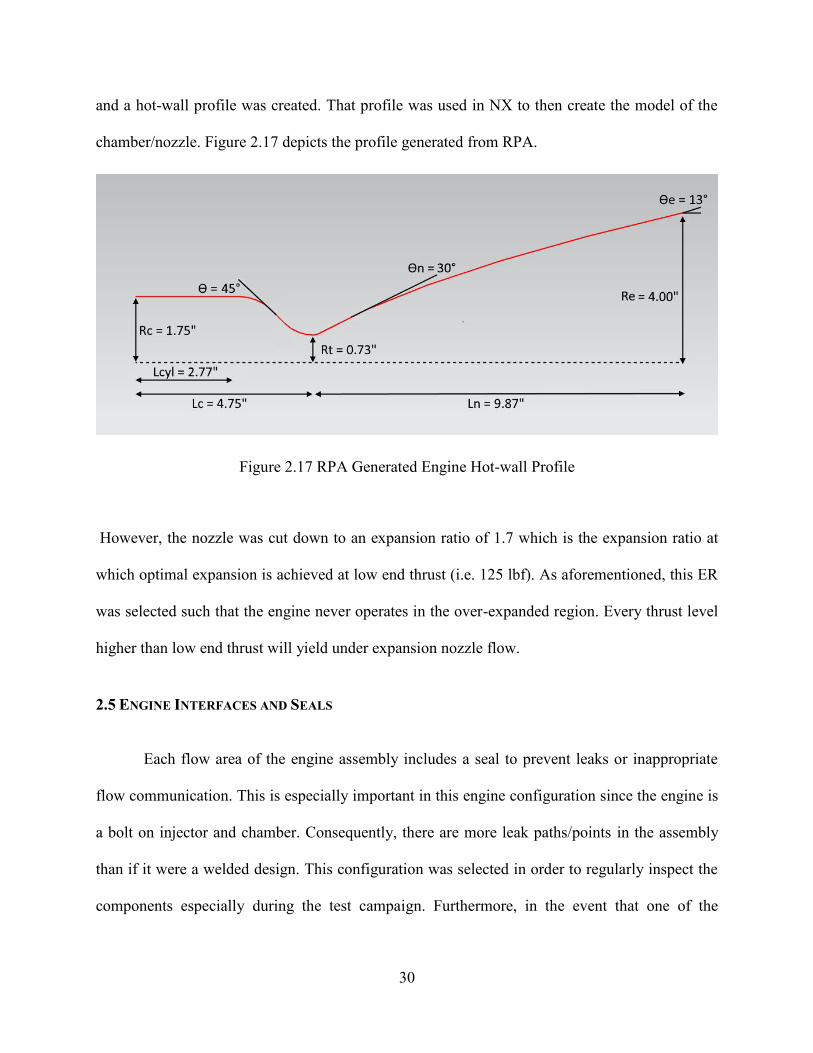
30
and a hot-wall profile was created. That profile was used in NX to then create the model of the
chamber/nozzle. Figure 2.17 depicts the profile generated from RPA.
Figure 2.17 RPA Generated Engine Hot-wall Profile
However, the nozzle was cut down to an expansion ratio of 1.7 which is the expansion ratio at
which optimal expansion is achieved at low end thrust (i.e. 125 lbf). As aforementioned, this ER
was selected such that the engine never operates in the over-expanded region. Every thrust level
higher than low end thrust will yield under expansion nozzle flow.
2.5 ENGINE INTERFACES AND SEALS
Each flow area of the engine assembly includes a seal to prevent leaks or inappropriate
flow communication. This is especially important in this engine configuration since the engine is
a bolt on injector and chamber. Consequently, there are more leak paths/points in the assembly
than if it were a welded design. This configuration was selected in order to regularly inspect the
components especially during the test campaign. Furthermore, in the event that one of the
31
components is damaged it can be replaced with another component, which would not be possible
with a welded design.
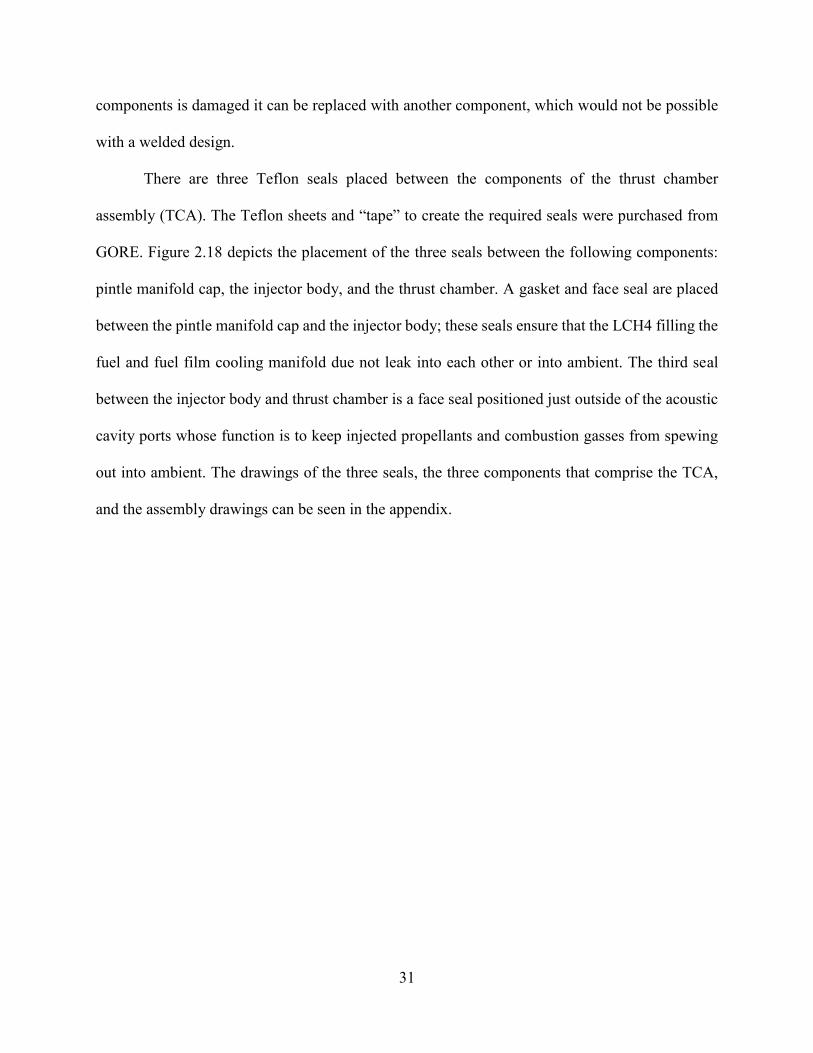
There are three Teflon seals placed between the components of the thrust chamber
assembly (TCA). The Teflon sheets and “tape” to create the required seals were purchased from
GORE. Figure 2.18 depicts the placement of the three seals between the following components:
pintle manifold cap, the injector body, and the thrust chamber. A gasket and face seal are placed
between the pintle manifold cap and the injector body; these seals ensure that the LCH4 filling the
fuel and fuel film cooling manifold due not leak into each other or into ambient. The third seal
between the injector body and thrust chamber is a face seal positioned just outside of the acoustic
cavity ports whose function is to keep injected propellants and combustion gasses from spewing
out into ambient. The drawings of the three seals, the three components that comprise the TCA,
and the assembly drawings can be seen in the appendix.

32
Figure 2.18 Exploded View and Seal Placement of Thrust Chamber Assembly
High-strength bolts hold the thrust chamber and injector assembly together. The corresponding
fastener used, number of fasteners, bolt preload and corresponding torque values can be seen in
table 2.8.
Injector Outer Seal
Injector Gasket
Thrust Chamber
Seal
33
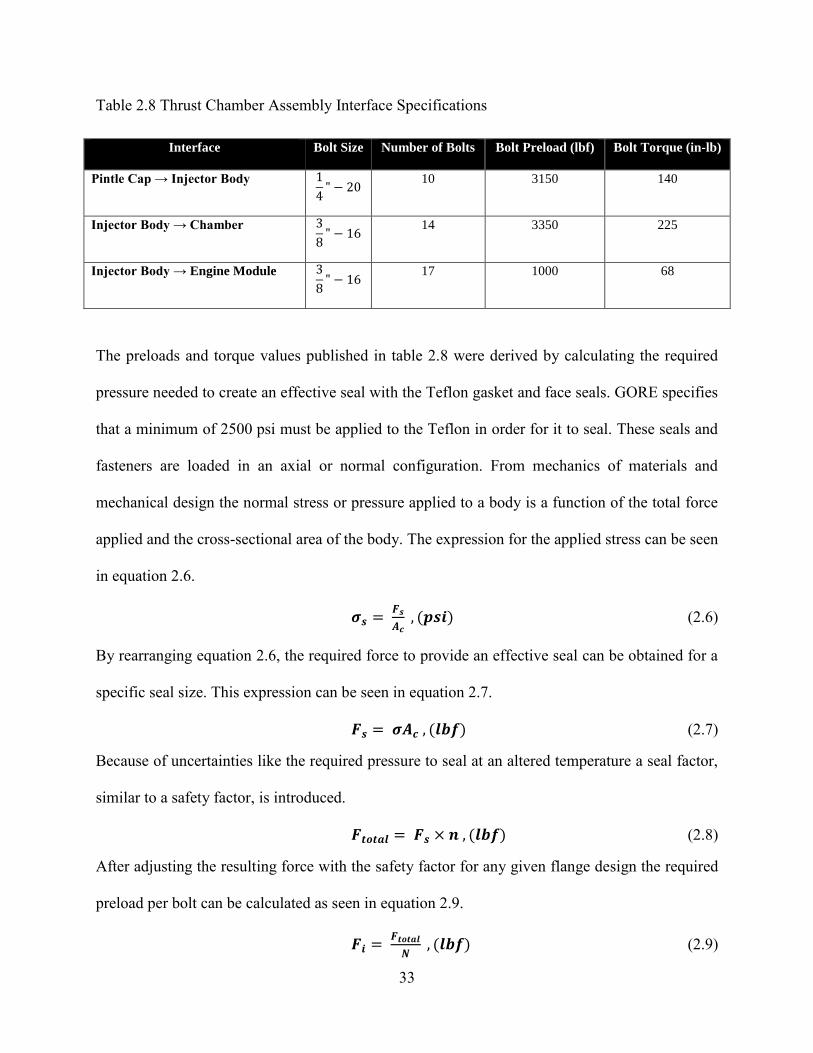
Table 2.8 Thrust Chamber Assembly Interface Specifications
The preloads and torque values published in table 2.8 were derived by calculating the required
pressure needed to create an effective seal with the Teflon gasket and face seals. GORE specifies
that a minimum of 2500 psi must be applied to the Teflon in order for it to seal. These seals and
fasteners are loaded in an axial or normal configuration. From mechanics of materials and
mechanical design the normal stress or pressure applied to a body is a function of the total force
applied and the cross-sectional area of the body. The expression for the applied stress can be seen
in equation 2.6.
𝝈𝒔 = 𝑭𝒔
𝑨𝒄 , (𝒑𝒔𝒊) (2.6)
By rearranging equation 2.6, the required force to provide an effective seal can be obtained for a
specific seal size. This expression can be seen in equation 2.7.
𝑭𝒔 = 𝝈𝑨𝒄 , (𝒍𝒃𝒇) (2.7)
Because of uncertainties like the required pressure to seal at an altered temperature a seal factor,
similar to a safety factor, is introduced.
𝑭𝒕𝒐𝒕𝒂𝒍 = 𝑭𝒔 × 𝒏 , (𝒍𝒃𝒇) (2.8)
After adjusting the resulting force with the safety factor for any given flange design the required
preload per bolt can be calculated as seen in equation 2.9.
𝑭𝒊 = 𝑭𝒕𝒐𝒕𝒂𝒍
𝑵 , (𝒍𝒃𝒇) (2.9)
Interface Bolt Size Number of Bolts Bolt Preload (lbf) Bolt Torque (in-lb)
Pintle Cap → Injector Body 1
4" − 20
10 3150 140
Injector Body → Chamber 3
8" − 16
14 3350 225
Injector Body → Engine Module 3
8" − 16
17 1000 68

34
Where Fi is the required preload per bolt, Ftotal is the total required force needed to be applied to
the seal adjusted with the seal factor (n), and N is the total number of bolts of the flange design.
The torque can be calculated using the relationship in equation 2.10
𝑻 = 𝒌𝑫𝒃𝑭𝒊 , (𝒊𝒏 − 𝒍𝒃𝒇) (2.10)
The T is the corresponding torque, k is a torque factor (k = 0.18 for lubricated bolts), Db is the
nominal size of the fastener being used, and Fi is the preload per bolt required. For example, the
interface between the injector body and thrust chamber is a flanged interface with 14 bolts. The
required sealing pressure used was 4000 psi, a seal factor of 1.2 was used, and the cross section of
the seal is approximately 7 in2. Using the process shown above, the resulting preload (Fi) required
per bolt is 3, 350 lbf and the corresponding torque value is approximately 225 in-lbs or 19 ft-lbs.
However, the possibility of failure of the bolts under these preloads must also be taken into
consideration. The bolt strength is specified by stating SAE or ASTM minimum quantities, the
minimum proof strength, or minim proof load, and the minimum tensile strength. The proof load
is the maximum load (force) that a bolt can withstand without acquiring a permanent set. The
expression for proof load can be seen in equation 2.11 and is a function of the minimum proof
strength and the tensile-stress area.
𝑭𝒑 = 𝑺𝒑𝒓𝒐𝒐𝒇𝑨𝒕 , (𝒍𝒃𝒇) (2.11)
The proof load is the maximum force that a bolt loaded in a tensile stress state can take. Meaning,
if the required preload per bolt exceeds the maximum proof load of the bolt being used then it will
obtain a permanent set. The proof strengths and tensile stress areas used to calculate the failure
criteria of the bolts used in the TCA are shown in the appendix. A helpful parameter when
determining whether a bolt can sustain a preload is by calculating the percent proof which is the
ratio between the applied force and the maximum proof load. This is shown in equation 2.12.

35
% 𝑷𝒓𝒐𝒐𝒇 𝒍𝒐𝒂𝒅 = 𝑭𝒊
𝑭𝒑 × 𝟏𝟎𝟎 (2.12)
The percent proof load for the example discussed above is 30 percent; meaning, that the bolts are
no where near their maximum load capacity. This is usually a good indication that the nominal
size of the bolt can be reduced to a smaller bolt and/or the number of bolts in the flange design can
be reduced. Reducing the bolt size reduces the cost of the specific fastener and reducing the number
of bolts reduces the time it takes to disassemble and re-assemble any given interface. However,
when you reduce the number of bolts on a flange you also reduce how evenly distributed the load
is being applied to the seal and component. A trade-off must be made between the time it takes to
assemble the bolted interface versus how effective the interface seals. For CROME, the
effectiveness of the seal was the design driver. Furthermore, because the percent proof load is so
low it can be augmented further (i.e. increase the torque on the fastener) if it leaks at the time the
engine is leak checked. If a smaller fastener is used for the same flange design then the % proof
load will be higher and consequently there will be less margin to increase the torque if the interface
leaks.
Another issue that must be considered when using fasteners on a rocket engine is that when
hot-fired the vibrations of the engine could loosen the clamping force of any given interface;
consequently, causing them to leak. For that reason, the fasteners used to assemble CROME are
wire-locking bolts. These types of bolts are commonly used in engine assemblies since the lock
wire wrapped around the bolts prevent loosening due to high vibrations. The head of the bolt has
two holes that allows for a safety wire or lock wire to be inserted through the bolt head, wrapped
around the bolt, and then fed into another bolt to act as an anchor. When installed properly, the
wire maintains tension between the two bolts which resists the bolts unthreading. This method is
highly visible and easily inspectable indication that the fasteners are properly secured.

36
As seen in table 2.8, CROME has three different interfaces. Two of them are from the TCA
of the components and the third is the interface between the engine and engine module. These
three interfaces will utilize lock wire bolts. However, lock wire bolts work well when used with a
threaded hole, like the pintle manifold cap and injector body interface, but when considering the
usage of the fastener with a through hole and a nut that clamps down on two components the usage
of lock-wire alone is not an effective way of “locking” the bolts. This is because the nuts can also
loosen due to high vibration which reduces the initial clamping force or preload on the bolt. For
this reason, the other two engine interfaces will use a lock-wire bolt and an oval locking nut. An
oval locking nut, unlike nylon-inserted locknuts, can withstand high temperatures and still retain
its locking abilities. An oval locknut, as the name implies, has threads that are shaped like an oval.
Two points on the threads are deformed so that the threads are not perfectly round, but then
plastically stretched when threaded onto the bolt. The plastic deformation of the nut increases the
friction between the nut and the fastener which creates the locking action. Figure 2.19 depicts a
lock-wire bolt and an oval lock nut.
Figure 2.19 Lock Nut Bolt and Oval Lock Nut

37
Figure 2.20 shows the TCA with the lock-wire installed.
Figure 2.20 Thrust Chamber Assembly Image

38
2.6 ENGINE ACOUSTIC CAVITIES
“Combustion instability” is defined in terms of the nature of pressure fluctuations in the
combustion chamber [1]. Combustion instability is classified as low, intermediate, and high
frequencies. The low range frequencies occur at less than 400 Hz and is commonly known as chug.
The intermediate frequencies occur between 400 – 1000 Hz and is known as buzzing. High
frequencies occur at more than 1000 Hz and is known as screeching or screaming; this class of
frequency is by far the most destructive. Furthermore, there are three modes of high frequency
combustion instability: tangential, longitudinal, and radial modes. If not mitigated or dampened,
combustion instabilities can cause destructive vibrations, chamber and instrumentation damage,
and rapid increase in heat flux within the chamber.
Analytical studies and experimental results have indicated that the geometrical
configuration of the combustion chamber governs the frequencies of acoustic modes of
instability…. moreover, with a given injector-element pattern, small-diameter chambers are more
stable than large-diameter chambers [1]. CROME utilizes Helmholtz resonators, a type of acoustic
cavity, which will be used to dampen the 1T, 2T, and 3T high frequency modes. CROME’s
acoustic cavity design consists of 17 tunable cavities. 2 of the cavities have a welded 1/8” bored
through Swagelok fitting which will be used in conjunction with a thermocouple probe to measure
the cavity temperature at different cavity immersion depths. This cavity temperature measurement
will be used to update the analysis that predicted the prevalent combustion frequencies and
corresponding resonant lengths required to dampen them per mainstage condition. The other 15
cavities, as aforementioned, will be used to dampen the 1T, 2T, and 3T combustion modes. Figure
2.21 along with table 2.9 summarizes which cavity will dampen which mode.

39
Figure 2.21 Acoustic Cavity Orientation
1
2
3
4 5 6
7
8
9
10
11
13 14
16
15
17
12

40
Table 2.9 Acoustic Cavity Orientation and Required Length Table
Cavity
Number
Definition Resonant Length
(in)
Bolt Length
(in)
1 1T 1.441 0.242
2 3T 0.650 1.033
3 1T + 5% lr 1.513 0.170
4 2T 0.888 0.795
5 1T - 5% lr 1.369 0.314
6 TC Probe - -
7 1T 1.441 0.242
8 2T - 5% lr 0.844 0.839
9 1T + 5% lr 1.513 0.170
10 1T - 5% lr 1.369 0.314
11 3T - 5% lr 0.618 1.065
12 TC Probe - -
13 1T - 5% lr 1.369 0.314
14 2T + 5% lr 0.932 0.751
15 1T 1.441 0.242
16 3T + 5% lr 0.683 1.000
17 1T + 5% lr 1.513 0.170
As seen from table 2.9, three of the cavities will dampen out the 1T mode, 3 cavities will be used
for dampening a 1T with a ± 5 % change in the resonant length, one cavity will be used to dampen
the 2T and 3T mode, while the remaining four cavities will be used to dampen out the 2T and 3T
mode with a ± 5 % change in the resonant length.

41
The acoustic cavity tubes are threaded into the injector and are tuned to the appropriate
resonant length by threading in a pre-cut bolt. The acoustic cavities will be sealed by a copper
crush washer which will be placed between the acoustic cavity tube and the bolt head of the bolt.
The washer displaces 0.04 inches when the bolt is torqued to 80 in-lbs. The resulting normal stress
felt by the copper washer is approximately 42.2 ksi which is well below the yield strength of
Inconel 625 at 1300 °F but still provides good deformation of the washer contact area between the
bolt and acoustic cavity. Resulting in an effective seal. There is plenty of torque margin between
the current torque selected (i.e. 80 in-lbs) to apply a compressive force on the washer. The
maximum torque that can be applied to this bolt without plastically deforming the acoustic cavity
is 120 in-lbs.
The determination of the bolt length was based on the total cavity length, the required
resonant length, the thickness and deformation of the copper washer at the selected torque (i.e.
preload), and the axial displacement based on the torque selected. An experiment was conducted
to determine the axial displacement of the bolt when applying a torque. Four torques were selected
to visually inspect the copper washer deformation and to measure the angular displacement of the
bolt which is an indication of the axial displacement if the type of bolt is known (i.e. how many
threads per inch). It is common knowledge that when a bolt is torqued one full revolution it
displaces axially by one thread. For example, the acoustic cavity bolt being used is a 5/16 – 24,
which means that the bolt moves axially 0.042” when turned one full revolution. The results and
washer deformation can be seen in table 2.10.

42
Table 2.10 Copper Washer Displacement Experiment Results
Parameter Value
Torque (in-lbs) 30 60 80 100
Angular Displacement (°) 30 40 45 – 50 70 – 75
Copper Washer Displacement
Resulting Normal Stress, psi 15,800 31,600 42,200 52,750
As seen from table 2.10, the image of the copper washer that was torqued to 80 in-lbs
shows a good interference contact on both the bolt and cavity side; thus, making a good seal. From
the angular displacement measured with the angle plate the bolt displaces axially approximately 5
thousandths of an inch (i.e. 0.005). The resulting expression to calculate the required bolt length
can be seen in equation 2.13.
𝒍𝒃 = 𝒍𝒄 − 𝒍𝑹 + 𝒕𝒘 − 𝟎. 𝟎𝟎𝟓 (2.13)
Where lb is the length of the bolt measured from the bottom of the bolt head, lc is the length of the
cavity, lR is the required resonant length, tw is the thickness of the crushed washer, and the 0.005
is the axial displacement of the bolt when torqued.
43
2.7 ENGINE INSTRUMENTATION
A main objective of the first iteration of CROME and the initial test campaign is to characterize
the operating conditions of the engine along a variety of mainstage conditions (i.e. Pc, burn-
duration, FFC %). This will allow for a more refined and accurate analysis of the components and
engine to be executed. This section will outline the instrumentation selected to be used on the
engine to help achieve that objective.
2.7.1 Engine Temperature Measurement Sensors
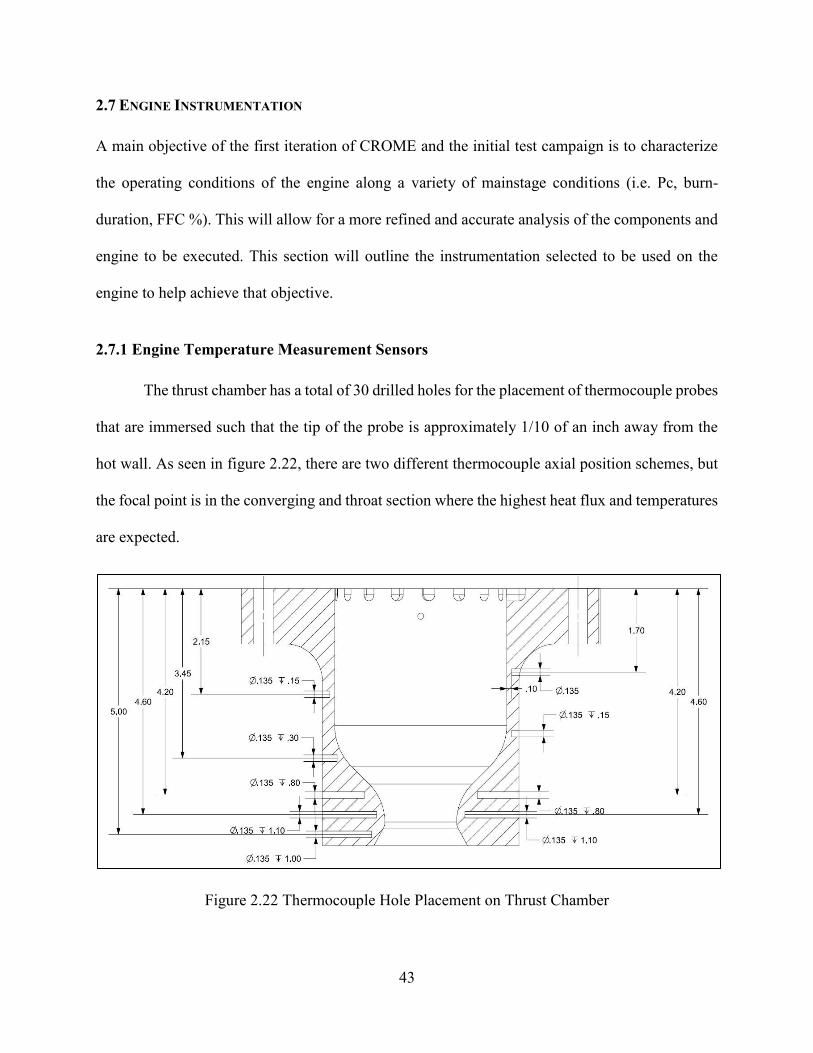
The thrust chamber has a total of 30 drilled holes for the placement of thermocouple probes
that are immersed such that the tip of the probe is approximately 1/10 of an inch away from the
hot wall. As seen in figure 2.22, there are two different thermocouple axial position schemes, but
the focal point is in the converging and throat section where the highest heat flux and temperatures
are expected.
Figure 2.22 Thermocouple Hole Placement on Thrust Chamber

44
Initially, when the thrust chamber was designed and manufactured the eight-inch clearance holes
were included but the mounting method for the TC was not yet selected. Modifications were made
to account for a Swagelok compression fitting that would hold the TCs in place and would allow
for the TC to be swapped out if the sensor is faulty or burns out. Figure 2.16 depicts this
modification and shows the fittings welded to the chamber walls. A quarter inch counter bore was
created at the locations of the already existing eight-inch holes to allow for the fitting to be welded
onto the chamber. Now the TC probes can be swaged such that the tip is touching the hot wall.
This ensures that there is no air pocket between the probe and the hot wall resulting in an accurate
hot wall temperature measurement. However, as seen in figure 2.20 not every eight-inch hole
originally drilled into the chamber has a fitting for the thermocouple. This was due to the size of
the fitting. Regardless, 24 of the original 30 locations will have a TC which will allow for the
procurement of hot-wall temperature data as a function of Pc, film cooling percentage and burn
time.
The data will be used as a reference when determining whether a burn duration for any
given mainstage condition can be increased safely without the possibility of causing damage to the
chamber. It will also be a way of assessing how well or how poor the film cooling is performing.
Also, to mitigate damage to the chamber, the TC measurements will be used as a redline to cut-off
a hot-fire test if it surpasses the maximum allowable operating temperature set (i.e. 1700 °F). This
value was set such that there is sufficient margin between the selected temperature and the melting
temperature of chamber.
45
2.7.2 Engine Pressure Measurement Sensors
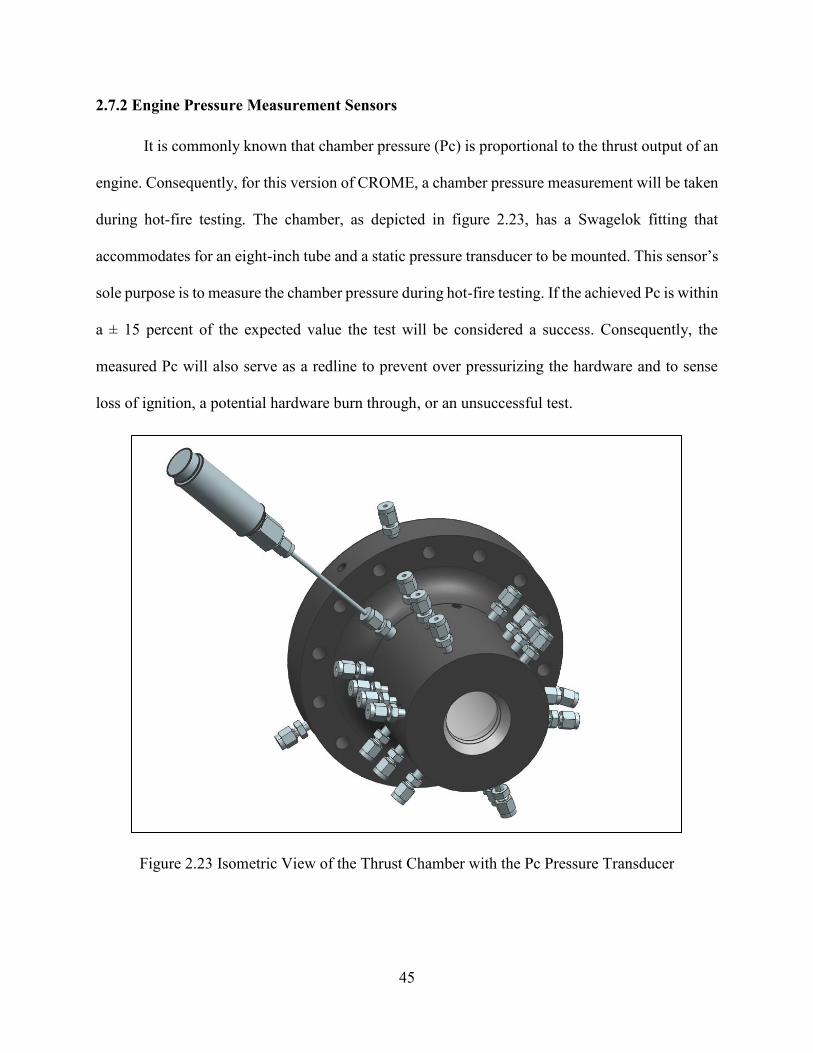
It is commonly known that chamber pressure (Pc) is proportional to the thrust output of an
engine. Consequently, for this version of CROME, a chamber pressure measurement will be taken
during hot-fire testing. The chamber, as depicted in figure 2.23, has a Swagelok fitting that
accommodates for an eight-inch tube and a static pressure transducer to be mounted. This sensor’s
sole purpose is to measure the chamber pressure during hot-fire testing. If the achieved Pc is within
a ± 15 percent of the expected value the test will be considered a success. Consequently, the
measured Pc will also serve as a redline to prevent over pressurizing the hardware and to sense
loss of ignition, a potential hardware burn through, or an unsuccessful test.
Figure 2.23 Isometric View of the Thrust Chamber with the Pc Pressure Transducer

46
A timer will be initiated at the beginning of a hot-fire test so the Pc redline won’t trigger a cut-off
in the event that a hard-start is experienced. A hard-start is an ignition condition where for a short
period of time (i.e. milli-seconds) there is a pressure spike in the chamber which can be as high as
3 to 5 times larger than the expected Pc. The pressure transducer will experience a short transient
in which it does not measure any pressure until the chamber and the eight-inch tubing is filled with
the hot gas. This transient will be characterized during a blow-down or cold flow test.
Combustion in a liquid rocket is never smooth; some fluctuations of pressure, temperature,
and velocity are always present; furthermore, when these fluctuations interact with the natural
frequencies of the propellant feed system or the chamber acoustics, periodic superimposed
oscillations, recognized as instability, occur [3]. Consequently, considerations to mitigate
instability were given when designing the engine components; for example, to mitigate chugg or
low frequency instability the appropriate pressure drop across the injector was selected. Secondly,
acoustic cavities are included in the engine design to dampen out certain modes of high combustion
instabilities. Regardless, there will be three dynamic pressure transducers threaded into the flange
of the combustion chamber to measure high frequencies during a hot-fire test. These transducers
will aid in identifying what frequency modes are prevalent during a hot-fire test and warrant
appropriate mitigations.
2.7.3 Engine Manifold Instrumentation
CROME is designed to be a liquid bi-propellant engine. In order to make that a true
statement, liquid propellants (i.e. sub-cooled propellants) must be delivered to the chamber, which
can be a difficult task to achieve. The saturation temperature of any given propellant is a function
of the operating pressure. The higher the operating pressure the higher (i.e. less negative) the
saturation temperature. If the fluid is below the saturation temperature then it is considered a

47
subcooled liquid. The goal is to deliver the propellants to the engine and into the chamber as a
subcooled liquid. Meaning, that the system must be chilled in such that the lowest required
saturation temperature is achieved. The lowest or coldest saturation temperature is the temperature
of the fluid in the chamber (Pc) since this will be the lowest pressure the fluid will be at before
being mixed, atomized, and burned. In order to ensure that the fluid is at or below that required
temperature there are several points in the engine manifold where temperature and pressure
measurements are taken upstream and downstream of the main engine valves. These locations
along with the required saturated temperature will be used as the success criteria for the facility
chill in and the initialization of a hot-fire test. It is important to note, however, that the engine
dribble volume will not be chilled and consequently their will be a transient where the engine only
receives gaseous propellants while that volume is chilled. The temperature and pressure
measurement upstream of the injector will be used as a reference temperature/pressure
measurement to identify at which point the injector received liquid and not gaseous propellant.
This transient will also be characterized when performing the fuel and oxygen blow downs.
2.8 ENGINE ASSEMBLY
The engine assembly is comprised of the thrust chamber assembly (i.e. the pintle manifold cap,
the injector body, the thrust chamber, and igniter), the main engine valves, the engine plumbing,
the engine module, and all their corresponding instrumentation. Figure 2.21 depicts the entire
engine assembly. This assembly is then mounted onto the thrust stand via twelve three quarter inch
bolts. The plumbing was designed such that the main engine valves are as close to the injector as
possible while still including the instrumentation required to obtain good data during a hot-fire
test. Downstream of the main engine valves is a tee where the engine purge is introduced which
allows for the expulsion of air (i.e. moisture) before introducing cryogenic propellants and for the

48
purging of residual propellants after a hot fire test. Downstream of the engine purge is the reference
pressure and temperature measurement that will be used as indication of propellant injection
quality. Lastly, on the fuel side there is a tee connected to an orifice which bleeds LCH4 to be used
as coolant before the propellants are delivered to the injector for injection into the chamber.
The engine module was modified and although not seen in image 2.24, contains supports
for the main engine valves, the actuators, and the ½” bleed solenoid valves. It also includes two
cross beams upstream of the engine mounting plate and a rectangular tube that runs across the
bottom two columns. This rectangular tube will be used as the module to flexure interface. The
thrust stand includes a flexure which is designed to take the weight of the engine module assembly
off of the load cells sandwiched between the hexagonal plates on the thrust stand.
Figure 2.24 Engine Module Assembly
½” Cryogenic Bleed Solenoid Valves
½” Main Engine Valves / Actuator Assm
Fuel Line Assembly
FFC Line Assembly
¼” Engine Purge
Engine Module
½” Cryogenic Check
Valve
LOX Line Torch Igniter
Assembly

49
Chapter 3: D1 Test Facility
3.1 D1 TEST FACILITY OVERVIEW
The D1 Test Facility is a mobile horizontal test stand. Test facilities in general are used to
transfer/deliver rocket propellants from the tanks to the thrust chamber at the needed flow rates
and pressures [1]. This test facility was designed and built to test CROME and CROME-X.
It is comprised of two trailers: the propellant trailer and the engine trailer. The propellant
trailer, as the name implies, houses two 100-gallon spherical tanks which will be used as the
propellant run tanks, eight 6k gaseous nitrogen bottles which will be used to pressurize the run
tanks (4 per run tank), the gaseous CH4 and O2 required for the ignition system, and two 200 series
nitrogen bottles to be used as the run line purge and igniter active purge fluid. The engine trailer,
as the name implies, houses the thrust stand onto which the engine is mounted to. Furthermore, it
has a large portion of the propellant run line that delivers the propellants to the engine. It is on this
test stand that CROME will be hot-fired on and its performance and limitations characterized. It
was designed as a pressure fed system and will operate in a blow down configuration.
The following sections within this chapter will discuss the selection and expected operation
of components and/or subsystems within the facility.

50
3.2 TANK MANIFOLDING
As stated before, the facility utilizes two 316 stainless steel (SS-316), 100-gallon run tanks
to store and pressurize the propellants during engine testing operations. As seen in figure 3.1, the
spherical run tank is comprised of two flanges welded on the top and bottom of the tank, two
welded lift points, and four tank legs. It has in internal diameter of 36 inches and as aforementioned
a volume of 100 gallons or approximately 13 cubic feet.
Figure 3.1 Propellant Run Tanks
Top Tank Flange
Lift Points
Bottom Tank Flange Tank Legs
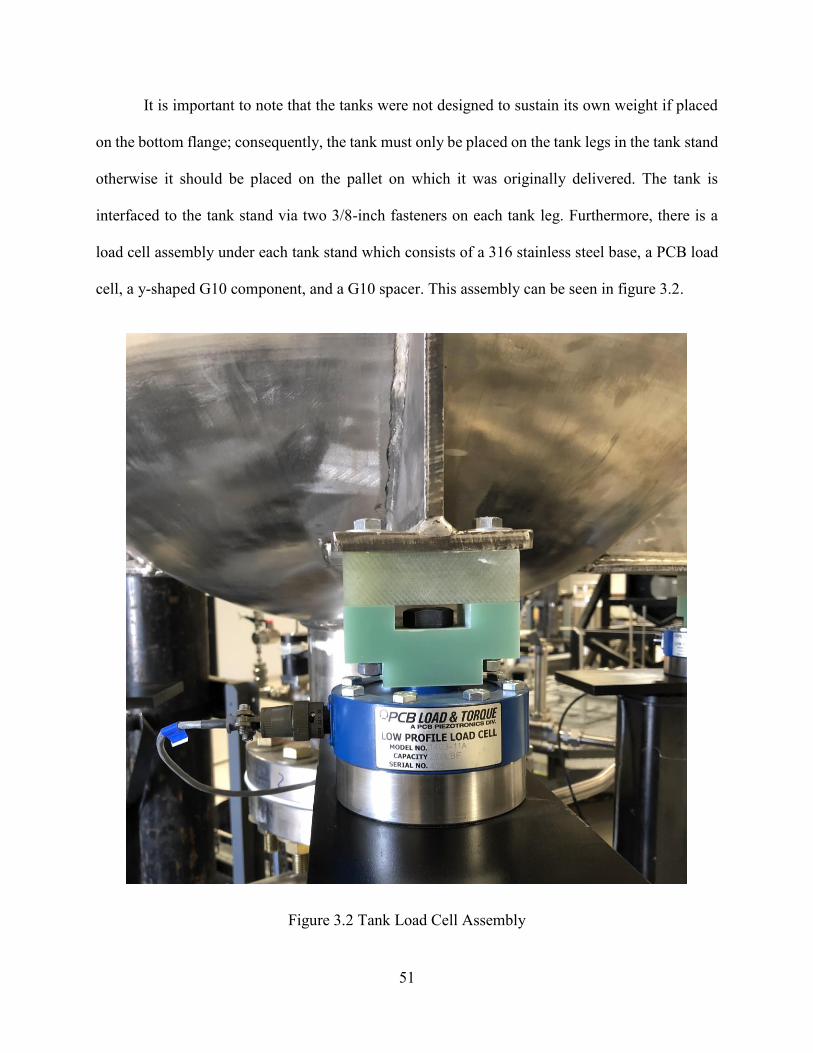
51
It is important to note that the tanks were not designed to sustain its own weight if placed
on the bottom flange; consequently, the tank must only be placed on the tank legs in the tank stand
otherwise it should be placed on the pallet on which it was originally delivered. The tank is
interfaced to the tank stand via two 3/8-inch fasteners on each tank leg. Furthermore, there is a
load cell assembly under each tank stand which consists of a 316 stainless steel base, a PCB load
cell, a y-shaped G10 component, and a G10 spacer. This assembly can be seen in figure 3.2.
Figure 3.2 Tank Load Cell Assembly

52
The load cells will be used to measure how much LOX or LCH4 is contained during testing
operations. The mass measurement will serve as a reference when filling the tanks, with their
corresponding propellants, such that the required propellant mass for the test day or single test is
filled into the tank. The required mass is determined by summing the amount of propellant required
to chill the tanks, chill the run lines, and run the hot-fire test multiplied by 1.5 to account for
uncertainties in propellant gasification. The approximated propellant mass that it takes to chill in
the tank and facility is a function of the total mass needed to be chilled, the specific heat of the
mass, the initial state of the propellant and the final state or temperature required off the tank/run-
line. These approximations will be validated during the initial cryo-shock and the appropriate cold
flows. Furthermore, maintaining the facility chilled will also be a function of how well the run-
lines/tanks are insulated and the ambient conditions which are uncertainties that were not factored
into the mass approximations.
3.2.1 Tank Manifolds
Each tank has two tank manifolds which has four welded 1-inch tubes. These manifolds
will be mounted to the tank via 12 three-quarter inch fasteners and will be used in order to manifold
the tank and assemble the required lines to effectively run testing operations. A Teflon gasket is
placed in between the tank flange and the tank manifold to mitigate leakage of propellants during
testing operation. Figure 3.3 depicts the assembly of the blind flange onto the tank manifold with
its appropriate Teflon gasket.
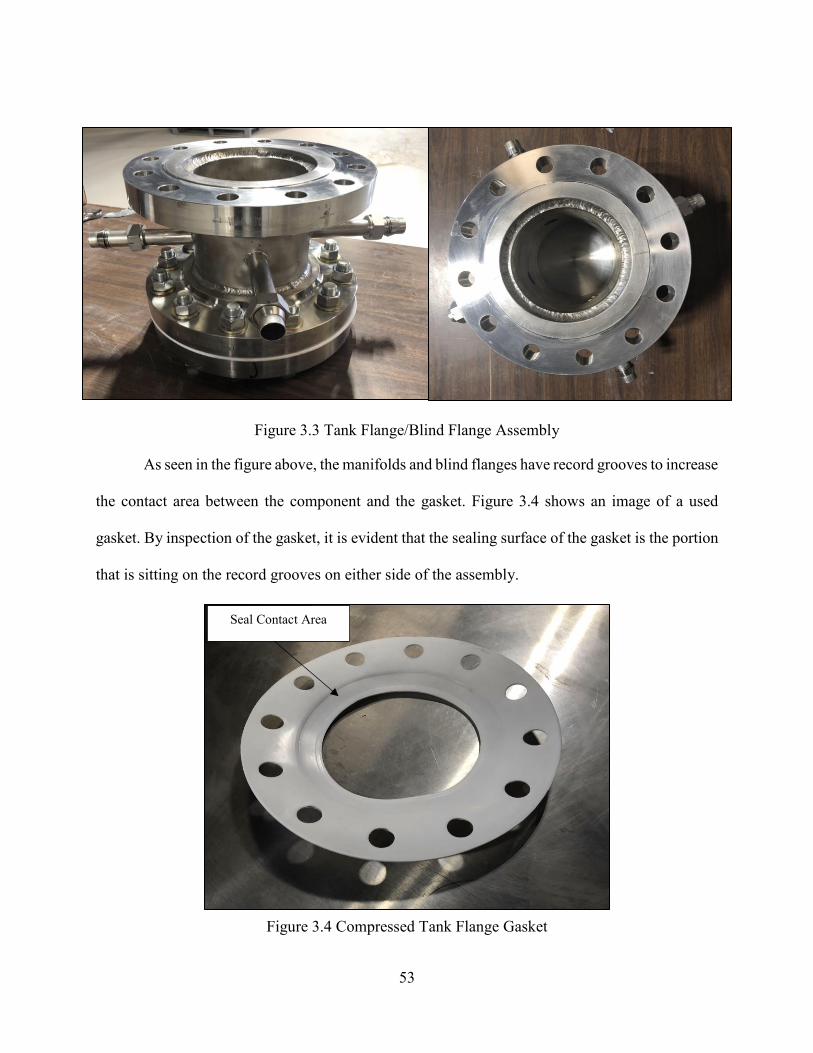
53
Figure 3.3 Tank Flange/Blind Flange Assembly
As seen in the figure above, the manifolds and blind flanges have record grooves to increase
the contact area between the component and the gasket. Figure 3.4 shows an image of a used
gasket. By inspection of the gasket, it is evident that the sealing surface of the gasket is the portion
that is sitting on the record grooves on either side of the assembly.
Figure 3.4 Compressed Tank Flange Gasket
Seal Contact Area

54
Table 3.1 summarizes the bolts used and the required torque values to produce an effective seal.
The method discussed in section 2.5 to calculate the required torque/preload for a seal was used
for these gaskets.
Table 3.1 Tank Flange Assembly Interface Specifications
Figure 3.5 depicts the assembly of the fuel tank, tank manifolds and blind flanges mounted on the
propellant trailer.
Figure 3.5 Fuel Tank Assembly
Interface Bolt Size Number of Bolts Bolt Preload (lbf) Bolt Torque (ft-lb)
Tank Flange Assembly Interfaces 3
4" − 10 12 8190 100

55
3.2.2 Tank Lines
As discussed in the prior section, the tank manifold enables for several lines to be
manifolded to the tank. With the current number of manifolds, a maximum amount of eight lines
can be connected to the tank; of those eight lines six were manifolded while the other two were
capped. The six manifolded lines are the tank pressurant line, auto-vent line, semi-auto vent line,
manual vent line, liquid drain line, liquid fill line, and the run-line. The lines discussed and their
corresponding components can be seen in the facility plumbing and instrumentation drawing
(P&ID) schematic located in the appendix. All components in each line will not be discussed;
instead, an overview of each line’s purpose will be given along with relevant information about
specific components in the lines.
The pressurant line delivers the required pressurant to keep the tank at the required test
pressure. Gaseous nitrogen (GN2) is the pressurant that will be used throughout CROME’s test
campaign and the gas that will be used to conduct initial facility, run-line and engine purges. The
pressurant is delivered to the tank via a quarter-inch tube from four manifolded 6k (i.e. 6000 psi)
GN2 k-bottles. The flow of pressurant and the delivery pressure is controlled by a pressure
regulator mounted off the pressurant manifold. A static pressure transducer downstream of the
pressurant manifold regulator is used to verify the delivery pressure and make adjustments.
Furthermore, because cryogenic propellants boil off, a cryogenic check valve was placed
downstream of the solenoid valve to ensure that there wouldn’t be any back flow up the pressurant
line that could damage any of the temperature sensitive components.
The propellant, when filled into the run-tanks, will slowly evaporate or boil-off due to heat
gains which causes the internal pressure of the tank to rise. In order to ensure safe operation and
mitigate over-pressurization of the tank an auto, semi-auto, and manual tank vent lines were

56
manifolded. As the name implies, these lines will serve as the tank vents to depressurize the run
tank or to create a flow path when filling the tanks. All vents are connected to a common bleed
line so when the vents are opened or actuated the gasses within the tank will flow out of the tank,
through the vent line, into the bleed line, and exhausted a safe distance away from the facility. The
auto vent line and semi-auto vent line are manifolded together and consist of an inline pressure
relief valve (PRV), preset to a cracking pressure of 425 psig, and a half-inch cryogenic solenoid
valve. The PRV is what makes the line an “auto” vent line since it cracks open at pressures higher
than the set cracking pressure and vents gasses until the pressure downstream of the PRV falls
below the set pressure. The semi-auto vent line has a solenoid valve that is remotely actuated in
LabView and will be triggered in the event of a cut-off to depressurize the tank. The manual
pressure vent is a manually actuated by opening a hand valve to allow gasses to be vented. The
manual vent allows for certain procedures to be conducted locally without having to rely on a test
conductor remotely actuating valves. Furthermore, in the event of a power loss, a facility operator
or technician can proceed to open the manual vent line to allow the tank to depressurize until power
has been restored.
The liquid vent line enables for subcooled propellant to be evacuated from the tank in the
case of an emergency. Also, without a liquid vent line, the propellant would have to gasify and be
vented through one of the gas vent lines which could be a lengthy operation. As part of the facility
shutdown operations, leftover propellant will be vented through the liquid vent line and out to
ambient at the end of a test day.
The liquid fill line, as the name implies, is the line that introduces the propellant to its
respective tank. LOX dewars will be purchased from Air Gas and LCH4 will be obtained from a
natural gas supplier in Albuquerque, New Mexico. The propellants will be introduced to the tank

57
through the fill line where the fluids will be filtered before being introduced to the tank in order to
reduce the possibility of contaminating the system. This procedure is strictly a local operation that
must be conducted at the beginning of a test day and if need be refilling the tanks.
Lastly, the run-line is the conduit that delivers the pressurized propellant from the tank to
the engine. All lines that travel between the two trailers are routed through the propellant trailer
and engine trailer bulkhead plates and are connected via flex hose. This line also contains a venturi
which is a flow measuring device that will be discussed in an upcoming section.
3.3 OXYGEN CLEANING
A liquid bi-propellant system employs two different propellants, an oxidizer and a fuel. For
CROME its LOX and LCH4. The propellant selection in turn is influenced by price, supply,
handling, and storage consideration [1]. A very important consideration in an oxygen rich
environment, like the oxidizer side of the propellant delivery system, is that contaminants pose a
serious risk. Furthermore, if proper treatment of the system is not taken those contaminants can
cause an explosion. Consequently, the oxidizer side of the facility and any line that comes into
contact with an oxygen line like the purge lines were sent to Astropak for oxygen cleaning. Oxygen
cleaning is a method of cleaning equipment intended for use with either liquid or gaseous oxygen;
moreover, it is a process that removes any type of contaminant from the system that could be a
fuel source during system operation. Three factors are required for an explosion to occur: a fuel
source (i.e. any sort of contaminant organic, inorganic, and/or particulates), an oxygen-rich
environment, and a heat source (e.g. a spark caused from the collision of two metallic particles).
This process, however, does not ensure that this hazard will never become a reality.
Continued care for the system’s cleanliness must be considered. For this reason, the system will
be reassembled in a “clean” space. Because of the surrounding environment of where the tRIAc

58
facility is located (i.e. a dessert) cleanliness guidelines were created to reduce the possibility of
contaminating the system. Among those guidelines, are to always wear nitrile gloves while
handling the system, this reduces the possibility of contaminating any component or tube with
organic contaminants like carbon-based greases and oils. Also, the system must have a positive
pressure at all times after being reassembled. This means that a pad pressure will be applied where
GN2 fills the entire system; consequently, increasing the pressure within the facility above the
ambient pressure (i.e. 14.7 psia). Since fluids flow from high to low pressures, assuming the facility
is leak tight, there will be no influx of contaminants into the system. This also implies that the
facility must always be capped or plugged when lines or components are disassembled; for
instance, when the flex hoses are disassembled to tow the trailers to the designated test area. The
flex hoses must be plugged as soon as they are disassembled otherwise the system will be
considered contaminated and testing operations will be suspended until it is cleaned again.
However, if the guidelines set in motion are followed the system will remain clean and safe to
operate.
3.3 MEASURING MASS FLOW RATES
The goal of a hot-fire test is to characterize engine performance. Part of that
characterization is obtaining relevant data that aids in the determination of certain performance
parameters (e.g. ISP and c*). One of the most important parameters during a hot-fire test is the
propellant mass flow. The mass flows allow for the verification that the engine is receiving the
propellants at the required quantity and proportions (i.e. total mass flow and mixture ratio). The
mass flow in this experiment is controlled by the main engine valves but measured with a venturi.
A venturi is an obstruction flowmeter, which allows for the mass flow to be obtained by
measuring a pressure differential between a steady flow point and an obstruction point. A venturi

59
has a gradual contraction and expansion to prevent flow separation and swirling, and it suffers
only frictional losses on the inner wall surfaces; furthermore, venturis cause very low head losses
and are preferred for applications that cannot allow large pressure drops [6]. Physically this means
that the discharge coefficient (Cd) the venturi is very close to unity and is in fact the flowmeter
with the highest Cd as compared to an orifice meter. Figure 3.6 depicts the internal geometry of
the venturi flowmeters purchased from Flowmaxx and Engineering. Table 3.2 summarizes the
flow meters specifications.
Figure 3.6 Venturi Internal Geometry
As seen in figure 3.6, the venturi has two ports for pressure measurements at the venturi inlet and
at the throat of the venturi. Also, it is important to note that this is a sub-sonic venturi or in terms
of an uncompressible fluid a non-cavitating venturi. Cavitation in a venturi occurs when there is
more than a fifteen-percent pressure drop across the venturi which causes the fluid to reduce to its

60
vapor pressure at the throat. This effect causes the formation of cavitation bubbles or boiling which
in turn blocks the throats passageway and fixes the mass flow rate. The advantage of using a
cavitating venturi is that no pressure disturbances downstream of the venturi can propagate
upstream thus not affecting the delivered mass flow rate. Usually cavitating venturis are used when
they are controlling mass flow and non-cavitating venturis are used when utilized as a flowmeter.
Table 3.2 Facility Venturi Specifications
Fluid Mass Flow (lbm/s) Inlet to Throat Pressure Differential
LCH4 (Fuel Venturi) 0.18 0.83 psid
0.77 14.95 psid
LOX (Oxidizer Venturi) 0.48 1.32 psid
1.6 14.53 psid
*Venturis were not calibrated but will assume a Cd of 0.95
The governing mass flow equation for an uncompressible fluid can be seen in equation 3.1. This
equation was derived from Bernoulli’s equation and can only be used if the conditions of the fluid
are well above the saturation curve (i.e. Z << 1).
ṁ = 𝑪𝒅𝑨√𝟐𝝆(𝑷−𝑷𝒕)𝒈𝒄
𝟏𝟒𝟒 (3.1)
Cd is the discharge coefficient of the venturi or orifice, ρ is the density of the fluid at the venturi or
orifice inlet, P is the measured inlet pressure of the fluid, and Pt is the measured throat pressure of
the fluid (if the venturi cavitates this is the vapor pressure of the fluid taken at the inlet
temperature). As noted under table 3.2, because of a shortage of time the venturis were not
calibrated as a result a Cd of 0.95 will be used in equation 3.1 when calculating the mass flow of
the propellants. A Cd of 0.95 is low for a venturi; usually coefficients up to 0.98 are reported. An
61
orifice, on the other hand, has discharge coefficients that range from 0.5 – 0.7. Although, the
venturis and orifices being used in the system and engine have not been calibrated and won’t be
calibrated before initial testing they should at some point be calibrated so that the error in data
reduction can be reduced. A Cd of 0.6 will be used for all orifice mass flow calculations.
3.3.1 Sizing an Orifice
As discussed in the prior section, orifices are a common component used to measure or
control mass flow. The smallest flow area in any tubing system will always control the mass flow.
Consequently, orifices were sized to control the flow off gaseous nitrogen of the facility and engine
purges and of the liquid methane for the engines fuel film cooling. This section will discuss the
criteria used for sizing the orifices utilized in the facility and engine. The criteria for selecting the
appropriate size orifice is dependent of the condition of the fluid: uncompressible or compressible.
The determination of whether a fluid is uncompressible or compressible can be determined
by the use of the compressibility factor (Z) of the fluid. If Z is substantially lower than 1 (i.e. Z <
< 1) then the fluid is considered uncompressible. If Z is near the value of unity (i.e. 0.8 < Z < 1.2)
and the conditions show the fluid well below the saturation curve then assume the fluid is
compressible ideal fluid. When sizing the FFC orifice the uncompressible criteria was used;
however, when choosing the run-line and engine purge orifices the ideal compressible criteria was
used.
The main requirement when selecting the orifice size for the purge lines was that it must
displace the purge volume (i.e. the volume downstream of the orifice) ten times in a sixty second
span. The second design criteria, was that the orifice choke the flow (i.e. the pressure drop across
the orifice is larger than the critical pressure ratio of the fluid. The critical pressure ratio of gaseous
nitrogen is approximately 0.53. The purge volume used for the selection of the run-line purge

62
orifices was approximated to be 0.076 cubic feet and was calculated based on an assumption that
there would be twenty-feet of one-inch tube downstream of the orifice. The required volumetric
flow rate was calculated using the expression shown in equation 3.2, which takes into
consideration the total volume is displaced ten times in a sixty second span.
�� = 𝑽𝒕×𝑵
𝒕 (3.2)
Where the Vt is the volume being displaced downstream of the orifice, N is the number of times
being displaced, and t is the time allotted. The resulting required volumetric flow rate for the run-
line purge was 0.0126 cubic feet. Then, using equation 3.3, the required mass flow rate was
determined assuming the conditions of the fluid based on the operating pressure planned to be used
and an arbitrary temperature.
�� = �� × 𝝆 (3.3)
Where ρ is the density of the fluid at the orifice inlet and V is the required volumetric flow rate.
The required mass flow rate was 0.0049-pound mass per second (lbm/s). Now that the mass flow
has been identified and verifying the compressibility factor meets the ideal compressible gas
criteria (i.e. 0.8 < Z < 1.2) the following expression of mass flow could be used to solve for the
required flow area and consequently orifice diameter assuming a discharge coefficient of 0.6.
ṁ = (𝑪𝒅𝑨)𝑷𝒐𝑫√ϒ𝒈
𝒁𝑹𝑻𝒐 (3.4)
Where Cd is the discharge coefficient, A is the venturi throat area or orifice area, Po is the fluid
inlet pressure, D is a function of the fluids Mach number and specific heat ratio, γ is the specific
heat ratio, g is the gravitation gas constant 32.2 ft/s2, Z is the compressibility factor, R is the gas
constant, and To is the inlet temperature of the fluid. As stated before, the second design criteria
was that the orifice be choked meaning sonic flow (i.e. M = 1) subsequently the fluids pressure
ratio and D can be determined by the expressions shown in equation 3.5 and 3.6, respectively.

63
𝑷
𝑷𝒐= (
𝜸+𝟏
𝟐)
−𝜸
𝜸−𝟏 (3.5)
Where P is the pressure downstream of the orifice, Po is the inlet pressure, and γ is the specific
heat ratio of the fluid.
𝑫 = (𝟏 +ϒ−𝟏
𝟐𝑴𝟐)
−(ϒ+𝟏)
𝟐(ϒ−𝟏) (3.6)
Here M is the Mach number and equals 1 for choked flow and γ is the specific heat ratio of the
fluid. The calculated values for γ, D, Z, and R were 1.41, 0.578, 0.99, and 55.1 (lbf-ft/lbm-R). Now
that the required mass flow and parameters are known the orifice area can be solved for by
manipulating equation 3.4. This yields an area and hole diameter of 0.0047 inches squared and
0.077 inches, respectively. The determination of the engine purge orifice used the same method
outlined and discussed above with the slight difference that the calculation of the purge volume is
comprised of the oxidizer and fuel dribble volume summed with the combustion chambers volume.
The resulting orifice size was 0.063 inches in diameter.
All orifices were purchased from O’keefe Controls Co. The orifices purchased from
O’keefe were 316SS and were chosen in a compression fitting assembly so that it can be
implemented in the facility without any adapters. Figure 3.7 depicts the union and tee orifice
selected for the run-line and engine purge, respectively.
Figure 3.7 Compression Union and Tee Orifice Assemblies
Orifice Orifice

64
As aforementioned, the amount of fuel film cooling will also be controlled by an orifice.
The determination of the size of orifice was slightly different than the purge orifices as in this
configuration the mass flow is dependent of the state of the LCH4 delivered through the fuel line
and could not be controlled independently like the pressurant supplied to the purge orifices.
Furthermore, in order to maintain the chambers integrity, it is paramount that sufficient coolant is
delivered to the chamber. The initial criteria or requirement is that a minimum of 30 percent of the
fuel amount be delivered as coolant to the chamber. Table 3.3 summarizes the amount of FFC that
should be delivered at 4 different thrust levels.
Table 3.3 Fuel Film Cooling at 30% Fuel Flow
Thrust, lbf 125 250 375 500
Fuel Flow
(lbm/s)
0.18 0.31 0.45 0.59
FFC Flow
(lbm/s)
0.054 0.093 0.135 0.177
It would be unrealistic, though, to have to swap out an orifice for each mainstage condition.
Instead, two orifices were sized such that when throttling the engine, the resulting fuel film cooling
percentages are still close to 30%.
3.4 CHARACTERIZING PRESSURE DROP ACROSS FACILITY LINES
The test facility utilizes a pressure fed propellant delivery system. Meaning, that the tank
is pressurized such that the propellant delivered to the main engine valves are at the required inlet

65
pressure. In order to set the appropriate tank pressure, the pressure drop from the tank to the engine
main valves due to major and minor flow losses must be determined. Major losses are pressure
losses due to viscous effects during flow in a conduit which is caused by friction and is a function
of fluid viscosity. Minor losses are the pressure losses due to the interruption of smooth fluid flow
due to the interaction with fittings, sudden expansions, contractions, and pipe turns. In the analysis
of piping systems, pressure losses are commonly expressed in terms of the equivalent fluid column
height, called head loss (hL) [6]. The expression that defines the total pressure drop across any
piping system due to major and minor losses can be seen in equation 3.7.
∆𝑷𝒕𝒐𝒕𝒂𝒍 = 𝒉𝑳,𝒕𝒐𝒕𝒂𝒍 × 𝝆𝒇𝒍𝒖𝒊𝒅 (3.7)
Where hL,total is the total head loss from the major and minor losses and ρ is the density of the fluid
flowing through the system. For an uncompressible fluid the change in density is a larger function
of temperature than pressure so for a constant temperature the change in density is negligible. The
total head loss expression can be seen in equation 3.8 where the first term is the head loss due to
major losses and the second term is the head loss due to minor losses.
𝒉𝑳,𝒕𝒐𝒕𝒂𝒍 = ∑ 𝒇𝑳
𝑫
𝑽𝟐
𝟐𝒈+ ∑ 𝑲𝑳
𝑽𝟐
𝟐𝒈 (3.8)
In this equation, f is the Darcy friction factor, V in both terms is the average velocity of the fluid,
D is the internal diameter of the tube, g is the gravitation constant and KL is the sum of all the
minor loss coefficients in the system of interest. Determining Darcy’s friction factor is dependent
on whether the flow is laminar or turbulent. Flow in pipes is turbulent for Reynolds number greater
than 2300 and can be determined by using the expression seen in equation 3.9.
𝑹𝒆 =𝝆𝑽𝑫
𝝁 (3.9)
In this equation, V is the average velocity of the fluid flowing through the tube, D is the inner
diameter of the tube, and μ is the dynamic viscosity of the fluid. The resulting Reynolds number

66
for the oxygen and fuel run-lines are 7,620 and 21,540, respectively. Since the flow is turbulent
(i.e. Re > 2300), the friction factor depends on the Reynolds number and the relative roughness
(ε/D), which is the ratio of the mean height of roughness of the pipe to the pipe diameter [6]. A
surface roughness value of 0.000007 ft was obtained from published literature values and used for
this analysis. Using the relative roughness value and the appropriate Reynolds number, Darcy’s
friction factor (f) was obtained from the Moody Diagram. The Moody Diagram is a chart that
presents the Darcy friction factor for pipe flow as a function of Reynolds number and relative
roughness over a wide range [6]. Now that the friction factor (f), average velocity (V), pipe inner
diameter (D), and total line length (L) are known the major head loss can be calculated. Similarly,
the minor head loss can be determined once the loss coefficients (KL) also known as resistance
coefficients are obtained. KL values have been experimentally determined and are openly
published in literature. Each fitting, sudden expansions and contractions (e.g. reducing unions),
and component in the line cause fluid flow interruption and must be taken into consideration when
calculating the minor head loss. The KL values used for this analysis were taken from literature
published values and are listed in the appendix.
The common oxidizer and fuel run-line parameters to calculate the total head loss are
summarized in table 3.4. Table 3.5 shows the total head loss and corresponding pressure drops as
a function of mass flow (i.e. average velocity, V). It is clear from equation 3.8 that the total head
loss is a function of the average velocity of the fluid (i.e. mass flow) which changes depending on
the thrust being tested. For this reason, it is important to quantify what the pressure drop is from
the tank to the main engine valves so the appropriate tank pressure can be selected to achieve the
required Pc and thrust. Furthermore, apart from conducting the pressure drop approximations a

67
cold flow will be conducted before a hot-fire to verify that the selected tank pressure based off the
pressure drop calculations are correct and the proper mass flow is achieved.
Table 3.4 Parameters Used for Determining Head Loss
Parameter Values
Tubing Size 1-inch Tubing ½ inch tubing
Run Line Length, L (ft) 20 3
Run Line Diameter, D (ft) 0.0695 0.036
Total Loss Coefficient, KL 5.72 4.4
Stainless Steel Surface Roughness, ε (ft) 7e-6
Relative Roughness, ε/D 1.0072e-4 1.95e-4
Table 3.5 Head Loss and Pressure Drop Results at Different Thrust Levels
Parameter Value
Thrust, F (lbf) 125 250 375 500
LCH4 Mass Flow (lbm/s) 0.18 0.31 0.45 0.59
LOX Mass Flow (lbm/s) 1.59 1.22 0.85 0.48
LCH4 Density (lbm/ft3) 23 23 23 23
LOX Density (lbm/ft3) 72 72 72 72
LCH4 HL, total (ft) 15 42 89 148
LOX HL, total (ft) 7 20 40 67
LCH4 Pressure Drop, ΔP (psid) 2 7 14 24
LOX Pressure Drop, ΔP (psid) 3 10 20 33
The injector pressure drop data provided in chapter 2 along with the approximated pressure drop
across the engine manifolds at high end thrust require a main engine valve downstream pressure

68
of approximately 367 psia (352 psig). The tank pressure then at the high end thrust level would be
405 psia (390 psig) for both the liquid methane and liquid oxygen tank which is approximately 35
psi less than the maximum operating pressure of the facility. Lower thrust levels would require a
lower tank pressure and subsequently have a lower pressure drop across the facility, engine
manifolds, and injector.
3.4 TEST FACILITY INSULATION METHOD
The facilities’ main purpose is to deliver the proper amount of propellant to the engine as
a subcooled liquid (i.e. a cryogen). As previously discussed, LOX and LCH4’s saturation
temperature at ambient pressure is -300 and -260 °F, respectively, and can only stay at cryogenic
conditions if the facility is effectively insulated. Otherwise, it will take an infinite amount of sub-
cooled fluid to condition and keep the facility chilled (i.e. the run-tank and run-line).
Cryogel Z insulation will be used to insulate the appropriate lines and run-tank. This type
of insulation has been used successfully in past projects and has been proven to be an effective and
inexpensive insulating method. Cryogel Z flexible aerogel blanket insulation is engineered to
deliver maximum thermal protection with minimal weight and thickness; furthermore, the
extremely low thermal conductivity of Cryogel Z minimizes heat gain and liquid boil-off in
cryogenic applications [7]. This insulation is wrapped around the tubing/line of interest and
secured with foil tape. Multiple layers of insulation can be applied to the line to increase the
effectiveness of the insulation. All tubing, fittings, and components on the run-line as well as run-
tanks will be insulated. Furthermore, the liquid fill line and a segment of all lines connected to the
tank manifolds will also be insulated to reduce possible heat sources that would cause propellant
to boil-off.

69
The propellant delivery system will be insulated following the completion of the facility
and engine leak check. An added benefit of this insulation, is that it is not a permanent insulator
so in the event of a leak occurring due to thermal contraction the insulation can be removed, the
leaking interface tightened, and the insulation reapplied. Figure 3.8 depicts Cryogel Z installed on
an industrial liquid natural gas (LNG) piping system.
Figure 3.8 Cryogel Z Insulation Installed on Industrial LNG Piping System

70
Chapter 4: Engine Testing Campaign
4.1 ENGINE TESTING OBJECTIVES
The objective of CROME’s initial campaign (i.e. D1) is to demonstrate successful engine
operation, validate operating conditions, and characterize engine performance through hot-fire
testing the engine. The engine will be hot-fired at four different thrust levels along its thrust range:
125, 250, 375, and 500 lbf. For each mainstage condition the propellant mass flow, chamber
pressure (Pc), propellant state data, and hardware state data will be measured. This data will be
used to calculate engine performance parameters like c*, c* efficiency, theoretical thrust and
theoretical specific impulse. These engine performance parameters are important to vehicle and
mission design and will be discussed in this chapter.
The design of a combustion chamber presents one of the more complex tasks in the field
of liquid-propellant rocket engineering, primarily because the basic processes, especially the
combustion within the thrust chamber, are perfectly misunderstood [1]. This test campaign aims
to try and understand CROME, its capabilities and more importantly limitations. Hardware state
data like hot-wall temperature measurement, surface temperature measurements taken at various
locations on the engine, and pressure measurements will be taken during various test operations
and will be useful when designing the second iteration of CROME. The mechanical and thermal
analysis will be modeled based on actual test data which will result in a better and more accurate
analysis and consequently a better engine design. Furthermore, uncertainties will be addressed
during the test campaign; for example, what the minim FFC required to maintain the integrity of
the hardware for thermal steady state conditions. With every successful hot-fire test, the engine
and its limitations will be further understood.

71
Engine testing is thrilling but also extremely dangerous. Another important objective,
maybe the most important, is student safety during the testing operations. Consequently, all test
operations will be executed with approved step-by-step procedures. This takes the ambiguity out
of executing test operations like performing required cold-flow tests or an igniter operation
verification test. Every procedure explains how and why the test must be conducted and lists
possible hazards that are associated to that specific test operation; thus, reducing the probability of
system failure and increases test operation success.
A secondary safety measure, for students and the system, is the integration of redlines or
cut-offs during test operations in order to ensure that the system is behaving as expected and is
safely shut down in the event of an anomaly. The redline parameters and shutdown sequence will
be discussed in a later section.
To recap, this test campaign will be the first time cSETR attempts to test a rocket engine
of this magnitude, in order to characterize engine and system performance while maintaining a
safe and effective work environment. The following sections will describe, in detail, the specifics
of the test campaign; for example, how each test operation is completed (i.e. an overview of the
testing procedures), the fluids planned to be used during the test campaign, the thought process
behind the automatic sequence and cutoff parameters, and lastly what to do with the data obtained
from a hot-fire test.
4.2 FLUIDS USED
Table 4.1 summarizes the fluids that will be used during CROME’s test campaign. It is important
that safety considerations be taken when handling these propellants in order to mitigate any
incidents. Among those considerations, at the very least, should be to always wear the proper

72
personal protective equipment (PPE). When handling cryogens it is a requirement to wear safety
goggles, a face shield, a non-porous lab-coat and/or cryogen rated apron without pockets or cuffs
which can catch a liquid, high top steel toed boots covered by pants and loose-fitting insulated
gloves. Also be mindful of the propellant and the hazards that accompany them when being
handled. Oxygen, regardless of state, used for testing is a pure oxygen and if mishandled (e.g.
dropping a gaseous oxygen k-bottle) can result in leakage into the surrounding environment which
can result in spontaneous combustion if an ignition source is introduced. Likewise, although
methane is non-toxic, it can cause asphyxiation in a confined area without proper ventilation. It is
important to always work in a well-ventilated area since natural gas is colorless, odorless, and
tasteless; furthermore, if leaked it will dilute the normal oxygen content of the surrounding air
which can lead to clouded judgement and in extreme conditions (i.e. air diluted below 12% oxygen
content) can lead to fainting. It is important to always use the “buddy” system and to be aware of
your surroundings. Always transport k-bottles and Dewar’s with the proper hand truck or trolley.
Table 4.1 Fluids Used During Test Campaign
Fluid Phase Purpose Hardware Flow Rate
(lbm/s) Pressure (psig) Temp. (°F)
Oxygen liquid Oxidizer 400 max -300 °F 1.59 max
Oxygen Gas Oxidizer 200 max Ambient 0.02 max
Methane Liquid Fuel 400 max -250 °F 0.59 max
Methane Gas Fuel 200 max Ambient 0.01 max
Nitrogen Gas Purge 300 max Ambient 0.01 max
As seen in table 4.1, oxygen and methane both in a gaseous and saturated or subcooled state will
be utilized. As aforementioned, LOX and LCH4 will be used as the propellants of CROME, while
GOX and GCH4 will be used as the propellants for the ignition system, the torch igniter. Gaseous
nitrogen (GN2) will be used abundantly throughout this test campaign in order to purge out any
captured moisture within the facility before introducing cryogens and to purge the run-line and

73
engine after a hot-fire test to expel any residual propellants left in the run-line or dribble volume.
GN2 will also be used to pressurize the engine propellants in the run-tanks. LOX, GOX, LN2,
GN2, GCH4 will be purchased and acquired from Airgas. LCH4 will be purchased and obtained
from a provider in Albuquerque, New Mexico.
Prior to a hot-fire test day, a trip will be made to Albuquerque with the LNG Micro-Fueler.
This Micro-Fueler is the transport tank purchased from Chart Industries, Inc. to transport the liquid
methane or in this case liquid natural gas (LNG) from Albuquerque back to the tRIAc facility
located in Fabens, Texas. It is designed to aid in the fueling of the D1 test facility fuel tank. It
consists of a 122-gallon vacuum jacketed pressure vessel mounted inside a protective steel pallet
frame, which makes it transportable. Its capabilities consist of self-pressurization or external
pressurization up to 300 psi, dispensing liquid from the Micro-Fueler, and emptying of liquid
natural gas in to the Micro-Fueler. The pressurization capability makes the transfer of LNG from
the Micro-Fueler to the fuel run-tank manageable. As specified by the LNG user manual, in order
for there to be effective flow from the Micro-Fueler to the run tank the internal pressure of the
transport tank must be at least 25 – 30 psi higher than the internal pressure of the run tank. Figure

74
4.1 depicts the LNG Micro-Fueler 3D model and an image of the Micro-Fueler taken in HQ at the
tRIAc test facility.
Figure 4.1 LNG Micro-Fueler
Further detail about the fill procedure from the Micro-Fueler to the run tank will be given in the
hot-fire test overview.
4.3 ENGINE TESTING PROCEDURES
The following sections will review and discuss the qualification tests required before executing
the first hot-fire test. The test facility and the engine must both be leak checked and then qualified
to be used with cryogenic fluids (i.e. cryoshock). Following the cryo-shock will be a series of cold
flow tests and an igniter check test. Once these tests have been performed a hot-fire test can be
executed.

75
4.3.1 Facility and Engine Leak Check Overview
The facility and engine leak check will be conducted to correct any major leaks within the
manifolds/lines. Since this test facility will be operating as a blow-down system (i.e. a pressure
fed system) it is critical that the facility be capable of building pressure which would be difficult
with major leaks.
The test facility and engine will be leak checked independently of each other. GN2 will be
utilized in both leak check tests. The GN2 for the facility leak check will be delivered to each side
of the facility (i.e. fuel and oxidizer side) by the manifolded GN2 k-bottles that deliver pressurant
to the tanks. The pressure regulator mounted off of the pressurant manifold will be adjusted such
that the delivery pressure is the required leak check pressure. The entire facility will be leak
checked at the same time; meaning, all solenoid valves and hand valves will be open with the
exception of the common vent hand valves. Nitrogen will be introduced to the system and
pressurize the tank pressurant line, the tank vent lines, the tank fill line, the run-line, and the
propellant bleed line up to the common vent. Following the pressurization of the entire volume,
students will check for leaks by spraying a soapy solution, commonly known as Snoop, on every
interface. Snoop is used so that if there is a leak at any given interface bubbles begin to form. The
bigger the leak the larger the bubbles created. After identifying all the leaks, the proper fix must
be executed. For a fitting to tube interface it’s as simple as further tightening the nut to the fitting,
but in the event of leak between the tank manifold and tank flange then the bolts must be tightened,
if there is margin on the maximum proof load. Once all identifiable leaks are fixed the leak check
is complete.
The engine leak check, similarly to the facility leak check, uses GN2 to pressurize the
volume of interest. The GN2 is delivered from the engine purge line downstream of the main

76
engine valves and pressurizes the engine’s dribble volume (i.e. the engine manifold volume and
injector volume), the combustion chamber volume up to the plugged throat, and the igniter up to
the check valves installed upstream of the propellant inlets. As mentioned, the engine must be
plugged at the throat in order to seal the engine and allow for pressure to build in order to preform
the leak check. Figure 4.2 depicts the plug assembly that will be used when leak checking the
engine.
Figure 4.2 Engine Throat Plug Assembly
As seen in Figure 4.2, the plug consists of a ¼ - 20-inch tee nut inserted into a tapered rubber plug
that has a ¼” clearance through hole. A ¼ - 20-inch hex head bolt is then inserted into the plug
with two washers that are used to ensure that when the bolt it torqued the clamping force between
the bolt and the tee nut will be evenly distributed. This assembly is placed firmly within the throat
off the engine, some physical persuasion is required in order to ensure it is wedged in the throat,
and is torqued to 150 ± 10 in-lbs. This preload or clamping force deforms the tapered plug axially
causing the plug to expand radially and thus creating an effective seal between the throat and the
plug. This is due to the Poisson’s effect where the lateral measurement increases or decreases in
¼” – 20 Tee Nut
Oversized Washer Tapered Rubber Plug
¼” Washer
¼” – 20 x 2” Bolt

77
width as the length of the material is elastically deformed. Figure 4.3 depicts a cross section view
of the engine with the plug installed.
Figure 4.3 Engine Throat Plug Installed Cross Section
Following the engine being plugged and pressurized, similarly to the test facility leak check snoop
will be applied to all interfaces for indications of leaks. This leak check will also evaluate the
engine welds between the igniter and the combustion chamber and the downcomer tubes welded
on to the pintle manifold cap.
The leak checks of the subsystem of interest in both the engine and test facility will be
conducted at two different pressures. The initial leak check will be conducted at 50 ± 10 psig, this
pressure is commonly referred to as shop pressure. The subsequent leak check utilizes a pressure
78
that is indicative of the maximum operating pressure of the line or system. For the engine, the
high-pressure leak check is conducted at 300 ± 10 psig. The test facility oxidizer and fuel side are
tested up to 400 ± 10 psig, and the run-line and igniter active purge are leak checked at 300 ± 10
psig. The only difference between the two leak checks conducted on the facility or engine is that
adjustments to leaking interfaces (i.e. tightening the nut of a fitting or component) can only be
done under pressure for the shop pressure leak check. The subsequent high-pressure leak checks
must vent the pressure in the volume before making any adjustments to the system. The reason
behind this is to prevent any incidents from occurring; for example, if a student goes to adjust the
nut on a leaking fitting and instead of tightening it, loosens it, the leak will be made larger and at
higher pressures the exit velocity of the fluid is substantially higher than at shop pressure. Instead
of venting after every leak is identified, electrical tape will be used to mark all the fittings that are
leaking within the system, vented, and then adjustments would be made. After the adjustments the
system would be pressurized again and checked further for leaks. This cycle would continue until
all leaks are fixed.
It is also important because the oxidizer and fuel tanks are only approximately 10 feet away
from each other and it would be very hazardous if both tanks were leaking propellant during a hot-
fire test that could possibly mix and combust with an ignition source. These leak checks are
conducted to reduce the possibility of a hazard like this occurring. Leak checking is a simple yet
crucial test operation before continuing any other test operation. The facility and engine will be
insulated after their appropriate leak checks are conducted.
4.3.2 Facility and Engine Cryoshock Overview
Following the insulation of the test facility and engine manifolds a cryoshock test will be executed.
A cryoshock, as the name implies, is a test operation that cold cycles the facility and the engine in

79
order to qualify the system to be used with cryogenic fluids. This test has the potential to address
many questions like the time it takes and how much fluid it takes to chill in the tank, it will be the
first time the tanks are filled with a cryogen and will evaluate how effective the fill procedure is
and possibly warrant considerations that weren’t made, once the tank accumulates a sub-cooled
liquid and the run-line chill begins the time to chill the run-line up to the main engine valves can
be quantified, and lastly, the boil off rate of propellant within the tank can be quantified. This
section will discuss each of the test objectives mentioned above and how they will be obtained.
Cryo-shocking the system is achieved by introducing a cryogen to the system, allowing for
the facility and engine to chill such that a sub-cooled liquid is flown through the run-line and then
all components are actuated to ensure proper function under cold temperatures. Furthermore, it is
the first test in which chilling the tank and system is preformed which will provide valuable insight
as to how long it takes for the tank to chill in and how much propellant or LN2 is expended to
accomplish the tank chill-in. The tank will be considered chilled once sub-cooled liquid begins to
accumulate within the tank and will only be possible once the tank is cool enough that the cryogen
does not vaporize. This would be indicated by the mass measured from the load cells underneath
the tank legs. Once sub-cooled liquid begins accumulating within the tank the mass measured by
the load cell would increase and the fill would only be finished once there was no flow from the
LN2 Dewar, which can be audibly determined from the sound of fluid flow to the tank or the
required mass to test is achieved. When there is no longer any propellant or fluid within the Dewar
or the pressure drop across the Dewar and run tank drops low enough there will no longer be any
flow into the run tank.
Further considerations must also be made before introducing a cryogenic fluid into the
facility. Of those considerations the most important is to ensure that there is no moisture (i.e. air)

80
within the system because introducing a cryogen to a system with moisture would condense and
then freeze the moisture thus causing a clog in the manifolds. In order to reduce this hazard, the
facility and engine manifold must be purged prior to filling the tank. There are two types of purges:
pressurized purges or active flow purges. A pressurized purge allows for the volume of interest to
be pressurize and then vented; this ensures that the entire volume is purged from particulates or
moisture and should be done at least twice. An active flow purge flows the purge fluid through the
volume of interest and assumes that entire volume is displaced from the fluid flow; however, the
entire volume may not be purged as in a pressurized purge. This test operation will use both
methods of purging. The entire test facility will be pressurized up to 100 ± 10 psig, verified by
several pressure measurements in the system, and then vented through the vent line. A check valve
downstream of the vent line hand valve will ensure that air does not flow back into the system;
thus, creating a nitrogen rich environment without any moisture within the facility. The pressurized
purge will be performed twice before filling the propellant tanks with LN2. After which the LN2
Dewar will be connected to the run-tank with a 1” flex hose upstream of the cryogenic filter. The
fill line and tank vent hand valve will be opened followed by opening the liquid delivery valve on
the Dewar which creates a flow path from the Dewar through the tank and out the vent line. LN2
will begin to flow and vaporize into a cool gas which will chill in the tank and as the tank
progressively chills in the flow of nitrogen will begin to change into two phase flow until the tank
is cool enough that only a sub-cooled liquid will flow and accumulate within the tank. Once this
is achieved and there is no longer any flow from the Dewar into tank, both the fill line and the tank
vent hand valve will be closed, the flex hose will be removed from the fill line and Dewar, the
Dewar will be removed and stored away, and the LN2 will be pressurized to approximately 250 ±
10 psig with GN2 from the pressurant line. Once the LN2 is pressurized the bleed line, and tank

81
isolation solenoid valve will be opened, in that order. LN2 will flow from the tank through the run-
line and bled upstream of the main engine valves out to the vent line. As with the tank, the LN2
will vaporize and progressively chill in the run-line until the line is cold enough to flow a sub-
cooled liquid, which will be verified by the pressure and temperature measurement of the fluid
taken at the bleed point upstream of the main engine valves. Once the liquid temperature measured
is below the saturation temperature of the fluid at the fluid pressure measured then the run-line
will be considered chilled. At which point, the tank isolation solenoid valve will be closed, cutting
off fluid flow, and all hand valves and solenoid valves will be opened and closed to validate that
they are operating at sub-cooled conditions.
Following the completion of the main objective of the test, the boil off rate of LN2 will be
evaluated. This is achieved by noting the initial mass of fluid measured within the system and the
time, waiting for the propellant to boil off and be vented through the tank vent line until the mass
measured by the load cells reaches zero and the tank pressure and temperature measurement verify
that there is no indication of a cold fluid within the tank. The time taken for the fluid to completely
boil-off is noted and then the boil off rate is calculated using the expression seen in equation 4.1.
��𝒃 =𝒎𝒐−𝒎𝒇
∆𝒕 (4.1)
The boil-off rate as seen in equation 4.1, is the propellant boil off rate in lbm per second and is an
indication of how long it takes for any amount of propellant to boil-off. This gives the test engineer
an idea of how long the propellant can be stored in the run-tank and also the ability to approximate
how much propellant will boil off in between tests, which will indicate whether more propellant
would have to be introduced to the tank to run a subsequent test or if there is enough propellant to
run the test.

82
Furthermore, the same method can be used to approximate the time and mass it takes for
the run-line to be chilled. The initial and final mass and time would be noted before and after the
run line chill is conducted. Knowing how much mass it takes to chill in the run-line will be useful
when approximating how many hot-fire tests can be conducted off of a specific mass of propellant
within the run tank and similarly, knowing how long it takes to chill in the run-line will be helpful
in calculating the total time it takes to prepare the facility for a hot-fire test. This total time is
computed by summing the time it takes to chill and fill the run-tank, to pressurize the
propellant/fluid within the run tank to the specified tank pressure, and the amount of time it takes
to chill the run-line. After which, a hot-fire can be conducted. Initial hot-fire tests will be short and
so the majority of the time to taken to prepare for a hot-fire test will be in readying the facility.
Liquid nitrogen was selected to be the cryogen to preform the cryo-shock because it is an
inert fluid and is a very cold cryogen, colder than LCH4 and LOX, which makes it a good candidate
to qualify the system. This qualification test is very important to the system and is a good test
operation to learn about the propellant delivery system.
4.3.3 Torch Igniter Check Overview
As aforementioned, an inhouse torch igniter will be used as the ignition system for CROME. It has
undergone an extensive test campaign, when it was first designed, and qualified at different
operating conditions. This igniter has been used in several projects as an ignition source with the
high-pressure combustor (HPC) being the most recent. The inlet conditions used during test
operations for HPC which resulted in reliable and repeatable ignition was an oxidizer valve inlet
pressure of 160 ± 10 psig inlet pressure and a fuel valve inlet pressure of 130 ± 10 psig. These
conditions will be adopted and used during CROME’s test campaign, but will be validated before
the first hot-fire test of every test day.

83
The igniter uses gaseous oxygen and methane as its propellants and are delivered from k-
bottles housed on the propellant trailer to the igniter via a ¼” line. A pressure regulator mounted
off the fuel and oxidizer bottle are used to regulate the inlet pressure of the fluid to the inlet pressure
mentioned above and is verified using a pressure measurement upstream of the igniter valves.
Once the required inlet pressures are achieved a 9 second auto sequence is initiated where a signal
to the sparker is sent, the igniter valves are opened, there is a 3 second burn, the igniter valves are
closed and a 5 second purge upstream of the fuel and oxidizer inlet is initiated. Successful ignition
is verified by a surface temperature measurement taken on the igniter adapter and by video
inspection of the test. If the surface temperature measured increases (i.e. the adapter got hot) and
the video taken during the test shows a flame in the chamber then the test is deemed successful
and will be tested again to ensure that at these operating conditions ignition is repeatable.
It is important to note that the purge introduced to the igniter dribble volume and chamber
is used in this test to purge out residual propellants but will also be used as an active purge during
a hot-fire test. Meaning, that after the igniter valves are closed and there is successful ignition of
the main engine propellant flow, the purge valves will be opened and there will be GN2 flowing
into the chamber while the test is ongoing. This accomplishes two critical things: 1) it ensures that
the igniter does not over heat and 2) it ensures that there is no residual propellant within the igniter
chamber that would cause a hard start on subsequent hot-fire test. The igniter active purge pressure
was selected such that when flown through the igniter the GN2 pressure is higher than Pc; thus,
there will always be flow into the chamber protecting the hardware.
4.3.4 Cold Flow Overview
A series of cold flow test, also called blowdown tests, will be conducted before hot-fire testing
CROME. A cold flow test introduces the actual propellant (i.e. LOX or LCH4) to its respective

84
system. This test is executed to characterize the resistance of the facility run-line. Resistance is
function of the major and minor fluid losses due to friction and the interruption of smooth fluid
flow and is characterized in equation 4.2.
𝑹 =𝝆∆𝑷
𝑾𝟐 (4.2)
This parameter as seen in equation 4.2, can be calculated by measuring the flow rate, density and
pressure drop of a fluid between two points of interest. Once the resistance is found experimentally,
then the equation can be rearranged to solve for the pressure drop at a different flow rate. This
expression is seen in equation 4.3. This is useful in determining what the pressure drop is of the
fluid from the tank to the main engine valves. Once the pressure drops at the four different flow
rates of interest (i.e. at the four different thrust levels of interest) are identified the required tank
pressure for any given hot-fire test can be updated in the test matrix.
∆𝑷 =𝑹𝑾𝟐
𝝆 (4.3)
The first cold flow test conducted on each side of the system (i.e. the oxidizer and fuel side
of the test facility) will be the first time the propellant is introduced into the system and similarly
as to the cryoshock might warrant further considerations that weren’t initially made. However,
since the test facility does not have a burn stack, LN2 will be used for the fuel side instead of
LCH4. This does, however, not provide the actual resistance value for the fuel side but it can be
adjusted based on the density ratio of the two cryogens. Liquid oxygen will be used on the oxidizer
side for the cold flow since flowing oxygen to the surrounding area is not considered dangerous to
the environment.
After the appropriate cold flow tests are conducted and the test matrix updated the engine
will be ready for a hot-fire test.
85
4.3.5 Engine Hot Fire Test Overview
The most important procedure, however, is the hot-fire test. All other test operations preformed
before the hot-fire test are to prepare, qualify, and understand the system before trying to hot-fire
CROME. As mentioned before, the hot-fire testing of CROME is to validate the performance of
the engine at different operating conditions (i.e. different thrust levels). This section will cover
what operations must be conducted to prepare the facility before initiating the hot-fire auto
sequence and discuss how to reduce and analyze the data acquired from a hot-fire test.
The test facility (i.e. the two trailers) are stored inside of HQ, which is a large warehouse,
under positive pressure. Before the trailers can be moved to the designated test area this positive
pressure must be vented from each side of the system; requiring power to be supplied to solenoid
valves so that the entire system can be vented. After all the solenoid valves are opened the common
vent hand valve can be opened and the nitrogen evacuated from the system. Once the system is
depressurized the vent hand valve is closed and the two trailers can be towed out and orientated
correctly at the designated test site. The MICIIT trailer, known as the DAQ trailer, will also be
towed and positioned approximately 50 feet behind the propellant tank trailer. After which, the
harnesses will be connected to the DAQ trailer and its corresponding instrumentation. The hot-fire
LabView GUI will then be initiated from the remote test location and all solenoid valves will be
cycled to ensure proper functionality. After a successful instrumentation check out, and following
the reassembly of the flex hoses between the bulk head plates and the vent line extensions being
reassembled the facility will undergo two pressurized purges; followed by, the filling of the fuel
and oxidizer run-tanks with their respective fluid LNG and LOX. This operation, as mentioned
before, encompasses the tank chill-in until a sub-cooled liquid is successfully accumulated in the
tank which is verified by the tank fluid temperature and pressure measurement taken upstream of

86
the 1st isolation hand-valve in either line. Once a sub-cooled liquid is achieved and the fill op is
finished the propellant will be pressurized with GN2 from the tank pressurant line up to the
required tank pressure as specified by the test matrix in the procedure. Once the tanks are
pressurized, both lines will simultaneously begin their respective run-line chills. Completion of
the run-line chill will be based on the temperature measurement upstream of the main engine
valves; when this fluid temperature measures below the saturation temperature of the fluid then
the chill will be complete at which point the automated hot-fire test sequence will be initiated and
the hot-fire test executed.
This whole test operation is executed to procure data required for the performance analysis
of the engine. The parameters of interest are propellant mass flow rate, chamber pressure and
thrust. From these parameters the engine’s specific impulse, c*, and c* efficiency will be calculated.
However, the initial campaign will not be using the thrust measurement system that was intended
to be used for the measurement of thrust during a hot-fire test. Instead, a theoretical thrust will be
calculated by using the total flow rate, chamber pressure, and CEA. CEA stands for chemical
equilibrium application and is commonly used in the preliminary design of a rocket engine in order
to acquire thermodynamic properties of a combustion gas based on the operating conditions and
chamber geometry (i.e. Pc, MR, and ε). Equation 4.4 shows the thrust equation.
𝑭 =��
𝒈𝑽𝒆 + 𝑨𝒆(𝑷𝒆 − 𝑷𝒂) (4.3)
Thrust in lbf, as seen in equation 4.3, is a function of the total propellant flow rate, the exit velocity
of the gas being ejected at the nozzle exit plane, the nozzle exit area and pressure, and atmospheric
pressure. Using CEA, the Pc and mixture ratio achieved during the actual hot-fire test will be used
along with the combustor’s geometric parameters to obtain the theoretical nozzle exit velocity and
pressure. CEA does not give the exit velocity, instead, it gives the Mach number and speed of
87
sound at the nozzle exit, which can be used to calculate the theoretical exit velocity. This
relationship can be seen in equation 4.4.
𝑽𝒆 = 𝑴𝒆 × 𝒄𝒆 (4.4)
Using the theoretical thrust calculated and the measured total propellant flow rate the theoretical
specific impulse can be calculated. The expression for specific impulse can be seen in equation
4.5.
𝑰𝒔𝒑 =𝑭𝒕
�� (4.4)
Specific impulse is the measure of how much thrust can be delivered per pound of propellant
consumed and is commonly used to assess the performance of a rocket engine. Characteristic
velocity, c*, reflects the effective energy level of the propellants and the design quality of the
injector and combustion chamber [1]. The empirical/actual and theoretical equation for c* can be
seen in equation 4.5.
𝒄∗ =𝑷𝒄𝑨𝒕𝒈𝒄
��=
√𝒈𝒄𝜸𝑹(𝑻𝒄)𝒏𝒔
𝜸√[𝟐
𝜸+𝟏]𝜸+𝟏𝜸−𝟏
(4.4)
The first equation is the empirical form of characteristic velocity and is a function of the chamber
pressure, chamber throat area, and propellant flow rate. This form of the equation shows that c*
measures combustion performance in a given thrust chamber by indicating how many pounds per
second of propellant must be burned to maintain the required nozzle stagnation pressure [1]. The
second form, the theoretical form, shows that c* is a function of the properties of the product gas
at the exit of the combustion chamber (i.e., at the nozzle inlet), specific heat ratio, gas constant and
gas temperature [1]. Lastly, c* efficiency is a measure of how effective the design of the injector
and thrust chamber area as this efficiency is the ratio of the actual c* achieved versus the maximum
theoretical c*. This is seen in equation 4.5.

88
𝜼𝒄∗ =𝒄𝒂𝒄𝒕𝒖𝒂𝒍
∗
𝒄𝒕𝒉𝒆𝒐𝒓𝒆𝒕𝒊𝒄𝒂𝒍∗ (4.4)
Although thrust and specific impulse will be theoretical values during the initial test campaign the
characteristic velocity and efficiency will be actual performance parameters based on only
experimental data obtained during a hot-fire test.
As the test campaign matures the thrust measurement system should be utilized to get
actual thrust and specific impulse but for now on a component development level this rocket engine
performance analysis will suffice.
4.4 HOT-FIRE AUTOMATIC CONTROL SEQUENCE
As mentioned in the prior section, the D1 test facility (i.e. the MICIIT trailer) has the capability of
employing an automated sequence that is pre-programmed before a hot-fire test. This automated
sequence controls when and to what position the valves are actuated and closed. It also employs
purges on the facility run-line and engine almost immediately after closing the main engine valves.
The auto sequence is programmed in quarter-second intervals thus allowing for precise control of
the fluid flow and sequence of events.
During any given hot-fire test, the system must be primed and ready to deliver a sub-cooled
propellant to the engine at which point the automated sequence is initiated. At this point all test
engineers present can focus their attention on the engine live feed and almost real-time data to try
and identify if something goes wrong and initiate a manual cutoff. The auto sequence for the hot-
fire test will initiate a 10 second purge, to purge out moisture in the engine’s dribble volume,
followed by the closing of the bleed lines and opening of the main engine valves. As soon as the
main engine valves are opened a timer will initiate and will close the valves after the pre-
programmed burn-time has elapsed. For initial hot-fire tests this burn time can be as low as three
seconds. The igniter valves and signal to the sparker will also be initiated in parallel when the main

89
engine valves are actuated; this way the igniter will be on milli-seconds before the propellant is
fed into the chamber. The igniter was chosen to be turned on before the propellants were injected
into the chamber to reduce the risk of having a hard start which occurs when the propellant mixture
is pooled into the chamber and then ignited causing a spike, although brief, in chamber pressure.
Once the burn-time is achieved the main engine valves will be closed followed by a 30 second
engine and run-line purge valves to evacuate any residual propellants in the lines. After the run-
line, engine and igniter purges are completed the hot-fire test will have been completed and the
test article (i.e. the engine) will be ready for visual inspection.
4.4.1 Redline Parameters and Facility Shutdown Sequence
Redlines will be activated during the automated hot-fire test sequence to ensure that a test is
promptly terminated if an anomaly occurs. Table 4.2 summarizes the redlines that will be used
during a hot-fire test.
Table 4.2 CROME Hot-Fire Testing Redlines
Redlined Parameter Reason for Cutoff
LOX main valve pressure HIGH Prevent high Pc and/or high MR in chamber
Fuel main valve pressure LOW Prevent high MR
Fuel Tank fluid temperature LOW Insufficient fuel in run tank
LOX Tank fluid temperature LOW Insufficient Oxidizer in run tank
Pc LOW Loss of ignition source; chamber burn through
Pc High Prevent from over pressurizing hardware
Combustor Hot Wall Temp. HIGH Prevent chamber burn through
90
Redlines are pre-programed into the control system (i.e. LabView CROME GUI) and are used to
ensure hardware and test operator safety. As summarized in table 4.2, most of the redlines
programmed is to ensure that, operational wise, the engine will not experience an oxygen rich
mainstage condition (i.e. a MR higher than stoichiometric). The operating conditions CROME is
intended to be tested at are all fuel rich. Most engines in use today operate in the fuel rich regime
because oxygen will destroy hardware. An oxygen rich environment will ensure that the combustor
walls are oxidized and will slowly burn away.
If the LOX main engine valve inlet pressure is to high the oxygen flow delivered to the
engine will also increase; meaning that the MR will increase. A redline is programmed based on
the inlet pressure measured upstream of the oxygen valve to ensure that the resulting LOX mass
flow does not increase by more than 5% of the intended LOX flow. Furthermore, the same outcome
is possible if the fuel mass flow is lower than required; which is why a redline was also set on the
inlet pressure measured upstream of the main engine fuel valve. If the conditions of the redlines
are met during a hot-fire test, the system will automatically initiate the programmed cutoff
sequence. The cutoff sequence closes the main engine valves thus terminating propellant flow to
the engine, closes the propellant run tank isolation solenoid valves, opens the propellant bleed
lines, opens the run-line and engine purges lastly opens the tank pressure vent solenoids in order
to depressurize the tanks. Once the reason for the cutoff is determined the appropriate solution will
be determined.
The other two redlines programmed into LabView are used to ensure that the hardware
does not fail. As aforementioned, there are 24 thermocouples mounted at several axial and
circumferential locations on the chamber which measure the hot wall temperature. Furthermore,
there is a pressure transducer mounted off of the combustion chamber that measures Pc. These

91
sensor outputs are used to mitigate burning through the hardware and to ensure that there is ignition
of the engine propellant influx in the chamber. If Pc is not established or lower than the expected
value, ignition was not achieved and propellant flow should be stopped so that oxygen and methane
does not pool in the chamber. Furthermore, if ignition was registered and Pc abruptly drops during
the test then there might have been a burn through in the chamber wall, which should not occur
based on the hot wall temperature redline.
Nonetheless, redlines will be included into every hot-fire test and will be adjusted after
initial testing based on the experience and insight gained. The capability of programing the DAQ
system with redlines during a test is extremely useful and will ensure that the system operates as
is intended.

92
Chapter 5: Conclusion
This chapter will discuss what work must be conducted before hot-fire testing the engine
at the time this thesis was written. It will also provide system enhancement recommendations in
order to improve the test facility which will make testing less ambiguous and increase the
understanding of testing with cryogenic propellants.
Thus far the purpose behind the design and fabrication of CROME has been covered, the
design criteria used to design CROME and the D1 Test Facility which will be used to test the
engine was discussed, and the objectives for hot-fire testing CROME were given.
To recap, CROME is a throttleable LOX/LCH4 500 lbf rocket engine. It is intended to be
used as the main propulsion system of small space vehicles like DAEDALUS. CROME is being
developed over three different stages and is currently in its first stage, which will demonstrate
engine operation and will evaluate engine performance through the hot-fire testing of CROME on
a mobile horizontal test stand. Furthermore, this test campaign will characterize the engine’s actual
operating conditions (i.e. pressures and temperatures) through its designed thrust range, 125 – 500
lbf. This data will then be used to redesign a flight like engine which will also undergo testing on
the D1 Horizontal Test Stand. This first design of CROME is a ground test engine that features
tunable acoustic cavities for dampening of combustion instability, a fuel film cooled injector
design for the cooling of the engine’s combustion chamber, a hot-wall temperature monitoring
system, and a main engine valve actuation system. It is a bolt on injector and chamber design in
order to maintain the possibility of testing different injector and/or chamber designs. Furthermore,
it allows for the hardware to be disassembled and inspected after a hot-fire test.
As mentioned above, a horizontal test stand was designed and built to test CROME. This
test stand is called the D1 Test Facility, which was built on two trailers: the propellant and engine

93
trailer. The propellant trailer houses two 100-gallon run-tanks, a propellant tank pressurization
system, all the appropriate lines to safely control the tank during test operations, and part of the
run-line. The engine trailer houses the engine which is mounted onto the thrust stand. It also
contains the second part of the run-line that delivers the LOX and LCH4 to the engine manifolding.
All fluid lines flow through one point on each trailer which are the bulk head plates bolted onto
each trailer and are interconnected with flex hoses. The flex-hoses will be disassembled when
towing the trailers to the test area and reassembled when both trailers have been towed and
correctly positioned. The oxygen side of the facility was sent to Astropak to be oxygen cleaned.
Furthermore, the tanks, tank manifolds, and run-lines will be insulated with Cryogel-Z in order to
reduce any heat transfer into the system when loading or flowing the propellants.
This test facility will be qualified and used to hot-fire test CROME in order to characterize
its performance. As the test program progresses so will the knowledge and understanding of the
propellant delivery system and engine. Parameters of interest during a hot-fire test is the propellant
mass flow and the measured chamber pressure during a hot-fire test, which will allow for a CEA
analysis to be conducted based on the achieved mainstage conditions and will be used in
determining the thrust, specific impulse, and c* efficiency of the hot-fire test. Appropriate redlines
will be used during every hot-fire test to ensure system, hardware, and most importantly operator
safety.
This is a very exciting time for cSETR and the LOX/LCH4 team as this will be the first
engine tested at this thrust level. However, engine testing is dangerous and demands the upmost
respect and caution. For this reason, all test operations will be conducted using approved
procedures which are currently being written, reviewed, and approved.

94
5.1 SYSTEM RECOMMENDATIONS
There are several improvements that can be made to the test facility which were not
currently made because of cost and/or schedule. These improvements and their value will be
discussed within this section.
The first improvement is the addition of surface temperature thermocouples throughout the
system. The locations of interest would be on the tank surface, upstream of the main engine valves,
and on the combustion chamber bolts. Sensors within the system are used to aid in effectively
running the system and having data to support operation decisions. Placing three surface
thermocouples on the tank, located on the bottom, mid and top of the tank, underneath the
insulation, would aid in understanding the temperature relationship of the tank and obtaining a
sub-cooled fluid when chilling/filling the tank with its respective propellant. Furthermore, these
measured temperatures could be used to characterize the effectiveness of the tank insulation. A
commonly used sensor for the indication of fluid level within a cryogenic tank is a thermocouple
rake. A thermocouple rake is a component with several thermocouple probes immersed to different
levels within the tank. The measured temperatures of the TC’s within the TC rake would be used
to indicate the level of sub-cooled propellant within the tank. Currently, the run-tanks have no
surface temperature thermocouples nor a TC rake. Instead, on a test day, a sub-cooled fluid will
be introduced into the tank via the fill line in order to chill the tank down. The tank chill is
concluded once the measured tank fluid temperature is lower than the saturated temperature of the
fluid at the pressure within the tank. A table of saturated temperatures as a function of pressure of
liquid oxygen, methane, and nitrogen is shown in the appendix. The filling of the tank, however,
continues until there is no longer any fluid flow between the micro-fueler or dewar and the run

95
tanks. If the surface thermocouples are installed there may be a temperature difference between
the three TC’s which can be used as a fluid level indicator.
Currently, the plan is to use a load cell placed underneath each tank leg to measure how
much propellant the tank contains. The “dry mass” is known as it is the weight of the tank, tank
manifolds, and lines that exert a force on the load cell so when a propellant is pooled in the tank
the load cells would measure the “wet mass”. The difference between these two is effectively the
weight of the fluid within the tank. The fill would be complete once the required propellant mass
was achieved which considers the mass of propellant that would be used to chill the run lines and
run a hot-fire test. However, this propellant monitoring system will not be used since the load cells
procured from PCB plastically deformed while installing the tank. The proposed method of
tracking how much propellant in the tank is an effective one, however, more robust load cells are
required (i.e. a higher mass measuring range with the 300% overload protection). The load cells
with the higher measuring range and the 300% overload protection are actually cheaper than the
load cells that were originally procured for this system. Currently, the fuel tank has four load cells
installed and are effectively acting as shims. It would be best to acquire 4 more load cells that
measure up to 1000 lbf and swap them out or at least purchase one of these load cells and assume
quarter symmetry of the measured mass. The oxygen tank will not be assembled with the load cells
originally acquired; instead, A36 steel load cell stand ins were fabricated and will be used in place
of the load cells. Communication between PCB and cSETR concluded that the purchased load
cells can be returned for partial credit which can than be used to purchase more robust sensors.
Since there is no TC rake, tank surface TC’s, or functioning load cells installed on the tank the
fluid temperature measured upstream of the 1st isolation hand valve will be used as an indicator of
what quality and quantity of propellant is left within the tank. Once this temperature measurement

96
rises above cryogenic temperatures then there is no longer any subcooled liquid within the tank,
meaning it is empty and all current and subsequent test operations will be stopped.
Another functional improvement to the system would be purchasing and installing a flare-
stack. A flare-stack in a test facility is used to completely burn all the fuel that is not directly burnt
during a hot-fire test. This would include the fuel used to chill in the run-line which is bled off
upstream of the main engine valve and vented to the surrounding area. This introduces a safety
hazard as gaseous methane clouds can potentially form without proper ventilation around/near the
test area. This methane mixes with air and forms a combustible mixture which can be ignited with
little activation energy and can harm the system and/or any test conductors working on the test
facility. The usage of a flare-stack would ensure that this fuel is burnt and that this hazard does not
become a reality.
Initial engine testing will be conducted without a flare-stack because of its high cost and
long lead time. However, careful considerations will be made when venting methane like ensuring
that there are no students working on the facility during this event and at the end of a hot-fire test
the run-line will be purged for a substantial amount of time to ensure that gaseous nitrogen dilutes
and pushes any methane near the vent away. A safety improvement that should be made is
purchasing portable hand held methane sensors for students to have at all times while working on
the facility. This sensor will warn the student if there is an excessive amount of fuel in the air that
can be dangerous and the student would slowly return to HQ until the fuel has been naturally
vented.
The last improvement that is recommended is the purchasing and installation of a real time
video camera system. This would allow for the test conductors and spectators at the remote-control
center to visually monitor the system as the test progresses. This is important as someone watching

97
the live feed can visually identify an issue with the system and/or engine and recommend the cut-
off sequence be executed. Currently, several video cameras will be setup before a test to record
the entire operation but will only be available after the test is conducted.
5.1 FUTURE WORK
Currently, the test facility is incomplete. The oxidizer side of the system is in transit back to UTEP.
In order to hot-fire test the engine the following must be conducted: the oxidizer side of the system
has to be carefully reassembled, the component harnessing must be finished, the facility and engine
must be leak checked, insulated, cryo-shocked, cold-flown, and finally hot-fire tested.
Instrumentation checks will be conducted before every test operation and a dry run will be
conducted before the cry-shock and hot-fire test. Furthermore, the procedures are currently being
reviewed and will require approval before conducting any testing. After the procedures are
approved the test campaign will begin and all test data obtained will be used in the design, analyses,
and fabrication of the second phase of CROME.
98
References
[1] D. K. Huzel and D. H. Huang, Modern Engineering for Design of Liquid-Propellant Rocket
Engines, Washington DC: American Institute of Aeronautics and Astronautics, 1992.
[2] Muscatello, A., & Santiago-Maldonado, E. (2012). Mars In Situ Resource Utilization
Technology Evaluation. 50th AIAA Aerospace Sciences Meeting including the New
Horizons Forum and Aerospace Exposition. doi:10.2514/6.2012-360
[3] G.P Sutton, Rocket Propulsion Elements, New York: Wiley, 2001
[4] Lopez, I. (2017). Design of a 2000 lbf LOX/LCH4 Throttleable Rocket Engine for a Veritcal
Lander. The University of Texas at El Paso.
[5] What is Oxygen Cleaning? (n.d.). Retrieved April 16, 2019, from
https://www.cpvmfg.com/news/what-is-oxygen-cleaning/
[6] Cengel, Y. A., & Cimbala, J. M. (2018). Fluid mechanics: Fundamentals and applications.
New York, NY: McGraw-Hill Education.
[7] Cryogenic Insulation – Cryogel® Insulation For Cold Work. (n.d.). Retrieved April 17, 2019,
from https://www.aerogel.com/products-and-solutions/cryogel-z/

99
Appendix A: Engine Component Drawings

100

101

102
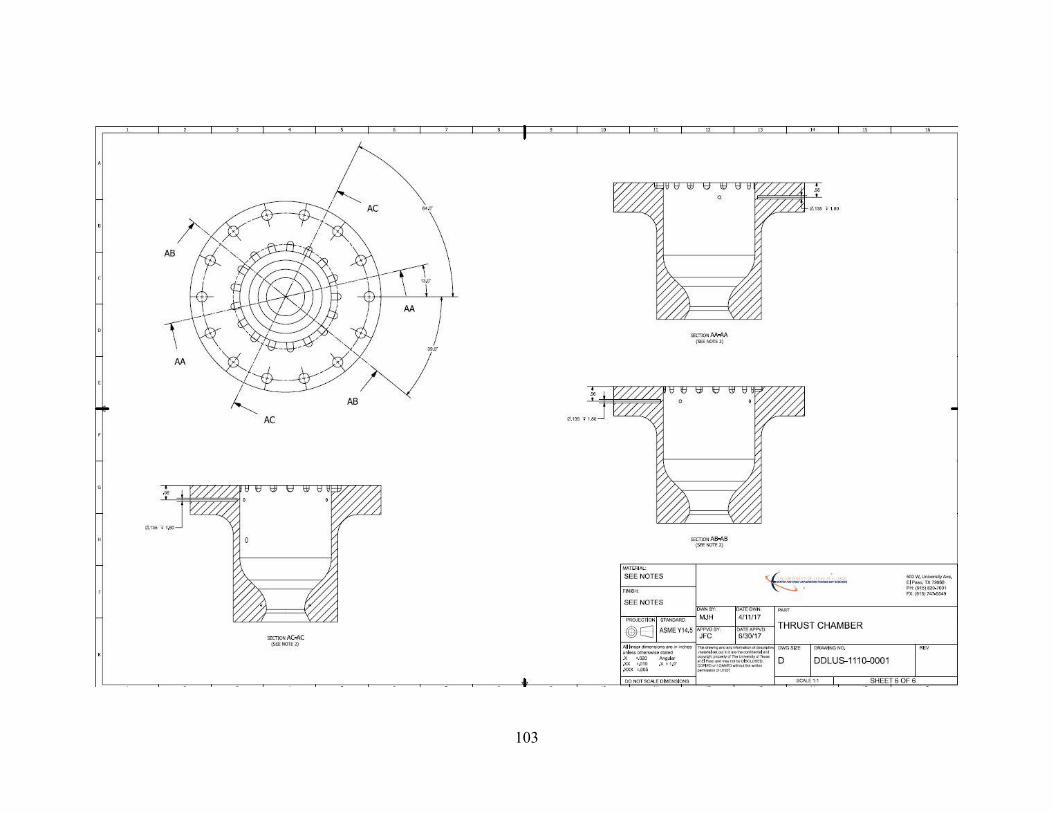
103

104

105

106

107

108
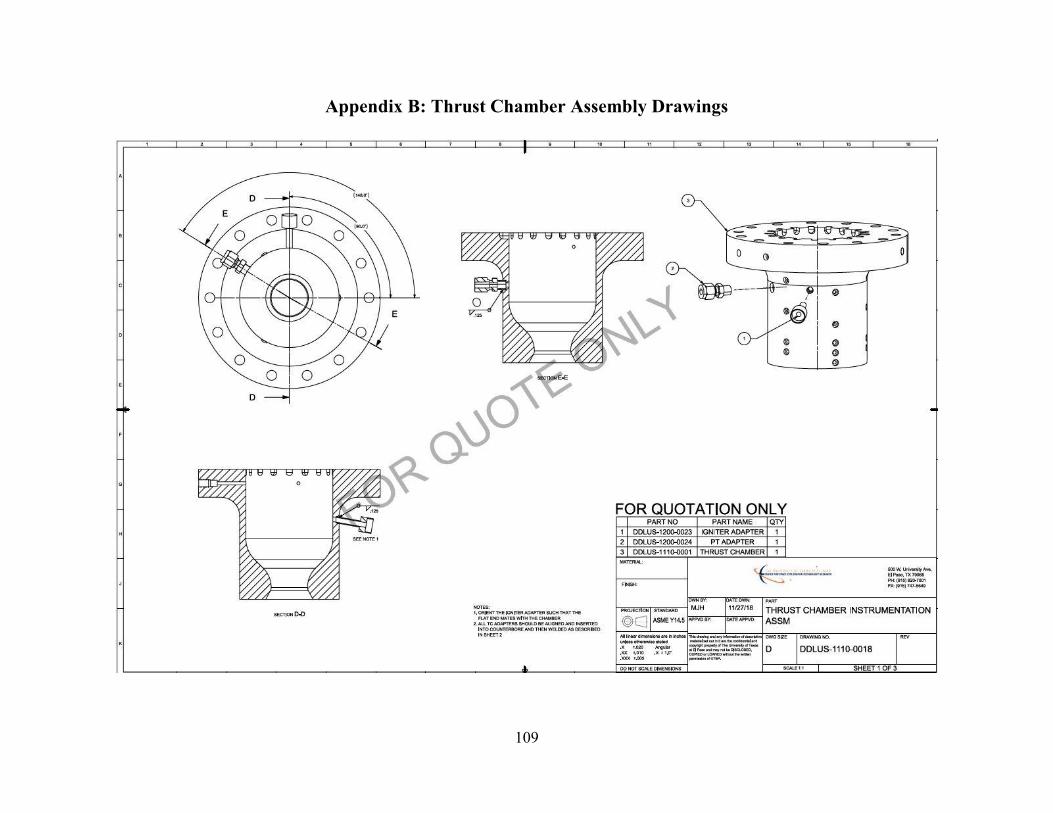
109
Appendix B: Thrust Chamber Assembly Drawings

110

111
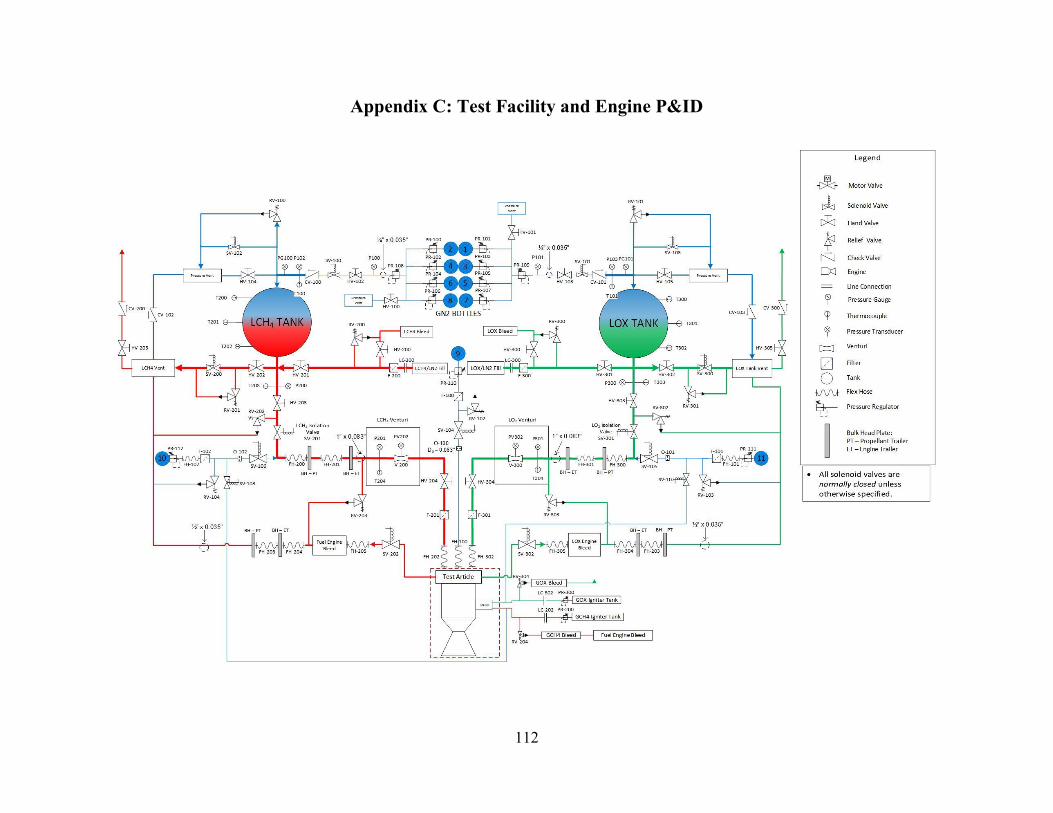
112
Appendix C: Test Facility and Engine P&ID
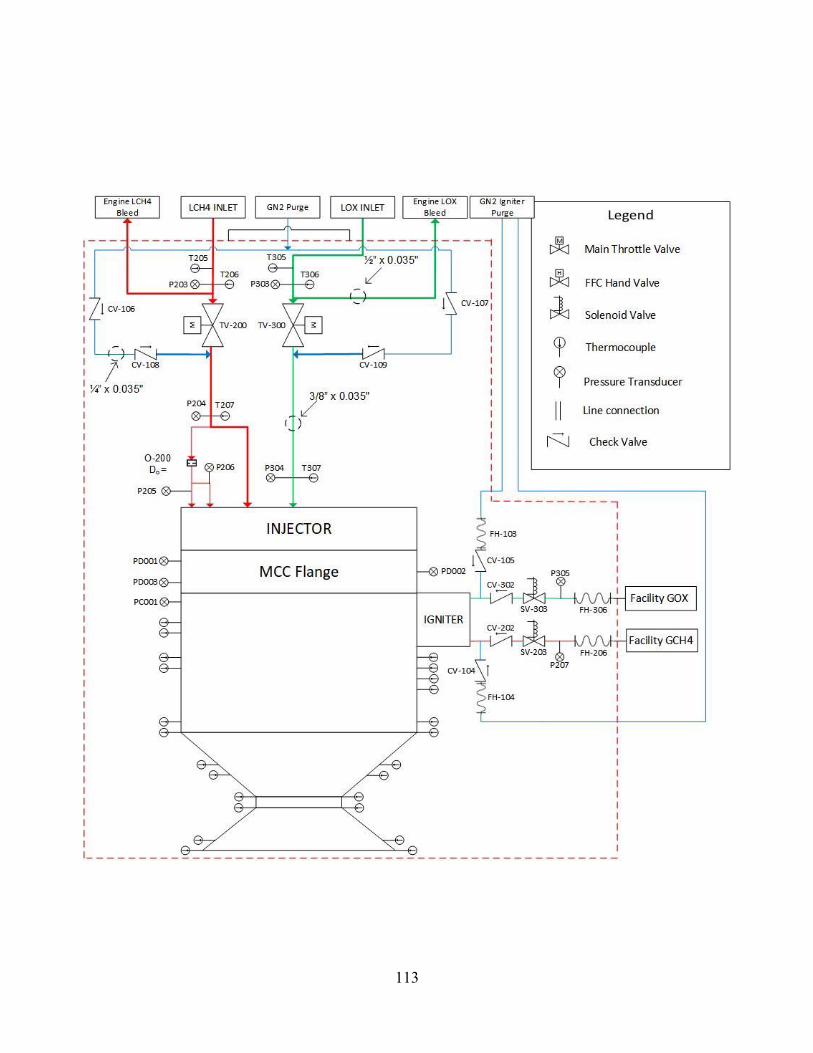
113

114
Appendix D: UNC and UNF Bolt Diameter and Area Table

115
Appendix E: SAE Specification for Steel Bolts

116
Vita
Manuel Jesus Herrera was born and raised in El Paso, Texas. After graduating from El
Dorado High School, he attended the University of Texas at El Paso to pursue a Bachelor’s of
Science in Mechanical Engineering degree on a Presidential scholarship. As a senior, he began
working with the Center for Space Exploration and Technology Research (cSETR) working on a
500 lbf liquid oxygen and liquid methane engine. In May of 2017, Manuel received his Bachelors
of Science in Mechanical Engineering. In the pursuit to further his education and improve his
portfolio, Manuel continued to graduate school to purse a Master’s of Science in Mechanical
Engineering. Manuel has participated in three internship experiences the most notable occurring
during Spring 2018 at NASA’s Marshall Space Flight Center, where he was exposed to rocket
engine design and engine testing. It is here, during this experience, where Manuel found his passion
for propulsion engineering.
Manuel has accepted a job offer with Blue Origin as a Test Engineer at their west Texas
facility and is expected to begin his employment in June 2019.
This thesis was written by Manuel J Herrera