the determinants and effects of slot servicescape
TRANSCRIPT

Anthony F. Lucas, PhD. Assistant Professor
William F. Harrah College of Hotel Administration University of Nevada,
Las Vegas 702-895-2065
Email Address: anthony,/[email protected]
The Determinants and Effects of Slot Servicescape Satisfaction in a
Las Vegas Hotel Casino
Anthony F. Lucas, Ph.D.
Abstract Scales representing ambient conditions, ability to navigate the slot floor,
cleanliness, interior decor and seating comfort all produce a significant effect on slot servicescape satisfaction. Scales representing slot servicescape satisfaction and gaming value produce significant effects on overall satisfaction with the slot experience. Overall satisfaction with the slot experience produces a significant effect on behavioral intention variables such as repatronage, word of mouth and desire to remain in the casino environment. This exploratory study uses data from a Las Vegas hotel casino to extend the work of Bitner ( 1992) and Wakefield and Blodgett ( 1996) related to servicescape effects. Simultaneous multiple regression analysis was used to test all one-tailed hypotheses at the .1 0 alpha level (n = 195).
Keywords: servicescape, physical environment, built environment, casino management, slot machines, slot management, casino environment, casino marketing
Introduction This study examines the effects of variables theorized to influence satisfaction
ratings with the physical environment of a slot floor (slot servicescape). Additionally, the effect of the slot servicescape satisfaction on overall experience satisfaction was examined and compared to the contributions of more traditional service-based satisfaction antecedents. Finally, the influence of overall slot player satisfaction on behavioral intentions was measured. All of these objectives were accomplished by employing scales designed to measure the proposed model constructs. These constructs then served as both independent and dependent variables in regression analyses conducted to determine the nature of the relationships between the model variables. Figure 1 depicts the hypothesized relationships.
UNLV Gaming Research & Review Journal • Volume 7, Issue I 1

Ambient
Factors
Casino
Layout Nav.
Cleanliness
Interior
Decor
Seating
Comfort
Satisfaction Casino Servicescape
Gaming
Value
Prompt
Service
Staff
Friendliness
Satisfaction Overall
Repatronage
Intentions
I( .. ,,,.,.,1
Desireto
Stay in Casino
Recommendatio
(Positive WOM)
Figure 1. Theoretical models: Determinants of servicescape satisfaction, overall experience satisfaction, and behavioral intentions.
Theories related to the role of the environment in the satisfaction process have been advanced (Mehrabian & Russell, 1974; Bitner, 1992), but few studies have empirically tested these theories in the leisure services industry. Wakefield & Blodgett (1996) empirically examined the role of the physical environment on the satisfaction process of leisure services consumers, including slot players. The current study extends the work of Bitner (1992) and Wakefield and Blodgett (1996), narrowing the scope to the slot floor of a hotel casino.
As slot operations consistently rank first in annual gaming revenues in Nevada (Nevada Gaming Control Board, 2000), a better understanding of the slot player satisfaction process may provide an edge in an increasingly competitive industry. The physical environment of the slot floor may provide the best opportunity for distinction among casinos, as the slot machine mix across Las Vegas Strip properties is relatively homogenous (J. Fitzpatrick, personal communication, April14, 2000). If servicescape satisfaction is found to influence the overall satisfaction of slot players, the identification of controllable antecedents would be of considerable value to casino executives. If overall satisfaction is found to influence word of mouth or repatronage intentions, knowledge of controllable servicescape satisfaction determinants would increase in value. Once these determinants were identified, experimentation could lead to measurable increases in operating profits.
Literature Review In general, people respond to the physical environment in affective terms
(Mehrabian & Russell, 1974). Environments tend to evoke affective sensations.
2 UNLV Gaming Research & Review Journal • Volume 7, Issue 1

The Determinants and Effects of Slot Sen•icescape Satisfaction in a Las Vegas Hotel Casino
Wakefield and Blodgett ( 1996) theorize that leisure service providers, such as casinos, primarily satisfy an emotional need for the consumer and therefore refer to these services as hedonic. Further, it is theorized that the effect of the servicescape on consumer satisfaction is exaggerated due to the extended length of time the consumer spends in the leisure service environment (Wakefield & Blodgett, 1996).
Ambient Conditions Various ambient conditions were theorized to affect the satisfaction ratings of slot
patrons. In this study, ambient conditions were considered to be intangible aspects of the slot environment capable of affecting the five senses (i.e., temperature or sounds). The following paragraphs describe various ambient conditions theorized to affect servicescape satisfaction.
In Sundstrom & Sundstrom's (1986) review of internal climate studies, researchers found that most people are comfortable between 67° and 73° F. Due to the size and frequently irregular configuration of casino floors, the internal climate can be difficult to control. For the same reasons, ventilation issues are also challenging. The internal air quality is often most affected by cigarette smoke, which can be remarkably offensive to nonsmokers. Nonsmokers have been found to respond to smoke-filled environs and smokers themselves in an emotionally charged manner (Jones, 1978; Jones & Bogat, 1978). Other research supports the importance of air quality/smoke levels to casino patrons (Francoeur, 1992).
In the late 1990's, slot technology featured advances in the areas of video graphics and sound (Edwards, 1998; Herriott, 1997; McKee, 1997). The success of these new machines suggested that visual and aural game features add to the quality of the overall sensory experience. Environmental psychology studies have also found that moderately dynamic visual and auditory stimuli can lead to increased arousal levels and ultimately increased levels of excitement (Mehrabian & Russell, 1974; Russell & Pratt, 1980). The clanking sound of coins falling into the metal slot trays not only creates auditory stimulation, but also provides evidence of winning.
Music and lighting level are often key components of ambience in restaurants. Music tempo and volume have been found to affect consumer behavior in restaurant and retail store settings (Milliman, 1982, 1986; Smith & Curnow, 1966). Although a different type of music may be appropriate for a casino, it is theorized to play a role in the slot servicescape satisfaction process. Francoeur (1992) found overall lighting levels to be a popular concern of casino patrons, when asked to describe their favorite casino. The research results related to interior lighting levels are mixed and appear to be a function of the setting. Most casinos employ a soft lighting strategy, which is usually associated with prestige and quality in retail settings (Gardner & Siomkos, 1985; Baker, Grewe!, & Parasuraman, 1994 ). The sum of the related research leads to the following hypothesis. HI: Ambient conditions (AMB) will produce a positive effect on servicescape satisfaction (SSAT).
Casino Navigation The degree of ease associated with navigating a casino environment is related to
what Bitner ( 1992) refers to as the spatial layout of the servicescape. The architecture, interior design and spatial layout of the environment can all evoke the sensation of crowding (Desor, 1972; Eroglu & Machleit, 1990; Stokols, 1972). A slot floor can certainly have too many machines, making it crowded and difficult to navigate. Additionally, aisle width has been specifically identified as an important navigational feature of a store/facility layout (Wakefield & Blodgett, 1994; Dabholkar, Thorpe, & Rentz, 1996).
When a person enters a new environment, orientation is often the most pressing
UNLV Gaming Research & Review Journal • Volume 7, Issue I 3

need (Wener, 1985). Sight lines and signs can help slot patrons orient themselves in the often unfamiliar environs of a casino floor. Sight lines are the visual paths available to the searcher. The management of casino sight lines has been cited as crucial to the visual topography of a floor layout (Steelman, 1998; Macomber, 1998). Additionally, the importance of signs in the in-store searching processes of consumers is well documented (Bitner, 1992; Dabholkar, et al., 1996; Levine, 1982; Levine, Marchon & Hanley, 1984). Machine density, aisle width, sight lines and the effective use of signs all play important roles in the successful navigation of a slot floor. The previous findings resulted in the following hypothesis. H2: Casino navigation (NAV) will produce a positive effect on servicescape satisfaction (SSAT).
Cleanliness It is reasonable to assume that a clean slot floor would be a desirable condition and
encourage what Bitner (1992) refers to as approach behavior. It is theorized that slot patrons do not like to see coin wrappers, dirty ashtrays and empty/dirty cocktail glasses while playing the machines. Research in the area of leisure services, including studies related to casinos, empirically supports the notion that cleanliness has a positive influence on servicescape quality (Francoeur, 1992; Wakefield & Blodgett, 1994; 1996; 1999). Other researchers have found the appearance of employees to be related to the perceived cleanliness of retail
Slot patrons do not like to see coin wrappers, dirty ashtrays and empty/dirty cocktail glasses while playing the machines.
store environments (Parasuraman, Zeithaml, & Berry, 1988; Levesque & McDougall, 1996; Fonvielle, 1997). Based on these findings the following hypothesis was formed. H3: Cleanliness (CLN) will produce a positive effect on servicescape satisfaction (SSAT).
Interior Decor Francoeur (1992) discovered that interior decor and overall lighting levels are
salient attributes of a desirable casino environment. General attractiveness of the environment as well as wall and floor treatments, specifically, have been found to affect servicescape satisfaction levels of slot patrons (Wakefield & Blodgett, 1996). Color has also been found to influence human responses to physical environments (Shaie, 1961; Mehrabian & Russell, 1974; Mahnke, 1987). As color is often central to the decor schemes of slot floors in Las Vegas, it is theorized to play a role in the servicescape satisfaction process. Flashing or flickering neon lighting is also common to casino floors. This type of decorative lighting has been found to create high levels of arousal, a component of excitement (Mehrabian & Russell, 1974). These findings are all related to satisfaction with the interior decor, resulting in the following hypothesis. H4: Interior decor (INT) will produce a positive effect on servicescape satisfaction (SSAT)
Seating Comfort The seating comfort construct in Wakefield & Blodgett's (1996) study did not
produce a significant effect on perceived servicescape quality, in the casino sample. However, other research suggests that seating comfort may influence servicescape satisfaction (Bitner, 1992). Studies have shown that padding (Branton & Grayson, 1967), backrests (Floyd & Ward, 1969) and fabric/heat-dissipating seat upholstery (Oboume, 1987) all increase a person's comfort level. Bitner (1992) suggests that physical comfort is related to servicescape quality evaluations.
Crowded seating conditions can also create feelings of physical discomfort. Research results indicate that the space between chairs in a room is directly related to
4 UNLV Gaming Research & Review Joumal • Volume 7, Issue 1

The Determinants and Effects of Slot Servicescape Satisfaction in a Las Vegas Hotel Casino
I the crowding sensation (Worchel & Teddlee, 1976). Physical
Physical surroundings or spatial conditions that produce feelings
of restricted movement have been found to evoke the
surroundings or spatial conditions that produce feelings of restricted movement have been found to evoke the crowding sensation (Desor, 1972; Stokols, 1972; Eroglu & Machleit, 1990). For example, slot machines placed closely together create insufficient personal space and limited maneuvering conditions. The following hypothesis was based on the results of the aforementioned research. crowding sensation. H5: Seating comfort (SC) will produce a positive effect on servicescape satisfaction (SSAT).
Overall Satisfaction Servicescape satisfaction is theorized to be one aspect of overall satisfaction with
the slot experience. A pilot study conducted in a Las Vegas hotel casino found that casino atmosphere influenced overall satisfaction ratings related to the gaming experience (Johnson, Hu, & Chen, 1998). Bitner (1992) theorizes that holistic servicescape evaluations are related to cognitive and affective internal responses (e.g., overall satisfaction). Ultimately, these internal responses lead to approach or avoidance behavior (e.g., repatronage).
The second phase of the model attempts to determine the effect of servicescape satisfaction on overall satisfaction, while controlling for the effects of more traditional satisfaction determinants. Focus group discussions and a review of literature identified perception of gaming value, staff friendliness and service promptness as forces central to a slot player's overall satisfaction. Overall satisfaction was limited to the consumer's experience, beginning with entry onto the slot floor and ending with his or her decision to end play.
Gaming Value In the typical slot experience, many more players will lose than win (Kilby &
Fox,1998). As a result of this verity, focus group participants often mentioned the looseness of machines and time on device as proxies for gaming value (Mayer, et al., 1998). Although most players will lose, the number of opportunities to win remains important to slot players. In the general marketing literature, a positive relationship between price-value and satisfaction is a popular hypothesis, but empirical support for the theory is mixed (Zeithaml, 1988).
Service Promptness and Staff Friendliness Cocktail, change and hand-paid jackpot services can all be measured by the slot
patron in terms of promptness or speed. Focus groups and research have identified service speed as an important facet of the overall satisfaction process of slot players and leisure services, in general (Mayer, et al., 1998; Wakefield & Blodgett, 1999). Staff friendliness has also emerged as a key decision criterion in both the casino selection and repatronage decision processes (Mayer, et al., 1998; Richard & Adrian, 1996). The previous paragraphs provided the foundation for the following hypotheses. H6: Slot servicescape satisfaction (SSAT) will produce a positive effect on overall satisfaction with the slot experience (OSAT). H7: Gaming value (GV) will produce a positive effect on overall satisfaction with the slot experience (OSAT). H8: Service promptness (PRMP) will produce a positive effect on overall satisfaction with the slot experience (OSAT). H9: Staff friendliness (FRND) will produce a positive effect on overall satisfaction with the slot experience (OSAT).
UNLV Gaming Research & Review Journal • Volume 7, Issue 1 5

Satisfaction to Loyalty Intentions The positive effect of customer satisfaction on loyalty-related behavior is
empirically supported by several studies (Anderson, Fomell, & Lehmann, 1994; Anderson & Sullivan, 1993; Fomell, 1992). This phase of the model provides the practical significance of the study, as the effect of overall satisfaction on the behavioral intentions of consumers is identified. Willingness to recommend, desire to remain in the casino environment and repatronage intentions represent specific aspects of slot player loyalty intentions. Due to the previous results related to the satisfaction/loyalty relationship, the following hypotheses were advanced: HlO: Overall satisfaction with the slot experience (OSAT) will produce a positive effect on repatronage intentions (RPI). H 11: Overall satisfaction with the slot experience (OSAT) will produce a positive effect on desire to stay in the casino environment (DES). H12: Overall satisfaction with the slot experience (OSAT) will produce a positive effect on positive word-of-mouth (WOM).
Methodology The research hypotheses were tested with data collected via intercept surveys
conducted in a Las Vegas Strip hotel casino, during the month of September 2000. A field study approach was employed, allowing for the subjects to remain in the environment while responding to the questionnaire. Although the sample was not randomly selected, steps were taken to randomize the selection process. Slot machine banks were randomly selected from a map of the slot floor. Given the selected bank's directional orientation, procedures governing the selection of subjects on that bank were imposed. These procedures limited the response duplicity associated with selecting two subjects from the same lateral side of a machine bank (e.g., a husband and wife). To be eligible for selection, the subject had to have been actively engaged in wagering activity. Once selected, subjects were asked to respond to three screening questions. When gaming, eligible subjects played slots at least 50% of the time, were not Nevada residents and had played slots for at least sixty minutes in the casino under study. A total of 325 subjects were approached, 244 of which completed the survey. However, the net effect of non-qualifiers, refusals and missing values reduced the data set to 195 usable cases. As an incentive, subjects that participated in the study were given a $2.00 roll of nickels.
The intercept survey was executed via a questionnaire containing 49 items related to aspects of the physical environment, satisfaction and various behavioral intentions. All responses were recorded on a Likert scale ranging from one to nine. The endpoints of the scale were anchored by the terms "disagree completely" and "agree completely." Subjects were also afforded ann/a (not applicable) option for statements that were unrelated to their slot experience. The subjects recorded their own responses to the survey using a pencil and a clipboard.
Due to the multidimensional nature of the constructs, composite indices were formed to test the relationships depicted in the model. For example, the seating comfort construct included an item related to back support and an item related to the amount of personal space (e.g., elbow room) afforded in the seating configuration. Although both are related to the core idea of seating comfort, the two items may fail to load together in a technique such as principal component analysis (PCA). A seat may provide adequate back support but fail to provide sufficient elbow room. In PCA, the extracted components are intended to be uni-dimensional, representing closely related aspects of a single construct.
The items included in the survey instrument were based on results from academic research, focus groups and discussions with industry and academic professionals. Although 32 of the 49 scale items were developed specifically for this study, 17 items
6 UNLV Gaming Research & Review Joumal • Volume 7, Issue 1

The Detem1inants and Effects of Slot Servicescape Satisfaction in a Las Vegas Hotel Casino
from existing scales were adapted or employed in their original form to measure some of the model variables. Table 1 lists the contributions of other authors to the scales used in this study. Most scales included items designed specifically for this study along with adapted items from existing scales.
Table 1 Composite Indices and Scale Item Contributors
Composite Index
Seating Comfort Interior Decor Cleanliness Casino Navigation Friendliness of Employees
Promptness of Service Slot Servicescape Satisfaction Desire to Stay in the Casino
Scale Item Contributors
Wakefield & Blodgett ( 1996) Wakefield & Blodgett (1996) Parasuraman, Zeithaml, & Berry (1988) Wakefield & Blodgett (1996) Mittal & Lassar ( 1996) Parasuraman, Zeithamal, & Berry (1988) Parasuraman, Zeithaml, & Berry (1988) Wakefield & Blodgett (1996) Wakefiled & Blodgett (1996)
A pilot study was undertaken to further refine the instrument. Data from the pilot study were also used to calculate Cronbach · s Alpha for each model construct. Once the survey instrument was adjusted and finalized, the formal data collection process was completed. Subsequently, a principal component analysis (PCA) was conducted on the items comprising the independent variables of the model designed to predict servicescape satisfaction. The PCA was employed to identify the latent structure of the data and corroborate the theory of five distinct components of servicescape satisfaction. Prior to the testing of the hypotheses, frequency tables were reviewed to identify out of range values or keypunch errors in the data set. Mahalanobis distances were analyzed to determine the presence of multivariate outliers as well. Bivariate scatterplots were examined to identify problematic curvilinearity among the composite indices. Although histograms indicated all composite indices to be negatively skewed, this condition was expected and not considered to be problematic.
Using the composite variables, simultaneous multiple regression analysis was conducted to determine the statistical significance of the hypothesized determinants of both slot servicescape satisfaction and overall satisfaction with the slot experience. Two separate regression analyses were conducted, one to explain the variance in servicescape satisfaction ratings and one to explain the variance in overall satisfaction ratings. Multiple regression analysis was an appropriate technique to examine both the individual significance of the independent variables and the collective ability of the independent variables to predict the criterion variables (Tabachnick & Fidell, 1996). Simple regression analysis was employed to test the effect of overall satisfaction on repatronage intentions (RPI), desire to stay in the casino environment (DES) and positive word-of- mouth (WOM). Due to the exploratory nature of this study, hypothesis tests were conducted at a .10 alpha level.
Results The descriptive statistics and scale reliability measures are reported in Table 2 at the
composite index level. All scale alphas exceeded Nunnally's (1978) recommended minimum level of . 70 for exploratory research. The gaming value scale recorded the smallest mean value (5.84) and the greatest standard deviation (2.08).
UNLV Gaming Research & Review Journal • Volume 7, Issue 1 7

Table 2
Descriptive Statistics and Reliability Measures for Composite Indices (N = 195)
Composite Index M SD Alpha a No. of Items Seating Comfort (SC 7.27 1.53 .88 5 Ambient Conditions (AMB) 7.23 1.43 .79 6 Interior Decor (INT) 7.38 1.39 .91 5 Cleanliness (CLN) 7.88 1.18 .91 6 Layout/Navigation (NAV) 6.96 1.68 .92 5 Gaming Value (GV) 5.84 2.08 .93 4 Staff Friendliness (FRND) 7.55 1.59 .96 4 Service Promptness (PRMP) 7.02 1.79 .92 4 Servicescape Satisfaction (SSAT) 7.16 1.61 .90 2 Overall Satisfaction (OSAT) 6.99 1.92 .90 2 Repatronage Intentions (RPI) 7.52 1.92 .96 2 Willingness to Recommend (WOM) 7.71 1.75 .97 2 Desire to Stay (DES) 7.20 1.96 .90 2
Note: acronbach's Alpha coefficient.
Table 3 contains the results of the regression analysis for the model designed to explain the variation in servicescape satisfaction ratings (see Table 4). The R2 for this regression was .46. Outliers were detected, but the residual diagnostics indicated no problematic violations of regression assumptions. The outlier cases were investigated and appeared to be valid observations however this regression analysis was repeated without the outlier cases to determine the extent of their impact on the solution. The results of the outlier-free regression analysis appear in Tables 5 and 6.
Table 3 Summary of Regression Analysis: SSAT Regressed on AMB, NAV, SC, INT and CLN (N = 195)
R .68
R2 Adjuste d R2 SEE .46 .45 1.20
Note: ***p < .01.
Table 4
F Durbin-Watson Statistic 32.40*** 2.02
Significance of Regression Coefficients: SSAT Regressed onAMB, NAV, SC, INT and CLN (N = 195)
Composite Variable Ambient Factors (AMB) Layout Navigation (NAV) Seating Comfort (SC) Interior Decor (INT) Cleanliness (CLN)
B .18** .29***.07 .13** .12* .23***
Note: *p < .10. **p < .05. ***p < .01.
SEB .09
.08
.08
.09
The results shown in Table 4 indicate that H 1 through H5 were fully supported. Each of the five independent variables hypothesized to affect servicescape satisfaction possessed a regression coefficient significantly different from zero at the .10 alpha level.
8 UNLV Gaming Research & Review Journal • Volume 7, Issue I

The Detenninants and Effects of Slot Servicescape Satisfaction in a Las Vegas Hotel Casino
Layout navigation (NAY) and cleanliness (CLN) produced the two greatest beta weights at .29 and .23, respectively. Additionally, both of these variables were significant at the .01 alpha level.
Table 5 and 6 present the results of the regression analysis without the cases identified as outliers. Three cases were lost due to Cook's distances that ranged well beyond the remaining cases, while two more cases were lost to high, studentized, deleted residual values. One final case was removed from the analysis due to its unusually large Mahalanobis distance. A total of six cases were declared as outliers and removed from the regression analysis. As a result of removing the outliers from the regression, the R 2 increased to .50 from .46 and the F statistic increased to 36.75 from 32.40. However, differences in the results of the individual hypothesis tests proved to be more dramatic (see Table 6).
Table 5 Summary of Regression Analysis with Outliers Removed: SSAT Regressed on AMB, NAY, SC, INT and CLN (N = 189)
R .71
R2 Adjuste d R2 SEE .50 .49 1.04
Note: ***p < .01.
Table 6
F Durbin-Watson Statistic 36.75*** 2.05
Significance of Regression Coefficients with Outliers Removed: SSAT Regressed on AMB, NAV, SC, INT and CLN (N = 189)
Composite Variable B SEB Ambient Factors (AMB) .26*** .08 Layout Navigation (NAV) .33*** .06 Seating Comfort (SC) .07"' .07 Interior Decor (INT) .11 * .07 Cleanliness (CLN .07"' .09
Note: *p < .10. **p < .05. ***p < .01. n/s (not significant)= p > .10
Perhaps the most notable difference in the test results was the lack of significance associated with the seating comfort (SC) and cleanliness (CLN) variables, which were both previously significant at the .05 and .01 alpha levels, respectively (see Table 4). Also noteworthy was the increase in the regression coefficient of the ambient conditions (AMB) variable, increasing from .18 to .26. Additionally, the ambient conditions variable was significant at the .01 alpha level in the outlier-free regression, as opposed to the .05 alpha level with outliers present. Although no violations of regression assumptions were detected in the all-cases regression analysis, the condition of the scatter plots and P-P plots were improved by removing the outlier cases.
The results from Table 6 failed to support H3 and H5. With the cases identified as outliers removed from the analysis, the resulting effect of cleanliness (CLN) and seating comfort (SC) on servicescape satisfaction (SSAT) was no longer significant at the .10 alpha level. Support remained for HI, H2 and H4. The outlier-free regression was provided to demonstrate the sensitivity of this solution to outliers. However, investigation of the outlier cases provided no basis for removing the observations from the analysis. The outlier cases were indeed unusual, but appeared to be valid responses.
UNLV Gaming Research & Review Journal • Volume 7, Issue 1 9

Overall Satisfaction with the Slot Experience When overall satisfaction (OSAT) was regressed on servicescape satisfaction
(SSAT), gaming value (GV), service promptness (PRMP) and staff friendliness (FRND), collinearity diagnostics indicated problematic conditions. These conditions warranted the removal of the staff friendliness (FRND) and service promptness (PRMP) variables from the regression analysis, as these variables were exhibiting high variance inflation factors (VIF) and negative betas. Despite significant, positive, bivariate correlation with overall satisfaction (OSAT) at the .05 alpha level, the regression results indicated that these variables were negatively related to overall satisfaction (OSAT) and not significant at the .1 0 alpha level. Staff friendliness (FRND) and service promptness (PRMP) were removed from the regression analysis, leaving gaming value (GV) and servicescape satisfaction (SSAT) to predict overall satisfaction (OSAT). The result was a minimal decrease in the adjusted R2 from .607 to .606. Due to this minimal decrease in the explanatory power of the model, it was decided that the two-variable model would be retained for this analysis.
An attempt was made to combine the staff friendliness (FRND) and service promptness (PRMP) variables to remove the collinearity from the model, however the results proved this attempt to be unsuccessful. Each of the two variables was also removed from the analysis while leaving the other variable in the model. However, problematic collinearity conditions were present in these scenarios as well. The results displayed in Tables 7 and 8 were the least biased results with the greatest explanatory power.
The two remaining variables, servicescape satisfaction (SSAT) and gaming value (GV), explained .62 of the variance in overall satisfaction (OSAT). The results in Table 8 supported H6 and H7, while H8 and H9 were unable to be tested, due to the multicollinearity condition. The effects of servicescape satisfaction (SSAT) and gaming value (GV) were significant at the .01 alpha level.
Table 7 Summary of Regression Analysis: OSAT Regressed on SSAT and GV (N = 195)
R .78
R2 Adjuste d R2 SEE .62 .61 1.20
Note: ***p < .01
Table 8
F Durbin-Watson Statistic 153.13*** 1.82
Significance of Regression Coefficients: OSAT Regressed on SSAT and GV (N = 195)
Composite Variable B Servicescape Satisfaction (SSAT) .46*** Gaming Value (GV) .43***
Note: ***p < .01.
SEB .07 .06
The collinearity diagnostics of the final model were judged as acceptable, with both VIF's below 2.0. Additionally, no problematic violations of the assumptions related to regression analysis were detected. There were cases identified as outliers, but an examination of these observations indicated that they were valid cases. A regression analysis without the outlier cases was also conducted but no material differences in the results occurred.
10 UNLV Gaming Research & Review Journal • Volume 7, Issue 1
The Detenninants and Effects of Slot Servicescape Satisfaction in a Las Vegas Hotel Casino
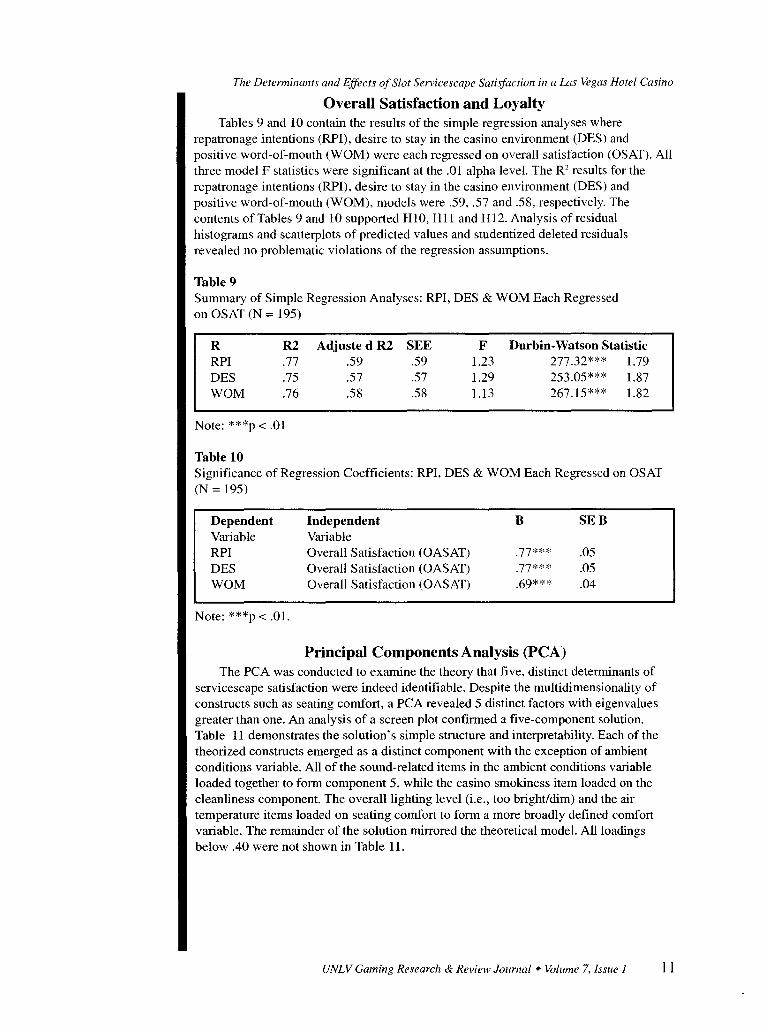
Overall Satisfaction and Loyalty Tables 9 and 10 contain the results of the simple regression analyses where
repatronage intentions (RPI), desire to stay in the casino environment (DES) and positive word-of-mouth (WOM) were each regressed on overall satisfaction (OSAT). All three model F statistics were significant at the .01 alpha level. The R" results for the repatronage intentions (RPI), desire to stay in the casino environment (DES) and positive word-of-mouth (WOM), models were .59, .57 and .58, respectively. The contents of Tables 9 and 10 supported H10, Hll and Hl2. Analysis of residual histograms and scatterplots of predicted values and studentized deleted residuals revealed no problematic violations of the regression assumptions.
Table 9 Summary of Simple Regression Analyses: RPI, DES & WOM Each Regressed on OSAT (N = 195)
R RPI DES WOM
R2 .77 .75 .76
Note: ***p < .01
Table 10
Adjuste d R2 SEE .59 .59 .57 .57 .58 .58
F 1.23 1.29 1.13
Durbin-Watson Statistic 277.32*** 1.79 253.05*** 1.87 267.15*** 1.82
Significance of Regression Coefficients: RPI, DES & WOM Each Regressed on OSAT (N=195)
Dependent Independent B SEB Variable Variable RPI Overall Satisfaction (OASAT) .77*** .05 DES Overall Satisfaction (OASAT) .77*** .05 WOM Overall Satisfaction (OASAT) .69*** .04
Note: ***p < .01.
Principal Components Analysis (PCA) The PCA was conducted to examine the theory that five, distinct determinants of
servicescape satisfaction were indeed identifiable. Despite the multidimensionality of constructs such as seating comfort, a PCA revealed 5 distinct factors with eigenvalues greater than one. An analysis of a screen plot confirmed a five-component solution. Table 11 demonstrates the solution's simple structure and interpretability. Each of the theorized constructs emerged as a distinct component with the exception of ambient conditions variable. All of the sound-related items in the ambient conditions variable loaded together to form component 5, while the casino smokiness item loaded on the cleanliness component. The overall lighting level (i.e., too bright/dim) and the air temperature items loaded on seating comfort to form a more broadly defined comfort variable. The remainder of the solution mirrored the theoretical model. All loadings below .40 were not shown in Table 11.
UNLV Gaming Research & Review Journal • Volume 7, Issue I 11

Table 11 Rotated Component Matrix: Independent Variables
Component Scale/Scale Item 1 2 3 4 5 Seating Comfort:
SC 1 seat back .74 SC2elbow room .79 SC3distance in front .71 SC4comfortable .77 SC5easy in & out .74
Ambient Factors: AMB 1 coin sound .87 AMB2machine sounds .85 AMB3music .61 AMB4lighting .51 AMB5temperature .47 AMB6smokiness .42
Interior Decor: INT1colors .76 INT2electric signs .67 .43 INT3wall treatment .83 INT4floor treatment .85 INT5 attractiveness .78
Cleanlineess: CLN 1 coin wrappers .80 CLN2ashtrays .84 CLN3c-tail glasses .84 CLN4cleanliness .85 CLN5employee appr .65 CLN 6mach screens .68
Layout/Navigation: NAV1sight lines .74 NAV2aisle width .66 NAV3signs/directions .86 NAV4find things .83 NAV5# of machines .71
Note: Varimax rotation with Kaiser normalization was employed in the principal component analysis. Rotation converged in seven iterations.
Discussion Hypotheses 1 through 5 were empirically supported in the all-cases model. This
support for the theoretical model of slot servicescape satisfaction was encouraging. Additionally, these findings provided general support for the theoretical models advanced by Wakefield & Blodgett (1996) and Bitner (1992), related to consumer evaluations of the servicescape.
One finding of theoretical significance was not associated with the hypothesis
12 UNLV Gaming Research & Review Journal • Volume 7, Issue 1

The Determinants and Effects of Slot Servicescape Satisfaction in a Las Vegas Hotel Casino
testing, but rather the analysis of one model's discriminant validity. The results of a principal component analysis (PCA) yielded support for a five-component solution related to the latent structure of the servicescape determinant matrix. This result was encouraging as it supported the underlying theory related to the model's variable selection process. Although three of the six items from the ambient factors scale loaded on other components, the solution remained interpretable. The item related to air quality (smoky) loaded on the cleanliness component. The items related to the overall lighting level and the comfort of the ambient air temperature loaded on the seating comfort component, forming a broader definition of comfort. The results of this PCA certainly increase the validity associated with these scales and encourage replication of the scales to further clarify and validate the structure found in this study.
Managerial Implications The results of the study identified five controllable determinants of servicescape
satisfaction and found the servicescape to influence overall experience ratings. Additionally, the overall satisfaction variable was found to significantly affect willingness to recommend (WOM), repatronage intention (RPI) and desire to stay in the casino
There is little evidence in Las (DES). These results highlight the importance of the servicescape
Vegas of servicescape management/maintenance. Most
of the attention to the servicescape is paid in the design phases of a hotel casino property.
to the overall slot experience with regard to satisfaction and its associated behavioral intentions.
There is little evidence in Las Vegas of servicescape management/maintenance. Most of the attention to the servicescape is paid in the design phases of a hotel casino property. Typically, it is difficult to obtain capital investment funds for servicescape-related improvements or changes, as the incremental cash flow associated with such an investment is abstract and difficult to quantify (Y. Harris, personal
communication, April 28, 2000). Hopefully the results of this study will help decrease these capital investment apprehensions and make the potential effects of the servicescape on casino performance less abstract. This assumes that satisfaction will lead to performance gains, resulting from increased repatronage, positive word of mouth and time in the servicescape.
Casino Navigation The layout navigation variable (NAV) produced a significant effect on servicescape
satisfaction (SSAT) at the .01 alpha level and recorded the greatest regression coefficient, at .29. This result indicates the importance placed on the navigation-related qualities of the slot servicescape. Slot players appear to be concerned with servicescape attributes that assist them in locating items or places of interest. Research supports the notion that people have a strong need to orient themselves or find their way in unfamiliar environs (Wener, 1985).
In some cases it may make sense to remove machines from the slot floor to improve sight lines. Traffic flow to previously hidden areas of the floor may improve, resulting in a form of increased capacity. Sight lines that increase capacity utilization could certainly result in material gains in business volumes.
Clear and common signage indicating machine type (e.g., video poker) and denomination may limit the frustration of players searching for a particular machine. Additionally, clear and visible signage related to restroom location may improve the functionality of the environment and customer relations. However, the challenge for casino management is to incorporate clear and functional signage into the decor scheme, as the interior attractiveness of the servicescape is also important to satisfaction levels.
UNLV Gaming Research & Review Journal • Volume 7, Issue I 13

Interior Decor If no capital improvements were made or the maintenance of the interior was
neglected, a replication of this study may produce different results. The challenge for many casino executives is to think of the interior decor or the maintenance of the existing decor as an investment with an associated return, and not a sunk cost. The results of this study provide a foundation for this philosophy, as the interior decor variable was found to influence servicescape satisfaction ratings.
An argument could be made for keeping the decor interesting, as 53% of the survey respondents indicated they visit Las Vegas casinos at least three times annually. This visitation frequency may be important, as continued exposure to the same decor scheme could reduce the overall appeal of the servicescape. Keeping the interior decor of a casino looking new and interesting can be expensive, but revamping the decor may be one key to maintaining the draw capability of the environment. It
Keeping the interior decor of a casino looking new and interesting can be expensive, but revamping the decor may be one key to maintaining the draw capability of the environment.
is conjectured that new casinos continually experience crowds upon opening, due in part, to consumer curiosity related to design, theme and decor. Even small-scale decor improvements may prove sufficient for maintaining the interest of the slot player.
Cleanliness The cleanliness variable was found to influence servicescape satisfaction ratings,
recording the second greatest regression coefficient, at .23. In Wakefield & Blodgett's (1996) study of three Reno, Nevada casinos, the facility cleanliness construct was found to exert the greatest impact on servicescape quality levels. Additionally, the results of a private study conducted to investigate casino patronage motivations found casino cleanliness to be the most influential choice factor for Midwestern, riverboat gamblers (J. Kilby, personal conversation, February 15, 2000).
Casinos face difficult challenges with regard to cleanliness issues. Most casinos are cleaned during the graveyard shift (i.e., 2:00am- lO:OOam) when business volumes are at the lowest level. Focus group participants offered some interesting suggestions with regard to improving the cleanliness of the servicescape during peak business hours. ( 1) Consumer perceptions of cleanliness may be improved by increasing the presence of porters during peak business hours. These additional porters could be responsible for cleaning the fingerprints off of machine screens and picking up coin wrappers from the aisles. (2) Employees, such as bus people, could be sent into the servicescape to assist cocktail servers in the retrieval of dirty cocktail glasses that accumulate during peak business periods. These suggestions should be considered, as the results of this study and others indicate that investing in cleanliness is related to satisfaction levels. Cost oriented casino managers may want to reconsider their position regarding the number of porters to employ.
Seating Comfort Seating comfort also positively influenced servicescape satisfaction ratings. This
result was meaningful, as the casino under study employed a wide variety of seats on the slot floor. It is not uncommon for a Las Vegas casino to have slot machine seats that vary in terms of back support, seat covering (i.e., fabric or vinyl), cushioning and maneuverability. The spatial configurations of Las Vegas slot floors also vary with regard to machine density. All of these attributes are components of seating comfort. However, each of these attributes or options can be affected by cost considerations. For example, fabric covered seats are more expensive than vinyl covered seats and seats with backrests are more expensive than stools without backrests.
The results of this study indicate that seating comfort is positively related to
14 UNLV Gaming Research & Review Journal • Volume 7, Issue 1

The Detenninants and Effects of Slot Servicescape Satisfaction in a Las Vegas Hotel Casino
servicescape satisfaction, providing support for abandoning a pure cost focus with regard to slot machine seating. Many times managers need to see evidence that an attribute is important to customer satisfaction before they feel comfortable investing in it. Although this study certainly does not prove cause and effect, the results support the notion that seating comfort is important to slot players. Additionally, comfortable slot players are more likely to stay in the servicescape, increasing the chances of extended gaming sessions.
Managers need to see evidence that an attribute is
important to customer satisfaction
before they feel comfortable investing in it.
With regard to existing research, the findings related to the effect of seating comfort support theory advanced by Bitner (1992) and refute the findings of Wakefield and Blodgett (1996). One component of Bitner's theory holds that the physical comfort associated with a servicescape will lead to positive perceptions of that environment and ultimately, approach behavior. Bitner's theory would categorize seating comfort as physical comfort. The positive effect of seating comfort on servicescape satisfaction supports Bitner's notion of the positive relationship between physical comfort and a person's evaluation of an environment. Wakefield and Blodgett also noted Bitner's theory related to the
exaggerated importance of comfort when consumers spend extended periods of time in the servicescape. Their results indicated that seating comfort did not influence servicescape quality ratings in their casino sample. However, Wakefield and Blodgett's seating construct was general and not adapted to casinos in particular, as outdoor stadiums were also examined with the same survey instrument. This may have had some bearing on the results.
Ambient Conditions Although the ambient factors of the servicescape were found to influence
servicescape satisfaction, this construct featured the most variability with respect to the nature of the scale items. Three of the items were related to comfort sensations while the remaining three items were related to aural sensations. This inter-item disparity was a likely contributor to the failure of the six items to load together in the principal component analysis.
Grayston (1974) makes the point that the ideal ambient conditions of an environment vary across setting, task and individual. This point is of particular importance to this study, as each casino must find the ambient factor combination that best suits the desires of its targeted clientele. The casino examined in this study now has
The ambient factors of the slot environment are important to
customer satisfaction and should be managed.
evidence suggesting that ambient factors (AMB) are important to the satisfaction levels of its clientele. Further exploration may be accomplished through experimentally manipulating specific ambient conditions and measuring the resulting effects. The results of the current exploratory study simply indicate that the ambient factors of the slot environment are important to customer satisfaction and should be managed.
The results associated with the ambient conditions (AMB) scale support the qualitative findings of Francoeur ( 1992) with
regard to the importance of the ambient conditions to the casino environment profile. These results also supported Bitner's (1992) general notion that the ambient conditions of an environment are an important component of a consumer's holistic evaluation of that environment. Further, Bitner notes the exaggerated importance of ambient conditions when the consumer is exposed to the environment for an extended period of time. As slot players can spend several hours at a time in the servicescape, the result of this study lends support to Bitner's theory. The positive impact of the ambient factors on servicescape satisfaction also supports the findings of Wakefield and Blodgett (1999).
UNLV Gaming Research & Review Journal • Volume 7, Issue 1 15

Servicescape Satisfaction Overall satisfaction (OSAT) was regressed on the servicescape and gaming value
variables. Both independent variables were significant at a .01 alpha level, with the servicescape satisfaction (SSAT) variable producing a beta weight of .46 against .43 for GV. This result may surprise some industry professionals, as it has been the author's experience that gaming value perceptions are much more widely theorized to influence overall customer satisfaction (McKee, 1998 ). However, the result of this study highlights the relative contribution of servicescape satisfaction (SSAT) to that of the more traditionally accepted determinant of overall satisfaction. Further, these results support the findings of a pilot study designed to predict overall customer satisfaction with the gaming experience (Mayer, et al., 1998). Their model produced significant effects for both an atmospheric/environment variable and a gaming value variable with the environment variable producing the greater of the two influences.
Gaming Value This variable recorded the lowest mean value of any composite variable in the
study, at 5.84, and the greatest standard deviation, at 2.08. The mean value nearest to gaming value (GV) was the layout navigation (NAV) variable, at 6.96. There were more low scores on the GV variable than any other variable, indicating that several participants tended to disagree with the positive gaming value statements. Expressions related to the inability to win at the slot machines were abundant in the comments section of the survey instrument. Management also expressed concern regarding the high hold percentage of the slot floor. The results of this study indicated that gaming value perceptions were positively related to overall satisfaction with the slot experience. However, this particular casino may want to consider formulating a plan to improve gaming value perceptions.
Limitations The instability of the servicescape satisfaction model was indicated, as six outlier
cases were removed from the analysis, resulting in the reversal of two hypothesis test decisions. Both the cleanliness and the seating comfort variables were no longer significant under the test parameters of the analysis. The removal of these six influential cases had a marked effect on the solution, indicating an unstable matrix. Although these cases were valid, the solution should be interpreted with caution.
The convergent and nomological validity of the scales was not measured. Due to data collection issues, the availability of comparable constructs and cost limitations, these forms of validity were not addressed. The identity and accuracy of the model constructs is compromised to a certain degree by the absence of these forms of validity. Reliability measures (alphas) may have been inflated, as the survey instrument did not randomize the order of the items. The items were grouped by construct and the survey instrument included section/construct titles (e.g., Overall Satisfaction), which indicated the intended similarity of the items.
The analysis of the data may be biased as a result of the difference in the refusal rates experienced by the two interviewers that administered the survey. It is possible that one interviewer may not have appealed to a certain character of person, producing a unique influence on the solution. There are many possible scenarios related to differences in the sub-samples obtained by each interviewer. These effects remain unknown, as differences in the responses obtained by each interviewer were not examined.
Although the research hypotheses are stated in terms of the effect an independent variable will produce or exert, it should be noted that regression analysis does not provide proof of a cause and effect relationship. So the results of the hypothesis tests
16 UNLV Gaming Research & Review Journal • Volume 7, Issue I

The Detenninants and Effects of Slot Servicescape Satisfaction in a Las Vegas Hotel Casino
should be strictly interpreted as support for the tenability or plausibility of the theoretical models. All language or reference to effect or influence is intended to describe the presence or absence of a model effect.
Recommendations for Future Research
Servicescape Scale Expansion The results of the servicescape satisfaction model were moderate, as .46 of the variance in servicescape satisfaction (SSAT) was explained by the independent variables. This result may be due to individual preferences or a high degree of random variation associated with the criterion variable. However, during the course of the study the following variables were identified as additions to the model that could improve its explanatory power.
1. A scale addressing the attractiveness of the employees and/or customers of the hotel casino.
2. A scale designed to measure the feeling of safety from harm or theft. Certain hotel casinos in Las Vegas have marketed themselves as gathering places,
featuring party-like atmospheres similar to that of nightclubs (e.g., Hard Rock Hotel and Casino). Other properties are known for the attractiveness of their cocktail servers (e.g., Rio Hotel Casino). These attributes may affect the satisfaction levels associated with the servicescape, as people are an important part of any environment (Russell & Snodgrass, 1987).
Most casinos experience problems with theft in the slot environment. Purse snatching teams are known to work casinos, preying on elderly persons and unsuspecting customers (Ivancevich, 1995). Modifications to slot cabinetry have been made to prevent purse-snatchers from reaching through machines to steal handbags and other items of value. Security is an important marketing issue for casinos, as no casino wants to be thought of as unsafe environment.
Further Examination of Servicescape Determinants This study determined that each of the five variables theorized to influence servicescape satisfaction was significant under the imposed test parameters. However the next step is to experimentally examine the economic implications of these variables. For example, determine the effect of seating comfort on length of play. This experiment would control for the effects of machine location, game type and other controllable influences on length of play, attempting to vary only seat quality. Players would be observed as to their length of play and analysis of variance could determine whether a significant difference exists between the mean values of the length of play measurements. This result would help casino management better understand the economic effects associated with the various seat designs, as a change in length of play is easily restated in terms of coin-in.
UNLV Gaming Research & Review Journal • Volume 7, Issue 1 17

References
Anderson, E. W., Fornell, C., & Lehmann, D. R. (1994). Customer satisfaction, market share and profitability: Findings from Sweden. Journal of Marketing, 58(July), 53-66.
Anderson, E. W., & Sullivan, M. (1993). The antecedents and consequences of customer satisfaction for firms. Marketing Science, 12(Spring), 125-143.
Baker, J., Grewel, D., & Parasuraman, A. (1994). The influence of the store environment in quality inferences and store image. Journal of the Academy of Marketing Science, 22(Fall), 328-339.
Bitner, M. J. (1992). Servicescapes: The impact of physical surroundings on consumers and employees. Journal of Marketing, 56( April), 57-71.
Branton, P., & Grayson, G. ( 1967). An evaluation of train seats by an observation of sitting behavior. Ergonomics, 10, 35-41.
Dabholkar, P. A., Thorpe, D. 1., & Rentz, J. 0. (1996). A measure of service quality for retail stores: Scale development and validation. Journal of the Academy of Marketing Science, 24( 1 ), 3-16.
Desor, J. A. (1972). Toward a psychological theory of crowding. Journal of Personality and Social Psychology, 21(1), 79-83.
Edwards, J. (1998). The game's the thing. Casino Journal, 11(9), 82-85. Eroglu, S. A., & Machleit, K. A. (1990). An empirical study of retail crowding:
Antecedents and consequences. Journal of Retailing, 66(Summer), 201-221. Floyd, W. F., & Ward, J. S. (1969). Anthropometric and physiological considerations in
school, office and factory seating. Ergonomics, 12, 132-139. Fonvielle, W. (1997). How to know what customers really want. Training and
Development, 51(9), 40-44. Fornell, C. (1992). A national customer satisfaction barometer: The Swedish experience.
Journal of Marketing, 56( January), 6-21. Francoeur, L. (1992). Applying the theme of "luck" to a destination resort with casino.
Masters thesis, Cornell University. [available UNLV library catalog]. Gardner, M.P., & Siomkos, G. J. (1985). Toward a methodology for assessing effects of
in-store atmosphere. In R. Lutz (Ed.), Advances in consumer research (pp. 27-31). Chicago: Association for Consumer Research.
Grayston, D. (1974). Music while you work. Industrial Management, 4(June), 38-39. Herriott, S. (1997). Reel-spinning talk. Casino Journal, 10(10), 104-109. Ivancevich, S. H. (1995). Casino surveillance: Internal control structure and beyond. The
Bottomline, 10(1), 30-33. Jones, J. W. (1978). Adverse emotional reactions of nonsmokers to secondary cigarette
smoke. Environmental Psychology and Nonverbal Behavior, 3(2), 125-1 127. Jones, J. W., & Bogat, A. (1978). Air pollution and human aggression. Psychological
Reports, 43(December), 721-722. Kilby, J., & Fox, J. (1998). Casino operations management. New York: Wiley. Levesque, T., & McDougall, G. H. G. (1996). Determinants of customer satisfaction in
retail banking. International Journal of Bank Marketing, 14(7), 12-20. Levine, M. (1982). You-are-here maps: Psychological considerations. Environment and
Behavior, 14(2), 221-237. Levine, M., Marchon, 1., & Hanley, G. (1984). The placement and misplacement of you
are-here maps. Environment and Behavior, 16(2), 139-157. Macomber, D. M. (1998). Casino ABC's: Building blocks to success. InS. Bybee (Ed.),
Principles of casino & gaming management (section 1 ). Las Vegas, NV: Author. [distributed in packet, UNLV course HOA 718].
Mahnke, F. H. (1987). Color and light in man-made environments. New York: Van Nostrand Reinhold.
18 UNLV Gaming Research & Review Journal • Volume 7, Issue 1

The Detenninants and Effects of Slot Servicescape Satisfaction in a Las Vegas Hotel Casino
Mayer, K. J., Johnson, L., Hu, C., & Chen, S. (1998). Gaming customer satisfaction: An exploratory study. Journal of Travel Research, 37(2), 178-183.
McKee, J. (1997). Back to the future. Casino Journal, 10(10), 110-111. McKee, J. (1998). Tough customers. Casino Journal, 11(10), 42-47. Mehrabian, A., & Russell, J. A. (1974). An approach to environmental psychology.
Cambridge, MA: MIT Press. Milliman, R. E. (1982). Using background music to affect the behavior of supermarket
shoppers. Journal of Marketing, 46(3), 86-91. Milliman, R. E. ( 1986). The influence of background music on the behavior of restaurant
patrons. Journal of Consumer Research, 13(September), 286-289. Nevada Gaming Control Board Quarterly Statistical Report, September 20, 2000. Carson
City, NV: The Board. Nunnally, J. (1978). Psychometric theory (2nd ed.). New York: McGraw-Hill. Obome, D. J. (1987). Ergonomics at work (2nd ed.). Liverpool, UK: Bath Press. Parasuraman, A., Zeitharnl, V.A., & Berry, L. L. (1988). SERVQUAL: A multiple-item
scale for measuring customer perceptions of service quality. Journal oiRetailing, 64(Spring), 12-40.
Richard, M.D., & Adrian, C.M. (1996). Determinants of casino repeat purchase intentions. Journal of Hospitality & Leisure Marketing, 4(3), 25-39.
Russell, J. A., & Pratt, G. (1980). A description of the affective quality attributed to environments. Journal of Personality and Social Psychology, 38(2), 311-322.
Russell, J. A., & Snodgrass, J. (1987). Emotion and the environment. In D. Stokols & I. Altman (Eds.), Handbook of environmental psychology (pp. 245-281). New York: Wiley.
Schaie, K. W. (1961). Scaling the association between colors and mood-tones. American Journal of Psychology, 74(2), 266-273.
Smith, P. C., & Curnow, R. (1966). Arousal hypotheses and the effects of music on purchasing behavior. Jou17!al of Applied Psychology, 50(3), 255-256.
Steelman, P. (1998). Casino size, pricing and profit chart. InS. Bybee (Ed.), Principles of casino & gaming management (section 1). Las Vegas, NV: Author. [distributed in packet, UNLV course HOA 718].
Stokols, D. ( 1972). On the distinction between density and crowding. Psychological Review, 79, 275-277.
Sundstrom, E., & Sundstrom, M. G. ( 1986). Work places. Cambridge, UK: Cambridge University Press.
Tabachnick, B. G., & Fidell, L. S. (1996). Using multivariate statistics (3rd ed.). New York: HarperCollins.
Wakefield, K. L., & Blodgett, J. G. (1994). The importance of servicescapes in leisure service settings. Journal of Services Marketing, 8(3), 66-76.
Wakefield, K. L., & Blodgett, J. G. (1996). The effect of servicescape on customers' behavioral intentions in leisure service settings. Journal of Services Marketing, 10(6), 45-61.
Wakefield, K. L., & Blodgett, J. G. ( 1999). Customer response to intangible and tangible service factors. Psychology and Marketing, 16(1), 51-68.
Wener, R. E. (1985). The environmental psychology of service encounters. In J. Czepiel, M. Solomon, & C. Suprenant (Eds.), The service encounter (pp. 101-112). Lexington, MA: Lexington Books.
Worchel, S., & Teddlee, C. (1976). The experience of crowding: A two-factor theory. Journal of Personality and Social Psychology, 34, 30-40.
Zeithaml, V. A. ( 1988). Consumer perceptions of price, quality, and value: A means-end model and synthesis of evidence. Journal of Marketing, 52(July), 2-22.
UNLV Gaming Research & Review Joumal • Volume 7, Issue 1 19