the determinants of financial performance of …
TRANSCRIPT

THE DETERMINANTS OF FINANCIAL PERFORMANCE OF COMMERCIAL BANKS
LISTED IN NAIROBI SECURITIES EXCHANGE
YATICH JAMES ROTICH
(B.A ECONOMICS) UNIVERSITY OF NAIROBI
A RESEARCH PROJECT SUBMITTED TO THE SCHOOL OF BUSINESS AND
ECONOMICS IN PARTIAL FULFILLMENT OF THE REQUIREMENTS FOR THE
CONFERMENT OF THE DEGREE OF MASTERS OF BUSINESS ADMINISTRATION
(FINANCE OPTION) KISII UNIVERSITY
JULY, 2020

ii
DECLARATION AND RECOMMENDATIONS
DECLARATION BY THE STUDENT
This is to declare that this project is my original work and has not been presented for a degree in
any other university
SIGNATURE--------------------------------------------------DATE-----------------------------
JAMES ROTICH YATICH
REGISTRATION NO: CBM12/10247/15
RECOMMENDATION BY THE SUPERVISORS
We the undersigned do declare that this project has been submitted for examination with our
approval as University Supervisors.
SIGNATURE ---------------------------------------------------DATE-----------------------------
Dr. Andrew Nyang’au
Lecturer, Department of Accounting and Finance
Kisii University
SIGNATURE ---------------------------------------------------DATE-----------------------------
Dr. Chesoli Wafula
Senior Lecturer, Department of Accounting and Finance
Kisii University

iii
COPY RIGHT
All the rights in this project are reserved. No part of it may be reproduced, stored in a retrieval
form or transmitted in any system or by any means electronic, mechanical, photocopying,
recording or otherwise, without the prior written permission of the author or Kisii University on
their behalf.
© 2019, Yatich James Rotich

iv
DEDICATION
This work is dedicated to my family made up of my dear wife Joan Kimutai, my lovely Daughters
Ashley Jebet and Nevaeh Jepkorir not forgetting my great young man Bryce Kebut for being there
for me all the time. Your smiles rejuvenated my life and made me feel comfortable being around
you. Lastly but not least special thanks go to the Almighty God for seeing me through the entire
journey. Amen

v
ACKNOWLEDGEMENTS
I sincerely wish to thank the almighty God for his guidance and protection which enabled me
complete my project this year after many years of false starts. I also want to immensely appreciate
the role played by my supervisor Dr. Andrew Nyag’au for taking his time to assist me to complete
my project. God bless you for your understanding, patience and endurance. I equally want to
appreciate my other supervisor Dr. Chesoli Wafula, for encouraging me to push harder even when
things seemed impossible.
God’s blessing be unto you.

vi
ABSTRACT
The intermediation role of commercial banks is bound by the extent to which its key business
performance drivers are manipulated to improve on financial performance and thus the study
examined the determinants of financial performance of commercial banks listed in Nairobi
Securities Exchange (NSE). The study was supported by the following specific objectives: to
establish the influence of deposits on financial performance of commercial banks listed in Nairobi
securities exchange, to determine the influence of capital adequacy on the financial performance
of commercial banks listed in NSE, to examine the influence of liquidity on financial performance
of commercial banks listed in NSE and to investigate the effect of loans on financial performance
of commercial banks listed in NSE. The target population for the study was all the eleven (11)
commercial banks listed in NSE covering a period of ten years from 2007 to 2017 and thus a survey
design of the eleven commercial banks listed NSE was undertaken. Secondary data was obtained
from published financial statements from commercial banks listed in NSE and annual banking
supervision reports from CBK was used in the study. The study used descriptive research design
to investigate the relationships between variables by use of mean, standard deviation, maximum
and minimum values. Also the study used correlation analysis to evaluate the association between
the independent variables and the dependent variables. Furthermore, the study used multiple
regression model to examine the strength of the relationship between the dependent and the
independent variables. The study also used correlation coefficients to test the null hypothesis. The
finding of the study illustrated that the relationship between Deposits and Return on Equity (ROE)
was positive and significant. The study found out that the relationship between capital adequacy
and ROE was insignificant. Furthermore, the study findings also revealed that the relationship
between liquidity and ROE was statistically insignificant. From the study findings, the relationship
between loans and ROE was found to be statistically significant. The study concluded that
management of commercial banks should embark at attracting, growing and retaining deposits and
also maintain a quality loan book so as to improve on financial performance. Furthermore the study
concluded that commercial banks should strive to attain minimum statutory capital adequacy and
liquidity ratio requirements so as not to attract costly penalties from the regulator.

vii
TABLE OF CONTENTS
DECLARATION AND RECOMMENDATIONS ...................................................................... ii
COPY RIGHT .......................................................................................................................... iii
DEDICATION .......................................................................................................................... iv
ACKNOWLEDGEMENTS.........................................................................................................v
ABSTRACT ............................................................................................................................. vi
TABLE OF CONTENTS ......................................................................................................... vii
LIST OF FIGURES ................................................................................................................. xii
LIST OF APPENDICES ......................................................................................................... xiii
LIST OF ABBREVIATIONS AND ACRONYMS ..................................................................xiv
CHAPTER ONE .........................................................................................................................1
INTRODUCTION ......................................................................................................................1
1.1 Background of the Study .......................................................................................................1
1.2 Statement of the Problem ......................................................................................................9
1.3 Objectives of the study ..........................................................................................................9
1.3.1 Main Objective ............................................................................................................9
1.3.2 Specific objectives ...................................................................................................... 10
1.4 Research Hypotheses ........................................................................................................... 10
1.5 Significance of the Study ..................................................................................................... 10
1.6 Scope and Justifications of the Study ................................................................................... 11
1.7 Limitations of the Study ...................................................................................................... 12
1.7.1 Delimitations of the Study ........................................................................................... 12
1.8Assumptions of the Study ..................................................................................................... 13
viii
1.9 Operational Definition of Key Terms .................................................................................. 13
CHAPTER TWO .................................................................................................................... 15
LITERATURE REVIEW ....................................................................................................... 15
2.1Theoretical Literature Review .............................................................................................. 15
2.1.1 Financial Intermediation Theory .................................................................................. 15
2.1.2 Money Creation Theory in Modern Economics ............................................................ 17
2.1.3Economic Value Added Theory. ................................................................................... 18
2.2 Empirical Literature review ................................................................................................. 20
2.2.1 Deposits and Financial performance ........................................................................... 20
2.2.2 Capital Adequacy and Financial Performance ............................................................. 24
2.2.3 Liquidity and Financial Performance .......................................................................... 27
2.2.4 Loans and Financial Performance ................................................................................ 31
2.3 Summary of Research Gaps ................................................................................................. 35
2.4 Conceptual Framework ....................................................................................................... 39
CHAPTER THREE ................................................................................................................ 42
RESEARCH METHODOLOGY ........................................................................................... 42
3.1 Research Design .................................................................................................................. 42
3.2 Study Area .......................................................................................................................... 42
3.3 Target Population ................................................................................................................ 42
3.4 Data Collection ................................................................................................................... 43
3.4.1 Instrumentation ............................................................................................................. 44
3.4.2 Data Collection Procedures ........................................................................................... 44
3.5 Data Analysis ...................................................................................................................... 44

ix
3.5.1 Descriptive Statistics ..................................................................................................... 44
3.5.2 Inferential Statistics ....................................................................................................... 45
3.5.3 Diagnostic Tests/Assumptions of Regression Model ...................................................... 46
3.6 Ethical Consideration .......................................................................................................... 46
CHAPTER FOUR ................................................................................................................... 47
DATA ANALYSIS AND DISCUSSIONS OF FINDINGS .................................................... 47
4.1 Descriptive Statistics ........................................................................................................... 47
4.1.1 Deposits........................................................................................................................ 47
4.1.2 Capital Adequacy ......................................................................................................... 49
4.1.2.1 Core Capital to Total Risk Weighted Assets............................................................... 50
4.1.3 Liquidity ........................................................................................................................ 52
4.1.3.1 Liquidity Ratio to Statutory Liquidity Ratio ................................................................ 52
4.1.4 Loans……………………………………………………………………………………….55
4.1.4.1. Loans and advances to Customers ............................................................................. 55
4.1.5 Financial Performance ................................................................................................... 57
4.1.5.1 Return on Equity (ROE) ............................................................................................. 58
4.2 Inferential Statistics ............................................................................................................. 60
4.2.1 Correlation Analysis ...................................................................................................... 60
4.3 Diagnostic Tests .................................................................................................................. 61
4.3.1 Tests for Homoscedasticity ........................................................................................... 61
4.3.2 Test for Normality ......................................................................................................... 62
4.3.3 Multi-collinearity Test ................................................................................................... 63
4.4 Regression Analysis ............................................................................................................ 64

x
4.4.1 Regression Analysis between Deposits and ROE ......................................................... 64
4.4.2 Regression Analysis between Capital Adequacy and ROE ........................................... 67
4.4.3 Regression Analysis between Liquidity and ROE ......................................................... 70
4.4.4 Regression Analysis between Loans and ROE .............................................................. 72
4.5 Testing Hypotheses ............................................................................................................. 73
4.5.1 Hypotheses One ............................................................................................................ 73
4.5.2 Hypotheses Two ........................................................................................................... 74
4.5.3 Hypotheses Three .......................................................................................................... 74
4.5.4 Hypotheses Four ............................................................................................................... 75
CHAPTER FIVE..................................................................................................................... 76
SUMMARY, CONCLUSIONS AND RECOMMENDATIONS ........................................... 76
5.1 Summary of Research Findings ........................................................................................... 76
5.2 Conclusions ......................................................................................................................... 77
5.3 Recommendations ............................................................................................................... 79
5.4 Areas of Further Research ................................................................................................... 79
REFERENCES ......................................................................................................................... 81
APPENDICES .......................................................................................................................... 90

xi
LIST OF TABLES
Table 3.1: Target population ..................................................................................................... 43
Table 4.1: Deposits ................................................................................................................... 48
Table 4.2: Core Capital to Total Risk Weighted Assets ............................................................. 51
Table 4.3: Liquidity Ratio to Statutory Liquidity Ratio .............................................................. 53
Table 4.4: Loans and Advances to Customers............................................................................ 56
Table 4.5: Return on Equity (ROE) ........................................................................................... 59
Table 4.6: Pearson’s Correlation Summary................................................................................ 61
Table 4.7: Results of Homoscedasticity ..................................................................................... 62
Table 4.8: Shapiro-Wilk for Normality Test .............................................................................. 63
Table 4.9: Multi-Collinearity test results ................................................................................... 64
Table 4.10: Model Summary-Deposits ...................................................................................... 65
Table 4.11: ANOVA-Deposits .................................................................................................. 66
Table 4.12 : Coefficientsa-Deposits ........................................................................................... 67
Table 4.13: Model Summaryb -Capital Adequacy...................................................................... 67
Table 4.14: ANOVAa -Capital Adequacy .................................................................................. 68
Table 4.15 :Coefficientsa -Capital Adequacy ............................................................................. 69
Table 4.16: Model Summaryb -Liquidity.................................................................................... 70
Table 4.17: ANOVAa -Liquidity ............................................................................................... 70
Table 4.18 :Coefficientsa -Liquidity .......................................................................................... 71
Table 4.19: Model Summaryb -Loans ........................................................................................ 72
Table 4.20: ANOVAa -Loans ..................................................................................................... 72
Table 4.21: Coefficientsa -Loans ............................................................................................... 73

xii
LIST OF FIGURES
Figure 2.1: Conceptual Framework ................................................................................................... 39
xiii
LIST OF APPENDICES
APPENDIX I: DATA COLLECTION INSTRUMENT ............................................................. 90
APPENDIX II: DEPOSITS ....................................................................................................... 91
APPENDIX III: CORE CAPITAL TO TOTAL RISK WEIGHTED ASSETS ........................... 92
APPENDIX IV: LIQUIDITY .................................................................................................... 93
APPENDIX V: LOANS ............................................................................................................ 94
APPENDIX VI: ROE ................................................................................................................ 95
APPENDIX VII: LIST OF COMMERCIAL BANKS LISTED IN NSE ................................... 96
APPENDIX VIII: RESEARCH PERMIT FROM NACOSTI .................................................... 97

xiv
LIST OF ABBREVIATIONS AND ACRONYMS
CBK - Central Bank of Kenya
ROA - Return on Assets
ROE - Return on Equity
GDP - Gross Domestic Product
SACCO - Savings and Credit Cooperative Society
SME - Small and Medium Enterprise
NIM - Net Interest Margin
MFC - Mortgage Finance Company
CBS - Central Bureau of Statistics
DTMFI - Deposit Taking Micro Finance Institution
MFI - Micro Finance Institution
PBT - Profit Before Tax
NPM - Net Profit Margin
CASA - Current Accounts and Savings Accounts
NSE - Nairobi Securities Exchange
SASRA - SACCO Societies Regulatory Agency
CMA - Capital Markets Authority
FP - Financial Performance
SD - Standard Deviation
1
CHAPTER ONE
INTRODUCTION
1.1 Background of the Study
The role of commercial banks in economic development is central through its critical function of
resource allocation. Financial institutions generally channel money from depositors with excess
cash over their expenditure to those with less cash through a process commonly referred to as the
financial intermediation. The financial intermediation process will only be successful if the
commercial banks are profitable. Financial performance or profitability of commercial banks is
measured by a number of financial ratios i.e. return on assets, return on equity or net interest
margin. These financial ratios are influenced by a number of environmental factors which are
either internal or external (Mutua, 2013)
The determinants of financial performance of banks listed in Nairobi Securities Exchange may
emanate from inside triggers under the purview and control of management and strategic
decisions of shareholders or external forces beyond the control of management. The internal
factors can be manipulated by management and shareholders of commercial banks to yield the
desired outcome in terms of the financial performance. The external forces can only be overcome
by adapting to it (CBK, 2017)
Hirindu and Kushani (2017) studied the factors effecting on bank profitability in Sri Lankan
domestic economy and found that deposits and profitability of commercial banks had a high
significant correlation. The study concludes that deposit mobilization which is under the control
of bank management can be harnessed to improve on bank performance. Trujillo (2013), in his
study of determinants of profitability of Spanish banks found that a higher proportion of deposits
in the balance sheet of Spanish banks contributes significantly to higher profits and was cited as

2
the major factors which can be exploited by management to improve on performance. Thus
deposit mobilization was highlighted as having significant and positive effect on financial
performance.
Javaid (2016) examined the bank specific macroeconomic factors of Pakistan banks and found
out that volume of deposits had a negative significant association with profitability of banks. This
was explained by the cost of holding huge liquidity instead of lending out the same borrowers.
The study concluded that banks management should level out the volume of deposits and loans
so as to improve on performance.
Capital is an internal environmental factor which enables commercial banks built internal
resilience against unanticipated negative systemic shocks in the operating environment is also an
important element influencing the profitability of performance of commercial banks (Cyton,
2018).
Stovrag (2017) examined a comparison of capital requirements and bank profitability between
large banks and small banks in Sweden. The findings suggested that niche banks improved on
their financial performance with increased capital adequacy while the same had an insignificant
impact on the profitability of large Swedish banks. The author attributes this to the need for
commercial bank management to manipulate other internal factors to improve on performance
when the optimal level of capital requirements has been exhausted.
Rodriquez (2014) studied the determinants of commercial bank profitability in Mexico and found
that among others, capital adequacy provokes a sufficiently great positive effect on profitability
of commercial banks.

3
Aymen (2013) studied the effect of capital on financial performance of Tunisian banks and the
findings suggested that relationship between capital adequacy and the financial performance of
the selected commercial banks is positive, however the correlation between capital adequacy and
return on assets appear to be statistically significant.
Amahalu, Okoye, Chike, Nweze, Chinyere, ObiOkika (2017) investigated the effect of capital
adequacy on the profitability of quoted money banks in Nigeria. The study revealed that capital
adequacy has a sufficiently great influence on the financial performance of listed banks in Nigeria
at 5% level of significance. The study seems to suggest that banks should minimize debt in their
capital structure to cushion itself against financial risk and bankruptcy.
Mbekomize and Mapharing (2017) studied the determinants of profitability of commercial banks
in Botswana and specifically investigated the association between profitability bank specific and
outside environmental factors of commercial banks. The study found out that among other factors,
capital adequacy had a statistical great influence on commercial banks performance and like other
studies suggested that management should gradually reduce debt in the capital structure as way
of building internal resilience against economic shocks.
Barus (2017) examined the impact of capital adequacy on the financial performance of savings
and credit societies in Kenya using explanatory research design targeting 83 SACCOs in
operation as at end of 2015. The study found that 86 per cent changeability in performance of
SACCOs were attributed to capital adequacy and the influence was found to be positive. This
amplifies the importance of capital concentration as a buffer for negative economic shocks which
might lead to insolvency.
4
The effect of liquidity on the financial improvement of commercial banks profitability is
important in that it enables financial institutions balance demand for loans and supply of deposits
and thus cushion itself against liquidity risks which might trigger run on deposits culminating in
sudden death of the affected financial institution (Cyton, 2018).
Srinivasan and Britto (2017) studied the financial performance of some selected commercial
banks in India. The study found that liquidity ratio and solvency as a strong positive predictor of
profitability.
Demirgunes (2016) examined the impact of liquidity on the financial performance on retail banks
in Turkey. The study focused on Borsa Istanbul (BIST) listed merchandising enterprises. The
study found a strong positive association between liquidity and bank performance and concluded
that enterprises with higher liquidity thresholds are in a position to meet their short team
obligations by taking advantage of investment opportunities on the short call notice i.e. short term
fixed deposits.
Botoe (2011) studied the effect of liquidity on profitability of commercial of Liberian commercial
banks and found a positive association between liquidity and bank profitability. The study
concluded that liquidity management by commercial banks ensures that working capital is not
necessarily tied up in idle assets thereby releasing funds for investment in productive activities.
Edem (2017) investigated liquidity management of deposit money banks in Nigeria between 1986
and 2011. The study specifically sought to examine the effect of liquidity management on the
performance of deposit money bank in Nigeria. The study found a strong positive association
between liquidity management and return on equity. The study concluded that bank management
should operate on optimal liquidity levels for efficiency and effectiveness which key drivers of
improved performance.
5
Chamler, Musah, Akomeah and Gakpetor, (2018) studied the effect of liquidity management on
profitability of Ghanaian commercial banks and found a strong positive association between
effective liquidity strategies and commercial bank performance. The correction was stronger
between liquidity levels and return on assets in comparison to levels of liquidity and return on
equity. The conclusion drawn from these study findings were that commercial banks that
maintain reasonable thresholds in liquidity are able to withstand unforeseen short term shocks or
liquidity risks and financial risks thereby improving on overall profitability. The study further
concludes that there is a level beyond which levels of liquidity becomes counterproductive and
thus might lead to overall decline in bank performance as was found out by Abdullah and Jahan,
(2014).
Vaita (2017) studied the impact of liquidity management on financial performance of tier one
listed Kenyan commercial Banks. The study found a strong positive association between liquidity
and return on assets but a weaker relationship between levels of liquidity and return on equity.
This finding are consistent to those of Chamler, Musah, Akomeah and Gakpetor, (2018) which
seem to suggest levels of liquidity influences to a large extent the efficiency in utilization of
assets as compared to wealth creation of the firm which is captured by return on equity.
Loans influence the profitability or performance of commercial banks because it is the major
driver of interest income which is the biggest contributor of earnings for commercial banks in
Kenya. The trick for commercial banks is to lend more so as to realize a higher interest income
and thus the volume of the outstanding loan asset has great impact on its financial performance.
As posited by (Kirimi, 2015) lending interest rates has a great influence on the financial
performance of commercial banks because as they argued, it is the greatest contributor of revenue
combined with managerial efficiencies.

6
Dinc (2017) investigated the effect of retail loans on Turkish bank profitability by paying close
attention to mortgage and consumer loans which are the biggest contributors to credit loan loss
exposures of banks. The study found out that volume of retail loans has a heavy negative effect
on profitability of Turkish banks as measured by interest margins. This according to the study is
explained by the element of provisions which erodes interest margins of Turkish retail banks.
Dietrich and Wanzeried, (2009) studied the factors affecting of profitability of financial
institutions by focusing on new evidence from Switzerland. The study examined commercial bank
related, banking sector related and outside environmental factors influence on bank profitability
underscoring the fact that Switzerland has a fully developed modern financial system in the world.
The study found out that the impact of volume of loans growing disproportionately than the
market has the highest influence on financial institutions’ profitability. It concludes by
highlighting the important of integrating bank specific characteristics about management and
shareholders i.e. level of education, skills, experience and independence all of which have an
influence on profitability.
Kana (2017) did an empirical study on the determinants of profitability commercial banks in
South African and specifically examined the effect of bank related variables i.e. equity capital,
saving deposits, volume of loans, contracted term deposits and credit loss exposure on
profitability of south African banks. The study found out that bank specific variables which are
under control of management had a significance influence on profitability as measured by return
on assets. The study concludes by highlighting the importance of bank mangers in paying special
attention to factors within their control to improve on bank profitability.
Yigermal (2017) studied the determinants of profitability of private selected private banks in
Ethiopia and specifically investigated the impact of bank size, loan to deposit ratio, loan

7
concentration index, credit risk and bank branches on the determination of return on assets and
return on equity as a measure of performance. The study found out that loan concentration index
was significant in explaining the variations in return on equity and the magnitude was found to
be positive while the same was found to be insignificant in explaining the variations inn return on
assets. The study concludes that Ethiopian government should foster conducive operating
environment for private banks to improve on performance since both bank specific and external
variables were found to have a significant influence on profitability.
Thiongo, Matata and simiyu, (2016) examined Loan portfolio growth and financial performance
of Kenyan commercial banks and specifically assessed the impact of loan portfolio growth on
the financial performance of Kenyan commercial banks. The findings of study found were that
loan portfolio growth had a positive attribute on profitability of commercial banks in formative
years but in subsequent years it was established to have a not desirable effect on financial
performance possibly due to growth in non-performing asset portfolio
In Kenya, commercial banks are clustered in four peer groups based on tiers or weights of
composite index which consists of loans, customer deposits, Liquidity, Number of deposits
accounts, capital adequacy and number of loan accounts. The weights are usually developed by
the central bank of Kenya. The same weights or tiers is also used to group Micro Finance
institutions in Kenya (CBK, 2017).

8
Tier I >kes150Bn
Tier II
Kes50Bn><Kes15
0Bn
TierIII kes15Bn><ke
s50Bn
Tier IV <kes15Bn
1.Kenya Commercial
bank
1.National bank of
Kenya
1.GT bank
1.SBM Bank 2.Fidelity
Bank
2.Cooperative Bank 2.Citibank 2.ABC Bank 3.Jamii Bora Bank
3.Equity bank
3.SBM
3.Gulf African Bank
4.Spire Bank
4.Barclays Bank
4.Bank of Baroda
4.Victoria Commercial
Bank
5.Paramount Bank
5.Standard Chartered
bank
5.Family Bank
5.Development Bank
of Kenya 6.Trans-National Bank
6.Commercial Bank of
Africa 6.Housing Finance
6.Sidian Bank
7.Credit Bank
7.CFC Stanbic Bank
7.Prime Bank
7.First Community
Bank
8.MOriental Bank
8.Diamond Trust Bank 8.Ecobank 8.Consolidated Bank
9.Middle East Bank
9.I&M bank
9.Bank of India
9.Gordian Bank
10.UBA Bank
10.NIC Bank
10.Habib and Zurich
11.DIB Bank
11.Bank of Africa 12.Mayfair Bank
Source: (CBK 2017)

9
1.2 Statement of the Problem
The government of Kenya is mandated to foster a stable market-based financial system that
supports improvement and growth of performance of financial institutions in the country CBK,
(2017).The government achieves this role by setting up conducive operating environment to
enable commercial banks grow deposits, maintain optimal capital adequacy and liquidity levels
besides growing a high quality loan book among others (Cyton, 2017).
Return on Equity of commercial banks declined from 28.04 per cent in 2007 to 20.68 percent in
2017 notwithstanding deposits growing from 705.2 Billion to 2.9 Trillion and loans growing from
495 Billion to 2.03 Trillion in the similar period. Liquidity improved slightly from 41 per cent to
43.7 per cent in the review period while Capital adequacy declined marginally from 18 per cent
to 17 per cent in the same period. Declining Return on Equity is threat to financial stability of
commercial banks and overall economic prosperity (Desta, 2017). There is evident mismatch on
the growth of determinants of financial performance and the overall effect Return on Equity.
Kiiru (2008) for example, examined the effects of funding structure on the financial performance
of DTMFIs in Kenya and found out that deposits and loan assets positively influence the financial
performance. This study though relevant; omitted the influence of liquidity and capital adequacy
on financial performance. There was need therefore, to investigate the determinants of financial
performance of commercial banks listed in Nairobi Securities Exchange.
1.3 Objectives of the study
1.3.1 Main Objective
The main objective of the study was to examine the determinants of financial performance of
commercial banks listed in Nairobi Securities Exchange.

10
1.3.2 Specific objectives
The specific objectives of the study were:
i. To establish the influence of deposits on financial performance of commercial banks listed in
Nairobi securities exchange.
ii. To determine the influence of capital adequacy on financial performance of commercial banks
listed in Nairobi securities exchange.
iii. To examine the influence of liquidity of on financial performance of commercial banks listed in
Nairobi securities exchange.
iv. To investigate the influence of loans of on financial performance of commercial banks listed in
Nairobi securities exchange.
1.4 Research Hypotheses
For purposes of analyzing the data, the following null hypotheses were tested:
Ho1: Deposits has no significant influence on the financial performance of commercial banks listed
in Nairobi Securities Exchange
Ho2: Capital adequacy has no significant influence on the financial performance of commercial banks
listed in Nairobi Securities Exchange.
Ho3: Liquidity has no significant influence on the financial Performance of commercial banks listed in
Nairobi Securities Exchange.
Ho4: Loans has no significant influence on the financial Performance of commercial banks listed in
Nairobi Securities Exchange.
1.5 Significance of the Study
The findings of the study will be of assistance to stakeholders in the banking industry ascertain
the determinants of financial performance of commercial banks listed in Nairobi Securities

11
exchange under the control and purview of management and shareholders. As Sanderatne
(2011) argued, sustained inflows of foreign direct investments (FDIs) is a catalyst to achieve a
sustainable high trajectory of economic growth through opportunities creation and general
improvement of infrastructural projects and commercial banks plays a crucial role being the
recipients of FDIs.
Bank Regulatory Agencies screen banks by evaluating banks’ liquidity, solvency and overall
financial performance to enable them intervene when there is need and to gauge the early warning
signs of potential financial problems. This is achieved through close supervision which requires
commercial banks to submit daily, weekly, monthly, quarterly and yearly reports on various
parameters i.e. deposits mobilized, capital adequacy, liquidity, volume of loans, assets quality,
number of customers, profits and loss statements etc. It should be understood that the bulk of
commercial bank deposits are public funds and thus its preservation is the primary role of the
government (Casu, Girardone & Malyneux, 2016).
Other researchers and academicians who will be pursuing disciplines related to the study will use
the research finding as a framework for their research. This will contribute to the existing pool of
knowledge.
1.6 Scope and Justifications of the Study
The scope of the study was confined to eleven Commercial Banks listed in Nairobi Securities
Exchange for a period of ten years from 2007 to 2017.
The listed banks were as follows:

12
Name of Bank
Barclays Bank Ltd BBK
KCB Bank Ltd KCB
Equity Bank (K) Ltd EQB
Cooperative Bank of Kenya Ltd COOp
Diamond Trust Bank Ltd DTB
I&M Holdings Ltd I&M
Stan Chart Bank Ltd SCB
NIC Bank Ltd NIC
Housing Finance Group HF
National Bank of Kenya Ltd NBK
CFC Stanbic Holdings Ltd SBK
1.7 Limitations of the Study
Secondary data took too long to be obtained. It took more than three months for CBK to update
its website to reflect the 2017 annual bank supervision report. To date the 2019 publication has
not been posted.
1.7.1 Delimitations of the Study
The problem was solved by obtaining current financial statements from commercial banks listed
in NSE. Also quarterly statistical bulletins were sourced from CBK website.

13
1.8 Assumptions of the Study
The study was undertaken with the assumption that the foreign exchange rate was stable
throughout the study period and also assumed that regulatory capital adequacy requirements for
banks were met on demand by all commercial banks.
1.9 Operational Definition of Key Terms
Deposits: The These are funds placed in banking institutions by customers for safe
keeping and are intended to be used by those customers in future
transactions. They assume the form of term deposits, savings or current
account balances. The same funds are used by financial institutions for
onward lending to borrowers at a negotiated price (Interest rates)
Capital
Adequacy:
It refers to the reasonableness of capital available to assist commercial
banks meet its business objectives and manifest as a buffer in cases of
negative economic downtimes. It is measured by capital adequacy ratio
and represents the internal resilience of the bank to withstand economic
shocks
Liquidity: This refers to the proficiency of a bank to meet and sustain its short term
cash commitments as and when they arise. The bulk of liquidity of
commercial banks are public deposits on call and call be accessed on short
notice by depositors.
Loans: This refers to a term facility or a financial accommodation extended to
customers from various financial institutions and are to be paid back are
companies that have been admitted to trade their shares publicly in the
official stock exchange market and must subscribe to the rules of trade

14
the shares of listed companies are available for the public to buy or sell at
any time thorough the stock exchange.
Listed firms: These are companies that have been admitted to trade their shares
publicly in the official stock exchange market and must subscribe to the
rules of the trade. The shares of listed companies are available for the
public to buy or sell at any time through the stock exchange.
Nairobi
Securities
Exchange
This is an organized Kenyan market where shares and stocks are issued,
bought and sold through the services of stockbrokers or dealers. The firm
issuing the shares has to plan in advance and ensure that there is
availability of their shares to be traded. The NSE is located at Nairobi
securities exchange house is located at 55 West lands Road in Nairobi.

15
CHAPTER TWO
LITERATURE REVIEW
2.1Theoretical Literature Review
2.1.1 Financial Intermediation Theory
The theory of financial intermediation was started in early 1960s being the work of Gurley and
Shaw. The idea is synonymous to information asymmetry and agency theories where financial
intermediaries mediate between the providers of financial capital and the consumers of financial
capital. Monetary negotiators exist because of market flaws because in the real market, there is a
conspicuous information vacuum between borrowers and lenders. In monetary markets,
information asymmetries are specifically conspicuous because debtors are knowledgeable about
the collaterals they have and integrity with regard to their repayments abilities but lenders seldom
have this information. Creditors would profit from realizing the correct attributes of debtors but
moral threat and mistrust impedes the straight convey of details between the two parties (Mutua,
2013).
Deposits are funds placed by customers in financial institutions for safe keeping and for future
withdrawals. In such cases, the depositor transfers the risk and cost of holding the deposit to the
financial institution. On the other hand the financial institution generate loan contracts to
borrowers through the intermediation process and include a price to cover their operations costs
and interest expense with sufficient surplus to be given back to the providers of funds. Financial
intermediaries facilitate risk transfer between market players and act as an agent in the complex
financial systems characterized by uncertainties in the current financial markets (Bollen, 2007).

16
The intermediation process will only exist if the end result yields the necessary income to cover
the opportunity costs, operational costs, and interest cost of funds with a retainer of surplus being
a reward for the investors (Allen, Carletti, Krahnen, Pieter and Tyrell, 2011).
The financial intermediation theory is assumed to apply to an oligopoly type market where there
are few dominant players in the market. It is also assumed that financial intermediary’s major
objective is market share expansion as opposed to profit maximization and the product offering
is similar for all the financial intermediaries (Andries, 2009).
Some authors have criticized the theory by arguing that the microeconomic tools used for analysis
should be uniform but divergence was noted in some approaches. Olokoyo, Adetiloye and Ikpefan
(2016) for example described financial intermediaries as using loans as inputs to produce money
while other scholars describe financial intermediaries as using deposits as inputs to avail money.
The theory also fails to bring out clearly the motivation for financial intermediaries as profit
maximization, market share growth or utility satisfaction. The theory also contributes to increased
cost of funds to borrowers and reduced return for lending form savers because of the middleman
role played by financial intermediation (Andries, 2009).
The financial intermediation model being the main theory of the study of determinants of financial
performance of commercial banks listed in NSE by bringing out the important role of monetary
institutions in mobilizing deposits and funding net borrowers. Deposit mobilization influences
the volume of deposits and levels of liquidity while funding of net borrower’s influences the
volume of loans, liquidity and capital adequacy.

17
2.1.2 Money Creation Theory in Modern Economics
The theory originated from debates of two University professors from Hungary i.e. Istvan
Hagelmayer and Milkos Riesz in the 1960’s .While Hagelmayer was of the view that money was
created simultaneously with credit rather than building up of liabilities and lending, Milkos
insisted on rational approaches to lending where commercial banks generate assets form
liabilities. The theory highlights that money or deposits is created using loans and that commercial
banks are using liquidity to create loans which are pushed to the borrowers. Here the capability
of banks is to create money by converting some liquid securities into money, borrowing from
central bank or borrowing from other commercial banks and quickly creating loans (Botos, 2016)
Financial institutions generate cash in the form of new loanees drawdowns by advancing loans
credits to customers. When banks creates loan contracts to a to a borrower, it does not usually do
so by advancing them real money over bank counters, but instead, the financial institution credits
the borrower’s bank account with the equivalent of loan amount. This process generates new
deposit available to the borrower and thus the bank gains from this newly created liability if the
borrower chooses not to withdraw the entire deposit at once. The bank ultimately gains on the
creation of an asset which earns them interest income. Sovereign states’ ability to spend is limited
to taxes mobilized from the citizens and the extent of borrowing in the financial market. The
printing of money for spending according to this theory is less appealing since it distorts the
financial market discipline by propagating the oversupply of currency leading to an erosion of
value. These findings points out the importance of financial institutions in the creation of credit
and mobilization of deposits in the economy (Randall, 2014)
The theory assumes that only financial institutions have the power to crate money while non-
financial institutions play the role of distribution of the money. These are institutions that shadow

18
the financial function of banks and includes insurance companies, investment companies etc. It
is also assumed Money creation by commercial banks cannot be unlimited and depends on how
the commercial bank can access from the central bank. This has a constraint on the volume of
loans to be created. The theory also assumes that the performances of all the commercial banks
are uniform so that the only driving force is creation of loans from deposits. It is also assumed
that commercial banks have the power to determine the quantity of money to be created in the
economy but no central banks (Botos, 2016).
Critics of the theory point out the inability of central bank being the banking regulator to limit
creation of money since the theory propagates that the commercial banks determine the extent of
money creation in the economy. The theory also highlights that lending is motivated only by
money creation to the exclusion of other factors i.e. profits, levels of liquidity, cost of capital
(McLeay, 2014)
This relevance of this theory to the study is that it brings out the important role of financial
institutions using money in their everyday activities of mobilizing deposits and funding net
borrowers. The financial institutions also create money when applying new loans to borrower’s
accounts which form the basis of new deposit which is available for onward lending to other
borrowers if the loanee chooses not to withdraw everything at once.
2.1.3Economic Value Added Theory.
The theory was introduced by Stern Stewart & Co., a consulting firm based in New York, as a
measurement tool in 1989 before they Trade marked it. In the 1990’s. The theory focuses mainly
on the ability of a firm to maximize shareholder value in its business strategy. Wealth creation or
value addition has become the ultimate economic purpose of a corporation. Firms focus on
creating, operating and acquiring new businesses and/or products that will provide a greater return

19
on Equity over and above the firm’s cost of capital, thus realizing optimal maximization of
shareholder wealth and survival of the firm. Economic Value Added theory is a strategic and
financial performance management tool that help Companies achieve a higher returns than their
overall overheads. Institutions usually use this concept to track their financial position and to help
management make better financial decisions regarding resource allocation, capital budgeting and
acquisition analysis (Geyser & Liebenberg, 2016). EVA emphasizes the Return on Equity (ROE)
of organizations after all costs and expenses have been charged including the firm's cost of capital
invested
The theory is premised on the assumption that the firm should be able to generate a higher rate of
cash flows from its current assets without impacting negatively on its growth prospects or risk
profile. It is also assumed that the firm is able to re-invest more of the current cash flows without
affecting the firms risk profile in meeting current obligations. The theory also assumes that the
enterprise is able to reduce the cost of financing its assets and future growth prospects by re-
investing its current cash flows without lowering the Return on Equity. This is not realistic since
re-investing the bulk of current cash flows for expansion of the enterprise might undermine the
firm’s ability to meet short term obligations.
Critics of EVA posited that the tool cannot be applied in measuring divisional performance for
companies with many departments and also is defective in measuring milestones in the company’s
quest in achieving its strategic objectives. The theory also fall short of capturing non-financial
measures in the overall success of a firm. These include employee welfare and the impact of
financial success in the environmental conservation. The theory is also inapplicable to some
industries as a measure of financial performance especially those in technology-intensive sectors
where the year on year changes in EVA may be negative and may not reflect the true position of
20
the firm’s financial performance. Another drawback for the Economic Value Added theory is that
it is distorted by inflation, with the result that it cannot be used during inflationary times to
estimate actual profitability. A superior measure, the adjusted EVA, corrects for inflationary
distortions. (Geyser & Liebenberg, 2016).
The relevance of the theory to the study is that it highlights the importance of Return on Equity
(ROE) as an effective tool in measure of an organizational financial performance. ROE evaluates
the value addition of an organization in terms of wealth creation to the shareholders. Financial
institutions deploy various strategies with the sole aim of improving the overall financial position.
These strategies include mobilizing cheap deposits, achieving optimal capital adequacy and
liquidity levels and growing a high quality loan book.
2.2 Empirical Literature review
2.2.1 Deposits and Financial performance
Dilrangi, Udayarathna, Pathiraja, Madhubhashini and Bandara (2018) investigated the effect of
level of deposits of financial performance on Sri Lankan listed commercial banks and specifically
investigated the relationship between short notice deposits, savings account deposits and fixed
term deposits and the profitability of commercial banks. The study used quantitative research
approach targeting twelve Colombo Stock exchange quoted banks as at 31st December, 2017. The
data was sourced from published sources for five years between 2013 and 2017. The study
revealed a high magnitude and statistical association between customer deposits, and ROA and
ROE. The study concludes that savings and current deposits have the biggest effect on the
profitability of commercial banks as compared with fixed deposits which might be explained by
the interest expense incurred in attracting fixed deposits. The study recommends bank
management to develop sound strategies aimed at attracting cheap deposits mainly from current
21
account holders for onward lending to borrowers so as to optimize on interest income as opposed
to pursuing very expensive fixed deposits.
Rengasamy (2014) examined the effect of the ratio of loans and deposit on the profitability of
Malaysian commercial banks from 2009 to 2013. The study dwelled on the entire eight
commercial banks in Malaysia and which are locally owned. The study adopted descriptive
research method, correlation and regression analysis to examine the associative power of the loans
and deposits and return on assets. The finding of the study was that there was a positive and
insignificant association between ratio of deposits and loans and profitability of commercial
banks. The research concludes that mobilization of customer deposits and subsequent conversion
of the same into loans will generally lead to improved earnings of commercial banks as long as
there was a balance between interest expense paid to depositors and interest earnings charged on
loans. The study further recommends bank management to optimize the balance between deposits
and loans to generate more revenue and monitor the quality of the loans created to avoid non-
performing loans which might erode interest income earned.
Okun (2012) in his study of the impact of deposits on Kenyan commercial banks financial
performance used a survey research design of 44 commercial banks in operation as at 31st June
2012. He examined the data using cross sectional regression model. The study found that the
association between ROE and deposits had a positive and sufficiently great attribute. The study
concluded that customer deposits impacts return on equity positively. Further the study
recommended that bank managers should invest in strategies aimed at attracting and retaining
customer deposits which play a very noble role in the lending procedure.
Tuyishime (2015) investigated the effects of deposit acquisition on financial performance of
Rwandan commercial banks. A case of equity bank Rwanda Limited. The study aimed at
22
determining the effect of marketing master plan on profitability commercial banks in Rwanda, to
establish the effect of interest expense changeability on deposit of the commercial banks in
Rwanda and to examine the effect of financial technology introduced in the growth and
profitability of commercial banks in Rwanda. The study used both descriptive and inferential
research design and a selection of 27 staff working form Equity bank Rwanda, data was examined
using statistical correlation model. The research found that an increase in customer deposits led
to more loans being disbursed hence and increase in interest income and overall improvement in
financial performance. Also marketing strategies was found to increase customer numbers hence
volume of deposits and thus influenced financial performance. The study also established that the
introduction of technology enabled equity bank Rwanda to reach out to low cost deposits in rural
areas and thus influenced on monetary performance as the Equity bank minimized over reliance
on expensive term deposits. The investigation therefore concluded that deposit mobilization affect
financial performance and thus Equity Rwanda should invigorate their marketing strategies, adopt
banking technologies and effect a positive change in interest rates to attract deposits. The study
further recommend management of equity Rwanda should design innovative strategies aimed at
mobilizing low cost deposits from unbanked population through use of agency banking to
facilitate collection of deposits from rural areas. It also recommends banks to offer completive
interest on term deposits to grow deposits.
Akuma, Doku and Awer (2017) examined the relationship between loan loss exposure, deposit
mobilization and earnings of Ghanaian banks from 2002 to 2011 .The study used secondary data
by sourcing for financial statements of 17 Ghanaian banks in operation during the study period.
Data was evaluated using regression model and established that there was a pragmatic notable
association between credit risk, deposit mobilization, growth in interest income, capital adequacy

23
and profitability of Ghanaian .The study concluded that profitable banks in Ghana depend more
on deposits in their financing activities and further the study suggested that commercial banks
should institute a master plan to acquire and grow deposits from the formal and informal sectors
of the economy besides investing heavily in credit risk policies preserve the quality of the asset.
Eyigege (2018) in his study of the influence of banking debts, clients deposits and statutory
minimum capital requirements on the banking stability of some selected Nigerian micro finance
banks found out that among others increase in customer deposits contributes to a positive
influence on profitability and thus operational sustainability. It concludes that Nigerian
microfinance banks should be cognizant of the cost of mobilizing those deposits.
Njeri (2010) explored the ramifications of deposit taking on profitability of microfinance
institutions in Kenya. The investigation aimed to examine whether deposit taking has an influence
on monetary evaluation of microfinance institutions in Kenya using descriptive research method
targeting 4 microfinance institutions operating in Kenya. Data analysis was done using the paired
t-test model and deducted that there was a general decline in ROA for all the DTMs for the period
under study inferring that deposit taking has not had a worthwhile influence on monetary
performance. The examination drew the conclusion that deposit taking has negatively influenced
financial performance of DTM’s and recommends that DTMs who intend to take deposits must
first have sufficient resources to cushion them against transformation expenses which weigh
down earnings. Also policy makers should approve DTMs who are compliant with the regulation
and are able to withstand transformation costs by demonstrating their capability of sufficient
resources to withstand change over.

24
2.2.2 Capital Adequacy and Financial Performance
Mahmud and Datta (2018) appraised the impact of minimum capital requirements on monetary
performance of listed commercial banks in Bangladesh under Basel II accord. The study
examined a panel data of 232 items for a total of 29 listed commercial banks in Bangladesh for
an eight year period from 2007 to 2014. Determinants of banks profitability was captured as ROA
and ROE. The study used descriptive research method where the standard deviations of capital
adequacy were analyzed against Basel II accord requirements. The study further did ordinary least
squares method of ROA and ROE against regulatory requirements. The study found out that
reasonableness of capital injected has an effective forward looking relationship with monetary
gain of commercial banks and concludes that adequately capitalized banks have the advantage to
incur higher levels expenses in terms of salaries and wages. The study points out that this might
help them expand their operations.
Almasari and Alamiri (2017) did a comparative study on the effect of capital soundness on
profitability of Saudi Arabia by paying special attention to Samba and Saab Banks. The study
was actualized by use of secondary data and employment of descriptive research design to test
the hypothesis. The revelation of the study was that there is a strong positive correlation between
soundness of capital and both ROA and ROE of both banks indicating the importance of capital
as a protection of deposits from customers against insolvency.
Amahalu, Okoye, Chinyere and Okika (2017) examined the effect of capital efficacy on financial
performance of listed deposits banks in Nigeria. The study aimed to investigate the influence of
capital adequacy on the financial performance of commercial banks bank in Nigeria for the period
2010 to 2015. Data was analyzed using the Pearson correlation model and multiple regression
and found that there is a positive significant relationship between capital adequacy and financial

25
performance. The study concluded that increase in capital reduces external borrowing which
improves on financial performance and also strengthens financial institutions position to absorb
negative shocks. Further the study concludes that reduction in financial costs of distress improves
on the NIM and thus financial performance. The study recommends that management and
shareholders reduce the proportion of debt in the capital to minimize financial risk and withstand
systemic shocks which might occasion bankruptcy.
Umoru and Osemwegie (2016) examined the influence of capital solidness and monetary
performance of banks in Nigeria using verifiable proof based on the feasible general least squares
estimator (FGLS). The study aimed to examine the role of capital adequacy on Nigerian Banks
profitability using quantitative research design targeting a sample of 8 Nigerian banks that have
withstood recent economic meltdown. The study period covered 2007-2015. Regression equation
was used in the research and it was found that 16% increase in capital adequacy enhances ROA
of Nigerian banks by 2.176% which is statistically significant and thus concluded that the banking
system in Nigeria is yet to stabilize and be able to withstand liability shocks, credit risk,
operational and market risks. The study suggested that the regulatory agency of the Nigerian
banks (CBN) should regularly review the least capital adequacy of banks in order to improve on
their financial performance. The study also recommends that the government should promote
macroeconomic policies aimed at stabilizing the financial sector.
Nzioki (2009) examined the impact of capital adequacy on the growth of monetary value of
commercial banks quoted at the Nairobi stock exchange. The investigation aimed to assess the
effect of capital adequacy ratio on the monetary gain of commercial banks, investigate the
implication of asset base on the financial performance of commercial banks, determine the effect
of bank’s size on the financial achievement of commercial banks and to evaluate the outcome of
26
asset quality on the financial accomplishment of commercial banks using a descriptive research
design of financial institutions in Kenya and a selection of nine commercial banks listed in
Nairobi securities exchange. The research evaluated the variables under study using regression
analysis and found that p values for all the 9 banks were positive and above 0.05 meaning the
correlation between capital adequacy and monetary accomplishment was positive and significant.
The study concludes that capital adequacy represents the soundness of a financial institution to
navigate cyclic downtimes and must be managed at optimal levels to assure depositors of the
safely of their funds placed in financial institutions. Further the study recommends that regulatory
agencies closely monitor capital soundness quantum to safeguard customer cash deposits in banks
and promote financial firmness and stability in the economy.
Barus (2017) examined the effect of capital adequacy on the financial accomplishment of Sacco’s
s in Kenya. The study aimed to establish the effect of capital adequacy on the financial
performance of savings and credit cooperative societies in Kenya using an explanatory research
design targeting all the 83 registered SACCOs in Kenya which have been in operation for 5 years
from 2011-2015.Multiple regression equation was employed in analysis of data and it was
established that capital solidness explains 86% variations of financial performance of SACCOs
in Kenya. The study concluded that capital adequacy strongly influences the financial
performance of SACCOs in Kenya and the influence was found to be positive. Further the study
recommends that capital adequacy requirements or SACCOs be closely monitored and regulated
by SASRA to ensure stability of SACCO to withstand insolvency challenges in the operating
environment. It also recommends that SACCOs should shift their strategies from concentration
of capital requirement to credit risk to preserve the asset.

27
2.2.3 Liquidity and Financial Performance
Ali and Khan (2016) investigated the effect of liquidity on profitability Pakistan commercial
banks. The research employed regression and correlation technique of data evaluation to identify
the strength and type of association between liquidity and financial accomplishment of banking
sector in Pakistan. The study used secondary data sourced from Habib bank limited for five years
from 2008 to 2014.The study found out that availability of cash and financial gain commercial
banks was positive and significant and concludes that with growing liquidity, financial
performance as captured by gross profit margin and net profit margin continues to improve up to
a certain limit. This may be explained by costs emanating from growing enterprises manifested
through inefficiencies which weigh down on profitability. The study recommends that
commercial should keep considerable levels of liquid assets to maintain a higher growth trajectory
in financial performance.
Kalanidis (2016) studied the impact of liquidity on the financial gain of fifty European banks
categorized as large. Profitability was evaluated in terms of return on assets, net interest margin,
return on equity and profit before tax. The investigation was specifically done after the financial
crisis to determine the task played liquidity in the overall financial meltdown. A sample of 350
observation was carried out in the study and a regression model was deployed to test the
association between the variables. The investigation found out that liquidity has a negative
relationship with return on assets, net interest margin and return on equity. The study concludes
that the loss of other alternative of holding low yielding assets instead of investing the liquid
assets in high yielding risk ventures far outweighs its benefits.
Marozva (2015) examined the relationship between liquidity and bank monetary gain of South
African banks between from 1998 to 2014 using the ordinary least squares method and auto

28
regression distribution lag technique. The study employed regression equation to highlight the
strength of correlation between market risk, financing risk, liquidity and loan loss exposure
against net interest revenue which is a proxy for financial accomplishment. The study observes
that there is a significant negative relationship between funding liquidity and financial
performance. These study findings were similar to those of Kalanidis (2016). The study concludes
that holding of liquid assets with a low premium imposes commercial banks with a loss of the
other alternative of investing the same in high yielding assets and thus negatively affecting
profitability. The study recommends that liquidity management should be the focal point of bank
management in order to achieve an optimal trade- off between availability of cash and
profitability.
Vianney (2011) studied the connection between regulation and monetary gain of Rwandan
commercial banks and specifically examined the ramifications of liquidity ratio and capital
requirements ratio on financial accomplishments of commercial banks in Rwanda. The study
revealed that government moderating policies on both liquidity and capital ratio requirements was
insignificant in explaining variations of profitability of commercial banks in Rwanda. This study
contradicts an earlier study by Mashamba. Gakera and Osano (2018) investigated effects of
government regulation on profitability of commercial banks in Kenya. The study found that there
exist a positive association between liquidity regulation and profitability of commercial banks in
Kenya. Similarly the study established that there exists a positive correlation between capital
adequacy and financial achievement of commercial banks in Kenya and concludes that bank
management should adopt the new interest rate cap laws to attract more borrowers so that they
can generate more revenue. This study contradicted an earlier study

29
Olagunju, Adeyanju and Olabode (2011) studied the management of liquidity and commercial
banks financial gain in Nigeria and specifically examined empirical evidence on the degree of
influence of banks profitability brought about by effective liquidity management. The study also
investigated how commercial banks can optimize their liquidity and profitability positions. Both
first hand sourced data and data obtained from other users was used in the study while descriptive
research method by use of the Pearson correlation analysis was used to test the interrelation
between the elements under study. The study found out that there is a notable relationship between
availability of cash and monetary achievement of commercial banks and that liquidity
management significantly influences on the net earnings of commercial banks. The study further
concludes that commercial banks should continuously strive to achieve optimal levels of liquidity
so as not to erode profitability. The study recommends the regulatory agencies to develop flexible
monetary policies so as to cushion commercial banks in meeting unexpected huge withdrawals
as opposed to keeping idle cash which is an opportunity cost.
Mashamba (2018) examined the consequences of Basel III liquidity requirements on banks net
earnings in developing markets for the period 2011 to 2016. The study found that liquidity
regulations by the government occasion a decline in profits of financial institutions. It concludes
high liquidity levels although good for meeting short term obligations earns no interest rates since
the same assumes the form of idle cash.
Njeri (2013) examined the effects of levels of liquidity on net earnings of DTM’s in Kenya. The
research aimed to evaluate the effect of liquidity on financial achievement of deposit taking micro
finance organizations using a descriptive research design of all the 9 microfinance institutions
operating in Kenya from the year 2009 to 2013. The examination of data was made using the
multiple regression model and correlation and found that liquidity and financial performance of

30
DTMFI’s had a correlation coefficient of 0.941 which was remarkable and positive. It was also
found from the regression analysis that 91% of the variability of financial performance of
DTMF’s was explained by liquidity among other variables. The investigation concluded that the
monetary achievement of DTMF’s is highly dependent on the levels of liquidity and thus
recommends that DTMF’s should put in place strategies directed at increasing liquidity levels to
foster financial performance.
Nyabeta (2013) studied the repercussions of liquidity on the monetary accomplishment of Nairobi
securities Exchange listed financial organizations using descriptive research technique targeting
a sample of 11 financial institutions listed at the Nairobi Securities exchange from 2010 to 2014.
The study analyzed data using regression model and correlation technique and found that the
correlation of liquidity and ROA vary significantly and but the levels of liquidity have a reverse
significant effect on ROA. The research concluded that a decrease in the levels of liquidity of
Nairobi Securities Exchange quoted financial intermediaries quoted triggers a decline in monetary
accomplishment as depicted by return on asset. The study further recommends that management
of monetary institutions listed at the NSE should explore other strategies other than liquidity to
improve on their financial performance.
Song’e (2015) analyzed the impact of liquidity administration on the monetary performance of
deposit taking SACCOs in Nairobi County using a descriptive research method by testing 27
SACCOs out of a population of 41 SACCOs operating in Nairobi as at December 2014.Data was
examined by use of multiple regression technique to bring out the strength of the relationships
between the variables and also correlation investigation was used to examine the association
between the elements under study. The study found that a conspicuous relationship between levels
of liquidity and financial achievement of SACCOS in Nairobi County as measured by ROA. The
31
study also established the existence of a strong relationship between and levels of liquidity and
financial achievement. The study concluded that levels of liquidity influences the monetary
accomplishment of SACCOs in Nairobi and further recommends that SACCO’s in Nairobi should
embrace sound liquidity management policies to lower exposure of credit risks and ensure long
term sustainability of member’s savings.
Majakusi (2012) examined the impact of liquidity management on the financial gain of Kenyan
commercial banks using descriptive research design targeting all the 43 financial entities in
existence in Kenya as at December 2016. The study period covered 5 years from 2010-2016. Data
was examined using the regression equation technique and it was found that there is conspicuous
positive association between liquidity and monetary performance of financial entities in Kenya
as captured by ROA. The investigation concluded that an increase in cash and cash equivalents
availability translate to an overall improvement in financial management as measured by ROA
and further recommends commercial bank managers should proactively relook into the liquidity
management to improve on performance.
2.2.4 Loans and Financial Performance
Tabak and Cajueiro (2011) studied the effects of loan investment mix on Brazilian banks returns
and risks by analyzing whether a varying range of loan portfolio mix of financial organizations
improves on performance and lowers risk. The study used regression equation technique and
correlation procedure to measure the association and strength of association of variables and
focused on both foreign owned and domestic banks in Brazil. The study found out that loan
portfolio concentration leads to improved financial performance occasioned by reduction in loan
delinquencies and thus lower provisions.

32
Cronje and Atahau (2015) studied size and loan portfolio structure and performance of local
owned monetary institutions in Indonesia. The investigation was carried out explicitly to evaluate
the impact of portfolio size on performance of large and small banks domestic banks in Indonesia.
The investigation tested a total of 69 large bank observations and 346 small bank observations
and employed descriptive statistics, univariate statistics and longitudinal data regression equation
to gauge the association between the elements under study. The research established that the
influence of loan portfolio mix on monetary achievement for small and large financial entities
differ significantly. The study concludes that small banks portfolio’s influence on returns is less
significant than that of large banks indicating the importance of size of portfolio in determining
banks’ performance.
Belguith and Bellouma (2017) investigated the impact of loan asset diversification on Tunisian
financial organizations net earnings. The study focused on investigating the effect of loan
portfolio diversification on banks’ earnings and to assess the effect of loan investment mix on
private and foreign financial institutions in Tunisia. The research used descriptive research
technique by targeting a list of 10 large banks in Tunisia holding an asset base of over 85% of the
banking industry over a period of 15 years from 2000-2015. Data was examined using the
regression equation and correlation method and found that loan asset diversification negatively
impacts monetary institutions profitability. The investigation concluded that focusing the credit
portfolio to few sectors of Tunisian economy is profitable than diversifying the loan portfolio to
many industries within the economy. The study further recommends that bank decision makers
should concentrate the loan portfolio to few sectors of the economy to improve on efficiencies
and effectiveness of banks supervision and thus improve on profitability. Concentration of loan

33
portfolio to many sectors of the Tunisian economy attracts intense competition leading to a
decline in profits.
Adzobu, Agbloyor and Aboagye (2017) examined the effect of loan asset diversification on
threats and earnings from banks in developing markets. The study specifically attempted to test
whether loan portfolio diversification covering many industries in Ghana translates to a better
financial performance and reduced loan loss exposures. The study employed ordinary least
squares method and generalized methods of moments on the yearly data of 30 commercial banks
operating in Ghana between 2007 and 2014 to determine the effect of loan product range mix on
the financial accomplishment of commercial banks. The findings from the study are that wide
loan product offering range does not improve bank financial performance and does not also reduce
credit risks. The study concludes that financial organization should pay attention to lending
policies that are sectorial based but with adequate monitoring to reduce default which impacts
negatively on profitability. It recommends further that credit screening should be deployed
effectively to avert delinquency.
Njeru, Njeru and Tirimba (2015) investigated the effect of loan reflows on monetary performance
of deposit taking SACCOs in Mount Kenya region. The study dwelled on investigating the effect
of the outstanding loan book, loan delinquency, loan products and credit facility control on the
monetary achievement of SACCOs in Mount Kenya area using descriptive research survey
targeting 92 interviewers. The study also used secondary data from audited accounts from
SASRA. Data was analyzed using both correlation and descriptive methods and found that gross
loans portfolio was varying at high levels as captured by a standard deviation of 0.879 implying
that the SACCO’s was pursuing its key mandate of giving loans to its members. This influences
its overall financial position. The volume of loans of the SACCOs was also found to be very high

34
with a mean of 3.04 indicating the SACCO’s main objective of funding its members. The research
concluded that there is elevated association between loan repayments and financial achievement
of SACCOs in Mount Kenya region and recommended that the introduction of credit risk strategy
to manage the loan book of the SACCO’s which was established to have a strong effect on
financial gain.
Okungu, Mule, Nyongesa, Aila, Ogut, Onchonga,…Muchoki (2014) analyzed the effect of
banking institutions loans on financial accomplishment of savings and credit co-operative society
in Kisumu. The study aimed to examine the effect of loans offered by financial entities on the
mobilization of savings and loaning behavior the SACCO in Kisumu County, to examine the
merits which SACCO members have realized from the competition between financial institutions
and savings societies in Kisumu and to identify the motivation behind SACCO members opting
to borrow money from other financial organizations in Kisumu City. The research used a case
study technique targeting a sample of 370 respondents from 1 Sacco in Kisumu which was
purposively selected. Data was probed using both descriptive and inferential statistical methods
and it was established that monetary accomplishment of the Sacco in Kisumu was not affected by
banking institutions loans but commercial bank loans positively influenced lending volumes of
the SACCO. The study thus concluded that banking institutions loans have not been significantly
influenced the SACCO lending volumes and thus financial performance and recommends that the
government through the relevant ministry and regulatory bodies should devise strategies to
protect SACCOs from stiff competition by giving equal opportunities to SACCOs to acquire
funds to disburse to their members. It also recommends that loan repayment period should be
regularly reviewed by Sacco management so as not to lose members to commercial banks and
also come up with policies of not ceiling upper limit of borrowing on shares held.
35
Thiongo, Matata and Simiyu (2016) examined the effect of loan asset growth on financial
achievement of commercial banks in Kenya. The study aimed to determine the effect of growth
in banking institutions outstanding loan book on financial gain of banking entities in Kenya, to
investigate the influence of asset quality on financial accomplishment of banking entities in
Kenya, to examine the influence of liquidity management on monetary performance of
commercial banks in Kenya and to examine the effect of capital soundness on monetary gain of
commercial banks in Kenya. The study used correlation research technique targeting all the 44
banking entities operating in the period 2011-2015. A sample of 62 senior loan officers’ from 31
commercial banks was selected for the study and multiple Regression analysis model was used
found that the outstanding loan book growth translates to a negative growth in financial position
in subsequent years and triggers an escalation of non-performing loan book. Also diversification
of portfolio failed to affect financial performance positively according to the study but it was
found to increase the volume of bad loans. The study concluded that loan portfolio growth
positively influences financial performance in the first year but in subsequent years it negatively
influences monetary accomplishment. The research recommended that banking entities should
strategically execute growth in loan portfolio to minimize on bad loans increasing in succeeding
years and that banking institutions should always be cautions in lending all year-round to manage
the non-performing loans.
2.3 Summary of Research Gaps
The study by Tuyishime (2015) on the effects of deposits mobilization on financial performance
of commercial banks in Rwanda; A case of equity bank Rwanda Limited aimed at determining
the effect of marketing strategies on financial performance of commercial banks in Rwanda,
establishing the effect of interest rate changes on deposit of the commercial banks in Rwanda and

36
examining the effect of banking technology introduced in the financial performance of
commercial banks in Rwanda. The study used statistical correlation model to analyze data and a
sample of 27 staff working form Equity bank Rwanda. This research used correlation analysis
which highlights the association between variables and failed to use multiple regression which is
brings out the associative strength between variables which is being addressed by the current
study
Njeri (2010) assessed the impact of deposit taking on financial performance of microfinance
institutions in Kenya. The study aimed to examine whether deposit taking has an influence on
financial performance of microfinance institutions in Kenya using descriptive research design
targeting 4 microfinance institutions operating in Kenya. Data analysis was done using the paired
t-test model and found that there was a general decline in ROA for all the DTMs for the period
under study inferring that deposit taking has not had a positive influence on financial
performance. The study failed to use a larger sample size which might have revealed a different
scenario. Also the study used paired t-test research method and failed to use multiple regression
analysis which brings out the associative power between the dependent and independent
variables.
Nzioki (2009) studied the impact of capital adequacy on the financial performance of commercial
banks quoted at the Nairobi stock exchange. The study aimed to investigate the effect of capital
adequacy ratio on the financial performance of commercial banks, examine the implication of
asset base on the financial performance of commercial banks, determine the effect of bank’s size
on the financial performance of commercial banks and to evaluate the effect of asset quality on
the financial performance of commercial banks using a descriptive research design of commercial
banks in Kenya and sample 9 of listed commercial banks in Nairobi securities exchange. The

37
study used regression analysis of the variables under examination and found that p values for all
the 9 banks were positive and above 0.05 meaning the relationship between capital adequacy and
financial performance was positive and significant. This study failed to use a larger sample size
which might have brought out a different outcome.
Umoru and Osemwegie (2016) investigated influence of capital adequacy on financial
performance of commercial banks in Nigeria using empirical evidence based on the Fgls
estimator. The study aimed to evaluate the role of capital adequacy on the performance of
Nigerian banks using quantitative research design targeting a sample of 8 Nigerian banks that
have withstood recent economic meltdown. The study period covered 2007-2015.This study
failed to use a larger sample size which could have revealed a true picture of capital adequacy
and financial performance of banks in Nigeria.
Njeri (2013) studied the effects of liquidity on financial performance of deposit taking micro
finance institutions in Kenya using descriptive research design targeting 9 microfinance
institutions operating in Kenya for a five year period from 2009 to 2013. Data was analyzed using
the multiple regression model and the findings of 9 DTM’s was inferred to represent the financial
performance of the entire microfinance industry. This study also failed to use a larger sample size
which is being used in the current study.
Nyabeta (2013) examined the effect of liquidity on the financial performance of financial
institutions listed in the Nairobi securities exchange using a descriptive research design targeting
a sample of 11 financial institutions listed at the Nairobi Securities exchange for the period 2010-
2014. The study analyzed data using multiple regression and correlation analysis and found that
the correlation of liquidity and ROA vary significantly and but the levels of liquidity have a
negative significant influence on ROA. The study nonetheless focused only on ROA as measure

38
of financial performance and left out ROE which captures the shareholders’ value in the
investment.
Okungu et al., (2014) analyzed the effect of commercial bank loans on financial performance of
savings and credit co-operative society in Kisumu. The study aimed to examine the effect of loans
offered by commercial banks on the savings and lending volumes of the SACCO in Kisumu City,
to investigate the advantages accrued to individual members owing to competition between
commercial banks and SACCOs in Kisumu City and to identify the factors that cause the SACCO
members to borrow money from other financial institutions in Kisumu City using a case study
research design targeting a sample of 370 respondents from 1 Sacco in Kisumu which was
purposively selected. The study used descriptive research methods of frequency distribution
tables, percentages, mean and standard deviation. Further the study used correlation analysis
method to examine the association between variables and failed to use multiple regression
equation which is being used in the current study.
Belguith and Bellouma (2017) investigated the impact of loan portfolio diversification on
Tunisian banks profitability. The study aimed to examine the impact of loan portfolio
diversification on banks profitability and to assess the effect of loan portfolio diversification on
private and foreign banks in Tunisia. The study sued descriptive research design of a sample of
10 large banks in Tunisia holding an asset base of over 85% of the banking industry over a period
of 15 years from 2000-2015. Data was analyzed using the regression and correlation model and
found that loan portfolio diversification negatively impacts banks profitability. This study failed
to use a larger sample size which might have yielded different outcomes.
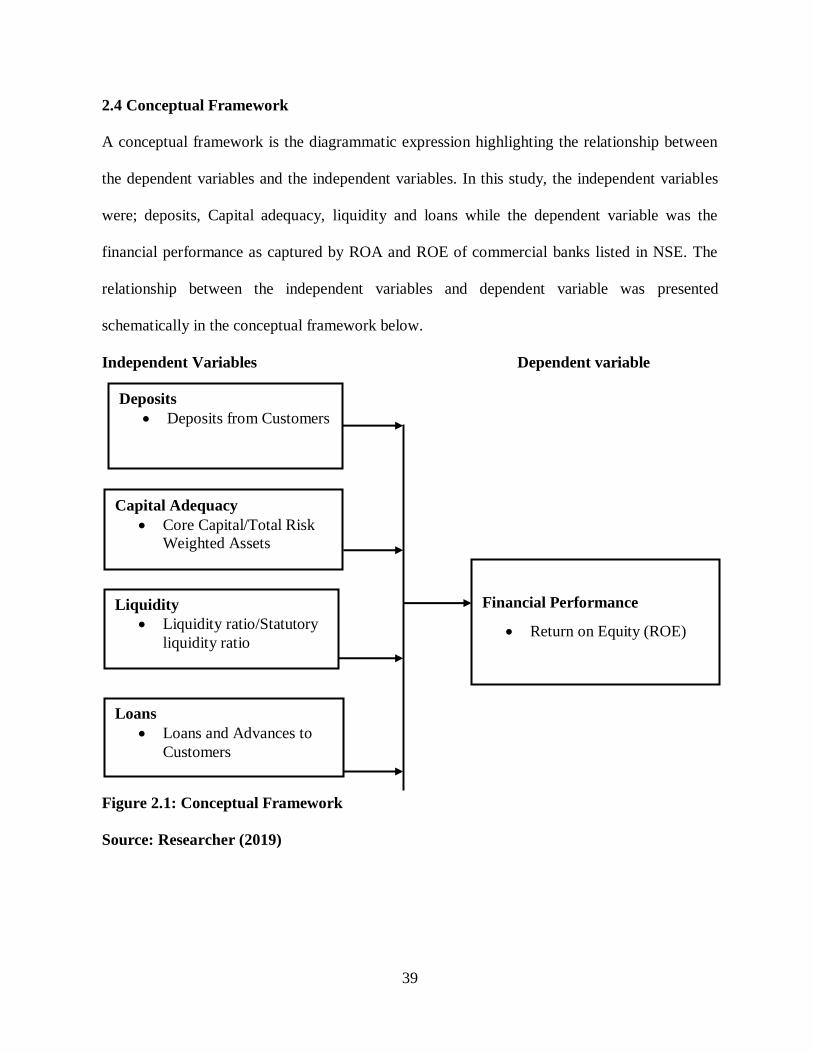
39
2.4 Conceptual Framework
A conceptual framework is the diagrammatic expression highlighting the relationship between
the dependent variables and the independent variables. In this study, the independent variables
were; deposits, Capital adequacy, liquidity and loans while the dependent variable was the
financial performance as captured by ROA and ROE of commercial banks listed in NSE. The
relationship between the independent variables and dependent variable was presented
schematically in the conceptual framework below.
Independent Variables Dependent variable
Figure 2.1: Conceptual Framework
Source: Researcher (2019)
Financial Performance
Return on Equity (ROE)
Liquidity
Liquidity ratio/Statutory
liquidity ratio
Capital Adequacy
Core Capital/Total Risk
Weighted Assets
Deposits
Deposits from Customers
Loans
Loans and Advances to
Customers

40
Deposits consist mainly of funds placed in banking institutions for safe keeping by various
account holders i.e. CASA, term deposit account holders among others. The volume of deposits
influences the ability of a financial institution to give out loans which has a bearing on interest
income and ultimately financial performance. Despite the desirability of commercial banks to
hold excess of deposits over loans, it might eventually lead to escalation of interest expense and
opportunity costs and thus it is always prudent for commercial banks to match their volume of
deposits with volume of loans.
Capital adequacy enables financial institutions absorb losses during economic downtimes and
thus has a positive influence on financial performance. It enables the financial institution built
internal resilience against unanticipated negative shocks in the operating environment. It cushions
depositors and other lenders against reasonable amount of losses before they become insolvent
and thus erode depositor’s funds. The rule of the thump is that commercial banks should
progressively convert their earnings into capital reserves to cover any liabilities or contingent
costs that may occur in the future and which may impair negatively on financial performance.
Liquidity influences financial performances of commercial banks by enabling financial
institutions withstand risks arising from a decrease in deposits not matched with a decrease in
assets. In such a situation the financial institution may suffer liquidity risks like a run on deposits
which may lead to its collapse. Commercial banks also invest their excess liquidity in government
securities to boost earnings and minimize the opportunity cost of holding excess liquidity. Levels
of Liquidity enable the financial institution to be agile and respond to changes in environment
swiftly to improve on financial performance.
Loans influence financial performance of commercial banks because it is the source of interest
income which is the major source of revenue for commercial banks in Kenya. Commercial banks

41
strive to lend more so as to earn a higher interest income and thus the volume of loans created has
huge significant on its financial performance. As posited by Kirimi, (2015), lending interest rates
has a great influence on the financial performance of commercial banks because as they argued,
it is the greatest contributor of revenue combined with managerial efficiencies.

42
CHAPTER THREE
RESEARCH METHODOLOGY
3.1 Research Design
The study adopted a descriptive research design where an empirical examination of the effect of
the independent variables on the dependent variables was carried out. In descriptive research
design, numerical data was collected and mathematically analyzed to approve or disapprove the
null hypotheses (Klazema, 2014). A descriptive research design was found to be more appropriate
because the study sought to collect numerical information about the correlation or relationship of
all the variables under study and applying statistical methods to measure the influence of the
independent variables on the dependent variables. Descriptive research design also enables an
investigation of the correlation between variables over a given time period.
3.2 Study Area
The study area for the research was central bank of Kenya library and its website where annual
banking supervision report was accessed. Also the websites of various commercial banks listed
in NSE was visited to access the published annual financial statements.
3.3 Target Population
Ngari (2014) defines population under study as the total collection of elements about which the
researcher wishes to make some inferences or households that are being investigated. The target
population for the study was all eleven commercial banks listed in NSE. Census research method
was applied where all the eleven commercial banks listed in NSE was taken as the sample size.
A cross-sectional, time series data of all the eleven listed commercial banks was used. The period
of study was taken from 2005 to 2017.

43
Table 3.1: Target population
S/N Name of Bank
1. Barclays Bank Ltd BBK
2. KCB Bank Ltd KCB
3. Equity Bank (K) Ltd EQB
4. Cooperative Bank of Kenya Ltd COOp
5. Diamond Trust Bank Ltd DTB
6. I&M Holdings Ltd I&M
7. Stan Chart Bank Ltd SCB
8. NIC Bank Ltd NIC
9. Housing Finance Group HF
10. National Bank of Kenya Ltd NBK
11. CFC Stanbic Holdings Ltd SBK
Source: CBK (2017)
3.4 Data Collection
As pointed out by Saunders, Lewis and Thornhill (2012), secondary research data involves the
use of information from studies of other researchers relevant to the subject matter. The study
obtained secondary data on Deposits, Capital Adequacy, Liquidity and Loans from published
financial statements of commercial banks listed in NSE. Also annual banking supervision reports
were sourced from CBK website. Time series secondary data was collected for all the eleven
commercial banks listed in NSE for the period of twelve years from 2005 to 2017.
44
3.4.1 Instrumentation
This is the process of deploying data collection tools or instruments in order obtain data from the
sample under study (Dinc, 2017). Data collection tool capturing deposits, capital adequacy,
liquidity and loans of all the eleven commercial banks listed in NSE was utilized as highlighted
in appendix I. The study used secondary data which was obtained from annual published financial
statements of commercial banks listed in NSE and also CBK website.
3.4.2 Data Collection Procedures
This outlines the overall research design and operationalization of the variables under study. It
involves specifying the instruments which will be used to collect the data and the process of
deploying the necessary tools in order to collect the required data (Mugenda, 2013). This study
was carried out by use of secondary data. The data collection instrument is shown in appendix I.
3.5 Data Analysis
Data analysis is the process of cleaning and organization the collected data so that useful
information can be derived therein (Mutua, 2013). The study used Statistical Package for Social
Sciences (SPSS) software to analyze the data. In the study, the dependent variable was financial
performance of commercial banks listed in NSE. The financial performance was measured by
ROA and ROE while the independent variables were given as deposits, Capital adequacy,
liquidity and loans.
3.5.1 Descriptive Statistics
The study used descriptive statistics to examine the association between variables by use mean,
standard deviation, maximum and minimum values. A panel data analysis of deposits, capital
adequacy, liquidity, loans, ROA and ROE of commercial banks listed in Nairobi securities
exchange was undertaken. The observations covered twelve years from 2005 to 2017
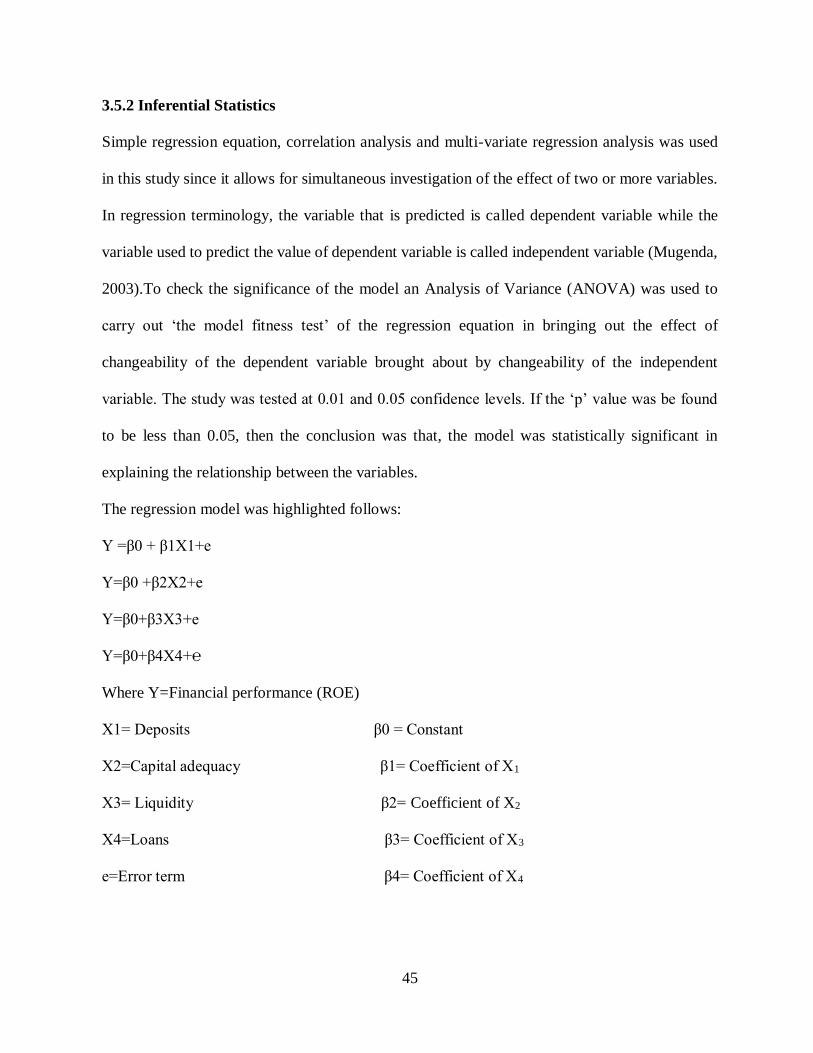
45
3.5.2 Inferential Statistics
Simple regression equation, correlation analysis and multi-variate regression analysis was used
in this study since it allows for simultaneous investigation of the effect of two or more variables.
In regression terminology, the variable that is predicted is called dependent variable while the
variable used to predict the value of dependent variable is called independent variable (Mugenda,
2003).To check the significance of the model an Analysis of Variance (ANOVA) was used to
carry out ‘the model fitness test’ of the regression equation in bringing out the effect of
changeability of the dependent variable brought about by changeability of the independent
variable. The study was tested at 0.01 and 0.05 confidence levels. If the ‘p’ value was be found
to be less than 0.05, then the conclusion was that, the model was statistically significant in
explaining the relationship between the variables.
The regression model was highlighted follows:
Y =β0 + β1X1+e
Y=β0 +β2X2+e
Y=β0+β3X3+e
Y=β0+β4X4+℮
Where Y=Financial performance (ROE)
X1= Deposits β0 = Constant
X2=Capital adequacy β1= Coefficient of X1
X3= Liquidity β2= Coefficient of X2
X4=Loans β3= Coefficient of X3
e=Error term β4= Coefficient of X4

46
3.5.3 Diagnostic Tests/Assumptions of Regression Model
Homoscedastic test was undertaken to validate the assumption that the error term generated in the
relationship between the dependent and independent variable was identical and the same for all
values of the predictor variables and the predicted variable. The test was necessary to confirm
homoscedasticy of the relationship between the dependent and the independent variables.
Normality test was further undertaken to test that relationship between the predicted and the
predictor variables follow a normal distribution curve and that, the variance around the regression
line was taken to be the same for all the predictor variables and data.
Multi-collinearity test was also undertaken to validate that the variables being examined were
devoid of auto correlation of and that the predictor variables were not influenced by the other
independent variables to a certain degree of accuracy. This test was important in eliminating
biases brought about by the interrelationship among the predictor variables that might influence
the outcome of the relationship between predicted and predictor variables.
3.6 Ethical Consideration
To preserve and maintain ethical norms in research, the study sought permission from Kisii
University before collection commenced. Also permission was sought from the National
Commission for Science, Technology and Innovation (NACOSTI) before data collection
commenced. Furthermore besides ensuring that citations were duly referenced, plagiarism levels
were managed below 20 per cent.

47
CHAPTER FOUR
DATA ANALYSIS AND DISCUSSIONS OF FINDINGS
4.1 Descriptive Statistics
4.1.1 Deposits
Deposits are important component in commercial banks operations and are largely funds placed
by customers who operate various bank accounts for safekeeping. These bank accounts could be
current accounts, savings accounts, term deposit accounts etc. Deposits generally influence the
ability of commercial banks to give loans and thus have significant influence on interest income
and ultimately financial performance (Cytonn, 2017). The null hypotheses of the study stated that
deposits have no significant influence on the financial performance of commercial banks listed in
Nairobi securities exchange. The study undertook descriptive statistics analysis to establish the
influence of deposits on the financial performance of commercial banks listed in NSE. Table 4.1
below highlights the descriptive statistics for deposits of the eleven commercial banks listed in
NSE.
KCB bank reported the highest maximum deposit value of kes 445, 398.00 billion while those for
EQB, Coop and DTB the maximum values of deposits were given as kes 298, 703.00 billion, kes
285, 990.00 billion and kes 209, 254.00 billion respectively. Stanchat bank, Diamond trust bank
and Barclays bank had maximum deposit values of kes 226, 051.00 billion, kes 209, 254.00 billion
and kes 189, 305.00 billion respectively. Housing finance group had the lowest maximum deposit
value of kes 41, 888.00 billion.
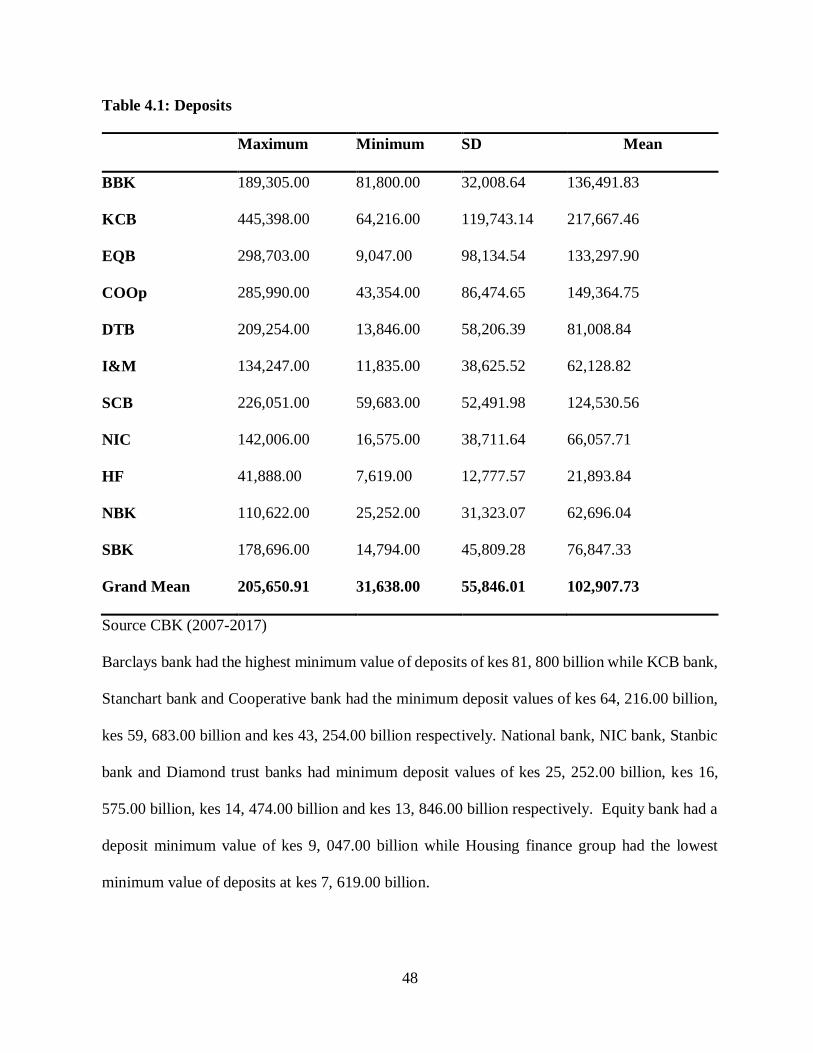
48
Table 4.1: Deposits
Maximum Minimum SD Mean
BBK 189,305.00 81,800.00 32,008.64 136,491.83
KCB 445,398.00 64,216.00 119,743.14 217,667.46
EQB 298,703.00 9,047.00 98,134.54 133,297.90
COOp 285,990.00 43,354.00 86,474.65 149,364.75
DTB 209,254.00 13,846.00 58,206.39 81,008.84
I&M 134,247.00 11,835.00 38,625.52 62,128.82
SCB 226,051.00 59,683.00 52,491.98 124,530.56
NIC 142,006.00 16,575.00 38,711.64 66,057.71
HF 41,888.00 7,619.00 12,777.57 21,893.84
NBK 110,622.00 25,252.00 31,323.07 62,696.04
SBK 178,696.00 14,794.00 45,809.28 76,847.33
Grand Mean 205,650.91 31,638.00 55,846.01 102,907.73
Source CBK (2007-2017)
Barclays bank had the highest minimum value of deposits of kes 81, 800 billion while KCB bank,
Stanchart bank and Cooperative bank had the minimum deposit values of kes 64, 216.00 billion,
kes 59, 683.00 billion and kes 43, 254.00 billion respectively. National bank, NIC bank, Stanbic
bank and Diamond trust banks had minimum deposit values of kes 25, 252.00 billion, kes 16,
575.00 billion, kes 14, 474.00 billion and kes 13, 846.00 billion respectively. Equity bank had a
deposit minimum value of kes 9, 047.00 billion while Housing finance group had the lowest
minimum value of deposits at kes 7, 619.00 billion.
49
The study findings indicate that, generally KCB had the highest Standard deviation of deposits of
ksh. 119, 743.14 billion while Equity bank, Cooperative bank, Diamond trust bank and Stanchart
bank had a SD value of deposits of kes 98, 134.24 billion, kes 86, 474.65 billion, kes 58, 206.39
billion and kes 52, 491.98 billion respectively. Stanbic bank, NIC bank and I&M bank had
standard deviation values of deposits of kes 45, 809.28 billion, kes 38, 711.64 billion and kes 38,
625.5 billion respectively. Housing finance group had the lowest standard deviation value of kes
12, 777.57 billion.
The findings of the study also reveal that KCB bank posted the highest mean value of deposits of
kes 217, 667.46 billion. Coop bank, BBK, and equity banks posted mean values of deposits of
kes 149, 364.75 billion, kes136, 491.83 billion and kes 133, 297.90 billion respectively while
Stanchart, DTB and Stanbic bank reported mean values of deposits of kes 124, 530.56 billion,
kes 81, 008.84 billion and kes 76, 847.33 billion respectively. NIC bank, national bank and I&M
bank had deposit mean values of kes 66, 057.71 billion, kes 2, 696.04 billion and kes 62, 128.82
billion respectively. Housing Finance had the lowest mean value of deposits of kes 21, 893.94
billion
4.1.2 Capital Adequacy
Capital adequacy enables financial institutions withstand losses in times of negative economic
cycles. It contributes to growth of internal resilience of commercial banks and enables it to
cushion itself against unanticipated negative shocks in the operating environment. Capital
adequacy is very crucial to depositors and financial investors since it cushions them against
reasonable amount of losses before commercial banks become insolvent and thus not being able
to give them back their deposits. It is always advisable for commercial banks to progressively
convert their earnings into capital reserves to cover any liabilities or contingent costs that may

50
occur in the future and which may impair negatively on financial performance (Eyigege,
2018).The banks total capital consists of tier one capital and tier two capital. Generally tier one
capital consists of shareholders equity and retained earnings and is mainly the primary source of
funding for commercial banks. Tier two capital consists of undisclosed funds that do not appear
in the bank’s financial statements and includes revaluation reserves, subordinated debts, and
general loan loses etc. Basel III accord recommended capital adequacy of commercial banks to
be 10.5 per cent (CBK, 2017)
The null hypotheses of the study indicated that Capital adequacy has no significant influence on
the financial performance of commercial banks listed in NSE. The study measured capital
adequacy using the ratios; Core Capital to Total Risk weighted assets, Total Capital to Total Risk
Weighted Assets and Core Capital to Total Deposits to uphold or reject the null hypotheses
4.1.2.1 Core Capital to Total Risk Weighted Assets
The core capital to the total risk weighted assets (TRWA) is a common ratio that affects the level
of capital in which commercial banks have to retain in order to meet the regulatory threshold of
capital adequacy (CBK, 2017). The activity of commercial banks is lending and thus the quality
of its assets is paramount. The major risk components in TRWA computations are market risks,
credit risks and operational risks. Table 4.2 below highlights descriptive statistics of core capital
to risk weighted assets of the eleven commercial listed in NSE.
Equity bank had the highest maximum value of capital adequacy of 45.68 while National banks
and housing finance had maximum vales of capital adequacy of 40.85 and 40.52 respectively.
Barclays bank, KCB bank and Coop bank had maximum values of capital adequacy 26.58, 23.12
and 22.01 respectively. NIC bank had the lowest maximum value of capital adequacy of 17.22.

51
The study findings also reveal that Equity bank had the highest minimum values of capital
adequacy of 13.86 while KCB bank had a minimum value of capital adequacy of 13.61. NIC
bank, Stanchat and Barclays banks had the lowest minimum values of capital adequacy of 13.30,
12.31 and 12.12 respectively. National bank posted the lowest minimum value of capital adequacy
of 3.98
Table 4.2: Core Capital to Total Risk Weighted Assets
Maximum Minimum SD Mean
BBK 26.58 12.12 4.46 17.57
KCB 23.12 13.61 2.86 17.16
EQB 45.68 13.86 8.76 20.57
COOp 22.01 11.37 3.02 16.25
DTB 19.10 11.12 2.01 16.05
I&M 18.90 10.95 2.37 15.65
SCB 18.32 12.31 1.73 15.80
NIC 17.22 13.30 1.07 15.01
HF 40.52 10.47 8.71 18.82
NBK 40.85 3.98 12.82 22.49
SBK 20.50 10.26 3.14 15.13
Grand Mean 26.62 11.21 4.63 17.32
Source CBK (2007-2017)
The bank with the highest standard deviation of capital adequacy was National bank with a value
of 12.82 while Equity bank, Housing finance and Barclays banks had capital adequacy standard
deviations values of 8.76, 8.71 and 4.46 respectively. Coop bank and I&M banks has capital

52
adequacy standard deviations values of 3.02 and 2.37 respectively while the bank with the least
Standard deviation was NIC banks with an SD of 1.07.
National banks had the highest mean value of 22.49 while Equity bank, Housing Finance,
Barclay’s banks and KCB had capital adequacy mean values of 20.57, 18.82, 17.57 and 17.16
respectively. Cooperative bank, diamond trust and CFC Stanbic banks had mean values of 16.25,
16.05 and 15.80 respectively. The bank with the lowest capital adequacy mean value was NIC
bank with 15.01.
4.1.3 Liquidity
Liquidity influences the financial performance of commercial banks by determining a trade of
between short term investment decisions and demand of deposits by account holders. Commercial
banks usually invest their excess liquidity in high earning asset yields i.e. government securities
to improve on their financial performance. Liquidity management also enable financial
institutions minimize the opportunity cost of holding excess liquidity and become agile balancing
between liabilities and assets. Commercial banks must maintain liquid or near liquid assets that
can finds the cash cycle for a month (Cytonn, 2018).The null hypotheses stated that the liquidity
has no significant influence on the financial performance of commercial banks listed in NSE.
Descriptive statistics of liquidity ratio to minimum statutory ratio was undertaken to uphold or
reject the null hypotheses.
4.1.3.1 Liquidity Ratio to Statutory Liquidity Ratio
The liquidity ratio of commercial banks listed in NSE was measured against the statutory
minimum liquidity ratio of 20 per cent. The liquidity ratio to minimum statutory ratio statistics is
presented in the table 4.5 below (CBK, 2017).
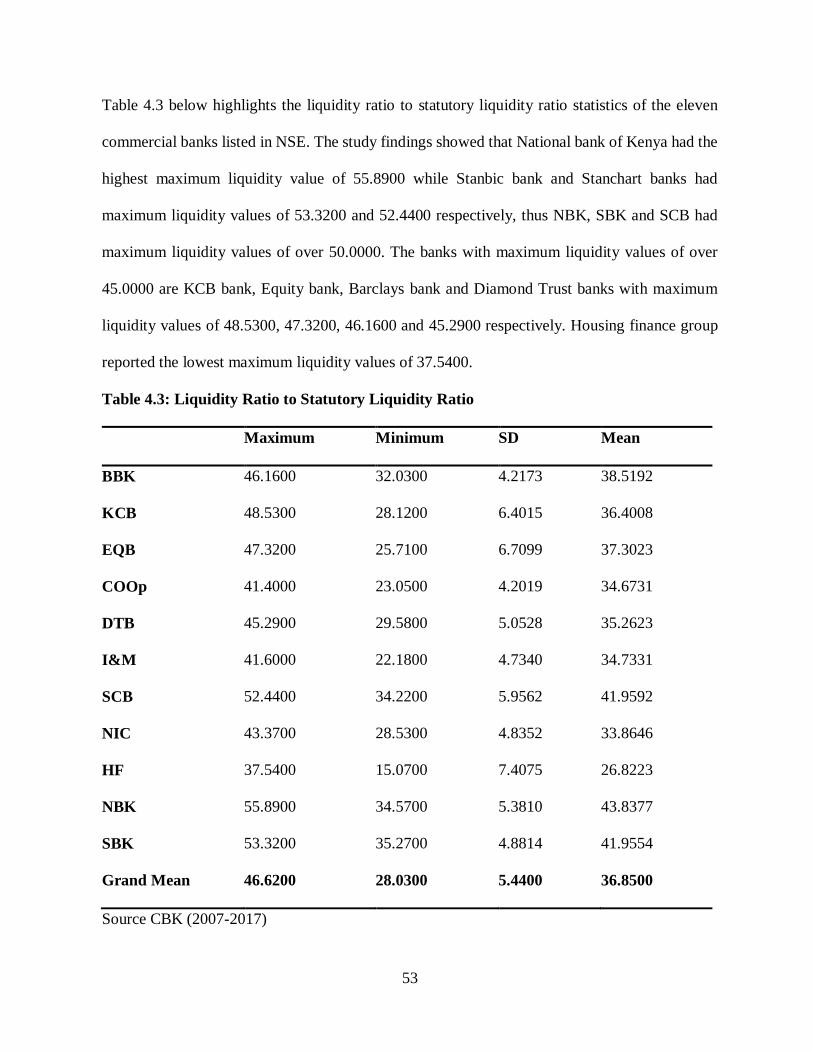
53
Table 4.3 below highlights the liquidity ratio to statutory liquidity ratio statistics of the eleven
commercial banks listed in NSE. The study findings showed that National bank of Kenya had the
highest maximum liquidity value of 55.8900 while Stanbic bank and Stanchart banks had
maximum liquidity values of 53.3200 and 52.4400 respectively, thus NBK, SBK and SCB had
maximum liquidity values of over 50.0000. The banks with maximum liquidity values of over
45.0000 are KCB bank, Equity bank, Barclays bank and Diamond Trust banks with maximum
liquidity values of 48.5300, 47.3200, 46.1600 and 45.2900 respectively. Housing finance group
reported the lowest maximum liquidity values of 37.5400.
Table 4.3: Liquidity Ratio to Statutory Liquidity Ratio
Maximum Minimum SD Mean
BBK 46.1600 32.0300 4.2173 38.5192
KCB 48.5300 28.1200 6.4015 36.4008
EQB 47.3200 25.7100 6.7099 37.3023
COOp 41.4000 23.0500 4.2019 34.6731
DTB 45.2900 29.5800 5.0528 35.2623
I&M 41.6000 22.1800 4.7340 34.7331
SCB 52.4400 34.2200 5.9562 41.9592
NIC 43.3700 28.5300 4.8352 33.8646
HF 37.5400 15.0700 7.4075 26.8223
NBK 55.8900 34.5700 5.3810 43.8377
SBK 53.3200 35.2700 4.8814 41.9554
Grand Mean 46.6200 28.0300 5.4400 36.8500
Source CBK (2007-2017)

54
The findings of the study from the table 4.3 above also indicated that, Stanbic bank posted the
highest minimum liquidity value of 35.2700 while national bank had a minimum liquidity value
of 34.5700. A total of four banks had minimum liquidity values of over 30.0000 with Stanchart
and Barclays banks reporting liquidity values of 34.2200 and 32.0300 respectively. Diamond trust
bank, NIC bank, KCB bank, Equity bank and Cooperative bank had minimum liquidity values of
29.5800, 28.5300, 28.1200, 25.7100 and 23.0500 respectively. Housing finance had the lowest
minimum liquidity value of 15.0700.
Housing finance group reported the highest liquidity standard deviation value of 7.4075. Equity
bank and KCB reported liquidity standard deviation values of 6.7099 and 6.4015 respectively.
Stanchart bank, National bank and Diamond trust bank each recorded liquidity standard deviation
vales of 5.9562, 5.3810 and 5, 0528 respectively. NIC bank, I&M bank and Barclays bank
indicated a liquidity standard deviation values of 4. 8352, 4.7340 and 4.2173 respectively.
Cooperative bank showed the lowest liquidity standard deviation value of 4.2109.
The study findings also showed that, National bank had the highest mean value of liquidity of
43.8377 while Stanbic bank and Stanchart banks reported mean liquidity values of 41.9554 and
41.9592 respectively. Barclays bank, Equity bank and KCB banks each reported mean liquidity
values of 38.5192, 37.3023 and 36.4008 respectively. Diamond trust bank and Cooperative bank
mean liquidity values were 35.2623 and 34.6731 respectively. The bank with the lowest mean
liquidity value was housing finance with a value of 26.8223. Generally all the banks reported a
mean liquidity value of over 30.000 except Housing Finance.

55
4.1.4 Loans
Loans are an important component of commercial banks performance because it determines the
interest income yield for the respective bank. Commercial banks strive to lend more in order to
earn a higher interest income and thus loans and advances to customers has a huge significance
on its financial performance. Kirimi (2015) posited that lending interest rates has a great influence
on the financial performance of commercial banks because as they argued, it is the greatest
contributor of revenue. The null hypotheses stated that loans have no significant influence on the
financial performance of commercial banks listed in NSE. Descriptive statistics of loans and
advances to customers was analyzed to uphold or reject the null hypotheses
4.1.4.1. Loans and advances to Customers
Loans and advances to customers is the net sum of term loans and overdraft facilities created by
commercial banks and extended to borrowers. The figure for loan and advances will be varying
from time to time depending on repayments or reflows by the borrowers. It excludes contingent
liabilities which are non-funded facilities also extended to customers (Cytron, 2017).
Table 4.4 below illustrate that KCB bank reported the highest maximum value of loans and
advances to customers at kes 411, 66.00 billion while cooperative bank and equity bank had
maximum loans and advances to customers values of kshs 262,362.00 billion and kes 229,394.00
billion respectively. Barclays bank, diamond trust bank and Stanchart bank had maximum loans
and advances to customer values of kes 177, 224.00 billion, kes 156, 843.00 billion and kes 139,
406.00 billion respectively. Stanbic bank, I&M bank and National bank had maximum loans and
advances to customer’s values of kes 135, 443.00 billion, kes 26, 983.00 billion and kes 72,
842.00 billion respectively. Housing finance group reported the lowest maximum loan and
advances to customer’s value of kes 56, 785.56 billion.

56
Table 4.4: Loans and Advances to Customers
Maximum Minimum SD Mean
BBK 177,224.00 70,220.00 34,227.24 115,001.12
KCB 411,666.00 36,311.00 126,573.05 185,727.64
EQB 229,394.00 5,524.00 84,158.41 112,149.60
COOp 262,362.00 44,655.00 77,355.65 125,712.29
DTB 156,843.00 10,318.00 48,528.88 68,674.10
I&M 126,983.00 8,198.00 39,872.51 58,020.40
SCB 139,406.00 35,402.00 42,049.33 88,139.26
NIC 118,459.00 14,259.00 39,070.96 62,165.77
HF 56,785.56 6,345.00 19,526.80 28,152.35
NBK 72,842.00 11,606.00 23,730.49 37,074.13
SBK 135,443.00 11,662.00 39,188.23 64,592.24
Grand Mean 171,582.51 23,136.36 52,182.87 85,946.26
Source CBK (2007-2017)
The study findings from table 4.4 above also indicated that, Barclays had the highest minimum
value of loans and advances to customers of kes 70.220.00 billion. Cooperative bank, KCB bank,
and Stanchart bank had minimum values of loans and advances to customers of kes 44, 655.00
billion, kes 36, 311.00 billion and kes 35, 402.00 billion respectively. NIC bank, Stanbic bank
and National bank had minimum values of loans and advances to customers of kes 14, 259.00
billion, kes 11, 662.00 billion and kes 11,606.00 billion respectively. Housing finance group had
a minimum value of loans and advances to customers of kes 6, 345.00 billion while Equity bank
indicated the lowest value of loans and advances to customers of kes 5, 524.00 billion.

57
The study findings showed that KCB bank had the highest standard deviation value of loans and
advances to customers of kes 126, 573.05 billion. Equity bank, Cooperative bank and Diamond
trust banks had standard deviation values of loans and advances to customers of kes 84, 158.41
billion, kes 77, 355.65 billion and kes48, 528.88 billion respectively. The standard deviation
values of loans and advances to customers for Stanchart bank, I&M bank, Stanbic and NIC bank
each were kes 42, 049.33 billion, kes 39, 872.51 billion, kes 39, 188.23 billion and kes 39, 070.96
billion respectively. Barclays bank had a standard deviation value of loans and advances to
customers of kes 34, 227.24 billion while the bank with the lowest standard deviation value of
loans and advances to customers was housing finance group with a figure of kes 19, 256.80
billion.
The study findings also found out that KCB bank had the highest mean value of loans and
advances to customers. Cooperative bank, Barclays bank and equity bank each had mean values
of loans and advances to customers of kes 125, 712.29 billion, kes 115, 001.12 billion and kes
112, 149.60 billion respectively. They are among the commercial banks that posted mean values
of loans and advances to customers of over kes 100, 000.00 billion. The mean values of loans and
advances to customers of Stanchart bank, Diamond trust bank, stanbic bank, and NIC bank each
were kes 88, 139.26 billion, kes 68, 674.10 billion, kes 64, 592.24 billion and kes 62, 165.77
billion respectively. I&M bank and national bank each had a mean value of loans and advances
to customers of kes 58, 020.40 billion and kes 37, 074.13 billion. Housing finance group reported
the lowest mean value of loans and advances of kes 28, 152.35 billion.
4.1.5 Financial Performance
Financial performance evaluates how a firm’s policies are actualized in the utilization of assets
to generate revenue. The primary objective of a firm is to generate revenue over and above its
58
operating costs and thus periodic evaluation of its financial statements is paramount to ascertain
whether the firm is making profits or loses. Financial performance can be measured through
various financial measures i.e. return on assets, return on equity, net interest margin, earnings per
share and return on investment (Njeri, 2013). The study Return on Equity (ROE) as a measure of
financial performance.
4.1.5.1 Return on Equity (ROE)
The return on equity is profitability measure that evaluates the shareholders net worth in the firm.
Return on equity sums up the capacity of the firm to generate profit from the investors’ funds in
the firm. It demonstrates how much profit each dollar worth of ordinary stock is able to be
generated from the firm (Mwangangi, 2013). Table 4.8 below shows the descriptive statistics of
ROE of eleven commercial banks listed in NSE.
From table 4.5 below, Equity bank had the highest value of maximum ROE of 50.1100 while
Stanchart bank and Barclays bank each had maximum values of ROE of 45.2700 and 44.5700
respectively. Diamond trust bank, I&M bank and cooperative bank each had maximum values of
ROE of 35.6400, 35.5000 and 34.5300 respectively. NIC bank and National bank each had
maximum values of ROE of 33.9500 and 32.4100. Housing finance reported the lowest maximum
value of ROE of 27.8200.

59
Table 4.5: Return on Equity (ROE)
Maximum Minimum SD Mean
BBK 44.5700 23.0000 7.4586 35.1477
KCB 35.2000 19.3200 3.6293 28.8638
EQB 50.1100 15.9100 10.3333 35.7338
COOP 34.5300 17.3900 5.4405 27.3762
DTB 35.6400 18.6100 5.3760 25.8477
I&M 35.5000 21.5000 4.8204 28.7369
SCB 45.2700 21.3000 7.1289 35.4277
NIC 33.9500 14.8100 5.3572 24.7338
HF 27.8200 3.9000 7.2675 14.6054
NBK 32.4100 -15.4000 12.4906 18.8831
Grand Mean 36.9400 14.0900 6.7700 27.1800
Source CBK (2007-2017)
The findings showed that Barclays bank had the highest minimum value of ROE of 23.0000. The
other commercial banks with minimum ROE values above 20 were I&M bank and Stanchart bank
each with minimum ROE values of 21.5000 and 21.3000 respectively. KCB bank, DTB bank,
cooperative bank and equity bank each had minimum values of ROE of 19.3200, 18.6100,
17.3900 and 15.9100 respectively. National bank reported the lowest minimum value of ROE of
-15.4000.
The research findings showed that only two banks had Standard deviation values of ROE of more
than 10.0. National bank had the highest standard deviation of 12.4906 while equity bank had an
SD value of ROE of 10.3333. Barclays bank, Housing finance group and Stanchart bank each had

60
standard deviation values of ROE of 7.4586, 7.2675 and 7.1289 respectively. Diamond Trust
bank, NIC bank and cooperative bank each had standard deviation values of ROE of 5.3760,
5.3572 and 5.4405 respectively. I&M bank reported a standard deviation value of ROE of 4.8204
while KCB bank had the lowest overall standard deviation value of ROE of 3.6293.
The research findings also indicated that equity bank had the highest mean value of ROE of
35.7338 followed by Stanchart bank and Barclays bank with mean value of ROE of 35.4277 and
35.1477 respectively. KCB bank, I&M bank, Cooperative bank and Diamond trust bank each had
mean values of ROE of 28.8638, 28.7369, 27.3762 and 25.8477 respectively. The study findings
showed that Housing finance had the lowest mean value of ROE of 14.6054.
4.2 Inferential Statistics
4.2.1 Correlation Analysis
Correlation analysis of the predictor and the predicted variables was evaluated to ascertain their
association with each other. The data collected was subsequently analyzed to ascertain the
Pearson correlation coefficient which establishes the existence of association between the
independent and the dependent variables. A Pearson’s correlation analysis of the variables was
analyzed at 5% level of significance. The magnitude of the association between the dependent
and the independent variables was measured based on Pearson’s correlation scale, where the
correlation coefficient of less than 0.3 signified a weak correlation, a correlation coefficient
between the intervals 0.3 and 0.5 indicated a moderate correlation and a correlation coefficient
greater than 0.5 illustrated strong correlation. The results are presented in table 4.6
From the table 4.6 below, the study findings indicated that the correlation between study variables
Deposits and ROE was (r=0.6482, p<0.05) which indicated a strong positive correlation between
deposits and ROE. The relationship was also indicated as significant at 0.05 levels. The study

61
findings also established the correlation between Capital Adequacy and ROE was (r=-0.1996,
p>0.05) which illustrated an insignificant correlation at 0.05 level.
Table 4.6: Pearson’s Correlation Summary
ROE Deposits Capital
Adequacy
Liquidity Loans
ROE 1.0000
Deposits 0.6482* 1.0000
Capital
Adequacy
-0.1996
-0.0644
1.0000
Liquidity 0.3550 0.2517 0.1658 1.0000
Loans 0.6131* 0.9836* -0.1262 0.1044 1.0000
*. Correlation is significant at the 0.05 level (2-tailed).
Source: (Researcher, 2019)
The results further indicated that liquidity and financial performance (ROE) had a correlation (r
= 0.3550, p>0.05) implying that there was no significant association between the two variables.
It was also evident that the correlation between Loans and financial performance was (r=0.6131,
p<0.05) indicating a strong significant relationship between Loans and ROE.
4.3 Diagnostic Tests
4.3.1 Tests for Homoscedasticity
The findings of the study was subjected to homoscedasticy test to evaluate the assumption of
homoscedasticity where it was deducted that the error term generated in the relationship between
the dependent and independent variable was homoscedastic and that it was the same or identical
for all values of the predictor variables. Table 4.7 shows the results obtained.

62
4.7: Table 4.7: Results of Homoscedasticity
Variable χ2 value p-value Conclusion Action
Deposits 0.68 0.4088 homoscedasticity can be upheld None
Capital
Adequacy
1.65 0.1987 homoscedasticity can be upheld None
Liquidity 1.26 0.2621 homoscedasticity can be upheld None
Loans 0.43 0.5118 homoscedasticity can be upheld None
Source: (Researcher, 2019)
The diagnostic tests results from table 4.7 above illustrated that the ‘p’ values of Deposits, Capital
Adequacy, Liquidity and Loans were 0.4088, 0.1987, 0.2621 and 0.5118 respectively. This
indicated that the test was statistically significant and therefore the assumption that data was
homoscedastic was confirmed. The study thus, concluded that the data was homoscedastic and
no further action was required.
4.3.2 Test for Normality
Assessment of the normality of the dependent variable is an important condition in multiple
regression analysis The findings of the study was tested to ascertain its normality condition where
it was assumed that the relationship between the predicted and the predictor variables follow a
normal distribution curve and that, the variance around the regression line was taken to be the
same for all the predictor variables.
It was necessary to carry out the normality test since the statistical procedures used in the study
including regression were based on the assumption that the data follows a normal distribution.
The assumption here is that the population from which the sample was drawn was normally
distributed (Ghasemi & Zahediasi, 2012). It was therefore statistically prudent to fit the multiple
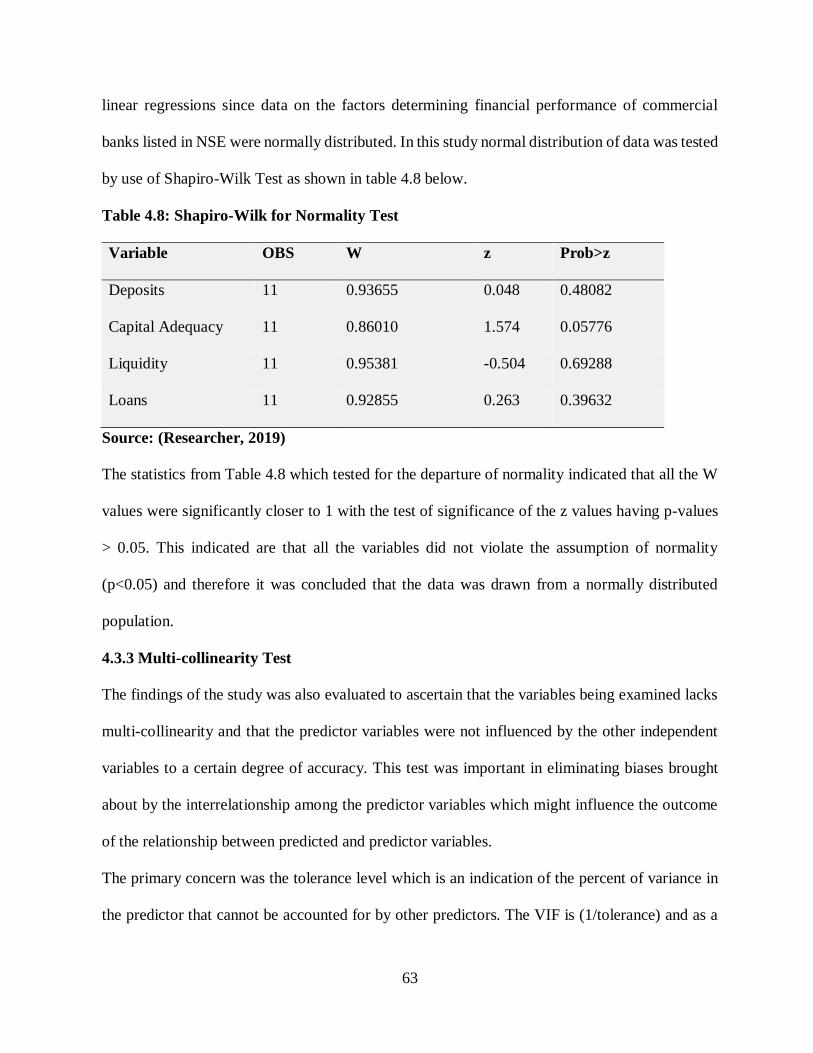
63
linear regressions since data on the factors determining financial performance of commercial
banks listed in NSE were normally distributed. In this study normal distribution of data was tested
by use of Shapiro-Wilk Test as shown in table 4.8 below.
Table 4.8: Shapiro-Wilk for Normality Test
Variable OBS W z Prob>z
Deposits 11 0.93655 0.048 0.48082
Capital Adequacy 11 0.86010 1.574 0.05776
Liquidity 11 0.95381 -0.504 0.69288
Loans 11 0.92855 0.263 0.39632
Source: (Researcher, 2019)
The statistics from Table 4.8 which tested for the departure of normality indicated that all the W
values were significantly closer to 1 with the test of significance of the z values having p-values
> 0.05. This indicated are that all the variables did not violate the assumption of normality
(p<0.05) and therefore it was concluded that the data was drawn from a normally distributed
population.
4.3.3 Multi-collinearity Test
The findings of the study was also evaluated to ascertain that the variables being examined lacks
multi-collinearity and that the predictor variables were not influenced by the other independent
variables to a certain degree of accuracy. This test was important in eliminating biases brought
about by the interrelationship among the predictor variables which might influence the outcome
of the relationship between predicted and predictor variables.
The primary concern was the tolerance level which is an indication of the percent of variance in
the predictor that cannot be accounted for by other predictors. The VIF is (1/tolerance) and as a
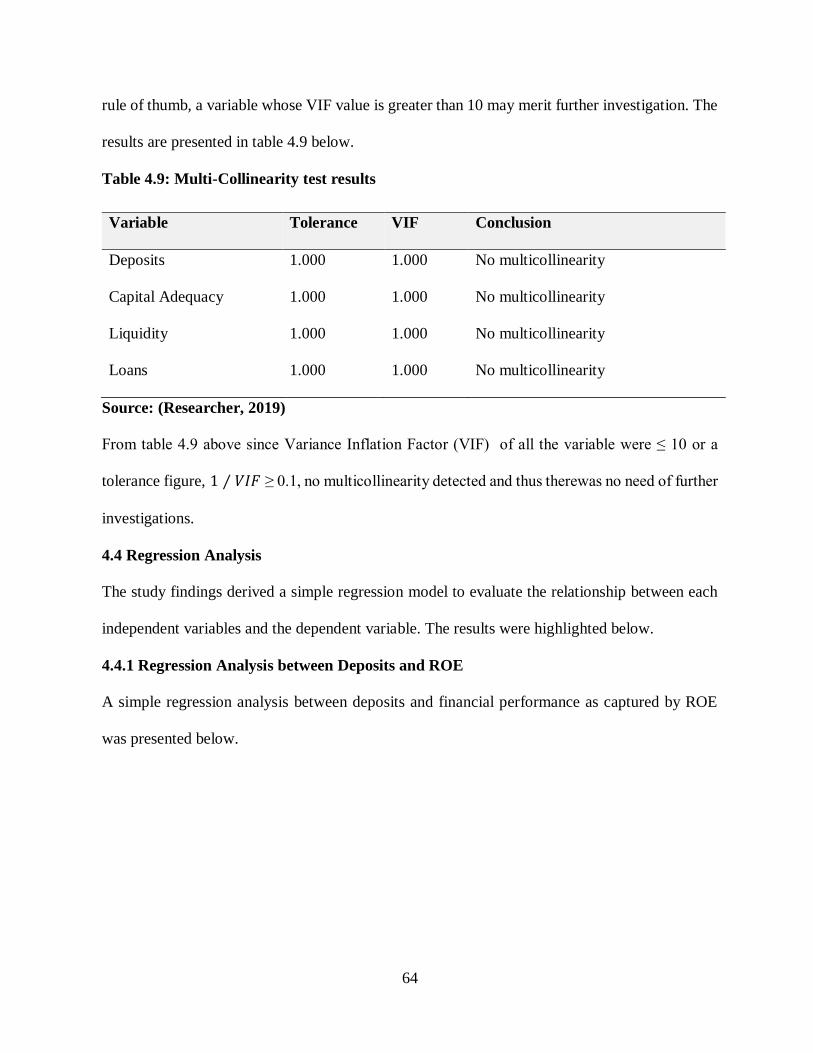
64
rule of thumb, a variable whose VIF value is greater than 10 may merit further investigation. The
results are presented in table 4.9 below.
Table 4.9: Multi-Collinearity test results
Source: (Researcher, 2019)
From table 4.9 above since Variance Inflation Factor (VIF) of all the variable were ≤ 10 or a
tolerance figure, 1 ⁄ 𝑉𝐼𝐹 ≥ 0.1, no multicollinearity detected and thus therewas no need of further
investigations.
4.4 Regression Analysis
The study findings derived a simple regression model to evaluate the relationship between each
independent variables and the dependent variable. The results were highlighted below.
4.4.1 Regression Analysis between Deposits and ROE
A simple regression analysis between deposits and financial performance as captured by ROE
was presented below.
Variable Tolerance VIF Conclusion
Deposits 1.000 1.000 No multicollinearity
Capital Adequacy 1.000 1.000 No multicollinearity
Liquidity 1.000 1.000 No multicollinearity
Loans 1.000 1.000 No multicollinearity

65
Table 4.10: Model Summary-Deposits
Model R RSquare
Adjusted R
Square
Std. Error
of the
Estimate
Change Statistics
Durbin-
Watson
R Square
Change
F
Change df1 df2
Sig. F
Change
1 .648a .420 .356 5.4294935 .420 6.522 1 9 .031 2.157
a. Predictors: (Constant), Deposits
b. Dependent Variable: ROE
Source: (Researcher, 2019)
The model summary in table 4.10 above indicated the strength of the relationship between
Deposits and Return on Equity (ROE) . The value of R squared measures if variations occurs in
deposits how much the ROE will change. The model summary also revealed the value of R
squared was (R2 = 0.420) which indicated that approximately 42 per cent of variance in financial
performance was explained by the movement in deposits. The model summary also indicated that
58 per cent of the variance in the financial performance was explained by other factors other than
deposits.
The analysis of variance (ANOVA) which tells us the goodness of fit of the entire model in
explaining the changeability of the dependent variable brought about by the changeability of the
independent variables is presented in table 4.11 below.
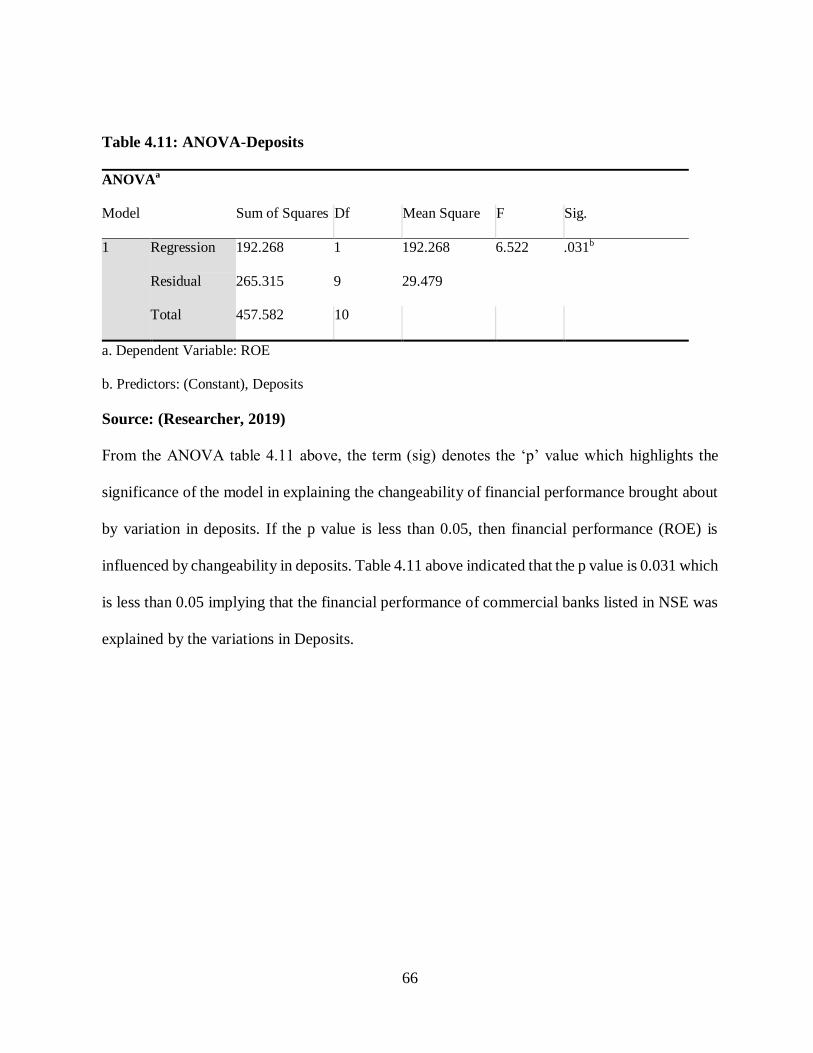
66
Table 4.11: ANOVA-Deposits
ANOVAa
Model Sum of Squares Df Mean Square F Sig.
1 Regression 192.268 1 192.268 6.522 .031b
Residual 265.315 9 29.479
Total 457.582 10
a. Dependent Variable: ROE
b. Predictors: (Constant), Deposits
Source: (Researcher, 2019)
From the ANOVA table 4.11 above, the term (sig) denotes the ‘p’ value which highlights the
significance of the model in explaining the changeability of financial performance brought about
by variation in deposits. If the p value is less than 0.05, then financial performance (ROE) is
influenced by changeability in deposits. Table 4.11 above indicated that the p value is 0.031 which
is less than 0.05 implying that the financial performance of commercial banks listed in NSE was
explained by the variations in Deposits.
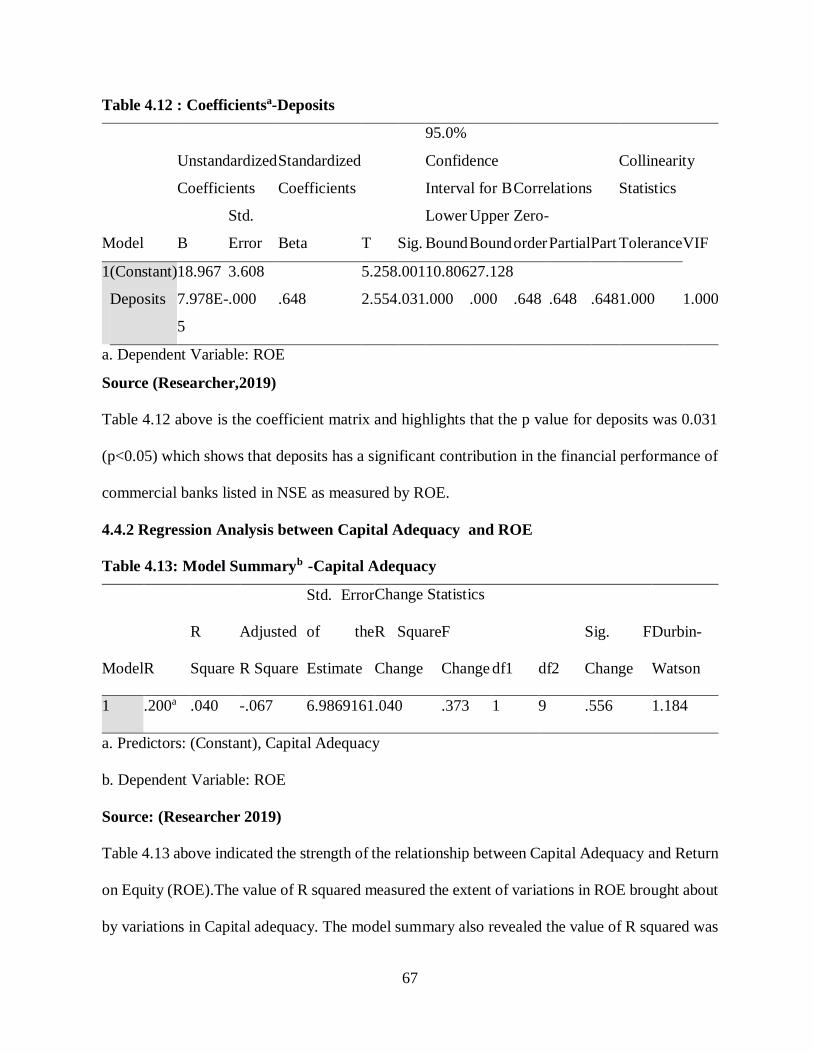
67
Table 4.12 : Coefficientsa-Deposits
Model
Unstandardized
Coefficients
Standardized
Coefficients
T Sig.
95.0%
Confidence
Interval for B Correlations
Collinearity
Statistics
B
Std.
Error Beta
Lower
Bound
Upper
Bound
Zero-
order Partial Part Tolerance VIF
1 (Constant) 18.967 3.608 5.258 .001 10.806 27.128
Deposits 7.978E-
5
.000 .648 2.554 .031 .000 .000 .648 .648 .648 1.000 1.000
a. Dependent Variable: ROE
Source (Researcher,2019)
Table 4.12 above is the coefficient matrix and highlights that the p value for deposits was 0.031
(p<0.05) which shows that deposits has a significant contribution in the financial performance of
commercial banks listed in NSE as measured by ROE.
4.4.2 Regression Analysis between Capital Adequacy and ROE
Table 4.13: Model Summaryb -Capital Adequacy
Model R
R
Square
Adjusted
R Square
Std. Error
of the
Estimate
Change Statistics
Durbin-
Watson
R Square
Change
F
Change df1 df2
Sig. F
Change
1 .200a .040 -.067 6.9869161 .040 .373 1 9 .556 1.184
a. Predictors: (Constant), Capital Adequacy
b. Dependent Variable: ROE
Source: (Researcher 2019)
Table 4.13 above indicated the strength of the relationship between Capital Adequacy and Return
on Equity (ROE).The value of R squared measured the extent of variations in ROE brought about
by variations in Capital adequacy. The model summary also revealed the value of R squared was
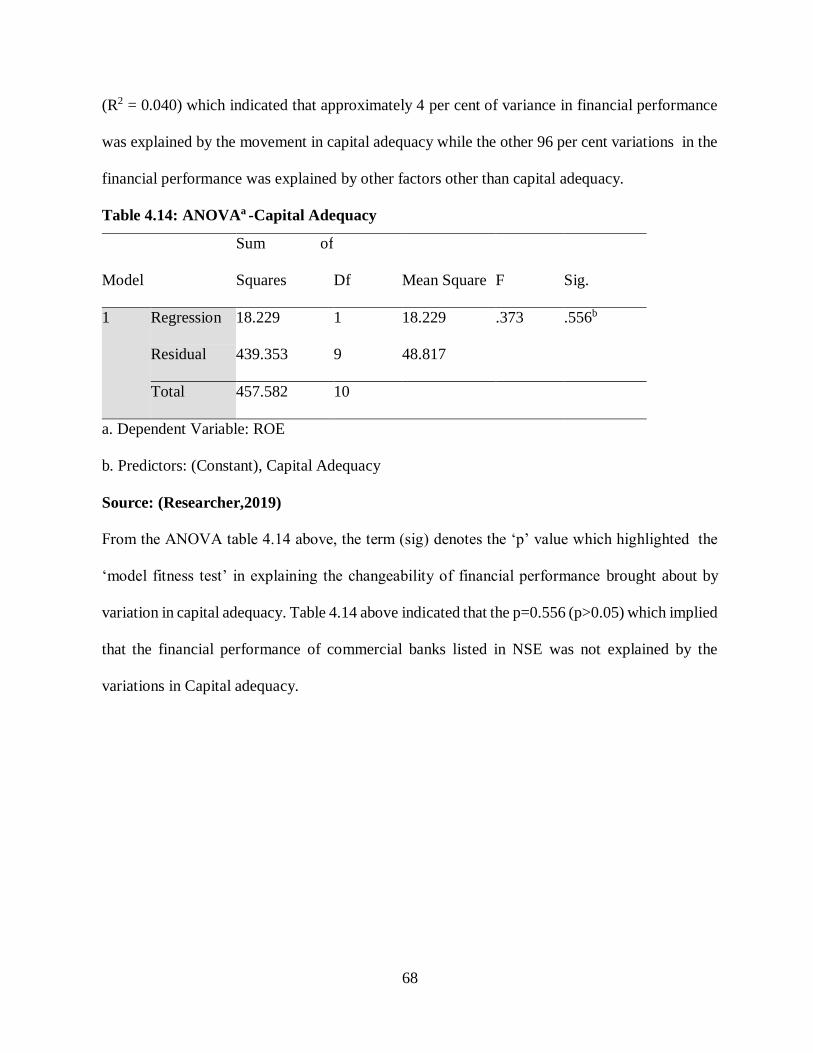
68
(R2 = 0.040) which indicated that approximately 4 per cent of variance in financial performance
was explained by the movement in capital adequacy while the other 96 per cent variations in the
financial performance was explained by other factors other than capital adequacy.
Table 4.14: ANOVAa -Capital Adequacy
Model
Sum of
Squares Df Mean Square F Sig.
1 Regression 18.229 1 18.229 .373 .556b
Residual 439.353 9 48.817
Total 457.582 10
a. Dependent Variable: ROE
b. Predictors: (Constant), Capital Adequacy
Source: (Researcher,2019)
From the ANOVA table 4.14 above, the term (sig) denotes the ‘p’ value which highlighted the
‘model fitness test’ in explaining the changeability of financial performance brought about by
variation in capital adequacy. Table 4.14 above indicated that the p=0.556 (p>0.05) which implied
that the financial performance of commercial banks listed in NSE was not explained by the
variations in Capital adequacy.
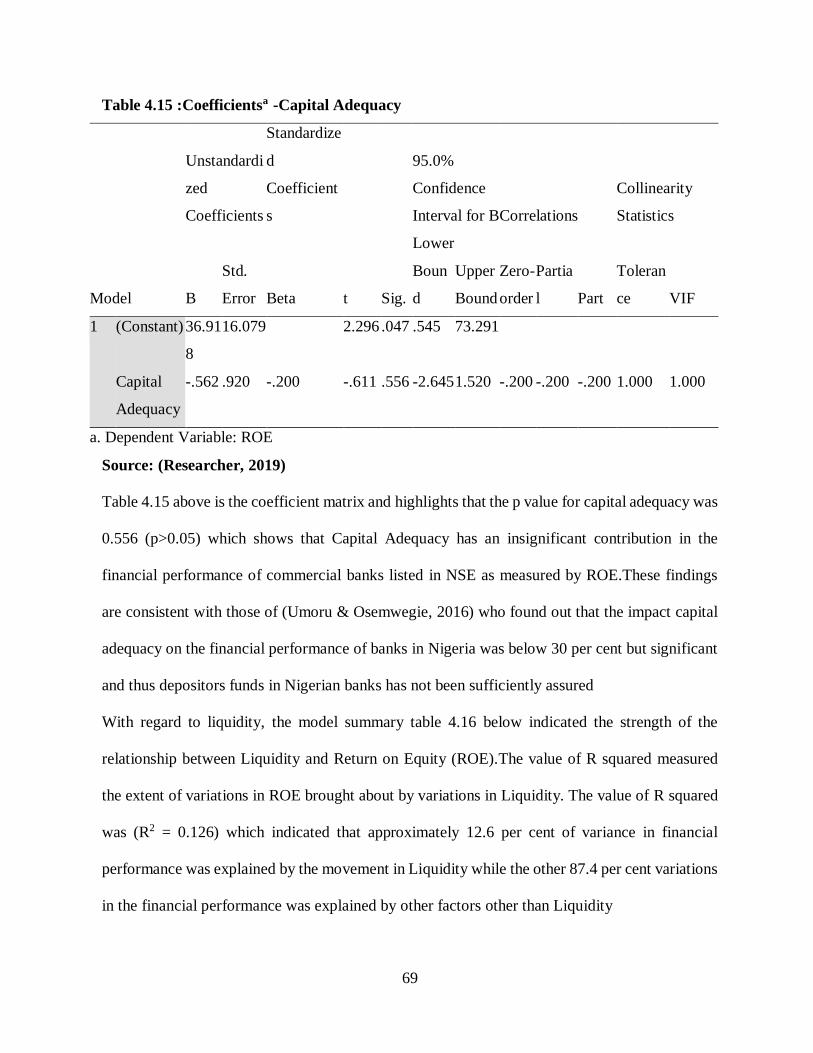
69
Table 4.15 :Coefficientsa -Capital Adequacy
Model
Unstandardi
zed
Coefficients
Standardize
d
Coefficient
s
t Sig.
95.0%
Confidence
Interval for B Correlations
Collinearity
Statistics
B
Std.
Error Beta
Lower
Boun
d
Upper
Bound
Zero-
order
Partia
l Part
Toleran
ce VIF
1 (Constant) 36.91
8
16.079
2.296 .047 .545 73.291
Capital
Adequacy
-.562 .920 -.200 -.611 .556 -2.645 1.520 -.200 -.200 -.200 1.000 1.000
a. Dependent Variable: ROE
Source: (Researcher, 2019)
Table 4.15 above is the coefficient matrix and highlights that the p value for capital adequacy was
0.556 (p>0.05) which shows that Capital Adequacy has an insignificant contribution in the
financial performance of commercial banks listed in NSE as measured by ROE.These findings
are consistent with those of (Umoru & Osemwegie, 2016) who found out that the impact capital
adequacy on the financial performance of banks in Nigeria was below 30 per cent but significant
and thus depositors funds in Nigerian banks has not been sufficiently assured
With regard to liquidity, the model summary table 4.16 below indicated the strength of the
relationship between Liquidity and Return on Equity (ROE).The value of R squared measured
the extent of variations in ROE brought about by variations in Liquidity. The value of R squared
was (R2 = 0.126) which indicated that approximately 12.6 per cent of variance in financial
performance was explained by the movement in Liquidity while the other 87.4 per cent variations
in the financial performance was explained by other factors other than Liquidity
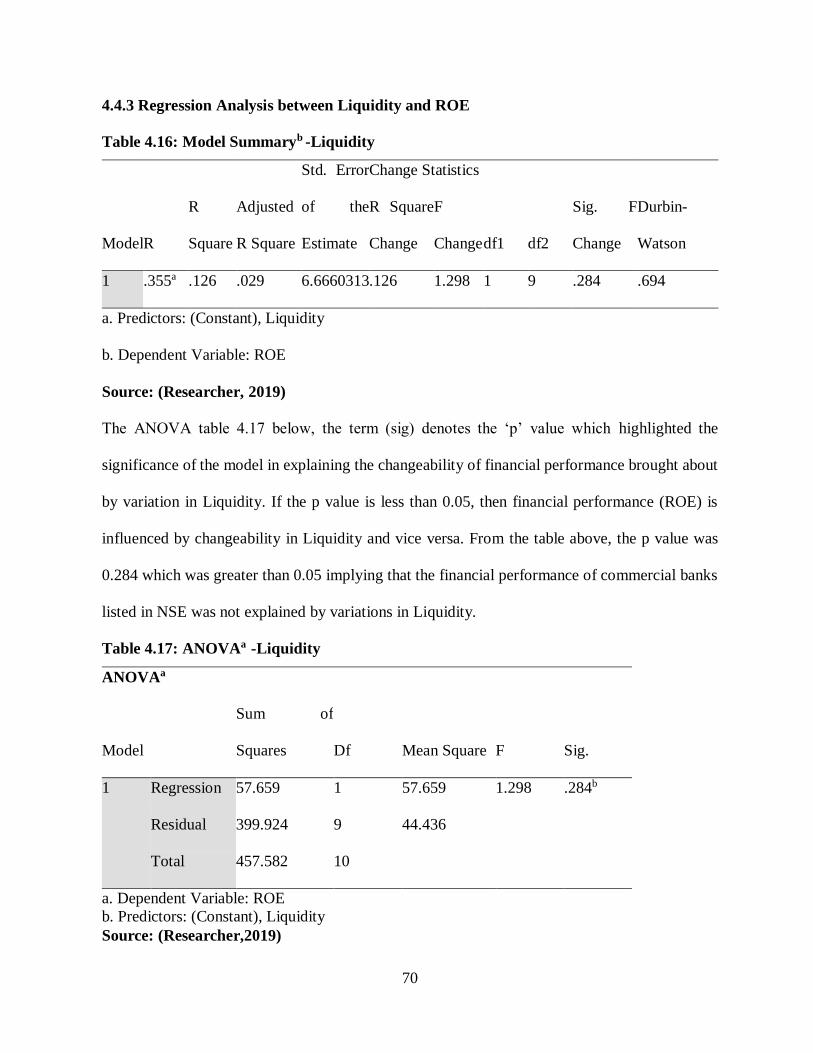
70
4.4.3 Regression Analysis between Liquidity and ROE
Table 4.16: Model Summaryb -Liquidity
Model R
R
Square
Adjusted
R Square
Std. Error
of the
Estimate
Change Statistics
Durbin-
Watson
R Square
Change
F
Change df1 df2
Sig. F
Change
1 .355a .126 .029 6.6660313 .126 1.298 1 9 .284 .694
a. Predictors: (Constant), Liquidity
b. Dependent Variable: ROE
Source: (Researcher, 2019)
The ANOVA table 4.17 below, the term (sig) denotes the ‘p’ value which highlighted the
significance of the model in explaining the changeability of financial performance brought about
by variation in Liquidity. If the p value is less than 0.05, then financial performance (ROE) is
influenced by changeability in Liquidity and vice versa. From the table above, the p value was
0.284 which was greater than 0.05 implying that the financial performance of commercial banks
listed in NSE was not explained by variations in Liquidity.
Table 4.17: ANOVAa -Liquidity
ANOVAa
Model
Sum of
Squares Df Mean Square F Sig.
1 Regression 57.659 1 57.659 1.298 .284b
Residual 399.924 9 44.436
Total 457.582 10
a. Dependent Variable: ROE
b. Predictors: (Constant), Liquidity
Source: (Researcher,2019)

71
Table 4.18 below is the coefficient matrix and highlights that the p value for Liquidity was 0.284
(p>0.05) which shows that Liquidity had an insignificant contribution in the financial
performance of commercial banks listed in NSE as measured by ROE.
Table 4.18 :Coefficientsa -Liquidity
Model
Unstandardized
Coefficients
Standardized
Coefficients
T Sig.
95.0%
Confidence
Interval for B Correlations
Collinearity
Statistics
B
Std.
Error Beta
Lower
Bound
Upper
Bound
Zero-
order Partial Part Tolerance VIF
1 (Constant) 8.549 16.476
.519 .616 -
28.723
45.821
Liquidity .506 .444 .355 1.139 .284 -.498 1.510 .355 .355 .355 1.000 1.000
a. Dependent Variable: ROE
Source: (Researcher,2019)
Table 4.19 below indicated the strength of the relationship between Loans and Return on Equity
(ROE).The value of R squared measured the extent of variations in ROE brought about by
variations in Loans. The model summary revealed the value of R squared was (R2 = 0.376) which
indicated that approximately 37.6 per cent of variance in financial performance was explained by
variations in Loans while the other 62.4 per cent variations in the financial performance was
explained by other factors other than Loans.

72
4.4.4 Regression Analysis between Loans and ROE
Table 4.19: Model Summaryb -Loans
Model R
R
Square
Adjusted
R Square
Std. Error
of the
Estimate
Change Statistics
Durbin-
Watson
R Square
Change
F
Change df1 df2
Sig. F
Change
1 .613a .376 .307 5.6329905 .376 5.421 1 9 .045 2.159
a. Predictors: (Constant), Loans
b. Dependent Variable: ROE
Source: (Researcher, 2019)
Table 4.20 below highlighted the ANOVA which tells us the significance of the model in
explaining the changeability of financial performance brought about by variation in Loans. If the
p value is less than 0.05, then financial performance (ROE) is influenced by changeability in
Loans and vice versa. From the table 4.20 below, it could be deducted that the p value was 0.045
which is less than 0.05 implying that the financial performance of commercial banks listed in
NSE was explained by the variations in Loans
Table 4.20: ANOVAa -Loans
Model
Sum of
Squares Df Mean Square F Sig.
1 Regression 172.007 1 172.007 5.421 .045b
Residual 285.575 9 31.731
Total 457.582 10
a. Dependent Variable: ROE
b. Predictors: (Constant), Loans
Source: (Researcher, 2019)
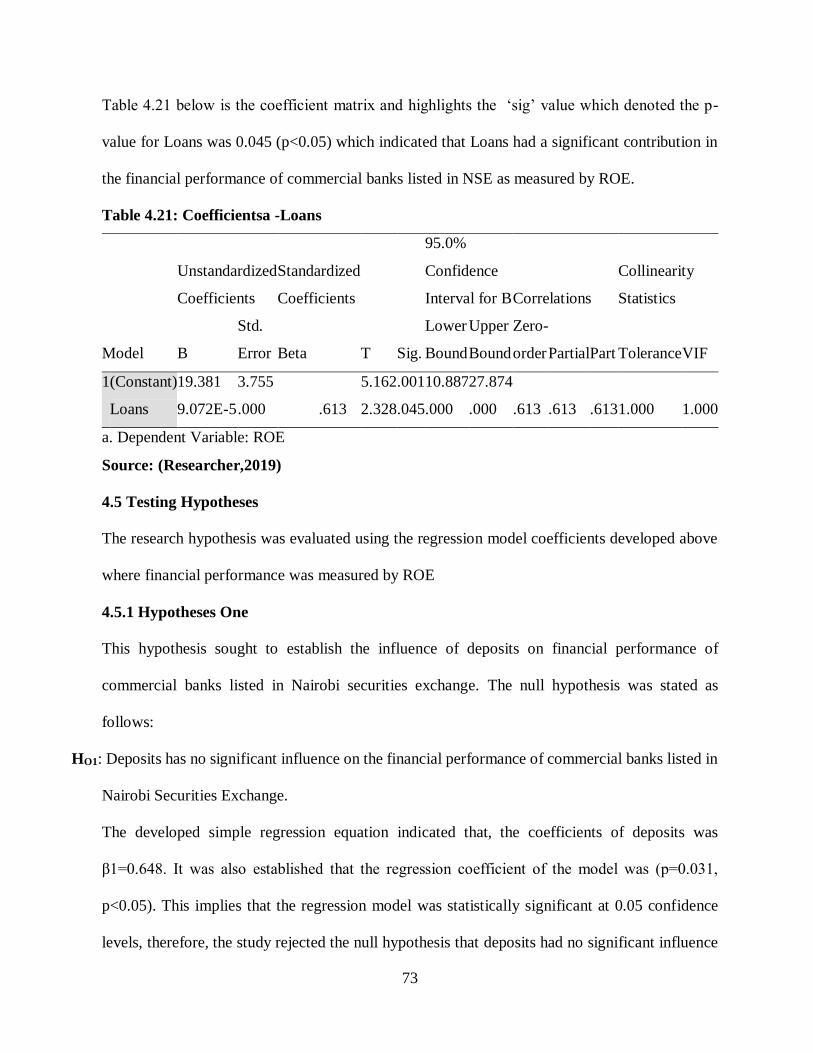
73
Table 4.21 below is the coefficient matrix and highlights the ‘sig’ value which denoted the p-
value for Loans was 0.045 (p<0.05) which indicated that Loans had a significant contribution in
the financial performance of commercial banks listed in NSE as measured by ROE.
Table 4.21: Coefficientsa -Loans
Model
Unstandardized
Coefficients
Standardized
Coefficients
T Sig.
95.0%
Confidence
Interval for B Correlations
Collinearity
Statistics
B
Std.
Error Beta
Lower
Bound
Upper
Bound
Zero-
order Partial Part Tolerance VIF
1 (Constant) 19.381 3.755 5.162 .001 10.887 27.874
Loans 9.072E-5 .000 .613 2.328 .045 .000 .000 .613 .613 .613 1.000 1.000
a. Dependent Variable: ROE
Source: (Researcher,2019)
4.5 Testing Hypotheses
The research hypothesis was evaluated using the regression model coefficients developed above
where financial performance was measured by ROE
4.5.1 Hypotheses One
This hypothesis sought to establish the influence of deposits on financial performance of
commercial banks listed in Nairobi securities exchange. The null hypothesis was stated as
follows:
HO1: Deposits has no significant influence on the financial performance of commercial banks listed in
Nairobi Securities Exchange.
The developed simple regression equation indicated that, the coefficients of deposits was
β1=0.648. It was also established that the regression coefficient of the model was (p=0.031,
p<0.05). This implies that the regression model was statistically significant at 0.05 confidence
levels, therefore, the study rejected the null hypothesis that deposits had no significant influence

74
on the financial performance of commercial banks listed in Nairobi Securities Exchange The
conclusion from the hypothesis testing showed that deposits had a positive significant effect on
the financial performance of commercial banks listed in NSE.
4.5.2 Hypotheses Two
The second null hypothesis sought to establish the influence of capital adequacy on the financial
performance of commercial banks listed in NSE and which was highlighted as follows:
HO2: Capital adequacy has no significant influence on the financial performance of commercial banks
listed in Nairobi Securities Exchange
The regression model showed that regression coefficients of capital adequacy was β2 = -0.200,
with ‘p’ values of (p=0.556, p>0.05), implying that the model was statistically insignificant at
0.05 levels. The study thus failed to reject the null hypothesis that; capital adequacy has no
significant influence of the financial performance of commercial banks listed in NSE. The study
thus upheld the alternative hypotheses. The conclusion from this hypotheses testing was that
Capital adequacy had no influence on the financial performance of commercial banks listed in
Nairobi Securities Exchange.
4.5.3 Hypotheses Three
The third hypotheses of the study sought to investigate the influence of liquidity on the financial
performance of commercial banks listed in Nairobi securities exchange. The third hypotheses
highlighted as follows:
HO3: liquidity has no significant influence on the financial performance of commercial banks listed in
Nairobi Securities Exchange
The regression model indicated that the coefficients of liquidity was β3= 0.355 while the ‘p’
values was (p=0.284, p> 0.05).The study found out that the model was statistically insignificant

75
at 0.05 levels and thus failed to reject the null hypothesis. The study thus concluded that liquidity
has statistically insignificant influence on the financial performance of commercial banks listed
in Nairobi Securities Exchange.
4.5.4 Hypotheses Four
The fourth hypothesis of the study attempted to examine the influence of loans on the financial
performance of commercial banks listed in Nairobi securities exchange. The fourth hypothesis is
highlighted as follows:
HO3: loans has no significant influence on the financial performance of commercial banks listed in
Nairobi Securities Exchange
The developed regression model indicated that, the coefficients of loans was β4= 0.613 with ‘p’
values of (p=0.045, p<0.05). The study thus established that the model was statistically significant
at 0.05 confidence levels and thus rejected the null hypothesis that loans had no significant
influence on the financial performance of commercial banks listed in Nairobi Securities Exchange
The conclusion from the hypothesis testing showed that loans had a positive significant effect on
the financial performance of commercial banks listed in NSE.

76
CHAPTER FIVE
SUMMARY, CONCLUSIONS AND RECOMMENDATIONS
5.1 Summary of Research Findings
The objective of the study was to ascertain the determinants influencing financial performance of
commercial banks listed in Nairobi securities exchange. The research was carried out by use of
secondary data of all the publicly listed commercial banks operating in Kenya from 2005 to 2017.
The period was considered long enough to bring out the influence of the predictor variables on
the predicted variables. The secondary data was obtained from annual bank supervision reports
from CBK website and annual published financial statements from publicly listed commercial
banks in Nairobi securities exchange.
The study findings revealed that the deposits for the eleven commercial banks listed banks in NSE
had a mean of kes 102, 907.73 billion. KCB bank had the highest mean value of deposits of
kes217, 667.46 billion while Housing finance had the lowest mean value of deposits of kes
21,893.84 billion. The study findings further established that the correlation coefficient between
deposits and financial performance was 0.312 which was positive and significant at 0.05 levels.
The regression model established that a unit change in deposits holdings other variables constant
resulted in 0.281 units change in financial performance.
The research findings revealed that the capital adequacy of the eleven commercial banks listed in
NSE had a mean value of 17.32. National bank had the highest mean value of 22.49 while NIC
bank had the lowest capital adequacy mean value of 15.01.From the Pearsons correlation matrix,
the study findings indicated that correlation between capital adequacy and financial performance
was statistically insignificant.The regression model developed showed that, the regression
coefficients of capital adequacy was (β2 = 0.165, p>0.05). These findings signified that the model

77
was statistically insignificant and that the variation in the values of FP cannot be explained by
variations in capital adequacy.
From descriptive statistics, the study found out that the mean liquidity value of the eleven
commercial banks listed in NSE was 36.85. National bank had the highest mean value of liquidity
of 43.8377 while Housing finance group had the lowest mean value of liquidity of 26.8223.The
findings of the study indicated that the correlation between liquidity and FP was insignificant at
0.05 confidence levels.The regression model developed showed that, the regression coefficients
of liquidity was (β3 = 0.215, p>0.05). These findings signified that the model was statistically
insignificant and that the variation in the values liquidity cannot explain the variations in financial
performance of commercial banks listed in NSE.
The descriptive statistics for loans indicated that the mean value of loan of the eleven commercial
banks listed in NSE was kes 85, 946.26 billion with KCB bank having the highest mean value of
loans of kes 185, 727.64 billion. The study findings showed that Housing group the lowest mean
value of loans of kes28, 152.35 billion. From the correlation matrix, study found out that, loans
was positively correlated with FP as indicated by the correlation coefficient of 0.666. Further the
study established that the relationship between loans and FP was significant at 0.01 confidence
level. The regression equation established, holding all the other the independent variables
constant at zero, a unit change in loans resulted in a 0.311 units change in financial performance
of commercial banks listed in NSE.
5.2 Conclusions
The first objective sought to establish the influence of deposits on financial performance of
commercial banks listed in Nairobi securities exchange. The study from descriptive statistics
indicated that KCB bank had the highest mean value of deposits. From the hypotheses testing, the
78
null hypothesis was rejected and the alternative hypothesis was accepted. The study concluded
that deposits has a significant influence the financial performances of commercial banks since
KCB bank appear to invest more in deposit mobilization than Housing finance group. The
conclusion from the study was that, there was a reward for deposit mobilization as reflected by
the variations in the mean values of deposits across the various commercial. There was also a
sustained effort by commercial banks to mobilize as much deposits as possible.
The second objective sought to investigate the influence of capital adequacy on the financial
performance of commercial banks listed in NSE. National bank had the highest mean value of
capital adequacy. From the hypotheses testing, the study failed to reject the null hypotheses. The
minimum statutory requirement for capital adequacy for commercial banks in Kenya was 10.5
per cent. The study indicated that capital adequacy requirement was made by all the commercial
banks listed in NSE and concluded that capital adequacy has no significant influence on the
financial performance of commercial banks listed in NSE.
The third objective sought to examine the influence of liquidity on the financial performance of
commercial banks listed in Nairobi securities exchange. The study indicated that National bank
had the highest mean value of liquidity while the hypotheses testing revealed that liquidity had
no significant influence on the financial performance of commercial banks listed in Nairobi
Securities Exchange. The minimum statutory liquidity requirement for commercial banks in
Kenya was 20 per cent. The study findings illustrated that the minimum statutory liquidity
requirements was met by all commercial banks listed in NSE and thus concluded liquidity has no
significant influence on the financial performance of commercial banks listed in Nairobi
Securities Exchange.

79
The fourth objective sought to determine the influence of loans on the financial performance of
commercial banks listed in Nairobi Securities Exchange. The study indicated that KCB bank had
highest mean value of loans. From the hypotheses testing, the study rejected the null hypotheses
and concluded that commercial banks strive to create more loans so as to generate more revenue.
This was illustrated by the varying mean level of loans across various banks. The study concluded
that loans influences the financial performance of commercial banks listed in Nairobi Securities
Exchange.
5.3 Recommendations
The study recommended that Management of commercial banks should embark on mobilization
of deposits since it is crucial for improvement and sustainability of financial performance.
The study also recommended that commercial banks should strive to attain and exceed optimal
capital adequacy requirements so as to protect itself against emerging unanticipated negative
economic effects presented by the external operating environment.
The study also recommended that, management of commercial banks should strive to attain the
minimum statutory liquidity requirements so as not to attract sanctions from the regulatory
agencies. These sanctions are manifested inform of penalties which are costly and thus might
impair on the overall performance.
The study further recommended that, management of commercial banks should bring into fore
strategies aimed at growing a quality loan book.
5.4 Areas of Further Research
The study sought to investigate the determinants influencing the financial performance of
commercial banks listed in NSE. However the variables used in the study was not exhaustible and
thus further studies should bring into focus other drivers of financial performance of commercial
80
banks i.e. Asset quality, management efficiencies, bank size, market concentration, number of
customers and regulatory compliance ratings.
Further research should also be extended to include the determinants of financial performance of
all the commercial banks in Kenya.
Further studies on the determinants of financial performances of SACCO’s and DTMFI’s should
also be carried out.
81
REFERENCES
Abdullah, M.N., & Jahan, N. (2014). The impact of liquidity on profitability of Bangladesh: A case study
of Chittagong stock exchange. International journal of economics and business review. (2) 10:17-
22
Adzobu, L. D., Agbloyor, E.K., & Abuagye, A. (2017). The effect of loan portfolio diversification on
banks risks and return. Evidence from emerging markets. Managerial finance. (5) 43
Akuma,J.,Doku,I.,&Awer,N.(2017). Credit Risk, Deposit and profitability of Ghanian banks.
International Journal of Economic & Finance issues. 7(5), 394-399.
Allen,F., Carletti,E.,Krahnen,Pieter,J., &Tyrell,M.(2011). Liquidity and crises. Oxford University Press.
New York.
Almasiri,A.A.,&Alamiri,A.M.(2017). The effect of capital adequacy on profitability: A comparative
study between Samba and Saab banks of Saudi Arabia. International journal for economics,
commerce and management. (5) 11:86-102
Amahalu,N.,Okoye,E.I.,Nweze,C.,Chinere,O.,&Okika,C.(2017).Effect of capital adequacy on Financial
Performance of Quoted Deposit Money Banks in Nigeria. International Conference on African
Entrepreneurship and innovation for sustainable development. Chapter 57:841-862.
Andries,A.M.(2009). Theories regarding financial intermediation and financial intermediaries: A Survey.
Fascicle of The faculty of Economics and Public Administration. (9) 2:254-261
Atavachi, B. (2013).Effect of Electronic Banking on Financial Performance of Deposit Taking
Microfinance institutions in Kenya. University of Nairobi Publication http://chss.uonbi.ac.ke.
Aymen,M. & Moussa,B.(2013). Impact of capital on financial performance of banks- The case of Tunisia.
Bank and bank systems. (8) 4:53-53

82
Badun,M.(2009).Financial Intermediation by banks and economic growth. A Review of empirical
evidence. Institute of public finance, Zagreb. (33) 2:121-152.
Barus. J. (2017).Effect of capital adequacy on the financial performance of savings and credit
Cooperative societies in Kenya. American Journal of Finance. (1) 4:2-12.
Bategeka, L.,&Okumu,L.J.(2010). Banking sector liberalization in Uganda process, results and Policy
options. Economic policy research Centre, Uganda.
Belguith,H., & Bellouma,M.(2017).The impact of loan portfolio diversification on Tunisian Banks
profitably. International journal of emerging research in management and Technology. (6) 6:35-
45.
Blancard, G.C.(2010). Incidence of bank levy and bank market power. University of Paris 1 Panthéon-
Sorbonne
Bollen, N.P.B (2007) “Mutual Fund Attributes and Investor Behaviour”, forthcoming. Journal of
Financial and Quantitative Analysis. (2) 2:01-09.
Botoe,W.(2011). The impact of liquidity of commercial banks in Liberia. University of Nairobi.
Botos,K.(2016). Money creation in the modern economy. Public finance quarterly journals. (1) 4:442-
457.
Britto,J. & Srinivasan,P.(2017). Analysis of financial performance of selected commercial banks in India.
Theoretical economics letters. Banglore. India.
Camarate,J.,&Brickmann,S.(2017) A market place without boundaries. The future of Banking.A South
African perspective. Pricewaterhousecoopers publication. Johannesburg.
Casu, B., Girardone, C., & Malyneux, P. (2016) Introduction to Banking, 2nd Ed. Pearso Education
Publishers. England.

83
Central Bank of Kenya, (2014). Bank Supervision report: Kenyan banking Sector for the period ended
December 2013.
Central Bank of Kenya, (2015). Bank Supervision report: Kenyan banking Sector for the period ended
December 2014.
Central Bank of Kenya, (2016). Bank Supervision report: Kenyan banking Sector for the period ended
December 2015.
Central Bank of Kenya, (2017). Bank Supervision report: Kenyan banking Sector for the period ended
December 2016.
Cronje, & Atahau, A.D.R. (2015). Does size affect loan portfolio structure and performance of domestic-
owned banks in Indonesia? Corporate ownership and control journal. (1) 13:389-400
Cytonn Investments Journal (2017). Kenya Listed commercial banks analysis. Consolidation and
Prudence in a challenging operating environment. Nairobi.
Demiquenes, K. (2016). The effect of liquidity on financial performance. Evidence from Turkish retail
industry. International journal of economics and finance. (8)4
Desta,T.S.(2016). Financial performance of the best African banks; Comparative analysisthrough
CAMEL Rating.Journal of Accounting and Management.(6) 1:1-20.
Dilrangi.A., Udayarathna.R.,Pathiraja. M.,Madhubhashini.P.,& Bandara.D.(2018). The effect of level of
deposits on financial performance-A study on listed commercial banks in Sri Lanka. University
of Sri Jayewardenepura. Sri Lanka.
Dinc,Y. (2017). The effect of retail loans on bank profitability. A comparative empirical analysis.
Istanbul Sabahaltin Zain University.
Edem,D.B.(2017). Liquidity management and performance of deposit money banks in Nigeria.
International journal of economics and finance management sciences. (5) 3:146-161

84
Emanue,O. & Amahalu,N.(2017). Effect of capital adequacy on financial performance of quoted money
banks in Nigeria. (1) 1.
Eyigege, A.I. (2018). The influence of financial leverage, customer deposits and capital adequacy on the
financial sustainability of some selected Nigerian Micro finance banks. Global journals.
Gakpetor,E.D, Akomeaoh,E.,Musah,A., & Chamler,R. (2018). The impact of liquidity on performance
of commercial banks in Ghana. Academic journal of economic studies. (4) 4:78-90
Gekara,M., &Osano,K.L(2018). Effect of government regulation on profitability of commercial banks in
Kenya. The strategic journal of business and change management. (5) 1:916-945
Gorn,J.A.(2008). German banks in the global economy. Global pressures and public sector banking.
Pitzer college publication Journal. (1) 9:1-104.
Gubbins,P.(2015). An overview of development and trends in Kenya’s retail financial landscape. Fsd,
Kenya. http://fsdkenya.org/an-overview-of-developmens-and-trends-in-kenyas-
Hayes, A.F. (2013) Introduction to Mediation, Moderation, and Conditional Process Analysis: A
Regression-Based Approach. Guilford Press. New York
Javarid,M.E. (2016). Bank specific macroeconomic determinants of bank profitability. Journal of
management information. (3) 2.
Kalanidis, D. (2016). The impact of liquidity on bank profitability: Post crisis evidence from European
banks. International Hellenic University. Thessaloniki-Greece.
Kana,K.M.(2017). Determinants of bank profitability. An empirical study of South African banks.
University of South Africa.
Karnik,M.(2016). India’s banking sector in 5 charts. World Economic Forum. 1st ed. Quartz publication.
India.

85
Kawshla, H.& Panditharathna, K. (2017). The factors affecting on bank profitability in Sri-lankan
domestic commercial banks. (7) 2.
Kemboi, J. K. & Tarus, D. K. (2012). Macroeconomic Determinants of Stock MarketDevelopment in
Emerging Markets: Evidence from Kenya. Research Journal of Financeand Accounting. (3) 5:57-
68.
Kiiru,M.J. (2008). The effects of funding structure on the Financial Performance of Deposit Taking Micro
Finance institutions in Kenya. University of Nairobi Publication.
Kirimi, E. (2015). The effect of lending interest rates on financial Performance of commercial banks in
Kenya. University of Nairobi Publication.
Klazema, A. (2014). Introductory statistics course. Udemys Inc
Mahmud, A., & Datta, C.K. (2018). Impact of capital adequacy on profitability under Basel II accord:
Evidence from commercial banks in Bangladesh. European journal of business and management.
(10)8:48-58
Majakusi. J. (2012). Effect of liquidity management on the financial performance of commercial banks
in Kenya. University of Nairobi.
Marozwa, G. (2015). Liquidity and bank performance. International business and economics research
journal. (14) 3:452-462
Mashamba, T. (2018). The effect of Basel III liquidity regulation on banks profitability. Journal of
governance and regulation. (7) 2:45-46.
McLeay,M.,Radia,A.,&Thomas,R.(2014). Money creation in the modern economy. Bank of England
Quarterly Bulletin.
Mohajan, H.K. (2017). Two criteria for good measurement in research. Validity and Reliability. Annals
of Spiru Haret University. (17) 3:58-82
86
Mugenda,A.,&Mugenda,M.(2013). Research Methods: Quantitative and Qualitative Approaches, ACTS
Publishers, Nairobi.
Muiruri,J.K.&Macharia,N.J.(2016). Determinants of profitability of commercial banks in
Kenya.University of Nairobi Publication.
Murerwa,C.B.(2015). Determinants of banks financial performance in developing economies: Evidence
from Kenya Commercial banks. United States International University journal.
Mutua,R. (2013).Effects of mobile banking on the financial performance of commercial banks in
Kenya,University of Nairobi Publication.
Mwangangi,K.A.(2013). Economic Performance Indicators and stock returns at the Nairobi Securities
Exchange, University of Nairobi Press.
Nairobi Securities Exchange bulletin 2017. Board Diversity and inclusion.
Ngari,J. M. (2014). Effects of financial Innovations on the financial performance of commercialBanks in
Kenya. University of Nairobi press.
Njeri,M.N. (2013).The effects of liquidity on the financial performance of deposit taking micro finance
institutions in Kenya. University of Nairobi press.
Njeri,M.R.(2010). Impact of deposit taking on financial performance of microfinance institutionsin
Kenya. University of Nairobi journal.
Njeru,M.D., Njeru,A.,Member,F.,&Tirimba,O.I.(2015). Effect of loan repayment of
financialPerformance of deposit taking SACCOs in Mount Kenya region. International journalof
innovation and applied studies. (10) 4:1238-1244.
Nzioki,S.(2009). The impact of capital adequacy on the financial performance of commercial banks
quoted at the Nairobi stock exchange. University of Nairobi Press.

87
Okun,D.M. (2012). The effect of level of Deposits of Financial Performance of CommercialBanks in
Kenya.University of Nairobi Publication.
Okungu,A.E.O.,Mule,R.K.,Nyongesa,D.,Aila.F.O.,Ogut.,A.S,Onchonga,D.M.,…Muchoki,M.M(2014).
Effect of commercial banks loans on financial performance of savings and creditCo-operative
societies in Kisumu, Kenya. Greener Journal of Economics and Accountancy.(3) 1:009-019.
Olagunju,A., Adeyanju,O.D, & Olabode,O.S.(2011). Liquidity management and commercial banks
profitability in Nigeria. Research Journal of Finance and Accounting. (2) 7/8:24-38.
Olokoyo, F.O., Adetiloye, K.A,.& Ikpefan, O.A (2016). Banks intermediation role and industrialoutput
in developing countries. Medwell journals. (11) 24:5838-5844.
Ongore,V.O.,& Kusa,G.B.(2013). Determinants of financial performance of commercial banksin Kenya.
International Journal of Economics and Finance issues. (3)1:237-252.
Randall,W.L (2014).From the state theory of money to modern money theory: An alternative toeconomic
orthodoxy. Levy Economics Institute of Bard College. Working Paper no.792.
Regngasamy.D. (2014). Impact of loan deposit ratio (LDR) on profitability. Panel evidence from
commercial banks in Malaysia. Third International conference on global business and social
sciences.G14 Mumbai conference.1 (1):19-21
Rodriquez, R.C. (2014).Determinants of commercial banks profitability in Mexico. Econo quantum
journal. (12) 1:120-121
Saunders, M., Lewis, P. & Thornhill, A. (2012) “Research Methods for Business Students” 6th edition,
Pearson Education Limited.
Song’e, H.K.(2015). The effect of liquidity management on the financial performance of DepositTaking
Savings and Credit Cooperative Societies in Nairobi County. University
ofNairobihttp://erepository.uonbi.ac.ke.
88
Stefancic,M.(2017). Troubles of the Italian banking system and the smothered hopes of Europe.European
research institute on cooperatives and social enterprise. (3) 2:99-116.
Stovrag, A. (2017). Capital requirements and bank profitability. A comparison between the large Swedish
banks and niche banks. International business school. 64:65
Sune, K. (2014). The accuracy of the Hausman Test in Panel Data: A Monte Carlo Study. Orebro
University.
Tabak, B. M., & Cajueiro, D. O. (2011).The effects of loan portfolio concentration on Brazilian banks
return and risks. Journal of banking and Finance. (11) 35:3065-3076.
Thiongo, P.K., Matata, K.,&Simiyu,A.(2016). Effect of Loan Portfolio Growth on Financial Performance
of Commercial Banks in Kenya. Imperial Journal of Interdisciplinary Research (2)11:2113-2141.
Trujillo-Ponce, A. (2013). What determines the profitability of banks? Evidence from Spain.
Tuyishime,R., Memba,F., & Mbera,Z.(2015). The effects of deposit mobilization on
FinancialPerformance of Commercial Banks in Rwanda; a case of equity bank Rwanda
limited.International journal for small business and entrepreneurship. (3) 6:44-71.
Umoru. D., &Osemwegie.J. (2016). Capital adequacy and financial performance of banks inNigeria;
Empirical evidence based on Fgls estimator. European Scientific Journal. (12)25:295-305.
Vaita,B.N.(2017). Effect of liquidity on financial performance of tier one listed commercial banks in
Kenya. University of Nairobi.
Vianney, K.J.M. (2011). The relationship between regulation and financial performance of Rwandan
Commercial banks. University of Nairobi.
Wanzenried, G., & Dietrich, A. (2009). What determines the profitability of commercial banks? New
evidence from Switzerland.

89
Weber, A. (2017). Bank consolidation, Efficiency and Profitability in Italy. IMF Working Paper. (17)
175:1-23.
Yigermal,M.E.(2017). The determinants of private commercial banks profitability: In the case of selected
Ethiopian private banks. International and organization. Journal of economics behavior. (1) 5:25-
35.

90
APPENDICES
APPENDIX I: DATA COLLECTION INSTRUMENT
Year
Deposits
-Deposits
from
customers
Capital Adequacy
-Core Capital/ Total
Risk Weighted Assets
Liquidity
-liquidity ratio /
statutory
liquidity ratio
Loans
-loans and
advances
tocustomers
Return on
Equity
PBT/Equity
2007
2008
2009
2010
2011
2012
2013
2014
2015
2016
2017
Totals

91
APPENDIX II: DEPOSITS
Bank
Name
STATISTICS
2007 2008 2009 2010 2011 2012 2013 2014 2015 2016 2017 Mean SD
BBK 109,097 126,562 125,869 123,826 124,207 137,915 151,122 164,779 165,359 178,448 189,305 136,491.83 32,008.64
KCB 92,686 150,645 143,602 173,995 210,174 223,493 237,213 276,750 347,702 386,611 445,398 217,667.46 119,743.14
EQB 31,536 48,977 65,825 125,492 121,774 140,286 158,527 202,485 236,610 277,275 298,703 133,297.90 98,134.24
COOp 56,198 67,159 92,529 129,226 142,705 162,267 174,776 216,174 263,709 259,472 285,990 149,364.75 86,474.65
DTB 29,347 45,853 54,886 68,605 59,772 72,505 84,672 101,594 126,229 169,600 209,254 81,008.84 58,206.39
I&M 18,360 23,786 44,759 68,208 56,944 65,640 74,494 86,621 103,741 103,741 134,247 62,128.82 38,625.52
SCB 73,841 76,896 86,774 100,504 122,323 140,525 154,720 154,067 172,036 186,598 226,051 124,530.56 52,491.98
NIC 24,806 35,239 39,514 48,492 66,293 77,466 84,236 92,791 105,194 104,160 142,006 66,057.71 38,711.64
HF 8,777 10,064 12,219 15,943 18,672 22,968 26,589 36,310 41,888 38,156 36,981 21,893.84 12,777.57
NBK 34,721 34,278 41,995 47,805 56,728 55,191 77,993 104,734 110,622 96,967 100,165 62,696.04 31,323.07
SBK 20,098 61,975 61,474 71,425 74,335 75,633 95,708 96,830 108,130 121,989 178,696 76,847.33 45,809.28
Avera
ge
45,406.09 61,948.55 69,949.64 88,501.91 95,811.55 106,717.18 120,004.55
139,375.
91
161,929.
09
174,819.
62
204,254
.18
SD 33,044.55 42,833.76 39,160.54 46,204.77 53,926.92 58,578.20 60,063.23
70,446.4
3
88,531.1
9
100,135.
84
110,778
.69

92
APPENDIX III: CORE CAPITAL TO TOTAL RISK WEIGHTED ASSETS
Bank
Name
STATISTICS
2007 2008 2009 2010 2011 2012 2013 2014 2015 2016 2017 Mean SD
BBK 13.03 15.02 19.15 26.58 24.10 22.70 16.59 18.45 15.80 15.72 15.91 17.574 4.461
KCB 13.61 15.45 14.82 23.12 19.10 21.30 18.68 17.06 14.11 16.85 14.87 17.162 2.856
EQB 45.68 29.23 23.63 21.95 15.36 19.90 18.55 15.17 14.64 14.39 15.82 20.566 8.758
COOp 14.22 22.01 20.33 16.16 16.04 20.30 15.66 14.60 14.52 16.25 16.47 16.248 3.015
DTB 19.10 15.62 15.38 15.35 14.21 17.70 17.66 16.82 14.84 16.22 17.32 16.048 2.014
I&M 14.44 10.95 16.99 18.90 18.12 17.00 15.07 15.77 17.05 16.63 17.17 15.648 2.367
SCB 16.29 15.74 14.12 13.91 12.31 16.30 17.49 15.81 17.53 17.51 15.62 15.801 1.733
NIC 15.84 14.21 14.59 14.64 14.98 15.60 14.82 14.37 14.52 17.22 16.69 15.012 1.069
HF 13.10 40.52 31.08 24.37 21.42 19.10 13.80 11.12 15.37 15.73 15.49 18.821 8.713
NBK 37.22 38.58 40.85 35.49 27.93 27.30 22.75 12.86 13.00 11.36 3.98 22.492 12.81
7
SBK 15.56 11.41 10.26 10.41 12.59 20.50 18.20 18.44 15.95 16.07 15.80 15.13 3.143
Average 19.826 20.795 20.109 20.08 17.833 19.791 17.206 15.497 15.212 15.814 15.013
SD 10.994 10.586 8.873 7.15 4.943 3.321 2.462 2.237 1.311 1.7 3.733

93
APPENDIX IV: LIQUIDITY
Bank
Name
YEARS STATISTICS
2007 2008 2009 2010 2011 2012 2013 2014 2015 2016 2017 Mean SD
BBK 39.91 46.16 40.55 39.46 34.70 34.21 37.71 44.13 33.01 32.03 37.77 38.52 4.22
KCB 38.68 45.20 48.53 36.53 34.41 36.07 33.11 31.75 30.65 29.08 28.12 36.4 6.4
EQB 43.31 38.79 36.21 40.83 35.28 37.85 28.80 25.71 27.01 40.63 44.99 37.3 6.71
COOp 35.93 37.51 33.49 34.10 37.57 23.05 32.60 35.00 37.10 33.70 33.80 34.67 4.21
DTB 33.45 37.36 36.90 30.51 29.58 30.35 31.00 32.84 33.45 44.45 45.29 35.26 5.05
I&M 33.11 41.60 38.96 36.00 35.05 39.43 22.18 35.02 32.11 36.10 34.11 34.73 4.73
SCB 41.20 38.97 48.55 42.16 34.22 39.12 37.57 43.03 46.87 50.12 52.44 41.96 5.96
NIC 31.37 35.56 33.43 30.87 33.66 31.38 28.53 30.23 28.98 32.27 43.37 33.86 4.84
HF 34.46 37.54 26.12 33.92 31.21 27.14 21.63 21.89 20.29 15.64 15.07 26.82 7.41
NBK 42.71 47.71 49.07 45.57 44.04 41.68 55.89 44.32 41.49 42.10 44.38 43.84 5.38
SBK 35.27 38.14 46.41 42.21 38.45 40.35 36.44 53.32 45.90 39.23 44.45 41.96 4.88
Average 37.22 40.41 39.84 37.47 35.29 34.6 33.22 36.11 34.26 35.94 38.53
SD 4.13 4.12 7.57 4.94 3.82 5.98 9.31 9.24 8.06 9.15 10.37
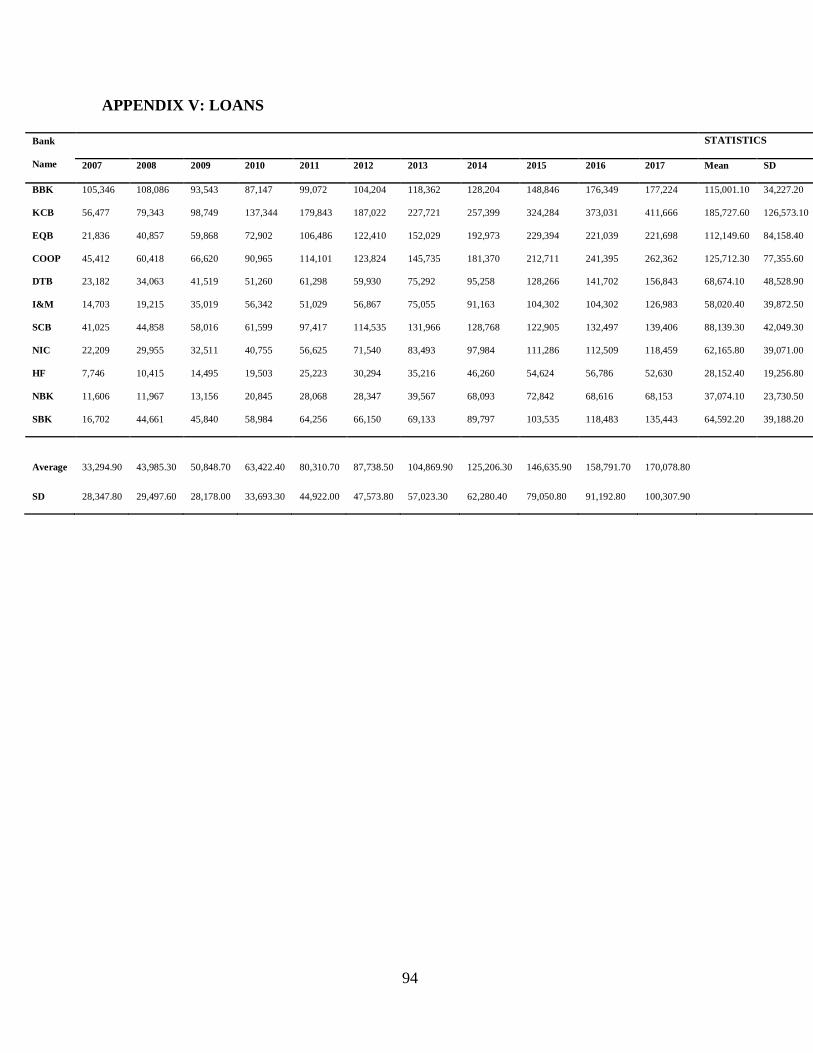
94
APPENDIX V: LOANS
Bank
Name
STATISTICS
2007 2008 2009 2010 2011 2012 2013 2014 2015 2016 2017 Mean SD
BBK 105,346 108,086 93,543 87,147 99,072 104,204 118,362 128,204 148,846 176,349 177,224 115,001.10 34,227.20
KCB 56,477 79,343 98,749 137,344 179,843 187,022 227,721 257,399 324,284 373,031 411,666 185,727.60 126,573.10
EQB 21,836 40,857 59,868 72,902 106,486 122,410 152,029 192,973 229,394 221,039 221,698 112,149.60 84,158.40
COOP 45,412 60,418 66,620 90,965 114,101 123,824 145,735 181,370 212,711 241,395 262,362 125,712.30 77,355.60
DTB 23,182 34,063 41,519 51,260 61,298 59,930 75,292 95,258 128,266 141,702 156,843 68,674.10 48,528.90
I&M 14,703 19,215 35,019 56,342 51,029 56,867 75,055 91,163 104,302 104,302 126,983 58,020.40 39,872.50
SCB 41,025 44,858 58,016 61,599 97,417 114,535 131,966 128,768 122,905 132,497 139,406 88,139.30 42,049.30
NIC 22,209 29,955 32,511 40,755 56,625 71,540 83,493 97,984 111,286 112,509 118,459 62,165.80 39,071.00
HF 7,746 10,415 14,495 19,503 25,223 30,294 35,216 46,260 54,624 56,786 52,630 28,152.40 19,256.80
NBK 11,606 11,967 13,156 20,845 28,068 28,347 39,567 68,093 72,842 68,616 68,153 37,074.10 23,730.50
SBK 16,702 44,661 45,840 58,984 64,256 66,150 69,133 89,797 103,535 118,483 135,443 64,592.20 39,188.20
Average 33,294.90 43,985.30 50,848.70 63,422.40 80,310.70 87,738.50 104,869.90 125,206.30 146,635.90 158,791.70 170,078.80
SD 28,347.80 29,497.60 28,178.00 33,693.30 44,922.00 47,573.80 57,023.30 62,280.40 79,050.80 91,192.80 100,307.90

95
APPENDIX VI: ROE
Bank
name
STATISTICS
2007 2008 2009 2010 2011 2012 2013 2014 2015 2016 2017 Mean SD
BBK 40.30 39.20 25.20 34.25 41.11 44.00 36.80 32.30 30.40 24.80 23.13 35.148 7.459
KCB 30.07 26.89 28.81 28.22 31.18 29.80 28.40 31.00 29.00 35.20 30.91 28.864 3.629
EQB 15.91 24.37 24.11 32.90 34.54 37.60 36.00 49.40 47.40 43.50 37.30 35.734 10.33
COOp 33.61 23.90 18.42 27.52 34.53 34.18 31.00 29.50 28.50 30.00 24.21 27.376 5.44
DTB 18.61 24.50 19.40 35.64 31.34 33.10 30.17 24.50 23.50 24.40 19.10 25.848 5.376
I&M 33.47 31.20 21.70 23.15 32.17 28.50 29.50 35.50 32.00 27.60 21.50 28.737 4.822
SCB 45.27 41.30 39.12 37.94 40.11 37.60 37.25 35.40 21.90 29.10 21.30 35.428 7.129
NIC 22.16 26.67 22.48 31.23 33.95 28.65 29.68 26.92 23.74 19.60 19.60 24.734 5.357
HF 8.95 5.33 8.62 13.12 20.69 17.50 21.40 20.50 19.10 14.80 3.90 14.605 7.268
NBK 32.41 28.94 27.31 27.17 23.37 11.23 15.45 19.20 (15.40) 15.00 10.50 18.883 12.491
SBK 27.59 18.40 14.70 20.96 30.82 26.13 31.30 27.70 25.10 22.90 16.90 23.593 5.127
Avrage 28.032 26.425 22.666 28.373 32.165 29.71 29.545 30.17 24.109 26.082 20.745
SD 10.799 9.689 7.93 7.243 6.083 9.313 6.577 8.331 15.1 8.485 8.959

96
APPENDIX VII: LIST OF COMMERCIAL BANKS LISTED IN NSE
S/N Name of Bank
1. Barclays Bank Ltd BBK
2. KCB Bank Ltd KCB
3. Equity Bank (K) Ltd EQB
4. Cooperative Bank of Kenya Ltd COOp
5. Diamond Trust Bank Ltd DTB
6. I&M Holdings Ltd I&M
7. Stan Chart Bank Ltd SCB
8. NIC Bank Ltd NIC
9. Housing Finance Group HF
10. National Bank of Kenya Ltd NBK
11. CFC Stanbic Holdings Ltd SBK

97
APPENDIX VIII: RESEARCH PERMIT FROM NACOSTI