the determinants of long-term debt issuance by european
TRANSCRIPT

THE DETERMINANTS OF LONG-TERM DEBT ISSUANCE BY EUROPEAN BANKS: EVIDENCE OF TWO CRISES
Adrian van Rixtel, Luna Romo González and Jing Yang
Documentos de Trabajo N.º 1621
2016

THE DETERMINANTS OF LONG-TERM DEBT ISSUANCE BY EUROPEAN BANKS:
EVIDENCE OF TWO CRISES

THE DETERMINANTS OF LONG-TERM DEBT ISSUANCE BY
EUROPEAN BANKS: EVIDENCE OF TWO CRISES (*)
Adrian van Rixtel and Luna Romo González (**)
BANCO DE ESPAÑA
Jing Yang (**)
BANK OF CANADA
(*) Work on this paper began when the authors were at the Monetary and Economic Department, Bank for InternationalSettlements (BIS), Centralbahnplatz 2, 4002 Basel, Switzerland. (**) Adrian van Rixtel ([email protected]) and Luna Romo González ([email protected]) are in the InternationalFinancial Markets Division, Associate Directorate General International Affairs, Banco de España. Jing Yang ([email protected]) is in the Financial Markets Department, Bank of Canada. We are very grateful to Michela Scatigna andJoerg Urban for excellent data assistance. We would like to thank Leonardo Gambacorta, Emanuel Kohlscheen, ChristianUpper, an anonymous referee and participants in seminars at the BIS and Banco de España and at the XXIV FinanceForum, CUNEF, Madrid, 7-8 July 2016 for helpful comments. All remaining errors are ours. The views expressed in thispaper are the authors’ and do not necessarily reflect those of the Banco de España, Bank of Canada or BIS.
Documentos de Trabajo. N.º 1621
2016

The Working Paper Series seeks to disseminate original research in economics and fi nance. All papers have been anonymously refereed. By publishing these papers, the Banco de España aims to contribute to economic analysis and, in particular, to knowledge of the Spanish economy and its international environment.
The opinions and analyses in the Working Paper Series are the responsibility of the authors and, therefore, do not necessarily coincide with those of the Banco de España or the Eurosystem.
The Banco de España disseminates its main reports and most of its publications via the Internet at the following website: http://www.bde.es.
Reproduction for educational and non-commercial purposes is permitted provided that the source is acknowledged.
© BANCO DE ESPAÑA, Madrid, 2016
ISSN: 1579-8666 (on line)

Abstract
This paper is one of the first to investigate the determinants of bond issuance by European banks.
We use a unique database of around 50,000 bonds issued by 63 banks from 14 European
countries to test explicitly a broad set of hypotheses on the drivers of bond issuance. The sample
covers the two major financial crises that caused severe dislocations in bank funding structures,
i.e. the global financial crisis of 2008-2009 and the euro area financial crisis of 2010-2012. Our
findings suggest that “market timing” (low interest rates) drove issuance before but not during the
crisis, when access to funding became more important than its cost. Moreover, during the crisis
years, country-risk characteristics became drivers of bond issuance, while for banks from the
euro area periphery central bank liquidity substituted for unsecured long-term debt. We also show
that heightened financial market tensions were detrimental to bond issuance, and more strongly
so during crisis episodes. We find evidence of “leverage targeting” by means of the issuance of
long-term debt during the crisis years. The positive and significant coefficient for the capital ratio
supports the “risk absorption” hypothesis, suggesting that larger capital buffers enhanced the
risk-bearing capacity of banks and allowed them to issue more debt. Moreover, banks with deposit
supply constraints and relatively large loan portfolios issued more bonds, both before and after the
crisis years. We find, too, that higher rated banks were more likely to issue bonds, also during the
crisis period. Stronger banks issued unsecured debt in particular, while weaker banks resorted more
to issuance of covered bonds. Overall, our results suggest that stronger banks – including those
from peripheral countries – maintained better access to longer-term funding markets, even during
crisis periods.
Keywords: bank funding, bond issuance, banking crisis, Europe.
JEL Classification: G21, G32, E44, E58, F3.

Resumen
Este documento es uno de los primeros en investigar los determinantes en la emisión de bonos
por parte de las entidades bancarias europeas. Utilizamos una base de datos única de en torno a
50.000 bonos emitidos por 63 bancos de 14 países europeos para comprobar explícitamente una
serie de hipótesis sobre los determinantes de la emisión de bonos. La muestra incluye las dos
grandes crisis financieras que causaron importantes trastornos en las estructuras financieras
bancarias, esto es, la crisis financiera mundial de 2008 y 2009 y la crisis financiera de la zona del
euro de 2010 a 2012. Nuestros resultados sugieren que el market timing (bajos tipos de interés)
explicó la emisión antes, pero no durante la crisis, ya que durante esta el acceso a la financiación
se volvió más importante que su coste. Además, durante la crisis, las características propias de
cada nacionalidad fueron un destacado determinante de la emisión de bonos, mientras que, para
los bancos de la periferia de la zona del euro, la liquidez del banco central reemplazó la emisión
de deuda a largo plazo no asegurada. También probamos que una mayor tensión en los mercados
financieros afectó negativamente a la emisión de bonos, particularmente durante los episodios de
crisis. Encontramos pruebas de leverage targeting por medio de la emisión de deuda a largo plazo
durante los años de crisis. El coeficiente positivo y significativo del coeficiente de la ratio de capital
apoya la hipótesis de risk absortion, indicando que los buffers de capital más altos mejoraron la
capacidad de soportar el riesgo de los bancos, permitiéndoles emitir más deuda. Además, los
bancos con más restricciones en la oferta de depósitos y carteras de préstamos relativamente
grandes emitieron más bonos, tanto antes como después de los años de crisis. También concluimos
que los bancos con mejor calificación crediticia tenían mayor probabilidad de emitir bonos, también
durante los períodos de crisis. Los bancos más fuertes emitieron, en particular, deuda no asegurada,
mientras que los más débiles recurrieron en mayor medida a la emisión de bonos garantizados. En
general, nuestros resultados sugieren que los bancos más fuertes —incluyendo los de los países
periféricos— mantuvieron un mejor acceso a los mercados de financiación a largo plazo, incluso
durante los años de crisis.
Palabras clave: financiación bancaria, emisión de bonos, crisis bancaria, Europa.
Códigos JEL: G21, G32, E44, E58, F3.
BANCO DE ESPAÑA 7 DOCUMENTO DE TRABAJO N.º 1621
1 Introduction1
Wholesale debt is one of the main funding sources of banks, in addition to retail deposits, equity and central bank
liquidity. In recent years, the analysis of developments in banks’ wholesale debt funding structures has gained
considerable interest in the context of the 2008-2009 global financial crisis. The crisis triggered a large body of
applied research on the relation between wholesale debt markets and bank leverage and the impact of leverage on
bank performance and risk (Adrian and Shin, 2010a; Demirguç-Kunt and Huizinga, 2010; Cornett et al., 2011;
Beltratti and Stulz, 2012). The focus has been on short-term wholesale funding in particular, given the important role
of repo and unsecured interbank markets first in the levering up of banks’ balance sheets and second in the
propagation and intensification of the crisis (Adrian and Shin, 2010b; Kalemli-Ozcan et al., 2012). In contrast, long-
term wholesale debt funding, such as banks’ issuance of medium-term notes (MTN) and bonds, has remained
largely outside the scope of analysis.
At the same time, long-term debt is an important source of funding. For example, the share of debt
securities (excluding securitisations) with a maturity over one year issued by banks (MFIs) as a percentage of total
assets grew strongly in several euro area countries during 2003-2013. Especially banks in Italy and the Netherlands
increased their dependence on long-term debt funding during this period (Chart 1). Also banks in Spain expanded
their recourse to long-term debt financing from just 5% at end-June 2003 to 12% at end-August 2007, after which it
fell to 9% at end-June 2013. At the same time, banks in France maintained a relative stable share of around 10%
during the same period, while that of banks in Germany declined sharply from 22% to 15%. The share of total assets
funded through long-term debt securities issued by banks in the UK moved between 6% and 8% during the same
period.
Despite the importance of long-term debt funding, the determinants of bond issuance by banks have
remained largely unexplored. These drivers have been analysed in only a handful of studies, which moreover focused
only on selected instruments, such as for subordinated debt issuance by US banks (Covitz et al., 2004; Covitz and
Harrison, 2004), covered bond and securitisation issuance (Carbó-Valverde et al., 2011) and debt securities
issuance by European banks (Camba-Mendez et al., 2012). Hence, at this juncture, there is almost no empirical
evidence available on the significance of bank-specific and macro-economic and financial market factors in shaping
the debt issuance decision of banks.
This is in sharp contrast to the elaborate investigation of the drivers of debt issuance by non-financial firms
in the corporate finance literature. Theoretical investigations have yielded important determinants of the size and
composition of corporate debt financing, such as agency costs (Jensen and Meckling, 1976; Myers, 1977),
asymmetric information (Flannery, 1986; Diamond, 1991a), liquidity risk (Diamond, 1991b) and tax benefits of debt
(Kane et al., 1985). Many empirical studies have proposed firm-specific variables to test these theories for various
dimensions of debt securities issuance. These include the choice of maturity structure (Barclay and Smith, 1995a;
Guedes and Opler, 1996; Stohs and Mauer, 1996; Baker et al., 2003; Custódio et al., 2013), secured versus
unsecured debt issuance (Berkovitch and Kim, 1990; Barclay and Smith, 1995b) and public versus private issuance
(Krishnaswami et al., 1999; Gomes and Philips, 2012). In addition to these firm-specific characteristics, the scope of
analysis has been broadened to include overall market conditions and macro-economic developments as well,
(Korajczyk and Levy, 2003; Erel et al., 2012). Investigations have concentrated on the phenomena of market timing
and “hot” versus “cold” markets in driving corporate bond issuance (Marsh, 1982; Baker and Wurgler, 2002; Doukas
et al., 2011). These theoretical and empirical advances in the corporate finance literature may offer important
1. This paper is a modified version of A. van Rixtel, L. Romo González and J. Yang (2015), “The determinants of long-term debt issuance by European banks: Evidence of two crises”, BIS Working Papers No.513.

BANCO DE ESPAÑA 8 DOCUMENTO DE TRABAJO N.º 1621
suggestions for the analysis of the determinants of debt issuance by banks. In fact, recent empirical work on the
drivers of bank leverage has showed that standard corporate finance determinants of non-financial firms’ capital
structure also apply to banks (Gropp and Heider, 2010).
The void in empirical evidence on banks’ debt financing has led us to take up the gauntlet and investigate
the specific determinants of long-term debt issuance by 63 banks from 14 European countries. We concentrate on
long-term debt, i.e. medium-term notes (MTNs)2 and bonds, and exclude banks’ recourse to short-term wholesale
debt markets. This is also motivated by severe data-limitations on short-term debt securities issuance at the
individual bank level. We follow the trend in the corporate finance literature and include both firm-specific
characteristics and macro-economic and financial market indicators as explanatory variables. Moreover, our sample
period covers the two major financial crises that caused severe dislocations in banks’ funding structures, i.e. the
global financial crisis of 2008-2009 and the euro area financial crisis of 2010-2012 (Van Rixtel and Gasperini, 2013).
With respect to the former crisis, important maturity and currency mismatches between banks’ asset and funding
structures turned out to be unsustainable and were one of its major triggers. These mismatches were pronounced
both at the individual bank and national banking system levels, suggesting that both bank-specific characteristics on
the one hand and overall macro-economic and financial market conditions on the other played a role. In the case of
the latter crisis, sovereign tensions spilled over to bank funding dislocations, with also important differences between
individual banks and between specific countries. We shall compare the determinants of bond issuance during these
crisis episodes with those during the non-crisis years. Finally, we analyse the issuance of secured versus unsecured
debt by European banks. The former includes covered bonds and government guaranteed debt, which became key
sources of bank funding, especially during the crises episodes.
We concentrate on explaining bank-specific issuance, which allows us to exploit the richness of our
individual bond issue data. These data are from Dealogic and have been thoroughly cleaned for structural changes
at the 63 banks in our sample, such as mergers and acquisitions and attributing issuance to “dead” banks. Data on
bank-specific characteristics are from Bankscope and SNL.3
Our main conclusions are as follows. We find that “market timing” played a role in the issuance decision
prior to the crisis. Banks were more likely to issue when interest rates were low.4 This result is in line with recent
empirical evidence from the corporate finance literature on the drivers of bond issuance by non-financial firms.
However, “market timing” was no longer relevant during the crisis years, when accessibility to longer-term funding
became more important for European banks than its cost. We also show that heightened financial market tensions,
especially higher stock market volatility, were detrimental to bond issuance. Moreover, country-risk characteristics
became additional drivers of bond issuance during the crisis periods, suggested by the significant and negative sign
for the sovereign CDS spread. Further analysis showed that this result only applied to unsecured issuance,
suggesting that increasing sovereign tensions limited access of banks to unsecured wholesale funding markets. In
contrast, sovereign CDS spreads did neither affect secured issuance of euro area banks nor total issuance by
European banks headquartered outside the euro area. Moreover, when we exclude government guaranteed bonds
and bonds retained as collateral for central bank liquidity operations, the sovereign CDS spread was no longer
significant as well. In fact, this “public-sector cleaned” issuance can be explained almost completely by bank-specific
characteristics.
We find strongly significant coefficients for the bank-specific variables, with signs as expected. The positive
and significant sign for growth of total assets for the crisis period supports “leverage” targeting. Moreover, banks
with deposit supply constraints and relatively large loan portfolios issued more long-term debt. The positive and
significant coefficient for the capital ratio supports the “risk absorption” hypothesis, suggesting that larger capital
2. MTNs are debt securities which are offered continuously under an issuance programme, with a range of different yields and maturities of up to thirty years available to cater to the specific needs of individual investors. 3. In Van Rixtel et al. (2015), we also conducted an aggregate analysis at the individual country level, which we presented in Appendix D. 4. We also tested the term spread, which was not significant throughout the various specifications.

BANCO DE ESPAÑA 9 DOCUMENTO DE TRABAJO N.º 1621
buffers expanded banks’ risk-bearing capacity, and hence better capitalised banks were able to issue more long-
term debt.
We also find that higher rated banks were more likely to issue bonds, both before and during the crisis
period. The latter two results are especially important, as they suggest that financially stronger banks had better
access to longer-term funding markets during both the global financial crisis of 2008-2009 and the euro area
financial crisis of 2010-2012. Hence, even though worse country-risk characteristics were detrimental to issuance,
individual bank performance mitigated the negative impact of bank nationality on access to wholesale funding. Our
results pass a large number of robustness tests, including estimations without government guaranteed and retained
issuance. They also hold when we include bond redemptions as an additional explanatory variable, which turns out
to be highly significant, supporting the debt “roll-over” hypothesis. Also the inclusion of the market-to-book ratio as
an additional explanatory variable does not affect our results. Moreover, the Heckman test does not suggest that our
results suffer from selection bias. They also pass further robustness tests for the possible relevance of banks’
issuance of contingent convertible capital instruments (CoCos), outliers in ratings and endogeneity concerns.
The remainder of this paper is organised as follows. Section 2 provides a brief overview of the literature on
the determinants of banks’ debt issuance. Section 3 provides an overview of the hypotheses (3.1) and discusses the
empirical methodology (3.2). Section 4 shows our data, including the sample of banks (4.1) and the dependent (4.2)
and explanatory variables (4.3). Section 5 concentrates on the bank-specific estimations, first for overall issuance
(5.1), followed by those for secured issuance (5.2) and for country groupings (core and peripheral euro area
countries and other European countries) (5.3). Robustness tests are conducted in section 5.4. Finally, section 6
summarizes and concludes.
BANCO DE ESPAÑA 10 DOCUMENTO DE TRABAJO N.º 1621
2 Literature review
2.1 Bank-specific determinants of bank’s debt issuance
Theoretical investigations of debt issuance by banks are often blurred by the inclusion of deposits, which are usually
treated as another form of debt (Gorton and Winton, 2003; Allen et al., 2014). Moreover, there are almost no studies
– neither theoretically nor empirically – that investigate the drivers of banks’ long-term debt issuance. This is in
contrast to the corporate finance literature, where a large number of theoretical hypotheses on the specific
determinants of bond issuance by non-financial firms have been tested empirically.5 At the same time, the banking
literature does offer bank-level frameworks to analyse the broader debt financing decision. These analyses provide
useful guidance for empirical investigations of banks’ bond issuance, and hence we discuss them here.
The first set of studies starts from agency costs and asymmetric information.6 Agency problems in banking
are likely to be pronounced, because banks are information specialists that are given control over certain financial
assets. Some studies argue that information asymmetries are reflected in the perceived opacity of banks, which
suggests that banks are more difficult to understand than non-financial corporations (Morgan, 2002; Dang et al.,
2014). At the same time, one needs to be careful in applying conventional corporate finance theories of agency
costs and asymmetric information unequivocally to the financing decision of banks. These theories are based on
trade-off considerations between debt and equity issuance, which are relevant for non-bank corporations, but much
less likely so for banks. When looking at actual equity issuance data for banks, it is clear that there is no pronounced
trade-off with debt issuance: even booming stock markets do not induce banks to issue large amounts of equity
instead of debt.
In the banking literature, bank debt7 is treated as a device to ensure market discipline that alleviates agency
problems and information asymmetries (Calomiris and Kahn, 1991; Flannery, 1994; Diamond and Rajan, 2001).
Traditionally, banking theory took a rather positive view of debt financing by banks, as debt was perceived to
enhance bank loan quality and/or liquidity creation through its disciplining effect (Acharya and Thakor, 2012). The
models of banking under asymmetric information developed in Gorton and Pennacchi (1990) and Calomiris and
Kahn (1991) imply that banks will face strong market pressure to offer low-risk debt (i.e. deposits) to outsiders,
because such debt protects depositors from inappropriate bank behaviour (Gorton and Winton, 2003; Calomiris and
Wilson, 2004). In this respect, debt issuance helps to resolve agency problems between the bank and depositors,
either by limiting the bank’s propensity to take on excessive risk or by preventing the bank from absconding with
depositors’ funds (Calomiris and Kahn, 1991). In Flannery (1994), the disciplining effect is achieved through the
issuance of short-term debt instruments, which are considered valuable contracting devices for banks, as changes
in bank risk will be promptly reflected in funding costs.
Apart from a cost channel, market discipline would work also through investors’ willingness to roll over
short-term debt (or not, see Morris and Shin, 2009). This “roll-over” channel is sometimes extended to long-term
debt instruments as well, a fraction of which must be renewed periodically (Admati and Hellwig, 2013). In Bank and
Lawrenz (2013), deposit funding acts as a commitment device, because, contrary to bonds, deposits are non-
negotiable (i.e. are “hard” claims on banks’ assets).8 In practice, banks will choose an optimal mixture of bond and
5. An extensive discussion of this literature is provided in Appendix A of Van Rixtel et al. (2015).
6. These analyses tend to emphasize two major problems faced by banks (Calomiris and Wilson, 2004): The potential conflict of interest between
bankers and depositors (Diamond, 1984) and banks’ role as issuers of transactable media.
7. Or more specifically, deposit financing: the literature concentrates on extremely short-term, typically demandable low-risk debt, in other words
demand deposits (see for example the definition of demandable debt in Calomiris and Kahn, 1991, p.497).
8 Deposits are a renegotiation-proof claim because of their collective action problem (see also Calomiris and Kahn, 1991, and Diamond and Rajan,
2000).
BANCO DE ESPAÑA 11 DOCUMENTO DE TRABAJO N.º 1621
deposit financing that aligns internal incentives of bank managers, such as potential gains obtained from
renegotiations with debt-holders, with external constraints (threat of regulatory intervention).
Due to more pronounced agency costs (as in: Flannery, 1994) and asymmetric information problems (as
discussed in: Morgan, 2002; Myers and Majluf, 1984), Gropp and Heider (2010) argue that banks display a higher
degree of debt financing than non-financial firms and hence are more leveraged. These agency and informational
setbacks may have increased the cost of issuing equity for banks (Allen et al., 2014). This hypothesis is supported by
the finding that especially profitable, dividend paying banks with high market-to-book ratios have more equity (i.e.
issue less debt) (Gropp and Heider, 2010). Hence, agency costs and asymmetric information would suggest a
negative relationship between market-to-book value and banks’ bond issuance.
Based on the perceived disciplining effect of debt issuance, several proposals have argued that banks
should be forced to issue subordinated debt, as banks’ ability in doing so may be considered as a market signal of
their viability (Evanoff et al., 2011). From a different angle, banks could also use debt issuance in order to manage
private information between them and the market. Hence, they issue debt to convey positive private information and
refrain from issuance to hide negative information (Covitz and Harrison, 2004; Billett et al., 1998).
The claim in banking theory that debt funding by banks imposes discipline on banks’ management is
refuted in Admati and Hellwig (2013), where the reliance on (short-term) debt funding is explained instead by debt
overhang and government guarantees and subsidies for debt.9 These authors find support in the experiences during
the global financial crisis, which revealed the limitations of debt as a disciplining device for banks.10
A second approach to assess banks’ recourse to debt financing concentrates on leverage targeting.11 This
implies that banks actively manage their leverage (i.e. choose their degree of leverage), with various studies
emphasizing different sources of funding being used in this process: (short-term) wholesale debt (Adrian and Shin,
2010a; Acharya et al., 2011; Damar et al., 2013), deposits (Berger et al., 2008) and non-deposit liabilities (Gropp and
Heider, 2010).12 Again, long-term debt remains largely outside the scope of analysis. Most studies find that the main
driver of bank leverage is size, i.e. bigger banks are more leveraged (Berger et al., 2008; Brewer et al., 2008; Adrian
and Shin, 2010a; Heider and Gropp, 2010; Damar et al., 2013). Additional bank-specific characteristics that are
found to explain the degree of leverage are collateral (positive) and the market-to-book ratio, profits and risk
(negative). The fact that leverage is very much bank-specific is also reflected in strongly significant time-invariant
bank fixed effects.
Leverage is closely linked to risk, and banks’ balance sheet adjustments have been associated with shifts in
risk appetite (Adrian and Shin, 2010a). Banks, like non-financial firms, may reduce their reliance on debt when they
become more risky, as for example reflected in higher default probabilities. If expected funding costs are sufficiently
risk sensitive, then riskier banks may be less likely to issue debt instruments. Covitz et al. (2004) demonstrate that
issuance decisions of banks are sensitive to firm-specific risk, just as others have found for non-financial firms. These
authors show that bank-specific risk proxies significantly affect the likelihood of debt issuance (negative sign),
9. Brunnermeier and Oehmke (2013) explain the reliance of banks on short-term debt funding as the outcome of a “maturity rat race”, where externalities between long-term and short-term debtholders can lead to an inefficient shortening of maturity structures. The incentive to do so may be particularly strong during financial crises.
10. In this respect, a large body of research has emphasized the risks of banks’ reliance on funding through short-term wholesale debt markets (Van
Rixtel and Gasperini, 2013; FRBNY, 2014). These conclusions are generally not extended to long-term wholesale debt financing by banks. This long-
term funding source offers both advantages and potential costs. On the one hand, lengthening the maturity structure of banks’ debt tends to make
them more resilient to funding shocks by decreasing reliance on short-term debt that can be withdrawn at very short notice (Eisenbach et al., 2014).
On the other hand, since long-term debt can be a more costly way of finance compared with short-term debt, the recourse to long-term debt may
increase the debt burden and hence the likelihood that the return on the bank’s assets will be insufficient to service this debt.
11. Of course, leverage targeting and adjustments in leverage may be caused by (changes in) agency costs and information asymmetries.
12. Non-deposit liabilities in Gropp and Heider (2010) are closely related to long-term debt for firms and include senior long-term debt, subordinated
debt and other debenture notes.
BANCO DE ESPAÑA 12 DOCUMENTO DE TRABAJO N.º 1621
especially during periods of financial and economic stress (while issuance is associated positively with size and
issuance frequency). Billet et al. (1998) find that banks adjust their funding structure away from risk-sensitive
securities and into deposits when they become more risky, predicting a negative relationship between rating strength
and deposit financing. Berger and Bouwman (2013) show that banks with higher capital before the crisis displayed
higher growth in wholesale debt funding during the crisis. If higher capital improves banks’ ability to absorb risk (i.e.
the “risk absorption” hypothesis in Berger and Bouwman, 2009), banks with higher capital could experience cheaper
and larger access to wholesale debt markets. Hence, according to this hypothesis, equity capital and bond issuance
should be associated positively. This relationship is also supported by Gambacorta and Shin (2016), which argue
that well-capitalised banks are perceived as less risky and have easier and cheaper access to funding including
bonds. These authors find that that a one standard deviation decrease in leverage determines an increase in the
average annual rate of debt funding between 1.6 and 2.3%. All in all, their results indicate that a larger capital base
reduces the financing constraints faced by banks, allowing banks to raise more debt. As suggested by these
authors, the results are in line with those of Kishan and Opiela (2000) and Admati et al. (2010), which indicate that
bank funding with debt becomes less information sensitive with higher capital, as the latter reduces bank risk and
creates a buffer against losses.
A third group of studies concentrates on liquidity in relation to debt issuance. The models of banking under
asymmetric information developed in Gorton and Pennacchi (1990) and Calomiris and Kahn (1991) imply that banks
will face strong market pressure to offer low-risk debt to outsiders, because it enhances the liquidity of bank claims
(Calomiris and Wilson, 2004). This is linked to the liquidity creation function of banks by financing relatively illiquid
assets with relatively liquid liabilities. Banks can meet liquidity needs by changing their funding structure (Diamond
and Rajan, 2001). In this respect, banks may issue debt to overcome deposit supply constraints, predicting a
negative relationship between deposit funding and bond issuance.
Finally, banks, especially in Europe, have been issuing considerable amounts of (long-term) secured debt,
which includes debt securities that are backed explicitly by either collateral (such as covered bonds and
securitisations) or government (e.g. government guaranteed bonds). Carbó-Valverde et al. (2011) show that
collateralised debt securities are issued for different purposes: while covered bonds are used especially to increase
bank liquidity, securitisations are more often issued in ways consistent with exploiting certain agency problems.
According to the “banking view of secured debt”, secured bond issuance of banks is negatively associated with
banks’ financial strength and size (Berger and Udell, 1990; Erel et al., 2012). Hence, especially weaker and smaller
banks will issue covered bonds or other secured instruments.13
An overview of the various bank-specific theories and the variables used to test them is presented in Panel
A of Table 1.
2.2 Macroeconomic and financial market determinants of banks’ debt issuance
The banking literature has generally paid little attention for the role of macroeconomic and financial market conditions
in the (long-term) debt securities issuance decision of banks. Covitz et al. (2004) find that both higher unemployment
and implied stock market volatility reduced the likelihood of subordinated debt issuance by US banks. Camba-
Mendez et al. (2012) find also a negative impact of (historical) stock market volatility on European banks’ bond
issuance, while other macroeconomic, financial and monetary policy-related variables are largely insignificant. The
major exception is a dummy variable for the ECB’s Covered Bond Purchase Programme on collateralised debt
13. A small but growing, literature concentrates on the tax benefits of debt in explaining banks’ recourse to debt financing. Recent empirical studies
show that this debt bias exists for banks to a similar extent as for non-banks (Keen and de Mooij, 2012; Heckemeyer and de Mooij, 2013). The
favourable tax treatment of debt leads to higher bank leverage, but this effect is smaller for the largest banks and for banks featuring higher leverage
ratios. However, as tax benefits affect mostly the choice between equity and any form of debt, we do not include tax issues in our analysis of the
drivers of long-term debt issuance.

BANCO DE ESPAÑA 13 DOCUMENTO DE TRABAJO N.º 1621
issuance. From a broader perspective, several studies have included macro variables as controls in estimations of
drivers of bank leverage. Heider and Gropp (2010) find that the term spread (positive), inflation and historical stock
market volatility (both negative) are significant in explaining banks’ market leverage, while GDP is not. Brewer III et al.
(2008) do not obtain significant results for several macroeconomic variables when country fixed effects are included.
On the importance of country-specific characteristics, Caruana and van Rixtel (2012) show that during the 2010-
2012 euro area financial crisis funding markets became increasingly segmented according to bank nationality, as the
access of banks to specific funding instruments was no longer determined primarily by their standalone credit rating
but by their country of origin.
Proponents of the “risk-taking channel” argue that banks may be incentivised to take on more risk through
excessive leverage when interest rates are low (Rajan, 2005; Borio and Zhu, 2012; Dell’Ariccia and Marquez, 2013;
Altunbas et al., 2014). This should be reflected in a negative relationship between (central bank) interest rates and
banks’ debt issuance.
Finally, the finance literature suggests that “market timing” considerations play an important role in the
decision whether or not to issue debt. Empirical research shows that companies issue bonds when interest rate are
low and/or expected to rise (Marsh, 1982; Graham and Harvey, 2001; Doukas et al., 2011).
Panel B of Table 1 provides a summary of the main findings in the banking literature on the relevance of
macroeconomic and financial market conditions for debt issuance.

BANCO DE ESPAÑA 14 DOCUMENTO DE TRABAJO N.º 1621
3 Hypotheses and empirical methodology
3.1 Hypotheses
The literature review provides us with a number of testable hypotheses, which are self-evident from the summary in
Table 1. We shall restrict ourselves to those hypotheses that we actually can test. For example, as we discuss in
section 4.3.1, we face data restrictions on bank-specific performance and stock market variables, such as profits,
dividends and stock prices.14 Hence, we do not discuss possible hypotheses that depend on the testing of the
relationship of these variables with bond issuance.
“Agency costs” and “asymmetric information”:
Due to existing information asymmetries and agency problems, market pressure will force banks to offer low-risk
debt (e.g. deposits) to outsiders, because such debt protects creditors from too risky bank behaviour. Depositors
can withdraw their funds at very short notice (“bank run”), in contrast to other debtholders. Hence, banks which face
more pronounced asymmetric information problems and agency costs will issue more deposits in order to alleviate
these constraints and hence have a lower need to issue bonds.
Hypothesis 1: according to “asymmetric information” and “agency costs” theories, bond issuance of banks
is negatively associated with the growth of deposit funding (see Table 1).
As banks face more pronounced information asymmetries and agency problems, they display a higher
degree of debt financing than non-financial firms. These setbacks may increase banks’ issuing costs of equity,
suggesting that especially banks with higher market-to-book value ratios have more equity and issue less debt.
Moreover, the market-to-book value ratio captures the growth opportunities of firms. As suggested by Myers (1977),
firms with growth options as reflected in higher market-to-book ratios will not issue long-term debt in order to avoid
committing the firm to share the benefits of exercising those options with debt-holders (“underinvestment”
problem).15
Hypothesis 2: according to “asymmetric information” and “agency costs” theories, bond issuance of banks
is negatively associated with market-to-book value ratios.
As a strategy to lower the agency costs of debt, debt issuers many schedule debt repayments to match the
decline in the value of assets (“maturity matching”), suggesting that firms with more long-term assets can support
more long-term debt (Diamond, 1991b). As loans are normally the longer maturity assets on banks’ balance sheets
(for example when compared with capital market-trading and investment activities), this result may point at a certain
degree of maturity matching between long-term assets and long-term liabilities.
Hypothesis 3: according to “agency costs” theories, bond issuance of banks is positively related to the ratio
of total loans to total assets (“maturity matching”).
“Roll-over” channel of debt:
Hypothesis 4: bond issuance of banks is positively related to their bond redemptions (“roll-over” channel) (Morris and
Shin, 2009; Admati and Hellwig, 2013).
14. We conduct a robustness test with market-to-book value as an additional explanatory variable for the listed banks in our sample in section 5.4.
15. For a more extensive discussion, see Appendix A of Van Rixtel et al. (2015).

BANCO DE ESPAÑA 15 DOCUMENTO DE TRABAJO N.º 1621
“Leverage targeting”:
The banking literature suggests that banks actively manage their leverage, through adjusting the size of their debt
issuance (banks hardly use equity issuance in their funding operations). Most empirical studies find that bigger banks
are more leveraged, which suggest that debt issuance plays an important role in the funding of banks’ expansion.
Hence, “leveraging up” and bank assets growth are positively related. At the same time, a positive coefficient could
also be explained by “deleveraging”: banks which are forced to restructure and downsize their business, for example
as a result of financial distress, may have to shrink the size of their balance sheet, and hence reduce their issuance
of long-term debt. In both cases, the crucial point is that banks actively manage their leverage through debt
issuance.
Hypothesis 5: bond issuance of banks is positively associated with size (total assets) and size growth
(Adrian and Shin, 2010a; Acharya et al., 2011; Damar et al., 2013; Berger et al., 2008; Gropp and Heider,
2010).
“Risk absorption”:
Financially stronger banks have greater capacity to absorb risk. Hence, higher rated and stronger capitalised banks
can access bond markets at better terms and consequently will issue more debt.16
Hypothesis 6: bond issuance of banks is positively associated with rating strength and equity (Berger and
Bouwman, 2009 and 2013; Gambacorta and Shin, 2016).
“Liquidity needs”:
Banks can meet liquidity needs by changing their funding structure, such as issuing debt to overcome deposit
supply constraints.
Hypothesis 7: bond issuance of banks is negatively associated with the growth of deposit funding (Diamond
and Rajan, 2001).
“Banking view of secured debt”:
Especially weaker and smaller banks issue covered bonds and other secured instruments, while stronger and larger
banks will signal their strength by issuing at unsecured terms.
Hypothesis 8: secured bond issuance of banks is negatively associated with banks’ financial strength and
size (Berger and Udell, 1990; Erel et al., 2012). This relationship will be more pronounced for weaker banks during
financial crises.
“Market timing”:
Banks issue more bonds when long-term interest rates and/or the term spread are low and/or expected to rise.
Hypothesis 9: bond issuance of banks is negatively associated with the level of interest rates and the term
spread (Marsh, 2001; Doukas et al., 2011).
16. Higher capital ratios may also reflect the fact that riskier banks are obliged to have higher capital buffers to compensate for their higher
unexpected losses. In this case, one would expect a negative coefficient between capital and bond issuance.

BANCO DE ESPAÑA 16 DOCUMENTO DE TRABAJO N.º 1621
“Risk-taking channel of monetary policy”:
An accommodative monetary policy stance in the form of low central bank policy rates may incentivise banks to take
on more risk by issuing more debt.
Hypothesis 10: bond issuance of banks is negatively associated with the central bank policy rate (Borio and
Zhu, 2012; Altunbas et al., 2014) and hence is positively associated with the amount of liquidity injected by the
central bank
Alternatively, banks may substitute bond issuance for borrowing from the central bank, when the conditions
to do so are favourable. In that case, the expected sign between central bank liquidity and banks’ bond issuance is
negative, leading to an alternative hypothesis 10A:
Hypothesis 10A: when the substitution effect between banks’ market funding and central bank borrowing
dominates, banks’ bond issuance is negatively associated with the amount of liquidity injected by the central bank.
“Country versus bank characteristics”:
Hypothesis 11: banks’ bond issuance is associated negatively with country-specific risk factors during financial
crises concentrated on these countries. During these episodes, bank-specific characteristics become less significant
(Caruana and van Rixtel, 2012; Van Rixtel and Gasperini, 2013).
3.2 Empirical methodology
In order to take into account “zero” issuance observations at the individual bank level, we conduct Tobit estimations,
in addition to OLS estimations. The absence of bond issuance by bank i in quarter t could be due to a lack of
demand for longer-term funds by the bank or a lack of supply of funds by investors. We believe that the best
practical empirical solution for this issue is using Tobit regressions. The underlying model assumes that the
dependent variable has a number of its values clustered at a limiting value, usually zero (as in our case) (McDonald
and Moffitt, 1980). Tobit regressions use all observations, both those at the limit (here zero) and those above it, to
estimate a regression line; it is generally to be preferred over alternative estimation models that estimate the
relationship only with the observations above the limit (i.e. that ignore the zero values).
The stochastic model underlying the Tobit framework with truncated (or censored) error terms may be
expressed as follows:
Yt = Xt β + εt if Xt β + εt > 0
= 0 If Xt β + εt ≤ 0
t = 1, 2, …, N, (1) where N is the number of observations, Yt is the dependent variable, Xt is a vector of independent variables, β is a vector of
unknown coefficients, and εt is an independently distributed error term assumed to be normal with zero mean and
constant variance σ2. Thus the model assumes that there is an underlying, stochastic variable equal to Xt β + εt which is
observed only when it is positive, and hence qualifies as an unobserved, latent variable (McDonald and Moffitt, 1980).
The regression takes the following specification:
ISSUANCE_BSit = αit + βt BANKSPECit-1 + γt MACRO_FINANCIAL_COUNTRYjt +
δt FINANCIAL_GENERALt + λj + μt + εit (2)

BANCO DE ESPAÑA 17 DOCUMENTO DE TRABAJO N.º 1621
The dependent variable ISSUANCE_BSit is bank-specific bond issuance. We use five different versions of
this variable, i.e. the total amount of bonds issued by bank i in quarter t (TOTAL_ISSUANCEit), secured issuance by
bank i in quarter t which includes covered bonds and government guaranteed bonds (SECURED_ISSUANCEit),
amount issued of unsecured bonds (UNSECURED_ISSUANCEit), covered bond issuance (COV_BONDSit) and
issuance of government guaranteed bonds (GOV_GUARit). In the Tobit estimations, issuance takes the following
values. First, if a bank issues bonds in a particular quarter, ISSUANCE_BSit is equal to the total actual amount of
bonds issued by bank i in quarter t scaled by its total assets. Second, in case of no issuance by bank i in quarter t,
the dependent variable is equal to zero.
The explanatory variables include bank and country-specific variables as well as overall financial market
conditions. BANKSPECit-1 is a set of time-variant variables that are specific to bank i. Following the convention in
the literature, firm characteristics are measured the quarter prior to bond issuance (Adrian et al., 2013; Becker and
Ivashina, 2014). This lag of one quarter avoids endogeneity problems (Brewer III et al., 2008).
MACRO_FINANCIAL_COUNTRYjt is a set of time-variant macroeconomic and financial variables that are specific to
country j which is the country where the headquarters of bank i is located (and hence the country responsible for its
supervision and eventual bailout). FINANCIAL_GENERALt includes two indicators of overall financial market
conditions, i.e. stock market implied volatility (VOLt) and the US dollar Libor-OIS spread (LIBOR_OISt). αit is a time
variant constant. λj and μt are country respectively time fixed effects. εit is the error term.
BANCO DE ESPAÑA 18 DOCUMENTO DE TRABAJO N.º 1621
4 Data and descriptive analysis
4.1 Bank sample
Our sample consists of the most frequently issuing European banks between 1999 and 2013, as recorded in the
Debt Capital Markets (DCM) database of Dealogic. We use a threshold of at least 200 bonds issued per individual
bank during this period. Our investigation of the data in Dealogic on all bonds issued by European banks from 1999
to 2013 showed that a cut-off of 200 bonds would give us a sample of banks that for practical and empirical
purposes would meet the objective of our study. We found a relatively small number of banks that issued more than
200 bonds during this period and a relatively large number of banks that issued considerably less than 200. As we
discuss in the next section and in Appendix B in greater detail, issuance data in Dealogic are reclassified for banks
involved in mergers and acquisitions and hence need to be individually checked to be sure by which specific bank
they were actually issued. This can only be done manually, which is extremely time consuming, but is manageable
for a not too large sample of banks. Moroever, a threshold of at least 200 bonds issued by an individual bank would
give us sufficient dispersion across time to capture changes in bond issuance patterns before and after the crisis.
Finally, the selection of the banks in our sample is based on actual issuance during 1999-2013 while our estimation
period runs only from 2005 to 2013, which should mitigate possible selection bias concerns.17
The selection of banks is further narrowed down by the availability of quarterly data for the independent
variables. In the end, we have a sample of 63 banks from 11 euro area countries (AT, BE, DE, ES, FR, GR, IE, IT, LU,
NL and PT) and Sweden, Switzerland and the United Kingdom. A breakdown of the number of banks per country is
shown in Chart 2. The full list of the names of the individual banks including bank nationality and bank-type is
presented in Appendix A. The largest national sample is the German one with 19 banks, followed by France and the
United Kingdom (both seven banks). Our sample is well-represented across countries in terms of national total
banking assets and does not have the over-representation of smaller countries that characterises other
investigations of European banks such as the 2011 European Banking Authority (EBA) stress test and Camba-
Mendez et al. (2012). The sample includes all European global systemically important banks (G-SIBs) which have
been identified by the Financial Stability Board (FSB).18
Most banks in our sample are commercial banks (37), followed by public savings banks (11), mortgage
banks (8) and cooperative banks (7). The large number of public savings banks is due to the importance of public
sector banks in Germany. While dropping in recent years, the share of the German banking system in public
ownership prior to the crisis amounted to around 40% of total German banking assets (Hüfner, 2010). Especially the
publicly owned Landesbanken have been large and frequent issuers of long-term debt securities. Traditionally, these
banks acted as central institutions for the savings banks (including providing access to capital markets) and main
bank of the respective regional (Länder) governments (Krahnen and Schmidt, 2004), but increasingly started to
operate in similar ways to private commercial banks on an international scale, concentrating on wholesale banking
activities. Their international advance was aided by government guarantees, which were abolished in 2005.19
Mortgage banks are characterised by large portfolios of mortgage-related lending, predominantly financed by market
funding, due to the absence of a broad deposit base. Cooperative banks provide banking services to both members
17. In order to address these concerns, we applied Heckman’s 2-stage correction method to test for selection bias in section 5.4. Our results pass this test.
18. Our sample includes all European G-SIBs on the list published by the FSB on 11 November 2013.
19. Due to their public ownership, savings banks and Landesbanken used to enjoy a guarantee by the public founding entity in the event of default as
well as a maintenance guarantee (Hüfner, 2010). These guarantees were especially important for the Landesbanken due to their large recourse to
market funding. Following a ruling by the European Commission that these guarantees were not in line with state aid regulations, a compromise in
February 2002 between the European Commission, the federal government as well as the Länder and the Association of Savings Banks and
Landesbanken required the abolition of the guarantee obligation while existing liabilities were still fully covered, and the replacement of the
maintenance guarantee. However, a generous phasing-out period until July 2005 allowed the banks to enter liabilities with government guarantee at a
maximum duration until 2015.
BANCO DE ESPAÑA 19 DOCUMENTO DE TRABAJO N.º 1621
as well as non-members, buttressed by significant deposit funding. They are fully or partly privately owned by their
customers and hence often not listed at a stock exchange.
4.2 Dependent variable
We downloaded from Dealogic DCM data on 50,465 long-term debt securities that were issued by the 63 banks in
our sample between January 1999 and March 2013. A major complication in compiling the issuance data was the
handling of “dead” banks, i.e. banks that disappeared as independent entities because they were taken over by
another bank. DCM reclassifies bonds issued backwards in time when the original issuing bank disappears; the
acquiring bank becomes the new parent issuer, also of the bonds that were issued by the “dead” bank before the
date of the takeover. As we want to link the issuance data to bank-specific information, it is clear that this needs to
be corrected, which can be done only manually for each individual bond issue concerned. For our checking we use
Bankscope, SNL, bond issue and bank-specific information from the three rating agencies (Fitch, Moody’s and S&P)
and publications from the banks in our sample. More detailed information on the cleaning of the data is provided in
Appendix B.
We include unsecured senior, subordinated, covered and government guaranteed bonds. The latter
became a crucial feature of longer-term bank funding in 2008 and 2009 in the context of the policy response to the
global financial crisis (Panetta et al., 2009; Muller et al., 2011). Covered bonds and government guaranteed issuance
combined are the secured issuance in our analysis. We include medium-term notes (MTNs), which are offered
continuously under an issuance programme, with a range of different yields and maturities of up to thirty years
available to cater to the specific needs of individual investors. As further explained is Appendix B, we exclude
securitisations and bonds issued by SPVs, bond exchanges and short-term debt securities.20 We concentrate on
longer-term debt, which according to the definition used by Dealogic includes debt instruments with an original
maturity of 18 months and longer.
The actual evolution of bond issuance by the 63 banks in our sample is shown in Chart 3. German banks
dominated European issuance from 1999 to 2005 (Chart 3, top left-hand panel), which was driven by the
Landesbanken. With the abolishment of the government guarantees in 2005 and the collapse of several
Landesbanken during the global financial crisis of 2008-2009, this dominance disappeared rapidly. Especially banks
headquartered in the UK, France, Spain, Italy and the Netherlands started to increase their bond issuance from
2004-2005 onwards. Notable issuance patterns are concentrated especially in quarters that were affected strongly
during the global financial crisis of 2008-2009 and the euro area financial crisis of 2010-2012. With respect to the
latter, the peak in Q1 2011 was due to a normalisation of issuance conditions and hence a “catch-up” in issuance
after the turbulent market developments in late November and December 2010, when a sharp deterioration of the
European sovereign debt crisis (i.e. problems and bailout of Ireland) spilled over to banks’ funding markets (Anguren-
Martín et al., 2012). The troughs in the first half of 2011 and second quarter of 2012 were also linked to this crisis,
when both Italy and Spain were increasingly hit. The euro area financial crisis and related bank restructuring and
deleveraging resulted in a decline of the share of banks from peripheral euro area countries (ES, GR, IE, IT and PT)
as of total euro area issuance to just 25% in Q1 2013, from 35% two years earlier. These developments affected the
total amount of bonds issued by European banks as well: this reached a level in Q1 2013 that was similar to that of
13 years earlier. In terms of the number of bonds issued, especially UK banks were relatively frequent issuers,
especially when compared with the amounts issued (Chart 3, top right-hand panel).
20. We acknowledge that possible substitution effects between issuance of (long-term) bonds, securitisations and short-term debt instruments may
play a role, but due to bank-specific data limitations – both with respect to securitisations and short-term debt – we have not been able to investigate
this issue in an accurate way. For instance, Almazan et al. (2015) find that securitisation is “… associated with substantial changes in the capital
structure and funding policies” of Spanish banks between 1999 and 2006 (p. 234) and, more specifically, with an important reduction of their deposit
ratios. However, they do not find a statistical significant relationship between banks’ securitisations and their ratio of non-interbank debt issued in
wholesale markets.

BANCO DE ESPAÑA 20 DOCUMENTO DE TRABAJO N.º 1621
We turn now to the specific types of longer-term debt instruments issued. Unsecured bonds dominated
issuance during relatively tranquil periods with expanding banking sectors, such as from early 2004 until the second
quarter of 2007 (Chart 3, centre left-hand panel). Unsecured issuance boomed in the first quarter of 2011 (see
above), and again in the first quarter of 2012, when the two Longer-Term Refinancing Operations (LTROs) of the
ECB of December and February had boosted confidence in European bank funding markets. Covered bond
issuance has seen an increasing trend in relative terms, especially by banks headquartered in peripheral euro area
countries. The issuance of government guaranteed bonds became an important source of funding during the
immediate aftermath of the collapse of Lehman Brothers in September 2008, but has disappeared largely since then.
When taking into account the number of bonds issued, banks issued large numbers of unsecured bonds,
suggesting relatively small sizes of individual issues (Chart 3, centre right-hand panel). In contrast, the number of
government guaranteed bonds issued was very small, while raising relatively large amounts.
Issuance activity was increasingly concentrated at the largest systemic banks in Europe: the share of the 16
European G-SIBs in our sample in total long-term issuance activity expanded strongly from just 12% in the first
quarter of 1999 to 55% in the first quarter of 2013 (Chart 3, bottom left-hand panel, red line). As bond issuance is
characterised by seasonal patterns, we smoothen G-SIB and overall total issuance as a four-quarter moving average
(Chart 3, bottom left-hand panel, blue and green lines). G-SIB issuance fell less strongly than that of all banks during
the 2008-2009 global financial crisis. However, this resilience disappeared largely during the worst episode of the
European financial crisis starting in the summer of 2011.
The average original maturity (in months) of bonds issued by the 63 European banks in our sample has
been increasing in recent years, from a low of around 50 months in the first quarter of 2009 to around 70 months in
the first quarter of 2013 (Chart 3, bottom right-hand panel, red line). This is indicative of a growing preference for
stable funding sources, both market and regulatory-driven, as debt securities with long maturities constitute stable
funding (ECB, 2012). The share of bonds issued with an original maturity of above three years in our sample is
between 60% and 80% (Chart 3, centre right-hand panel, blue line). Hence, our analysis concentrates on the longer-
term segment of European banks’ bond funding.
Inspection of the issuance data for individual banks shows that during a significant number of quarters
various banks did not issue long-term debt at all. This phenomenon became more prominent over time (Chart 4).
The largest number of banks not issuing (i.e. 15) was recorded in the second quarter of 2012, at the height of the
euro area financial crisis. These banks included seven of the 11 banks from peripheral euro area countries in our
sample.
Panel A of Table 2 provides the descriptive statistics of the five dependent variables in the bank-specific
analysis (TOTAL_ISSUANCEit, SECURED_ISSUANCEit, UNSECURED_ISSUANCEit, COV_BONDSit and GOV_GUARit).
Mean total quarterly issuance per bank before the crisis was around 1% of average total assets (ratio 0.011), with
considerable variation across time, as shown by the standard deviation. The largest total quarterly amount issued by
any single bank before the crisis was around 19% of total assets. Since the financial crisis, quarterly issuance amounts
of individual banks have increased, as banks started to frontload issuance in quarters when funding markets were
accessible or took advantage of government guaranteed issuance programmes. The largest quarterly amount issued by
a single bank since the financial crisis was around 11% of total assets.
4.3 Explanatory variables
4.3.1 BANK-SPECIFIC VARIABLES
We include six variables capturing essential balance sheet and performance characteristics of individual banks
(BANKSPECit-1 in Equation (2)). GR_TAit-1 is the quarterly increase in total assets, scaled by total assets. According to
the “leverage targeting” hypothesis, bond issuance of banks is positively associated with the growth of total assets
(Hypothesis 5). K_TAit-1 is the ratio of total equity capital to total assets. The “risk absorption” hypothesis predicts

BANCO DE ESPAÑA 21 DOCUMENTO DE TRABAJO N.º 1621
that bond issuance of banks is positively associated with bank equity (Hypothesis 6). L_TAit-1 is the ratio of total loans
to total assets, which captures business model differences between banks. We expect a positive relationship
between the loan ratio and bond issuance, indicating that banks with high loan growth need to recourse to bond
issuance. A positive sign also would be in accordance with “maturity matching” as a strategy to lower agency costs
(Hypothesis 3). D_TAit-1 is the ratio of total customer deposits to total assets. We expect a negative relationship
between this variable and bond issuance (Hypothesis 7). RATING_AVit-1 is the average of the stand-alone ratings for
each bank published by Fitch, Moody’s and S&P. The ratings are scaled from “0” to “20”, with “0” and “20”
representing C respectively AAA in Fitch and S&P and Ca and Aaa in Moody’s. This average rating is a proxy for
bank-specific risk and is expected to be positively correlated with bond issuance (Hypothesis 6).
We use the one-quarter lagged values of the balance sheet and rating variables to avoid endogeneity
problems. The quarterly data for the balance sheet variables are obtained from Bankscope, and where available,
augmented by data from SNL. For several banks for which quarterly data are poorly populated in these databases,
we go to original sources such as quarterly and annual reports. Missing quarterly data are estimated by interpolation.
Due to the lack of historical quarterly balance sheet data, the estimation including bank-specific variables is
conducted for Q1 2005 – Q1 2013 only. Our main bank-specific estimations use 1,627 observations.
Restrictions on data-availability are the reason why we have not included important flow variables such as
profits and dividends. Quarterly data for these indicators are available in Bankscope and SNL for the most recent
years only. Moreover, given their significant variability across quarters, quarterly interpolations based on annual
values fail to provide a realistic picture of actual developments. In addition, a relatively large number of banks in our
sample, i.e. the public savings banks and several cooperative banks, are not listed. Hence, we do not have data on
stock prices and market value for these banks. Due to these data limitations, we cannot test for the full sample of
banks hypotheses suggested by the corporate finance literature which require stock market information.
Notwithstanding this shortcoming, we collect for the listed banks in our sample market value data in order to
calculate the market-to-book ratio. Agency costs and asymmetric information problems suggest a negative
relationship between this ratio and bond issuance (Hypothesis 2). We use market-to-book value as an additional
explanatory variable of banks’ bond issuance in a separate robustness test (section 5.4). Finally, we do not
investigate the tax benefits of debt. Corporate taxes change only sporadically and hence are less suited to be
included in empirical analyses of a quarterly frequency.
Descriptive statistics of the bank-specific explanatory variables are reported in Panel B of Table 2. The
mean size of the 63 banks in our sample is euro 490 billion, with considerable dispersion across banks: the largest
bank (total assets of euro 2.6 trillion) is more than 470 times the size of the smallest bank (euro 5.5 billion). We also
find considerable heterogeneity in funding structures, with some banks depending predominantly on deposit funding,
while others hold no or very small amounts of deposits. Also asset structures display large variation, such as
indicated by large differences in loan-to-total assets ratios. The mean rating of the banks in our sample is 16, or A+
in Fitch and S&P and A1 in Moody’s. The lowest rating (4) is below investment grade (CCC+/Caa1), while the highest
(20) is AAA/Aaa.
4.3.2 COUNTRY-SPECIFIC AND FINANCIAL MARKET VARIABLES
The country-specific and financial market variables in Equation (2) (see section 3.2) are the following.
MACRO_FINANCIAL_COUNTRYjt includes TERM_SPREADjt, LRjt, CB_RATEjt, CB_BSjt, CBPPt, GDPjt and
CDS_SOVjt. FINANCIAL_GENERALt includes VOLt and LIBOR_OISt.
TERM_SPREADjt is the difference between 10-year government bond yields and country representative 3-
month government bill yields of the 14 countries in our sample. It proxies for the cost of borrowing at different
maturities, which can affect the choice of debt maturity. The “market timing” hypothesis (see Hypothesis 9) suggests
a negative relation between the issuance of long-term bonds and the term spread. LRjt is the 10-year government

BANCO DE ESPAÑA 22 DOCUMENTO DE TRABAJO N.º 1621
bond yield of the respective national sovereign. We expect a negative relationship. CB_RATEjt is the policy interest
rate of the respective central bank (ECB, Bank of England, Sveriges Riksbank and Swiss National Bank). The “risk-
taking channel” hypothesis (see Hypothesis 10) predicts a negative relation between the policy rate and bond
issuance. CB_BSjt is the size of the balance sheet (total assets) of the respective central bank, which should capture
impact of unconventional monetary policy (i.e. effects of the monetary policy stance beyond the policy rate).21 We
also use the variable ECB_liquidityjt, which is the amount of ECB lending related to monetary policy operations to
credit institutions in country j in quarter t. The “risk taking channel” (Hypothesis 10) would predict a positive
relationship, while abundance of central bank liquidity could also cause banks to switch from bond issuance to
central bank borrowing (negative relationship, see Hypothesis 10A). CBPPt is a dummy variable for the ECB Covered
Bond Purchase Programme, which was active from June 2009 to June 2010 in its first phase, and reactivated from
early November 2011 to end-October 2012 (Camba-Mendez et al., 2012; Beine et al., 2011). This dummy takes the
value one when active and zero otherwise. We expect a positive relation with covered bond issuance. GDPjt is the
percentage change in real GDP of the respective country. We expect a positive relationship. CDS_SOVjt is the
sovereign CDS spread of the respective national sovereign. With the strong interrelationship between the sovereign
and the banking sector, we expect a negative relationship, especially during crisis periods (Hypothesis 11). VOLt is
implied stock market volatility (VSTOXX). As several available measures of implied volatilities based on national stock
market indices are highly correlated with the VSTOXX, we use the latter for all countries. LIBOR_OISt is the three-
month US dollar Libor-OIS spread. Summary statistics of the main country-specific and financial market variables are
presented in Panel B of Table 2. A summary overview of the dependent and explanatory variables used in the
estimations is presented in Table 3.
21. We also used central bank assets scaled by GDP, with similar results.

BANCO DE ESPAÑA 23 DOCUMENTO DE TRABAJO N.º 1621
5 Empirical results
5.1 Overall results
Table 4 shows the results of estimating Equation (2) (in section 3.2) for total issuance (TOTAL_ISSUANCEit). In our
discussion, we concentrate on the Tobit estimates. Generally, we find strongly significant coefficients for the bank-
specific variables, with signs as expected by the formulated hypotheses (see Table 1). The positive and significant sign
for total assets’ growth (GR_TAit-1) (Table 4, column (4)) for the crisis period supports “leverage targeting” (Hypothesis 5,
section 3.1). Interestingly, this variable is not significant in the pre-crisis period, suggesting that banks resorted to long-
term wholesale funding to finance balance sheet expansion during the crisis years, but not before. This may be
explained by the widely reported use of short-term wholesale markets and securitizations in the years prior to the crisis;
when access to these markets became severely limited for most banks during the crisis, they had to resort to long-term
bond issuance. The coefficient estimate on the capital ratio (K_TAit-1) is significantly positive for both crisis and pre-crisis
periods, providing support for the “risk absorption” hypothesis (Hypothesis 6). Hence, as capital expands banks’ risk-
bearing capacity, better capitalised banks are able to issue larger amounts of long-term debt. The coefficient on the
deposit ratio (D_TAit-1) is negatively and significantly associated with bond issuance for both periods, supporting the
“agency costs” and “asymmetric information and deposit supply constraints hypotheses (Hypotheses 1 and 7).
Moreover, bond issuance is positively and significantly associated with the loan ratio (L_TAit-1), both before and after the
crisis. As loans are normally the longer maturity assets on banks’ balance sheets (for example when compared with
capital market-trading and investment activities), this result may point at a certain degree of “maturity matching”
between long-term assets and long-term liabilities (Hypothesis 3). Finally, we also find the expected positive sign (at
10%) on the coefficient of banks’ credit ratings (RATING_AVit-1): banks that are perceived to be less risky and hence
have a higher credit rating issue more long-term debt than lower rated banks (Hypothesis 6). This result also holds
during the crisis period (even more significant at 1%), suggesting that the standalone financial strength of banks
remained an important factor in maintaining access to long-term wholesale markets.22
Our results also indicate that macroeconomic and financial market conditions are important determinants of bond
issuance by European banks, in addition to bank-specific characteristics. Hence, we can extend the empirical results from
the corporate finance literature suggesting that these conditions are important drivers of the debt issuance decision of non-
bank firms to debt issuance by banks. Sovereign CDS spreads (CDS_SOVjt) are negatively and significantly correlated with
bond issuance in the crisis period, suggesting the importance of country-specific risk factors during the crisis (Hypothesis
11). However, we do not find that this finding was accompanied by a decline in the importance of bank-specific
characteristics. This is an important result for policy, as it shows that better-performing banks maintained better access to
longer-term funding markets during the crisis period. Hence, banks’ own policies and management decisions matter, also
during financial crises. Furthermore, we find that financial market volatility (VOLt) was negatively and significantly related to
bond issuance throughout our full sample period. Hence, financial market tensions reduced the likelihood that banks
issued bonds. The long-term interest rate (LRjt), or our indicator for “market timing” (Hypothesis 9),23 is no longer significant
during the crisis period, as access to long-term debt markets became more important than its cost. Interbank funding
costs, proxied by Libor-OIS spreads, are significantly and, as expected, negatively correlated with bond issuance, but only
in the pre-crisis period. The sign of this variable turns positive during the crisis years, which may be explained by the
issuance of large amounts of government guaranteed and retained bonds during quarters when access to global interbank
markets was especially impaired. The issuance of these bonds may also explain the negative and significant coefficient for
GDP during the crisis period. To complete our investigation of the importance of general macroeconomic and financial
market conditions, we included the central bank policy rate, the size of its balance sheet and the term spread, but these
variables were not significant in both periods (not reported in Table 4).
22. Adrian et al. (2013) find for a large sample of US non-banks that those with better ratings were also more likely to resort to bond financing during
the crisis.
23. We also included the term spread, but this variable was not significant in both periods (not reported).

BANCO DE ESPAÑA 24 DOCUMENTO DE TRABAJO N.º 1621
5.2 Secured issuance
Table 5 reports our findings for secured (SECURED_ISSUANCEit) and unsecured issuance (UNSECURED_ISSUANCEit).
The former includes covered bonds and long-term debt securities issued under government guaranteed issuance
programmes that were established in many European countries after the collapse of Lehman Brothers. Turning first to
the Tobit results for secured issuance (columns (3)-(4)), the most notable finding is that the rating sign now turns
negative, suggesting that lower rated banks were more likely to issue secured debt. This result supports the “banking
view of secured debt” (Hypothesis 8), which expects that secured bond issuance is negatively associated with the
issuer’s financial strength.24 Also the sign of the coefficient for the capital ratio (K_TAit-1) turns now negative, but fails to
meet the 10% significance level. The deposit and loan ratios (D_TAit-1 and L_TAit-1) remain significant with unchanged
signs, while the results for GDP and the Libor-OIS spread are unchanged as well. In contrast, the sovereign CDS
spread is no longer significant for the crisis period.
The results for unsecured issuance in Table 5 provide further support for the “banking view of secured
debt”, as the coefficients for both the rating and capital ratio variables are now positive and significant (columns (7)-
(8)). Hence, stronger banks seem to want to signal their financial strength to financial markets by demonstrating that
they are able to issue on unsecured terms. At the same time, the sovereign CDS spread is now significant and has
the expected negative sign, indicating that banks headquartered in countries affected by sovereign tensions were
less likely to issue unsecured bonds.
In order to better understand the drivers of secured bond issuance, we split this sample into its two
constituents, i.e. covered bonds (COV_BONDSit) and government guaranteed bonds (GOV_GUARit). The results are
reported in Table 6. The coefficient of the capital ratio (K_TAit-1) is negative and significant for the crisis period
(column (4)), indicating that especially less capitalised banks issued covered bonds during the crisis years. With the
global and euro area financial crises increasingly turning into crises of bank solvency, investors seem to have
required additional security from banks with lower capital ratios. Investor preferences may also explain the negative
sign on the coefficient of GDP, indicating that banks headquartered in countries experiencing lower economic
growth were more likely to issue covered bonds during the crisis period. Increased financial market volatility reduced
the likelihood of European banks issuing covered bonds during the full sample period. The deposit and loan ratios
have the expected signs (negative respectively positive) and are both significant for the crisis period.
Turning to government guaranteed bonds, their issuance is completely driven by macro-economic factors;
bank-specific factors are no longer significant. GDP is the main determinant, significant at the 1% level and a
negative sign. Hence, the significant and negative sign on the coefficient of GDP that we reported in the overall
results (Table 4) and in those for secured issuance (Table 5) seems to have been driven largely by government
guaranteed issuance, followed by covered bond issuance.
The results of the bank-specific analysis that we have discussed thus far have not included significant
findings for central bank policies, both the policy interest rate and the size of the balance sheet. We investigate the
role of central banks further by including a dummy for the ECB Covered Bond Purchase Programme (CBPP), which
was active from June 2009 to June 2010 in its first phase (CBPP1), and reactivated in early November 2011 until the
end of October 2012 in a second phase (CBPP2). The results in Table 7 show that this programme indeed promoted
the issuance of covered bonds, with a positive and significant sign (at 5%) for the coefficient on CBPPt (column (3)).
Interestingly, this programme seemed not to have functioned as intended for covered bond issuance by banks
headquartered in peripheral euro area countries. We find a negative and significant sign for an interaction term
CBPP_PERIt (column (3)) which is a dummy variable capturing covered bond issuance by peripheral banks in
quarters when the programme was active.
24. Erel et al. (2012) find for a sample of US non-financial corporations that higher leveraged firms are more likely to issue secured debt.
BANCO DE ESPAÑA 25 DOCUMENTO DE TRABAJO N.º 1621
5.3 Regional issuance
The global financial crisis of 2008-2009 and especially the euro area financial crisis of 2010-2012 had profoundly
different repercussions for individual countries. In order to have a better understanding of these processes, we divide
the sample into three regional groups: the banks headquartered in core euro area countries (DE, FR, NL, BE, AT and
LU), peripheral euro area countries (ES, GR, IT, IE and PT) and other European countries (UK, SE and CH). Then we
regress total issuance (TOTAL_ISSUANCEit) of the banks in each region on the set of explanatory variables that we
have used in the bank-specific regression. Table 8 shows the results. Most notably, the coefficient for the sovereign
CDS spread is negative and significant for banks headquartered in the euro area, i.e. both for the core and peripheral
countries (columns (2) and (4)), but is not significant for the three countries outside the euro area (UK, SE and CH)
(column (6)). Two conclusions can be drawn from this finding. First, the euro area financial crisis was not affecting
just the long-term funding of peripheral banks; also bond issuance by banks from the euro area core countries was
negatively correlated with sovereign tensions. Second, European banks headquartered outside the euro area were
not affected directly by the sovereign turmoil. Issuance of these banks was driven largely by bank-specific
characteristics, such as capital and loan ratios (both positive) and their deposit ratio (negative).
The main difference between the determinants of issuance by core versus peripheral euro area banks is that
the former is positively and significantly associated with the credit rating whereas the latter is positively correlated
with the capital ratio. On the latter result: we find generally positive coefficients for the capital ratio in the regressions,
which is significant for peripheral euro area banks for the full sample (at 5% for pre-crisis and 1% for crisis period;
columns (3) and (4)) and for UK-SE-CH banks for the crisis period only (column (6)). Hence, our acceptance of the
“risk absorption” hypothesis in section 5.1 seems to be driven largely by banks headquartered in peripheral euro
area countries.
Moreover, we find a positive and significant coefficient (at 1%) for the long-term interest rate (LRjt) in the core
euro area estimation for the crisis period (column (2)), suggesting that banks from the core were less likely to issue
long-term bonds when government bond yields were low. This result may pick-up financial market turmoil related to
the euro area financial crisis: “flight to safety” investment flows drove sovereign 10-year government bond yields of
the leading core euro area countries to their lowest levels during the most intense episodes of the crisis. But during
these times, bond market access of core euro area banks was also severely hampered, which explains the positive
sign. We do not observe this relationship for sovereign CDS spreads of core countries, which were generally at their
peaks during periods of severe market disruptions (and hence the negative sign). Interestingly, before the crisis, the
sign on the coefficient for the long-term interest rate (LRjt) was negative and significant (column (1)), suggesting that
in normal times core euro area banks “timed” their issuance to take advantage of lower issuance costs; actually,
peripheral area banks followed the same strategy before the crisis (column (3)).
5.4 Additional analysis and robustness tests
In this section, we present further analysis of our results and conduct robustness tests. As our database allows for a
detailed breakdown of various types of bonds, we are able to estimate the drivers of more differentiated subsamples
of bond issues. These estimations provide additional evidence that helps us to verify our conclusions.
As a first investigation, we exclude all bonds which benefited from direct state support or were issued with
the objective to be used as collateral in central bank liquidity operations. That is, we exclude government guaranteed
bonds and retained issues, which are both identified in the Dealogic database. Hence, we are able to test to what
extent our results were driven by the inclusion of public sector supported issuance. Government guaranteed and
retained bonds emerged for the first time during the global financial crisis of 2008-2009, when state and central bank
support for banks became a key element of their wholesale funding structure (see Panel A, Chart 5). At the height of
the euro area crisis in the second half of 2011 and first half of 2012, retained issuance returned in significant
amounts, as banks needed collateral to obtain liquidity from the ECB. During the global financial crisis, retained
bonds were issued mainly by UK banks, which started to issue these instruments from the second quarter of 2008

BANCO DE ESPAÑA 26 DOCUMENTO DE TRABAJO N.º 1621
onwards (see Panel B, Chart 5). This coincided with the start of the Bank of England’s Special Liquidity Scheme
(SLS) in April 2008, under which banks could swap illiquid debt securities for UK Treasury bills and use the latter as
collateral to obtain cash. In contrast, retained issuance during 2011-2012 was dominated by Spanish and Italian
banks, which faced growing pressures in accessing wholesale funding markets and became increasingly dependent
on ECB liquidity.
The results of the estimations for the reduced sample (excluding government guaranteed and retained
issuance) are reported in Table 9. Interestingly, national characteristics are now no longer significant: issuance of
bonds can be explained completely by bank-specific factors and overall implied stock market volatility (VSTOXX).
Higher rated and better capitalized banks were more likely to issue long-term debt, in line with the “risk-absorption”
hypothesis. Bond issuance was also driven by the growth of total assets, suggesting “leverage targeting”, while
relatively large loan portfolios were also associated with larger issuance.
Next, we further investigate the possible impact of central bank policies on European banks’ bond issuance.
In our baseline estimations, neither the central bank policy rate nor central bank total assets were significant; to save
space, we did not report them. This is remarkable, against the background of the exceptional central bank policy
stance during the crisis years, both in terms of conventional and unconventional policies. Hence, we conducted
further analysis for smaller samples, focusing on issuance of different types of debt, for different groups of countries.
We also included new explanatory variables for liquidity provided by central banks. The main results of this exercise
are reported in Table 10. We found that unsecured issuance by banks headquartered in the peripheral countries (ES,
GR, IE, IT and PT) was negatively and significantly (at 1%) associated with liquidity provided by the ECB
(ECB_liquidityjt). Hence, central bank liquidity became a substitute for unsecured long-term debt during the crisis
years for banks from the European periphery. Thus, we find partial support for our Hypothesis 10A on the
substitution between bond issuance and central bank liquidity, as it seems to hold only for banks headquartered in
the peripheral countries.
Furthermore, we tested the importance of bond redemptions in driving new bond issuance. Both market
reports and academic literature suggest that this “roll-over” channel (Hypothesis 4) may be important. We
approximated for each bank the amount of their quarterly redemptions on the basis of the information provided by
Dealogic.25 We added these redemptions as an additional explanatory variable (REDEMPTIONSit) in the baseline
regression; results are reported in Table 11. We found indeed evidence that banks rolled over maturing long-term
debt by issuing new bonds, with REDEMPTIONSit significant before and since the crisis (at 10% and 1%,
respectively). Moreover, the results for the other explanatory variables were robust when compared with the baseline
results presented in Table 4, with the only exception being the sovereign CDS spread (which misses just the 10%
level).
Another variable that may drive bond issuance is the market-to-book ratio, which is often used as a proxy
for firms’ growth opportunities. Hypothesis 2 suggests that banks’ bond issuance and their market-to-book ratios
are negatively associated. 40 banks in our sample are listed and hence the number of observations is reduced to
376 for the pre-crisis period and 694 since the outbreak of the crisis. The results of the estimation including the
market-to-book ratio are reported in Table 12. The Tobit estimates do not yield significant results for this ratio. When
comparing the results for the other variables in Table 12 with our baseline results reported in Table 4, our main
findings do not change. For the results since the crisis, the Tobit estimates only change for the two variables that
were significant at just the 10% level in the baseline estimation (GR_TAit-1 and CDS_SOVjt), which are no longer
significant (but only marginally).
25. Dealogic does not provide data on the amounts outstanding, but only on gross issuance. Hence, we approximated redemptions on the basis of
the original maturity of the bonds issued.

BANCO DE ESPAÑA 27 DOCUMENTO DE TRABAJO N.º 1621
Additionally, our sample may contain some Contingent Convertible Bonds (CoCos), whose issuance is
probably driven by regulatory requirements (Avdjiev et al., 2013). Given the characteristics of our dataset, we cannot
properly identify bonds classified as CoCos; however, we can investigate which banks issued CoCos during our
sample period in other databases (e.g. Bloomberg) or in specialised investment banks’ reports. From our
investigation, we conclude that when Basel III started to be phased-in in 2013, up to 10 banks in our sample issued
CoCos (depending on the source consulted). These bonds are potentially included in our database and hence may
distort our results. In order to control for the latter, we exclude these 10 banking groups and replicate the Tobit
baseline regressions of Table 4. The main results are reported in Table 13. Our results are robust when compared to
the results of Table 4, particularly for the period after the crisis, with the only exception being the US dollar Libor-OIS
spread (LIBOR_OISjt), which is not significant anymore. In addition, we ran two other regressions using dummy
variables that take the value one since Q4 2009 – when the first CoCo bond was issued by Lloyds – respectively
since Q4 2010 (when the Basel III framework was finalized). Our main results do not change (not reported).
Furthermore, we control for extreme values of the banks’ credit ratings variable (RATING_AVit-1), which
range in our sample from very low extreme values (CCC+) to the highest rating possible (AAA), and re-estimate our
Tobit baseline regression of Table 4. The results are reported in Table 14. In Columns (1) and (2), we exclude
observations with a rating below investment grade (0.8% of our left side observations), while in Columns (3) and (4)
we exclude observations below the rating level of A- (5.7% of our left side observations). The excluded observations
correspond to euro area peripheral banks in all cases. The coefficient of RATING_AVit-1 remains positive and
significant for both periods in the Tobit estimations, as in our baseline regression. Moreover, the results for the other
explanatory variables are also similar to our baseline results, with the exception of the CDS spread (not significant
since crisis) and the long-term interest rate (positive and significant for the crisis period). The latter result is similar to
what we found for the regional analysis for the banks headquartered in the core euro area reported and discussed in
section 5.3 (Table 8). This is not surprising, as the extreme rating values that we now excluded were all for euro area
peripheral banks, and consequently the sample of banks that we used for the estimates in Table 14 is much more
biased to banks from the core euro area.
As another robustness test, we investigated the possible existence of selection bias: some banks are
excluded from the sample by self-selection, as they decided not to issue. To test for selection bias, we applied
Heckman’s 2-stage correction (Heckman, 1974, 1976 and 1979). This approach involves a selection equation
considering the portion of the sample that is observed and a regression equation that regresses the outcome
variable (i.e. our main dependent variable TOTAL_ISSUANCEit) on a set of explanatory variables. The selection
equation is defined as a Probit model, where the dependent variable ISSUANCE_OBSERVEDit takes the value 1 if
TOTAL_ISSUANCEit by bank i in quarter t is positive and 0 if it is zero or not available. We use the Probit model to
estimate the following selection equation, using the entire sample:
ISSUANCE_OBSERVEDit = Xt β + ε1t (3)
where Xt is a set of explanatory variables.
The regression equation is defined as follows:
TOTAL_ISSUANCEit = Yt φ + ε2t (4)
where TOTAL_ISSUANCEit is the positive (non-zero) amount of bonds issued by bank i relative to its total assets in
quarter t. Yt is also a set of explanatory variables, but Yt ≠ Xt. Equation (4) is estimated with ordinary least squares
(OLS).
BANCO DE ESPAÑA 28 DOCUMENTO DE TRABAJO N.º 1621
Our analysis suffers from selection bias if the error terms ε1t and ε2t are correlated. We conducted
Heckman’s 2-stage correction for different sets of Yt and Xt. Our test results indicate that we cannot reject the null
hypothesis that the two equations are independent, suggesting that our results are not affected by selection bias.
In our paper we assumed, following the convention in the literature, that the one-quarter lags of the banks’
specific balance sheet variables and ratings are good instruments for bank specific characteristics, which we
consider endogenous.26 Notwithstanding this convention, we conduct additional tests for endogeneity concerns in
section 5.4 based on our OLS estimations. Therefore, in what follows, our results should be compared with our OLS
baseline regressions in Table 4.27 First, we check whether our instruments are both “relevant” and “valid” (Cameron
and Trivedi, 2009). Whereas the first condition is easily testable, the second requires an overidentified model. We find
that one-quarter lags are “relevant” instruments according to pairwise correlations between the endogenous
regressors and the instruments and, more importantly, based on Shea’s partial R2.28 In order to test if
(overidentifying) instruments are “valid”, we include as additional instruments the second quarter lag of the balance
sheet and rating variables. This allows us to test for instruments’ exogeneity with an “overidentifying restriction test”
(in our case, a Hansen-J test) after GMM estimations. For both the pre-crisis and “crisis” period, we do not reject the
null hypothesis that the instruments are valid. Second, we re-estimate our model with two kind of instrumental
variables estimators (2SLS and GMM) for both the overidentified case and the exactly identified case. Overall, our
main conclusions still hold.
26. We also check this empirically and perform a Durbin-Wu-Hausman test (which assumes that the instruments are valid). We reject the null
hypothesis that the variables are exogeneous for both the period before the crisis and the “crisis” period.
27. These are overall very similar to our Tobit results in the same table. 28. According to Baum (2006), the Shea partial R2 is an adequate measure to test the relevance of instruments when more than one endogenous regressor is used, since it “… takes the intercorrelations among the instruments into account” (p.208). We also find that the Sanderson-Windmeijer first-stage chi-squared statistic rejects the null hypothesis of under-identification at at least the 1% significance level.

BANCO DE ESPAÑA 29 DOCUMENTO DE TRABAJO N.º 1621
6 Summary and conclusions
This paper is one of the first to investigate the determinants of bond issuance by European banks. We use a unique
database of around 50,000 bonds, allowing us to differentiate between different types of long-term debt securities.
For example, we obtained data on government guaranteed and retained bonds, which became prominent sources
of funding for many European banks during the 2008-2009 global and 2010-2012 euro area financial crises. Bank
funding dislocations during these two crises were driven by bank-specific characteristics, country-specific
macroeconomic factors and financial market conditions. Our database has been manually cleaned for each bond for
the impact of mergers and acquisitions, and hence we are confident that we able to match each bond with the
characteristics of the correct, actual issuer. Our analysis at the individual bank level allows us to test explicitly a
broad set of hypotheses from both the corporate finance and banking literature on the drivers of bond issuance.
Our findings suggest that “market timing” played a role in the issuance decision prior to the crisis. Banks
were more likely to issue when interest rates were low. This result is in line with recent empirical evidence from the
corporate finance literature on the drivers of bond issuance by non-financial firms. However, “market timing” was no
longer relevant during the crisis years, when access to longer-term funding became more important for European
banks than its cost. We also show that heightened financial market tensions, especially higher stock market volatility,
were detrimental to bond issuance. Moreover, country-risk characteristics became drivers of total bond issuance
during the crisis periods, suggested by the significant and negative sign for the sovereign CDS spread. However,
when we exclude government guaranteed bonds and bonds retained as collateral for central bank liquidity
operations, this spread is no longer significant. In fact, issuance excluding government guaranteed and retained debt
can be explained almost completely by bank-specific characteristics.
Turning to the results for the bank-specific explanatory variables, generally we find strongly significant
coefficients with signs as expected. The positive and significant sign for growth of total assets for the crisis period
supports “leverage” targeting: as short-term wholesale markets essentially closed down during the crisis, the banks
in our sample resorted to long-term debt issuance. Moreover, banks with deposit supply constraints issued more
long-term debt. The positive and significant coefficient for the capital ratio supports the “risk absorption” hypothesis:
larger capital buffers expanded banks’ risk-bearing capacity, and subsequently better capitalised banks were able to
issue more bonds. We also find that higher rated banks were more likely to issue bonds, also during the crisis
period. The latter two results are especially important, as they suggest that financially stronger banks maintained
better access to longer-term funding markets, even during the crises. Hence, even though worse country-risk
characteristics were detrimental to issuance, individual bank performance could mitigate the negative impact of bank
nationality. Moreover, bond issuance is positively and significantly associated with the relative size of banks’ loan
portfolios: as these loans are normally the longer maturity assets on banks’ balance sheets, this result may point at a
certain degree of maturity matching between long-term assets and liabilities.
When distinguishing between secured and unsecured issuance, our results show that stronger banks –
higher rated and stronger capitalised banks – were more likely to issue unsecured debt, supporting the “banking
view of secured debt” hypothesis (Berger and Udell, 1990; Erel et al., 2012). We find the opposite result for the
issuance of secured debt, providing further support for this hypothesis. We also test for the effectiveness of the
ECB’s Covered Bond Purchase Programme. The results show that indeed it promoted the issuance of covered
bonds, but particularly those issued by core euro area countries. When we restrict the sample to unsecured bonds
issued by peripheral banks, our findings indicate that this issuance was negatively associated with funds provided by
the ECB during the crisis years, pointing at a certain degree of substitution between unsecured debt and ECB
liquidity.

BANCO DE ESPAÑA 30 DOCUMENTO DE TRABAJO N.º 1621
We also investigate the drivers of bond issuance by banks from different countries and find that higher
country-risk characteristics reduced the likelihood of issuance by banks from the euro area but not by those from
outside this area (ie UK, SE and CH). We draw two conclusions from this finding. First, the euro area financial crisis
was not affecting just the long-term funding of peripheral banks; also bond issuance by banks from the euro area
core countries was negatively correlated with sovereign tensions. Second, European banks headquartered outside
the euro area were not affected directly by the sovereign turmoil. Issuance of these banks was driven largely by
bank-specific characteristics, such as capital and loan ratios (both positive) and their deposit ratio (negative).
Our results pass a large number of robustness tests. Bond redemptions turn out to be a significant
additional explanatory variable; however, this variable does not affect our baseline results, supporting the robustness
of our findings. Inclusion of the market-to-book ratio does not change our results as well. Also the exclusion of
extreme values for the rating variable and of CoCo bonds from our sample do not materially change our main results.
Our results also pass the Heckman test for selection bias and several tests for endogeneity concerns.
BANCO DE ESPAÑA 31 DOCUMENTO DE TRABAJO N.º 1621
REFERENCES
ACHARYA, V., I. GUJRAL, N. KULKARNI and H. SHIN (2011), “Dividends and bank capital in the financial crisis of 2007-2009”, NBER Working Paper
No.16896.
ACHARYA, V. and A. THAKOR (2012), “The dark side of liquidity creation: leverage and systemic risk”, revised mimeograph, April 9th.
ADRIAN, T. and H. SHIN (2010a), “Liquidity and leverage”, Journal of Financial Intermediation, 19, 418–437.
— (2010b), “The changing nature of financial intermediation and the financial crisis of 2007–2009,” Annual Review of Economics, 2, 603–618.
ADRIAN, T., P. COLLA and H. SHIN (2013), “Which financial frictions? Parsing the evidence from the financial crisis of 2007 to 2009”, in D. Acemoglu, J.
Parker and M. Woodford (eds.), NBER Macroeconomics Annual 2012, Volume 27, 159-214.
ALLEN, F., E. CARLETTI and R. MARQUEZ (2014), “Deposits and bank capital structure”, Wharton Financial Institutions Center Working Paper No.14-08.
ALMAZAN, A., A. MARTÍN-OLIVER and J. SAURINA (2015), “Securitization and banks’ capital structure”, Review of Corporate Finance Studies, 4 (2),
206-238.
ALTUNBAS, Y., L. GAMBACORTA and D. MARQUES-IBANEZ (2014), “Does monetary policy affect bank risk?”, International Journal of Central
Banking, March, 95-135.
ANGUREN-MARTÍN, R., ROMO-GONZÁLEZ, L. and A. VAN RIXTEL (2012), “Evolución reciente de los mercados internacionales de deuda”, Banco de
España, Boletín Económico, February, 83-103 [in Spanish; “The recent evolution in international debt markets”].
ASHCRAFT, A. (2008), “Does the market discipline banks? New evidence from regulatory capital mix”, Journal of Financial Intermediation, 17, 543-561.
AVDJIEV, S., KARTASHEVA, A. and B. BOGDANOVA (2013), “CoCos: a primer”, BIS Quarterly Review, September, 43-56.
BAKER, M. and J. WURGLER (2002), “Market timing and capital structure”, Journal of Finance, 57, 1–32.
BAKER, M., R. GREENWOOD and J. WURGLER (2003), “The maturity of debt issues and predictable variation in bond returns”, Journal of Financial
Economics, 70, 261-291.
BANK, M. and J. LAWRENZ (2013), “Deposit finance as a commitment device and the optimal debt structure of commercial banks”, European
Financial Management, 19, 14-44.
BARCLAY, M. and C. SMITH, JR. (1995a), “The maturity structure of corporate debt”, Journal of Finance, 50, 609–631.
— (1995b), “The priority structure of corporate liabilities”, Journal of Finance, 50, 899-916.
BAUM, C.F. (2006), “An introduction to modern econometrics using Stata”, Stata Press.
BECKER, B. and V. IVASHINA (2014), “Cyclicality of credit supply: firm level evidence”, Journal of Monetary Economics, 62, 76-93.
BEIRNE, J., L. DALITZ, J. EJSING, M. GROTHE, S. MANGANELLI, F. MONAR, B. SAHEL, M. SUŠEC, J. TAPKING and T. VONG (2011), “The impact of the
Eurosystem’s covered bond purchase programme on the primary and secondary markets”, European Central Bank, Occasional Paper Series No.122.
BELTRATTI, A. and R. STULZ (2012), “The credit crisis around the globe: why did some banks perform better?”, Journal of Financial Economics, 105, 1–17.
BERGER, A. and G. UDELL (1990), “Collateral, loan quality and bank risk”, Journal of Monetary Economics, 25, 21–42.
BERGER, A., R. DEYOUNG, M. FLANNERY, D. LEE and Ö. ÖZTEKIN (2008), “How do large banking organisations manage their capital ratios?”, Journal
of Financial Services Research, 34, 123-149.
BERGER, A. and C. BOUWMAN (2009), “Bank liquidity creation”, Review of Financial Studies, 22, 3779-3837.
— 2013), “How does capital affect bank performance during financial crises?”, Journal of Financial Economics, 109, 146–176.
BERKOVITCH, E. and E. KIM (1990), “Financial contracting and leverage induced over- and under-investment incentives”, Journal of Finance, 45, 765–
794.
BILLETT, M., J. GARFINKEL and E. O’NEAL (1998), “The cost of market versus regulatory discipline in banking”, Journal of Financial Economics, 48,
333-358.
BORIO, Z. and H. ZHU (2012), “Capital regulation, risk-taking and monetary policy: a missing link in the transmission mechanism?”, Journal of Financial
Stability, 8, 236-251.
BREWER III, E., G. KAUFMAN and L. WALL (2008), “Bank capital ratios across countries: why do they vary?“, Journal of Financial Services Research,
34, 177-201.
BRUNNERMEIER, M. and M. OEHMKE (2013), “The maturity rat race”, Journal of Finance, 68, 483-521.
CALOMIRIS, C. and C. KAHN (1991), “The role of demandable debt in structuring optimal banking arrangements”, American Economic Review, 81(3),
497-513.
CALOMIRIS, C. and B. WILSON (2004), “Bank capital and portfolio management: the 1930s “capital crunch” and the scramble to shed risk”, Journal of
Business, 77, 421-455.
CAMBA-MENDEZ, G., S. CARBÓ-VALVERDE and D. RODRÍGUEZ-PALENZUELA (2012), “Access to funding by European banks and the financial crisis”,
mimeograph.
CAMERON, A. C. and P. K. TRIVEDI (2009), “Microeconometrics using Stata. Revised edition”, Texas: Stata Press.
CARBÓ-VALVERDE, S., R. ROSEN and F. RODRÍGUEZ-FERNÁNDEZ (2011), “Are covered bonds a substitute for mortgage-backed securities?”,
Federal Reserve Bank of Chicago, Working Paper No.2011-14.
CARUANA, J. and A. VAN RIXTEL (2012), “International financial markets and bank funding in the euro area: dynamics and participants", originally
published in Economistas, December 2012.
CORNETT, M., J. MCNUTT, P. STRAHAN and H. TEHRANIAN (2011), “Liquidity risk management and credit supply in the financial crisis”, Journal of
Financial Economics, 101, 297–312.
COVITZ, D. and P. HARRISON (2004), “Do banks time bond issuance to trigger disclosure, due diligence, and investor scrutiny?”, Journal of Financial
Intermediation, 13, 299–232.
COVITZ, D., D. HANCOCK and M. KWAST (2004), “A reconsideration of the risk sensitivity of U.S. banking organization subordinated debt spreads: a
sample selection approach”, Federal Reserve Bank of New York, Economic Policy Review, September, 73-92.
CUSTÓDIO, C., M. FERREIRA and L. LAUREANO (2013), “Why are US firms using more short-term debt?”, Journal of Financial Economics, 108, 182-212.
DAMAR, H., C. MEH and Y. TERAJIMA (2013), “Leverage, balance-sheet size and wholesale funding”, Journal of Financial Intermediation, 22, 639–662.
DANG, T., G. GORTON, B. HOLMSTRÖM and G. ORDOÑEZ (2014), “Banks as secret keepers”, NBER Working Paper No.20255.
DELL’ARICCIA, G. and R. MARQUEZ (2013), “Interest rates and the bank risk-taking channel”, Annual Review of Financial Economics, 5, 123-141.
BANCO DE ESPAÑA 32 DOCUMENTO DE TRABAJO N.º 1621
DEMIRGÜÇ-KUNT, A. and H. HUIZINGA (2010), “Bank activity and funding strategies: the impact on risk and returns”, Journal of Financial Economics,
98, 626–650.
DIAMOND, D. (1991a), “Monitoring and reputation: the choice between bank loans and directly placed debt”, Journal of Political Economy, 99, 689–721.
— (1991b), “Debt maturity structure and liquidity risk”, Quarterly Journal of Economics, 106, 709-737.
DIAMOND, D. and R. RAJAN, R. (2000), “A theory of bank capital”, Journal of Finance, 55, 2431–2465.
— (2001), “Liquidity risk, liquidity creation and financial fragility: a theory of banking”, Journal of Political Economy, 109(2), 287-327.
DOUKAS, J., J. GUO and B. ZHOU (2011), “’Hot’ debt markets and capital structure”, European Financial Management, 17, 46-99.
EISENBACH, T., T. KEISTER, J. MCANDREWS and T. YORULMAZER (2014), “Stability of funding models: an analytical framework“, Federal Reserve
Bank of New York, Economic Policy Review, 29-47.
EREL, I., B. JULIO, W. KIM and M. WEISBACH (2012), “Macroeconomic conditions and capital raising”, The Review of Financial Studies, 25, 341-376.
EUROPEAN CENTRAL BANK (2012), Changes in bank financing patterns, April.
EVANOFF, D., J. JAGTIANI and T. NAKATA (2011), “Enhancing market discipline in banking: the role of subordinated debt in financial reform”, Journal
of Economics and Business, 63,
FEDERAL RESERVE BANK OF NEW YORK (2014), “Special Issue: the stability of funding models”, Economic Policy Review, 20, February.
FLANNERY, M. (1986), “Asymmetric information and risky debt maturity choice”, Journal of Finance, 41, 18-38.
— (1994), “Debt maturity and the deadweight cost of leverage: optimally financing banking firms”, American Economic Review, 84(1), 320-331.
FLANNERY, M. and K. RANGAN (2006), “Partial adjustment toward target capital structures”, Journal of Financial Economics, 79, 469–506.
GOMES, A. and G. PHILIPS (2012), “Why do public firms issue private and public securities?”, Journal of Financial Intermediation, 21, 619-658.
GORTON, G. and G. PENNACCHI (1990), “Financial intermediaries and liquidity creation,” Journal of Finance, 45, 49–71.
GORTON, G. and A. WINTON (2003), “Financial intermediation”, in G. Constantinides, M. Harris and R. Stulz (eds.), Handbook of the Economics of
Finance, Volume 1A – Corporate Finance, 431-552.
GRAHAM, J. and C. HARVEY (2001), “The theory and practice of corporate finance: evidence from the field”, Journal of Financial Economics, 60, 187–243.
GROPP, R. and F. HEIDER (2010), “The determinants of bank capital structure”, Review of Finance, 14, 587-622.
GUEDES, J. and T. OPLER (1996), “The determinants of the maturity of corporate debt issues”, Journal of Finance, 51, 1809-1833.
HECKEMEYER, J. and R. DE MOOIJ (2013), “Taxation and corporate debt: are banks any different?”, IMF Working Paper No.WP/13/221.
HECKMAN, J. (1974), “Shadow wages, market wages and labour supply”, Econometrica, 42, 679–693.
HECKMAN, J. (1976), “The common structure of statistical models of truncation, sample selection and limited dependent variables and a simple
estimator for such models”, Annals of Economic and Social Measurement, 5, 475–492.
— (1979), “Sample selection bias as a specification error”, Econometrica, 47, 153–161.
HÜFNER, F. (2010), “The German banking system: lessons from the financial crisis”, OECD, Economics Department Working Papers No.788.
JENSEN, M. and W. MECKLING (1976), “Theory of the firm: managerial behaviour, agency costs, and ownership structure”, Journal of Financial
Economics, 3, 305-360.
KALEMLI-OZCAN, S., B. SORENSEN and S. YESILTAS (2012), “Leverage across firms, banks and countries”, Journal of International Economics, 88,
284-298.
KANE, A., A. MARCUS and R. MCDONALD (1985), “Debt policy and the rate of return premium to leverage”, Journal of Financial and Quantitative
Analysis, 20, 479-499.
KEEN, M. and R. DE MOOIJ (2012), “Debt, taxes, and banks”, IMF Working Paper No.WP/12/48.
KORAJCZYK, R. and A. LEVY (2003), “Capital structure choice: macroeconomic conditions and financial constraints”, Journal of Financial Economics,
68, 75-109.
KRAHNEN, J.-P. and R. SCHMIDT (2004), The German Financial System, Oxford: Oxford University Press.
KRISHNASWAMI, S., P. SPINDT and V. SUBRAMANIAM (1999), “Information asymmetry, monitoring, and the placement structure of corporate debt”,
Journal of Financial Economics, 51, 407-434.
LEMMON, M., M. ROBERTS and J. ZENDER (2008), “Back to the beginning: persistence and the cross-section of corporate capital structure”, Journal
of Finance, 63, 1575-1608.
MARSH, P. (1982), “The choice between equity and debt: an empirical study”, Journal of Finance, 37, 121–144.
MCDONALD, J. and R. MOFFIT (1980), “The uses of Tobit analysis”, Review of Economics and Statistics, 62, 318-321.
MORRIS, S. and H. SHIN (2009), “Illiquidity component of credit risk”, mimeograph, September.
MORGAN, D. (2002), “Rating banks: risk and uncertainty in an opaque industry”, American Economic Review, 92, 874-888.
MULLER, P., S. DEVNANI and R. FLYTKJAER (2011), “The impact of state guarantees on banks’ debt issuing costs, lending and funding policy”,
European Commission Economic Papers, No.447.
MYERS, S. (1977), “Determinants of corporate borrowing”, Journal of Financial Economics, 5, 147-175.
MYERS, S. and N. MAJLUF (1984), “Corporate financing and investment decisions when firms have information that investors do not have”, Journal of
Financial Economics, 13, 187-221.
PANETTA, F., T. FAEH, G. GRANDE, C. HO, M. KING, A. LEVY, F. SIGNORETTI, M. TABOGA and A. ZAGHINI (2009), “An assessment of financial
sector rescue programmes”, BIS Papers No.48.
RIXTEL, A. VAN and G. GASPERINI (2013), “Financial crises and bank funding: recent experience in the euro area”, BIS Working Papers No.406.
RIXTEL, A. VAN, L. ROMO GONZÁLEZ and J. YANG (2015), “The determinants of long-term debt issuance by European banks: Evidence of two
crises”, BIS Working Papers No.513.
ROMO-GONZÁLEZ, L. and A. VAN RIXTEL (2011), “Non-enhanced debt financing by euro area banks under severe financial stress”, Banco de
España, Financial Stability Journal, 20, 95-117.
ROSE, A. and T. WIELADEK (2012), “Too big to fail: Some empirical evidence on the causes and consequences of public banking interventions in the
UK”, Journal of International Money and Finance, 31, 2038-2051.
STOHS, M. and D. MAUER (1996), “The determinants of corporate debt maturity structure”, Journal of Business, 69, 279–312.
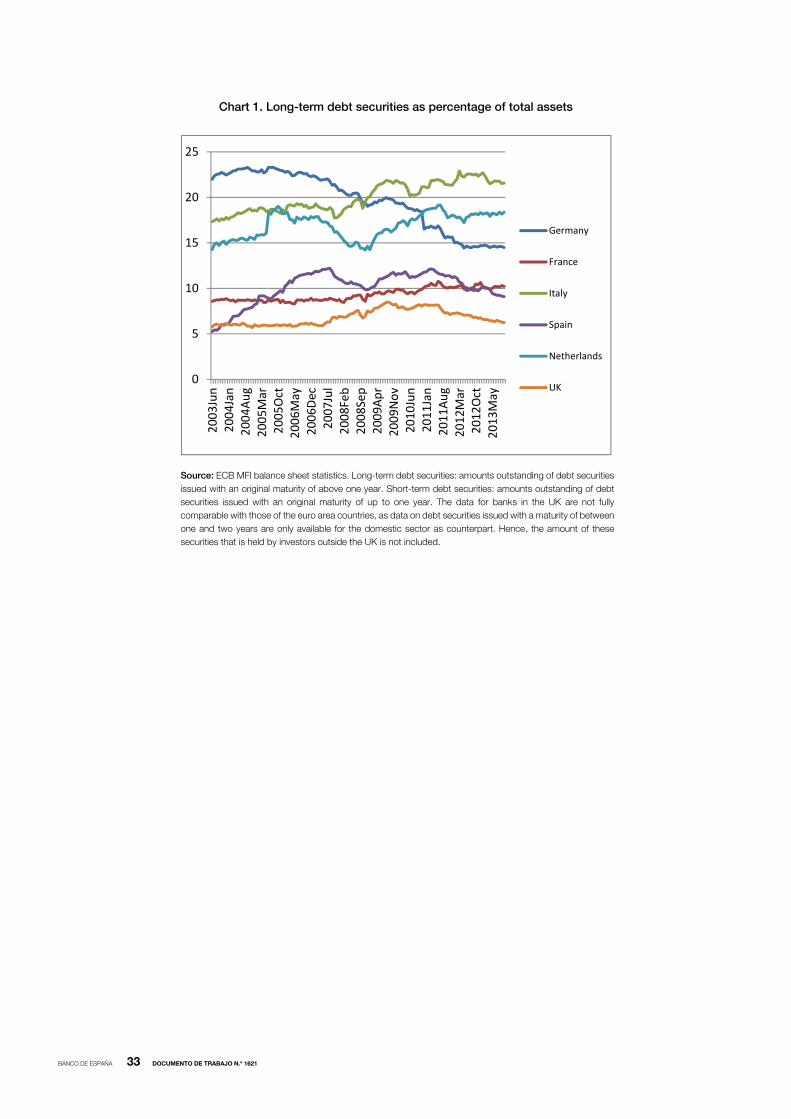
BANCO DE ESPAÑA 33 DOCUMENTO DE TRABAJO N.º 1621
Chart 1. Long-term debt securities as percentage of total assets
Source: ECB MFI balance sheet statistics. Long-term debt securities: amounts outstanding of debt securities
issued with an original maturity of above one year. Short-term debt securities: amounts outstanding of debt
securities issued with an original maturity of up to one year. The data for banks in the UK are not fully
comparable with those of the euro area countries, as data on debt securities issued with a maturity of between
one and two years are only available for the domestic sector as counterpart. Hence, the amount of these
securities that is held by investors outside the UK is not included.
0
5
10
15
20
25
2003Jun
2004Jan
2004Aug
2005Mar
2005Oct
2006May
2006Dec
2007Jul
2008Feb
2008Sep
2009Apr
2009Nov
2010Jun
2011Jan
2011Aug
2012Mar
2012Oct
2013May
Germany
France
Italy
Spain
Netherlands
UK

BANCO DE ESPAÑA 34 DOCUMENTO DE TRABAJO N.º 1621
Chart 2. Sample - Number of banks per country
Germany (19)
France (7)
Italy (5)
Austria (5)
The Netherlands (5)
Spain (2)
Belgium (2)
Greece (1)
Ireland (1)
Luxembourg (1)
Portugal (2)
United Kingdom (7)
Sweden (4)
Switzerland (2)

BANCO DE ESPAÑA 35 DOCUMENTO DE TRABAJO N.º 1621
Chart 3. European banks’ bond issuance 1999-201329
29. Based on the 63 banks in our sample.
0
50,000
100,000
150,000
200,000
250,000
300,000
1999-1
1999-3
2000-1
2000-3
2001-1
2001-3
2002-1
2002-3
2003-1
2003-3
2004-1
2004-3
2005-1
2005-3
2006-1
2006-3
2007-1
2007-3
2008-1
2008-3
2009-1
2009-3
2010-1
2010-3
2011-1
2011-3
2012-1
2012-3
2013-1
AUSTRIA BELGIUM FRANCEGERMANY GREECE ITALYIRELAND LUXEMBOURG NETHERLANDSPORTUGAL SPAIN SWEDENSWITZERLAND UNITED KINGDOM
mill EUR Amounts issued by country

BANCO DE ESPAÑA 36 DOCUMENTO DE TRABAJO N.º 1621
Chart 4. Number of banks not issuing in quarter t
0
2
4
6
8
10
12
14
16

BANCO DE ESPAÑA 37 DOCUMENTO DE TRABAJO N.º 1621
Chart 5. Government guaranteed and retained issuance
Panel A
(a) Only one bond from Alpha Bank was simultaneously both retained and government guaranteed.
Panel B
0
50,000
100,000
150,000
200,000
250,000
300,000
2005
-1
2005
-3
2006
-1
2006
-3
2007
-1
2007
-3
2008
-1
2008
-3
2009
-1
2009
-3
2010
-1
2010
-3
2011
-1
2011
-3
2012
-1
2012
-3
2013
-1
OTHER BONDS
GOVERNMENT GUARANTEED BONDS
RETAINED BONDS
mill EUR Amounts issued: Retained and Government guaranteed bonds (a)
0
10,000
20,000
30,000
40,000
50,000
60,000
2007
-120
07-2
2007
-320
07-4
2008
-120
08-2
2008
-320
08-4
2009
-120
09-2
2009
-320
09-4
2010
-120
10-2
2010
-320
10-4
2011
-120
11-2
2011
-320
11-4
2012
-120
12-2
2012
-320
12-4
2013
-1
AUSTRIA BELGIUM FRANCEGERMANY GREECE ITALYIRELAND LUXEMBOURG NETHERLANDSPORTUGAL SPAIN SWEDENSWITZERLAND UNITED KINGDOM
mill EUR Amounts retained by country

BANCO DE ESPAÑA 38 DOCUMENTO DE TRABAJO N.º 1621
Table 1. Summary literature on the determinants of banks’ debt issuance
Variable Theory Explanation Expected sign
Panel A: Bank-specific
Deposits Agency costs and asymmetric information (Gorton and Pennacchi, 1990; Calomiris and Kahn, 1991); liquidity needs (Diamond and Rajan, 2001); commitment device (Bank and Lawrenz, 2013).
Banks issue deposits as a device to resolve agency costs and asymmetric information problems (market discipline) and hence have lower need to issue bonds. Banks issue debt to overcome deposit supply constraints.
Negative
Bank performance (profitability and dividends)
Agency costs and asymmetric information (Gropp and Heider, 2010). More profitable and dividend-paying banks have more equity, i.e. issue less debt. Negative
Market-to-book ratio Agency costs and asymmetric information (Gropp and Heider, 2010). Banks with high market-to-book ratios have more equity, i.e. issue less debt. Negative
Bank performance (as measured by rating migrations and (abnormal) equity returns)
Information revelation (Covitz and Harrison, 2004). Banks issue bonds to convey positive information to markets. Positive
Size (total assets and growth total assets) Leverage targeting (Adrian and Shin, 2010a; Acharya et al., 2011; Damar et al., 2013; Berger et al., 2008; Gropp and Heider, 2010); agency costs and asymmetric information.
Leverage targeting banks grow by expanding debt (and hence issue long-term debt, in addition to short-term debt). Larger banks are less prone to agency conflicts and asymmetric information and hence issue long-term debt.
Positive
Bank risk proxies, including credit ratings Leverage targeting (see above); market discipline (Covitz et al., 2004).
More risky banks have lower leverage and lower recourse to debt issuance, especially during periods of economic and financial stress.
Negative with risk (positive with rating strength)
“Roll-over” ratio of debt “Roll-over” channel of debt (Morris and Shin, 2009; Admati and Hellwig, 2013)
Investors’ willingness to roll over debt provides market discipline. Positive
Equity capital Risk absorption hypothesis (Berger and Bouwman, 2009 and 2013) Better capitalised banks (based on book value of equity) issue more debt. Positive
Corporate tax rate Tax benefits of debt (Keen and de Mooij, 2012; Heckemeyer and de Mooij, 2013)
Tax benefits of debt are associated with higher bank leverage. Positive
Panel B: Macroeconomic and financial market conditions
GDP/unemployment/ Covitz et al. (2004) Worse economic conditions are associated with lower debt issuance. Negative
Stock market volatility Covitz et al. (2004); Camba-Mendez et al. (2012). Higher volatility is associated with lower debt issuance. Negative
Country-specific risk factors Caruana and Van Rixtel (2012); Van Rixtel and Gasperini (2013). Country-specific risk factors become more important drivers of banks’ bond issuance during financial crisis than bank-specific factors.
Negative
Monetary policy stance (policy rate, central bank balance sheet)
Risk-taking channel (Rajan, 2005; Borio and Zhu, 2012; Dell’Ariccia and Marquez, 2013; Altunbas et al., 2014); “Market timing”.
Banks may be incentivised to take on more risk through excessive leverage when interest rates are low. Lower policy rate may spill over to other interest rates, lowering financing costs and increasing bond issuance (“timing”).
Policy rate negative; balance sheet positive.
Interest rate and term spread “Market timing” (Marsh, 1982; Doukas et al., 2011) Banks issue bonds when interest rates are low or expected to rise. Negative

BANCO DE ESPAÑA 39 DOCUMENTO DE TRABAJO N.º 1621
Table 2. Summary statistics
Panel A: Dependent variable: Bond issuance divided by total assets.
Variable Mean Std. dev. Min Max
Before crisis (Q1 2005 – Q3 2007)
TOTAL_ISSUANCE 0.0106 0.0160 0 0.1886
SECURED_ISSUANCE 0.0045 0.0093 0 0.1047
UNSECURED ISSUANCE 0.0061 0.0136 0 0.1886
COV_BONDS 0.0034 0.0076 0 0.0825
GOV_GUAR 0.0011 0.0057 0 0.1047
Since crisis (Q4 2007 – Q1 2013)
TOTAL_ISSUANCE 0.0070 0.010 0 0.1054
SECURED_ISSUANCE 0.0040 0.0083 0 0.1054
UNSECURED_ISSUANCE 0.0030 0.0057 0 0.0671
COV_BONDS 0.0029 0.0064 0 0.0615
GOV_GUAR 0.0011 0.0054 0 0.1054
Panel B: Explanatory variables
Variable Mean Std. dev. Min Max
Total assets (m€) 489,999 543,572 5,545 2,586,700
K_TAit (capital ratio) 0.04 0.02 0 0.15
D_TAit (deposits ratio) 0.32 0.14 0.00 0.82
L_TAit (loan ratio) 0.49 0.16 0.08 0.98
RATING_AVit 16.1 1.7 4 20
LRjt (in %) 3.6 1.8 0.5 36.6
TERM_SPREADjt (in %) 1.6 1.8 -4.7 34.6
GDPjt (in %) 1.10 2.8 -9.0 8.2
VOLt (volatility) 24.3 9.1 12.8 50.0
LIBOR_OISt (basis points) 34.8 33.6 2.2 186.8
CDS_SOVjt (in %) 1 5 0 200

BANCO DE ESPAÑA 40 DOCUMENTO DE TRABAJO N.º 1621
Table 3. Summary list of dependent and independent variables
Period Q1 2005 – Q1 2013
Dependent variables TOTAL_ISSUANCEit Total amount of bonds issued by bank i in quarter t, scaled by its total assets
SECURED_ISSUANCEit Total amount of secured bonds (covered plus government guaranteed) issued by bank i in quarter t, scaled by its total assets
UNSECURED_ISSUANCEit Total amount of unsecured bonds issued by bank i in quarter t, scaled by its total assets
COV_BONDSit Total amount of covered bonds issued by bank i in quarter t, scaled by its total assets
GOV_GUARit Total amount of guaranteed bonds issued by bank i in quarter t, scaled by its total assets
Explanatory variables GR_TAit-1 Quarterly increase in total assets of bank i, scaled by total assets
K_TAit-1 Ratio of total equity to total assets of bank i in quarter t-1
L_TAit-1 Ratio of total loans to total assets of bank i in quarter t-1
D_TAit-1 Ratio of total customer deposits to total assets of bank i in quarter t-1
MTBit-1 Ratio of the market to book value of bank i in quarter t-1.
REDEMPTIONSit Approximated amount of bond redemptions by bank i in quarter t, scaled by total assets.
RATING_AVit-1 Average of the stand-alone ratings published by Fitch, Moody’s and S&P for bank i in quarter t-1
TERM_SPREADjt 10-y govt bond yield – 3-m govt bill rate for country j in quarter t
LRjt 10-y govt bond yield for country j in quarter t
CB_RATEjt Policy rate central bank responsible for monetary policy in country j in quarter t
CB_BSjt Balance sheet central bank responsible for monetary policy in country j in quarter t
CBPPt Dummy for Covered Bond Purchase Programme ECB in quarter t
GDPjt Percentage change in real GDP of country j in quarter t
CDS_SOVjt Sovereign CDS spread country j in quarter t
LIBOR_OISjt US dollar Libor-OIS spread in quarter t
VOLt Implied stock market volatility (VSTOXX) in quarter t
ECB_liquidityjt ECB lending related to monetary policy operations to credit institutions in country j in quarter t (section 5.4)

BANCO DE ESPAÑA 41 DOCUMENTO DE TRABAJO N.º 1621
Robust standard errors in parentheses. *** p<0.01, ** p<0.05, * p<0.1. Suffix i refers to bank i, suffix j to country j. Country j is the country where
the HQ of bank i is located.
Table 4. General results
(1) (2) (3) (4)
Variables TOTAL_ISSUANCEit TOTAL_ISSUANCEit TOTAL_ISSUANCEit TOTAL_ISSUANCEit
OLS OLS Tobit Tobit
Before crisis Since crisis Before crisis Since crisis
GR_TAit-1 -0.0063* 0.0110*** -0.0058 0.0110*
(0.0035) (0.0041) (0.0094) (0.0057)
K_TAit-1 0.1043* 0.1009*** 0.1083** 0.1123***
(0.0556) (0.0375) (0.0438) (0.0257)
D_TAit-1 -0.0365*** -0.0251*** -0.0366*** -0.0245***
(0.0070) (0.0046) (0.0059) (0.0031)
L_TAit-1 0.0208*** 0.0326*** 0.0216*** 0.0329***
(0.0053) (0.0032) (0.0050) (0.0025)
RATING_AVit-1 0.0008 0.0007** 0.0010* 0.0009***
(0.0008) (0.0004) (0.0005) (0.0003)
LRjt -0.0101*** -0.0001 -0.0099*** -0.0001
(0.0032) (0.0005) (0.0030) (0.0003)
GDPjt -0.0007 -0.0005** -0.0007 -0.0005***
(0.0009) (0.0002) (0.0007) (0.0002)
VOLt -0.0004*** -0.0001** -0.0004* -0.0001**
(0.0002) (0.0001) (0.0002) (0.0001)
LIBOR_OISjt -0.0001** 0.0000* -0.0001** 0.0000**
(0.0000) (0.0000) (0.0000) (0.0000)
CDS_SOVjt -0.7010 -0.0231 -1.1857 -0.0281*
(3.4751) (0.0172) (4.0030) (0.0166)
Constant 0.0445*** -0.0174*** 0.0395*** -0.0213***
(0.0172) (0.0065) (0.0145) (0.0061)
Country dummies Yes Yes Yes Yes
Year dummies Yes Yes Yes Yes
Observations 596 1,031 596 1,031
R-squared 0.2520 0.2918
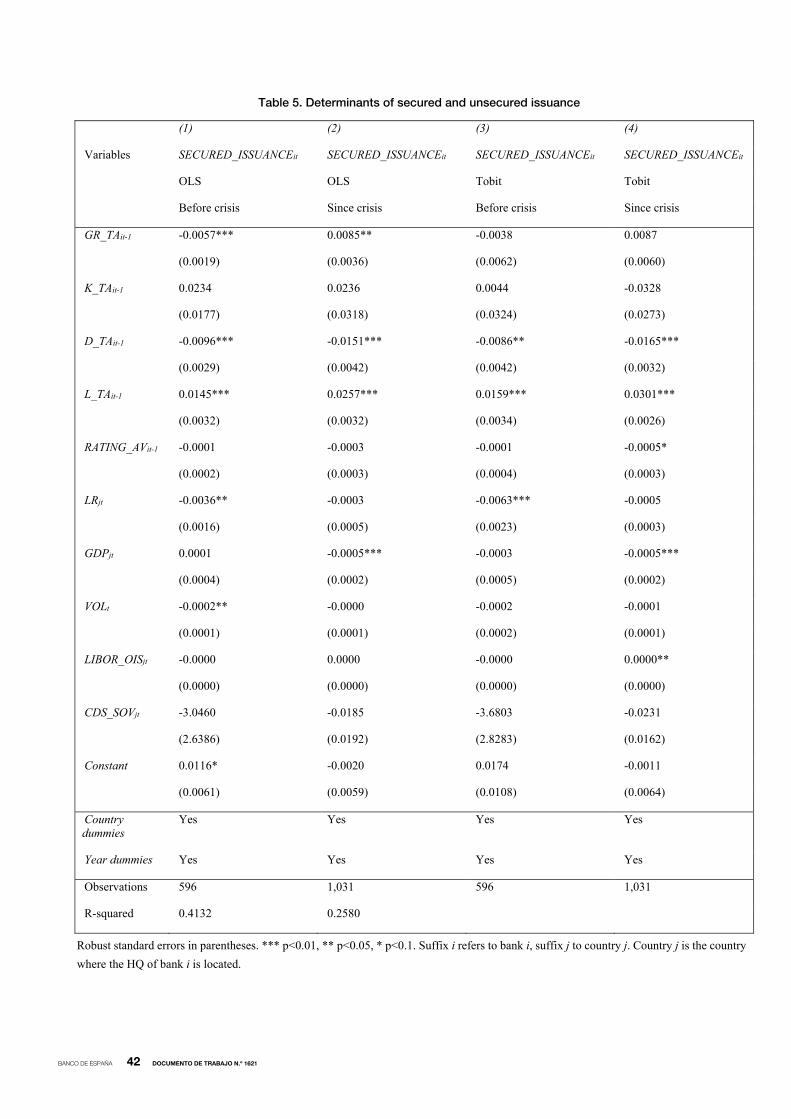
BANCO DE ESPAÑA 42 DOCUMENTO DE TRABAJO N.º 1621
Table 5. Determinants of secured and unsecured issuance
(1) (2) (3) (4)
Variables SECURED_ISSUANCEit SECURED_ISSUANCEit SECURED_ISSUANCEit SECURED_ISSUANCEit
OLS OLS Tobit Tobit
Before crisis Since crisis Before crisis Since crisis
GR_TAit-1 -0.0057*** 0.0085** -0.0038 0.0087
(0.0019) (0.0036) (0.0062) (0.0060)
K_TAit-1 0.0234 0.0236 0.0044 -0.0328
(0.0177) (0.0318) (0.0324) (0.0273)
D_TAit-1 -0.0096*** -0.0151*** -0.0086** -0.0165***
(0.0029) (0.0042) (0.0042) (0.0032)
L_TAit-1 0.0145*** 0.0257*** 0.0159*** 0.0301***
(0.0032) (0.0032) (0.0034) (0.0026)
RATING_AVit-1 -0.0001 -0.0003 -0.0001 -0.0005*
(0.0002) (0.0003) (0.0004) (0.0003)
LRjt -0.0036** -0.0003 -0.0063*** -0.0005
(0.0016) (0.0005) (0.0023) (0.0003)
GDPjt 0.0001 -0.0005*** -0.0003 -0.0005***
(0.0004) (0.0002) (0.0005) (0.0002)
VOLt -0.0002** -0.0000 -0.0002 -0.0001
(0.0001) (0.0001) (0.0002) (0.0001)
LIBOR_OISjt -0.0000 0.0000 -0.0000 0.0000**
(0.0000) (0.0000) (0.0000) (0.0000)
CDS_SOVjt -3.0460 -0.0185 -3.6803 -0.0231
(2.6386) (0.0192) (2.8283) (0.0162)
Constant 0.0116* -0.0020 0.0174 -0.0011
(0.0061) (0.0059) (0.0108) (0.0064)
Country dummies
Yes Yes Yes Yes
Year dummies Yes Yes Yes Yes
Observations 596 1,031 596 1,031
R-squared 0.4132 0.2580
Robust standard errors in parentheses. *** p<0.01, ** p<0.05, * p<0.1. Suffix i refers to bank i, suffix j to country j. Country j is the country
where the HQ of bank i is located.

BANCO DE ESPAÑA 43 DOCUMENTO DE TRABAJO N.º 1621
Continuation Table 5
Robust standard errors in parentheses. *** p<0.01, ** p<0.05, * p<0.1. Suffix i refers to bank i, suffix j to country j. Country j is the country
where the HQ of bank i is located.
(5) (6) (7) (8)
Variables UNSECURED_ISSUANCEit UNSECURED_ISSUANCEit UNSECURED_ISSUANCEit UNSECURED_ISSUANCEit
OLS OLS Tobit Tobit
Before crisis Since crisis Before crisis Since crisis
GR_TAit-1 -0.0006 0.0026 0.0033 0.0014
(0.0030) (0.0032) (0.0091) (0.0039)
K_TAit-1 0.0809 0.0773*** 0.0902** 0.0877***
(0.0540) (0.0241) (0.0422) (0.0174)
D_TAit-1 -0.0269*** -0.0100*** -0.0263*** -0.0086***
(0.0066) (0.0028) (0.0057) (0.0020)
L_TAit-1 0.0062 0.0069*** 0.0054 0.0067***
(0.0043) (0.0017) (0.0049) (0.0017)
RATING_AVit-1 0.0008 0.0011*** 0.0013*** 0.0014***
(0.0007) (0.0002) (0.0005) (0.0002)
LRjt -0.0065** 0.0002 -0.0069** 0.0003
(0.0029) (0.0001) (0.0029) (0.0003)
GDPjt -0.0008 -0.0001 -0.0008 -0.0001
(0.0009) (0.0001) (0.0007) (0.0001)
VOLt -0.0002 -0.0001*** -0.0003 -0.0001**
(0.0002) (0.0000) (0.0002) (0.0000)
LIBOR_OISjt -0.0001** 0.0000 -0.0001** 0.0000
(0.0000) (0.0000) (0.0000) (0.0000)
CDS_SOVjt 2.3449 -0.0046 2.2174 -0.0480*
(2.3188) (0.0042) (3.8518) (0.0282)
Constant 0.0329** -0.0154*** 0.0254* -0.0221***
(0.0164) (0.0039) (0.0141) (0.0042)
Country dummies
Yes Yes Yes Yes
Year dummies Yes Yes Yes Yes
Observations 596 1,031 596 1,031
R-squared 0.1908 0.2182
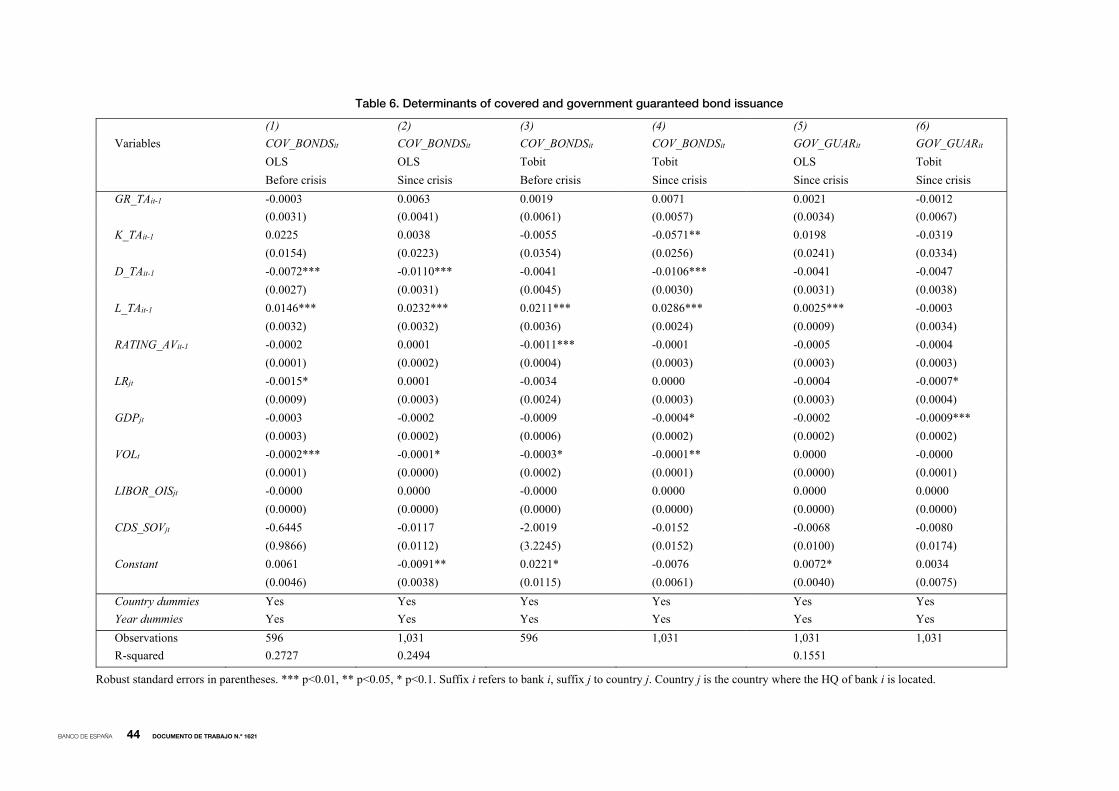
BANCO DE ESPAÑA 44 DOCUMENTO DE TRABAJO N.º 1621
Table 6. Determinants of covered and government guaranteed bond issuance
(1) (2) (3) (4) (5) (6)
Variables COV_BONDSit COV_BONDSit COV_BONDSit COV_BONDSit GOV_GUARit GOV_GUARit
OLS OLS Tobit Tobit OLS Tobit
Before crisis Since crisis Before crisis Since crisis Since crisis Since crisis
GR_TAit-1 -0.0003 0.0063 0.0019 0.0071 0.0021 -0.0012
(0.0031) (0.0041) (0.0061) (0.0057) (0.0034) (0.0067)
K_TAit-1 0.0225 0.0038 -0.0055 -0.0571** 0.0198 -0.0319
(0.0154) (0.0223) (0.0354) (0.0256) (0.0241) (0.0334)
D_TAit-1 -0.0072*** -0.0110*** -0.0041 -0.0106*** -0.0041 -0.0047
(0.0027) (0.0031) (0.0045) (0.0030) (0.0031) (0.0038)
L_TAit-1 0.0146*** 0.0232*** 0.0211*** 0.0286*** 0.0025*** -0.0003
(0.0032) (0.0032) (0.0036) (0.0024) (0.0009) (0.0034)
RATING_AVit-1 -0.0002 0.0001 -0.0011*** -0.0001 -0.0005 -0.0004
(0.0001) (0.0002) (0.0004) (0.0003) (0.0003) (0.0003)
LRjt -0.0015* 0.0001 -0.0034 0.0000 -0.0004 -0.0007*
(0.0009) (0.0003) (0.0024) (0.0003) (0.0003) (0.0004)
GDPjt -0.0003 -0.0002 -0.0009 -0.0004* -0.0002 -0.0009***
(0.0003) (0.0002) (0.0006) (0.0002) (0.0002) (0.0002)
VOLt -0.0002*** -0.0001* -0.0003* -0.0001** 0.0000 -0.0000
(0.0001) (0.0000) (0.0002) (0.0001) (0.0000) (0.0001)
LIBOR_OISjt -0.0000 0.0000 -0.0000 0.0000 0.0000 0.0000
(0.0000) (0.0000) (0.0000) (0.0000) (0.0000) (0.0000)
CDS_SOVjt -0.6445 -0.0117 -2.0019 -0.0152 -0.0068 -0.0080
(0.9866) (0.0112) (3.2245) (0.0152) (0.0100) (0.0174)
Constant 0.0061 -0.0091** 0.0221* -0.0076 0.0072* 0.0034
(0.0046) (0.0038) (0.0115) (0.0061) (0.0040) (0.0075)
Country dummies Yes Yes Yes Yes Yes Yes
Year dummies Yes Yes Yes Yes Yes Yes
Observations 596 1,031 596 1,031 1,031 1,031
R-squared 0.2727 0.2494 0.1551
Robust standard errors in parentheses. *** p<0.01, ** p<0.05, * p<0.1. Suffix i refers to bank i, suffix j to country j. Country j is the country where the HQ of bank i is located.
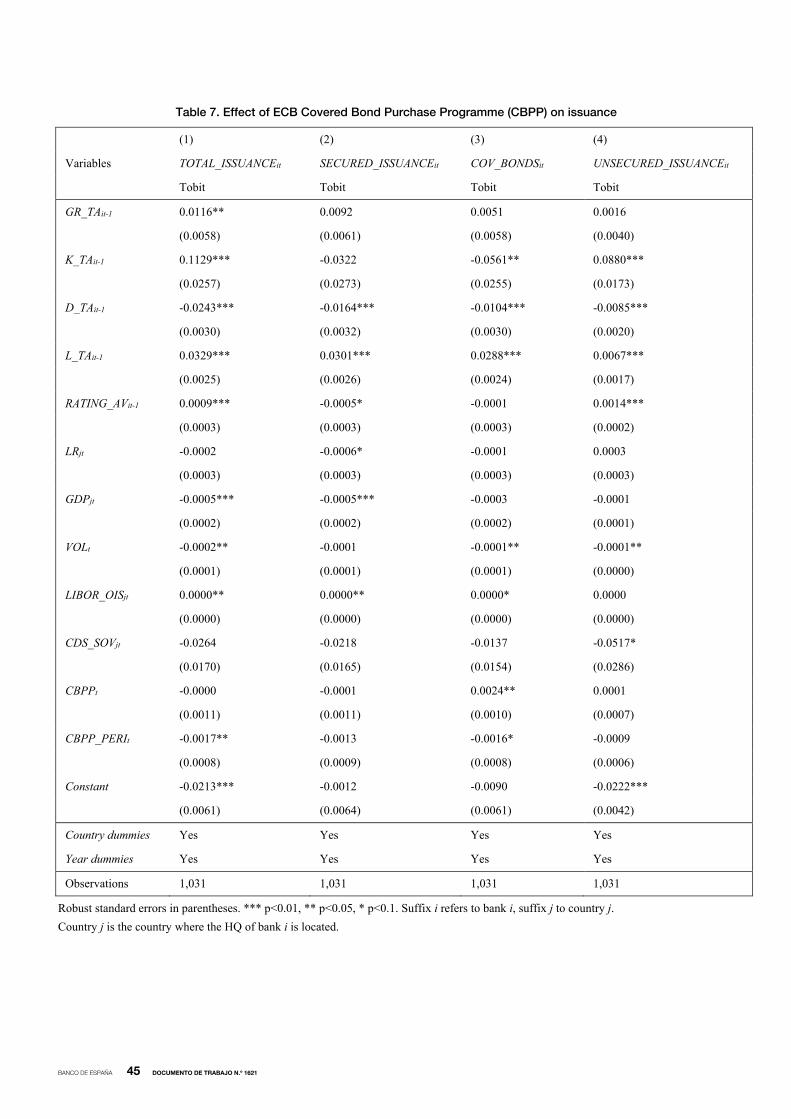
BANCO DE ESPAÑA 45 DOCUMENTO DE TRABAJO N.º 1621
Table 7. Effect of ECB Covered Bond Purchase Programme (CBPP) on issuance
(1) (2) (3) (4)
Variables TOTAL_ISSUANCEit SECURED_ISSUANCEit COV_BONDSit UNSECURED_ISSUANCEit
Tobit Tobit Tobit Tobit
GR_TAit-1 0.0116** 0.0092 0.0051 0.0016
(0.0058) (0.0061) (0.0058) (0.0040)
K_TAit-1 0.1129*** -0.0322 -0.0561** 0.0880***
(0.0257) (0.0273) (0.0255) (0.0173)
D_TAit-1 -0.0243*** -0.0164*** -0.0104*** -0.0085***
(0.0030) (0.0032) (0.0030) (0.0020)
L_TAit-1 0.0329*** 0.0301*** 0.0288*** 0.0067***
(0.0025) (0.0026) (0.0024) (0.0017)
RATING_AVit-1 0.0009*** -0.0005* -0.0001 0.0014***
(0.0003) (0.0003) (0.0003) (0.0002)
LRjt -0.0002 -0.0006* -0.0001 0.0003
(0.0003) (0.0003) (0.0003) (0.0003)
GDPjt -0.0005*** -0.0005*** -0.0003 -0.0001
(0.0002) (0.0002) (0.0002) (0.0001)
VOLt -0.0002** -0.0001 -0.0001** -0.0001**
(0.0001) (0.0001) (0.0001) (0.0000)
LIBOR_OISjt 0.0000** 0.0000** 0.0000* 0.0000
(0.0000) (0.0000) (0.0000) (0.0000)
CDS_SOVjt -0.0264 -0.0218 -0.0137 -0.0517*
(0.0170) (0.0165) (0.0154) (0.0286)
CBPPt -0.0000 -0.0001 0.0024** 0.0001
(0.0011) (0.0011) (0.0010) (0.0007)
CBPP_PERIt -0.0017** -0.0013 -0.0016* -0.0009
(0.0008) (0.0009) (0.0008) (0.0006)
Constant -0.0213*** -0.0012 -0.0090 -0.0222***
(0.0061) (0.0064) (0.0061) (0.0042)
Country dummies Yes Yes Yes Yes
Year dummies Yes Yes Yes Yes
Observations 1,031 1,031 1,031 1,031
Robust standard errors in parentheses. *** p<0.01, ** p<0.05, * p<0.1. Suffix i refers to bank i, suffix j to country j.
Country j is the country where the HQ of bank i is located.
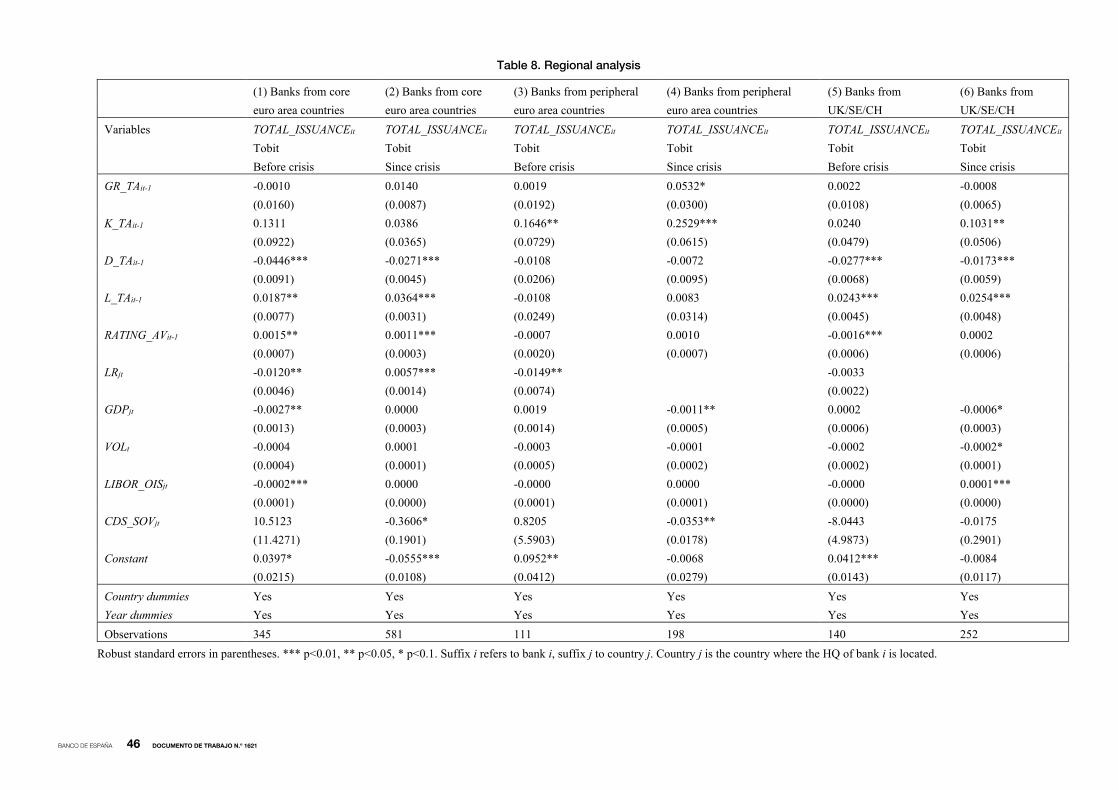
BANCO DE ESPAÑA 46 DOCUMENTO DE TRABAJO N.º 1621
Table 8. Regional analysis
(1) Banks from core (2) Banks from core (3) Banks from peripheral (4) Banks from peripheral (5) Banks from (6) Banks from
euro area countries euro area countries euro area countries euro area countries UK/SE/CH UK/SE/CH
Variables TOTAL_ISSUANCEit TOTAL_ISSUANCEit TOTAL_ISSUANCEit TOTAL_ISSUANCEit TOTAL_ISSUANCEit TOTAL_ISSUANCEit
Tobit Tobit Tobit Tobit Tobit Tobit
Before crisis Since crisis Before crisis Since crisis Before crisis Since crisis
GR_TAit-1 -0.0010 0.0140 0.0019 0.0532* 0.0022 -0.0008
(0.0160) (0.0087) (0.0192) (0.0300) (0.0108) (0.0065)
K_TAit-1 0.1311 0.0386 0.1646** 0.2529*** 0.0240 0.1031**
(0.0922) (0.0365) (0.0729) (0.0615) (0.0479) (0.0506)
D_TAit-1 -0.0446*** -0.0271*** -0.0108 -0.0072 -0.0277*** -0.0173***
(0.0091) (0.0045) (0.0206) (0.0095) (0.0068) (0.0059)
L_TAit-1 0.0187** 0.0364*** -0.0108 0.0083 0.0243*** 0.0254***
(0.0077) (0.0031) (0.0249) (0.0314) (0.0045) (0.0048)
RATING_AVit-1 0.0015** 0.0011*** -0.0007 0.0010 -0.0016*** 0.0002
(0.0007) (0.0003) (0.0020) (0.0007) (0.0006) (0.0006)
LRjt -0.0120** 0.0057*** -0.0149** -0.0033
(0.0046) (0.0014) (0.0074) (0.0022)
GDPjt -0.0027** 0.0000 0.0019 -0.0011** 0.0002 -0.0006*
(0.0013) (0.0003) (0.0014) (0.0005) (0.0006) (0.0003)
VOLt -0.0004 0.0001 -0.0003 -0.0001 -0.0002 -0.0002*
(0.0004) (0.0001) (0.0005) (0.0002) (0.0002) (0.0001)
LIBOR_OISjt -0.0002*** 0.0000 -0.0000 0.0000 -0.0000 0.0001***
(0.0001) (0.0000) (0.0001) (0.0001) (0.0000) (0.0000)
CDS_SOVjt 10.5123 -0.3606* 0.8205 -0.0353** -8.0443 -0.0175
(11.4271) (0.1901) (5.5903) (0.0178) (4.9873) (0.2901)
Constant 0.0397* -0.0555*** 0.0952** -0.0068 0.0412*** -0.0084
(0.0215) (0.0108) (0.0412) (0.0279) (0.0143) (0.0117)
Country dummies Yes Yes Yes Yes Yes Yes
Year dummies Yes Yes Yes Yes Yes Yes
Observations 345 581 111 198 140 252
Robust standard errors in parentheses. *** p<0.01, ** p<0.05, * p<0.1. Suffix i refers to bank i, suffix j to country j. Country j is the country where the HQ of bank i is located.

BANCO DE ESPAÑA 47 DOCUMENTO DE TRABAJO N.º 1621
Robust standard errors in parentheses. *** p<0.01, ** p<0.05, * p<0.1. Suffix i refers to bank i, suffix j to country j. Country j is the
country where the HQ of bank i is located.
Table 9. Total issuance excluding government guaranteed and retained issues
(1) (2)
Variables
TOTAL_ISSUANCEit excluding
government guaranteed issuance
TOTAL_ISSUANCEit excluding government
guaranteed and retained issuance
Tobit Tobit
Since crisis Since crisis
GR_TAit-1 0.018** 0.0191***
(0.0071) (0.0067)
K_TAit-1 0.0703*** 0.0769***
(0.0189) (0.0176)
D_TAit-1 -0.0036 -0.0031
(0.0028) (0.0026)
L_TAit-1 0.0086*** 0.007***
(0.0026) (0.0024)
RATING_AVit-1 0.0005** 0.0006***
(0.0002) (0.0002)
LRjt -0.0003 -0.0004
(0.0003) (0.0003)
GDPjt -0.0002 -0.0002
(0.0002) (0.0002)
VOLt -0.0002** -0.0002***
(0.0001) (0.0001)
LIBOR_OISjt 0.0000 0.0000
(0.0000) (0.0000)
CDS_SOVjt -0.0041 0.0009
(0.0096) (0.0098)
Constant -0.0074 -0.0074
(0.005) (0.0048)
Country dummies Yes Yes
Year dummies Yes Yes
Observations 913 913
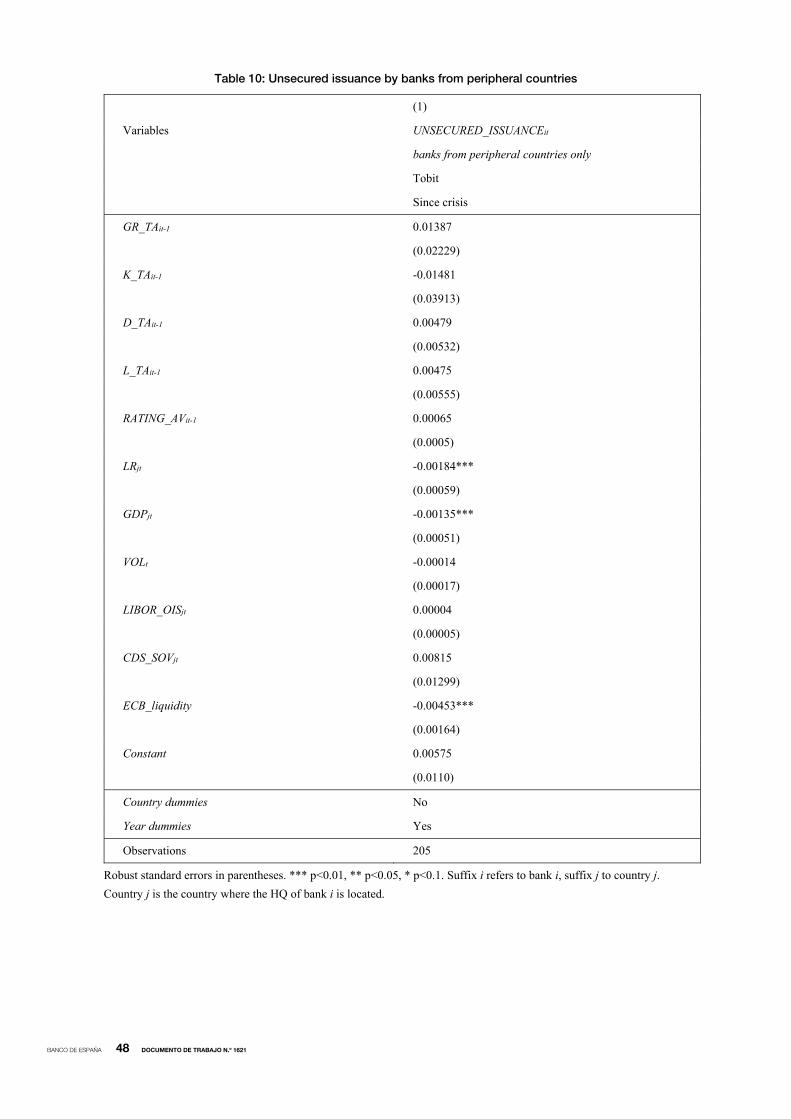
BANCO DE ESPAÑA 48 DOCUMENTO DE TRABAJO N.º 1621
Table 10: Unsecured issuance by banks from peripheral countries
Robust standard errors in parentheses. *** p<0.01, ** p<0.05, * p<0.1. Suffix i refers to bank i, suffix j to country j.
Country j is the country where the HQ of bank i is located.
(1)
Variables UNSECURED_ISSUANCEit
banks from peripheral countries only
Tobit
Since crisis
GR_TAit-1 0.01387
(0.02229)
K_TAit-1 -0.01481
(0.03913)
D_TAit-1 0.00479
(0.00532)
L_TAit-1 0.00475
(0.00555)
RATING_AVit-1 0.00065
(0.0005)
LRjt -0.00184***
(0.00059)
GDPjt -0.00135***
(0.00051)
VOLt -0.00014
(0.00017)
LIBOR_OISjt 0.00004
(0.00005)
CDS_SOVjt 0.00815
(0.01299)
ECB_liquidity -0.00453***
(0.00164)
Constant 0.00575
(0.0110)
Country dummies No
Year dummies Yes
Observations 205
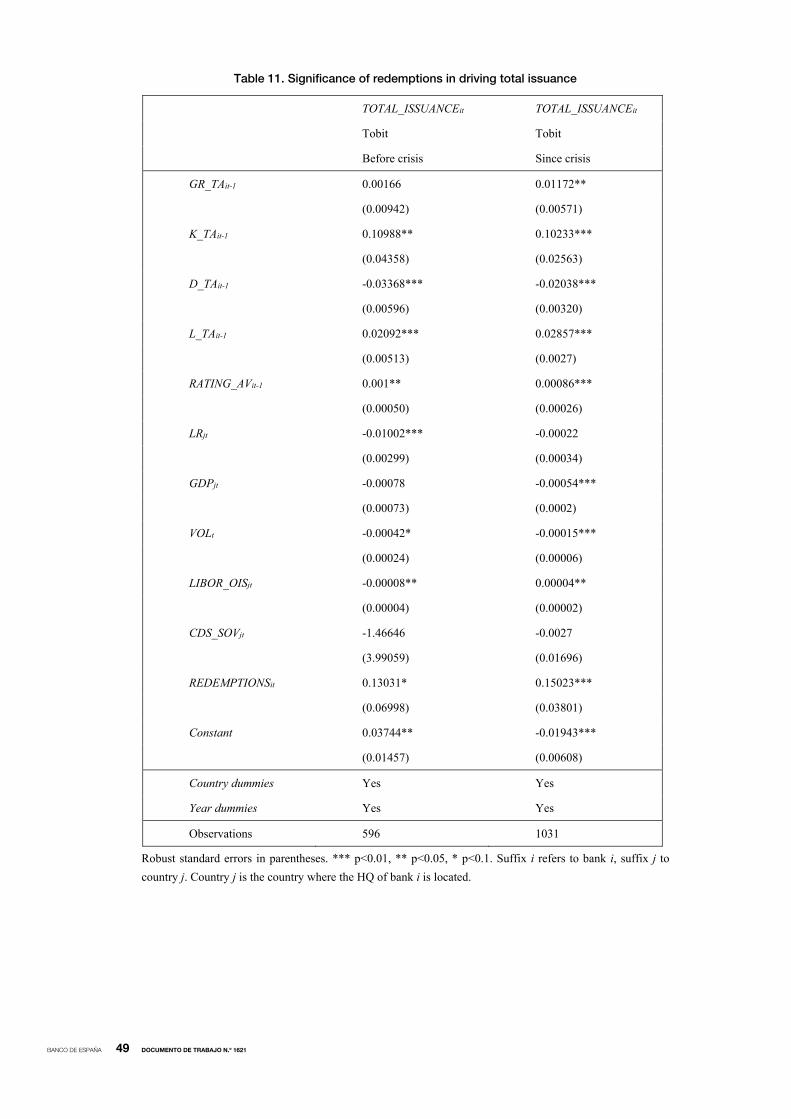
BANCO DE ESPAÑA 49 DOCUMENTO DE TRABAJO N.º 1621
Table 11. Significance of redemptions in driving total issuance
TOTAL_ISSUANCEit TOTAL_ISSUANCEit
Tobit Tobit
Before crisis Since crisis
GR_TAit-1 0.00166 0.01172**
(0.00942) (0.00571)
K_TAit-1 0.10988** 0.10233***
(0.04358) (0.02563)
D_TAit-1 -0.03368*** -0.02038***
(0.00596) (0.00320)
L_TAit-1 0.02092*** 0.02857***
(0.00513) (0.0027)
RATING_AVit-1 0.001** 0.00086***
(0.00050) (0.00026)
LRjt -0.01002*** -0.00022
(0.00299) (0.00034)
GDPjt -0.00078 -0.00054***
(0.00073) (0.0002)
VOLt -0.00042* -0.00015***
(0.00024) (0.00006)
LIBOR_OISjt -0.00008** 0.00004**
(0.00004) (0.00002)
CDS_SOVjt -1.46646 -0.0027
(3.99059) (0.01696)
REDEMPTIONSit 0.13031* 0.15023***
(0.06998) (0.03801)
Constant 0.03744** -0.01943***
(0.01457) (0.00608)
Country dummies Yes Yes
Year dummies Yes Yes
Observations 596 1031
Robust standard errors in parentheses. *** p<0.01, ** p<0.05, * p<0.1. Suffix i refers to bank i, suffix j to
country j. Country j is the country where the HQ of bank i is located.

BANCO DE ESPAÑA 50 DOCUMENTO DE TRABAJO N.º 1621
Table 12. Market-to-book ratio as additional explanatory variable
(1) (2) (3) (4)
Variables TOTAL_ISSUANCEit TOTAL_ISSUANCEit TOTAL_ISSUANCEit TOTAL_ISSUANCEit
OLS OLS Tobit Tobit
Before crisis Since crisis Before crisis Since crisis
GR_TAit-1 -0.0005 0.0076* -0.0004 0.0080
(0.0027) (0.0041) (0.0059) (0.0054)
K_TAit-1 0.1327** 0.1697*** 0.1342*** 0.1821***
(0.0584) (0.0487) (0.0291) (0.0297)
D_TAit-1 -0.0272*** -0.0215*** -0.0275*** -0.0208***
(0.0074) (0.0053) (0.0054) (0.0038)
L_TAit-1 0.0062* 0.0258*** 0.0067 0.0257***
(0.0033) (0.0045) (0.0049) (0.0037)
RATING_AVit-1 -0.0008* 0.0007** -0.0006 0.0008**
(0.0004) (0.0003) (0.0005) (0.0003)
LRjt -0.0075*** -0.0003 -0.0073*** -0.0003
(0.0028) (0.0004) (0.0023) (0.0003)
GDPjt 0.0004 -0.0008*** 0.0005 -0.0008***
(0.0007) (0.0002) (0.0006) (0.0002)
VOLt -0.0002 -0.0002*** -0.0003 -0.0002***
(0.0002) (0.0001) (0.0002) (0.0001)
LIBOR_OISjt -0.0000** 0.0001** -0.0000 0.0001***
(0.0000) (0.0000) (0.0000) (0.0000)
CDS_SOVjt -0.7705 -0.0193* -1.0274 -0.0226
(3.4653) (0.0109) (2.5994) (0.0144)
MTBit-1 0.0014* 0.0006 0.0014 0.0002
(0.0009) (0.0010) (0.0010) (0.0009)
Constant 0.0438*** -0.0165** 0.0404*** -0.0189**
(0.0112) (0.0072) (0.0125) (0.0076)
Country
dummies Yes Yes Yes Yes
Year dummies Yes Yes Yes Yes
Observations 376 694 376 694
R-squared 0.4524 0.3428
Robust standard errors in parentheses. *** p<0.01, ** p<0.05, * p<0.1. Suffix i refers to bank i, suffix j to country j. Country j is
the country where the HQ of bank i is located.
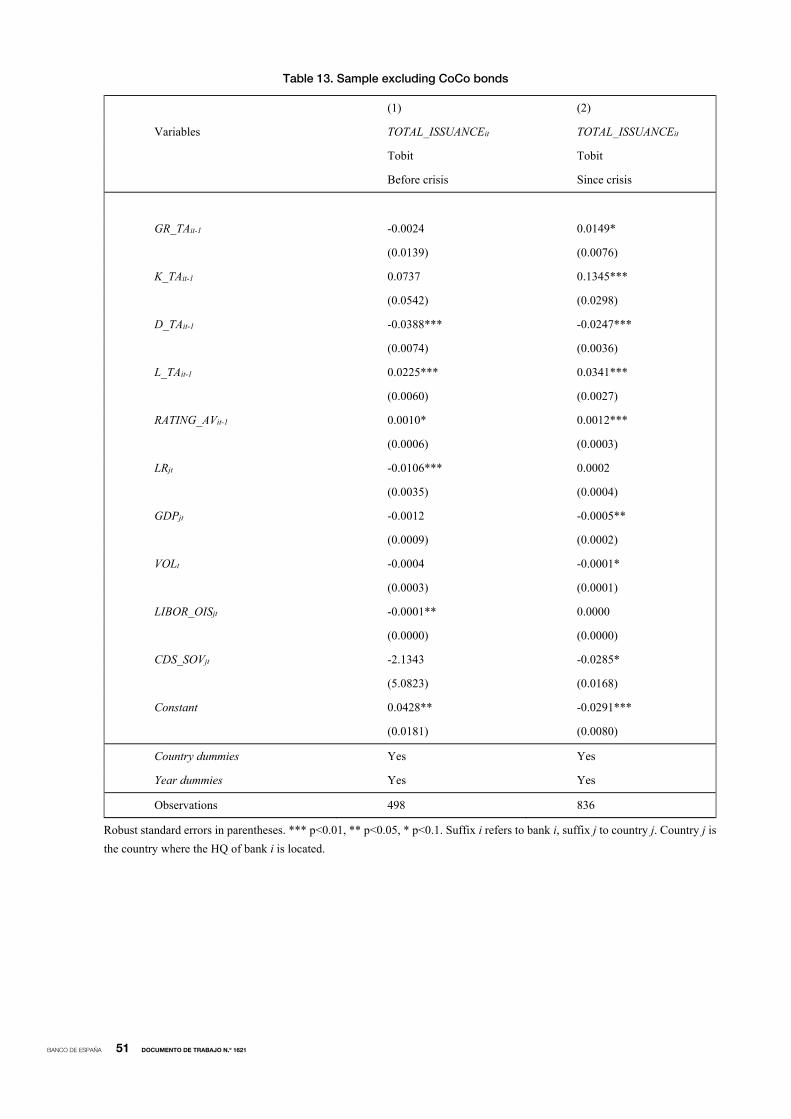
BANCO DE ESPAÑA 51 DOCUMENTO DE TRABAJO N.º 1621
Table 13. Sample excluding CoCo bonds
(1) (2)
Variables TOTAL_ISSUANCEit TOTAL_ISSUANCEit
Tobit Tobit
Before crisis Since crisis
GR_TAit-1 -0.0024 0.0149*
(0.0139) (0.0076)
K_TAit-1 0.0737 0.1345***
(0.0542) (0.0298)
D_TAit-1 -0.0388*** -0.0247***
(0.0074) (0.0036)
L_TAit-1 0.0225*** 0.0341***
(0.0060) (0.0027)
RATING_AVit-1 0.0010* 0.0012***
(0.0006) (0.0003)
LRjt -0.0106*** 0.0002
(0.0035) (0.0004)
GDPjt -0.0012 -0.0005**
(0.0009) (0.0002)
VOLt -0.0004 -0.0001*
(0.0003) (0.0001)
LIBOR_OISjt -0.0001** 0.0000
(0.0000) (0.0000)
CDS_SOVjt -2.1343 -0.0285*
(5.0823) (0.0168)
Constant 0.0428** -0.0291***
(0.0181) (0.0080)
Country dummies Yes Yes
Year dummies Yes Yes
Observations 498 836
Robust standard errors in parentheses. *** p<0.01, ** p<0.05, * p<0.1. Suffix i refers to bank i, suffix j to country j. Country j is
the country where the HQ of bank i is located.

BANCO DE ESPAÑA 52 DOCUMENTO DE TRABAJO N.º 1621
Table 14: Results excluding extreme values of the rating variable
(1) (2) (3) (4)
Variables TOTAL_ISSUANCEit TOTAL_ISSUANCEit TOTAL_ISSUANCEit TOTAL_ISSUANCEit
Tobit Tobit Tobit Tobit
Before crisis Since crisis Before crisis Since crisis
GR_TAit-1 0.0017 0.0092 0.0011 0.0106**
(0.0095) (0.0058) (0.0094) (0.0053)
K_TAit-1 0.1104** 0.1100*** 0.1143*** 0.1100***
(0.0437) (0.0256) (0.0435) (0.0244)
D_TAit-1 -0.0356*** -0.0242*** -0.0349*** -0.0234***
(0.0059) (0.0030) (0.0058) (0.0028)
L_TAit-1 0.0223*** 0.0332*** 0.0237*** 0.0332***
(0.0051) (0.0025) (0.0051) (0.0023)
RATING_AVit-1 0.0010** 0.0010*** 0.0009* 0.0012***
(0.0005) (0.0003) (0.0005) (0.0003)
LRjt -0.0099*** 0.0028*** -0.0082*** 0.0033***
(0.0030) (0.0008) (0.0030) (0.0008)
GDPjt -0.0007 -0.0005** -0.0012 -0.0007***
(0.0007) (0.0002) (0.0008) (0.0002)
VOLt -0.0004* -0.0000 -0.0005* -0.0000
(0.0002) (0.0001) (0.0002) (0.0001)
LIBOR_OISjt -0.0001** 0.0000*** -0.0001** 0.0000***
(0.0000) (0.0000) (0.0000) (0.0000)
CDS_SOVjt -1.2077 -0.2319*** -0.8281 -0.3157***
(4.0029) (0.0800) (4.2176) (0.0806)
Constant 0.0379*** -0.0392*** 0.0348** -0.0439***
(0.0146) (0.0076) (0.0149) (0.0072)
Country dummies Yes Yes Yes Yes
Year dummies Yes Yes Yes Yes
Observations 596 1,020 571 968
Robust standard errors in parentheses. *** p<0.01, ** p<0.05, * p<0.1. Suffix i refers to bank i, suffix j to country j. Country j
is the country where the HQ of bank i is located.

BANCO DE ESPAÑA 53 DOCUMENTO DE TRABAJO N.º 1621
APPENDIX A. Sample of banks
Name Country Type
1.Landesbank Baden-Wuerttemberg (LBBW) Germany Public savings bank
2.Barclays plc UK Commercial bank
3.HSBC Holdings plc UK Commercial bank
4.Commerzbank AG Germany Commercial bank
5.Lloyds Banking Group plc UK Commercial bank
6.UBS AG Switzerland Commercial bank
7.Royal Bank of Scotland Group plc UK Commercial bank
8.Rabobank Nederland The Netherlands Cooperative bank
9.BPCE SA France Cooperative bank
10.Norddeutsche Landesbank Girozentrale Germany Public savings bank
11.UniCredit SpA Italy Commercial bank
12.BNP Paribas SA France Commercial bank
13.Landesbank Hessen-Thueringen Girozentrale Germany Public savings bank
14.Banco Santander SA Spain Commercial bank
15.BayernLB Holding AG Germany Public savings bank
16.Deutsche Bank AG Germany Commercial bank
17.DZ Bank AG Deutsche Zentral-Genossenschaftsbank Germany Cooperative bank
18.Intesa Sanpaolo SpA Italy Commercial bank
19.Credit Agricole SA France Cooperative bank
20.KBC Group NV Belgium Commercial bank
21.Societe Generale France Commercial bank
22.HSH Nordbank AG Germany Public savings bank
23.WGZ BANK AG Westdeutsche Genossenschaftsbank Germany Cooperative bank
24.Raiffeisenlandesbank Oberoesterreich AG Austria Public savings bank
25.Swedbank AB Sweden Commercial bank
26.Groupe Credit Mutuel CEE France Cooperative bank
27.Credit Suisse Group Switzerland Commercial bank
28.Muenchener Hypothekenbank Germany Mortgage bank
29.Banque et Caisse d'Epargne de l'Etat Lux Luxembourg Commercial bank
30.Banco Bilbao Vizcaya Argentaria SA (BBVA) Spain Commercial bank
31.SNS Reaal NV The Netherlands Commercial bank
32.Nordea Bank AB Sweden Commercial bank
33.Bank of Ireland Ireland Commercial bank
34.Skandinaviska Enskilda Banken AB (SEB) Sweden Commercial bank
35.NIBC Holding NV The Netherlands Commercial bank

BANCO DE ESPAÑA 54 DOCUMENTO DE TRABAJO N.º 1621
36.Raiffeisen Zentralbank Oesterreich AG Austria Cooperative bank
37.Oberoesterreichische Landesbank AG Austria Public savings bank
38.Caixa Geral de Depositos SA (CGD) Portugal Commercial bank
39.Mediobanca - Banca di Credito Finanziari Italy Commercial bank
40.Banco BPI SA Portugal Commercial bank
41.Standard Chartered plc UK Commercial bank
42.Aareal Bank AG Germany Mortgage bank
43.Banca Carige SpA Italy Commercial bank
44.Alpha Bank AE Greece Commercial bank
45.Erste Group Bank AG Austria Commercial bank
46.Nationwide Building Society UK Mortgage bank
47.Svenska Handelsbanken AB Sweden Commercial bank
48.ABN AMRO Bank NV The Netherlands Commercial bank
49.Hypo Tirol Bank AG Austria Mortgage bank
50.Banca Monte dei Paschi di Siena SpA Italy Commercial bank
51.Caisse Centrale du Credit Immobilier de France Mortgage bank
52.Hypo Real Estate Holding AG Germany Mortgage bank
53.ING Groep NV The Netherlands Commercial bank
54.Fortis group Belgium Commercial bank
55.Dresdner Bank AG Germany Commercial bank
56.Deutsche Schiffsbank AG Germany Mortgage bank
57.HBOS plc UK Commercial bank
58.Landesbank Sachsen Girozentrale - Sachsen Germany Public savings bank
59.WestLB AG Germany Public savings bank
60.Depfa Bank plc Germany Mortgage bank
61.LBB Holding AG-Landesbank Berlin Holding Germany Public savings bank
62.Dekabank Deutsche Girozentrale Germany Public savings bank
63.Groupe Caisse d’Epargne France Commercial bank

BANCO DE ESPAÑA 55 DOCUMENTO DE TRABAJO N.º 1621
APPENDIX B. Detailed description of bond issuance data
We include unsecured senior and subordinated bonds, covered bonds, government guaranteed bonds, hybrid bonds
and medium-term notes (MTN), but exclude securitisations. Our investigation of the Dealogic DCM database showed
that a considerable number of securitisations have SPVs of which it was not clear with which bank they are affiliated.
Moreover, our analysis of the data showed that banks’ private placements of bonds are important. Hence, we include
both publicly issued bonds as well as private placements. We exclude bond exchanges, as our analysis of Dealogic
showed that they could lead to double-counting of bonds. We have conducted an in-depth analysis of available
original maturities. Dealogic has poor coverage of short-term debt. Essentially, it covers only short-term debt
instruments issued in international markets and excludes domestically issued short-term debt. Hence, we
concentrate on longer-term debt, which according to the definition used by Dealogic includes debt instruments with
an original maturity of 18 months and longer.
We concentrate on European banks, i.e. banks headquartered in the euro area, UK, Sweden and
Switzerland. Our investigation and cross-checking with other data-sources revealed that covered bonds issued by
Danish banks are not represented well in Dealogic. Hence, we exclude these banks.
The identification of which specific bank issued a particular bond is a rather complex issue in Dealogic. This
because banks are reclassified backwards in time when they are taken over by another bank. For example,
Commerzbank took over Dresdner Bank in December 2009. This resulted in a reclassification of all bonds issued by
Dresdner Bank, with Commerzbank listed as the parent issuer of these bonds. As we want to use bank-specific
information in our analysis, we need to identify the bonds issued by Dresdner Bank, in order to be able to link them
to Dresdner bank-specific information. This adjustment needs to be made also for mergers and acquisitions involving
relatively small banks (which issue few bonds), of which there have been many in Europe (SNL lists around 1,400
mergers and acquisitions involving European banks during our sample period of 1999-2013). As the bonds issued
by these banks are registered under the name of the acquiring parent bank also for the years before the merger, they
need to be excluded from the sample of the acquiring bank.
The reclassification of bonds by issuing-banks is especially cumbersome for banks that were taken over
several times by other banks. For example, Antonveneta was initially taken over by ABN AMRO, and then purchased
by Banco Santander, which subsequently sold it to Monte dei Paschi di Siena. So in each case, backwards in time,
the bonds that are classified as having been issued by the acquiring bank need to be corrected for the ones that
actually were issued by Antonveneta.
Given these reclassification issues for banks involved in mergers and acquisitions, we decided to adopt the
following identification process. First, we collected institutional information for each issuing bank, such as history,
information on mergers and acquisitions, member banks of the same bank group, etc. For these bank-by-bank
investigations, we used largely information from Bankscope, SNL, Fitch, Moody’s and S&P and individual banks’
websites (annual and quarterly reports, etc.), augmented where needed by other sources (Google-based searches,
etc.).30 Second, we then checked for all the issuing parents (“issuer parent type” in Dealogic) the specific issuers
(“issuer type”) and where needed (i.e. based on the institutional information obtained) we corrected the classification.
Third, we double-checked the classification of the bonds with other sources (SNL and Bloomberg).
This process was very time-consuming, as it can only be done manually. In fact, the reclassification of bond
issues from banks that have disappeared (“dead banks”) due to takeovers etc. is such an extensive job that other
papers refrain from it. For example, Camba-Mendez et al. (2012) state (p.23) that “… Attributing issuance to dead
30. Other papers have the same experience with the construction of bank samples. For example, Rose and Wieladek (2012) conducted also extensive
bank-by-bank investigations (including Google searches) for certain institutional characteristics in order to construct their sample group.

BANCO DE ESPAÑA 56 DOCUMENTO DE TRABAJO N.º 1621
banks would have been an enormous task. Subsidiary firms for the banking group would have had to be identified
and added up”. This is exactly what we have done.
Another issue with Dealogic is the specific way it classifies banks. It distinguishes between “banks” and
“other financial companies”, but the latter group includes several issuers that in fact are banks. Examples are ING
(due to its insurance arm it is classified as “other financial company”) and Hypo Real Estate. When double-checking
the group of “other financial companies” with other sources (such as the sample group of the EBA stress test, member
overviews of various banking associations and other empirical studies), we found in total nine issuers that in fact are
banks and should be included in our analysis.
Furthermore, we extended our sample with several banks that have disappeared due to mergers,
acquisitions or failures, but which were important bond issuers before those events. Examples are Dresdner Bank
and Fortis. Some of these are complex cases: for example, some of the bonds that were issued by Fortis were
classified after its collapse under the parent name of the acquiring or new entities (Belgian/Luxembourg operations
were acquired by BNP Paribas, while the Dutch operations were renamed ABN AMRO).
For several large European (parent) banks we found bonds issued by SPVs (i.e. not securitisations). It most
instances it was not possible to identify if these bonds were issued by a SPV of a bank that had been acquired by
the parent bank (and hence would have to be reclassified for the years before the merger/takeover; we found one
example of a bond issued by a SPV of Deutsche Postbank which is now classified under the parent bank Deutsche
Bank). Due to this uncertainty, and the fact that there were only a few cases of SPVs issuing bonds (excluding
securitisations), we decided to exclude them (less than 1% of all bonds issued by European G-SIBS was through
SPVs).
To have sufficient data available for econometric analysis, we include banks that were taken over only if we
have at least four years of data. Moreover, given the enormous task of cleaning up the database, we decided to
include only banks that issued more than 200 bonds during 1999-2013. Including “dead” banks, this gave us a
preliminary sample group of 77 banks. Of these 77 banks, we dropped 14 due to data constraints with respect to
the explanatory variables. In the end, we settled for a sample group of 63 banks which issued a total of 50,465 bonds
during Q1 1999 - Q1 2013.

BANCO DE ESPAÑA PUBLICATIONS
WORKING PAPERS
1501 LAURA HOSPIDO and EVA MORENO-GALBIS: The Spanish productivity puzzle in the Great Recession.
1502 LAURA HOSPIDO, ERNESTO VILLANUEVA and GEMA ZAMARRO: Finance for all: the impact of fi nancial literacy training
in compulsory secondary education in Spain.
1503 MARIO IZQUIERDO, JUAN F. JIMENO and AITOR LACUESTA: Spain: from immigration to emigration?
1504 PAULINO FONT, MARIO IZQUIERDO and SERGIO PUENTE: Real wage responsiveness to unemployment in Spain:
asymmetries along the business cycle.
1505 JUAN S. MORA-SANGUINETTI and NUNO GAROUPA: Litigation in Spain 2001-2010: Exploring the market
for legal services.
1506 ANDRES ALMAZAN, ALFREDO MARTÍN-OLIVER and JESÚS SAURINA: Securitization and banks’ capital structure.
1507 JUAN F. JIMENO, MARTA MARTÍNEZ-MATUTE and JUAN S. MORA-SANGUINETTI: Employment protection legislation
and labor court activity in Spain.
1508 JOAN PAREDES, JAVIER J. PÉREZ and GABRIEL PEREZ-QUIRÓS: Fiscal targets. A guide to forecasters?
1509 MAXIMO CAMACHO and JAIME MARTINEZ-MARTIN: Monitoring the world business cycle.
1510 JAVIER MENCÍA and ENRIQUE SENTANA: Volatility-related exchange traded assets: an econometric investigation.
1511 PATRICIA GÓMEZ-GONZÁLEZ: Financial innovation in sovereign borrowing and public provision of liquidity.
1512 MIGUEL GARCÍA-POSADA and MARCOS MARCHETTI: The bank lending channel of unconventional monetary policy:
the impact of the VLTROs on credit supply in Spain.
1513 JUAN DE LUCIO, RAÚL MÍNGUEZ, ASIER MINONDO and FRANCISCO REQUENA: Networks and the dynamics of
fi rms’ export portfolio.
1514 ALFREDO IBÁÑEZ: Default near-the-default-point: the value of and the distance to default.
1515 IVÁN KATARYNIUK and JAVIER VALLÉS: Fiscal consolidation after the Great Recession: the role of composition.
1516 PABLO HERNÁNDEZ DE COS and ENRIQUE MORAL-BENITO: On the predictability of narrative fi scal adjustments.
1517 GALO NUÑO and CARLOS THOMAS: Monetary policy and sovereign debt vulnerability.
1518 CRISTIANA BELU MANESCU and GALO NUÑO: Quantitative effects of the shale oil revolution.
1519 YAEL V. HOCHBERG, CARLOS J. SERRANO and ROSEMARIE H. ZIEDONIS: Patent collateral, investor commitment
and the market for venture lending.
1520 TRINO-MANUEL ÑÍGUEZ, IVAN PAYA, DAVID PEEL and JAVIER PEROTE: Higher-order risk preferences, constant
relative risk aversion and the optimal portfolio allocation.
1521 LILIANA ROJAS-SUÁREZ and JOSÉ MARÍA SERENA: Changes in funding patterns by Latin American banking systems:
how large? how risky?
1522 JUAN F. JIMENO: Long-lasting consequences of the European crisis.
1523 MAXIMO CAMACHO, DANILO LEIVA-LEON and GABRIEL PEREZ-QUIROS: Country shocks, monetary policy
expectations and ECB decisions. A dynamic non-linear approach.
1524 JOSÉ MARÍA SERENA GARRALDA and GARIMA VASISHTHA: What drives bank-intermediated trade fi nance?
Evidence from cross-country analysis.
1525 GABRIELE FIORENTINI, ALESSANDRO GALESI and ENRIQUE SENTANA: Fast ML estimation of dynamic bifactor
models: an application to European infl ation.
1526 YUNUS AKSOY and HENRIQUE S. BASSO: Securitization and asset prices.
1527 MARÍA DOLORES GADEA, ANA GÓMEZ-LOSCOS and GABRIEL PEREZ-QUIROS: The Great Moderation in historical
perspective. Is it that great?
1528 YUNUS AKSOY, HENRIQUE S. BASSO, RON P. SMITH and TOBIAS GRASL: Demographic structure and
macroeconomic trends.
1529 JOSÉ MARÍA CASADO, CRISTINA FERNÁNDEZ and JUAN F. JIMENO: Worker fl ows in the European Union during
the Great Recession.
1530 CRISTINA FERNÁNDEZ and PILAR GARCÍA PEREA: The impact of the euro on euro area GDP per capita.
1531 IRMA ALONSO ÁLVAREZ: Institutional drivers of capital fl ows.
1532 PAUL EHLING, MICHAEL GALLMEYER, CHRISTIAN HEYERDAHL-LARSEN and PHILIPP ILLEDITSCH: Disagreement
about infl ation and the yield curve.
1533 GALO NUÑO and BENJAMIN MOLL: Controlling a distribution of heterogeneous agents.
1534 TITO BOERI and JUAN F. JIMENO: The unbearable divergence of unemployment in Europe.
1535 OLYMPIA BOVER: Measuring expectations from household surveys: new results on subjective probabilities of future
house prices.
1536 CRISTINA FERNÁNDEZ, AITOR LACUESTA, JOSÉ MANUEL MONTERO and ALBERTO URTASUN: Heterogeneity
of markups at the fi rm level and changes during the great recession: the case of Spain.
1537 MIGUEL SARMIENTO and JORGE E. GALÁN: The infl uence of risk-taking on bank effi ciency: evidence from Colombia.
1538 ISABEL ARGIMÓN, MICHEL DIETSCH and ÁNGEL ESTRADA: Prudential fi lters, portfolio composition and capital ratios
in European banks.
1539 MARIA M. CAMPOS, DOMENICO DEPALO, EVANGELIA PAPAPETROU, JAVIER J. PÉREZ and ROBERTO RAMOS:
Understanding the public sector pay gap.
1540 ÓSCAR ARCE, SAMUEL HURTADO and CARLOS THOMAS: Policy spillovers and synergies in a monetary union.
1601 CHRISTIAN CASTRO, ÁNGEL ESTRADA and JORGE MARTÍNEZ: The countercyclical capital buffer in Spain:
an analysis of key guiding indicators.
1602 TRINO-MANUEL ÑÍGUEZ and JAVIER PEROTE: Multivariate moments expansion density: application of the dynamic
equicorrelation model.
1603 ALBERTO FUERTES and JOSÉ MARÍA SERENA: How fi rms borrow in international bond markets: securities regulation
and market segmentation.
1604 ENRIQUE ALBEROLA, IVÁN KATARYNIUK, ÁNGEL MELGUIZO and RENÉ OROZCO: Fiscal policy and the cycle
in Latin America: the role of fi nancing conditions and fi scal rules.
1605 ANA LAMO, ENRIQUE MORAL-BENITO and JAVIER J. PÉREZ: Does slack infl uence public and private labour
market interactions?
1606 FRUCTUOSO BORRALLO, IGNACIO HERNANDO and JAVIER VALLÉS: The effects of US unconventional monetary
policies in Latin America.
1607 VINCENZO MERELLA and DANIEL SANTABÁRBARA: Do the rich (really) consume higher-quality goods? Evidence from
international trade data.
1608 CARMEN BROTO and MATÍAS LAMAS: Measuring market liquidity in US fi xed income markets: a new synthetic
indicator.
1609 MANUEL GARCÍA-SANTANA, ENRIQUE MORAL-BENITO, JOSEP PIJOAN-MAS and ROBERTO RAMOS: Growing like
Spain: 1995-2007.
1610 MIGUEL GARCÍA-POSADA and RAQUEL VEGAS: Las reformas de la Ley Concursal durante la Gran Recesión.
1611 LUNA AZAHARA ROMO GONZÁLEZ: The drivers of European banks’ US dollar debt issuance: opportunistic funding
in times of crisis?
1612 CELESTINO GIRÓN, MARTA MORANO, ENRIQUE M. QUILIS, DANIEL SANTABÁRBARA and CARLOS TORREGROSA:
Modelling interest payments for macroeconomic assessment.
1613 ENRIQUE MORAL-BENITO: Growing by learning: fi rm-level evidence on the size-productivity nexus.
1614 JAIME MARTÍNEZ-MARTÍN: Breaking down world trade elasticities: a panel ECM approach.
1615 ALESSANDRO GALESI and OMAR RACHEDI: Structural transformation, services deepening, and the transmission
of monetary policy.
1616 BING XU, ADRIAN VAN RIXTEL and HONGLIN WANG: Do banks extract informational rents through collateral?
1617 MIHÁLY TAMÁS BORSI: Credit contractions and unemployment.
1618 MIHÁLY TAMÁS BORSI: Fiscal multipliers across the credit cycle.
1619 GABRIELE FIORENTINI, ALESSANDRO GALESI and ENRIQUE SENTANA: A spectral EM algorithm for dynamic
factor models.
1620 FRANCISCO MARTÍ and JAVIER J. PÉREZ: Spanish public fi nances through the fi nancial crisis.
1621 ADRIAN VAN RIXTEL, LUNA ROMO GONZÁLEZ and JING YANG: The determinants of long-term debt issuance by
European banks: evidence of two crises.
Unidad de Servicios AuxiliaresAlcalá, 48 - 28014 Madrid
E-mail: [email protected]