the determinants of mergers - bi norwegian business … 19003 – master thesis 01.09.2014 page i...
TRANSCRIPT

Ingrid Graff Kvalen Katinka Vister
BI Norwegian Business School
Master Thesis
The Determinants of Mergers
- A study of Norwegian Private Companies -
Hand-in date: 01.09.2014
Supervisor:
Ignacio Garcia de Olalla Lopez
Campus: BI Oslo
Examination code and name:
GRA 19003 Master Thesis
Programme: Master of Science in Business and Economics
Major:
Business Law, Tax and Accounting
This thesis is a part of the MSc programme at BI Norwegian Business School. The school takes no responsibility for the methods used, results found and conclusions drawn.

GRA 19003 – Master Thesis 01.09.2014
Page i
Abstract
The purpose of the thesis is to investigate the determinants of mergers in Norway,
with focus on the impact from macroeconomic factors and recent regulative
changes.
This thesis presents an analysis using a sample of Norwegian private limited
liability companies (private companies) in the period between 1999 and 2012, to
test several hypotheses about what influences merger activity. Linear regression
models are employed on panel data to predict the effects of the independent
variables.
The results imply a positive and significant relationship between the level of the
economy and merger activity, which is consistent with prior empirical studies.
Further, changes in regulations and internal company factors are proven to have a
significant relation to mergers. The credibility of the analysis is proven through
several robustness tests.
Our findings support the neoclassical hypothesis in that merger activity is affected
by economic, regulatory and technological changes.

GRA 19003 – Master Thesis 01.09.2014
Page ii
Content
ABSTRACT I
CONTENT II
TABLES AND FIGURES V
PREFACE VI
INTRODUCTION 1
1.1 RESEARCH QUESTION AND OBJECTIVES 3
1.2 THESIS OUTLINE 4
2 REVIEW OF LITERATURE 5
2.1 MERGER WAVES IN A HISTORICAL PERSPECTIVE 5
2.1.1 THE FIRST WAVE: 1897 - 1904 6
2.1.2 THE SECOND WAVE: 1916 - 1929 7
2.1.3 THE THIRD WAVE: 1965 - 1969 8
2.1.4 THE FOURTH WAVE: 1984 - 1989 9
2.1.5 THE FIFTH WAVE: 1992 - 2000 10
2.1.6 THE SIXTH WAVE: 2003 - 2007 10
2.2 WHY MERGERS OCCUR 11
2.2.1 NEOCLASSICAL HYPOTHESIS 12
2.2.2 BEHAVIORAL HYPOTHESIS 13
2.2.3 NEOCLASSICAL VERSUS BEHAVIORAL HYPOTHESIS 15
2.3 COMMONLY APPLIED VARIABLES IN PREVIOUS RESEARCH 16
2.3.1 STOCK PRICE 16
2.3.2 INTEREST RATE 18
2.3.3 INFLATION 19
2.3.4 GROSS DOMESTIC PRODUCT 20
2.3.5 UNEMPLOYMENT RATE 21
2.3.6 OIL PRICE 21
2.3.7 CHANGE IN ASSETS 22

GRA 19003 – Master Thesis 01.09.2014
Page iii
3 MERGERS IN NORWAY 22
3.1 DEFINITIONS AND TYPES 22
3.2 THE PROCESS 26
3.3 MERGER MOTIVES 26
3.4 RISKS 29
3.5 DEVELOPMENT OF MERGERS 30
4 MERGER REGULATIONS 31
4.1 BACKGROUND 31
4.2 RECENT CHANGES IN REGULATIONS 32
4.2.1 TEMPORARY TAX ON DIVIDENDS IN 2001 32
4.2.2 NEW TAX REFORM IN 2006 34
4.2.3 AUDIT EXEMPTION IN 2011 35
4.2.4 NEW CAPITAL REQUIREMENT IN 2012 36
5 VARIABLES AND HYPOTHESES 37
5.1 DEPENDENT VARIABLE 37
5.2 INDEPENDENT VARIABLES 37
5.3 HYPOTHESES 41
6 METHODOLOGY AND DATA 43
6.1 DESCRIPTION OF DATA 43
6.2 METHOD OF ESTIMATION 45
6.3 DEFINITION OF VARIABLES 47
6.4 MODEL SPECIFICATION 48
7 EMPIRICAL RESULTS AND ANALYSIS 48
7.1 GOODNESS OF FIT 48
7.2 MAIN RESULTS 49
7.2.1 MACROECONOMIC VARIABLES 50
7.2.2 LEGISLATIVE CHANGES 50
7.2.3 COMPANY SPECIFIC VARIABLE 54
7.3 ROBUSTNESS TESTS 54
7.3.1 FE VS. POOLED OLS 54
7.3.2 DUMMY VARIABLES 55

GRA 19003 – Master Thesis 01.09.2014
Page iv
7.3.3 SPLIT-SAMPLE VALIDATION 56
7.3.4 DUMMY 2006 58
7.4 ASSESSING MULTICOLLINEARITY 59
8 FINAL COMMENTS AND CONCLUSION 60
9 RECOMMENDATION FOR FUTURE RESEARCH 62
REFERENCES 64
APPENDIX 70
APPENDIX A: HAUSMAN TEST 70
APPENDIX B: DEVELOPMENT OF LONG-TERM INTEREST RATE 70
APPENDIX C: PRELIMINARY REPORT 70

GRA 19003 – Master Thesis 01.09.2014
Page v
Tables and Figures
FIGURES
Figure 1.1: Development of mergers in Norway 2
Figure 1.2: Economic development in Norway 2
Figure 3.1: Merger by admission 23
Figure 3.2: Merger by new establishment 24
Figure 3.3: Triangle merger 24
Figure 3.4: Parent-daughter merger 25
Figure 3.5: Daughter-daughter merger 25
Figure 3.6: Development of mergers 30
Figure 5.1: Correlation matrix – macroeconomic variables 38
Figure 6.1: Total number of firms 44
Figure 6.3: Variables in the regression model 48
TABLES
Table 7.1: Regression results – FE and pooled OLS 49
Table 7.2: Robustness test – Only dummies 55
Table 7.3: Robustness test – Split-sample validation 56
Table 7.4: Robustness test – Dummy 2006 58
Table 7.5: Correlation matrix – Main model 59

GRA 19003 – Master Thesis 01.09.2014
Page vi
Preface
This master thesis represents the end of our Master of Science degree in Business
and Economics at BI Norwegian Business School. The decision to write about the
determinants of mergers was mostly inspired by personal interest and due to the
lack of research on this topic in Norway.
We would like to express our gratitude to our academic supervisor, Ignacio Garcia
de Olalla Lopez, for providing us with valuable advice, constructive comments,
and support during the thesis writing process.
We would also like to thank the Centre for Corporate Governance Research for
allowing us to use data from the CCGR database. Finally, we would like to thank
Limei Che for helping us with the extraction of data.
September 2014
Katinka Vister Ingrid Graff Kvalen

GRA 19003 – Master Thesis 01.09.2014
Page 1
Introduction
“Merger waves are an enduring mystery and the search for a single explanation
for their existence, growth and size continues.” S. Owen 2006
Mergers tend to occur in waves. Previous research documents a clear trend of
merger waves. The clustering of waves can be tied to various technological,
economic, and regulatory shocks. In a global perspective, six merger waves have
taken place since the 19th century. The characteristics of the different merger
waves are distinct, but the main common points of each wave are those referring
to political and regulative factors, and macroeconomic factors. Nonetheless, there
is no consensus as to why merger waves occur. One explanation is the
neoclassical hypothesis, which is based on an economic disturbance that leads to
industry reorganization. Another theory, called the behavioral hypothesis, argues
that we observe clustering in merger activity because a substantial portion of
merger activity is driven by stock market valuations.
This thesis seeks to analyze what influences merger activity in Norway, with
focus on certain legislative changes in recent years. As far as we know, there has
never been done research on this topic in Norway. Neither have we found foreign
research determining what influences mergers for private companies. The
selection process of the macroeconomic influencers will be based on findings in
accordance with the neoclassical approach. While the neoclassical hypothesis
focuses on clustering within industries, this thesis will analyze general economic
shocks that affect the overall business sector. In addition, the comprised changes
in regulations apply to companies in Norway regardless of industry.
Various measures of economic activity are consistently found to be potential
explanatory variables of mergers. Such findings comprise gross domestic product
(GDP), interest rates, and stock prices among others. In our model, some of these
macroeconomic factors supplemented by a measure of individual firm growth will
form the basis of potential influencers on merger activity, in addition to the effects
of certain regulations recently entered into force in Norway.
In 2000 the government announced a temporary dividend tax that applied for
companies in 2001. Figure 1.1 shows an interesting development of number of

GRA 19003 – Master Thesis 01.09.2014
Page 2
mergers in the aftermath of the temporary dividend tax. In 2006 a new tax reform
was implemented, which created a new chapter in the history of mergers. Later, in
2011 and 2012, two main legislative events occurred. Firstly, a new amendment
exempted a large proportion of Norwegian companies from audit, followed by a
60 percent decrease in the requirement for share capital for private limited liability
companies. These changes had consequences for organizational and structural
choices among companies, and it is interesting to investigate the potential
implication on merger activity.
Figure 1.1: The development of mergers in Norway Source: BRREG
!"!!!!
!!500!!
!1!000!!
!1!500!!
!2!000!!
!2!500!!
!3!000!!
!3!500!!
1999!2000!2001!2002!2003!2004!2005!2006!2007!2008!2009!2010!2011!2012!
Number!of!mergers!
Figure 1.2: Economic development in Norway Source: OECD
0"
500"
1000"
1500"
2000"
2500"
3000"
3500"
Yr" 1998"1999"2000"2001"2002"2003"2004"2005"2006"2007"2008"2009"2010"2011"
GDP"
Figure 1.1 presents the development of number of mergers in Norway. The trend
indicates an overall increase, except the drop in 2002-2003. This increasing trend
coincides to the development of the Norwegian economy measured in terms of
GDP as presented in figure 1.2. Previous research has studied the macroeconomic
effect on mergers in several countries. However, limited research has been
conducted in Norway. The more or less positive relationship between the merger
development and the economic condition indicates that global findings might be
applicable in Norway.

GRA 19003 – Master Thesis 01.09.2014
Page 3
This study proceeds by using a sample of private firms in Norway in the period
between 1999 and 2012, to test several hypotheses about what influences merger
activity. Linear regression models are employed to predict the effects of the
independent variables. What was ought to be our main model is believed to be
unreliable due to a possible structural break in 2006. The results are therefore
based on a split-sample validation, which takes into account the structural break.
The findings confirm a positive relationship between mergers and the level of the
general economy represented by GDP. In accordance with international results,
our models (the main model and the first subsample) suggest that a higher interest
rate leads to a higher degree of merger activity. However the result turns opposite
in the second subsample. The evidence for the interest rate is therefore not clear.
This is also the case for the accounting variable, change in assets, which is
included to measure individual firm growth.
At last, the legislative changes are found to have an impact on mergers. Firstly,
the results imply that the temporary dividend tax in 2001 has a negative impact on
merger activity. Previous research finds strong timing effect on dividend
payments around the temporary dividend tax in 2001. The tendency of holding
back dividends results in locked-up funds. Thus, the incentive to obtain growth
externally by merging decreases. Secondly, the new tax reform in 2006 is found to
have a positive effect on merger activity. The new amendment gave incentives to
restructure or establish holding companies. The tendency of restructuring into
holding companies resulted in an increased amount of mergers, especially triangle
mergers. This tax reform is found to be an external factor causing a structural
break in the time series data. Finally, the results imply a negative relationship
between the new regulations in 2011-2012 and merger activity. However, we
believe that the effect of the audit exemption and the new capital requirement
might become even more visible at a later point in time.
1.1 Research question and objectives
This thesis seeks to answer the following research question:
“What influences merger activity in Norway?”

GRA 19003 – Master Thesis 01.09.2014
Page 4
In order to conclude on the research question the following objectives will
contribute to give proper answers.
1. The first objective is to present the economic dimensions of mergers, from
the macroeconomic perspective, in order to understand the determinants of
these operations.
2. Together with the macroeconomic factors, we will include certain
legislative changes regarding companies, in order to get insight in how
these amendments have affected merger activity in Norway.
1.2 Thesis outline
The following thesis is organized in nine main chapters. Chapter two reviews
previous literature on the history of mergers and presents previous findings.
Chapter three introduces mergers in Norway with respect to definitions, different
types of mergers, and merger motives. The chapter concludes with a review of the
development of the number of mergers in Norway the last years.
Chapter four presents merger regulations in Norway with respect to legislative
changes in recent years.
Chapter five explains the choice of variables used in the model, and concludes
with a deduction of the hypotheses.
Chapter six describes the data provided in the study, followed by a thorough
discussion of the methodology. It reviews estimation techniques, definitions of
variables, and concludes with presenting the regression model.
Chapter seven presents the empirical results and the panel data regression
analysis. Firstly, the model fit is discussed. Next the results for the main model
are presented. Lastly, a series of robustness tests have been conducted, followed
by assessment of multicollinearity in order to verify the credibility of the obtained
results.

GRA 19003 – Master Thesis 01.09.2014
Page 5
Chapter eight presents the final conclusion, and chapter nine provides
recommendations for future research.
2 Review of literature
This chapter reviews previous literature on mergers from a historical perspective,
and in terms of previous findings. It concludes with a description of the most
commonly applied variables.
2.1 Merger waves in a historical perspective
An investigation of mergers in a historical perspective is important in order to
determine the factors influencing merger activity. Given previous research,
merger activity has been found to take place in waves which belong to a context
of changing the competition game, marked by economic changes, technological
evolutions, changes generated by the phenomenon of globalization, and by
changes in what the regulation process is concerned (Vancea 2012).
As of today, six merger waves have taken place, with the merger waves being
most revealing in the US. Each of the waves has distinct features, which
differentiates them from each other. As economic conditions, deregulations, new
laws and technological changes have occurred, the features of the merger waves
have evolved. As a result, there have been different combinations of mergers,
where the waves have created both monopolistic and oligopolistic markets. In
addition, mergers have gone from a hostile tactic to a more strategic weapon in
order for companies to adjust to a changing environment. In other words, the
different waves were based on motivations and characteristics specific to the
period of development. However, similarities between the waves have also been
found. The main similarities of each wave are those referring to political,
regulating, and macroeconomic factors.
First, the political and regulating factors have been seen to play an important role
when it comes to merger activity. The first waves, those of the 1890s and 1920s,

GRA 19003 – Master Thesis 01.09.2014
Page 6
were generated by the antitrust laws, while those of the 1980s seemed to be
generated by the markets´ large scale of deregulations. In the latest years,
deregulations have been concentrated on specific sectors. As a result, it has
created industry merger waves (Vancea 2012). Secondly, the macroeconomic
factors have been shown to play an important part in nearly all of the merger
waves, with the state of the economy and interest rates being the most determining
factors.
The first four waves occurred in 1897-1904, 1916-1929, 1965-1969, and 1984-
1989. Merger activity declined at the end of the 1980s but resumed again in the
early 1990s to begin the fifth merger wave. We also had a relatively short, but
intense merger period between 2003 and 2007. A good argument could be made
that this period constitutes a sixth merger wave (Gaughan 2011). In the following
we will look closer into each of the mergers waves. These waves are typically
labeled the horizontal merger wave of the 1890s, the vertical mergers of the
1920s, the conglomerate merger wave of the 1960s, the refocusing wave of the
1980s, and the global wave of the 1990s (Eckbo, Betton, and Thorburn 2008).
2.1.1 The first wave: 1897 - 1904
Horizontal combinations of mergers dominated the first merger wave in the US. A
monopolistic market started to evolve as a result of the many horizontal mergers
and industry consolidations. The first merger wave is therefore known for its role
in creating large monopolies.
O'Brien (1988) observed that the merger wave did not occur as a result of
companies wanting to achieve economies of scale, which had been the main
motivation until then. At this point, the merger wave was rather created by
companies wanting to increase their market power. This period shows the result of
weak monopoly regulations, as companies managed to work around the laws by
the use of mergers. In 1890, the Sherman Antitrust Act was implemented, which
was made to prevent the monopolization of markets. Despite the enactment of the
Sherman Antitrust Act (1890), it was not enough to limit this period's intense
merger activity. It was the US Justice Department who was largely responsible for
the limited effect of the Sherman Act. At the time the Justice Department was
charged with enforcing the law, they were understaffed and unable to aggressively

GRA 19003 – Master Thesis 01.09.2014
Page 7
pursue antitrust enforcement (Gaughan 2011). Therefore, the pace of horizontal
mergers and industry consolidations continued unabated without meaningful
antitrust restrictions.
In addition to the lack of enforcement of federal antitrust laws, there were other
legal reasons, which contribute to the explanation of why the first merger wave
occurred. In selected states, several corporation laws were gradually relaxed. As a
result, corporations became better able to secure capital, hold stock in other
corporations, and expand their lines of business operations, thereby creating a
fertile environment for firms to contemplate mergers (Gaughan 2011). Therefore,
it occurred a clear distinction between the states with liberalized corporate laws
and those without in relation to merger activity. The wave ended, as it was a steep
decline in the equity market combined with the US suffering from having a weak
banking system.
2.1.2 The second wave: 1916 - 1929
The second merger wave is characterized by several industries being consolidated.
Looking back, it was not monopolies that emerged but rather oligopolies. When
the second wave emerged, the U.S. economy was growing and developing in a
positive direction after the decline in the equity market. The economic growth was
mainly due to the post-World War I economic boom, which provided access to
investment capital for pending securities markets. The availability of capital,
which was driven by favorable economic conditions and low margin requirements
therefore created a rocket stock market.
The second merger wave provides an image of how companies adjust to their
operating environment, as the US government had taken the lesson from the last
wave and imposed stricter laws. The antitrust environment in the 1920s was more
severe than the environment that had prevailed during the first wave of mergers.
Around the year 1910, the Congress started to worry about the market power of
the monopolies, and their ability to abuse the market. It was also clear that the
Sherman Act was not effective enough to act as a deterrent to monopoly. As a
result, the Congress implemented the Clayton Act in 1914. It was a law that
strengthened antitrust provisions of the Sherman Act. As the economy and the
banking system again began to rise in the late 1900s, the antitrust laws had
become an important deterrent to monopoly. Sudarsanam (2010) found that the

GRA 19003 – Master Thesis 01.09.2014
Page 8
stricter antitrust laws against monopolies triggered the second wave. With the
stricter antitrust environment, the second wave created fewer monopolies. In stead
it created several oligopolies and many vertical mergers, as companies in
unrelated industries started to combine. This was the first large-scale formation of
conglomerates. Even if these business combinations involved firms that did not
directly produce the same products, they often had similar product lines.
Like the first, the second wave ended by the steep decline of the equity market.
2.1.3 The third wave: 1965 - 1969
The booming economy in the 60s created a fertile ground for the third merger
wave to arise. The wave is often known as the conglomerate merger period, where
the label indicates the character of the typical merger. In the period from 1965 to
1975, about 80 percent of mergers were conglomerate mergers. The
conglomerates that were formed had not just the intention of creating diversified
product lines, companies wanted to engage in a diversified strategy by merging
with firms operating in unrelated industries. Moreover, it was not uncommon for
smaller companies to target larger companies during this wave.
Shleifer and Vishny (1991) explained the tremendous growth of conglomerates by
the diversification of companies as being a result of the stricter antitrust law that
prohibited mergers between companies within the same industry. The stricter anti-
trust law, the Cells Kefuaver Act of 1950, was imposed in response to the growing
monopolies and oligopolies of the first and second wave. The main motivation of
the law was to obstacle anticompetitive mergers of corporate assets. The
Government had learned from the earlier waves and adjusted the competition laws
to become stricter. However, the problem was that these laws were aimed at
horizontal and vertical mergers and not on conglomerate mergers. For that reason,
firms chose the only option available, namely conglomerates. As a consequence,
conglomerate mergers dominated the third wave.
On the other hand, Sudarsanam (2010) claims that the diversification was due to
companies wanting to reduce the volatility in their income as the creation of
internal capital markets by diversification improves the capital allocation.
The third wave ended as a result of the oil crisis and the economic recession of the
early 70s.

GRA 19003 – Master Thesis 01.09.2014
Page 9
2.1.4 The fourth wave: 1984 - 1989
The unique characteristic of the fourth wave is the significant role of hostile
mergers (Gaughan 2011). It is known for being hostile as corporations and
speculative partnerships played a fierce takeover game as a means of receiving
abnormal returns in a relatively short time. Despite the many hostile mergers, the
fourth wave was marked by an increased focus on strategic mergers. Companies
had both offensive and defensive strategies, which were very complex. As a
result, many innovative mergers evolved as companies adapted to the hostile
environment. Furthermore, the merger wave is known by its significant number
of mergers, which were designed either to downsize or specialize operations in
correction of the excessive conglomeration in the third wave.
The fourth wave also distinguishes itself from the other waves by the size and
prominence of the merger targets. The greatest mergers in history up till that time,
in terms of value, were carried out. Previously, mergers between smaller and
medium-sized businesses had been dominating, but in the fourth wave, billion-
dollar mergers were the leading factor. As of this reason, the fourth wave has been
referred to as the wave of the megamergers.
Looking back, the fourth wave stood out for having a much greater share of
mergers within selected industries as a result of heavy deregulations. The effect of
the deregulations could especially be seen in the airline industry where it was an
extensive growth of mergers. The effects of the deregulations were shown in the
study of Mitchell and Mulherin (1996) where they found that deregulation, oil
price shocks, foreign competition, and financial innovations can explain a
significant portion of takeover activity in the 1980s.
The UK and the EU were experiencing a merger wave during the same period.
The characteristics of the merger wave in the UK are very similar to those
affecting the wave in the US. The wave occurred as a result of deregulations in the
financial service sector and was also characterized by the many hostile mergers. In
the EU, the wave occurred as a result of political changes. Sudarsanam (2010)
observed that the fall of the Berlin Wall and the Schengen Agreement were the
main contributors to the wave. These events opened for trade between countries
and several European partnerships were created.
The stock market crash in 1989 put an end to the fourth merger wave.

GRA 19003 – Master Thesis 01.09.2014
Page 10
2.1.5 The fifth wave: 1992 - 2000
The fifth merger wave began with large deals, similar to what had been seen
during the fourth wave. However, short-term financial gambling was avoided and
companies started to focus more on strategic and “friendly” deals, which were of
the long-term commitment. As with the rest of the merger waves, the economy
was booming. In addition, a new peak was reached in the stock market and for
several market indexes. In order for companies to react to the increased demand,
they started pursuing mergers again.
Despite the many megamergers, the fifth merger wave differentiates itself from
the others by having more strategic and less hostile mergers than what had been
performed earlier. In addition, companies financed mergers through the use of
equity, instead of the use of debt
However, the most distinguishing factor of the fifth merger wave is that it became
an international merger wave. The wave was seen in Europe, Asia, Central and
South America. All of the continents were experiencing economic growth at this
time. Companies strived to reach new markets worldwide, which affected all the
economies. The world economy experienced a ripple effect. What started as an
expansion effort in one part of the world, set off a ripple effect for the rest of the
world.
Looking closer into the UK, they experienced their largest wave so far. It occurred
as a consequence of deregulations and by privatizations of previously state-owned
companies. As with the US merger wave, the UK wave consisted of many cross-
border deals. Furthermore, the EU also experienced a merger wave, which was
triggered as the Single European Act led to the Single Market. This particular
change made cross-border deals easier.
2.1.6 The sixth wave: 2003 - 2007
At the time when the sixth merger wave started, interest rates were low after the
recession in the economy. The interest rates were kept low even though the
economy was starting to recover, and as a result it gave a major boost to the
private equity business. Like the fifth wave, companies financed mergers through
the use of equity and a new wave was triggered.
On the other hand, Martynova and Renneboog (2005) claim that the reason why
the merger wave occurred was mainly due to the delay of transactions after the
GRA 19003 – Master Thesis 01.09.2014
Page 11
9/11 terrorists attack in the US. At that time there was a highly unsecure market
and investments were withhold. As the market began to return to normal and the
uncertainty vanished, investments exploded and triggered a new wave.
Sudarsanam (2010) explained the merger wave as a result of emerging markets.
UK and the EU have the same characteristics of their merger waves during this
period.
Thus it was a relatively short, but nonetheless intense merger wave. It came to a
rapid end when the subprime crisis started in 2007.
2.2 Why mergers occur
Mergers have created much disagreement and controversy over several decades.
The disagreements are focused on the reasons why merger waves occur, what
economic and noneconomic consequences merger waves have, and what
government policies toward mergers should be. These questions have been asked
through a vast range of literature, and a great variety of answers have been given.
For many years the phenomenon of mergers has been investigated, where the
literature on the topic has been divided into two main aspects, merger theories and
the gains of mergers.
Given previous research, merger activity has been found to take place in waves
which belong to a context of changing the completion game, marked by economic
changes, technological evolutions, changes generated by the phenomenon of
globalization, and also by changes in what the regulation process is concerned
(Vancea 2012). Despite that prior research has found mergers not to occur evenly
over time, but instead cluster in distinct ways, there has not been found
determining reasons why the frequency of mergers varies. Past work on this topic
have focused on macroeconomic variables as the source of takeover activity
(Mitchell and Mulherin 1996). However, the results have been characterized by
having mixed success.
The explanation of why mergers occur is often divided into two different views;
the neoclassical -, and the behavioral hypothesis. The neoclassical model explains
the clustering of mergers as a response by industries to different shocks. The
behavioral model on the other hand, explains the clustering of mergers as rational

GRA 19003 – Master Thesis 01.09.2014
Page 12
managers taking advantage of consistent pricing errors in the market to buy real
assets with overvalued stock (Vancea 2012).
2.2.1 Neoclassical hypothesis
The neoclassical hypothesis explains merger waves as a result of firms’ reactions
to different industry shocks in the business environment. Companies react to
different shocks by reorganizing their business in order to answer efficiently to
opportunities that come with the shocks. The goal of the reorganization is to make
operations become more profitable and favorable.
Typically, merger waves have occurred as economic, regulatory or technological
shocks have arisen in the market. An economic shock comes with an economic
boom. In order for companies to meet the aggregated demand in the economy,
they expand their business through mergers as it provides a faster form of
expansion than organic growth. Gort (1969) explains that rational merger waves
are based on an economic disturbance, which leads to industry reorganization. As
a result, merger frequencies vary greatly among industries.
Regulatory shocks occur as new laws are implemented, or as deregulations are
imposed. Either way, companies seek to eliminate barriers and adapt to the new
changes.
Technological shocks may have multiple forms because technological changes
can generate important changes within the existing sectors or might create new
ones (Vancea 2012). One of the first to observe the connection between
technological shocks and merger activity was Coase (1937) who found that
technological change leads to mergers. More recently, Tobin´s Q has been linked
to merger waves. Hennessy (2004), explained Tobin´s Q to be the market value of
a company divided by the replacement value. Tobin´s Q is applied in order for
companies to determine whether to invest or not in a company, where a high Q
ratio implies a high value creation of the present assets. Jovanovic and Rousseau
(2002) found that technological changes lead to an increased spread of Q ratios.
The merger waves are therefore created as companies with a high Q takes over
companies with a low Q ratio.
A possible answer to economic, regulatory or technological shocks is to reallocate
assets through mergers. As companies simultaneously react and compete for the

GRA 19003 – Master Thesis 01.09.2014
Page 13
best combinations of assets, this activity clusters in time and creates merger
waves. The research by Mitchell and Mulherin (1996) proved the clustering of
mergers within industries. Through their research they found that various
economic, technological or regulatory shocks could be linked to merger waves.
Merger waves occurred as mergers clustered within industries that experienced
various shocks, such as deregulation.
Over time, several merger waves have occurred and the neoclassical hypothesis
has been linked to all of them. One has seen different combinations of mergers,
mergers creating monopolies and oligopolies, and mergers being hostile and
strategic. The antitrust laws generated the first waves, those of the 1890s and 20s,
while those of the 80s seem to have been generated by the markets´ large-scale
deregulation. In the latest years one have seen deregulations concentrated on
sectors creating industry merger waves (Vancea 2012). The merger waves have
therefore occurred as companies adapt to various shocks and changes in the
environment.
However, Harford (2005) claims that sufficient capital liquidity is needed for the
waves to occur. In order for the reallocation of assets to be conducted, capital
liquidity has to exist. Therefore, even if industry shocks do not cluster in time, the
importance of capital liquidity means that industry merger waves as reactions to
shocks will cluster in time to create aggregate merger waves (Harford 2005).
2.2.2 Behavioral hypothesis
The behavioral hypothesis was created as research found a positive correlation
between merger activity and stock market valuations. The hypothesis assumes that
merger waves are the result of overvalued markets and managerial timing. The
hypothesis is argued to be able to explain why merger waves normally occur when
there is stock market and economic boom periods, as well as why merger waves
occur at all.
Further it is argued that mergers occur when managers use overvalued shares to
buy assets of undervalued companies. The behavioral model ignores the
hypotheses about the efficient capital markets and managers willingness to
maximize shareholder wealth. However, the model brings in another aspect,

GRA 19003 – Master Thesis 01.09.2014
Page 14
namely the psychology of the players in the market. Marris (1964) (quoted by
Gugler, Mueller, and Yurtoglu (2012)) stated that one of the main objectives of a
manager was to create growth, whether it was profitable for the company or not.
Later, Mueller (1969) (quoted by Gugler, Mueller and Yurtoglu (2012)) stated that
since managers obtain a “psychological comfort” of running a larger company or
obtain greater return as companies grows, they have a high willingness to merge
companies.
Schleifer and Vishny (2003) argue that we observe merger waves because a
significant portion of merger activity is driven by stock market valuations. They
argue that bull markets create groups of bidders with overvalued stocks, which are
used as currency to buy tangible assets of undervalued targets through mergers.
By changing the overvalued stocks to tangible assets, companies avoid the loss of
value when the market realizes the overvaluation and makes corrections. On the
other hand, target managements, which are assumed to have a short time horizon,
are willing to accept bids of overvalued stocks due to the maximization of
shareholders´ profit. The stock exchange therefore creates a win-win situation. As
a result, overvaluation in total or in certain industries would result in wave-like
grouping in time (Harford 2005).
Later, Rhodes-Kropf and Viswanath (2004) developed a rational managerial
behavior model with the conditions of uncertainty regarding misvaluations, which
leads to the correlation between high stock market valuation and merger activity.
The model provides another explanation of why the managers of targeted
companies accept overvalued stocks. It is given that managers should not accept
stocks that are overvalued, unless their own company is overvalued as well.
However, they state that when one company is overvalued, the entire industry
tends to be overvalued. In other words, there exist overestimation synergies during
these periods. Hence, the target will be likely to accept the offer, since it is
similarly valued as the rest of the industry (Rhodes-Kropf and Viswanath 2004).
As a result, when the market is overvalued there is more likely for a merger wave
to occur.
Furthermore, Rhodes-Kropf, Robinson, and Viswanathan (2005) and Ang and
Cheng (2006) observed a relationship between high market-to-book (M/B) ratios
and merger waves. A high M/B ratio indicates an overvaluation of the market and
these misvaluations tend to create merger waves. As a result, industries

GRA 19003 – Master Thesis 01.09.2014
Page 15
undergoing waves tend to experience abnormally poor returns as the wave fades.
2.2.3 Neoclassical versus Behavioral hypothesis
In our research, we will follow the neoclassical hypothesis rather than the
behavioral view. This choice is partially based on the research done by Harford,
Mitchell and Mulherin and partially based on the behavioral hypothesis lack of
explanation of merger waves occurring for unlisted companies. The choice is also
in compliance with our expectations about mergers being affected by legislative
changes and macroeconomic factors.
In the research by Harford (2005), the result supports the neoclassical hypothesis
over the behavioral. Harford conducts industry-level approaches to explore the
impact of macroeconomic factors on merger activity during the 1980s and 1990s.
In his research he used two sets of factors predicted by the behavioral and
neoclassical hypotheses to be associated with merger waves. For the neoclassical
hypothesis Harford included a set of factors capturing shocks to an industry’s
operating environment. When it comes to the behavioral hypothesis, he included
a set of factors chosen to more directly examine the reliance on market timing.
The results gave clear indications that economic, deregulatory and technological
factors drive merger waves. Harford observed that the shocks precede industry
merger waves, created the merger clusters when transactions costs were low and
the capital liquidity was high. Moreover, the deregulatory variable findings are
also consistent with the findings of Mitchell and Mulherin (1996) for the wave of
the 1980s. They further suggest that variables associated with behavioral
hypothesis are important economic conditions that are necessary, but they are not
sufficient to explain why merger waves occur. It should be noted that it would be
wrong to say that no mergers have been driven by managers timing the market,
but such merger motives would not cause waves. It is rather clustering of shocks
that cause aggregate merger waves, not managers trying to time the market
(Harford 2005).
Due to Harford, Mitchell and Mulherin, the neoclassical hypothesis is found to be
more appropriate for our research.

GRA 19003 – Master Thesis 01.09.2014
Page 16
The second reason for following the neoclassical view is due to the behavioral
hypothesis lack of ability to explain merger waves of unlisted companies. The
stocks of unlisted companies cannot be overvalued, which means that the ability
of exchanging overvalued stocks with undervalued stocks is not a possibility. This
aspect especially targets Norway, where unlisted companies produce a larger
portion of the economic activity. However, unlisted companies might also be
over-or undervalued in terms of their assets, but the probability of an entire
industry with unlisted companies is found to be over- or undervalued
simultaneously is very small. We therefore find the neoclassical view more
appropriate.
On the contrary to the neoclassical hypothesis, which focuses on clustering within
industries, we will in this thesis analyze general economic shocks that affect the
overall business sector.
2.3 Commonly applied variables in previous research
The creation of our model will be based on previous research results, which will
be explained in the following section. The section explains different commonly
applied variables and main results. The variables presented are mainly based on
previous international and national studies. However, some are also combined
with logical reasoning.
A few variables have consistently appeared as potential explanatory influencers of
merger waves: measures of economic activity, such as GDP, interest rates, and
securities prices.
2.3.1 Stock price
Studies have explained stock prices as an influencer, both through the
neoclassical- and the behavioral hypothesis. However, as we have a neoclassical
approach to our thesis, it will be given most attention to the arguments concerning
the stock prices’ effect on merger, given by neoclassical hypothesis.
The level of the stock markets is one factor that appears to be important in the
majority of existing literature on this topic. Rising share prices are very often an

GRA 19003 – Master Thesis 01.09.2014
Page 17
indicator that a country’s economy is strengthening and this is followed by
increased profits for many firms (Owen 2006)
Financial theory has been supported, as it has been seen high levels of merger
activity in periods of rising stock prices and rapid economic growth. The
relationship has been explained by individual firms having the incentive and the
opportunity to capitalize on market disequilibria by arranging mergers when the
trend of stock prices is upward and the economy is booming (McGowan 1971).
Overall, stock prices have usually been found positively related to merger activity
(Melicher, Ledolter, and D’Antonio 1983). In addition, stock market performance
is claimed to be the most robust result when it comes to takeover activity
(Mitchell and Mulherin 1996). One of the first to report this relationship was
Weston (1953). He found that mergers were significantly and positively related to
stock prices. He obtained the result by using the interwar period. Later, Nelson
(1959) claimed that stock prices could drive a merger trend. Nelson got his result
on the basis of quarterly data for 1895-1904, where it was shown a strong positive
correlation between an index of industrial stock prices and the number of mergers.
The positive correlation between merger activity and the stock market was also
found to be true by Gort (1969), Steiner (1975), Beckenstein (1979), and Guerard
(1989). Mueller (1989), claims to be able to explain merger activity. First, he
argues that they occur in waves, and that these waves tend to be positively
correlated with stock market prices. Along the same line, Schleifer and Vishny
(2003) assert that the boom in the stock market is correlated with merger waves.
Rhodes-Kropf and Viswanath (2004) followed up by a study in which proves and
summarizes that the stock market drives merger activity. Also, Choi and Jeon
(2011) found stock market to be one of the most relevant factors of determining
aggregate merger activity.
In Wilson (2013) local factors that make South Africa attractive to merger and
acquisition (M&A) activity are investigated. The study looks heavily into foreign
direct investments, but it is relevant in terms of local determinants. A negative
binomial regression model with the numbers of mergers as the dependent variable
was applied. The results show that share price, market size, rate of return, and
macroeconomic stability play a key role in M&A activity. In terms of share prices,
she found that an increase in share prices, which indicates a booming stock
market, encourages M&A transactions. It has also been found that while both
positive and negative movements in security prices increase the dispersion in

GRA 19003 – Master Thesis 01.09.2014
Page 18
valuations, they affect merger frequencies in opposite ways (Gort 1969).
In the following, findings on stock prices´ effect on merger activity are presented
in accordance with the behavioral view. As merger waves have been found to
correlate with high stock market valuations, models have been developed in which
results from market overvaluation and managerial timing. In Mueller (1989) the
positive correlation between merger and stock market activity was shown. The
findings suggest that the optimism of managers in their ability to improve the
performance of acquired firms, and a general state of optimism among investors
lead to higher share prices. The historical record further demonstrates that the
level of stock prices, as the market peaks, represents a dramatic overoptimism on
future profits and dividends (Shiller 1981). Managers of acquiring firms may
simply be caught up in the same overoptimism that is affecting all investors
during a stock market boom (Mueller 1989).
2.3.2 Interest rate
Another important factor in determining the level of merger and acquisition
activity is the interest rate. Interest rates have usually been found significant, but
with mixed signs (Golbe and White 1988).
The majority of researchers have found interest rate to be positively connected to
merger activity. In the study by Steiner (1975) interest rate was claimed to explain
merger activity. Along the same line, Beckenstein (1979) found that the nominal
interest rate had a positive and significant effect on mergers. Furthermore,
Melicher, Ledolter, and D’Antonio (1983) and Guerard (1989) reported that
merger activity is heavily related to interest rates and found a positive correlation.
In the study by Yagil (1996) he investigated the relationship between
macroeconomic factors and merger activity measured in terms of both the dollar
value of the acquisition and the number of mergers. His hypothesis was that the
impact of the two macroeconomic factors, interest rate and investment level in the
economy, on merger activity are positive. The findings provided by his research
indicate that the two macroeconomic parameters are good explanation of the
variation in the degree of merger activity over time. In addition, the significance
level of the interest rate was found to be higher than that of the change in the
investment level. Also the research done by Wilson (2013) found that interest rate

GRA 19003 – Master Thesis 01.09.2014
Page 19
had a positive influence on merger activity. Wilson, which investigates local
factors that make South Africa attractive to M&A activity, found that with interest
rates as an indicator of rate of return from investment, high interest rate encourage
M&A.
However, other researches have also found interest rates to have a negative effect
on merger activity. First, Becketti (1986) found that mergers were influenced
negatively by real interest rates. Later, Golbe and White (1993) found that the size
of the economy has a positive effect on merges and that the real interest rates
appear to have a negative effect.
2.3.3 Inflation
Little empirical research has included inflation as an influencer on mergers.
However, we believe that inflation might be an important economic factor with a
possible effect on merger activity. In the research done by Wilson (2013), she
found that macroeconomic stability, which was measured by the inflation rate,
played an important role in regard to merger activity. Wilson provided results
showing that low rates of inflation encouraged merger activity. Wilson (2013) was
later followed up by a new study of Vencatachellum and Wilson (2013). The
study applied the same panel data set, but the dependent variable in this case was
the value of M&A´s, rather than the numbers of M&A. Again, inflation was used
as a macroeconomic barometer of market risk, where high levels signify a
negative economic outlook. The obtained result was similar to the first study, as
inflation was found to have a negative and statistically significant effect.
However, Fishman (1989) claims that real growth in money supply may affect
merger activity to the degree that it can reduce the opportunity cost of cash
compared to alternative funding sources. The argument is defended by the fact
that potential competition tend to be weaker following a cash offer due to
uncertainties. That lower probability of the potential buyer is challenged in a
scenario of higher liquidity motivates a positive link between M&A and growth in
money supply (Resende 2008). These arguments are also connected to inflation,
as inflation will always be based on an increase in the money supply.

GRA 19003 – Master Thesis 01.09.2014
Page 20
2.3.4 Gross Domestic Product
In previous literature, both Gross Domestic Product (GDP) and Gross National
Product (GNP) have been used as independent variables explaining merger
activity. What has been shown is that merger activity tends to be greatest in
periods of economic shocks in form of general economic expansion. Economic
expansion motivates companies to expand their operations in order to meet the
rapidly growing aggregate demand in the economy. Companies have to make
choices on how to meet the demand, and as merger is a faster form of expansion
than internal organic growth, we often see a high level of merger activity during
economic shocks (Gaughan 2011). In addition, it is easier to attempt deals of this
sort in a large economy rather than in a small one. When a firm is considering
entering the market for corporate control, it is far easier to find a suitable partner
for a merger or a target for an acquisition when there are a lot of companies to
choose from (Owen 2006).
Merger activity typically increases during expansions and decreases during
recessions. However, the number of mergers appears to be procyclical. The
increase in merger activity appears to reach its peak before the peak of the
business cycle expansion; that is, merger activity begins to decline before GNP
reaches its peak (Becketti 1986).
Overall, GNP and GDP have usually been found positively related to merger
activity (Golbe and White 1988). Gort (1969), with his ‘economic disturbance
theory of mergers’ indicates that economic growth is associated with a higher
level of uncertainty in the market and therefore mergers would more likely occur.
Steiner (1975) found that GNP has a significant positive influence on mergers.
Furthermore, GDP was found to have a positive and significant influence on
mergers by Beckenstein (1979) and Guerard (1989). Mulherin and Boone (2000)
proved that economic, regulatory and technological changes are connected to
merger activity. Chung and Weston (1982) found that mergers were positively and
significantly related to the growth rate of GNP. Choi and Jeon (2011), state that
GDP is one of the most relevant factors of determining aggregate merger activity.
In the research by Wilson (2013), she found that an increase in GDP leads to a
higher merger activity. This result confirms the role of market size encouraging
merger activity. GDP was also found to have a positive and statistically
significant effect on M&A activity, by the follow up research done by
Vencatachellum and Wilson (2013).

GRA 19003 – Master Thesis 01.09.2014
Page 21
However, Becketti (1986) found that real GNP negatively influenced mergers, but
his statistical significance was not strong.
2.3.5 Unemployment rate
Unemployment is another factor, which has been given little attention in previous
research. Given previous findings and through logical reasoning, it is expected
that unemployment might have an effect on mergers as this represents companies
that adapt to changing operating conditions and make changes in order to create
new growth. In Mitchell and Mulherin (1996), the impact of industry shocks on
takeover and restructuring activity was examined. They found that employment
shocks are positively related to merger activity. The result indicated that
employment shocks had a significant relation between industry mergers and the
restructuring activity. Looking at unemployment in another way, it is often argued
that mergers and acquisitions lead to employee layoffs (O'Shaughnessy and
Flanagan 1998) thus merger activity tends to correlate with higher levels of
unemployment.
2.3.6 Oil price
Jensen (1993) found that the oil price shocks not only directly affect the oil
industry itself, but also the structure of industries in which energy is a major input.
In the research by Mitchell and Mulherin (1996), energy dependence was found to
have a positive effect on merger activity. Furthermore, as Norway is highly
dependent on oil production, we look at oil price as a possible variable in our
model. Value added in the oil industry is 22 percent of Norway's gross domestic
product (Moen 2011). In other words, an increase in oil prices, assuming that sales
are constant, would increase growth in the Norwegian economy. This will create
ripple effects for Norway's imports and exports, as higher economic growth
creates inflation and higher interest rates. It represents, however, a small
proportion of employment in this country, and only 8 percent are related directly
or indirectly to the industry (Moen 2011). Despite a low share of employment in
this sector, oil revenues have a great impact on other industries, especially in
terms of import and export industries.

GRA 19003 – Master Thesis 01.09.2014
Page 22
2.3.7 Change in assets
An important caveat to all of the theories connecting economic factors and the
level of merger and acquisition activity is that they all presume that external
factors are able to drive decision making within the firm and, if necessary,
override internal concerns. This may, indeed, be the case but there will always be
instances in which internal factors will either encourage or prohibit a firm’s entry
into the market for corporate control (Owen 2006). We have therefore included
the change in assets variable to our model, as slow growth or decline in assets is
an internal factor encouraging mergers.
A variety of different accounting variables have been included in regressions as
measures of firm growth. Lakonishok, Shleifer, and Vishny (1994) used growth in
sales, Titman, Wei, and Xie (2004) included growth in capital investment, Sloan
(1996) used accruals, and a cumulative accruals measure (net operating assets)
was included by Hirshleifer et al. (2004). However, the firm asset growth rate is
the strongest determinant of future returns, with t-statistics of more than twice
those obtained by other previously documented predictors (Cooper, Gulen, and
Scill 2008). Cooper, Gulen, and Scill (2008) use change in assets as their main
test variable, and it is a simple and comprehensive measure of firm asset growth,
the year-on-year percentage change in total assets.
3 Mergers in Norway
This chapter introduces mergers in Norway with respect to definitions, different
types of mergers, and merger motives. The chapter concludes with a review of the
development of number of mergers in Norway the last years.
3.1 Definitions and types
Mergers are types of capital changes. A merger is when two or more companies
merge together to one entity. Substantial for this type of transaction is that the
settlement takes place by a change in equity. Mergers cause legal challenges in
terms of company law, tax law and accounting law.

GRA 19003 – Master Thesis 01.09.2014
Page 23
The term merger is used in a broad sense, regardless of the scope and of technical
implementation. Mergers are described in the Norwegian Company Act Chapter
13. From this provision it follows that:
A merger is when a company (the assignee company) is to take over the assets,
rights and obligations of another company (the assigning company) as a whole
against consideration to the shareholders consisting of
1. shares in the assignee company, or
2. such shares with an addition which may not exceed 20% of the total
consideration.
Mergers are thus one possible type of equity transaction. A transaction that
follows the merger provisions of the Company Act benefits from a number of
advantages compared to alternative methods of mergers and acquisitions. Such
advantages include tax achievements, legal and contractual continuity, among
others.
Merger by admission:
Figure 3.1: Merger by admission
a b c d
A B
a b c d
A A + v1/v2
v1 v2 Business content
Stocks
A merger by admission is carried out through a transfer of the entire assets and
liabilities of an assigning company to an assignee company cf. the Company Act
§13-2 cf. §13-4. The consideration is rendered from the assignee company to the
shareholders of the assigning company. The consideration normally consists of
shares in the assignee company, or shares with an additional sum of cash. As a
consequence of this transaction, the assigning company ceases to exist. This is the
main system in an ordinary merger according to Norwegian company law.

GRA 19003 – Master Thesis 01.09.2014
Page 24
Merger by new establishment:
Figure 3.2: Merger by new establishment
a b c d
A B
a b c d
A C + v1/v2
v1 v2
Business content
Stocks
Newco C
In a merger by new establishment, the assignee company is a new established
entity, and the consideration is rendered from this new company. This type of
merger is basically subject to the same regulations as merger by admission. The
two assigning companies that transfer their assets and liabilities to the new
established company ceases to exist after the merger.
Triangle mergers:
Figure 3.3: Triangle merger
a b c d
D
B
a b c
A D + v1/v2 v1
v2
Business content
Stocks
A
Claim
A
In 1985 Norwegian legislators gave way to an alternative way of merger in certain
group affiliations, by allowing the consideration to consist of shares in the
transferee company’s parent company. In that way at least three companies are
involved. These are the transferor company, the transferee company and the
parent company, which renders the consideration, a “triangle merger”. This type
of merger is rare outside Norway. The European Merger Directive (the third EEC
Company Law Directive, 78/855/EEC) has no rules concerning triangle mergers,

GRA 19003 – Master Thesis 01.09.2014
Page 25
nor are such rules to be found in the other Nordic countries’ company acts
(Giertsen 2004).
Parent-daughter merger:
Figure 3.4: Parent-daughter merger
a b
A
D
A A + v1/v2
v1
v2
a b
Merger between a parent company and a wholly owned subsidiary is stated in the
Company Act §13-23. This type of merger differs from the ordinary merger
process, by that the boards of directors of the companies may adopt a merger plan,
which provides that the subsidiary´s assets, rights and obligations as a whole shall
be transferred to the parent company without consideration. The merger has to be
carried out according to certain rules stated in the provision.
Daughter-daughter merger:
Figure 3.5: Daughter-daughter merger
a b
A
D1 A D1 + v1/v2 v1 Bus. content
a b
D2 v2
A
Mergers between companies within the same owner are stated in the Company
Act §13-24 (does not apply for public limited liability companies). In the event
that two private limited liability companies have the same owner, these may
resolve a merger plan, which provides that all of the assets, rights and obligations
as a whole of one of the companies shall be transferred to the other company

GRA 19003 – Master Thesis 01.09.2014
Page 26
without consideration. The merger decision requires two-thirds of the general
assembly, and the subsidiaries have to be wholly owned by the parent.
Cross border mergers:
The provisions in the Company Act chapter 13 do also apply for mergers between
one or more private limited liability companies and one or more foreign
companies having their registered offices or their main offices in another EEA-
state, and which are subject to the laws of another EEA-state than Norway.
3.2 The process
A merger process takes place in stages during a period of 8-16 weeks, and can be
divided in the following steps:
- Preparation
- Board decision and convening to the general meeting
- Decision by the general meeting
- Creditor notice period
- Implementation
The preparation time will vary according to the complexity of the transaction. The
preparation comprises valuation of the participating companies, and clarifications
of other prerequisites for the transaction. By the Company Act it follows that the
maximum time period from valuation through the general meeting is 8 weeks. The
decision by the general meeting has to be reported to the Brønnøysund Register
Center (BRREG), which further notifies the creditors. In July 2013 changes in
regulation concerning simplifications in the process entered into force. Among
other changes, the creditor notice period was reduced from 2 months down to 6
weeks.
3.3 Merger Motives
There are several possible motives and reasons why companies might engage in
mergers. The motives for mergers, suggested in the literature, are mainly of two
types: operating and financial. Operating motives include improving operating

GRA 19003 – Master Thesis 01.09.2014
Page 27
efficiencies, enhancing growth, improving market control, attaining managerial
improvement, and pooling resources for research and development and
technological expertise. Financial motives include diversification, tax benefits,
increased debt capacity, reduced bankruptcy risk and cost, and utilization of cash
flow surpluses (Yagil 1996). In Yagil (1996) it was revealed that management,
which perceives growth as enhancing to its own interest, might influence mergers.
However, these mergers do not appear to be associated with profitability.
Growth
One of the most fundamental motives for mergers is growth. A company can grow
internally, but external growth through mergers or acquisitions is often preferable
due to time perspective. Weston, Chung, and Hoag (1990) list some factors that
favor external growth:
1. Some goals and objectives may be achieved more speedily through an
external acquisition.
2. The cost of building an organization internally may exceed the cost of an
acquisition.
3. There may be fewer risks, lower costs, or shorter time requirements
involved in achieving an economically feasible market share by the
external route.
4. The firm may be able to use securities in obtaining other companies,
whereas it might not be able to finance acquisition of equivalent assets and
capability internally.
5. Other firms may not be utilizing their assets or management as effectively
as they could be utilized by the acquiring firm.
6. There may be tax advantages.
7. There may be opportunities to complete the capabilities of other firms.
Synergy
Another reason for the transaction is potential synergistic gains. Synergy occurs
when the sum of the parts is more productive and valuable than the individual
components (Gaughan 2011).We distinguish between operating and financial
synergies. Operating synergy can be implemented through revenue enhancement
or cost reducing measures. Potential sources of revenue enhancements might

GRA 19003 – Master Thesis 01.09.2014
Page 28
come from a sharing of marketing opportunities by cross-marketing each merger
partner´s product (Gaughan 2011). On the other hand, the main source of
operating synergy comes from cost reductions. Cost reductions might be a result
of economies of scale – decreases in per unit costs that result from an increase in
the size or scale of company´s operations.
Financial synergy refers to the impact of a corporate merger or acquisition on the
costs of capital to the acquiring firm or the merging partners. The extent to which
financial synergy exists in corporate combinations, the costs of capital should be
lowered (Gaughan 2011). Another widely discussed proposition is that the debt
capacity of the combined firm can be greater than the sum of the two firms´
capacities before the merger, and this provides tax savings on investment income
(Weston, Chung, and Hoag 1990).
Diversification
Diversification could also be a reason why companies decide to merge.
Diversification means growing outside a company´s current industry category
(Gaughan 2011). A company might diversify to take leading positions, or take
over more profitable firms. Diversification per se may have value for many
reasons, including demand for diversification by managers and other employees,
preservations of organizational and reputational capital, and financial and tax
advantages (Weston, Chung, and Hoag 1990).
Horizontal Integration
Horizontal integration refers to the increase in market share and market power that
results from acquisitions and mergers of rivals. Horizontal integration might
motivate mergers because of market power, which may increase prices and thus
revenues.
Vertical Integration
Vertical integration refers to the merger or acquisition of companies that have a
buyer– seller relationship (Gaughan 2011). Companies might engage in vertical
integration to be assured of a dependable source of supply. This is an advantage
when companies pursue just-in-time inventory management, to get lower
inventory cost, or if there is a need to have specialized inputs.

GRA 19003 – Master Thesis 01.09.2014
Page 29
Inefficient Management
Mergers might be motivated by replacement of management. If the management
is poor, or inefficient in some way, merging with another company with better
management will make the operations continue.
Tax advantages
In Norway, tax is an important motive. If a merger is conducted in accordance
with the Norwegian law, no tax is charged. This is in contrast to acquisitions,
which is taxed after Norwegian realization rules.
3.4 Risks
Mergers, however, may not provide automatic basis for success. These types of
transactions might present formidable challenge to effective managerial planning
and control performance. Accordingly there are important to be aware of risks.
The general business activity is at risk. There might be problems with the
corresponding consolidations among competitors or customers and suppliers.
Mergers will in most cases result in increased costs in terms of logistic and
management problems. Further, there might arise integration problems when
combining different organizational cultures in the companies that are participating
in the merger. Violation of confidentiality agreements might occur, especially for
merger attempts, which does not result in a merger. The two companies know
confidential information about each other and the confidentiality can be broken if
the merger implementation is terminated (Perland 2014).
GRA 19003 – Master Thesis 01.09.2014
Page 30
3.5 Development of mergers
Figure 3.6: Development of mergers
!"!!!!
!!500!!
!1!000!!
!1!500!!
!2!000!!
!2!500!!
!3!000!!
!3!500!!
1999!2000!2001!2002!2003!2004!2005!2006!2007!2008!2009!2010!2011!2012!
Number!of!mergers!
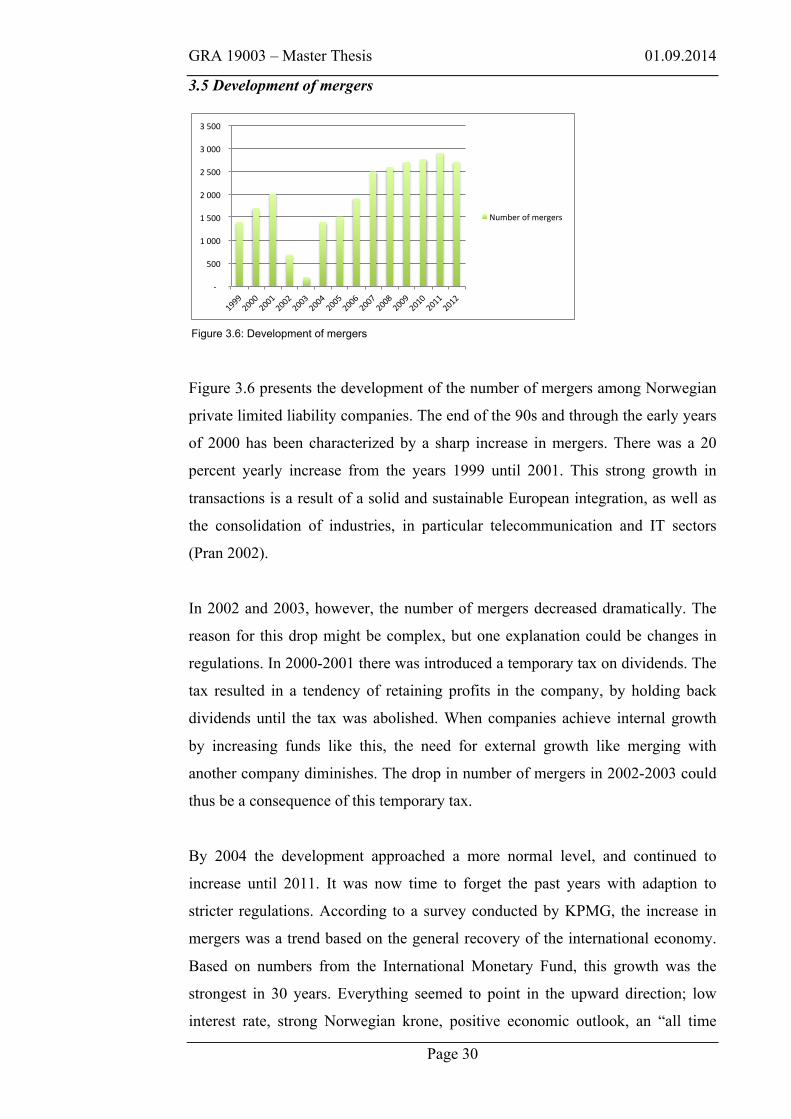
Figure 3.6 presents the development of the number of mergers among Norwegian
private limited liability companies. The end of the 90s and through the early years
of 2000 has been characterized by a sharp increase in mergers. There was a 20
percent yearly increase from the years 1999 until 2001. This strong growth in
transactions is a result of a solid and sustainable European integration, as well as
the consolidation of industries, in particular telecommunication and IT sectors
(Pran 2002).
In 2002 and 2003, however, the number of mergers decreased dramatically. The
reason for this drop might be complex, but one explanation could be changes in
regulations. In 2000-2001 there was introduced a temporary tax on dividends. The
tax resulted in a tendency of retaining profits in the company, by holding back
dividends until the tax was abolished. When companies achieve internal growth
by increasing funds like this, the need for external growth like merging with
another company diminishes. The drop in number of mergers in 2002-2003 could
thus be a consequence of this temporary tax.
By 2004 the development approached a more normal level, and continued to
increase until 2011. It was now time to forget the past years with adaption to
stricter regulations. According to a survey conducted by KPMG, the increase in
mergers was a trend based on the general recovery of the international economy.
Based on numbers from the International Monetary Fund, this growth was the
strongest in 30 years. Everything seemed to point in the upward direction; low
interest rate, strong Norwegian krone, positive economic outlook, an “all time

GRA 19003 – Master Thesis 01.09.2014
Page 31
high” stock market, and a better income level in general. These factors are
according to KPMG a clear indication of increased merger activity. KPMG was
right, the number of mergers increased further until 2008 (StavangerAftenblad
2005). A fall in number of mergers and acquisitions internationally in 2008 was
caused by the credit turmoil. After the financial subprime crisis came to the
surface in the United States, the financial climate changed dramatically. Banks all
around the world tightened the lending conditions and investors required more
return to take risk. However, Norway was not hit as hard. This is partly explained
by continued activity in the petroleum and offshore industry (DagensNæringsliv
2008). The effect of the crisis on Norwegian mergers is only reflected in the lower
increase during the years of the crisis.
From 2008 until 2011 the growth in number of mergers was at a level around 4
percent yearly increase, compared to a yearly increase around 30 percent in 2006
and 2007. In 2012, however, number of mergers decreased by 7 percent. There are
different opinions of what causes these fluctuations. Recent findings show that the
general economy has an impact, regulative changes are also an important factor,
and new amendments have occurred in Norway the past years. However, research
on the topic is limited which makes further analysis interesting.
4 Merger regulations
In this chapter merger regulations in Norway are presented with respect to
legislative changes in recent years.
4.1 Background
The origin of the Norwegian regulation on mergers is primarily related to the
principle of continuity and the harmony of European law. The purpose of the
provisions on mergers in the Norwegian Company Act is to open for a simplified
merger- or sharing process for companies. The considerations behind the
formulations put more emphasis on business and economic efficiency than on the
minority shareholders and creditors. In return the minority shareholders and
creditors are protected by the principle of continuity. The principle means that the

GRA 19003 – Master Thesis 01.09.2014
Page 32
assigning company´s judicial situation is transferred and will be continued by the
assignee company.
The Norwegian Taxation Act provides further regulations on mergers concerning
tax treatment. By the Norwegian Taxation Act § 11-1 it follows that mergers are
basically taxable transactions. The solution is however that mergers that are
implemented in line with the Norwegian Company Act, occurs with tax
continuity.
Recently, changes in the Norwegian Company Act were made which involves
simplifications in the administrative procedures with respect to mergers
(Stortinget 2011). This change will possibly affect the company´s merger
decisions. Regulative changes that may have an impact on mergers are not limited
to the specific provisions on mergers in the Company Act. A broader perspective
should be considered when studying the development of mergers.
The regulations decide the complexity of the process and are important in the
decision of a potential merger. Changes in regulations will thus affect the
development of the scope of mergers, which is what this thesis seeks to
investigate and look further into.
4.2 Recent changes in regulations
4.2.1 Temporary tax on dividends in 2001
In 2000 a temporary tax on dividends was introduced in Norway. The tax was
effective from late 2000 and throughout 2001. Dividends were tax exempt for
shareholders during 1992-2000. Only the general tax on capital gains of 28
percent applied for companies. The new amendment in 2000 imposed an
additional tax on dividends of 11 percent for the shareholders. The effective tax
rate thus increased from 28 percent to 35.9 percent.
The rational behind the temporary tax was to strengthen the effect of the so-called
split model. There were strong incentives to shift income from the labor income

GRA 19003 – Master Thesis 01.09.2014
Page 33
tax base to the capital income tax base. The split model of dual income taxation
was designed to prevent this income shifting. The dividend tax was in fact an
attempt to strengthen the distribution properties of the current tax regime, until the
entire taxation system in Norway should be reformed. However, the politicians
had conflicting opinions about the dividend tax. The ruling political party, the
Norwegian Labor Party, implemented the temporary dividend tax at that time. The
Conservative Party of Norway was on the other hand strongly disagreeing, and
argued that the dividend tax would create an inefficient business sector. The
market seemed to have the same opinion, as the Conservative Party got higher
support relative to the Labor Party when the dividend tax was introduced. A new
election took place in 2001, where the Conservative Party won, and the temporary
tax was immediately removed.
Burman and Randolph (1994) studied the response to capital-gains tax changes.
They concluded that shareholders are actively avoiding tax, and that temporarily
taxes will largely result in significant adjustments to save tax. In a report of the
adaption effects of the dividend tax in 2000-2001, Dypbukt (2004) found that
most companies timed their dividends and performed active tax avoidance in
2000-2001. Alstadsæter and Fjærli (2009), also found strong timing effect on
dividend payments around the temporary dividend tax in 2001.
If a dividend tax rate is implemented, companies will adjust to save tax.
Accordingly they will wait with the dividend payments, and retain funds in the
company. Dypbukt (2004), shows that we experienced a lock-in effect of
dividends during the period where the temporary tax was effective. The
management decides to distribute the earnings differently. When firms decide to
transfer the surplus to retained earnings, the equity increases, and the company
experiences internal growth. Thus, the incentive to obtain growth externally by
merging decreases. Further, the repeal of the tax will thus lead to reestablishment
of the normal dividend policy. Accordingly, the incentive to merge will eventually
increase, but this effect will be shown at a later point in time.

GRA 19003 – Master Thesis 01.09.2014
Page 34
4.2.2 New tax reform in 2006
In 2006 a new tax reform entered into force in Norway, and implied a major
revision of the dual income tax system of the 1992 tax reform. The Nordic Dual
Tax system is characterized by separate tax schedules for capital and wage
income. It combines a low proportional tax rate on capital income with a
progressive tax rate on other income, mostly labor income. For medium and high
income classes, there is a large difference in the marginal tax rates on capital and
labor income, providing great incentives for income shifting from labor income to
capital income in order to minimize tax payments (Alstadsæter 2007). The main
purpose of the new tax reform in 2006 was to stop income shifting between the
labor and capital income tax bases without worsening the conditions for
investment and economic growth (Alstadsæter and Fjærli 2009).
As part of the new tax reform in 2006, the Exception-Model (Alstadsæter and
Fjærli 2009) was introduced without warning in March 2004 and created a new
chapter in the history of mergers. The method basically exempts companies from
tax on dividends and tax on gains from realization of shares. The purpose is to
avoid double taxation within the corporate sector (Regjeringen 2011a). For
corporate shareholders the Exception-Model enabled tax-free acquisitions.
Personal shareholders, however, were not exempted: The dividend tax shifted
from zero to positive for individuals. A transition rule ensured that if an individual
shareholder sold his shares in a corporation to another corporation during 2005,
and was compensated in the form of shares in this new corporation, no capital
gains taxes applied. This was the so-called transition rule E, and the motivation
for this was to equalize tax treatment of personal shareholders and individuals
who owned shares through a holding company. Now all individual shareholders
had the possibility to transfer their shares to a holding company without triggering
any capital gains tax under the pre-reform regime (Alstadsæter and Fjærli 2009).
Berzins, Bøhren, and Stacescu (2013) examine a large sample of private
Norwegian firms with a controlling stockholder that was exposed to the new tax
law in 2006. They find that the use of holding companies increases strongly after
the tax reform.
The Exception-Model will thus influence the development of mergers in two
ways. First, the Model enabled tax-free acquisitions instead of going through the

GRA 19003 – Master Thesis 01.09.2014
Page 35
comprehensive merger regulations. Accordingly the Exception-Model will have a
negative influence on the development of ordinary mergers. On the other hand,
the Exception-Model increased the need to apply the merger regulations to
restructure into holding companies. The restructuring process often involved
mergers in terms of triangle mergers with two companies and a demerger
followed by realization of shares, or the establishment of a new holding structure
followed by a triangle merger (Gjems-Onstad 2012).
4.2.3 Audit exemption in 2011
In May 2011 the new regulation of audit exemption entered into force. The
background for the amendment is rooted in EU law and the development in other
countries. In 1994 the EC Fourth Directive permitted national governments to
dispense with the requirement for small companies to undergo a statutory audit
(Collis, Jarvis, and Skerratt 2004). Most member states currently offer audit
exemption to small companies using country-specific size criteria or the EU
maxima (Collis 2007). Denmark and Sweden are among the countries that
adopted the exemption. The interest of harmonization and consideration for
competition then led to the modification of the statutory audit also in Norway
(Regjeringen 2011b).
The exemption is voluntary, and the decision has to be determined by the general
assembly. The requirements for exemption are turnover less than 5 million NOK
(0.6 million EUR), balance sheet total less than 20 million NOK and (2.4 million
EUR) and average number of employees no more than 10. The company cannot
be a parent company of a group, nor be under supervision of the Financial
Supervisory Authority (Regnskapsbyrået 2011). The new regulation contributes to
less administrative burdens and increased cost savings for the companies that
choose to opt out. This is an incentive for companies to demerge to get under the
thresholds. One might believe that there will be fewer mergers in total, since
companies now have a new potential cost to account for when calculating the
benefits of mergers.
Another regulation that became effective in 2011 was the increased access for tax-
free reorganization. Initially the provisions relating to tax-free mergers only

GRA 19003 – Master Thesis 01.09.2014
Page 36
applied when all companies participating in the merger were domiciled in
Norway. Since 2011 the cross-boarder mergers and demergers can on certain
conditions be implemented without immediate tax-effect. The tax exemption will
apply to both company and shareholder. The cross-border merger must be
conducted in accordance with the provisions of chapter 13 of the Companies Act.
The amendment will facilitate for mergers, which possibly will result in an
increased number of mergers.
In addition the so-called “legality requirement” was repealed. A tax legal
condition required for favorable tax positions to be valid. The terms said that
company law and accounting law rules must be followed for that condition could
be considered fulfilled. The loss of the legality requirement means that certain
mergers that previously would not qualify for tax exemption, today can be
implemented without taxation. The current implementation of mergers will now
be easier and less costly since companies do not have to deal with discretionary
legality conditions (DetJuridiskeFakultet 2013).
4.2.4 New capital requirement in 2012
In January 2012 the requirement for share capital in order to become a private
limited liability company in Norway was changed. The requirement was reduced
from NOK 100 000 to NOK 30 000. In addition it was decided that it is allowed to
use the paid in share capital to cover the founding expenses. The Act also enables
credit institutions – not only auditors – to confirm that the company has received
the paid in share capital. This will affect the founding of new corporations, and
make it less expensive.
The new regulation is part of the government´s effort to simplify and modernize
the Norwegian Private Limited Liability Company Act. The purpose of the
amendments is to stimulate innovation and new businesses. It is also desirable to
make the Norwegian private companies more competitive with the aim of
reducing the use of foreign business organization (so-called NUF). The
simplification in the Act was expected to increase the number of new established
corporations.

GRA 19003 – Master Thesis 01.09.2014
Page 37
Out of 215 675 companies that were registered in December 2010, 105 432
companies had a share capital of NOK 100 000. It is reason to believe that many
of these have determined the share capital only to fulfill the requirement. Funds
that could be invested or used otherwise are locked in the company. The new
regulation will possibly lead some companies to reduce the share capital of the
new minimum requirement of NOK 30 000 and release a portion of these funds to
the shareholders. Relating this to mergers, it is reason to believe that the incentive
to merge decreases. Companies no longer need to merge two business activities
into one company in times where capital is needed, but not available, because of
locked up funds.
5 Variables and hypotheses
This chapter explains the choice of variables used in the model, and concludes
with a deduction of the hypotheses.
5.1 Dependent variable
Our dependent variable, percentage of mergers of total firms (PMTF), is given by
the total amount of mergers divided by the total amount of firms per year. A ratio
is used in our model in order to obtain the real change in mergers and not to be
misled by the development of total firms over time.
5.2 Independent variables
The independent variables include macroeconomic factors, dummy variables
capturing the effects of the regulative changes, and a control variable capturing
internal firm factors.
Macroeconomic variables
When we in this paper consider the impact of legislative changes that have taken
place in Norway, we want to combine this with macroeconomic variables that
have repeatedly been shown to be significant and have a strong influence on
mergers. It is important to control for those variables that have the greatest impact

GRA 19003 – Master Thesis 01.09.2014
Page 38
on mergers when we examine the impact of legislative changes. The choice of
macroeconomic variables has been determined by an examination of the
correlation between the independent variables and by previous literature.
Based on previous literature, there are a relatively large number of different
macroeconomic variables that can be applied in order to explain merger activity.
The risk that the variables measure the same theoretical variable (the same
characteristic) is therefore potentially high. An examination of the correlation
between the independent variables has been carried out in order to investigate how
well the term validity is. No explanatory variables must be 100% linear
combinations of others. The less they correlate, the better it is. High correlation
between the explanatory variables can lead to unstable coefficients and
corresponding high p-values because it becomes difficult to identify which
variables explaining what. Figure 5.1 presents the correlation matrix, which revels
that there is a quite high correlation between several of the independent variables,
especially GDP, stock price, oil price, long-term interest, and CPI. The results are
not surprising, as these factors tend to move in the same direction. The correlation
will be taken into account when we further examine possible variables given
previous literature.
GDP Interest Long-term Unemployment Stock price Oil Price CPI
interest
GDP 1,0000
Interest -0,5694 1,0000
Long-term interest -0,8431 0,8512 1,0000
Unemployment -0,2175 -0,4996 -0,1514 1,0000
Stock price 0,7689 -0,6542 -0,7568 -0,2039 1,0000
Oil price 0,9739 -0,4916 -0,8263 -0,2626 0,7158 1,0000
CPI 0,9748 -0,6463 -0,8516 -0,0594 0,7170 0,9182 1,0000
Figure 5.1: Correlation matrix - Macroeconomic variables
Previous literature overall agrees that there are two main motives for mergers:
operating and financial. We have therefore chosen to base our study on Yagil
(1996). Yagil conducted a study, which is based on the two main motives,
operating and financial motives. The purpose of the study was to investigate the
effect of interest rate and investment level on merger activity. The findings
indicate that the two macroeconomic parameters offer a good explanation of the

GRA 19003 – Master Thesis 01.09.2014
Page 39
variation in the degree of merger activity over time. However, the findings in
Yagil’s research reveal that the interest rate is more statistically significant than
the change in the investment in explaining merger activity. We therefore move
somewhat away from his research by changing the investment level as a
parameter to gross domestic product (GDP). This change is done, as we believe it
will improve our model in that it captures the most influential determinants of
mergers. First, GDP is believed to be more influential as it has been included in
most studies on mergers and have in these been found to be significant and to be a
strong influencer. Secondly, by using GDP as a parameter, the investment level
will be indirectly included as it is a part of the GDP equation. GDP (Y) in total
consists of consumption (C), investment (I), government spending (G) and net
exports (X - M).
Y = C + I + G + (X - M)
In addition, as we know from the correlation matrix, GDP have a high correlation
with several of the other independent variables. We believe that in order to obtain
more consistent coefficients, stock price, oil price, and, CPI should not be
included in the model. Furthermore, unemployment is also excluded from the
main model as it has been given little attention in previous research.
As Yagil found interest rate to be strongly statistically significant, interest rate
will be included in the model. However, different measurement of interest rate has
been applied. The majority of researchers use the long-term interest rate, and it
has therefore been chosen as the most appropriate variable. Despite the relatively
high correlation between GDP and long-term interest, compared to GDP and
interest rate (short term), long-term interest rate have been shown through
empirical research to be a more reliable variable by being significant and having a
strong influence on mergers, compared to the short-term interest rate.
To summarize, in accordance with theory and previous empirical research, as well
as our correlation matrix, the main model includes GDP and long-term interest
rate as these are found to trigger mergers.
GRA 19003 – Master Thesis 01.09.2014
Page 40
Legislative changes
The effect of regulative changes on merger activity will be measured by binary
(dummy) variables in the regression model.
Dummy 2002:
The dummy is included to capture the effects of the temporary tax on capital gains
and dividends. The effect on mergers, in particular, is believed to occur a couple
of years after the tax was effective. Therefore, the dummy is set to capture the
effects of the years 2002 and 2003.
Dummy 2006:
This dummy captures the effect of the new tax reform of 2006. The dummy
measures the effect before and after 2006, by taking value 1 for observations in
2006 and later years, and 0 before 2006.
Dummy 2011:
This dummy captures the effect of both the audit exemption that came in 2011 and
new capital requirement from 2012. The reason for having one dummy is due to
the fact that the two amendments occurred almost at the same time. Hence, the
effects of the two amendments will be difficult to test individually. The dummy
measures the effect before and after 2011, by taking value 1 for observations in
2011 and 2012, and 0 before 2011.
Company specific variable
Change in asset is a control variable that captures internal relationships within
companies. It is included to capture typical growth companies and is measured by
the change in a firm´s asset per year. There will always be instances in which
internal factors will either encourage or discourage growth through mergers. We
have therefore included the change in assets variable to our model, as a reduction
or a static level in total assets is an internal factor encouraging mergers.

GRA 19003 – Master Thesis 01.09.2014
Page 41
5.3 Hypotheses
Macroeconomic impact
Merger activity typically increases during expansions and decreases during
recessions. GDP has usually been found positively related to merger activity, and
is one of the most relevant factors of determining aggregate merger activity.
H1: GDP has a positive effect on mergers.
Yagil (1996), discusses that mergers are customarily viewed as channels for
external growth as opposed to internal growth in the form of increased investment
in existing or new lines of products. The cost of financing the investment will in
turn, vary directly with the interest rate in the economy. Therefor, an increase in
the interest rate will increase the likelihood for external growth via mergers and
acquisitions. Several other researchers have found interest rate to be positively
connected to merger activity.
H2: Interest rate has a positive effect on mergers.
Impact of regulative changes
In 2000 the government announced a temporary dividend tax that applied for
companies in 2001. The temporary dividend tax resulted in a strong tendency of
timing dividends among companies. The shareholders decided saving instead of
consumption, and hold back dividend payment until the temporary tax was
repealed. When the surplus is transferred to retained earnings, the equity
increases, and the company experiences internal growth. Thus, the incentive to
obtain growth externally by merging decreases.
H3: The temporary dividend tax in 2001 had a negative effect on mergers.
In 2006 a new tax reform entered into force in Norway. As part of the new tax
reform, the Exception-Model was introduced. From this model it follows that
dividends paid to corporations are tax exempt, as are corporation’s capital gains

GRA 19003 – Master Thesis 01.09.2014
Page 42
from realization of shares. The shareholder income tax only applies for
individuals. The new amendment gave incentives to restructure or establish
holding companies. It was later proved by Berzins, Bøhren, and Stacescu (2013)
that the number of holding companies increased by 460% in 2005. Accordingly,
the tax reform of 2006 may have influenced the development of mergers in two
different ways. By enabling tax-free acquisitions, there was no need to use
ordinary mergers as a means to combine two entities without obtaining a tax
liability. This force suggests a negative influence on mergers. However, the
tendency of restructuring into holding companies resulted in an increased amount
of mergers, especially triangle mergers. We believe the latter force had the
strongest impact. In addition we will experience the effect of the repeal of the
temporary dividend tax in 2001.
H4: The new tax reform in 2006 had a positive effect on mergers.
In 2011 and 2012, new regulations with potential effect on merger activity entered
into force. The two main amendments occurring these years were the audit
exemption in 2011, and the new capital requirement in 2012. The audit exemption
might affect those companies that are just within the thresholds, and are exempted
audit. In a potential merger decision where the merger will result in crossing the
thresholds, the audit expense will increase the incentive to terminate the merger
implementation.
In 2012 the new capital requirement entered into force. The requirement was
decreased from 100 000 NOK to 30 000 NOK. This allows companies to use
locked up funds. Companies that were facing a merger decision due to capital
need now had an incentive to drop the merger plans. Both amendments are thus
believed to decrease merger activity. Due to the fact that these two regulative
changes occurred within a short time horizon and are hypothesized to influence
mergers in the same direction, the hypotheses are combined.
H5: New regulations in 2011 and 2012 had a negative effect on mergers.

GRA 19003 – Master Thesis 01.09.2014
Page 43
Change in assets
One of the most fundamental motives for mergers is growth. To control for
individual firm growth, an accounting variable should be included. Cooper,
Gulen, and Scill (2008) argue that total asset growth is the strongest determinant
of future returns, with a t-statistic twice the size of that obtained by other growth
variables previously documented in the literature. Asset growth is positively
correlated with merger activity.
H6: Change in assets has a positive effect on mergers.
6 Methodology and data
This chapter describes the data provided in the study, followed by a thorough
discussion of the methodology. It reviews estimation techniques, definitions of
variables and concludes with expressing the regression model.
6.1 Description of data
The data is obtained from the Center for Corporate Governance Research (CCGR)
and the Brønnøysund Register Center (BRREG). CCGR focuses on empirical
research and primarily studies Norwegian firms. Distinct for this database is the
sample of private firms. In general, collecting data on private firms is a
comprehensive process, and sometimes even impossible. CCGR has made
research on small and medium sized companies (SME) possible by storing
information on private firms since 1992. The center has provided us with a dataset
consisting of accounting variables on Norwegian companies from 1998 until
2012. The main purpose of the accounting variables is to inspect the properties
and to be able to describe the data. However, assets will in addition be used to
obtain a control variable in the regression model.
BRREG develops and operates many of the nation´s most important registers and
electronic solutions. Transactions such as mergers have to be registered in this
center. BRREG has provided us with data on companies that have participated in
mergers in the period from 1998 to 2012. The macroeconomic data is retrieved

GRA 19003 – Master Thesis 01.09.2014
Page 44
from the OECD statistics and Norges Bank, the Norwegian central bank. The
combined data constitutes the final dataset for the study.
The dataset has observations of different firms, which is observed over time.
When a dataset consists of both time-series data and cross-sectional data, it is
called panel data. The number of observations is not the same for each company,
because the companies vary over the time period. The panel is though an
unbalanced panel (Gujarati and Porter 2009).
Panel data can better detect and measure effects that simply cannot be observed in
pure cross-section or pure time-series data. Accordingly this type of data is better
suited to study the dynamics of change. On the other hand, estimation and
inference problems like heteroscedastisity and autocorrelation need to be
addressed (Gujarati and Porter 2009)
The thesis aims to investigate what influences mergers, in particular the effect of
regulative changes in the Norwegian Private Limited Liability Company Act. One
of the amendments regards the audit exemption in 2011. The exemption does not
apply for parent companies in a consolidation (The Norwegian Private Limited
Liability Companies Act § 7-6 cf. The Norwegian Auditors Act § 2-1 (5)). The
sample of firms in this dataset is thus only Norwegian private companies (AS),
excluding parent companies. The figure below presents an overview of total
number of firms in the dataset. The development of firms has decreased over the
period.
Figure 6.1: Total number of firms
!"!!!!
!20!000!!
!40!000!!
!60!000!!
!80!000!!
!100!000!!
!120!000!!
1999!2000!2001!2002!2003!2004!2005!2006!2007!2008!2009!2010!2011!2012!
Total!number!of!firms!

GRA 19003 – Master Thesis 01.09.2014
Page 45
The total sample of firms consists of firms with an average turnover of 22 million
NOK and an average balance sheet total of 49 million NOK. Further, the total
sample has an average debt ratio of 1.6. The average number of employees is 6
and the average number of owners is 2. According to the European definition of
small and medium sized firms (SME), the average firm in the sample is a small
company (EuropeanCommission 2003). Most Norwegian firms are small
companies (Regjeringen 2013), thus the dataset provides a representative sample
for the Norwegian economy. The total sample contains 1 365 295 observations.
Recall that he development of mergers in Norway from 1999-2012 is presented in
the introduction (figure 1.1). The amount per year increased in the beginning of
the period until 2001, followed by a drop from 2001 to 2003. In 2004 the amount
of mergers again started to grow, with the highest increase of 31 percent from
2006 to 2007. After 2007, the development experienced a subsiding increase, and
from 2001 to 2012 the development in number of mergers was decreasing. The
sample of merged firms is characterized by almost the same accounting numbers
as the total sample. The average turnover is 20.5 million NOK, and the average
balance sheet total is 46 million NOK. The average debt ratio is 1.5. Furthermore,
the average number of employees is 9 and the number of owners is 2 on average.
The sample of merged firms will thus be placed in the category of small firms,
like the total sample. Number of observations in this sample is 174 603.
6.2 Method of estimation
There are different estimation methods for panel data, and the general distinction
is between the fixed effects model (FE) and the random effects model (RE). In
this study we have a short panel, which means that the number of cross-sectional
units, N, is greater than the number of time periods, T. When dealing with a short
panel the estimates obtained by FE and RE can differ significantly.
The crucial distinction between fixed and random effects is whether the
unobserved individual effect embodies elements that are correlated with the
regressors in the model, not whether these effects are stochastic or not (Greene
2012). FE allows each firm to have its own intercept value. RE assumes that the
intercept values are a random drawing from a much larger population of firms

GRA 19003 – Master Thesis 01.09.2014
Page 46
(Gujarati and Porter 2009). If explicit comparison of the levels of a variable
against one another is the goal of the research, then the levels of the variable are
usually treated as "fixed". If, on the other hand, the primary interest is in the
effects of other variables across the levels of a factor, then the control variable
might be treated as a "random" effect (Hanneman 2002). This research is
interested in comparing the merged firms against the rest of the firms included in
the sample. The firms included in the sample are not seen as a drawing from a
larger universe of such firms.
FE explores the relationship between predictor and outcome variables within an
entity, which will be firms in this study. Each firm has their own individual
characteristics that may or may not influence the predictor variables.
When using FE we assume that something within the individual may impact or
bias the predictor or outcome variables and we need to control for this. This is the
rationale behind the assumption of the correlation between the entity’s error term
and the predictor variables. FE removes the effect of those time-invariant
characteristics from the predictor variables so we can assess the predictors’ net
effect (Torres-Reyna 2014).
The variation across the firms in the sample may be correlated with the regressors,
thus FE is the best-suited estimation technique for this purpose.
A formal test developed by Hausman in 1978 is helpful when choosing between
FE and RE. The null hypothesis is that the preferred model is random effects vs.
the alternative the fixed effects (Greene 2012). It basically tests whether the
unique errors are correlated with the regressors, the null hypothesis is they are not.
If the null hypothesis is rejected, the conclusion is that RE is not appropriate and
that we may be better off using FE, in which case statistical inferences will be
conditional on the error terms in the sample. The result of the Hausman test is
presented in appendix A. The null hypothesis is rejected, which suggests the use
of the fixed effects model. Conclusively, the fixed effects model is considered to
render the most robust results.

GRA 19003 – Master Thesis 01.09.2014
Page 47
However, the fixed effect model is not without flaws. The FE model may have too
many cross-sectional units of observation requiring too many dummy variables
for the model specification (Gujarati and Porter 2009). This will reduce the
degrees of freedom and the statistical power of the estimation.
To address estimation and inference problems such as heteroscedastisity and
autocorrelation, the “cluster(csid)” option is added to the regression command.
The csid is the cross-section identifier, which in this case is the organization
number. The resulting standard errors are therefore completely robust to any kind
of serial correlation and heteroskedasticity (Wooldridge 2011).
6.3 Definition of variables
The dependent variable is the merged firms in percentage of the total sample of
firms.
The independent variables included in the model are macroeconomic factors,
dummy variables capturing the effect of regulative changes, and a control variable
for internal firm growth.
The macroeconomic factors included as independent variables are GDP and long-
term interest rate.
The effect of regulative changes on mergers will be measured by three binary
(dummy) variables in the regression model. The first dummy captures the effect of
the temporary tax on dividends. The tax was effective in 2001, which makes the
potential effect on mergers occurring a year or two later. The second dummy
captures the effect of the new tax regime in 2006. The third dummy captures the
effect of both the audit exemption that became effective in 2011, and the new
requirement for capital that became effective in 2012.
To control for internal firm growth, a control variable of individual accounting
figures is included. This variable measures the change in a firm´s assets per year.

GRA 19003 – Master Thesis 01.09.2014
Page 48
6.4 Model specification
The regression model can be expressed as:
PMFT = 0 + 1*GDP + 2*LTI + 3*D2002 + 4*D2006 + 5*D2011 + 6*CA
+
The abbreviations are presented below:
PMTF Mergers in percent of total firms
GDP Gross domestic product
LTI Long-term interest
D2002 Year dummy 2002-2003
D2006 Year dummy before/after 2006
D2011 Year dummy before/after 2011
CA Change in assets
Figure 6.3 Variables in the regression model
7 Empirical results and analysis
7.1 Goodness of fit
In linear regression a good fit of the model is obtained when the differences
between the observed values and the model´s predicted values are small and
unbiased.
One measure of goodness of fit of a regression model is R-squared. It is defined as
the percentage of the response variable variation that is explained by a linear
model. R-squared have its values reaching from 0 to 1. 0 percent indicates that the

GRA 19003 – Master Thesis 01.09.2014
Page 49
model explains none of the variability of the response data around its mean, and
100 percent indicates that the model explains all the variability of the response
data around its mean (Frost 2013). In general, the closer it is to 1, the better is the
fit (Gujarati and Porter 2009). The R-squared for our main model is 0,866.
Accordingly the model explains 86,6 percent of the variability, which implies a
good fit.
7.2 Main results
Table 7.1 shows the results of regressing the merger ratio on the legislative
changes. The independent variables are listed vertically, and the dependent
variable, PMFT, is typed over each column together with the method of
estimation. The coefficient to each regressor is listed with the standard error
below and the significance level in terms of stars to the left.
The first column presented is estimated by the use of fixed effects, and the second
by pooled OLS. The results do not change significantly according to the
estimation method. We will first comment on the results obtained with fixed
effects, which is our main model. The results from the fixed effects model support
all of our hypotheses, except for the dummy 2011.
FE pooled OLS
Variables PMTF PMTF
GDP 0,023 *** 0,022 ***0,00005 0,00006
Long-term interest 0,006 *** 0,006 ***0,00004 0,00004
Dummy 2002 -0,012 *** -0,012 ***0,000009 0,00001
Dummy 2006 0,002 *** 0,002 ***0,00002 0,00002
Dummy 2011 0,007 *** 0,008 ***0,00003 0,00003
Change in assets -9,22E-05 *** -4,09E-05 ***0,000004 0,000002
Constant -0,162 *** -0,154 ***0,0004 0,0005
Observations 621 499 621 499
R-sq 0,866 0,866
*** Significant at 1% level, significant at 5% level, * significant at 10% level
Table 7.1: Regression results - FE and pooled OLS

GRA 19003 – Master Thesis 01.09.2014
Page 50
7.2.1 Macroeconomic variables
GDP:
We find support for Hypothesis 1. GDP has a positive effect on the merger ratio.
The coefficient is 0.023 (table 7.1) and statistically significant at the 1 percent
level. This finding indicates that economic growth leads to a higher degree of
merger activity. Given previous research, GDP have usually been found positively
related to merger activity. Hence, our finding is in accordance with theory.
Furthermore, the result is also consistent with our descriptive findings, which
show that mergers tend to move in the same direction as GDP.
Long-term interest rate:
Hypothesis 2 is supported as the Long-term interest rate is found to have a
positive effect on mergers. The coefficient is 0.006 (table 7.1) and statistically
significant at the 1 percent level.
Our findings suggest that a higher interest rate leads to a higher degree of merger
activity. This is in accordance to Yagil´s (1996) research. He stated that the cost
of financing investments varies directly with the interest rate in the economy.
Therefor, an increase in the interest rate will increase the likelihood for external
growth through mergers.
7.2.2 Legislative changes
Dummy 2002:
In accordance with theory and logical reasoning, it was expected that the
temporary tax on capital gains and dividends would have a negative effect on
mergers as we believe the incentive to obtain growth externally by merging would
decrease. We find support for Hypothesis 3 as the Dummy 2002 has a negative
effect on the merger ratio. The coefficient is -0.012 (table 7.1) and is statistically
significant at the 1 percent level. The results show a negative relationship between
the temporary tax in 2001 and the merger ratio. Accordingly, the incentive to
merge in order to increase the company´s assets decreases.
This is also supported by previous findings from studies of the temporary
dividend tax. Dypbukt (2004) and Alstadsæter and Fjærli (2009) found strong
GRA 19003 – Master Thesis 01.09.2014
Page 51
timing effect on dividend payments around the temporary dividend tax in 2001.
The Norwegian Conservative Party believed that the dividend tax would create an
inefficient business sector, which seems to be true. However, the response of lock-
in funds was strengthened due to the fact that the tax was temporary. If a tax is
perceived as temporary, this will spur intertemporal income shifting through the
timing of dividends (Auerback and Hassett 2005). When a dividend tax rate is
implemented, companies adjusted in order to save tax. The dividend payments
were hold back, and the funds were kept in the company. It was therefore
expected that the merger activity would decrease, which is supported by our
findings.
Dummy 2006:
Dummy 2006, which captures the effect of the new tax reform including the
Exception-model, is found to have a positive effect on merger activity. The
coefficient is 0.002 (table 7.1) and is statistically significant at the 1 percent level.
Hence, hypothesis 4 is supported.
The main purpose of the new tax reform in 2006 was to stop income shifting
between the labor and capital income tax bases without worsening the conditions
for investment and economic growth (Alstadsæter and Fjærli 2009). As part of the
new tax reform was the Exception-model, which exempted companies from tax on
dividends and tax on gains from realization of shares. Theory suggests that the
Exception-Model influenced the development of mergers in two ways, it has a
negative effect on ordinary mergers and it has a positive effect on the tendency of
restructuring into holding companies, especially through triangle mergers. Our
result implies that the latter force had the strongest impact.
In addition, the effect of the Dummy 2006 is strengthened because it might capture
the effect of the repeal of the temporary dividend tax in 2001. When the dividend
tax was repealed, companies reinstated their dividend payments and the incentive
to merge eventually increased.
Dummy 2011:
We did not find support for Hypothesis 5. Dummy 2011, which captures the
legislative changes in 2011 and 2012, has a positive effect on the merger ratio.
The coefficient is 0.007 (table 7.1) and statistically significant at the 1 percent
level. In addition, the positive effect is enhanced by the fact that Dummy 2006 is

GRA 19003 – Master Thesis 01.09.2014
Page 52
equal to 1 in the same years as Dummy 2001. As both Dummy 2006 and Dummy
2011 are positive, the effect in the years 2011 and 2012 is even further away from
our expectations.
This finding can be explained in several ways. First and foremost, we believe our
main model might be unreliable, in terms of biased coefficients. When we use a
regression model involving time series data, it may happen that there is a
structural change in the relationship between the regress Y and the regressors. By
structural change, we mean that the values of the parameters of the model do not
remain the same through the entire time period (Gujarati and Porter 2009). If this
is the case, our coefficients will be biased. In order for the main model to become
reliable, we must apply interaction terms for the included variables. The structural
change may be due to external forces, in our case, the two different tax reforms.
Looking at the development of mergers, there is a clear distinction in the level of
mergers before and after the new tax reform. Given our descriptive findings, we
believe there is a structural change in 2006. The structural change might therefore
cause errors in our estimations. Due to this fact, we will in chapter 7.3 conduct a
split-sample validation, assuming that there is a structural break in 2006.
Moreover, other explanations to the positive effect exist. First, our result can
imply that the new regulations in terms of audit exemption and decreased capital
requirements do not influence the choice of companies merging. If this is true, the
regression suffers from omitted variables and the resulting positive relationship
between the regulative changes and the merger ratio might be potentially biased.
Secondly, it might exist a true positive relationship between the dummy for these
regulative changes and the merger ratio, and hence the hypothesis was incorrect.
If this is true, the interpretation of the result has to be examined more closely. In
terms of the audit exemption in 2011, there are two ways to interpret the result.
First, based on companies that are just below the thresholds, the result implies that
the gain obtained by merging two companies is believed to exceed the cost arising
with being obliged to have statutory audit. Hence, the audit exemption has a
positive effect on mergers. On the other hand, companies that are already over the
thresholds and do not have the option to opt out audit, will not be affected by the

GRA 19003 – Master Thesis 01.09.2014
Page 53
amendment. Hence, the result might reflect mergers among companies that are not
affected by the audit exemption, as we do not control for those.
The reduced capital requirement in 2012 however, is found to increase new
established entities strongly (Nordbø and Backer 2012), which in isolation implies
a lower merger ratio. It might be that the effect of these two amendments goes in
the opposite directions. The results imply that the positive effect exceeds the
negative effect. However, measuring the effect of these two regulative changes by
the same dummy variable is not the most desirable and appropriate solution. But
as previously mentioned the reason for having one dummy is due to the fact that
the two amendments occurred almost at the same time. Hence, the effects of the
two amendments will be difficult to test individually.
Furthermore, there are other changes in regulations occurring in the same time
period, which might explain the positive coefficient. As previously mentioned,
two other regulative changes with a potential impact on mergers occurred in 2011.
This year there was approved increased access for tax-free reorganization, and the
“legality requirement” was repealed. These two changes were believed to increase
the number of mergers.
Finally, one explanation might be that the effects of the new regulations have not
occurred yet. If we compare the legislative changes in 2011 and 2012 with the
changes in 2002, there is a clear difference. In 2002 companies had to adjust
immediately as the new tax was enforced, in 2011 and 2012 however, companies
had time to consider their options. According to Erhvervsstyrelsen (corresponding
to the Brønnøysund Register Center in Denmark), only 23% of Danish companies
opted out auditing a year after the enforcement. However, after three years the
number of companies opting out had increased to 32.3%. In other words, the
number of companies that opt out auditing gradually increased as companies were
given time to adjust and to consider the consequences opting out entails.
Furthermore, the thresholds in Norway are set at a lower level than in the EU. As
of this reason, the effect might be smaller. Therefore, we believe that the effect of
the audit exemption might come at a later point in time. This will probably also be
the case with the effect of the reduced capital requirement.

GRA 19003 – Master Thesis 01.09.2014
Page 54
7.2.3 Company specific variable
The control variable, change in assets, is found to have a negative effect on
merger activity. The coefficient is -0.00009 (table 7.1) and statistically significant
at the 1 percent level. One of the most fundamental motives for mergers is growth.
Our result implies that companies which are already experiencing growth will
have less incentive to merge.
7.3 Robustness tests
Robustness is defined as “the ability of a system to resist change without adapting
its initial stable configuration” (Wieland and Wallenburg 2012). In statistics, a test
is claimed to be robust if it still provides insight despite having its assumptions
altered. A series of robustness tests have been conducted. First, the main model,
estimated with fixed effects (FE) is compared to pooled OLS estimation.
Secondly, we test the dummies in order to verify their consistency. Finally, a split-
sample validation is presented in order to test for the structural break. The
significance level shows strong results for all samples, with an overall
significance level at one percent.
7.3.1 FE vs. pooled OLS
In table 7.1 the results obtained from the two different estimation techniques are
presented. Fixed effects estimation deals with the variation across the firms in the
sample, which may be correlated with the regressors. Hence, the fixed effects
method is the best-suited estimation technique for this purpose, and its results are
more consistent. Pooled OLS is an estimation method where all observations are
pooled together, assuming that the constant term is equal for all firms in the
model. The results are extremely similar for both estimation methods. The signs
remain constant, and the coefficients hold close values. This is an indicator of
robust results.
As we tested the robustness of our result by the use of both FE and pooled OLS,
we obtained the same sign and statistical significance. This finding gives an
indication of a robust model.

GRA 19003 – Master Thesis 01.09.2014
Page 55
7.3.2 Dummy variables
FE
Variables PMFT
Dummy 2002 -0,012 ***0,000002
Dummy 2006 0,010 ***0,000006
Dummy 2011 0,007 ***0,000003
Constant 0,012 ***0,000003
Observations 1 365 295
R-sq 0,838
*** Significant at 1% level, significant at 5% level, * significant at 10% level
Table 7.2: Robustness test - Only dummies
Central to this paper is the definition of the legislative variables. It is therefore
crucial to verify consistency with regards to the individual behavior of these
dummies. A robustness test is applied to our main model in order to test for the
year dummies. Table 7.2 presents the FE-regression results with only the three
dummies as independent variables. The coefficients are almost identical to the
results in the main model, and the significance levels are the same. Judging by
each coefficient estimate, the parameters are measuring what they ought to test.
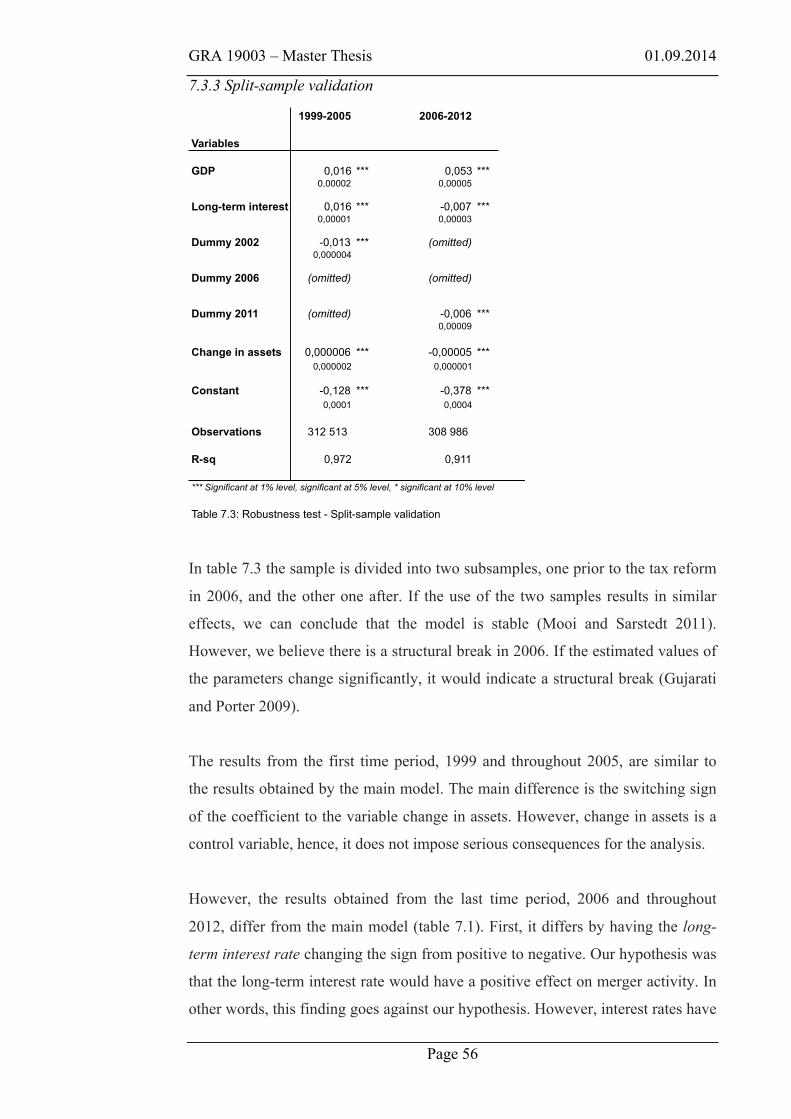
GRA 19003 – Master Thesis 01.09.2014
Page 56
7.3.3 Split-sample validation
1999-2005 2006-2012
Variables
GDP 0,016 *** 0,053 ***0,00002 0,00005
Long-term interest 0,016 *** -0,007 ***0,00001 0,00003
Dummy 2002 -0,013 *** (omitted)0,000004
Dummy 2006 (omitted) (omitted)
Dummy 2011 (omitted) -0,006 ***0,00009
Change in assets 0,000006 *** -0,00005 ***0,000002 0,000001
Constant -0,128 *** -0,378 ***0,0001 0,0004
Observations 312 513 308 986
R-sq 0,972 0,911
*** Significant at 1% level, significant at 5% level, * significant at 10% level
Table 7.3: Robustness test - Split-sample validation
In table 7.3 the sample is divided into two subsamples, one prior to the tax reform
in 2006, and the other one after. If the use of the two samples results in similar
effects, we can conclude that the model is stable (Mooi and Sarstedt 2011).
However, we believe there is a structural break in 2006. If the estimated values of
the parameters change significantly, it would indicate a structural break (Gujarati
and Porter 2009).
The results from the first time period, 1999 and throughout 2005, are similar to
the results obtained by the main model. The main difference is the switching sign
of the coefficient to the variable change in assets. However, change in assets is a
control variable, hence, it does not impose serious consequences for the analysis.
However, the results obtained from the last time period, 2006 and throughout
2012, differ from the main model (table 7.1). First, it differs by having the long-
term interest rate changing the sign from positive to negative. Our hypothesis was
that the long-term interest rate would have a positive effect on merger activity. In
other words, this finding goes against our hypothesis. However, interest rates have

GRA 19003 – Master Thesis 01.09.2014
Page 57
usually been found significant, but with mixed signs (Golbe and White 1988). The
majority of researchers have found it to be a positive relation, which we have
based our hypothesis on. Nevertheless, several researchers have also found it to be
negative. First, Becketti (1986) found that mergers were influenced negatively by
real interest rates. Later, Golbe and White (1993) also found that the real interest
rates appear to have a negative effect. The finding can therefore be supported by
previous literature. In addition, according to the survey conducted by KPMG, the
increase in mergers was a trend based on low interest rate, strong Norwegian
krone, positive economic outlook, an “all time high” stock market, and a better
income level in general. These factors are according to KPMG a clear indication
of increased merger activity. Furthermore, the sixth merger wave is characterized
by its low interest rate, while at the same time the economy was recovering. This
finding is supported by our descriptive findings. Descriptive analysis of the
development of the long-term interest rate compared to the development of
mergers supports the negative sign. During the last time period, the long-term
interest rate has constantly been decreasing, with an average growth rate of minus
seven percent (appendix B). While at the same time as the interest rate has been
decreasing, the amount of mergers and GDP has been increasing.
Next, the dummy variable for 2011 switches sign and turns negative. This finding
is in accordance with our hypothesis. It was expected that the two amendments
occurring these years, audit exemption in 2011 and the new capital requirement in
2012, would have a negative effect on the merger activity. First, it was expected
that the audit exemption would decrease the merger activity, as mergers between
companies may trigger obligation to audit. Secondly, the new capital requirement
was expected to have a negative effect on mergers, as companies were able to use
previously locked up funds. As a result, the incentive to merge in order to obtain
new capital to the company was reduced. Both amendments are thus believed to
decrease the merger activity. In addition, our result is further supported by the
descriptive findings, which show a negative trend of merger activity from 2011 to
2012. Due to these expectations and findings, it is highly likely that our main
model suffers from a structural break, which contains estimation errors.
The other coefficients in the second subsample hold similar signs as the main
model, and the explanatory powers do not differ to a great extent.
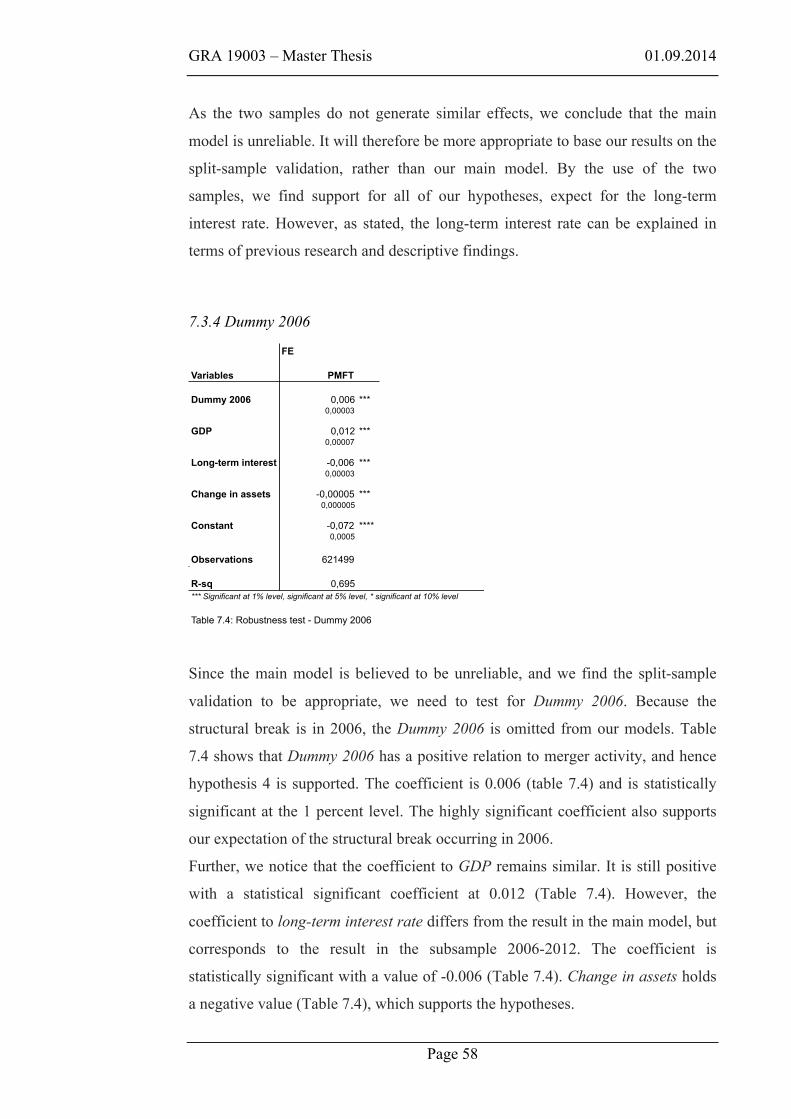
GRA 19003 – Master Thesis 01.09.2014
Page 58
As the two samples do not generate similar effects, we conclude that the main
model is unreliable. It will therefore be more appropriate to base our results on the
split-sample validation, rather than our main model. By the use of the two
samples, we find support for all of our hypotheses, expect for the long-term
interest rate. However, as stated, the long-term interest rate can be explained in
terms of previous research and descriptive findings.
7.3.4 Dummy 2006
FE
Variables PMFT
Dummy 2006 0,006 ***0,00003
GDP 0,012 ***0,00007
Long-term interest -0,006 ***0,00003
Change in assets -0,00005 ***0,000005
Constant -0,072 ****0,0005
Observations 621499
R-sq 0,695*** Significant at 1% level, significant at 5% level, * significant at 10% level
Table 7.4: Robustness test - Dummy 2006
Since the main model is believed to be unreliable, and we find the split-sample
validation to be appropriate, we need to test for Dummy 2006. Because the
structural break is in 2006, the Dummy 2006 is omitted from our models. Table
7.4 shows that Dummy 2006 has a positive relation to merger activity, and hence
hypothesis 4 is supported. The coefficient is 0.006 (table 7.4) and is statistically
significant at the 1 percent level. The highly significant coefficient also supports
our expectation of the structural break occurring in 2006.
Further, we notice that the coefficient to GDP remains similar. It is still positive
with a statistical significant coefficient at 0.012 (Table 7.4). However, the
coefficient to long-term interest rate differs from the result in the main model, but
corresponds to the result in the subsample 2006-2012. The coefficient is
statistically significant with a value of -0.006 (Table 7.4). Change in assets holds
a negative value (Table 7.4), which supports the hypotheses.

GRA 19003 – Master Thesis 01.09.2014
Page 59
7.4 Assessing multicollinearity
An important prerequisite for performing regression analyzes where one wishes to
comment on the entire population, is to check for multicollinearity.
Multicollinearity refers to linear relationships among the independent variables. In
the case of perfect multicollinearity the regression coefficients remain
indeterminate and their standard errors are infinite (Gujarati and Porter 2009).
Multicollinearity can be detected by studying the pair-wise correlation among
regressors. If the zero-order correlation between two variables is high, then
multicollinearity can be a problem. High correlation between the explanatory
variables can lead to unstable coefficients and corresponding high p-values
because it becomes difficult to identify which variables explaining what. In
addition, if collinearity is high but not perfect, estimation of regression
coefficients is possible but their standard errors tend to be large (Gujarati and
Porter 2009). The correlation matrix of the independent variables in the regression
model is presented in table 7.5. The correlation matrix reveals a high correlation
between the dummy variable for 2006 and GDP with a value exceeding 0.9. This
finding can therefore be a potential threat to our analysis. However, by the use of
the variables in different estimation methods and in the robustness tests, the
coefficients tend to be stable and have low p-values. We therefore feel confident
in applying both variables in our model. Moreover, the rest of the variables hold
more appropriate values.
Dummy Dummy Dummy Change GDP Long-term
2002 2006 2011 in assets interest
Dummy 2002 1,0000
Dummy 2006 -0,3928 1,0000
Dummy 2011 -0,0996 0,2536 1,0000
Change in assets -0,0626 0,1060 0,0369 1,0000
GDP -0,3506 0,9010 0,3887 0,1134 1,0000
Long-term interest 0,3476 -0,6262 -0,6694 -0,0946 -0,8116 1,0000
Table 7.5: Correlation matrix - Main model
GRA 19003 – Master Thesis 01.09.2014
Page 60
8 Final comments and conclusion
The purpose of the thesis was to investigate the determinants of mergers in
Norwegian private firms. In order to organize the analysis, we utilized a model
taking into account macroeconomic factors and legislative changes with potential
influencing effect. In addition, we included a control variable, capturing a
company specific factor, which is believed to decrease the probability of mergers
occurring.
In this paper we have investigated mergers from 1999 until 2012, and shown
different factors influencing merger activity. To conclude our analysis we will
summarize our findings and compare it with previous literature and theory. The
general conclusion of this thesis is that macroeconomic factors, GDP and long-
term interest rate, have a strong statistically significant impact on mergers among
Norwegian private firms. Furthermore, our dummy variables controlling for
legislative changes are also found to be statistically significant. Finally, Change in
assets, was found to have a significant effect on merger activity.
We feel confident about our findings as the results correspond to previous
research, and the credibility is proven through several robustness tests.
We will in the following go more in depth of our findings. First, a positive
relation between mergers and the level of the general economy represented by
GDP is confirmed. GDP is found to have a significant and positive effect in both
our subsamples, and the results are therefore robust. This finding indicates that
economic growth leads to a higher degree of merger activity. Our finding is in
accordance with theory as GDP have usually been found positively related to
merger activity and hence, it supports our hypothesis.
Furthermore, long-term interest rate is found to have a positive and a negative
relationship to merger activity. In the first sample long-term interest rate had a
positive effect, while in the second it had a negative effect. However, it was
proven that long-term interest rate has a significant effect on merger activity.
Nevertheless, the evidence is not clear.
GRA 19003 – Master Thesis 01.09.2014
Page 61
When it comes to the legislative changes, the results suggest them to have an
impact on mergers. First, Dummy 2002 was proven to have negative effect on the
merger ratio. The result implies that the temporary dividend tax in 2001 had a
negative impact on merger activity. Previous research has found strong timing
effect on dividend payments around the temporary dividend tax in 2001. The
tendency of holding back dividends results in locked-up funds. Thus, the incentive
to obtain growth externally by merging decreases, which is supported by our
finding.
Moreover, Dummy 2006, which captures the effect of the new tax reform
including the Exception-model, is found to have a positive effect on merger
activity. The new amendment gave incentives to restructure or establish holding
companies. The tendency of restructuring into holding companies resulted in an
increased amount of mergers, especially triangle mergers. In addition, the repeal
of the temporary dividend tax in 2001 might strengthen this positive effect on
mergers. The effect is supported by our findings. In addition, Dummy 2006 is
believed to have created a structural break.
The Dummy 2011, which captures the legislative changes in 2011 and 2012, has a
negative effect on the merger ratio. Furthermore, we believe that the effect of the
audit exemption and the new capital requirement might become even more visible
at a later point in time.
Finally, change in assets, which was included to measure individual firm growth,
was found to have a positive and a negative effect on the merger ratio. Therefore,
the evidence is not clear. However, the variable does not impose serious
consequences for the analysis as it is used as a control variable.
The evidence found in this thesis is in accordance with the neoclassical
hypothesis. The neoclassical model explains the clustering of mergers as a
response by industries to different shocks, such as economic, regulatory and
technological changes. While the neoclassical hypothesis focuses on clustering
within industries, this thesis analyzes general economic shocks that affect the
overall business sector. In addition, the comprised changes in regulations apply to
companies in Norway regardless of industry. Nevertheless, our findings support

GRA 19003 – Master Thesis 01.09.2014
Page 62
the neoclassical hypothesis in that merger activity is affected by economic,
regulatory and technological changes.
The thesis provides an interesting perspective on what influences mergers. As far
as we know, there has never been done research on what influences mergers in
Norway. Neither have we found foreign research determining what influences
mergers for private companies. Our results give indications of Norwegian firms’
ability to adjust to economic conditions, as well as legislative changes.
Practically, companies adjust as changes in the competitive environment occur. In
order for companies to create growth, they must be proactive and develop
opportunities as the changes occur.
Our findings indicate that merger is a strategic tool, as we detect changes in the
activity level as the economy evolves and as new regulations are implemented.
9 Recommendation for future research
As we are believed to be the first to do research on this topic in Norway, it will
likely benefit from further research. Future research have the advantage of having
a richer data set in terms of longer sample period and additional information with
regards to the legislative changes, which we believe will have a more visible
effect at a later stage. At this point in time (2014), the sample period was limited
up to 2012. It is therefore reasonable to assume that by expanding the data set
some years later, the obtained results will become more reliable.
The research might further benefit from applying different combinations of
variables. It is more or less impossible to capture all the factors that in reality have
an impact on the merger activity, and selection of other variables could be
considered. Furthermore, interaction terms between the variables included in our
main model could have been applied. This would have eliminated the estimation
errors, which the structural break gives. In addition, the dummies, which are set to
capture legislative changes, might in reality capture other changes that are not
controlled for in our model. One suggestion is to control for companies that are
below and above the thresholds in relation to the audit exemption. This is to
identify companies that choose to merge despite the fact that they become obliged

GRA 19003 – Master Thesis 01.09.2014
Page 63
to have audit.
Furthermore, it can be argued that different proxies for mergers might achieve
more refined results. Other researches have used the merger value and the amount
of mergers, as their independent variable.

GRA 19003 – Master Thesis 01.09.2014
Page 64
References 2014. Act of 13 June 1997 No. 44 Norwegian Private Limited Liability
Companies Act. Gyldendal Rettsdata.
Alstadsæter, Anette. 2007. "THE ACHILLES HEEL OF THE DUAL INCOME
TAX: THE NORWEGIAN CASE." Finnish Economic Papers 20 (1).
Alstadsæter, Anette, and Erik Fjærli. 2009. "Neutral taxation of shareholder
income?
Corporate responses to an announced dividend tax." Springer Science+Business
Media, LLC 2009.
Ang, J. S., and Y. Cheng. 2006. "Direct Evidence on the Market-driven
Acquisition Theory." Journal of Financial Research 29:199-216.
Auerback, Alan J., and Kevin A. Hassett. 2005. "The 2003 Dividend Tax Cuts
and the Value of the Firm: An Event Study." The National Bureau of
Economic Research July (2005).
Basili, M. , M. Franzini, and A. Vercelli. 2006 Environment, Inequality and
Collective Action: Routledge
Beckenstein, A. R. . 1979. "Merger activity and merger theories: an empirical
investigation." Antitrust Bulletin 24:105-128.
Becketti, S. . 1986. "Corporate mergers and the business cycle." Economic Review
Federal Reserve Bank of Kansas City 71 (13-26).
Berzins, Janis, Øyvind Bøhren, and Bogdan Stacescu. 2013. "Tax concerns and
agency concerns in dividend policy: Holding companies as a separating
device." Centre for Corporate Governance Research 2013 (2).
Burman, Leonard E., and William C. Randolph. 1994. "Measuring Permanent
Responses to Capital-Gains Tax Changes in Panel Data." The American
Economic Review 84 (4).
Choi, S.H., and B.N. Jeon. 2011. "The impact of the macroeconomic environment
on merger activity: evidence from US time-series data." Applied Financial
Economics 21 (4):233-249.
Chung, Kwang S., and Fred J. Weston. 1982. Diversification and mergers in a
strategic long-range-planning framework. In Mergers and acquisitions:
Curent problems in perspective. Michael Keenan and Lawrence J. White
ed: Lexington, Mass.: D.C. Heath.
Coase, R. 1937. "The Nature of the Firm." Economica 4:386-405.
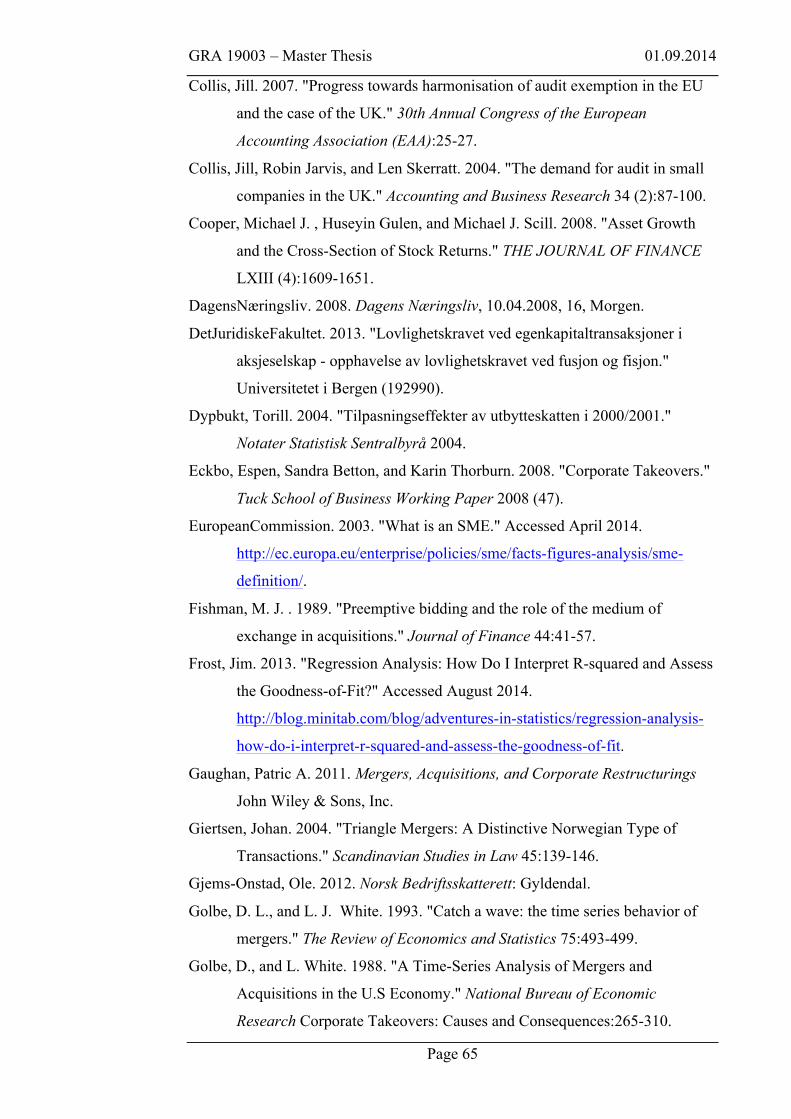
GRA 19003 – Master Thesis 01.09.2014
Page 65
Collis, Jill. 2007. "Progress towards harmonisation of audit exemption in the EU
and the case of the UK." 30th Annual Congress of the European
Accounting Association (EAA):25-27.
Collis, Jill, Robin Jarvis, and Len Skerratt. 2004. "The demand for audit in small
companies in the UK." Accounting and Business Research 34 (2):87-100.
Cooper, Michael J. , Huseyin Gulen, and Michael J. Scill. 2008. "Asset Growth
and the Cross-Section of Stock Returns." THE JOURNAL OF FINANCE
LXIII (4):1609-1651.
DagensNæringsliv. 2008. Dagens Næringsliv, 10.04.2008, 16, Morgen.
DetJuridiskeFakultet. 2013. "Lovlighetskravet ved egenkapitaltransaksjoner i
aksjeselskap - opphavelse av lovlighetskravet ved fusjon og fisjon."
Universitetet i Bergen (192990).
Dypbukt, Torill. 2004. "Tilpasningseffekter av utbytteskatten i 2000/2001."
Notater Statistisk Sentralbyrå 2004.
Eckbo, Espen, Sandra Betton, and Karin Thorburn. 2008. "Corporate Takeovers."
Tuck School of Business Working Paper 2008 (47).
EuropeanCommission. 2003. "What is an SME." Accessed April 2014.
http://ec.europa.eu/enterprise/policies/sme/facts-figures-analysis/sme-
definition/.
Fishman, M. J. . 1989. "Preemptive bidding and the role of the medium of
exchange in acquisitions." Journal of Finance 44:41-57.
Frost, Jim. 2013. "Regression Analysis: How Do I Interpret R-squared and Assess
the Goodness-of-Fit?" Accessed August 2014.
http://blog.minitab.com/blog/adventures-in-statistics/regression-analysis-
how-do-i-interpret-r-squared-and-assess-the-goodness-of-fit.
Gaughan, Patric A. 2011. Mergers, Acquisitions, and Corporate Restructurings
John Wiley & Sons, Inc.
Giertsen, Johan. 2004. "Triangle Mergers: A Distinctive Norwegian Type of
Transactions." Scandinavian Studies in Law 45:139-146.
Gjems-Onstad, Ole. 2012. Norsk Bedriftsskatterett: Gyldendal.
Golbe, D. L., and L. J. White. 1993. "Catch a wave: the time series behavior of
mergers." The Review of Economics and Statistics 75:493-499.
Golbe, D., and L. White. 1988. "A Time-Series Analysis of Mergers and
Acquisitions in the U.S Economy." National Bureau of Economic
Research Corporate Takeovers: Causes and Consequences:265-310.
GRA 19003 – Master Thesis 01.09.2014
Page 66
Gort, M. 1969. "An Economic Distrubance Theory of Mergers." The Quarterly
Journal of Economics 83 (4):624-642.
Greene, William H. 2012. Econometric Analysis: Pearson.
Guerard, J. . 1989. "Mergers, stock prices, and industrial production." Economics
Letters 30:161-164.
Gugler, Klaus, Dennis Mueller, and Burcin Yurtoglu. 2012. "The determinants of
merger waves: An international perspective." Journal of Industrial
Organization 30 (1):1-15.
Gujarati, Damodar N., and Dawn C. Porter. 2009. Basic Econometrics: McGraw-
Hill Education.
Hanneman, Robert. 2002. "Linear Models." Accessed 10.07.2014.
http://faculty.ucr.edu/~hanneman/linear_models/c4.html.
Harford, Jarrad. 2005. "What drives merger waves?" Journal of Financial
Economics 77 (3):529-560. doi: 10.1016/j.jfineco.2004.05.004.
Hennessy, C.A. 2004. "Torbin´s Q, Debt Overhang, and Investment." Journal of
Finance 59 (4):1717-1742.
Hirshleifer, David, Kewei Hou, Siew Hong Teoh, and Yinglei Zhang. 2004. "Do
investors overvalue firms with bloated balance sheets? ." Journal of
Accounting and Economics 38 (297–331).
Investopedia. 2014. "Definition of "robust"." Accessed August 2014.
http://www.investopedia.com/terms/r/robust.asp.
Jensen, Michael C. 1993. "The Modern Industrial Revolution, Exit, and the
Failure of Internal Control Systems." Journal of Finance 48:831-880.
Jovanovic, B., and P.L. Rousseau. 2002. "The Q-theory of mergers." American
Economic Review 92 (2):198-204.
Lakonishok, Josef, Andrei Shleifer, and Robert Vishny. 1994. "Contrarian
investment, extrapolation, and risk
." Journal of Finance 49:1541–1578.
Marris, Robin. 1964. The Economic Theory of Managerial Capitalism: Glencoe:
Free Press.
Martynova, M., and L.D.R. Renneboog. 2005. "Takeover Waves: Triggers,
Performance and Motives." Discussion Paper, Tilburg University, Center
for Economic Research 2005 (107).
McGowan, John. 1971. "International Comparisons of Merger Activity." Journal
of Law and Economics 14 (1):233-250.

GRA 19003 – Master Thesis 01.09.2014
Page 67
Melicher, R., J. Ledolter, and L. D’Antonio. 1983. "A time series analysis of
aggregate merger activity." Review of Economics and Statistics 65:423-29.
Mitchell, Mark, and Harold Mulherin. 1996. "The Impact of Industry Shocks on
Takeover and Restructuring Activity." Journal of Financial Economics
41:193-229.
Moen, Espen R. 2011. "Oljens Ringvirkninger " Accessed may 2014.
http://www.bi.no/forskning/News/Nyheter-2011/Oljens-ringvirkninger/
Mooi, Erik, and Marko Sarstedt. 2011. A Concise Guide to Market Research : The
Process, Data, and Methods Using IBM SPSS Statistics: Springer Berlin
Heidelberg.
Mueller, Dennis. 1969. "A Theory of Conglomerate Mergers." Quarterly Journal
of Economics 83:643-59.
Mueller, Dennis. 1989. "MERGERS: Causes, Effects and Policies." International
Journal of Industrial Organization 7:1-10.
Mulherin, J. H., and A. L. Boone. 2000. "Comparing acquisitions and
divestitures." Journal of Corporate Finance 6:117-139.
Nelson, Ralp. L. 1959. Merger Movements in American History Industry, 1895-
1956: Princeton University Press.
Nordbø, Rasmus, and Thomas L. Backer. 2012. "Nye forutsetninger for
etablering av foretak i Norge." Business Law, Tax and Accounting, BI
Norwegian Business School.
O'Brien, A.P. 1988. "Factory Size, Economies of Scale, and the Great Merger
Wave of 1898-1902." Journal of Economic History 48:639-649.
O'Shaughnessy, K. C., and David J. Flanagan. 1998. "Determinants of layoff
announcements following M&As: an empirical investigation." Strategic
Management Journal 19 (10):989-999.
Owen, S. 2006. "The history and mystery of merger waves: A UK and US
perspective." Working Paper Number 2006-02. School of Banking and
Finance, The University of New South Wales. 02 (2006).
Perland, Olav Fr. 2014.
Pran, Adele Norman. 2002. "Due diligence i forbindelse med fusjoner og
oppkjøp." Magma 2002 (5).
Regjeringen. 2011a. "Prop. 1 LS (2010–2011)." Accessed July 2014.
http://www.regjeringen.no/nb/dep/fin/dok/regpubl/prop/2010-2011/prop-
1-ls-20102011/3/3/2.html?id=618420.
GRA 19003 – Master Thesis 01.09.2014
Page 68
Regjeringen. 2011b. "Prop. 51 L (2010-2011)." Accessed January 2014.
http://www.regjeringen.no/nb/dep/fin/dok/regpubl/prop/2010-2011/prop-
51-l-20102011.html?id=628867.
Regjeringen. 2013. "Små og mellomstore bedrifter i Norge." Accessed April
2014.
http://www.regjeringen.no/nb/dep/nfd/tema/forenkling_for_naringslivet/s
ma-og-mellomstore-bedrifter.html?id=614069.
Regnskapsbyrået. 2011. "Fravalg av revisjon…." Accessed june 2014.
http://www.regnskapsbyraet.no/nyheter_cms/2011/juli/fravalg-av-
revisjon/28.
Resende, Marcelo 2008. "Mergers and acquisition waves in the UK: a Markov-
switching approach." Applied Financial Economics 18:1067-1074.
Rhodes-Kropf, M., D. T. Robinson, and S. Viswanathan. 2005. "Valuation Waves
and Merger Activity: The Empirical Evidence." Journal of Financial
Economics 77:561-603.
Rhodes-Kropf, Matthew, and S Viswanath. 2004. "Market Valuation and Merger
Waves." Journal of Finance 59:2685-2718
Schleifer, Andrei, and Robert Vishny. 2003. "Stock market driven acquistions."
Journal of Financial Economics 70:295-311.
Selskabsstyrelsen, Erhvervs- og. 2009. "Notat - Erhvervs- og Selskabsbestyrelsen
" Accessed August 2014.
http://www.eogs.dk/graphics/nyheder/Evaluering.pdf.
Shiller, R. J. 1981. "Do stock prices move too much to be justified by subsequent
changes in dividends." American Economic Review 71:421-36.
Shleifer, Andrei, and Robert Vishny. 1991. "akeovers in the ‘60s and ‘80s:
Evidence and Implications." Strategic Management Journal 12:51-59.
Sloan, Richard. 1996. "Do stock prices fully reflect information in accruals and
cash flows about future earnings? ." Accounting Review 71:289–315.
StavangerAftenblad. 2005. Stavanger Aftenblad, 04.01.2005, 10, Næringsliv.
Steiner, P. O. 1975. Mergers: Motives, Effects and Policies: University of
Michigan Press
Stortinget. 2011. "Lovvedtak 57 (2010-2011) " Accessed January 2014.
https://http://www.stortinget.no/no/Saker-og-
publikasjoner/Vedtak/Beslutninger/Lovvedtak/2010-2011/vedtak-201011-
057/.
GRA 19003 – Master Thesis 01.09.2014
Page 69
Sudarsanam, S. 2010. Creating Value from Mergers and Acquisitions: The
Chalanges. 2nd ed. Harlow England Pearson Education Limited.
Titman, Sheridan, John Wei, and Feixue Xie. 2004. "Capital investments and
stock returns." Journal of Financial and Quantitative Analysis 39:677-700.
Torres-Reyna, Oscar. 2014. "Panel Data Analysis Fixed & Random Effects."
Accessed july 2014. http://www.princeton.edu/~otorres/Panel101.pdf.
Vancea, Mariana. 2012. "An overview on the Determinants of Mergers and
Acquisition Waves." Economic Science Series 21 (2):390-397.
Vencatachellum, D. J-M., and M. K. Wilson. 2013. "Determinants of Mergers
and Acquisitions Targeting Africa 1990-2011." University of
Johannesburg.
Wenstøp, Fred, and Epen Bagøien. 2003. INNFØRING I SPSS 11.0:
Handelshøyskolen BI.
Weston, Fred J., Kwang S. Chung, and Susan E. Hoag. 1990. Mergers,
Restructuring, and Corporate Control: Prentice-Hall Inc. .
Weston, J. Fred. 1953. "The role of mergers in the growth of large firms. ."
Berkeley: University of California Press. .
Wieland, A., and C.M. Wallenburg. 2012. "Dealing with supply chain risks:
Linking risk management practices and strategies to performance."
International Journal of Physical Distribution & Logistics Management
42 (10).
Wilson, Magdalena 2013. "Trends and determinants of mergers and acquisitions
targeting South Africa 1990-2011."
Wooldridge, Jeffrey M. . 2011. "Testing heteroksedasticity and autocorrelation
fixed effect model." Accessed July 2014.
http://www.stata.com/statalist/archive/2011-03/msg00089.html.
Yagil, Joseph. 1996. "Mergers and Macro-Economic Factors." Review of
Financial Economics 5 (2):181-190.

GRA 19003 – Master Thesis 01.09.2014
Page 70
Appendix
Appendix A: Hausman test
Coefficients(b) (B) (b-B) sqrt(diag(V_b-V_B))
fixed random Difference S.E.
Change in assets -0,0000922 -0,0000409 -0,0000513 0,00000277
Dummy 2002 -0,0121047 -0,0122802 0,0001755 0,00000717
Dummy 2006 0,0016275 0,0020683 -0,0004409 0,0000114
Dummy 2011 0,0074165 0,0080872 -0,0006707 0,0000134
GDP 0,0230471 0,0218983 0,0011488 0,0000326
Long-term interest 0,0062352 0,0060805 0,0001547 0,0000201
b = consistent under H0 and Ha; obtained from xtregB = inconsistent under Ha, efficient under H0; obtained from xtreg
Test: H0: difference in coefficients not systematic
chi2(6) = (b-B)'[(V_b-V_B)^(-1)](b-B) = 6597,05Prob>chi2 = 0,0000
Appendix B: Development of long-term interest rate
0,00#
1,00#
2,00#
3,00#
4,00#
5,00#
6,00#
7,00#
1998# 1999# 2000# 2001# 2002# 2003# 2004# 2005# 2006# 2007# 2008# 2009# 2010# 2011# 2012#
Long1term#interest#rate#
Appendix C: Preliminary Report
During the thesis writing process, we changed the research question. The change
was done, as we wanted to expand our research area. In addition, we changed the
supervisor.