the development and evaluation of novel monoclonal
TRANSCRIPT

The Development and Evaluation of Novel Monoclonal Antibodies Directed against Folate
Pathway Components
Amy Elizabeth Quinn
A Thesis Submitted for the Degree of Doctor of Philosophy from the School of Clinical and
Laboratory Sciences at Newcastle University, Newcastle Upon Tyne.
SCHOOL OF CLINICAL AND LABORATORY SCIENCES NORTHERN INSTITUTE FOR CANCER RESEARCH
2008

Development and Evaluation of Novel Monoclonal Antibodies to FR-α and FPGS
II
Declaration I hereby declare that as the author of this thesis, all the work reported was performed by
myself. This thesis is original and has not been submitted for any other qualification.
Signed
Amy Elizabeth Quinn

Development and Evaluation of Novel Monoclonal Antibodies to FR-α and FPGS
III
Acknowledgements I would like to thank my supervisors - Drs. Mik Pinkney and Nigel Piggott for their help,
support and encouragement throughout this project; I also extend my thanks to Dr. Ian
Milton for sponsorship of this project and use of the facilities at Leica Biosystems, Newcastle
and Drs Craig Robson and Nicola Lawson for their generous offer of support when I needed it
most.
I would like to acknowledge everyone, both at Leica and Newcastle University who have
assisted me with training and techniques and everyone who has provided me with reagents
and cell lines essential for successful completion of my project. I would also like to thank
Mike Cole for his assistance with the statistical analysis of my data.
I would like to acknowledge my family, closest friends and my husband David for all their
support and positive encouragement throughout – without them I could have never got
through this.
This project was a BioNET industrial collaborative project funded and sponsored by
Newcastle University and Leica Biosystems Newcastle (formerly Novocastra laboratories).
Publications Smith, A.E., Pinkney, M., Piggott, N.H., Calvert, A.H., Milton, I.D. & Lunec, J. (2007) A Novel
Monoclonal Antibody for Detection of FR-α in Paraffin Embedded Tissues. Hybridoma 26: (5)
281-288.
Quinn, A.E., Pinkney, M., Piggott, N.H., Calvert, A.H., Milton, I.D. & Lunec, J. (2009)
A Novel Monoclonal Antibody for detection of FPGS in Paraffin Embedded Tissues.
Hybridoma 28: (6) 415-421
Nutt, J.E., Razak, A.R., O’Toole, K., Black, F., Quinn, A.E., Calvert, A.H., Plummer, E.R., Lunec,
J. (2010) the role opf folate receptor alpha (FRalpha) in the response of malignant pleural
mesothelioma to pemetrexed-containing chemotherapy. British Journal of Cancer 102: (3)
553-560.

Development and Evaluation of Novel Monoclonal Antibodies to FR-α and FPGS
IV
Abstracts and Presentations Smith, A.E., Pinkney, M., Piggott, N., Kucukmetin, A., Edmondson, R., Calvert, A.H. & Lunec, J.
The Development and Evaluation of a Novel Monoclonal Antibody
to FR-α Suitable for Use on Paraffin Embedded Samples.
Poster Presentation – Quinquennial Review of CRUK groups at the NICR, Oct 2006,
Translational Research.
Amy E. Smith, Michael Pinkney, Nigel H. Piggott, Ali Kucukmetin, Richard Edmondson, Hilary
Calvert, Ian D. Milton & John Lunec.
Novel Monoclonal Antibodies to Folate Receptor Alpha and Folylpolyglutamate Synthetase
for use on Paraffin Embedded Samples.
Amerian Association for Cancer Research Meeting. April 2007 - Late Breaking Poster Session.

Development and Evaluation of Novel Monoclonal Antibodies to FR-α and FPGS
V
Abstract Folates are essential in the de novo nucleotide biosynthetic pathway, folate receptor alpha
(FR-α) is a folate transporter which is an attractive target for anticancer drug design due to
its limited expression in normal tissues. It has great potential to direct therapies toward
pathologic cells whilst minimizing toxicity in normal tissues. The enzyme folylpolyglutamate
synthetase (FPGS) polyglutamates folates and folate analogues, trapping them within the
cell and increasing their affinity as substrates for subsequent enzymatic reactions.
Expression of folate biochemical pathway components, such as FR-α and FPGS, may be
indicators of malignancy and also determine response to antifolate chemotherapeutics and
other folate pathway targeted therapies currently being evaluated. Knowledge of their
expression in tumours may enable optimal use by identifying responsive subgroups of
patients. In spite of their importance in the diagnosis and treatment of cancer, the lack of
monoclonal anti-FR-α and FPGS antibodies suitable for immunohistochemistry (IHC) analysis
of formalin fixed, paraffin embedded biopsy samples or Western blot analysis has limited
research in this area.
The aim of this project was to generate and fully characterize monoclonal antibodies to
detect specific expression of these proteins in formalin fixed, paraffin embedded tissues for
use on archival tissue and samples collected prospectively in connection with clinical trials of
antifolates.
Novel monoclonal antibodies with specificity for sensitive detection of FR-α and FPGS in
paraffin-embedded tissues were developed. ELISA and Western blot analysis confirmed
specific reactivity of both antibodies to the recombinant protein, a single 40kD protein in
whole cell lysates from cell lines known to express FR-α, and a single 60kD protein from cells
expressing FPGS. Epitope mapping experiments confirmed specificity restricted to a linear
epitope present in the protein target sequences.
IHC analysis of FR-α in a panel of normal tissues demonstrated predominantly membrane
with cytoplasmic staining limited to some ovarian epithelia (inclusion cysts), placental
trophoblasts and proximal kidney tubules; FPGS demonstrated a wider pattern of
expression. FR-α analysis of a panel of malignant and benign tissues demonstrated limited
expression with variable intensities of staining and patterns of membrane and cytoplasmic

Development and Evaluation of Novel Monoclonal Antibodies to FR-α and FPGS
VI
reactivity between cases. In the majority of malignant ovarian tumours, including an archival
tissue microarray (TMA) of 167 tumour samples, membrane staining was observed in 89% of
cases. FPGS analysis on a panel of benign and malignant tissues demonstrated frequent and
high cytoplasmic expression in a range of tumours compared to normal adjacent tissue.
The archival ovarian cancer TMA analysis showed a significant association between high
expression of FR-α and poor patient survival (p=0.012, Cox regression) indicating a role for
FR-α as a prognostic marker and potential therapeutic target for ovarian cancer and other
cancers with expression of FR-α, detectable via the use of our antibody on FFPE tumour
samples.

Development and Evaluation of Novel Monoclonal Antibodies to FR-α and FPGS
VII
Abbreviations 5-FU 5-fluorouracil
αα Amino acid
ABC Streptavidin Biotin complex
AGE Agarose gel electrophoresis
ALL Acute lymphoblastic leukaemia
AMP Adenosine monophosphate
AP Alkaline phosphatase
APS Ammonium persulphate
APES Aminopropyl-tri-ethoxy-silane
AT Adenine thymine
ATP Adenosine triphosphate
AICAR Aminoimidazole carboxamide ribonucleotide
AICARFT Aminoimidazole carboxamide ribonucleotide formyltransferase
BCIP 5-bromo-4chloro-3-indolylphosphate
BLAST Basic local alignment search tools
BP Base pairs
BPB Bromophenol blue
BSA Bovine serum albumin
C1 Single carbon fragments
CBC Comparative biology centre
CIAP Calf intestine alkaline phosphatase
CIT Citrate
CO2 Carbon dioxide
DAB Diaminobenzidine tetrachloride

Development and Evaluation of Novel Monoclonal Antibodies to FR-α and FPGS
VIII
DCC Dextran coated charcoal
DEPC Diethylpyrocarbonate
DHF Dihydrofolate
DHFR Dihydrofolate reductase
DMF Dimethyl formamide
DMSO Dimethyl sulphoxide
DNA Deoxyribonucleic acid
dNDP Deoxynucleotide diphosphate
dNTP Deoxynucleotide triphosphates
dsDNA Double stranded deoxyribonucleic acid
dTMP Deoxythymidine monophosphate
DTT Dithiothrietol
dUMP Deoxyuridine monophosphate
dUTP Deoxyuridine triphosphates
EBI European bioinformatics institute
ECL Enhanced chemiluminescence
ELISA Enzyme linked immunosorbent assay
ER Oestrogen receptor
FACS Fluorescence activated cell sorting
FADH2 Flavin adenine dinucleotide
FBP Folate binding protein
FCS Foetal calf serum
fDUMP Fluorodeoxyuridine monophosphate
FFPE Formalin fixed, paraffin embedded
FPGH Folylpolyglutamate hydrolase

Development and Evaluation of Novel Monoclonal Antibodies to FR-α and FPGS
IX
FPGS Folylpolyglutamate synthetase
FR Folate receptor
FR-α Folate receptor alpha
GAR Glycinamide ribonucleotide
GARFT Glycinamide ribonucleotide formyl transferase
GMP Guanosine monophosphate
GPI Glycophosphatidylinositol
GTP Guanosine triphosphates
GST Glutathione s transferase
HAT Hypoxanthine, aminopterin, thymidine
HF High-folate
HGPRT Hypoxanthine-guanine phosphoribosyl transferase
HRP Horseradish peroxidase
IF Immunofluorescence
Ig Immunoglobulin
IHC Immunohistochemistry
IMP Inosine monophosphate
IP Intraperitoneal
IPTG Isopropyl-D -thiogalactopyranoside
IV Intravenous
LF Low-folate
MAb Monoclonal antibody
MPM Malignant pleural mesothelioma
mRNA Messenger ribonucleic acid
MS Methionine synthase

Development and Evaluation of Novel Monoclonal Antibodies to FR-α and FPGS
X
MTA Multitargeted antifolate
MTX Methotrexate
NADH Nicotinamide adenine dinucleotide
NADPH Nicotinamide adenine dinucleotide phosphate
NBT Nitroblue tetrazolium
NF Normal-folate
NHL Non-Hodgkin lymphoma
NRS Normal rabbit serum
NSCLC Non-small-cell lung cancer
OD Optical density
OSE Ovarian surface epithelium
PA Polyacrylamide
PAGE Polyacrylamide gel electrophoresis
PBS Phosphate buffered saline
PCR Polymerase chain reaction
PCS Polycloning site
PEG Polyethylene glycol
RE Restriction endonuclease
RFC Reduced folate carrier
RNA Ribonucleic acid
RNR Ribonucleotide reductase
RT Reverse transcriptase
RTPCR Reverse transcription polymerase chain reaction
SHMT Serine hydroxy methyltransferases
SDS Sodium dodecyl sulphate

Development and Evaluation of Novel Monoclonal Antibodies to FR-α and FPGS
XI
SDS-PAGE Sodium dodecyl sulphate polyacrylamide gel electrophoresis
TAXI Tetracycline, ampicillin, X-Gal, IPTG
TBS Tris buffered saline
T/E Tris/EDTA
TEMED Tetramethyl ethylene diamine
TFB Transformation buffer
THF Tetrahydrofolate
Tm Melting temperature
TMA Tissue microarray
TMP Thymidine monophosphate
TS Thymidylate synthase
Tx Thioredoxin
UMP Uridine monophosphate
UTP Uridine triphosphate
WB Western blot
WT Wild type
X-Gal 5-bromo-4-chloro-3indolyl β-D-galactosidase

Development and Evaluation of Novel Monoclonal Antibodies to FR-α and FPGS
XII
Hypothesis Folate biochemical pathway components such as FR-α and FPGS are predicted to be
determinants of response to novel antifolate drugs such as pemetrexed and other folate
receptor targeted cancer therapies. Such drugs are showing promise in current cancer
chemotherapy trials and knowledge of their level of expression in tumours will enable their
optimal use by identifying responsive subgroups of patients. This thesis describes the
development and validation of specific monoclonal antibodies to facilitate this.
To be practical for the analysis of protein biomarkers in multicentre clinical trials, antibodies
are required which can be used on FFPE tissue, which is readily processed in local routine
histology laboratories. To date, FR-α and FPGS antibodies suitable for immunohistochemical
analysis of FFPE samples are not commercially available. A major aim of this project is to
rectify this situation by the production of antibodies directed against both proteins. The
antibodies generated may be of particular use as companion diagnostics to facilitate the
screening ofpatients to establish the predictive value and significance of FR-α and FPGS
expression for the therapeutic response to antifolates, in the context of multicentre clinical
trials. In addition, the antibodies may also be used to predict response of other folate
receptor targeted drug delivery systems and therapies currently under investigation.
The antibodies developed in this project were evaluated on cultured tumour cell lines and
panels of archival FFPE normal tissue and tumour samples, including a tissue microarray of
167 ovarian tumour samples to ensure the patterns of immunoreactivity were consistent
with previous published data and to test the hypothesis that FR-α and FPGS may be markers
of poor prognosis in ovarian tumours with high expression.
It is also hypothesised that FR-α expression may be altered via changes in extracellular
conditions or via the action of hormones. The antibody validation experiments were also
complimented by in vitro studies to determine whether alteration of extracellular folate
concentration or treatment of breast and ovarian tumour cell lines with anti-oestrogens such
as tamoxifen increases FR-α expression and potentially sensitises the cells to antifolates such
as pemetrexed which are hypothesised to be internalized via FR-α.

Development and Evaluation of Novel Monoclonal Antibodies to FR-α and FPGS
XIII
Aims and Expectations To produce monoclonal antibodies directed against FR-α and FPGS, for which
there is an identifiable market as research tools and potential companion
diagnostic/ prognostic markers of response in conjunction with the use of
antifolate cancer chemotherapy agents and other agents currently being
investigated.
Evaluate their ability to detect expression of these proteins by
immunohistochemical analysis of FFPE tissue samples.
Evaluate the suitability of the antibodies for detection of FR-α and FPGS proteins
by Western blotting of sodium dodecyl sulphate (SDS) polyacrylamide gel
electrophoresis (SDS-PAGE) separations of tissue protein extracts.
Epitope map the antibodies to ensure their specificity for the target.
Assess the expression levels of FR-α and FPGS on ovarian cancer patient samples
and evaluate their utility as prognostic markers.
Determine whether extracellular folate concentration changes and antioestrogens
alter the expression of FR-α. This would have implications for the response to FR-α
targeted therapies.
Evaluate the suitability of the antibodies for application in other techniques such
as IF and FACS and identify any potential neutralizing properties they may possess.

Development and Evaluation of Novel Monoclonal Antibodies to FR-α and FPGS
XIV
Table of Contents Declaration ................................................................................................................................. II
Signed ......................................................................................................................................... II
Acknowledgements ................................................................................................................... III
Publications ............................................................................................................................... III
Abstracts and Presentations ..................................................................................................... IV
Abstract ...................................................................................................................................... V
Abbreviations ........................................................................................................................... VII
Hypothesis ................................................................................................................................ XII
Aims and Expectations ............................................................................................................ XIII
Table of Contents .................................................................................................................... XIV
List of Tables ........................................................................................................................... XXX
Chapter One ............................................................................................................................... 1
1. General Introduction .............................................................................................................. 1
1.1. The Immune System ........................................................................................................ 1
1.1.1. Innate Immunity ....................................................................................................... 1
1.1.2. Adaptive Immunity ................................................................................................... 2
1.1.3. B-Lymphocytes ......................................................................................................... 2
1.2. Antibodies ....................................................................................................................... 3
1.3. Antigens ........................................................................................................................... 4

Development and Evaluation of Novel Monoclonal Antibodies to FR-α and FPGS
XV
1.4. Polyclonal Antibodies ...................................................................................................... 5
1.5. Monoclonal Antibodies ................................................................................................... 5
1.6. Metabolism ..................................................................................................................... 7
1.7. Folates ............................................................................................................................. 8
1.7.1. The Folate Pathway .......................................................................................................... 9
1.8. Folate Transport ............................................................................................................ 12
1.8.1. The Reduced Folate Carrier .................................................................................... 12
1.8.2. Folate Receptors (FR’s) ........................................................................................... 13
1.8.3. Folate Receptor Alpha Expression ......................................................................... 18
1.8.4. Regulation of Folate Receptor Alpha Expression ................................................... 20
1.8.5. Folate Receptor Alpha and Cancer ......................................................................... 21
1.8.5.1. Selection of Patients for Folate Receptor Alpha Targeted Therapies ............. 23
1.9. Folylpolyglutamate Synthetase ..................................................................................... 24
1.10. Summary ..................................................................................................................... 26
1.11. Research Plan .............................................................................................................. 27
Chapter Two ............................................................................................................................. 29
2. Antigen Design and Preparation .......................................................................................... 29
2.1. General Introduction ..................................................................................................... 29
2.2. Recombinant Protein Expression Systems .................................................................... 29
2.2.1. The pET Expression System .................................................................................... 30

Development and Evaluation of Novel Monoclonal Antibodies to FR-α and FPGS
XVI
2.3. Aims and Objectives ...................................................................................................... 34
2.4. Materials and Methods ................................................................................................. 35
2.4.1. Antigen Design ....................................................................................................... 35
2.4.1.1. Homology Searches ......................................................................................... 35
2.4.1.2. BLAST Searches ............................................................................................... 35
2.4.2. Target Sequence Selection ..................................................................................... 35
2.4.3. Restriction Mapping ............................................................................................... 36
2.4.4. Oligonucleotide Primer Design .............................................................................. 36
2.4.5. Oligonucleotide Primer Synthesis .......................................................................... 37
2.4.5.1. Oligonucleotide Primer Quantitation .............................................................. 37
2.4.6. RNA Preparation ..................................................................................................... 38
2.4.7. Complementary DNA Preparation/RT-PCR ............................................................ 38
2.4.8. The Polymerase Chain Reaction (PCR) ................................................................... 39
2.4.9. Agarose Gel Electrophoresis .................................................................................. 41
2.4.9.1. Preparation of DNA Size Markers ................................................................... 41
2.4.9.2. Agarose and Running Buffer Preparation ....................................................... 42
2.4.10. Gel Extraction/ Fragment Preparation ................................................................. 42
2.4.11. Preparation of pGEM T-easy plasmid construct .................................................. 42
2.4.12. pGEM T-Vector Ligations ...................................................................................... 43
2.5. Protein Expression ......................................................................................................... 44
2.5.1. Preparation of Growth Media ................................................................................ 44
2.5.1.1. 2YT Media ........................................................................................................ 44
2.5.1.2. 2YT Agar .......................................................................................................... 44

Development and Evaluation of Novel Monoclonal Antibodies to FR-α and FPGS
XVII
2.5.2. Overnight E.coli cultures ........................................................................................ 44
2.5.3. Novablue E.coli Non-Expression Host .................................................................... 45
2.5.4. Competent E.coli Preparation ................................................................................ 46
2.5.5. Transformation of pGEM T Easy Constructs into Novablue E.coli ......................... 46
2.5.6. Selection Plates ...................................................................................................... 47
2.5.7. Colony Screening Procedure and Plasmid Isolation ............................................... 47
2.5.7.1. Plasmid Minipreparations ............................................................................... 47
2.5.8. Restriction Digestion of Plasmid DNA .................................................................... 47
2.5.9. Automated DNA Sequencing .................................................................................. 49
2.5.10. Expression of FR-α and FPGS Recombinant Proteins ........................................... 49
2.5.10.1. Subcloning in to pET Expression Vectors ...................................................... 49
2.5.10.2. Preparation of the Insert for Subcloning ...................................................... 55
2.5.10.3. Preparation of pET vectors ............................................................................ 55
2.5.10.4. Ligation of DNA fragments into pET constructs ............................................ 56
2.5.10.5. Transformation into Novablue E.coli ............................................................ 56
2.5.10.6. Screening Transformant Colonies ................................................................. 56
2.5.11. Transformation into an Expression Host .............................................................. 57
2.5.11.1. E.coli BL21 (DE3) plysS and Tuner (DE3) plysS .............................................. 57
2.5.11.2. Transformation into E.coli BL21/Tuner ......................................................... 57
2.5.12. Fusion Protein Expression .................................................................................... 58
2.5.12.1. Small Scale Fusion Protein Induction ............................................................ 58
2.5.13. SDS Polyacrylamide Gel Electrophoresis .............................................................. 58

Development and Evaluation of Novel Monoclonal Antibodies to FR-α and FPGS
XVIII
2.5.13.1. Large Scale Fusion Protein Induction ............................................................ 59
2.5.14. Sonication of Large Scale Products ...................................................................... 60
2.5.15. His-Bind Column Chromatography ...................................................................... 60
2.5.15.1. Soluble Columns ............................................................................................ 60
2.5.15.2. Insoluble Columns ......................................................................................... 61
2.5.15.3. Protein Assay ................................................................................................. 61
2.5.16. Refolding of Insoluble Protein Fractions .............................................................. 62
2.5.17. Refolding by Dialysis ............................................................................................. 62
2.5.18. Refold Columns .................................................................................................... 63
2.6. Results - Antigen Design ................................................................................................ 63
2.6.1. Amino Acid and Gene Sequences .......................................................................... 63
2.6.2. Target Sequence Selection ..................................................................................... 63
2.6.3. Primer Design ......................................................................................................... 64
2.6.4. Amplification of FPGS2 and FR-α DNA ................................................................... 65
2.6.5. Amplification of FPGS3 cDNA ................................................................................. 66
2.6.6. Fragment Preparations and Restriction Digests .................................................... 67
2.6.7. pET Cloning ............................................................................................................. 70
2.6.8. Expression of FR-α and FPGS Recombinant Proteins in E.coli ............................... 70
2.6.9. Large Scale Recombinant Protein Expression ........................................................ 73
2.6.10. Recombinant FR-α and FPGS Protein Purification ............................................... 73
2.6.10.1. FPGS2............................................................................................................. 73
2.6.10.2. FR-α ............................................................................................................... 74
2.6.10.3. FPGS3............................................................................................................. 76

Development and Evaluation of Novel Monoclonal Antibodies to FR-α and FPGS
XIX
2.7. Discussion ...................................................................................................................... 78
2.7.1. Recombinant Protein Production ........................................................................... 78
Chapter Three ........................................................................................................................... 81
3. Antibody Production ............................................................................................................ 81
3.1. Hybridoma Technology ................................................................................................. 81
3.1.1. Cell Fusion Technique............................................................................................. 81
3.1.2. Antibody Screening and Characterisation .............................................................. 83
3.1.3. Epitope Mapping .................................................................................................... 84
3.2. Aims and Objectives ...................................................................................................... 87
3.3. Materials and Methods ................................................................................................. 88
3.3.1. Mouse Immunisation Schedule .............................................................................. 88
3.3.2. Growth of Cell Lines ............................................................................................... 89
3.3.3. Protein Estimation .................................................................................................. 90
3.3.4. Western Blotting (WB) ........................................................................................... 91
3.3.5. Assessment of Bleeds via Western Blot ................................................................. 92
3.3.6. Immunohistochemistry .......................................................................................... 94
3.3.6.1. Indirect Avidin-Biotin (ABC) Technique Immunohistochemistry .................... 96
3.3.6.2. Novolink™ Polymer Immunohistochemistry ................................................... 97
3.3.6.3. Bleed Assessment via Immunohistochemistry ............................................... 97
3.3.7. NS-1 Myeloma Cell Culture .................................................................................... 98
3.3.8. Cell Fusion Procedure ............................................................................................. 99
3.3.8.1. Fusion Preparation .......................................................................................... 99

Development and Evaluation of Novel Monoclonal Antibodies to FR-α and FPGS
XX
3.3.8.2. Splenocyte Preparation ................................................................................... 99
3.3.8.3. NS-1 Myeloma Cells ........................................................................................ 99
3.3.8.4. Fusion in PEG ................................................................................................. 100
3.3.9. Enzyme Linked Immunosorbent Assay (ELISA) .................................................... 100
3.3.9.1. Screening for Specific Hybridoma Colonies via ELISA ................................... 100
3.3.9.2. ELISA Screening of Hybridomas against Fusion Protein Tags ....................... 102
3.3.10. Screening ELISA Positive Hybridomas via IHC .................................................... 102
3.3.11. Cloning Hybridomas via Limiting Dilution .......................................................... 102
3.3.11.1. Assessment of 1st and 3rd Clones via Western Blot Analysis..................... 103
3.3.12. Freezing Down Cells ........................................................................................... 103
3.3.13. Weaning into R20 Medium ................................................................................ 104
3.4. Antibody Validation and Characterisation .................................................................. 104
3.4.1. Characterisation of Weaned Clones via Immunohistochemistry ........................ 104
3.4.2. Characterisation of Weaned clones via Western Blot Analysis ........................... 104
3.4.3. Further Characterisation ...................................................................................... 105
3.4.4. Epitope Mapping .................................................................................................. 105
3.5. Results – Hybridoma Technology ................................................................................ 107
3.5.1. Mouse Immunisation and Polyclonal Assessment ............................................... 107
3.5.1.1. FPGS Immunisations/Polyclonal Assessment ............................................... 107
3.5.2. FR-α Immunisations/Polyclonal Assessment ....................................................... 109
3.5.2.1. Western Blot Studies to Identify the Cause of Cross-Reactivity ................... 111
3.5.3. Production of Anti FR-α and FPGS Antibodies ..................................................... 114

Development and Evaluation of Novel Monoclonal Antibodies to FR-α and FPGS
XXI
3.5.3.1. Anti FPGS Antibody Generation .................................................................... 114
3.5.4. FPGS Expression via Western Blot Analysis ......................................................... 115
3.5.4.1. FPGS Extended Panel .................................................................................... 116
3.5.4.2. FPGS Leukaemia Panel .................................................................................. 118
3.5.5. FPGS Expression in Normal and Inflamed Tissues ............................................... 118
3.5.6. FPGS Expression in Benign and Malignant Tissues .............................................. 121
3.5.7. FPGS Further Characterisation ............................................................................. 124
3.5.8. FPGS Epitope Mapping ......................................................................................... 125
3.5.8.1. Anti FR-α Antibody Generation ..................................................................... 126
3.5.8.2. FR-α Expression via Western Blot Analysis .................................................. 128
3.5.8.3. FR-α Extended Panel ..................................................................................... 128
3.5.8.4. FR-α Leukaemia Panel ................................................................................... 130
3.5.9. FR-α Expression in Normal and Inflamed Tissues ................................................ 130
3.5.10. FR-α Expression in Benign and Malignant Tissues ............................................. 132
3.5.11. FR-α Further Characterisation ............................................................................ 135
3.5.12. FR-α Epitope Mapping ........................................................................................ 136
3.5.13. mOV 18 Epitope Mapping .................................................................................. 137
3.5.14. LK26 Epitope mapping ....................................................................................... 138
3.6. Discussion .................................................................................................................... 139
3.6.1. FPGS Antibody Development ............................................................................... 139
3.6.1.1. FPGS WB Analysis .......................................................................................... 139
3.6.1.2. FPGS IHC Analysis .......................................................................................... 141

Development and Evaluation of Novel Monoclonal Antibodies to FR-α and FPGS
XXII
3.6.1.3. FPGS Epitope Mapping .................................................................................. 141
3.6.2. FR-α Antibody Development ................................................................................ 142
3.6.2.1. FR-α WB Analysis ........................................................................................... 143
3.6.2.2. FRα IHC Analysis ............................................................................................ 145
3.6.2.3. FR-α Epitope Mapping ................................................................................... 146
Chapter Four ........................................................................................................................... 150
4. Ovarian Tissue Microarray Analyses .................................................................................. 150
4.1. Ovarian TMA Study Aims and Objectives .................................................................... 151
4.2. Ovarian TMA Study Materials and Methods ............................................................... 151
4.2.1. Assessment of TMA IHC Staining- Scoring System Used...................................... 152
4.2.2. Statistical Analysis ................................................................................................ 153
4.2.2.1. Kaplan-Meier Survival Plots and Log-Rank Test ............................................ 153
4.3. Ovarian TMA Study - Results ....................................................................................... 154
4.3.1. FR-α and FPGS Images and Scoring ...................................................................... 154
4.3.2. Statistical Analysis of Overall Survival .................................................................. 162
4.3.2.1. Overall Survival and FR-α Score 1, 2 and Mean ........................................... 164
4.3.2.2. Overall Survival and FPGS Score 1, 2 and Mean ........................................... 166
4.3.2.3. Overall Survival Multivariate Analysis ........................................................... 166
4.3.3. Statistical Analysis of Time to Relapse ................................................................. 167
4.3.3.1. Relapse Free Survival and FR-α Score 1, 2 and Mean ................................... 169

Development and Evaluation of Novel Monoclonal Antibodies to FR-α and FPGS
XXIII
4.3.3.2. Relapse Free Survival and FPGS Score 1, 2 and Mean .................................. 171
4.3.4. Relapse Free Survival Multivariate Analysis ......................................................... 171
4.3.4.1. Correlations between FR-α, FPGS and Other Prognostic Variables .............. 172
4.4. Discussion .................................................................................................................... 176
Chapter Five ........................................................................................................................... 182
5. Cell Studies ......................................................................................................................... 182
5.1. Cell Studies - Aims and Objectives .............................................................................. 184
5.2. Oestrogen Regulation Study – Materials and Methods .............................................. 185
5.2.1. Culture and Treatment of Cells ............................................................................ 185
5.3. Oestrogen Regulation Study - Results ......................................................................... 186
5.4. Oestrogen Regulation Study – Discussion ................................................................... 187
5.5. Extracellular Folate Concentration Study – Materials and Methods .......................... 188
5.6. Extracellular Folate Concentration Study – Results .................................................... 189
5.6.1. FPGS ...................................................................................................................... 189
5.6.2. FR-α ...................................................................................................................... 190
5.7. Extracellular Folate Concentration Study – Discussion ............................................... 190
5.8. mOV18 Comparative Study –Materials and Methods ................................................ 191
5.9. mOV18 Comparative Study - Results .......................................................................... 192
5.10. mOV18 Comparative Study – Discussion .................................................................. 195
5.11. Breast Cancer Case Study – Materials and Methods ................................................ 195

Development and Evaluation of Novel Monoclonal Antibodies to FR-α and FPGS
XXIV
5.12. Breast Cancer Case Study – Results .......................................................................... 196
5.13. Breast Cancer Case Study - Discussion ...................................................................... 197
5.14. Immunofluorescence Studies – Materials and Methods .......................................... 197
5.15. Immunofluorescence Studies - Results ..................................................................... 198
5.16. Immunofluorescence Studies - Discussion ................................................................ 201
6. Concluding Remarks and Future Direction ........................................................................ 203
References .............................................................................................................................. 208

Development and Evaluation of Novel Monoclonal Antibodies to FR-α and FPGS
XXV
List of Figures Figure 1-1: Antibody structure. .................................................................................................. 4
Figure 1-2: Diagrammatic representation of the structure of the folic acid molecule. ............. 9
Figure 1-3: General overview of the folate metabolic pathway.. ............................................ 11
Figure 1-14: Diagrammatic representation of the RFC.. .......................................................... 13
Figure 1-15: GPI anchor structure.. .......................................................................................... 14
Figure 1-16: The organisation of human FR genes. ................................................................. 16
Figure 1-17: Diagrammatic representation of the folate receptor potocytosis mechanism. .. 17
Figure 2-1: The control elements of the pET system. .............................................................. 32
Figure 2-2: Overview of the recombinant protein production methods used for the
generation of recombinant FR-α and FPGS.............................................................................. 33
Figure 2-3: Primer Tm calculation. ........................................................................................... 37
Figure 2-4: Steps involved in PCR reactions. ............................................................................ 40
Figure 2-5: T-Easy Vector Map. ................................................................................................ 43
Figure 2-6: Photograph of blue-white selection plate. ............................................................ 45
Figure 2-7: Common RE’s generating both blunt and sticky ends. .......................................... 48
Figure 2-8: pET 21 Vector map. ................................................................................................ 51
Figure 2-9: pET 41 Vector map ................................................................................................. 53
Figure 2-10: pET32 Vector map ................................................................................................ 54
Figure 2-11: FR-α target region. ............................................................................................... 64

Development and Evaluation of Novel Monoclonal Antibodies to FR-α and FPGS
XXVI
Figure 2-12: FPGS target region. .............................................................................................. 64
Figure 2-13: FR-α and FPGS PCR products. .............................................................................. 66
Figure 2-14: FPGS nested PCR product. ................................................................................... 67
Figure 2-15: FR-α and FPGS restriction digests. ....................................................................... 68
Figure 2-16: Typical DNA sequencing chromatogram trace obtained. .................................... 69
Figure 2-17: FPGS small scale inductions. ................................................................................ 71
Figure 2-18: FR-α pET21 small scale inductions. ...................................................................... 72
Figure 2-19: FR-α pET41 small scale inductions ....................................................................... 72
Figure 2-20: FPGS insoluble fractions. ..................................................................................... 74
Figure 2-21: FR-α insoluble fractions. ...................................................................................... 75
Figure 2-22: FR-α refolded fractions. ....................................................................................... 76
Figure 2-23: FPGS dialysed protein. ......................................................................................... 77
Figure 3-1: Overview of de novo and nucleotide salvage pathways in mammalian cells. ...... 83
Figure 3-2: Overview of MAb production ................................................................................ 86
Figure 3-3: Semi-dry blotting apparatus. ................................................................................. 93
Figure 3-4: Indirect ABC technique immunohistochemistry. ................................................... 95
Figure 3-5: Novolink™ polymer methodology. ........................................................................ 97
Figure 3-6: Positive ELISA plate. ............................................................................................. 101
Figure 3-7: AP WB of FPGS polyclonal bleed.. ........................................................................ 108
Figure 3-8: Polyclonal and monoclonal comparison. ............................................................. 108

Development and Evaluation of Novel Monoclonal Antibodies to FR-α and FPGS
XXVII
Figure 3-9: FR-α polyclonal bleed. .......................................................................................... 110
Figure 3-10: FPGS polyclonal bleed. ....................................................................................... 115
Figure 3-11: FPGS extended panel WB. ................................................................................. 116
Figure 3-12: FPGS extended panel (2) WB. ............................................................................ 117
Figure 3-13: FPGS leukaemia panel WB. ................................................................................ 118
Figure 3-14: FPGS normal panel. ............................................................................................ 120
Figure 3-15: FPGS tumour panel.. .......................................................................................... 123
Figure 3-16: FPGS pre-treatment evaluation. ........................................................................ 124
Figure 3-17: FPGS epitope mapping. ...................................................................................... 125
Figure 3-18: FPGS epitope. ..................................................................................................... 126
Figure 3-19: FR-α bleed evaluation. ....................................................................................... 127
Figure 3-20: FR-α extended panel WB. .................................................................................. 128
Figure 3-21: FR-α extended panel (2) WB. ............................................................................. 129
Figure 3-22: FR-α leukaemia panel WB. ................................................................................. 130
Figure 3-23: FR-α normal panel. ............................................................................................. 132
Figure 3-24: FR-α tumour panel (1). ....................................................................................... 134
Figure 3-25: FR-α pre-treatment selection. ........................................................................... 135
Figure 3-26: FR-α epitope mapping. ...................................................................................... 136
Figure 3-27: FR-α epitope. ...................................................................................................... 137
Figure 3-28: mOV18 epitope mapping. .................................................................................. 137

Development and Evaluation of Novel Monoclonal Antibodies to FR-α and FPGS
XXVIII
Figure 3-29: mOV18 epitope. ................................................................................................. 138
Figure 3-30: LK26 epitope mapping. ...................................................................................... 138
Figure 4-1: Photograph of the OVCA TMA slides. .................................................................. 154
Figure 4-2: Photograph of OVCA1 stained with FR-α. ............................................................ 155
Figure 4-3: Photograph of twelve TMA cell cores (x1) stained with FR-α. ............................ 156
Figure 4-4: Photograph of eight TMA cores (x4) stained with FR-α. ..................................... 157
Figure 4-5: Photograph of OVCA1 stained with FPGS. ........................................................... 158
Figure 4-6: Twelve TMA cell cores (x1) stained with FPGS. ................................................... 159
Figure 4-7: Photograph of eight TMA cores (x4) stained with FPGS.. .................................... 160
Figure 4-8: FR-α membrane staining. ..................................................................................... 161
Figure 4-9: FPGS cytoplasmic staining. .................................................................................. 161
Figure 4-10: FR-α Kaplan-Meier analysis (1). ......................................................................... 164
Figure 4-11: FR-α Kaplan-Meier analysis (2). ......................................................................... 165
Figure 4-12: FR-α Kaplan-Meier analysis (3). ........................................................................ 165
Figure 4-13: FPGS Kaplan-Meier analysis (1). ........................................................................ 166
Figure 4-14: FR-α Kaplan-Meier analysis (4). ......................................................................... 169
Figure 4-15: FR-α Kaplan-Meier analysis (5). ......................................................................... 170
Figure 4-16: FR-α Kaplan-Meier analysis (6). ......................................................................... 170
Figure 4-17: FPGS Kaplan-Meier analysis (2). ........................................................................ 171

Development and Evaluation of Novel Monoclonal Antibodies to FR-α and FPGS
XXIX
Figure 4-18: Statistical analysis of the relationship between FR-alpha IHC score 1 and the
other prognostic variables. . .................................................................................................. 174
Figure 4-19: Statistical analysis of the relationship between FPGS IHC score 2 and the
other prognostic variables. .................................................................................................... 175
Figure 5-1: FR-α oestrogen regulation WB. ........................................................................... 186
Figure 5-2: FPGS extracellular folate concentration WB. ...................................................... 189
Figure 5-3: FR-α extracellular folate concentration WB. ....................................................... 190
Figure 5-4: FR-α mOV18 comparative study.. ........................................................................ 194
Figure 5-5: FR-α Breast cancer IHC case study.. ..................................................................... 196
Figure 5-6: IF comparative study WB.. ................................................................................... 200

Development and Evaluation of Novel Monoclonal Antibodies to FR-α and FPGS
XXX
List of Tables Table 2-1: RT-PCR Components ............................................................................................... 39
Table 2-2: PCR Mixture Components ....................................................................................... 40
Table 2-3: Standard Conditions used in PCR reactions. ........................................................... 41
Table 2-4: Reagents used in T-vector ligations. ...................................................................... 44
Table 2-5: Reagents used for restriction digests. ..................................................................... 49
Table 2-6: Reagents used for restriction digestion in preparation for subcloning .................. 55
Table 2-7: Reagents used for pET vector digestion .................................................................. 55
Table 2-8: Reagents used for ligations ..................................................................................... 56
Table 2-9: FR-α and FPGS forward and reverse primers. ......................................................... 65
Table 2-10: FPGS Nested PCR primer sequences. .................................................................... 67
Table 2-11: FR-α primer sequences. ........................................................................................ 70
Table 2-12: Summary of some of the recombinant proteins generated in this project. ......... 77
Table 3-1: Mouse immunisation schedules employed in this study. ....................................... 89
Table 3-2: Human cell lines used for characterisation of FR-α and FPGS antibodies. ............. 90
Table 3-3: Immunostaining for wild-type FPGS NN 3.2 on normal and inflamed tissues. .... 119
Table 3-4: Immunostaining for FPGS on a range of benign and malignant tissues ............... 122
Table 3-5: Immunostaining for wild-type FR-α BN 3.2 on normal and inflamed tissues. ...... 131
Table 3-6: Immunostaining for FR-α on a range of benign and malignant tissues ................ 133
Table 4-1: Summary of statistical analysis of overall survival ................................................ 163

Development and Evaluation of Novel Monoclonal Antibodies to FR-α and FPGS
XXXI
Table 4-2: Summary of statistical analysis of time to relapse ............................................... 168
Table 4-3: Summary of the correlations between FR-α/FPGS and the other prognostic
variables. ................................................................................................................................ 173

Development and Evaluation of Novel Monoclonal Antibodies to FR-α and FPGS
XXXII
Chapter One

Development and Evaluation of Novel Monoclonal Antibodies to FR-α and FPGS
1
Chapter One
1. General Introduction
1.1. The Immune System
The immune system is the body’s defence system against foreign agents, infectious
organisms and cancerous cells. It has the capacity to generate an enormous variety of cells
and molecules which act in synergy to specifically recognise and eliminate countless foreign
organisms.
The immune response can be broadly divided into two phases – immune recognition and
response. Immune recognition is extremely specific and can identify subtle chemical
differences which distinguish one pathogen from the next. Furthermore, this recognition
system is able to discriminate between foreign molecules and the body’s own cells and
proteins.
Once a pathogen has been recognized, the immune system recruits a variety of cells and
molecules to generate an effector response. Subsequent exposure to the same pathogen
evokes immunological memory, characterised by a heightened immune reaction and a more
rapid response (Goldsby, Kindt, Osborne, & Kiuby, 2003).
1.1.1. Innate Immunity
Immunity itself can also be segregated into two broad categories; the less specific
component, innate immunity, provides the first line of defence against infection and
prevents the penetration and spread of many infectious agents. Innate immunity is
nonspecific and does not improve with repeated exposure, but does provide broad reactivity
against various frequently encountered foreign pathogens.
Components of the innate immune system include a variety of anatomic, physiological,
biochemical, inflammatory and cellular barriers including skin, mucosa, lysozymes,
complement and phagocytes (Goldsby et al., 2003).

Development and Evaluation of Novel Monoclonal Antibodies to FR-α and FPGS
2
1.1.2. Adaptive Immunity
Adaptive immunity differs from innate immunity as it is able to recognise and selectively
eliminate foreign pathogens. Adaptive immune responses differ between individuals as they
are reactions to specific antigenic challenges.
The antigenic specificity of the adaptive immune system allows it to distinguish subtle
differences among antigens and is capable of generating tremendous diversity in its
recognition molecules. Immunologic memory allows the adaptive immune response to
confer lifelong immunity to many pathogens after just one initial exposure.
Adaptive immunity is not independent of innate immunity and both systems work intimately
together. Immune responses can be divided into cell mediated and humoral responses. Cell
mediated immunity can be transferred only by the administration of T-lymphocytes from an
immune individual; in contrast humoral immunity refers to transient immunity that can be
transferred to a non-immune individual by the administration of serum antibodies from an
immune individual (Goldsby et al., 2003). As this project is concerned with the humoral
branch of the immune response this branch only will subsequently be discussed.
1.1.3. B-Lymphocytes
B-lymphocytes mature in the bone marrow and each cell expresses a membrane bound
antibody molecule. As a B-cell matures, random rearrangements of gene segments encoding
an antibody molecule generate a vast number of B-cells with different antigenic specificities.
Naive B-cells circulate and, upon first encounter with a pathogen whose antigen matches the
membrane bound antibody, divide rapidly and differentiate into clones of antigenically
committed mature B-lymphocyte daughter cells with a single, distinct specificity. Each cell
clone recognises a discrete, identical site of amino acids (epitope) on an antigen. Epitopes
can be both linear and conformational in nature. Memory B-cells are identical to the naive
cell, expressing the same membrane bound antibody but have a longer lifespan. Plasma cells
are B cells containing no membrane bound antibody but produce antibody in a secreted
form, and have a finite lifespan of only a few days (Goldsby et al., 2003).

Development and Evaluation of Novel Monoclonal Antibodies to FR-α and FPGS
3
1.2. Antibodies
Antibodies function as the effectors of the humoral immune response by binding to antigen
and neutralising it or facilitating its elimination. When an antigen is coated with antibody it
can be eliminated in two ways:
It can crosslink several antigens, forming clusters for digestion by phagocytosis;
this occurs via activation of the complement system and results in lysis of the
foreign organism.
Antibodies can also ‘coat’ (opsonise) an organism, thus neutralising it and
preventing it from binding to host cells (Guyton & Hall, 1997) .
Antibodies (also termed Immunoglobulins, Ig’s) are glycoproteins residing in the serum
fraction of blood (Tiselius, 1939) and have a common structure of four peptide chains,
consisting of two identical light chains and two identical heavy chains; these are linked to
each other by disulphide bonds and various noncovalent linkages to form a heterodimer
(Figure 1-1). Similar interactions link the two heavy and light chains to form a dimer of
dimers, forming the basic 4 chain structure of an antibody molecule (Guyton & Hall, 1997).
Approximately the first 110 amino acids of the amino terminal region of a light or heavy
chain can show great variation among antibodies and it is this region which is responsible for
their defined specificity. The light chains contain a constant and a variable domain and are
classified as either κ or λ, based upon small differences in their polypeptide structure. Each
antibody contains two light chains which are always identical, but it is the heavy chains
which determine the antibody subclass (isotype). There are five types of mammalian Ig
heavy chain: α, δ, ε, γ and μ; these chains are found in IgA, IgD, IgE, IgG and IgM antibodies
respectively (Jaton & Riesen, 1976). Each heavy chain contains a constant and a variable
region, the constant region being almost identical in all antibodies of the same class. Each
isotype differs in its biological properties, function and location. Igs can be further divided
into sub classes/ isotypes based upon minor differences in the sequences of α and γ heavy
chains: α1, α2, γ 1, γ2, γ3 and γ4 giving rise to immunoglobulins IgA1, IgA2, IgG1, IgG2, IgG3
and IgG4 respectively. IgG is the major Ig present in the serum and provides the majority of
antibody based immunity to pathogens (Goldsby et al., 2003).

Development and Evaluation of Novel Monoclonal Antibodies to FR-α and FPGS
4
Digestion of an antibody molecule with the enzyme papain produces three antibody
fragments; two identical with antigen binding activity, denoted Fab fragments with a MW of
45,000 Da, and one fragment with no antigen binding activity, denoted the Fc fragment with
a MW of 50,000 Da (Figure 1-1).
Figure 1-1: Antibody structure. Each heavy and light chain in an Ig molecule contains an amino
terminal variable (V) region (pale blue, yellow respectively), the remainder of the molecule the
constant (C) regions (dark blue and purple) exhibit limited variation, defining the two light and five
heavy chain subclasses. The Fc and Fab/ Fab2 regions are also depicted (Abcam).
1.3. Antigens
Substances which are recognised by the B-cell antibody are termed antigens; the basic
principle of any immunological technique is that an antibody will combine with its specific
antigen to give an exclusive complex of Ab/Ag. Classically, an antigen is defined as any
substance which elicits an immune response in a susceptible animal and is capable of
binding with the specific antibodies generated. Antigens are usually of a high molecular

Development and Evaluation of Novel Monoclonal Antibodies to FR-α and FPGS
5
weight and are commonly proteins or polysaccharides although nucleic acids, lipids and
peptides have also been reported to function as antigens (Goldsby et al., 2003).
For an efficient Ag/Ab interaction to occur the epitope must be exposed and available for
binding, alterations in the conformation of epitopes through tissue processing, fixation,
reduction and pH changes may affect the binding. It is for this reason antibodies are often
effective for one particular immunological technique such as immunohistochemistry (IHC)
but are unsuitable for application in a different technique such as Western blot (WB) or
immunoprecipitation of native proteins.
1.4. Polyclonal Antibodies
Prior to 1975, the only antibodies available were polyclonal in nature. Polyclonal antibodies
refer to antibodies present in the crude serum of an immunised animal, capable of
recognising a number of different immunogenic epitopes of the administered immunogen.
These antibodies may be of different subclasses. It will also contain other, sometimes large
amounts of undesirable immunoglobulins produced via the animals immune response and,
depending on the immunogenicity of the administered antigen may make up as little as 5%
of the total immunoglobulin present. The presence of such antibodies increases the risk of
cross reactivity and anomalous results and variability between batches often leads to
inconsistencies in results. However, despite the drawbacks these antibodies are often used
as they are quick and inexpensive to produce, requiring little skill or technical expertise.
They are particularly useful when amplification of a signal from a target protein with low
expression is required as they recognise multiple epitopes on one protein.
1.5. Monoclonal Antibodies
Monoclonal antibodies, in contrast are slow and expensive to produce and require high
technology and extensive technical skills in order to produce successful antibodies. Large
quantities of specific antibodies can be produced and their specificity ensures that only one
epitope is recognised on an antigen, this is extremely useful when observing subtle protein
alterations and the antibodies are less likely to cross react with other proteins and generally
produce less background cross reaction. Once a hybridoma is established a constant and
Development and Evaluation of Novel Monoclonal Antibodies to FR-α and FPGS
6
renewable antibody source is generated and all batches are identical, eliminating the
problem of batch variability associated with polyclonal antibodies. Monoclonal antibodies
are only one subclass, usually IgG, allowing for selection of an appropriate secondary
antibody for detection.
Monoclonal antibodies (MAbs) have revolutionised immunology, their ability to discriminate
between antigens has had a major impact upon numerous research areas including cancer,
virology and inflammatory diseases. MAbs have several different roles and may be used in all
stages of cancer therapy from the diagnosis, monitoring and finally also in the treatment of
the disease. MAbs are produced by a specialised cell fusion technique, the methodology of
which will be discussed in detail in section 3.1. The resultant antibodies generated are
derived from stable fusion cells which can be grown in culture secreting genetically identical
antibodies.
Their precise antigen specificity and ability to distinguish fine structural antigenic
differences between proteins overcome the problems with cross reaction associated with
polyclonal antisera and make them powerful biochemical tools. In addition to their
therapeutic potential they are also extremely versatile in molecular biology, with application
in ELISA, IHC, Western blotting (WB) and immunofluorescence (IF); convenient labelling with
fluorescent or electron dense particles allow their application in both fluorescence and
electron microscopy.
As therapeutic agents, MAbs can be used directly to react with antigens on the surface of
cancer cells and may enhance the immune response. They can be selected to act against
growth factor receptors, inhibiting tumour growth. In addition they can be conjugated to
anticancer drugs, radioisotopes or other toxins; upon binding to their antigen they can then
selectively target the agent they are carrying to the tumour cells.
Animal antibodies may elicit an immune response themselves in an individual. Many
antibody therapies also require humanisation of the antibody before they can be used in
order to reduce the likelihood of an immune reaction (Schroff, Foon, Beatty, Oldham, &
Morgan, 1985).
MAbs have had tremendous success to date, particularly in haematologic malignancies and
in a number of solid tumours. To date the FDA have approved 21 MAb products, with six of

Development and Evaluation of Novel Monoclonal Antibodies to FR-α and FPGS
7
these being approved specifically for their use in cancer. The first MAb to receive FDA
approval was Rituximab, a humanised MAb directed against CD20, a B-cell antigen expressed
to a high degree in B cell malignancies, it is indicated for the treatment of low-grade
lymphomas refractory to conventional therapy (Hainsworth, 2000; Hainsworth et al., 2000).
Other MAbs include Trastuzumab (Herceptin®), a humanised McAb targeting the HER-2/neu
antigen expressed in 25-35% of breast cancers and Edrecolomab targeting the 17-1A antigen
seen in colon and rectal malignancies (Hainsworth et al., 2000; Haller, 2001).
MAbs also have application outside of cancer therapy, including Palivisumab, used in the
treatment of respiratory syncitial virus and Infliximab, which targets tumour necrosis factor
alpha (TNF-α), used in the treatment of Crohns disease and arthritis (Alkan, 2004).
The ‘magic bullet’ approach to cancers is the ultimate aim in cancer therapies, to selectively
target the tumour whilst protecting normal tissues from any of the toxic effects. MAb’s by
their very nature have the potential to do just this, making them extremely attractive
current and future tools in the fight against cancers.
1.6. Metabolism
Glucose and other food molecules taken in from the diet are catabolised via controlled,
stepwise oxidation processes, in order to provide chemical energy in the form of ATP and
NADH.
The products of glycolysis, the citric acid cycle and oxidative phosphorylation occur in the
cytosol, mitochondrial matrix and mitochondrial membrane respectively and serve as the
starting material for each subsequent reaction.
As well as catabolic reactions, the intermediate products from both glycolysis and the citric
acid cycle are used to produce small molecules used as raw materials in various biosynthetic
pathways. One of such pathways is the synthesis of activated precursors, which ultimately
form new DNA.
Nucleotides, needed to form both RNA and DNA are synthesized via specialised biosynthetic
pathways; carbon and nitrogen atoms present in purine and pyrimidine bases are derived
from amino acids; deoxyribose and ribose sugars are derived from glucose (Alberts et al.,
2002).

Development and Evaluation of Novel Monoclonal Antibodies to FR-α and FPGS
8
Nucleotides play a central role in almost all biochemical processes carried out within the
human body. Not only are they the monomeric components of DNA and RNA, but they also
drive many free energy requiring reactions, regulate numerous metabolic pathways,
mediate hormone signals and are essential coenzymes in a number of enzymatic reactions.
Almost every cell in the human body can synthesize nucleotides de novo and from the
degradation products of nucleic acids, reflecting their vital importance (Voet & Voet, 2004).
1.7. Folates
Folate is derived from the latin word ‘folium’ meaning leaf, it is found in high concentrations
in green, leafy vegetables and was first isolated from spinach in 1941 (Mitchell, Snell, &
Williams, 1941).
Folate is the generic term given to a large family of B vitamins with similar biological activity.
Folates exist in various oxidation states, the most oxidised and stable of which is folic acid
(pteroylmonoglutamate, PteGlu, Figure 1-2), used in nutritional supplements and food
fortification. Naturally occurring folates are also used as pharmaceutical agents in the
treatment of various cancers and anaemia (Fitzpatrick, 2003).
Folic acid and its various coenzymes facilitate the transfer of single carbon (C1) fragments
from donor molecules and are involved in methylation reactions, including purine and
pyrimidine nucleotide biosynthesis, amino acid conversions such as the conversion of serine
to glycine, catabolism of histidine to glutamic acid and the conversion of homocysteine to
methionine (Fitzpatrick, 2003).
The chemical structure of folate is comprised of a para-amino benzoic acid linked at one end
to a 2-amino, 4-hydroxy- pteridine ring (pteroic acid) and at the other end to a variable
number of glutamic acid moeties, typically 1-9 residues (Figure 1-2). The pteridine ring is the
component of the molecule which can be altered in its oxidation state at the N5 and N10
positions. This ring cannot be synthesized endogenously by mammalian cells and must be
obtained from exogenous sources via the diet or from intestinal microflora (Berg, Tymoczko,
& Stryer, 2002; Rosenblatt, 1995).

Development and Evaluation of Novel Monoclonal Antibodies to FR-α and FPGS
9
Figure 1-2: Diagrammatic representation of the structure of the folic acid molecule. a) P-amino
benzoic acid is linked at one end to 6 methyl pteridin, forming pteroic acid and at the other end to a variable
number of glutamic acid moieties, forming the whole folic acid molecule. b) The structure of the polyglutamic
acid molecule, three residues are represented but up to nine residues can be attached to the folic acid molecule
(Polonen, 2000).
1.7.1. The Folate Pathway
Folates taken in from the diet are absorbed through the intestine in the monoglutamyl form,
primarily as N5-methyl tetrahydrofolate (THF). Transport through the membrane is
facilitated by both receptor and carrier mediated mechanisms via the folate receptor (FR)
and reduced folate carrier (RFC) respectively. Once inside the cell monoglutamyl folates are
polyglutamated via the action of the enzyme folylpolyglutamate synthetase (FPGS, Figure
1-3). These steps will be discussed in more detail in section 1.9.
N5-methyl THF is converted into its more versatile cofactor N5,N10-methylene THF via the
action of the enzyme serine hydroxymethyl transferase (SHMT). Demethylation of 5-methyl
THF can also occur via the vitamin B12 dependent reaction with methionine synthase (MS),
yielding THF (Figure 1-3). N5,N10-methylene THF is a key substrate, as its cellular
concentration is thought to regulate the flux of this substrate into the different branches of
a
b

Development and Evaluation of Novel Monoclonal Antibodies to FR-α and FPGS
10
the pathway and is a more useful intracellular form of the vitamin that can be used in
nucleotide biosynthesis (Green, MacKenzie, & Matthews, 1988; Matthews, 1984).
Once inside the cell THF can be directed into one of three major branches in the pathway
contributing towards:
Methionine synthesis and hence DNA Methylation
Purine synthesis
Thymidine synthesis

Development and Evaluation of Novel Monoclonal Antibodies to FR-α and FPGS
11
Figure 1-3: General overview of the folate metabolic pathway. Folates1 are transported into cells predominantly by the RFC2 and also by the FR3. FPGS4 catalyses the
polyglutamation of folates. SHMT5 aids in the conversion of 5-methyl THF to 5,10 methylene THF, MS6 also yields THF from the catalysis of homocysteine to methionine. THF can
aid in purine synthesis via GARFT7 and AICARFT8, yielding THF and thymidine synthesis via the action of TS9, yielding DHF and dTMP, the resultant DHF being recycled back to THF
via the action of DHFR10.

Development and Evaluation of Novel Monoclonal Antibodies to FR-α and FPGS
12
1.8. Folate Transport
The mechanisms by which folates are transported across cell membranes has been an area of
research interest for many years. The mechanisms of cellular transport in tumours have been well
studied and are commonly found to differ in tumours when compared with normal tissue.
Normal adult tissues have been found to exhibit two major cellular transport mechanisms, each
with a differential affinity for various oxidation states of folates and folyl coenzymes. These
transport systems can be distinguished by their preferences for folates as substrates, as well as by
differences in temperature and pH dependence (Lucock, 2000).
The folate transport systems may be divided into two separate categories; the membrane
channels or carriers which vectorialy transport the molecules, and the receptors, endocytic
vesicles which are internalised. Both bind folates and some antifolate chemotherapy agents with
high affinity and specificity (Brzczinsca, Winska, & Balinska, 2000). Although these methods are
distinct from one another and function independently, both systems appear to deliver folate to
the same intracellular compartment and their role in folate metabolism appear similar (Brzczinsca
et al., 2000). More recently, the ubiquitously expressed proton coupled folate transporter, a low
pH, carrier mediated mechanism of folate transport has also been identified. This mechanism was
initially thought to be related to that of the RFC but recent work has identified it as genetically
distinct from this mechanism. This transport mechanism may be an additional route of
folate/antifolate uptake relevant to cells at low pH (Qiu et al., 2006; Zhao & Goldman, 2007).
1.8.1. The Reduced Folate Carrier
The RFC is a member of the major facilitator superfamily of transport carriers and is a high
capacity bi-directional transporter for both natural folate compounds and antifolate
chemotherapeutics. It is similar in structural homology to the glucose transporter and possesses
thiol groups vital to its transport function. Transport via the RFC is temperature dependent,
sodium independent and is characterized by a neutral pH optimum (Brzczinsca et al., 2000).
A study by Whetstine et al (2002) characterised the RFC gene and found it to be ubiquitously
expressed in normal tissues. This is the major route of transport of folate into the cell (Whetstine,
Flatley, & Matherley, 2002). It is located on the plasma membrane and contains twelve
transmembrane domains with both the C and N terminal regions being located in the cytoplasm
(Figure 1-4). The transport kinetic properties of the RFC indicate a poor affinity for folic acid (Ki =

Development and Evaluation of Novel Monoclonal Antibodies to FR-α and FPGS
13
~200µM) for reduced folate cofactors and methotrexate (MTX) (Antony, 1996; Brzczinsca et al.,
2000; Henderson, 1990).
Folate metabolism is responsible for the conversion of homocysteine to methionine, important in
the biosynthesis of S-adenosylmethionine, a methyl donor. Subsequently this is responsible for the
methylation of CpG islands by DNA methyltransferases. If this biosynthetic pathway is impaired it
may lead to either hypo- or hypermethylation, this may in turn adversely affect expression of the
RFC (Odin et al., 2003).
Figure 1-4: Diagrammatic representation of the RFC. Note the twelve transmembrane domains which loop
between the inner and outer surfaces of the cell membrane, a large cytoplasmic loop inside the cell and cytoplasmic N
and C terminal regions (Sadlish, Williams, & Flintoff, 2002).
1.8.2. Folate Receptors (FR’s)
Folate receptors have been an intense area of research, particularly in the last decade due to their
unique pattern of distribution in normal tissues. The expression of folate receptors may have
become redundant due to the ubiquitous expression of the high capacity RFC, however, there are
a small number of normal tissues in which folate receptor expression is present. It is thought such
tissues may serve to acquire folates from biological fluids where the folate concentration is very
low (Elnakat & Ratnam, 2004). Much of the research aimed at folate receptors is concerned with

Development and Evaluation of Novel Monoclonal Antibodies to FR-α and FPGS
14
the use of folate receptors as target for cancer treatment including small molecules such as
antifolates or antibody therapies and the utility of folate receptors as a marker of prognosis or
companion diagnostic for subgroups of cancers with their expression.
Folate receptors are glycopolypeptides which are normally attached to the cell membrane via a
glycophosphatidylinositol (GPI) anchor. GPI anchored proteins are attached to the external surface
of the cell membrane by glycolipid moeties and are not directly accessible from the cytosolic face
of the membrane (Figure 1-5).
This feature makes the receptor inaccessible to circulating folates and antifolates. (Mayor &
Reizman, 2004). Also termed folate binding proteins (FBP), they bind a range of folyl coenzymes,
including folic acid and N5-methyl-THF with a high affinity (Ki = 0.09-0.24nM) (Antony, 1996;
Elnakat & Ratnam, 2004).
Figure 1-5: GPI anchor structure. General core structure consists of ethanolamine phosphate in an amide linkage
to the C-terminus of the protein, three mannose residues (orange), glucosamine (blue) and phosphatidylinositol
(purple) (Mayor & Reizman, 2004).
FR’s have a mass of approximately 38-40 kDa and are members of the FOLR gene family, consisting
of FOL1, FOL2 and FOL3 genes which encode the homologous isoforms FR-α, β and γ (Figure 1-6).
All isoforms share highly conserved sequences in approximately 75% of the gene but differ in the

Development and Evaluation of Novel Monoclonal Antibodies to FR-α and FPGS
15
5’ untranslated region. This may account for the difference in tissue expression and biochemical
properties observed between isoforms (Antony, 1992; Saiwaka, Price, Hance, Chen, & Elwood,
1995).
The two membrane associated forms of FR (α and β) are attached to the cell membrane surface
and are capable of transporting folate into the cell by carrier mediated endocytosis but the
majority of normal tissues virtually lack its expression (Elwood et al., 1997).
FR-β has been found to be expressed in placenta and haematopoetic cells but not in other tissues.
(Ratnam, Marquardt, Duhring, & Freisheim, 1989; Ross et al., 1999). Furthermore, FR-β found to
be expressed on the surface of haematopoetic progenitor and stem cells has not been found to be
functional for folate binding, indicating folate transport in such cells is also largely due to the RFC
(Reddy et al 1999).
A third member, FR γ, the product of the FOL3 gene is a secretory protein as it lacks the signal
required for the formation of a GPI anchorage site, it has been found primarily in normal
haematopoetic and leukaemic cells. As its levels are virtually undetectable in normal human serum
it may potentially be of use as a serum marker for lymphoid malignancies (Antony, Kane, Portillo,
Elwood, & Kolhouse, 1985). These isoforms have now been characterised from several species
(Antony, 1996).
More recently a fourth member, FR-δ has been identified through database mining although its
function and tissue expression has yet to be identified (Elnakat & Ratnam, 2004; Takimoto, 1997).
The chromosomal location of the FR genes, including FR-δ has been determined to be 11q13.3-
11q14 and the FR’s are thought to be structurally similar to riboflavin binding proteins. From
comparative cDNA sequences FR’s β and γ are closer in similarity than FR-α, indicating the gene
encoding FR-α was diverged earlier in evolution (Elnakat & Ratnam, 2004). As this project is
concerned with the generation of antibodies directed against FR-α, the RFC and other FR isoforms
will not be discussed further.

Development and Evaluation of Novel Monoclonal Antibodies to FR-α and FPGS
16
Figure 1-6: The organisation of human FR genes. The numbers are indicative of the exon lengths in base pairs. P
indicates the location of the promoter regions, adjacent to which are the Sp1 and ets binding sites which drive the
basal promoter activity (Elnakat & Ratnam, 2004).
There is no homology between the RFC and the membrane anchored FR proteins that would
suggest any structural or functional similarity between the carriers and, although their functional
role appears to be similar, their transport kinetics and affinity for folate differ significantly (Elnakat
& Ratnam, 2004).
Membrane-associated forms of the receptor are fully capable of transporting folate into the cell,
although the RFC is the primary folate uptake pathway utilized by normal cells (Elnakat & Ratnam,
2004). A number of theories exist as to the mechanism of folate uptake by FR’s.
The first reports indicated that FR’s are recycled via a mechanism termed potocytosis (Figure 1
-7). This mechanism was proposed from the observation that FR-α recycled between an
intracellular, acid resistant pool to an extracellular, acid-sensitive pool (Kamen, Wang, Streckfuss,
Peryea, & Anderson, 1988). FR’s are clustered on the cell membrane surface and have been
reported to be preferentially associated with uncoated vesicular structures known as caveolae
(membrane invaginations). These are characterised by the presence of caveolin – a marker
protein. Caveolin 1 binds to cholesterol and is thought to play an essential role in internalisation
and recycling of the FR, whereby the folate-bound receptor complex is internalised by the
caveolae. Increased acidification of the closed compartment would dissociate the folate from the
receptor and transport it into the cytosol with the energy generated from the acidic gradient. The
closed invagination in the cell membrane would then reopen to expose the receptors for the next

Development and Evaluation of Novel Monoclonal Antibodies to FR-α and FPGS
17
cycle (Rothberg, Ying, Kolhouse, Kamen, & Anderson, 1990). Subsequent studies have indicated
that the caveolar hypothesis may not be necessary for folate transport and have demonstrated
that GPI-anchored proteins are distributed diffusely across the surface of the cell membrane,
requiring cross-linking for subsequent clustering into caveolae. They also established that this was
not achieved by folate binding (Mayor, Rothberg, & Maxfield, 1994). Some studies, however still
argue that efficient delivery of folate into the cytosol is dependent upon caveolae (Ritter, Fajardo,
Matsue, Anderson, & Lacey, 1995).
Figure 1-7: Diagrammatic representation of the folate receptor potocytosis mechanism. The lowering of
intracellular pH releases the anionic folate from the carrier. This lowering is achieved by acidification via an H+ pump
which then causes the folate to dissociate from the receptor. It is then subsequently released from the vesicle into the
milieu of the cytosol. The FR is then recycled back up to the plasma membrane, this process has been reported to take
between 30 minutes and 5 hours (Kamen & Smith, 2004; Rothberg et al., 1990).
More recently the lipid-raft endocytosis theory has been proposed as an FR-α transport
mechanism. This involves membrane domains rich in lipids, GPI anchored proteins and signalling
proteins clustered into large platforms that are able to segregate various membrane components.
Lipid rafts are thought to regulate a number of different processes including lipid sorting, protein
trafficking, cell polarisation and signal transduction (Le Roy & Wrana, 2005; Simons & Ikonen,
1997). A number of studies have now indicated the role of this transport mechanism in FR
mediated folate uptake, describing the potocytosis mechanism to be more akin to the PCFT.
Recently, a number of proteins crucial to the cycling of FR’s have been identified and may provide
more information on functional regulation of FR’s, although the exact mechanism is still to be

Development and Evaluation of Novel Monoclonal Antibodies to FR-α and FPGS
18
elucidated (Elnakat et al., 2009; Le Roy & Wrana, 2005; Mayor, Sabharanjak, & Maxfield, 1998;
Sabharanjak & Mayor, 2004).
The proposed transport systems are present in normal tissue, although are largely restricted to
luminal surfaces and areas not directly accessible to the bloodstream. The mechanisms described
are relatively inefficient, low-capacity modes of folate transport utilised by normal cells, likely to
be due to their restricted expression. If FR’s are overexpressed in malignant cells, however, they
may be an additional relevant transport route of folate, antifolate and other folate targeted
therapies (Lucock, 2000; Theti & Jackman, 2004)
The accumulated folate in the cytoplasm is regulated once it is released from the receptor. Slowly
proliferating cells or folate depleted cells only take up folate until the cytoplasm has accumulated
physiological levels of the polyglutamates, after which the process is inhibited through FPGH
modulation, although the receptor remains functional and is not destroyed by the process
(Brzczinsca et al., 2000).
1.8.3. Folate Receptor Alpha Expression
The expression profiles of FR-α described by Weitman et al were obtained by
immunohistochemical analysis with the use of two murine monoclonal antibodies, mOV18 and
mOV19, which were generated against an ovarian tumour membrane preparation. The mOV18
antibody; developed as an ovarian cancer marker and the LK26 antibody, raised against a
choriocarcinoma cell line were both subsequently discovered to recognise FR-α, however for
immunohistochemical staining they only work in a limited fashion on freshly frozen tissue sections
and are unsuitable for use in other applications such as WB, or IHC analysis of paraffin embedded
tissue (Coney et al., 1991).
Although there are many limitations with the use of these antibodies they have still been used in
various studies to provide a large amount of information on the distribution of FR-α in normal and
malignant tissues. Results from the use of the mOV 18 and 19 antibodies and mRNA studies have
indicated that FR-α expression is limited to the epithelia of the choroid plexus, proximal kidney
tubules, fallopian tube, uterus, epididymis, acinar cells of the breast, thyroid and trophoblasts in
the placenta where they facilitate maternal to foetal transport of folate (Mangiarotti et al., 2001).
IHC analysis on frozen sections have also indicated expression in bronchial glands, alveolar
epithelium of lung, oesophagus, stomach, pancreas and thyroid with varying levels of expression
(Mantovani et al., 1994). Expression in proximal kidney tubules has been reported both in human

Development and Evaluation of Novel Monoclonal Antibodies to FR-α and FPGS
19
proximal tubule cell lines and in intact rat kidney used to follow both uptake and trafficking of
fluorescent conjugates of folic acid. These studies have indicated a role for FR-α in the salvage and
reabsorption of folates that have escaped into the urine. This study also contra-indicated the fate
of folate in neoplastic cells where cytosolic release of folates is readily observed (Reddy & Low,
1998), explaining the absence of toxicity of folate conjugates to the kidney (Morshed, Ross, &
McMartin, 1997, Sandoval, 2004). In the placenta, folates are proposed to play a role in the
accumulation of folates in the foetal circulation (Yasuda et al., 2008). In the CSF their role is
thought to be similar through their expression in the choroid plexus (Ramaekers & Blau, 2004;
Wollack et al., 2007).
Many studies have examined FR-α expression and ability to bind folate in malignant tissues by
various methods, including microarray analysis and radioligand binding assays. Much attention has
focused upon ovarian and endometrial cancers as these tumour types express FR-α most
consistently. Although the receptor has been found to be downregulated in mucinous
adenocarcinomas of the ovary, FR-α has been found to be consistently expressed in non-mucinous
adenocarcinomas of the ovary, uterine adenocarcinoma, testicular choriocarcinoma, ependymal
brain tumours and non functioning pituitary adenoma (Garin-Chesa et al., 1993; Ross, Chaudhuri,
& Ratnam, 1994; Weitman et al., 1992a, {Ross, 1994, Garin-Chesa, 1993). It has been reported to
be expressed in MPM and less frequently in breast, colon and renal carcinomas. As well as
identification of the presence of FR-α in such tumours, the ability to bind folate has also been
demonstrated (Elnakat & Ratnam, 2004).
Wu et al (1999) used a quantitative in situ hybridisation method to examine the expression levels
of mRNAs for FR-α in paraffin embedded tissue sections of a number of different ovarian, uterine
and cervical cancers. Different patterns of FR regulation were observed between the different
tissue types as well as in differentiation and malignancy. Differentiation of the germinal epithelium
into mucinous tumours was found to be associated with the down regulation of FR-α. However,
FR-α expression was found to be retained in malignant serous tumours of the ovary (Wu, Gunning,
& Ratnam, 1999).
Recently Yang et al (2007) found that FR-α mRNA is frequently overexpressed in osteosarcoma
samples via the use of the reverse transcriptase polymerase chain reaction (RT-PCR). 75% of the
tested samples (84/107) were found to contain detectable FR-α mRNA with 29.9% containing
higher levels than that of the control ovarian cancer cell line SKOV-3 (Yang et al., 2007).

Development and Evaluation of Novel Monoclonal Antibodies to FR-α and FPGS
20
1.8.4. Regulation of Folate Receptor Alpha Expression
In recent years, a number of transcriptional/post-transcriptional mechanisms have been studied as
potential contributors to the unique tissue specificity patterns of FR genes. The investigation of
such regulatory mechanisms could potentially be clinically advantageous as selective over
expression may enhance the efficacy of FR-targeted therapies and the relevance of FR-α as a
diagnostic marker.
Several studies have examined the effect of folate concentration on receptor expression and have
found that variations in the extracellular and hence intracellular folate concentration can
modulate FR-α expression in a variety of cells. In vitro data has consistently indicated that FR-α
protein was regulated by folate concentration in culture medium with cells grown in low folate
conditions having up to a 4 fold increase in FR-α expression compared to cells grown in standard
culture medium. This increase has also been shown to be reversed by the addition of folic acid or
reduced folate coenzymes to the medium (Kane et al., 1988; Kelemen, 2006). Modulation of FR-α
in this way may enhance tumour response to folate targeted therapies taken in by this route.
Reports that various steroid hormones may alter FR-α expression support the requirement for
further investigation. This type of regulation would be of value in folate receptor targeted
treatments as it is hypothesised that the major limitation of this type of treatment is the variability
of FR-α expression levels in tumours. Any means of specifically increasing FR-α expression would
be of great potential in enhancement of such therapies and in the enhancement of diagnostic
imaging. Concomitant use of both antioestrogens and antifolates in oestrogen expressing tumours
may also have a synergistic effect and potential clinical relevance.
Kelley et al (2003) reported that folate receptor levels are generally relatively low in oestrogen
receptor positive ovarian and cervical tumour cell lines and have hypothesized that FR-α
expression may be regulated by oestrogens. A negative correlation between FR-α expression levels
and oestrogen receptor status in primary breast cancers has been observed, suggesting FR-α may
be regulated via this nuclear receptor. The study reported transcriptional repression of FR-α by the
oestrogens and derepression by antioestrogens such as Tamoxifen (Kelley, Rowan, & Ratnam,
2003).
Similarly Tran et al (2005) reported enhancement of FR-α expression via the glucocorticoid
receptor (GR) agonist Dexamethosone which was inhibited by a GR antagonist. Treatment of HeLa
(cervical carcinoma) cells with dexamethasone resulted in a progressive increase in expression of
Development and Evaluation of Novel Monoclonal Antibodies to FR-α and FPGS
21
both FR-α mRNA detected by real-time PCR and FR-α protein detected by WB using FR-specific
rabbit antiserum. This enhancement was not, however observed in FR negative cells (Tran,
Shatnawi, Zheng, Kelley, & Ratnam, 2005).
Other studies identifying potential modulators of FR expression include retinoic acid dependent
upregulation of FR-α (Bolton, Wood, Kennedy, Don, & Mattick, 1999), variant hepatocyte nuclear
factor 1 activation of the FR-α P1 promoter (Tomassetti et al., 2003), caveolin downmodulation
relating to overexpression of FR-α (Bagnoli et al., 2000), ethanol related upregulation of FR’s
(Romanoff, Ross, & Mc Martin, 2007) and translational upregulation of FR’s via increased
intracellular homocysteine concentration (Antony et al., 2004).
1.8.5. Folate Receptor Alpha and Cancer
FR-α is the most widely studied folate receptor isoform and is also the most highly expressed,
although, as described previously its expression is largely restricted to the apical membrane of
polarised epithelial cells where it is not supplied with folate in the circulation. This is in contrast to
its constitutive expression in certain specific malignancies where it is accessible via the vascular
system.
FR-α protein has been characterised as a marker of ovarian carcinoma, as it is overexpressed in
more than 90% of non-mucinous ovarian carcinomas (Campbell, Jones, Foulkes, & Trowsdale,
1991). Its expression is usually absent on normal ovarian epithelial cells but appears to be stable in
ovarian cancers and has been shown to increase in its expression with disease progression
(Mangiarotti et al., 2001). As the expression of FR-α appears to be related to malignant
transformation, it is an active area of research, particularly as its expression in most normal cells is
restricted, which makes it an attractive candidate for novel, experimental tumour targeted
therapies.
Another interesting area of research is the role of FR-α in tumour progression. It has been found
that tumours with negative expression grow more slowly and that transfection of functional FRα
can cause cells to grow more rapidly. This may be due to the nanomolar concentrations at which
FR-α can take up folates, which may be too low for effective uptake via the RFC which takes up
folates in the micromolar range (Ebel et al., 2007).
Folate receptor targeted therapies currently being developed cover three broad categories; small
molecule therapies including the antifolate class of chemotherapeutics, immunotherapies via the

Development and Evaluation of Novel Monoclonal Antibodies to FR-α and FPGS
22
use of FR targeted antibodies and TS inhibitors and folate conjugates, including both therapeutic
agents and carriers. All such therapies require a disgnostic test in order to select for patients who
may potentially benefit from the therapy, particularly in the case of FR-α which is a key
determinant of response but its expression is limited.
As folate plays a major role in the growth and replication of normal cells, its components are
highly relevant targets for anticancer drug design. The effectiveness and cytotoxicity of these
drugs are thought to be due to their inhibition of both DNA and RNA synthesis. Antifolates
(antimetabolites), typically analogues of folates and TS inhibitors are the major classes of drug
relevant to folate receptor targeted therapies.
Natural folates and the classical antifolates are known to be taken up primarily via the RFC,
although FR-α is an additional route relevant to some antifolates, particularly when the
extracellular folate concentration is low (Theti & Jackman, 2004). The RFC is ubiquitously
expressed and is the major cause of patient intolerability to such drugs with a lower concentration
of drug reaching the tumour and causing toxicity in normal tissue. Antifolates specifically directed
to FR-α would therefore be extremely promising, as the targeted approach would potentially
deliver a higher concentration of drug to the tumour cells and result in lower toxicity to normal
tissue (Jackman, Theti, & Gibbs, 2004; Wang, Zhao, & Goldman, 2003).
Pemetrexed was developed in 1992 and is termed a multitargeted antifolate due to its ability to
inhibit the folate dependent enzymes TS, DHFR, GARFT and AICARFT (Exinger et al., 2003).
Pemetrexed has been found to have a high affinity for FR-α indicating this may be an additional,
relevant route of uptake into the cell which may overcome drug resistance often seen with
antifolates, although the primary route of uptake is via the RFC (Exinger et al., 2003; Wang et al.,
2003).
Other antifolates which have shown an affinity for FR-α are the TS inhibitors ZD9331 and
CB300638 and the GARFT inhibitor lometrexol, particularly CB300638 which is an FR-α targeted TS
inhibitor (Gibbs et al., 2005; Theti & Jackman, 2004). Such drugs may be of particular relevance to
tumours overexpressing FR-α and some have even been designed as such, given that RFC
mediated antifolate drug delivery and its associated toxicities are impossible to avoid with current
antifolates.

Development and Evaluation of Novel Monoclonal Antibodies to FR-α and FPGS
23
Two anti FR-α antibodies are currently being tested in clinical trials, the mOV18 antibody, which
has shown promise in phase I trials with complete remissions being observed in 5/15 patients,
with the remission being sustained in 1 patient almost 3 years post follow up and minimal side
effects (Crippa et al., 1994).
A humanised MAb, MORAb-003 (farletuzumab) has also been developed and has shown success in
both phase I and II clinical trials. It was originally derived from the LK26 antibody, also a human
anti- FR-α antibody suitable for use on frozen tissue and has been tested, both as a monotherapy
and in combination with chemotherapy with promising results (Armstrong, 2009; Ebel et al., 2007;
Konner et al., 2010).
Folate conjugation aims to exploit FR mediated endocytosis by delivering the conjugated agent
directly to the site of FR-α expressing tumours. A number of chemotherapeutic agents have been
conjugated to folate with promising results, various types of drug carrier have also been
conjugated to folates including liposomes, lipid nanoparticles and micelles. They have the
potential to increase the load of cytotoxic drug to the tumour site and may allow it to be retained
more readily than simple folate conjugates (Zhao, Li, & Lee, 2008).
Other relavant therapies currently being investigated are folate conjugated anti T-cell receptor
antibodies, which have previously been found to specifically target tumour cells for lysis,
suggesting these conjugates may have value as immunotherapeutic agents (Kranz, Partrick, Brigle,
Spinella, & Roy, 1995). Recently, dendritic cells transfected with FR-α mRNA have been used for
the treatment of relapsed metastatic ovarian cancer with promising results (Hernando et al.,
2007).
1.8.5.1. Selection of Patients for Folate Receptor Alpha Targeted Therapies
There are a number of methods of assessing FR-α expression such as IHC on frozen tissue
(Campbell et al., 1991) and imaging with folate conjugated radioisotopes (Zhao et al., 2008). It has
also been suggested a simple blood test may potentially allow for selection of suitable patients
due to the identification of functional soluble FR-α present in serum being higher in ovarian cancer
patients than healthy volunteers (Basal et al., 2009; Mantovani et al., 1994).
However, the standard and most routinely used method of detecting the level of expression of FR
in tumours would be measuring the levels on FFPE tumour samples collected by biopsies. An

Development and Evaluation of Novel Monoclonal Antibodies to FR-α and FPGS
24
antibody suitable for this use would therefore be extremely promising as a potential companion
disgnostic to all the therapies described.
1.9. Folylpolyglutamate Synthetase
FPGS catalyses the ATP dependent formation of an amide bond between the γ-carboxyl group of
naturally occurring folates and the amino group of glutamic acid. The enzyme has both cytosolic
and mitochondrial forms, differing only by the presence of a 42 residue amino terminal leader
peptide sequence in the mitochondrial form. Up to seven glutamate residues can be added to
monoglutamate compounds allowing them to be retained in the cell. This reaction occurs in both
natural folates and antifolates. This is essential for the survival of all proliferating mammalian cells
and it plays a central role in the action of antifolates, as polyglutamation increases both
intracellular drug concentration and affinity for subsequent enzymatic reactions (Freemantle,
Taylor, Krystal, & Moran, 1995; Odin et al., 2003).
The FPGS gene spans 12 kilobases in length and the protein itself is approximately 60kDa, the
cytosolic form differs from the mitochondrial form by a mass of 1 kDa. Both isoforms are derived
from the same gene and the leader sequence is thought to be required for tracking and
penetration into the mitochondria. Mitochondrial forms are thought to be involved in
mitochondrial C1 metabolism whereas cytosolic forms are required for establishment of normal
cytosolic folate pools (Chen et al., 1996; Sanghani, Sanghani, & Moran, 1999).
As the action suggests, FPGS is expressed in any cell undergoing sustained proliferation and is also
expressed in a number of differentiated tissues. Expression of FPGS activity is regulated by a
proliferation dependent mechanism by which rapidly dividing cells express higher enzymatic
activity than quiescent cells. Folate binding has also been shown to activate FPGS enzyme activity
(Barredo & Moran, 1992; Egan et al., 1995; Sun, Cross, Bognar, Baker, & Smith, 2001). In addition,
the folate binding domain of FPGS has been reported to be strikingly similar to that of DHFR (Sun,
Bognar, Baker, & Smith, 1998).
To date there is no known IHC data available on this particular protein, although mRNA gene
expression studies have been carried out. Often mRNA and protein levels do not correlate and
similarly a decrease in FPGS activity is not always associated with a decrease in FPGS mRNA,
indicating that alteration in FPGS expression may occur at the post-transcriptional level (Leclerec
et al 2001).

Development and Evaluation of Novel Monoclonal Antibodies to FR-α and FPGS
25
FPGS mRNA transcript levels have been found to be high in various tumours, in particular B-
lineage leukaemias. High levels of expression have also been observed in normal gut, bone
marrow stem cells, liver and kidney. In the same study human heart and skeletal muscle were
found to express very high levels of FPGS specific mRNA. Human brain and, surprisingly, placental
tissue were found to have a low level of FPGS message. This enzyme, however, has not been found
to be appreciably expressed in other normal adult tissues (Freemantle & Moran, 1997). These
findings agree with a study carried out in 2001 by Leclerec et al, who also found high FPGS mRNA
expression levels in human skeletal muscle, heart, liver and kidney (Leclerec & Barredo, 2001).
A study by Odin et al (2003) found gene expression levels of FPGS to be significantly higher in
colorectal tumour biopsies compared with normal adjacent mucosa. They concluded that the level
of expression is also an independent prognostic marker, as patients with low levels of FPGS had
shorter tumour specific survival than patients with a high level. They suggested the low level may
indicate a folate deficient state that could increase aggressiveness of the tumour (Odin et al.,
2003).
Modulation of FPGS in order to increase sensitivity to antifolates is an interesting area of research,
although few studies have investigated this. Sohn et al (2004) investigated FPGS modulation on
chemosensitivity to 5-FU and MTX in colon cancer cells transfected with sense/antisense FPGS
cDNA. They found FPGS overexpressing cells to confer growth advantage over those cells treated
with antisense cDNA and significant increase in sensitivity to 5-FU. No difference in
chemosensitivity was observed with MTX (Sohn et al., 2004). Further studies in this area using
different cell lines and antifolates would be interesting.
As FPGS is paramount in catalysing the activation of antifolate compounds, specific anti-FPGS
monoclonal antibodies suitable for use on formalin fixed and paraffin embedded samples may
enable us to predict the degree of response tumours may have to such drugs, enabling more
informed decisions to be made with regard to the choice of treatment and identification of those
patients most likely to respond to antifolate chemotherapy. In addition it would greatly aid in
clarification of FPGS expression profiles which, to date have largely relied on mRNA data which is
not always representative of the protein expression levels in the same tissue (Leclerec et al 2001).

Development and Evaluation of Novel Monoclonal Antibodies to FR-α and FPGS
26
1.10. Summary
The folate pathway components FR-α and FPGS are highly relevant targets, particularly in ovarian
cancer and other tumour types with high expression. The dual role of FR-α as both a promising
target for cancer therapy and its association with poor prognosis makes it particularly interesting.
Cancer therapies currently being developed aim to offer the ‘magic bullet approach’ to cancer
therapy, targeting the tumour and minimizing toxicity to normal tissues. A number of therapies
are currently preclinical and clinical trials. Potential modulators of FR-α expression have also been
identified and have the potential to upregulate expression of FR-α in tumour cells, enhancing the
efficiacy of folate targeted therapies. A number of methods are currently being developed to
determine the expression of FR-α in tumours, which would aid in the selection of patients who
may benefit from FR targeted therapies. Antibodies directed against FR-α and FPGS, suitable for
use on FFPE tumour samples would greatly assist with this highly relevant area of research and
allow suitable patients to be selected routinely and with ease in hospital pathology labs without
the need for complex detection methods. It is thus a major aim of this project to generate
antibodies suitable for this application.

Development and Evaluation of Novel Monoclonal Antibodies to FR-α and FPGS
27
1.11. Research Plan
Year 1:
Stage 1: Select regions from FR-α and FPGS protein sequences and amplify via PCR from cDNA
prepared from mRNA derived from cell lines, clone the product into a T-vector. Sequence fidelity
would then be assessed via automated DNA sequencing from Lark Technologies. The insert would
then be subcloned into both pET21b and pET41b expression plasmids. pET41b plasmids have been
shown to increase the solubility of proteins due to the presence of a GST tag, this tag is also highly
immunogenic and may aid in stimulating the mouse immune response later in the project. Initial
subcloning would be performed using NovaBlue E.coli, this host lacks T7 polymerase, and this step
reduces plasmid instability. The plasmid would then be transformed into the inducible T7+
lysogenic expression host BL21plysS or Tuner strain. Purification of the resultant recombinant
protein will be achieved via his-bind chromatography.
Stage 2: Laboratory female BalbC mice would be immunised with the antigens prepared in stage 1.
Responding animals would be sacrificed after an immunisation schedule and the primed B-cells
from the spleen would be fused with NS-1 myeloma cells to establish specific hybridomas. The
specific reactivity of the secreted antiodbodies will be assessed via ELISA, IHC and Western
blotting.
Year 2: Evaluation of antibodies for immunohistochemistry on paraffin and frozen tumour
samples, Western blotting and ELISA; Epitope mapping of selected antibodies; Analysis of FR-α and
FPGS expression in tumour biopsy samples, including a large archival collection of ovarian tumour
samples in tissue microarray form and correlation of expression with clinical and histopathological
data, including oestrogen receptor expression, and prognostic significance for response and
survival in univariate and multivariate analysis.
Year 3: In vitro cell studies on breast and ovarian tumour cell lines to test for the ability to
modulate the expression of FR-α by oestrogen and anti-oestrogen treatment and the consequence
for response to folate receptor targeted therapies. Assessment of antibodies for application in
other techniques such as IF and FACS. Evaluation of any neutralizing properties the antibodies may
possess. Preparation of thesis.

Development and Evaluation of Novel Monoclonal Antibodies to FR-α and FPGS
28
Chapter Two

Development and Evaluation of Novel Monoclonal Antibodies to FR-α and FPGS
29
Chapter Two
2. Antigen Design and Preparation
2.1. General Introduction
Prokaryotic host expression systems have been used widely in molecular biology to produce
recombinant proteins for a wide range of different applications. One such application is the
immunisation of animals for monoclonal antibody production.
Both monoclonal and polyclonal antibodies have important clinical applications in the detection,
diagnosis and treatment of cancers. They are also important tools for the study of protein
expression in both normal and tumour tissues. Antibodies can be directed against a wide range of
different antigens such as recombinant proteins (soluble or refolded), synthetic peptides, nucleic
acids and carbohydrates.
The generation of a suitable recombinant protein or synthetic peptide which can be used for the
induction of an immune response in laboratory animals is the first step in antibody production.
Both prokaryotic (bacterial) (Rosenberg et al., 1987; Studier & Moffatt, 1986) and eukaryotic
expression systems (Luckow & Summers, 1988) may be utilized to produce a suitable antigen.
2.2. Recombinant Protein Expression Systems
Prokaryotic expression systems are commonly used for the production of recombinant eukaryotic
proteins and have several advantages, including the ease of cell culture, inducible protein
expression, rapid cell growth and subsequent protein expression, ability to express large regions of
the protein of interest and high protein yield. It offers advantage over more complex eukaryotic
systems when required for antigen generation and subsequent immunisation for antibody
production. Prokaryotic hosts lack complex post-translational modification processes which can
often lead to masking of linear epitopes (Baneyx, 1999). This may be of particular value when
attempting to generate antibodies suitable for both IHC and WB analysis. The fusion proteins
produced via this method can be purified by affinity chromatography and the antigens produced
are often successful. If the protein produced is insoluble, simple methods are available to
solubilise and refold the protein, although this may pose a problem if the protein produced is
required for functional or enzymatic studies, as recovery of functional proteins from insoluble
Development and Evaluation of Novel Monoclonal Antibodies to FR-α and FPGS
30
inclusion bodies is not always possible (Singh & Panda, 2005). The pET prokaryotic expression
systems using E.coli as a host were selected for use in this project in order to generate
recombinant FR-α and FPGS for subsequent immunisation, which will be discussed in more detail
in the following chapter.
Eukaryotic expression systems include protein expression via yeast, mammalian and insect cells.
The advantage of eukaryotic expression systems are the high levels of protein expression and ease
of purification. Some systems even secrete the protein into the media, allowing for continuous
expression of a protein without lysing the cells. As eukaryotic proteins are being produced by
eukaryotic cells there are no problems associated with incorrect protein folding and the post
translational modifications remain intact. These are important for functional protein studies and
the analysis of protein-protein interactions. The major disadvantage of eukaryotic expression is
the slow rate of protein production as eukaryotic cells do not grow as rapidly as prokaryotic cells
(Mattanovich, Gasser, Hohenblum, & Sauer, 2004).
Synthesis of peptides is another method of generating an antigen for immunisation and is
particularly useful when a unique sequence is required from proteins with high sequence
homology They are also useful where a particular epitope target is required for antibody
production such as an antibody directed against a phosphorylated region of a protein. The
disadvantages of peptides are their instability and lack of immunogenicity. They often have to be
conjugated to larger compounds, decreasing the likelihood of an immune response to the peptide
target. They are also more difficult to use as screening antigens in later stages of antibody
production, as peptides are more likely to degrade. It often requires many attempts to generate
an antibody to a peptide, so it is also potentially time consuming. In our experience this has not
been found to be as successful as generation of antibodies to recombinant protein antigens. For
this reason the recombinant protein method was used in preference to generation of a peptide
target.
2.2.1. The pET Expression System
The pET expression vector system is one of the most commonly used E.coli expression systems, it
is used for subcloning regions of cDNA and subsequent expression of corresponding recombinant
protein regions in E.coli host strains (Rosenberg et al., 1987; Studier & Moffatt, 1986). The pET
system relies on high level inducible expression from the bacteriophage T7 promoter in specialised

Development and Evaluation of Novel Monoclonal Antibodies to FR-α and FPGS
31
bacterial hosts in which the production of T7 RNA polymerase is under the control of an inducible
lac promoter (Figure 2-1). The system also allows convenient tagging of proteins with 6 histidine
motifs to facilitate purification of proteins by immobilised nickel ion chromatography and the
production of fusion proteins tagged with sequences that often enhance solubility of the target
protein. The pET expression system is of particular value when expression of large protein target
regions and high levels of recombinant protein are required.
Target DNA is subcloned into pET plasmids, once cloned they are under the control of the
bacteriophage T7 promoter which controls the transcription and expression of the protein.
Expression can therefore be induced by transformation into an E.coli host carrying a T7 RNA
polymerase gene. Initially the plasmid is transformed into a non-expression host such as
Novablue, which does not contain the T7 RNA polymerase gene. This step reduces plasmid
instability caused by potentially toxic protein production in the host and increases the yield of
recombinant plasmid. After this step the plasmid is then transferred into an expression host
containing a copy of the T7 RNA polymerase gene (Figure 2-2).

Development and Evaluation of Novel Monoclonal Antibodies to FR-α and FPGS
32
Figure 2-1: The control elements of the pET system. A recombinant plasmid is transferred to E.coli containing a copy of the gene encoding T7 RNA polymerase. These hosts
are also lysogens of bacteriophage DE3, a lambda derivative containing the LacI gene, lac UV5 promoter and the T7 RNA polymerase gene. Once the DE3 lysogen is formed, the
only promoter able to direct the transcription of the T7 RNA polymerase gene is the UV5 promoter, inducible by IPTG. Addition of IPTG induces production of T7 RNA polymerase,
transcribing target DNA in the plasmid (Novagen Catalogue).

Development and Evaluation of Novel Monoclonal Antibodies to FR-α and FPGS
33
Figure 2-2: Overview of the recombinant protein production methods used for the generation of recombinant FR-α and FPGS. Suitable target sequences were selected
using bioinformatics tools to ensure targets were unique, primers were designed and synthesised and DNA was created from mRNA via RTPCR and PCR. The DNA was cloned into a
non expression vector and propagated in a non-expression host then subcloned into a pET expression vector and expressed in an E.coli expression host. Resultant proteins were
purified and stored in preparation for immunisation.
Development and Evaluation of Novel Monoclonal Antibodies to FR-α and FPGS
34
2.3. Aims and Objectives
The aim of this part of the project was to generate suitable recombinant FR-α and FPGS proteins
which could subsequently be used as immunogens for the production of anti FR-α and FPGS
antibodies. The schedule in this part of the project was as follows:
Identify the known coding sequences for both proteins and perform homology searches,
selecting target sequences based on the information.
Design and generate suitable FR-α and FPGS primers for amplification of cDNA prepared
from cell lines known to express the proteins and to prepare the insert for cloning.
Use pGEM T vectors to clone the insert and check sequence fidelity via automated
sequencing.
Excise the fragment from the T-vector and subclone into pET21b and 41b expression
plasmids.
Expand and purify the pET-fragment constructs in a non expression strain of E.coli and
transform into a suitable expression host to express his-tagged recombinant FR-α and
FPGS.
Purify the resultant recombinant protein via his-bind (nickel affinity) column
chromatography.
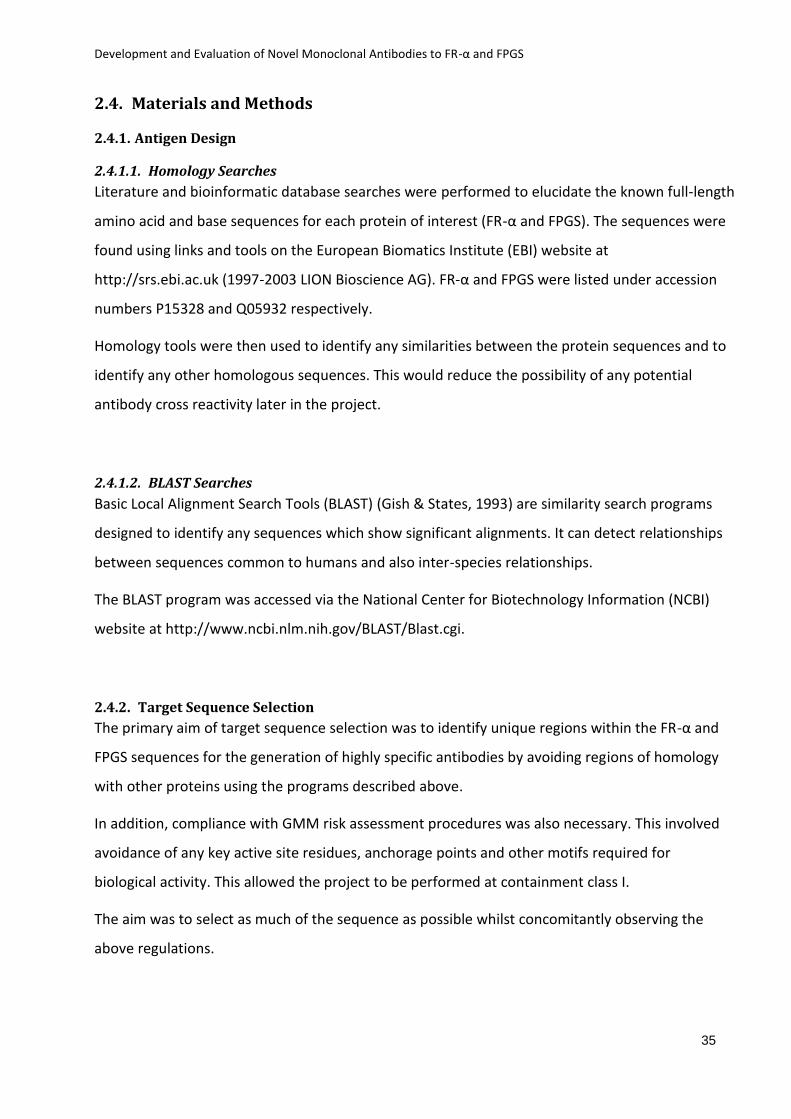
Development and Evaluation of Novel Monoclonal Antibodies to FR-α and FPGS
35
2.4. Materials and Methods
2.4.1. Antigen Design
2.4.1.1. Homology Searches
Literature and bioinformatic database searches were performed to elucidate the known full-length
amino acid and base sequences for each protein of interest (FR-α and FPGS). The sequences were
found using links and tools on the European Biomatics Institute (EBI) website at
http://srs.ebi.ac.uk (1997-2003 LION Bioscience AG). FR-α and FPGS were listed under accession
numbers P15328 and Q05932 respectively.
Homology tools were then used to identify any similarities between the protein sequences and to
identify any other homologous sequences. This would reduce the possibility of any potential
antibody cross reactivity later in the project.
2.4.1.2. BLAST Searches
Basic Local Alignment Search Tools (BLAST) (Gish & States, 1993) are similarity search programs
designed to identify any sequences which show significant alignments. It can detect relationships
between sequences common to humans and also inter-species relationships.
The BLAST program was accessed via the National Center for Biotechnology Information (NCBI)
website at http://www.ncbi.nlm.nih.gov/BLAST/Blast.cgi.
2.4.2. Target Sequence Selection
The primary aim of target sequence selection was to identify unique regions within the FR-α and
FPGS sequences for the generation of highly specific antibodies by avoiding regions of homology
with other proteins using the programs described above.
In addition, compliance with GMM risk assessment procedures was also necessary. This involved
avoidance of any key active site residues, anchorage points and other motifs required for
biological activity. This allowed the project to be performed at containment class I.
The aim was to select as much of the sequence as possible whilst concomitantly observing the
above regulations.

Development and Evaluation of Novel Monoclonal Antibodies to FR-α and FPGS
36
2.4.3. Restriction Mapping
Restriction maps for each cDNA protein coding region were also obtained in order to determine
the positions of all restriction sites throughout both the FR-α and FPGS sequences. This was
performed in order to enable appropriate selection of restriction sites to engineer into the
terminals of the forward and reverse primers which would be used to amplify the regions selected,
use of a restriction site already present in the target sequence would result in truncation of the
protein and thus were avoided. The restriction maps were obtained from Harvard education at
http://pga.mgh.harvard.edu/cgi-bin/map.cgi. The maps obtained also provided information on
unique restriction sites and restriction sites not found within the protein sequence. This assisted in
selection of appropriate restriction sites.
2.4.4. Oligonucleotide Primer Design
Complementary primers were designed, E.coli codon usage was considered at this stage as
translation may be impaired if the codon usage is found to be low, which may result in failure of
subsequent steps. Rectification of this may involve alteration of a limited number of bases or
movement of primers to avoid unfavourable codon usage. The primers were designed to base pair
with mRNA sequences derived from cell lines known to express the protein, flanking the regions of
interest. Information on the protein expression in various cell lines was found from the National
Cancer Institute website at http://dtp.nci.nih.gov/mtweb/.
Restriction sites were engineered into the 5’ end of each forward and reverse primer to allow for
subcloning into the polycloning site of pET expression vectors.
As well as addition of restriction sites the primers had to be designed to ensure the proteins would
be translated in the correct reading frame, engineering an extra base into the primer sequence is
often required to ensure this occurs. A guanine residue was also engineered into the 5’ end of the
restriction site as they are the most efficient residues for acquiring non-template derived adenine
residues which Taq polymerase commonly adds to the sequence during transcription. This is of
significance as initial cloning involved placement of the fragment into a T-vector which will be
discussed in detail in section 2.4.11.
GC rich areas of the sequence were also avoided if at all possible as they often cause problems
with self complementation in PCR.

Development and Evaluation of Novel Monoclonal Antibodies to FR-α and FPGS
37
The melting temperatures (Tm) of each forward and reverse primer pair were also calculated to
ensure they were similar, to ensure both primers would anneal under the selected conditions.
Figure 2-3: Primer Tm calculation. Approximate Tm values were estimated according to the following general rule:
4o (G+C) + 2o (A+T) = Tm
2.4.5. Oligonucleotide Primer Synthesis
Primers were synthesised using an automated synthesiser, (Applied Biosystems) the method used
to add each base was the phosphoramidite method (Caruthers 1987). Prior to each synthesis the
machine was prepared according to the manufacturers instructions and various visual safety
checks performed. The resultant primer solutions were removed from the machine in glass vials
containing ammonium hydroxide. The solution was transferred into plastic screw cap 1.6ml
microfuge tubes, sealed and incubated at 56oC overnight to remove protective groups. The
primers were then placed at -20oC for 15 minutes to reduce the volatile state of ammonia. 400µl
primer solution was removed and treated with 40µl Sodium acetate (NaAc, 2M, pH 4.0-4.8) to
remove the ammonium hydroxide. 1.2ml 100% ethanol was then added and the DNA precipitated
for 15 minutes at -80oC, then centrifuged (Eppendorf 5702, 10 minutes, 14000 RPM) to pellet the
DNA. The supernatant was removed and the pellet washed in 100µl 70% ethanol, spun down again
and dried in a 65oC hot block. Once dry the pellet was resuspended in 150µl RNase free water
treated with 0.1% DEPC.
2.4.5.1. Oligonucleotide Primer Quantitation
Primer concentrations were calculated using an automated calculator. 10µl primer was added to
990µl dH2O to make a 1/100 dilution and placed in a cuvette. The machine was blanked according
to the manufacturer’s instructions and the absorbance at 260nm measured (Genequant II
DNA/RNA Calculator, Pharmacia Biotech). The primer concentration was given in pmol/μl (μmol/l).
For each primer solution measured, a stock solution of 7.5μM was prepared and stored at -20oC.

Development and Evaluation of Novel Monoclonal Antibodies to FR-α and FPGS
38
2.4.6. RNA Preparation
The human ovarian carcinoma cell lines SKOV-3 and IGROV-1 were selected for RNA extraction as,
from the NCBI data, they were found to have high levels of both FR-α and FPGS mRNA. The cells,
which grew as a monolayer, were maintained in appropriate culture medium: RPMI 1640 (Sigma,
UK), 10% foetal bovine serum (Sigma, UK) and 2mM L-glutamine (Sigma, UK) with 5% CO2 in a 37oC
incubator. Cells were harvested at approximately 75% confluence (~107 cells) via the use of
trypsin-EDTA (Sigma, UK), washed three times in phosphate buffered saline (PBS) and pelleted via
centrifugation (Eppendorf 5702, 2000 RPM, 6 mins). The pellet was resuspended in 200µl PBS and
stored at -20oC prior to RNA extraction. mRNA was extracted from both cell lines using an RNA
preparation kit (RNeasy, Qiagen) and extraction of total RNA was carried out according to the
manufacturer’s instructions. The quality of the RNA was assessed by agarose gel electrophoresis
(see 2.4.9) and spectrophotometry.
2.4.7. Complementary DNA Preparation/RT-PCR
Reverse transcription of mRNA is necessary as eukaryotic genes cannot be translated directly by
bacterial cells due to the presence of introns. Eukaryotic organisms have the ability to remove
non-coding introns after transcription via enzymatic splicing. As bacteria lack these necessary
enzymes, they are unable to translate eukaryotic genes in their native form. Amplification of DNA
segments can be performed by obtaining spliced mRNA transcripts from the eukaryotic cytoplasm
and converting it back to a DNA copy lacking introns. This is achieved using the enzyme reverse
transcriptase (RT), also known as RNA dependent DNA polymerase. The resultant complementary
DNA (cDNA) template can then be used for the polymerase chain reaction.
cDNA was prepared from SKOV-3 and IGROV-1 mRNA by RT-PCR. 0.5ml microcentrifuge tubes
were assembled containing the following components:

Development and Evaluation of Novel Monoclonal Antibodies to FR-α and FPGS
39
Table 2-1: RT-PCR Components
Reagent Volume (μl)
RNA (1-2µg) 3
Reverse Primer (7.5µM) 4
MgCl2 ( 25mM Fermentas) 4
Dimethyl Sulphoxide (DMSO) (Sigma) 1
10x RT Buffer (100mM Tris pH 8.3, 0.5µM KCl, 15mM MgCl2, 0.1% gelatine, 20mM
DTT) (Promega)
2
RNase free H2O 3
RNasin (10U/µl, Promega) 0.5
dNTP’s (10mM, Promega) 2
Reverse Transcriptase (20U/µl, Promega) 0.6
The mixture was overlaid with 40μl mineral oil to avoid evaporation and pulse spun to ensure
mixing of the components. Reverse transcription was performed in a mini thermal cycler (MS
Research Mini-Cycler), this machine was programmed for chain extension at 42oC for 30 minutes,
enzyme denaturation at 95oC for 5 minutes and a 4oC cooling temperature, left for a minimum of
15 minutes. The cDNA was stored at -20oC until required.
2.4.8. The Polymerase Chain Reaction (PCR)
PCR is an enzyme based technique used to amplify a segment of DNA which lies between two
regions of a known base sequence. The cDNA produced via RT-PCR is denatured via heating in the
presence of two oligonucleotide primers engineered to anneal to the 5’ and 3’ ends of the
sequence of interest and a pool of the four dNTP’s. The mixture is then cooled to allow the
primers to anneal and amplification is achieved via the action of Taq DNA polymerase. This cyclic
mechanism of heat denaturation, annealing and amplification can be repeated many times (Figure
2-4). Taq polymerase can be added to the PCR mixture before heat denaturation, it can also be
added once the annealing temperature is achieved; this is known as a ‘hot start’. Taq polymerase
is purified from the thermophilic bacterium Thermus Aquaticus which resides in hot springs in
temperatures above 100oC. Its DNA polymerase is thermostable and is not affected by the heat
denaturation step, it is for this reason it is commonly used in PCR reactions.

Development and Evaluation of Novel Monoclonal Antibodies to FR-α and FPGS
40
Figure 2-4: Steps involved in PCR reactions. DNA is denatured to separate the double stranded helical structure
(step 1), annealing is then achieved by addition of Taq polymerase to the mixture of primers and a pool of dNTP’s and
cooled (step 2); amplification/ synthesis (step 3) is achieved via a cyclic mechanism of heat denaturation, annealing
and amplification which may be repeated many times (Britannica encyclopaedia 1998).
PCR was performed according to the method of Mullis et al. A sterile 0.5ml centrifuge tube was
used in the PCR reactions, 10μl of cDNA from both the SKOV-3 and IGROV-1 RT reactions were
added to the tube along with various other reaction components used to hybridise to the cDNA
and prime elongation (Mullis et al., 1986).
Table 2-2: PCR Mixture Components
Reagent Vol (μl)
cDNA from RT Reaction 10
Forward Primer (7.5 μm) 2
MgCl2 (25 mM, Fermentas) 2
Dimethyl Sulphoxide (DMSO) (Sigma) 4
10x RT Buffer(100mM Tris pH 8.3, 0.5µM KCl, 15mM MgCl2, 0.1% gelatine, 20mM
DTT) (Promega)
4
RNase free H2O 27.5
Taq Polymerase (1u/μl, Fermentas) 0.5

Development and Evaluation of Novel Monoclonal Antibodies to FR-α and FPGS
41
Again the mixture was overlaid with mineral oil to avoid evaporation and pulse spun to ensure all
reagents were mixed. PCR was performed in a thermal mini-cycler via a programmed reaction.
(MS Research Mini-Cycler)
The following program was used in the PCR reaction.
Table 2-3: Standard Conditions used in PCR reactions.
Step Temperature Time Reason
1 95oC 1 minute Denaturation of cDNA
2 55oC 1 minute Primer annealing
3 72oC 1 minute DNA synthesis
4 95oC 30 seconds Denaturation
5 55oC 30 seconds Primer re-annealing
6 72oC 1 minute DNA synthesis Repeat steps 4-6 30 times
7 72oC 10 minutes Pick up A’s for T- vector, complete synthesis
8 4oC Overnight
The resultant PCR product was held at 4oC and stored at -20oC. A 7μl sample of both PCR products
was analysed by agarose gel electrophoresis to observe the result of the reactions.
2.4.9. Agarose Gel Electrophoresis
Agarose gel electrophoresis is used to separate DNA molecules on the basis of their size and is
commonly used following PCR reactions to assess the success of the amplification, concentration
and size of the PCR product generated. The resolution is dependent upon the concentration of
agarose, the buffering system used, mass charge ratio and relative electrophoretic mobility of the
fragments when an electric current is applied to the gel.
2.4.9.1. Preparation of DNA Size Markers
A stock solution of DNA markers were prepared by addition of 20μl loading buffer (0.35% Orange
G, 30% glycerol, 10mM EDTA) and 40μl dH2O to 10μl of a 123 base pair ladder (Sigma, UK).
Markers were stored at -20oC until required. 6μl was loaded on to each gel. 7μl PCR reaction
mixture was added to 3μl loading buffer and loaded on to the gel.

Development and Evaluation of Novel Monoclonal Antibodies to FR-α and FPGS
42
2.4.9.2. Agarose and Running Buffer Preparation
1.7% agarose gels were used for separation and detection of PCR fragments. Gels were prepared
by melting 1.7g agarose powder (Helena Biosciences) in 100mls Tris-Boric acid-EDTA buffer (TBE
buffer; 0.09M Tris-Borate, 0.002M EDTA, pH 7.4). The solution was allowed to cool to 56oC before
addition of 1μl ethidium bromide (EtBr) (125μg/ml, Sigma).
The gel was poured into a gel casting tray with a comb to form wells for sample loading. Once set
the gel was submerged in an electrophoresis tank containing TBE buffer, the samples and markers
were loaded and the gel electrophoresed for approximately 20 minutes at 120 volts.
The DNA was visualised by staining with EtBr which, was added to both the gel running buffer and
agarose, EtBr is a DNA intercalating agent and binds to DNA between the bases of the double
helix. The labelled DNA can then subsequently be visualised via the use of an ultraviolet light
transillumanator (UV-dual intensity transilluminator, UVP Ltd. UK) as EtBr has fluorescent
properties under these conditions.
2.4.10. Gel Extraction/ Fragment Preparation
PCR products were excised from agarose gels via the use of a scalpel and purified using a column
based method using a QIA quick spin gel extraction kit (Qiagen). Protocols were followed
according to the manufacturers instructions.
Once eluted the purified samples were analysed by gel electrophoresis to observe the purity and
yield of the fragment and then stored at -20oC until required.
2.4.11. Preparation of pGEM T-easy plasmid construct
Use of cloning vectors is a convenient way to facilitate insertion of PCR fragments into pET
expression vectors. Adenine residues are commonly added to PCR products by Taq polymerase.
For this reason T-vectors (Promega pGEM, T Easy), plasmids containing a thymidine residue at
each end of the cloning site are first used to carry the fragment of interest. They are prepared by
cutting Promegas pGEM -5zf vector with EcoRV and adding 3’ terminal thymidine residues to both
ends, this overhanging thymidine base binds more easily to the adenine tail on the PCR product. In
addition to this pGEM T Easy vectors also possess the β lactamase enzyme gene which causes
bacterial ampicillin resistance, allowing for selection of E.coli which contain the plasmid only.
Furthermore the T7 and SP6 RNA polymerase promoters flank the polycloning site which is within

Development and Evaluation of Novel Monoclonal Antibodies to FR-α and FPGS
43
the α peptide coding region of the LacZ gene for β galactosidase. Bacterial colonies utilise this
enzyme to metabolise galactose into lactose and glucose (Figure 2-5). Insertional inactivation of
this gene allows selection of recombinants via blue/white screening.
The advantage of cloning into a T-vector before cloning into a pET expression vector is the ease
with which the fragment can be cloned via AT cloning. An alternative strategy would be to digest
the PCR product with restriction enzymes and to clone directly into appropriately digested pET
vectors. However, pET vectors have low copy numbers and it is difficult to produce a DNA
miniprep of sufficient quantity/quality for DNA sequencing. Cloning the PCR products into the
higher copy-number pGEM T-easy plasmids is the preferred method as it facilitates the sequencing
of the amplified DNA from a single miniprep. Universal M13 sequencing primers will anneal to the
sites flanking the polycloning site of the pGEM T-easy vector, further facilitating sequencing.
Figure 2-5: T-Easy Vector Map. Note the polycloning site, containing a number of different restriction sites within
the LacZ gene used in blue-white selection. This plasmid also contains the gene for ampicillin resistance (Novagen
catalogue).
2.4.12. pGEM T-Vector Ligations
T-vector ligations were carried out in 1.6ml microfuge tubes.
To the tube the following components were added;

Development and Evaluation of Novel Monoclonal Antibodies to FR-α and FPGS
44
Table 2-4: Reagents used in T-vector ligations.
Reagent Volume (µl)
Vector (Promega pGEM 50ng/µl) 1
Insert (Fragment Preparation) 1 or 2 depending upon yield
10x Ligation buffer (400 mM Tris-HCl pH 7.8, 100 mM MgCl2, 100 mM DTT, 5 mM
ATP) (Fermentas)
1
RNase free dH2O Vol to make total vol = 10µl
T4 DNA Ligase (Fermentas 1000u/µl) 1
Samples were overlaid with mineral oil and ligations incubated overnight at 16oC. Samples were
stored at -20oC until required.
2.5. Protein Expression
2.5.1. Preparation of Growth Media
2.5.1.1. 2YT Media
16g Tryptone Difco (Becton Dickinson), 10g yeast extract (Becton Dickinson) and 5g sodium
chloride (BDH) were dissolved in 1 litre of distilled water. The media was aliquoted into 200ml
bottles and sterilised by autoclaving before use.
2.5.1.2. 2YT Agar
3g Bacto-agar (Becton Dickinson) was added to a 200ml aliquot of 2YT media. The 2YT agar was
then melted and sterilized via boiling, then allowed to cool.
2.5.2. Overnight E.coli cultures
Novablue stock cultures are routinely grown in the biological safety laboratory on tetracycline
plates. Bacterial cell culture was performed in biological safety cabinets employing aseptic
techniques. 20ml universals containing 5ml 2YT and 10µl tetracycline (15mg/ml, Kramel Biotech)
were inoculated with a single colony (1µl) stock Novablue E.coli and grown overnight at 37oC in an
orbital incubator.

Development and Evaluation of Novel Monoclonal Antibodies to FR-α and FPGS
45
2.5.3. Novablue E.coli Non-Expression Host
Novablue E.coli is a K-12 bacterial cloning strain commonly used in general purpose bacterial
cloning. It has high plasmid transformation efficiency and gives a high yield of good quality plasmid
DNA from standard minipreps. Wild type E.coli strains possess the LacZ gene encoding the α and β
subunits of β galactosidase. As described earlier, this enzyme breaks down galactose, it is also able
to break down a chromogenic analogue of galactose; X-gal (5-bromo-4-chloro-3-indolyl-B-D-
galactoside). When this compound is metabolised it yields a blue compound. Bacterial colonies
with an intact LacZ gene therefore appear blue in media supplemented with X-gal (Figure 2-6).
Novablue E.coli are modified to lack the genes encoding the α-subunit if this protein and thus
cannot synthesize functional β-galactosidase. pGEM vectors carry the gene encoding the α-
subunit, creating an intact gene in Novablue E.coli containing the plasmid, these cells are able to
synthesize functional β-galactosidase. These cells are therefore able to form blue colonies on X-gal
supplemented agar plates. The LacZ gene in the pGEM vector has been engineered to contain a
polycloning site within the gene encoding the α-subunit of β-galactosidase. If the plasmid
contained an insert the LacZ gene would fail to function correctly. It would be unable to
metabolise X-gal to the blue product and the colonies would remain white (Figure 2-6). This allows
identification of E.coli with a plasmid containing an insert from E.coli containing the plasmid which
has recircularised without an insert. Only a very small proportion of host cells actually take up
plasmid DNA. In addition, Novablue E.coli possess tetracycline resistance properties, this in
combination with the ampicillin resistance gene carried by the plasmid allow for continual
selection and reduce the frequency of false positive white colonies.
Figure 2-6: Photograph of blue-white selection plate. White colonies indicate the plasmid contains an insert as
the colonies are unable to metabolise X-gal. Blue colonies retain this ability and metabolise X-gal, appearing blue.

Development and Evaluation of Novel Monoclonal Antibodies to FR-α and FPGS
46
2.5.4. Competent E.coli Preparation
Transformation of plasmids into E.coli is achieved by inducing a transient competent state into the
host cells, this state enables them to take up exogenous DNA.
A centrifuge tube containing 50ml pre warmed 2YT medium containing 100µl tetracycline
(15mg/ml) was inoculated with 500µl overnight culture (see previous section), The culture was
incubated at 37oC in an orbital incubator and continually monitored until an optical density (OD) of
0.4 at 550nm was achieved (WPA CO210 Digital Colorimeter). At this point the cells are in mid-log
phase and are growing exponentially. The centrifuge tube containing the culture was stored on ice
for 20 minutes to halt cell growth. The cells were then centrifuged at 4oC for 10 minutes at 3000
RPM (MS Falcon C1300). The supernatant was discarded and and the cells resuspended in 8mls
pre-chilled transformation buffer (TFB) (3.73g KCl, 4.4g MnCl2, 0.735g CaCl2, 0.4g hexamine cobalt
chloride, 5ml 1M 2-[N-morpholino] ethanesulfonic acid (MES) pH 6.3, made up to 500ml with
distilled water). The cells were then centrifuged again at 4oC for 10 minutes at 3000 RPM. The
supernatant was discarded and the cells resuspended in 2mls TFB and 70µl DMF (Sigma) was
added. This mixture was stored on ice for 5 minutes after which 70µl 2.25M dithiothreitol (DTT)
was added and incubated for a further 10 minutes on ice. Finally a further 70µl DMF was added
and the cells incubated on ice for a minimum of 1 hour before use. After this time the cells were
competent and ready for transformation.
2.5.5. Transformation of pGEM T Easy Constructs into Novablue E.coli
A 10µl volume of ligation mix was added to 200µl competent Novablue E.coli and incubated on ice
for 45 minutes. The cells were then heat shocked at 42oC for 90 seconds in a water bath, they
were then transferred to ice for 2 minutes. After the addition of 800µl 2YT to each sample the cells
were incubated at 37oC for 1 hour in a dry hot block. The cells were centrifuged for 3 minutes at
2000 RPM (Microfuge, Beckman Coulter), sufficient supernatant was discarded to leave 100µl
residual volume. The pellet was resuspended in this small volume and spread over the surface of a
TAXI selection plate. The plates were allowed to dry and were then inverted and incubated
overnight at 37oC.

Development and Evaluation of Novel Monoclonal Antibodies to FR-α and FPGS
47
2.5.6. Selection Plates
TAXI plates are used for blue/white selection of transformants, they also contain antibiotics for
screening out non transformants.
T = Tetracycline
A = Ampicillin
X = X-Gal
I = IPTG
Preparation of TAXI plates 2YT agar was prepared as described in section 2.5.1, a 200ml volume
was melted and cooled to approximately 56oC before addition of 400µl tetracycline (15mg/ml),
400µl ampicillin (25mg/ml, Sigma), 1ml X-gal (2%) and 80µl 1M IPTG (isopropylthiogalactoside, Q-
Biogene). The agar was then mixed and poured into approximately 12 petri plates and allowed to
cool in a biological safety cabinet. Plates were stored inverted at 4oC until required.
2.5.7. Colony Screening Procedure and Plasmid Isolation
2.5.7.1. Plasmid Minipreparations
12 white colonies were picked from each TAXI selection plate used for transformation and used to
prepare 5ml overnight cultures (5mls 2YT, 10µl Tetracycline, 10µl Ampicillin). The cultures were
incubated overnight at 37oC in an orbital incubator. 12 colonies were selected as blue-white
selection is not always specific and false positives may occur.
Plasmid DNA was isolated via the use of a Qiagen QIAprepR Miniprep kit. First 1.5ml of each
overnight culture was transferred into a micro-centrifuge tube and centrifuged for 3 minutes at
13000 RPM. The supernatant was discarded and protocols were then followed according to the
manufacturers instructions. The principle of the method is based upon alkaline lysis of the
bacterial cells, adsorption of plasmid DNA on to silica in the presence of high salt then washing
and elution of plasmid DNA. Minipreps were stored at -20oC until required.
2.5.8. Restriction Digestion of Plasmid DNA
Bacterial restriction endonucleases (RE’s) are commonly used to both prepare and recover DNA
fragments by ‘cutting’ DNA at specific sequences. (Smith, 1979) The sequences recognised by RE’s

Development and Evaluation of Novel Monoclonal Antibodies to FR-α and FPGS
48
are commonly 4-6 bases in length and are highly specific to each particular RE. The nomenclature
applied to RE’s uses abbreviations, with the first letter being derived from the genus name and the
second two letters from the species name. Additional letters and/or numbers are added for
identification of the specific enzyme (Smith & Nathans, 1973). Cleavage of the DNA strands can
give rise to either ‘blunt’ ends where both strands terminate in a base pair or ‘sticky’ ends
(cohesive termini) where cleavage is staggered and results in an overhang of unpaired nucleotides
(Figure 2-7). The RE’s used in this project were used to excise the fragments of interest from the T-
vector in order to confirm the presence of the DNA insert, the RE’s used also produced sticky ends
in order for them to be able to form bonds with the complementary region on the plasmid in
subsequent steps.
Figure 2-7: Common RE’s generating both blunt and sticky ends. AluI and HaeIII (top) generate blunt ends,
BamHI, HindIII and EcoRI (bottom) generate sticky ends.
In both instances double digests were performed to liberate the cloned insert from the plasmid
DNA as both sequences were engineered with different RE sites on their forward and reverse
primers. FR-α contained SacI and XhoI restriction sites and FPGS contained BamHI and HindIII
restriction sites named RE1 and RE2 as described in Table 2.5. Engineering two different RE sites in
to the primers allows for directional cloning so the insert is in its desired orientation. The double
digestion mixture was prepared as described below. The mixture was then incubated in a dry hot
block at 37oC for 30 minutes. 7µl of each digest was added to 3µl loading buffer and resolved via

Development and Evaluation of Novel Monoclonal Antibodies to FR-α and FPGS
49
1.7% agarose gel electrophoresis using 123 bp markers as a reference, 2 combs were placed in
each agarose gel.
Table 2-5: Reagents used for restriction digests.
Reagent Volume (µl)
Miniprep 5
10X Buffer (Appropriate colour)
(Red - FPGS 10mM Tris-HCl pH8.5, 10mM MgCl2, 100mM KCl, 0.1 mg/ml BSA.
Yellow –FR-α 33mM Tris-Acetate pH 7.9, 10mM Mg Acetate, 66mM Potassium
acetate, 0.1 mg/ml BSA)
1
RE1 (10U/µl) 0.5
RE2 (10U/µl) 0.5
H2O 3
2.5.9. Automated DNA Sequencing
The previous step allowed confirmation of the presence of the insert, a second step was also
added in order to confirm the identity of the insert. The sequences of the inserts were fully
characterised via automated dye-terminator DNA sequencing using the universal M13 forward and
reverse primers. This was used to ensure the complete target sequence had been cloned into the
pGEM vector. 20µl samples of miniprep DNA were sent to Lark Technologies (Essex, UK) for
sequencing.
2.5.10. Expression of FR-α and FPGS Recombinant Proteins
2.5.10.1. Subcloning in to pET Expression Vectors
A wide variety of pET vectors are now available for use with E.coli host expression systems for
protein production. Production of proteins via the use of both simple pET expression vectors and
vectors containing water soluble tags were used. Use of vectors containing tags encoding water
soluble protein sequences such as glutathione s-transferase (GST) and thioredoxin (Tx) assist with
solubility of potentially insoluble proteins.

Development and Evaluation of Novel Monoclonal Antibodies to FR-α and FPGS
50
pET 21 was selected as it is a relatively simple vector, it is an expression vector under the control
of T7 RNA polymerase. It contains ampicillin resistance, a polycloning site for cloning the insert
and a C-terminal His-tag, used for purification (Figure 2-8). The protein produced from this type of
vector is favoured in mouse immunisation schedules as it does not contain any ‘tag’ (with the
exception of the His-tag), this allows for easier screening in hybridoma technology stages, which
will be discussed in more detail in the following chapter. However, experience in this lab has
shown that proteins produced in such vectors are not always easy to purify, particularly with
insoluble proteins which may also be cysteine rich. As they do not contain a large tag, the protein
does not always appear to be immunogenic to the animal, particularly if small regions were
targeted. Short, untagged sequences are often degraded to nothing in E.coli cells and are
undetectable via SDS PAGE. For this reason both pET 21, 41 and 32 vectors were selected for
generation of recombinant proteins as all targets were small and relatively cysteine rich. Water
soluble tags may aid in the solubility and improve immunogenicity of short sequences as they
potentially contain motifs which may solicit the help of T-cells.

Development and Evaluation of Novel Monoclonal Antibodies to FR-α and FPGS
51
Figure 2-8: pET 21 Vector map (Novagen catalogue).

Development and Evaluation of Novel Monoclonal Antibodies to FR-α and FPGS
52
pET 41 vectors were selected as an adjunct to the pET 21 vector. pET41 vectors possess all the
features of the pET 21 system, although kanamycin resistance replaces ampicillin resistance. In
addition it has a GST fusion tag, this has been reported to enhance the production and solubility of
the fusion protein produced. As the proteins we intended to produce were likely to be insoluble
this was deemed a suitable vector to use. The GST tag may also stimulate the mouse immune
system due to the large size of the tag. This has inherent advantages and disadvantages as it may
increase the affinity of the antibody due to a stronger immune response but may also decrease
the number of antibodies being produced to the protein as they may recognise the GST construct
in addition to the protein. In addition pET32 vectors were also used, they are similar to pET41 but
contain a thioredoxin (TX) tag in place of the GST tag and possess ampicillin resistance.

Development and Evaluation of Novel Monoclonal Antibodies to FR-α and FPGS
53
Figure 2-9: pET 41 Vector map (Novagen catalogue)

Development and Evaluation of Novel Monoclonal Antibodies to FR-α and FPGS
54
Figure 2-10: pET32 Vector map (Novagen catalogue)

Development and Evaluation of Novel Monoclonal Antibodies to FR-α and FPGS
55
2.5.10.2. Preparation of the Insert for Subcloning
Double restriction digests via the use of the same RE’s detailed in section 2.5.8 were performed in
order to excise the inserts from the pGEM plasmids using the following reagents.
Table 2-6: Reagents used for restriction digestion in preparation for subcloning
Reagent Volume (µl)
Miniprep (4μg) 20
10X Buffer (Appropriate colour) 3
RE1 (10U/μl) 1
RE2 (10U/μl) 1
H2O Volume to make total = 30
The mixture was incubated at 37oC for 1 hour and samples were analysed via 1.7% agarose gel
electrophoresis. The whole sample was added to 6µl loading buffer. Following electrophoresis the
band was extracted from the gel and a fragment preparation made using the Qiagen kit as
previously described.
2.5.10.3. Preparation of pET vectors
The pET vectors used were prepared by digestion of the neat vector with the appropriate
restriction enzymes in order to produce the appropriate sticky ends required for cloning of the FR-
α and FPGS fragments.
Table 2-7: Reagents used for pET vector digestion
Reagent Volume (µl)
Neat Vector (pET21, 41 or 32) 2
RE1 (10U/μl) 1
RE2 (10U/μl) 1
10X Buffer (appropriate colour) 2
H2O Volume to make total = 20
Vectors were incubated for one hour then treated with 2µl calf intestine alkaline phosphatase
(CIAP, Promega 1U/µl) to remove 5’ phosphate groups and prevent the vector recircularising. A
clean up kit (Novagen) was then used to remove all traces of reagents and other contaminants,

Development and Evaluation of Novel Monoclonal Antibodies to FR-α and FPGS
56
following this the entire sample was run on an agarose gel and a fragment preparation performed,
vectors were stored at -20oC until required.
2.5.10.4. Ligation of DNA fragments into pET constructs
Ligations were performed in a similar way to that of pGEM ligations. In both cases the vectors used
were already prepared and needed no preparation before the ligations were performed.
Table 2-8: Reagents used for ligations
Reagent Volume (µl)
dH2O 6
Fragment Prep 1
pET 21/41 1
10 X Ligase buffer (Fermentas, 400mM Tris-HCl, 100mM MgCl2, 100mM DTT,
5mM ATP pH7.8)
1
T4 DNA Ligase (Fermentas, 1U/µl) 1
The samples were overlaid with oil to prevent evaporation and incubated at 16oC overnight.
Overnight Novablue cultures were also prepared as previously described.
2.5.10.5. Transformation into Novablue E.coli
The pET constructs were first transformed into the non-expression host Novablue. Novablue cells
were prepared and transformed as described previously for pGEM transformations. Selection of
transformants was made following overnight incubation at 37oC on 2YT agar plates. pET 21 and 32
colonies were grown on agar containing ampicillin (50µg/ml) and pET41 colonies grown on agar
containing kanamycin (30µg/ml).
2.5.10.6. Screening Transformant Colonies
As blue-white selection is not present at this stage, all colonies appear white. 12 colonies from
each plate were selected and grown overnight in 5ml broth cultures with the appropriate
antibiotic. The plasmid DNA was subsequently purified from 1.5ml aliquots of each culture using
the standard Qiagen minipreparation protocol described previously.

Development and Evaluation of Novel Monoclonal Antibodies to FR-α and FPGS
57
The plasmid DNA was again double restriction digested as described previously and the
electrophoretic mobility compared with 123 base pair markers assessed using 1.7% agarose gel
electrophoresis. This allowed differentiation between plasmid – insert constructs from empty
vectors which had lost the insert. Orientation of the insert was not performed due to the presence
of different restriction sites at either end of the insert.
2.5.11. Transformation into an Expression Host
2.5.11.1. E.coli BL21 (DE3) plysS and Tuner (DE3) plysS
Both the above E.coli strains are λDE3 lysogens that carry a chromosomal copy of the T7 RNA
polymerase gene under the control of the lacUV5 promoter. The addition of isopropyl β-D-1-
thiogalactopyranoside (IPTG) brings about production of a T7 RNA polymerase which can then
transcribe genes cloned downstream of the T7 lac promoter in pET plasmids. Both strains possess
the pLysS plasmid, which carries a chloramphenicol resistance gene and encodes the gene for T7
lysozyme. T7 lysozyme inhibits T7 RNA polymerase and the plasmid produces enough of this
enzyme to inhibit the basal (pre-induction) level of T7 RNA polymerase. This prevents ‘leaky’
expression of the target gene. This enzyme also aids cell lysis following protein expression.
Furthermore E.coli Tuner strains are lacZY deletion mutants of BL21, the lacY (lac permease)
mutation causes the IPTG to enter the cells uniformly. This produces a homogenous,
concentration dependent induction and has been found to be effective in increasing the solubility
of previously insoluble proteins. This is due to the IPTG entering more slowly, allowing protein
production to proceed at a slower rate, lowering the possibility of recombinant proteins being
segregated into insoluble inclusion bodies. These features make these strains of E.coli particularly
suited to large scale protein expression.
2.5.11.2. Transformation into E.coli BL21/Tuner
Both BL21 and Tuner are routinely cultured in 2YT media. Competent cells were prepared and
transformed as previously described for the Novablue E.coli. 1µl of each plasmid miniprep was
added to 100µl competent cells and transformed. Following transformation recombinants were
selected for by culture on plates containing ampicillin for pET 21 constructs and kanamycin for pET
41 constructs. Transformant colonies were selected for small and large scale protein production.

Development and Evaluation of Novel Monoclonal Antibodies to FR-α and FPGS
58
2.5.12. Fusion Protein Expression
2.5.12.1. Small Scale Fusion Protein Induction
Colonies were picked from the transformation plates and cultured at 37oC in an orbital incubator
in 5mls 2-YT media with the appropriate antibiotic (50µg/ml). The absorbance at 550nm was
monitored until it reached 0.4 (mid-log phase). At this point a 1ml sample was removed and
incubated at 37oC, this was used as the pre-induction sample, a 10µl sample was also removed to
provide an overnight culture for large scale induction. To the remainder of the culture 10µl 1M
IPTG was added and incubated for 3 hours at 37oC. Following induction 1ml samples were taken
and centrifuged, along with the uninduced sample (13000 RPM, 3 minutes). The cell pellets from
both the pre and post induction cultures were resuspended in 150µl SDS Laemmli sample buffer
(40% dH2O, 5% 2-mercaptoethanol, 2%SDS, 20% glycerol, 25% Tris 250mM pH 6.8, 0.1%
bromophenol blue).
2.5.13. SDS Polyacrylamide Gel Electrophoresis
The pre and post induction samples in SDS Buffer were boiled in a water bath to denature the
proteins and 10µl added to each well, they were resolved electrophoretically via the use of 12%
polyacrylamide gels. The gels were stained with Coomassie blue, the molecular weight of the
induced protein was confirmed in relation to standard molecular weight markers. Once successful
induction was confirmed, large scale protein induction could be carried out.
SDS PAGE was carried out via the use of a Bio-Rad Mini-Protean casting unit, which was assembled
according to the manufacturers instructions. The gel consisted of a lower 12% resolving gel and an
upper 4% stacking gel. The stacking gel allows concentration of the loaded sample and improves
resolution on entry into the lower gel. The 12% resolving gel was prepared as follows; 3mls 30%
acrylamide mix, 1.85ml dH2O, 5mls 750mM Tris pH 8.8, 50μl 20%SDS. The solution was stored at
4oC. When required, 100µl 10% w/v ammonium persulfate (APS), and 10µl N,N,’,N’-
tetramethylethylenediamine (1% v/v) (TEMED, Sigma) was added and poured between the glass
plates of the casting gel, 2cm beneath the top of the glass. It was then overlaid with water to
ensure there was an even meniscus. Once polymerised the water was decanted and the stacking
gel was added. (1ml 30% acrylamide mix, 3.89mls dH2O, 5mls 125mM Tris pH 6.8) 50µl APS and
5µl TEMED were added to activate and the stacking gel loaded on top of the resolving gel. The
comb was then placed in between the glass plates, ensuring no air was trapped between the
plates, and the gel was allowed to polymerise. Once polymerised, the comb was removed and the

Development and Evaluation of Novel Monoclonal Antibodies to FR-α and FPGS
59
wells washed with distilled water to remove any unpolymerised acrylamide. The gels were then
placed in the electrophoresis tank and the reservoirs filled with Tris-glycine electrophoresis buffer
(25mM Tris pH 8.3, 192mM glycine, 0,1% SDS).
The samples were added along with 6µl markers (Bio-Rad Precision plus dual colour protein
standards) and electrophoresed for approximately 30 minutes at 240 volts or until the dye front
had reached the bottom of the gel. After completion gels were removed from the glass plates and
the stacking gel excised and discarded. Gels were then either stained for visualisation of the
protein bands or transferred to nitrocellulose filters for Western blots.
The gels were stained with Coomassie blue and fixed with methanol and glacial acetic acid. This
was achieved by immersion of the gel in a solution containing 0.25% (w/v) Coomassie blue, 40%
methanol and 10% glacial acetic acid for a minimum of 1 hour at room temperature with gentle
agitation. The gels were then destained with a destain solution containing 40% methanol and 10%
glacial acetic acid to remove excess background staining. The bands were visible and were
compared with known molecular weight protein standards. The gels were photographed then
discarded.
2.5.13.1. Large Scale Fusion Protein Induction
The purpose of large scale induction is to produce a larger quantity of recombinant protein for
immunisation. The 10µl sample taken from the small scale induction was grown in a 5ml overnight
culture with the appropriate antibiotic (50µg/ml). The next day this was added to 500µl pre-
warmed 2-YT media with 1ml appropriate antibiotic (50µg/ml). The culture was incubated for
approximately 3 hours at 37oC in an orbital incubator until an OD of 0.4 at 550nm was reached.
The flasks were then induced with 500µl 1M IPTG and incubated for a further 3 hours. The
cultures were then harvested and separated from the culture medium via centrifugation.
(3000RPM, 40 minutes) The supernatant was discarded and the pelleted cells resuspended in
10mls 1X His-bind buffer (5mM imidazole, 500mM NaCl, 20mM Tris-HCl pH 7.9). The suspension
was transferred into a 25ml universal and a few granules of lysozyme (Sigma) were added to aid in
disruption of the bacterial cell membranes. The universals were stored at -20oC overnight or until
required for processing.

Development and Evaluation of Novel Monoclonal Antibodies to FR-α and FPGS
60
2.5.14. Sonication of Large Scale Products
After overnight storage the bacterial cell walls were disrupted by first thawing the mixture then
sonicating (MSE Soniprep 150 Sonicator). The cells were sonicated 12 times for 1 minute each time
with 1 minute intervals on an amplitude setting of 12 microns. The lysate was then centrifuged in
polycarbonate centrifuge tubes at 4oC for 20 minutes at 27,000G. The supernatant (containing the
soluble fraction) was decanted into a fresh universal and filtered (0.45µM filters) in preparation
for column chromatography, this method was employed initially as immunisation with soluble
proteins has in the past been more successful in obtaining high quality antibodies, which may be
due to the protein being more immunologically active. The insoluble fraction (pellet) was
resuspended in 10mls His-Bind Buffer containing 8M urea (5mM imidazole, 500mM NaCl, 20mM
Tris-HCl pH 7.9, 8M Urea). This was placed on a roller in an attempt to solubilise the pellet.
2.5.15. His-Bind Column Chromatography
2.5.15.1. Soluble Columns
Fusion proteins are designed and consideration is given to purification of the protein at the design
stage. The strategy commonly employed to facilitate this purification is to fuse the target gene to a
sequence capable of selectively recognising a matrix bound ligand. In this case pET 21, 41 and 32
were selected as they encode a hexahistidine tag. This is then translated via the use of E.coli to
form 6 consecutive histidine residues
This type of chomatography is dependent upon the hexahistidine tag present on the recombinant
protein binding to nickel ions on a column. During purification the His-tag sequence binds to
divalent cations (Ni2+) immobilised on agarose His-bind metal chelation resin (Novagen). The
unbound proteins are washed away and the protein of interest is eluted using an imidazole elution
buffer.
5mls of an even suspension of His-Bind resin (Novagen) were added to a 5ml polypropylene
column. The resin was left to settle by gravity and once the storage buffer (20% ethanol) had
washed away, the column was washed with 10mls deionised water and charged with 10mls charge
buffer (5mM NiSO4). Binding of nickel to the resin was observed via the change of column colour
from white to blue. The free nickel was washed away and the column equilibrated with 10mls
binding buffer (5mM imidazole, 500mM NaCl, 20mM Tris-HCl pH 7.9). The column was allowed to
run until all the solution had reached the top of the column before adding the next solution,

Development and Evaluation of Novel Monoclonal Antibodies to FR-α and FPGS
61
continuous flow was ensured and it was never allowed to run dry. At this stage the protein
fraction was added, either the soluble fraction or solubilised pellet (refolded by dialysis - see
section 2.5.17) was allowed to flow through, followed by a further 10 mls His-Bind buffer. The
column was the washed with 10mls wash buffer (60mM imidazole, 500mM NaCl, 20mM Tris-HCl
pH 7.9). The bound protein was then eluted with 10ml elute buffer (1M imidazole, 500 mM NaCl,
20 mM Tris-HCl pH 7.9). 0.5ml fractions were collected in 1.5ml microcentrifuge tubes, 12 in total
were collected for quality and quantitative analysis. After use the nickel was removed from the
column by adding 10mls 200mM EDTA and then washing with deionised water. As the columns
could be used more than once, they were stored in the fridge until required.
2.5.15.2. Insoluble Columns
The same method as the above method was employed when running an insoluble column, the
insoluble fraction was centrifuged (15 mins 27,000 G) and the supernatant decanted and filtered
via the use of a 0.45 µM filter. His-bind buffer was added to reduce the molar concentration of the
protein solution from 8M to 6M. Following this the protocol was followed as above, however all
solutions used contained 6M urea in addition to the other components.
2.5.15.3. Protein Assay
The concentration of the eluted protein fractions was determined via the use of a Bradford
protein microassay. 10µl samples from each fraction were added to 790µl dH2O and 200µl
Bradford dye reagent concentrate (BioRad) compared with a blank containing 200µl Bradford
reagent and 800µl dH2O, the OD was measured at 590nm at room temperature. The total protein
concentration in each fraction was determined by comparison with a standard curve of BSA
standard controls.
10µl samples were taken from fractions containing significant concentrations of protein (more
than 0.4mg/ml) and were mixed with an equal volume of SDS sample buffer and analysed via SDS-
PAGE to determine the molecular weight and purity of the protein.
After this had been confirmed the protein fractions with the highest concentration of protein were
pooled together and re-assayed to determine the total protein fraction concentration. A freeze
thaw test was performed on a small sample of the protein and re assayed to ensure the protein

Development and Evaluation of Novel Monoclonal Antibodies to FR-α and FPGS
62
was suitable for freezing down. Once confirmed the proteins were split into 200µg aliquots and
stored at -80oC until required.
2.5.16. Refolding of Insoluble Protein Fractions
It is common for proteins overexpressed in E.coli host strains to be insoluble and to be segregated
into insoluble inclusion bodies within the cell. In order to recover immunologically active protein,
the inclusion bodies need to be solubilised refolded and purified.
The pellet was solubilised in binding buffer with 8M urea and left on a roller for at least 24 hours
or longer if necessary. As the pellet was solubilised under denaturing conditions (urea) the
denaturing agent was then be gradually removed to allow the protein to refold and gain its
antigenicity, this step was vital as the immunisation of mice relies upon the protein being
recognised by the murine immune system and mice cannot be injected with urea. Refolding was
achieved via either successive dialysis, (performed after running the insoluble fraction on an
insoluble column) reducing the molarity of the denaturant gradually whilst keeping the
constituents of the dialysis buffer constant or via refolding of the insoluble protein and reducing
the denaturant concentration whilst bound to the column.
2.5.17. Refolding by Dialysis
12cm lengths of 5-24/32 visking tubing (Medicell International) were cut and rinsed in distilled
water to separate the two layers. Medi clips were used to secure the end of the tubing and the
insoluble fraction added to the tubing. Another clip was used to secure the end once filled with
the protein. 500mls of a 4M urea 10mM Tris-HCl solution (pH 8.0) was prepared and the dialysis
tubing was placed in the solution, which was left for 3 hours at room temperature with constant
magnetic stirring. Buffer changes were performed, halving the molar concentration of urea each
time from 4M, 2M, 1M, 0.5M, 0.25M, 0.125M, 60mM, and 30mM, after which the dialysed protein
was washed twice in a 10mM Tris-HCl solution. Once dialysis was completed the protein was
recovered from the tubing and the solution was then Bradford assayed to determine the
concentration of protein present and frozen down if necessary.

Development and Evaluation of Novel Monoclonal Antibodies to FR-α and FPGS
63
2.5.18. Refold Columns
Another method employed to reduce the urea concentration and attempt to isolate the protein
was by use of a refold column. The same procedure applied to insoluble columns was followed
with a number of additional steps. After loading of His-Bind buffer, the insoluble fraction was
added to the column followed by an additional 10mls His-Bind buffer + 6M urea. A further 10mls
His-Bind buffer + 4M urea were added to the column, after which 10mls His-Bind buffer and 2M
urea were added. Finally, 10mls His-Bind buffer, wash buffer and elution buffer, all without urea
were added successively to the column and the fractions collected as normal.
2.6. Results - Antigen Design
2.6.1. Amino Acid and Gene Sequences
Links on the EMBL-EBI website located FR-α and FPGS base and amino acid sequences, which were
listed under accession numbers P15328 (257 amino acids, 29819 Da) and Q05932 (587 amino
acids, 65609 Da) respectively. FPGS was found to have both a mitochondrial and cytosolic from,
differing only in the presence of a leader peptide sequence in the mitochondrial form, responsible
for tracking and penetration into mitochondria.
BLAST searches revealed no significant homology between the sequences, or similarity to any
other human sequences for either FR-α or FPGS.
2.6.2. Target Sequence Selection
One target region for FR-α was selected and two targets for FPGS (Figure 2-11 and Figure 2-12).
The lengths of each sequence were 189 amino acids on FR-α and 228 and 167 amino acids on FPGS
targets 1 and 2 respectively, the target sequences were selected in accordance with GMM risk
assessments described in section 2.4.2. The sequences on FR-α avoided a serine residue (S-234),
known to be involved in the formation of a GPI anchor to the cell membrane, this ensured the
recombinant protein would be unable to bind lipid membranes. It is well documented that
sequences with a high number of cysteine residues are incorrectly folded when expressed in E.coli,
due to disulphide bond scrambling. As the region we were intending to clone contained 13
cysteine residues we predicted the recombinant form of the protein would be safe.
Although FPGS is also cysteine rich, its active soluble form has been produced in E.coli . Therefore
the same risk assessment could not be used for this protein. The sequences selected on FPGS

Development and Evaluation of Novel Monoclonal Antibodies to FR-α and FPGS
64
avoided three key active site residues located at the C-terminal domain and the ATP binding site,
which is critical to enzyme function as it catalyses the conversion of folates to polyglutamate
derivatives. These measures ensured the recombinant protein would be inactive.
Figure 2-11: FR-α target region. 189 amino acid FR-α target region selected (purple), note avoidance of n-terminal
signalling sequence (black) and serine 234 (red).
Figure 2-12: FPGS target region. Two FPGS target sequences selected (purple) - one 228 amino acid region
denoted FPGS2 (left) and one 167 amino acid region denoted FPGS3 (right), note the avoidance of the ATP binding site
and three key active site residues (red).
2.6.3. Primer Design
Primers were designed, considering the E.coli codon usage and restriction sites were added to the
ends of the primers. SacI (GAGCTC) and XhoI (CTCGAG) were selected as the restriction sites to be
added to FR-α forward and reverse primers. BamHI (GGATCC) and HindIII (AAGCTT) were selected
for both targets on the FPGS primers respectively (Table 2-9).
SacI, XhoI and HindIII restriction enzyme sites were selected as they were not present in the target
sequence, BamHI was present in the FPGS sequence but primers were designed to begin after this
site for ease with cloning, for this reason the targets on FPGS were termed FPGS2 and FPGS3 as
FPGS1 was the initial design planned to begin before the BamHI site (Table 2-9). The primers were
synthesized, concentrations calculated and 7.5µm solutions made.

Development and Evaluation of Novel Monoclonal Antibodies to FR-α and FPGS
65
RNA preparations were made for RT-PCR, the ovarian tumour cell lines SKOV-3 and IGROV-1 were
used for this purpose.
Table 2-9: FR-α and FPGS forward and reverse primers.
Primer Sequence
FR-αF 5’GGAGCTCTGAAAAGCCAGGCCCGGAGGACAAGT3’
FR-αR 5’GCTCGAGCATGGCTGCAGCATAGAACCTCGC3’
FPGS2 F 5’GGGATCCGCCTGAGCTCTTCACCAAG3’
FPGS2R 5’GAACCTTCAGGTACCAGGTACCAGGTGAAGGGGCCC3’
FPGS3F 5’ GGGATCCGGCGGCCCTGCTGAAGCT3’
FPGS3R 5’ GAAGCTTCTGGGACAGTGCGGGCTCCAG3’
2.6.4. Amplification of FPGS2 and FR-α DNA
RT-PCR was carried out to produce both FR-α and FPGS2 cDNA, initially using the mRNA extracted
from the ovarian tumour cell line SKOV-3. Both FPGS and FR-α cDNA was then amplified via PCR
using both forward primers and the product fractionated and visualised via agarose gel
electrophoresis. In both cases a fluorescent band of DNA was observed between the 492 and 615
bp marker for FR-α and between the 615 and 738bp marker for FPGS (Figure 2-1), these correlated
with the approximate sizes of 567 and 684 bases respectively.

Development and Evaluation of Novel Monoclonal Antibodies to FR-α and FPGS
66
Figure 2-13: FR-α and FPGS PCR products. Photographic image of 1.7% agarose gel showing fluorescent bands of
ethidium bromide bound PCR products prepared from the SKOV-3 cell line when exposed to UV light. The circles show
the PCR product produced from FR-α (left, 567bp) and FPGS2 (right, 684bp).
2.6.5. Amplification of FPGS3 cDNA
FPGS3 required optimisation of the PCR reaction in order obtain a band. Various strategies were
performed in order to obtain the required product. The annealing temperature was first increased
in an attempt to increase specificity of primer-mRNA complementation, this was without success.
The ovarian tumour cell line IGROV-1 was then tried as the RNA source, again without success. A
two-stage hemi nested PCR was then performed using the forward primer from FPGS2 and the
FPGS3 reverse primer in the first round (as this is part of the same protein), the second round was
a template PCR reaction using the FPGS3 forward and reverse primers and serial dilutions of the
template. In this case bands were obtained but were the incorrect length. As this sequence is
relatively GC rich it was inferred that the problem may be due to the primers self complementing
each other. For this reason it was decided new primers were to be designed outside of the target
region to carry out a full nested PCR (Table 2-10). In the first round the new primers were used to

Development and Evaluation of Novel Monoclonal Antibodies to FR-α and FPGS
67
amplify the target sequence. In the second round the original forward and reverse primers were
used and this was found to be successful. Both cell lines were used and both were successful,
however when cloned into the T-vector and sent for sequencing the product amplified from the
IGROV-1 cell line was found to contain errors which may have been significant, therefore, the
product amplified from the SKOV-3 cell line was pursued (Figure 2-14). Errors were found in both
sequences, likely to be due to errors arising from the two-stage PCR reaction, however only one
was deemed significant.
Table 2-10: FPGS Nested PCR primer sequences.
Primer Sequence
FPGS3F Nested 5’ GAGGTTCGAGTCTTGCTCTTCAATG3’
FPGS3R Nested 5’ GGAAAGCCAAAAACAAAAGGCACCTA3’
Figure 2-14: FPGS nested PCR product. Photographic image of 1.7% agarose gel, 2nd Round Nested PCR using
SKOV-3 cell line as the RNA source. The neat preparation was used as this contains the highest concentration of PCR
product. Note the band (arrowed) corresponds to the 123bp standards at 500 bases.
2.6.6. Fragment Preparations and Restriction Digests
Following PCR the bands were excised from the gel, fragment preparations prepared and ligated
into pGEM T Easy vectors. They were then transformed into Novablue E.coli, grown on TAXI
selection plates (to select for the presence of the pGEM vector) and plasmid minipreparations
(minipreps) were prepared.

Development and Evaluation of Novel Monoclonal Antibodies to FR-α and FPGS
68
Restriction digests were performed on the plasmid minipreps using the appropriate RE’s for each
construct. They were then analysed on an agarose gel to differentiate between those vectors
containing inserts and those only possessing an empty vector (Figure 2-15).
Figure 2-15: FR-α and FPGS restriction digests. Photographic example of 1.7% agarose gel showing restriction
digests for FR-α (left) and FPGS2 minipreps (right). FR-α vectors were digested with SacI and XhoI restriction
enzymes, FPGS2 vectors were digested with BamHI and HindII restriction enzymes. Again bands corresponding to 567
bases (FR-α) and 684 bases (FPGS2) were observed.
One positive miniprep was selected from each gel and a sample sent to Lark Technologies (Essex,
UK) for automated sequencing. Accuracy in this technique is maintained for approximately 380
bases downstream of primer binding. Bases denoted N were unidentified by the sequencer.
The following image shows a typical trace obtained (Figure 2-16), approximately 60 bases of the
initial sequence represents the polycloning region of the pGEM plasmid, after which the added
bases and restriction sites engineered into the primer, followed by the target sequence. The
sequences were analysed to ensure they correlated with the published sequences, once complete
identity and conformity was ensured, the FR-α and FPGS2 fragments were ligated into pET 21 and
pET 41 expression vectors.
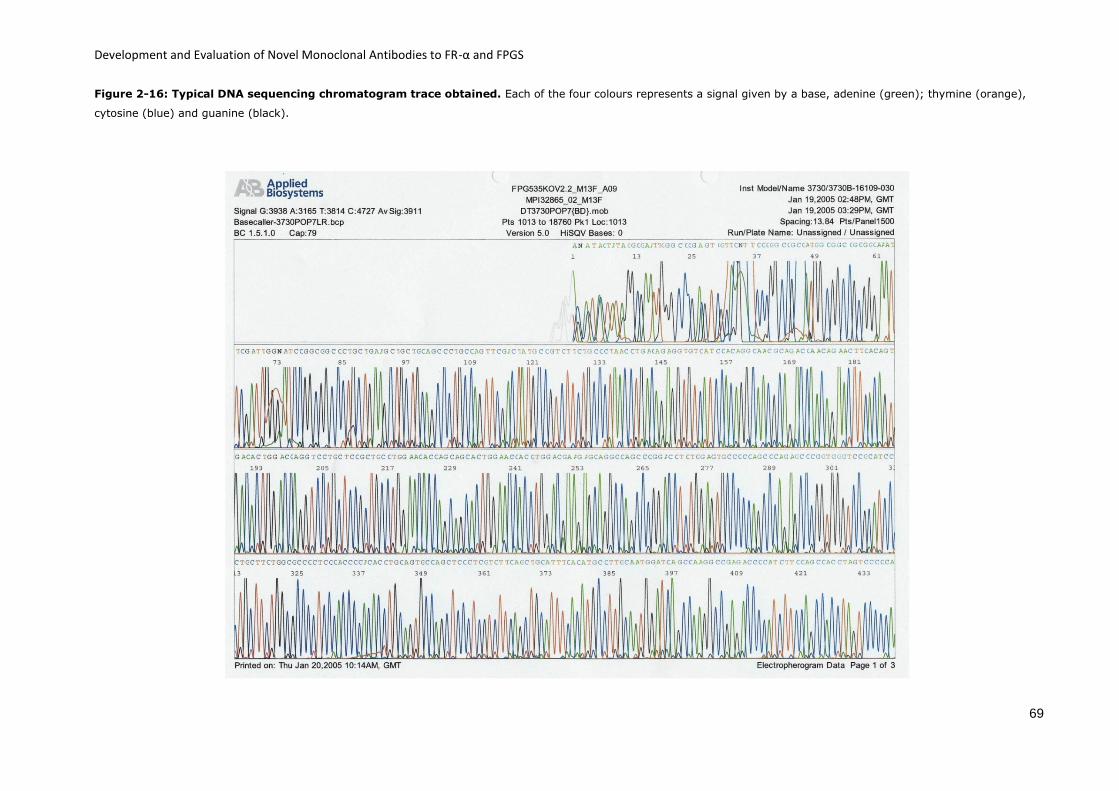
Development and Evaluation of Novel Monoclonal Antibodies to FR-α and FPGS
69
Figure 2-16: Typical DNA sequencing chromatogram trace obtained. Each of the four colours represents a signal given by a base, adenine (green); thymine (orange),
cytosine (blue) and guanine (black).

Development and Evaluation of Novel Monoclonal Antibodies to FR-α and FPGS
70
The FPGS2 sequence was analysed and the sequence was found to be correct. The FR-α sequence,
however contained a base substitution 16 amino acids downstream of the forward primer. The
substitution resulted in a stop codon, transformation using this miniprep would have resulted in a
truncated protein. It was inferred that the error may lie in the cell line and all minipreps may
contain the error. Two methods were developed to rectify this problem.
A long primer was designed which corrected the stop codon (Denoted FR-α F2).
A new primer was designed which began after the stop codon (Denoted FR- α F3).
Table 2-11: FR-α primer sequences.
2.6.7. pET Cloning
Once sequences were checked and found to be correct they were ligated into both pET 21 and pET
41 vectors, which had been pre-cleaved with the appropriate restriction enzymes and transformed
into Novablue E.coli. Minipreparations were prepared as described earlier, restriction digested and
screened via 1.7% agarose gel electrophoresis to ensure the selected miniprep contained an
insert.
2.6.8. Expression of FR-α and FPGS Recombinant Proteins in E.coli
One positive plasmid miniprep was selected for each target and was used for transformation into
BL21 (DE3) pLysS or Tuner expression hosts. One colony from each plate was selected and small
scale inductions were performed as previously described. Both pre and post induction samples
were resolved via SDS-PAGE and visualised via staining with Coomassie blue (Figures 2-17, 2-18
Primer Sequence
FR-α F2 5’GGAGCTCTGAAAAGCCAGGCCCGGAGGACAAGCTGCATGAGCAGTGTCGTCCGTGGCGTAAGAATGCCTGCTGT3’
FR-α F3 5’ GGAGCTCT AAGAATGCCTGCTGTTCTACCAACAC3’
Development and Evaluation of Novel Monoclonal Antibodies to FR-α and FPGS
71
and 2-19). The molecular weights of the FPGS2 protein in pET 21 and pET 41 constructs were
calculated to be 28 kDa and 58 kDa respectively.
The molecular weights of FR- α and FR- αF2 in pET 21 and pET 41 constructs were calculated to be
23.1 kDa and 55 kDa respectively.
The molecular weights of FPGS3 in pET 21 and pET 41 constructs were calculated to be 21.3 kDa
and 51.7 kDa respectively.
The following photographs are examples of some of the small scale inductions carried out.
Figure 2-17: FPGS small scale inductions. 12% (v/v) polyacrylamide gel. FPGS2 pET 21 and 41 small scale
inductions illustrating pre and post IPTG induction samples. (PI – pre induction, I – post induction) The bands circled
at approximately 28 and 58 kDa marked with a white circle indicate the induced protein bands.

Development and Evaluation of Novel Monoclonal Antibodies to FR-α and FPGS
72
Figure 2-18: FR-α pET21 small scale inductions. 12% (v/v) Polyacrylamide gel. FR-α and FR-α F2 pET 21 BL21
small scale inductions illustrating pre and post IPTG induction samples. The bands marked with a white circle at
approximately 23kDa indicate the induced protein band.
Figure 2-19: FR-α pET41 small scale inductions. 12% (v/v) Polyacrylamide gel. FR-α and FR-α F2 pET 41 BL21
small scale inductions illustrating pre and post IPTG induction samples. The bands marked with a white circle at
approximately 55kDa indicate the induced protein band.

Development and Evaluation of Novel Monoclonal Antibodies to FR-α and FPGS
73
2.6.9. Large Scale Recombinant Protein Expression
Following confirmation from small scale inductions that a protein of the expected approximate
molecular weight was expressed, large scale inductions were carried out. Typically two large flasks
(500ml cultures) were used to carry out the large scale induction for each protein. The BL21 strain
was used to generate FPGS2 recombinant proteins, both BL21 and Tuner strains were used for FR-
α and Tuner alone for FPGS3 (after unsuccessful BL21 purification) in an attempt to increase
solubility.
2.6.10. Recombinant FR-α and FPGS Protein Purification
2.6.10.1. FPGS2
FPGS2 large scale inductions were defrosted, sonicated and separated into soluble and insoluble
fractions. They were then purified using His-Bind chromatography on a soluble column. The
quality and quantity of the purified protein were assessed by SDS-PAGE and Bradford Assay.
Finally the fractions were pooled to create the protein to be used in subsequent immunisations.
Recombinant FPGS-2 protein was initially purified from the pET 41 soluble fraction, however, in
the hybridoma generation stage a significant issue with cross reactivity of the soluble protein was
highlighted which will be discussed in more detail in section 3.5.2.1. This resulted in purification of
the insoluble pET41 fraction to be purified via insoluble His-bind column chromatography and
used for immunization (Figure 2-20). In addition, generation of a new FPGS2 pET32b construct was
subsequently purified and used as a screening antigen in subsequent stages of the project. The
molecular weight of the new FPGS2 pET32 recombinant protein was calculated as 45kDa.
The FPGS2 pET21 construct did not yield sufficient protein to be used for immunisation and was
discontinued. A summary of the FPGS recombinant proteins produced is detailed in Table 2-12.

Development and Evaluation of Novel Monoclonal Antibodies to FR-α and FPGS
74
Figure 2-20: FPGS insoluble fractions. 12% (v/v) Polyacrylamide gel. FPGS2 32b BL21 insoluble fractions collected
via His bind chromatography (lanes 1-9) which were subsequently pooled together to generate one sample, dialysed
and used both for immunisation and as a screening antigen.
2.6.10.2. FR-α
Recombinant FR-α and FR-α F2 large scale protein induction samples were also purified from the
soluble fraction as described above for FPGS2, in light of the cross reactivity problem associated
with FPGS and the likelihood of the same occurring with FR-α it was decided that the insoluble
fractions of FR-α and FR-αF2 would be purified and used for immunisation (Figure 2-21). Despite
one of the initial plasmid minipreparations containing a stop codon 16 bases into the coding
sequence, others generated at the same time did not contain the error as first thought, as another
miniprep was sent to Lark technologies for sequencing and was found to contain no errors. It was
decided that as both FR-α and FR-αF2 fractions were essentially the same, the only difference
being the primers used that these fractions could safely be pooled together to generate a large
stock of recombinant FR-α. In addition to this a pET32 construct was generated as a screening
antigen, the insoluble fraction was purified via the use of a refold column (Figure2-22). Again this
was to overcome previous problems with cross reaction which will be discussed in more detail in
section 3.5.2.1. The molecular weight of the new FR-α pET32 recombinant protein was calculated
to be 39.3 kDa.

Development and Evaluation of Novel Monoclonal Antibodies to FR-α and FPGS
75
The FR-αF3 primers were not used as this would have only generated a truncated version of the
successful FR-α and FR-αF2 proteins and protein production via the use of these primers was
therefore discontinued.
The FR-α pET21 construct did not yield sufficient protein for immunisation and attempts to
produce this protein were also stopped. A summary of the FPGS recombinant proteins produced is
detailed in Table 2-12.
Figure 2-21: FR-α insoluble fractions. 12% (v/v) Polyacrylamide gel. FR-α pET 41 Tuner insoluble fractions (lanes
1-10) which were subsequently pooled together into one sample, dialysed and used both for immunisation and as a
screening antigen.

Development and Evaluation of Novel Monoclonal Antibodies to FR-α and FPGS
76
Figure 2-22: FR-α refolded fractions. 12% (v/v) Polyacrylamide gel. FR-α pET 32 refolded fractions (lanes 1-8)
which were refolded via the refold column method (see section 2.5.18).
2.6.10.3. FPGS3
FPGS3 recombinant protein was not identified in the soluble fraction and His-Bind
chromatography was carried out on an insoluble column in order to purify the protein. The
fractions were pooled and dialysed, the quality and quantity of the resultant protein was again
assessed via SDS-PAGE and Bradford assay (Figure 2-23). A summary of the FPGS recombinant
proteins produced is detailed in Table 2-12. All proteins were stored in 200µg aliquots at -80oC
until required for immunisation.

Development and Evaluation of Novel Monoclonal Antibodies to FR-α and FPGS
77
Figure 2-23: FPGS dialysed protein. 12% (v/v) Polyacrylamide gel. FPGS3 pET 41 recombinant protein, refolded by
dialysis.
Table 2-12: Summary of some of the recombinant proteins generated in this project.
Protein/ Target
Vector Tag E.coli Strain
Soluble/ Insoluble
Refold Method
Use for protein
FPGS1 NA NA NA NA NA Abandoned at design stage
FPGS2 pET21 His BL21 Soluble NA Insufficient yield for immunisation
FPGS2 pET41 His, GST BL21 Soluble NA Used for immunisation – abandoned after 3rd
cloning
FPGS2 pET41 His, GST BL21 Insoluble Dialysis Used for immunisation/screening
FPGS2 pET32 His, Tx BL21 Insoluble Dialysis Used for immunisation/screening
FPGS3 pET41 His, GST Tuner Insoluble Dialysis Used for immunisation – subsequently failed
FR-α pET21 His, Tx BL21 Soluble NA Insufficient yield for immunisation
FR-α pET41 His, GST BL21 Soluble NA Used for immunisation
FR-α (and F2) pET41 His, GST Tuner Insoluble Dialysis Pooled and used for immunisation/screening
FR-α pET32 His, Tx Tuner Insoluble Refold column Used for screening
FRα3 NA NA NA NA NA Abandoned as would generate truncated
protein

Development and Evaluation of Novel Monoclonal Antibodies to FR-α and FPGS
78
2.7. Discussion
2.7.1. Recombinant Protein Production
Antibodies suitable for immunohistochemical analysis of paraffin embedded tissue samples are
extremely useful as much of the tissue obtained from tumour samples is readily obtainable for
storage and transportation in this form. To date, there are no known commercially available FPGS
antibodies and only one known commercially available antibody capable of recognising FR-α. The
mOV 18 and 19 antibodies which have been found to recognise FR-α only do so in a limited
fashion, identify only the native protein conformation and are unsuitable for analysis on paraffin
embedded samples and Western blotting. In addition, mOV19 is no longer commercially available.
As they are only suitable for analysis on frozen tissue sections, their application is limited. Thus it
was one of the aims of this project to rectify this situation and produce a panel of antibodies
which can be used in wider applications.
The first step in monoclonal antibody production was to focus upon molecular biology techniques
to produce a suitable immunogen which could subsequently be used to immunise mice to produce
monoclonal antibodies, which will be discussed in detail in section 3.1.
The recombinant protein expression method used is currently the method of choice for the
production of immunogenic proteins. Using the methods described earlier, we were able to
successfully produce all three recombinant proteins from target sequences with relatively few
complications.
The aims of this particular section of the project were satisfied as all three recombinant proteins
have been successfully expressed and purified via the use of recombinant protein expression
techniques. These proteins were subsequently used for immunisation of mice for generation of
anti FR-α and FPGS antibodies. In addition, recombinant proteins for FR-α and FPGS2 have been
generated in pET32 vectors which may be used for immunisation or as screening antigens, as the
protein target sequence remains the same and the sequences differ only in the tagged and vector
flanking regions. This will avoid any problems relating to antibody cross reaction. The importance
of this will also be discussed in detail in the following chapter.
The stop codon in the FR-α sequence was inferred to be an error arising from the cell line used.
This was the reason for the design of the FR-αF2 and FR-αF3 primers. It was later discovered,
however, that this was not the case, as one of the other minipreps was sent for sequencing and
was found to be correct. In hindsight a different miniprep could have been sent earlier for

Development and Evaluation of Novel Monoclonal Antibodies to FR-α and FPGS
79
sequencing before design and preparation of new primers was considered. The protein might then
have been produced more quickly; however valuable experience was gained in the design of
primers and the methods involved in recombinant protein production. Additionally, valuable PCR
troubleshooting experience was gained from the problems encountered with the FPGS3 primers.
The proteins were produced using pET 32 and pET 41 vectors. It would have been useful to have
purified a protein in the pET 21 construct to observe the difference in antibody yield with and
without a GST protein present. However all proteins were too insoluble without the presence of
the tag, the yields in the soluble fractions were negligible and when refolding was attempted the
proteins precipitated into solution rapidly, both on refold columns and by dialysis.
All proteins produced had degradation to some degree, which may have been caused by the
overgrowth of E.coli cultures. This was not deemed to be a disadvantage as it may allow for many
different protein species to be presented to the murine immune system. Degradation may have
been reduced by inducing the large scale induction samples at an earlier stage in the growth. This
was not however deemed necessary as undegraded protein has not, in the past, always been
required to produce successful antibodies.
In summary, the aims of this part of the project were achieved, the next stage being dependent
upon the immune response produced by the mice to the protein.

Development and Evaluation of Novel Monoclonal Antibodies to FR-α and FPGS
80
Chapter Three

Development and Evaluation of Novel Monoclonal Antibodies to FR-α and FPGS
81
Chapter Three
3. Antibody Production
3.1. Hybridoma Technology
Antibodies are commonly produced via the immunisation of laboratory animals, typically mice and
rats, with an antigen emulsified in an adjuvant solution. Antigens are typically proteins although
peptides, nucleic acids and carbohydrates have also been used. The two most commonly used
adjuvants are Freunds complete and incomplete adjuvants. Freunds complete adjuvant contains
mineral oil and an additional component, the cell walls of mycobacterium which serve as non-
specific stimulators of the murine immune response (Freund, 1956; Freund & Mc Dermott, 1942).
Adjuvants are used as they strongly enhance the immune response via a number of different
mechanisms including retention of the immunogen at the site of administration, stimulation of an
immune response at the injection site and protection against antigen catabolism, all resulting in
promotion of subsequent immune reactions. The animal immune system identifies the antigen as
‘non-self’ and an immune response is generated, this involves the clonal expansion of B-cells
which differentiate to form plasma cells, able to secrete antibody of a single defined specificity.
Plasma cells sequester in secondary lymphoid organs, particularly the spleen where antibodies are
secreted and circulate in the blood and lymph, serving to recognise and opsonize any foreign
antigens encountered. If collected, these plasma cells would be an ideal source of antibody;
however these cells are unable to survive in vitro for any period of time and are unsuitable for use
as an antibody source.
3.1.1. Cell Fusion Technique
Many attempts had been made to produce antibodies with single known specificity, however,
until the development of hybridoma technology all attempts had failed (Berry, 2005). In 1975
Georges Kohler and Cesar Milstein developed a method of generating monoclonal antibodies by
successful fusion of antibody secreting B-cells from the spleen of an immunised mouse with a
mouse B-cell tumour (myeloma) cell line. This was achieved via somatic cell hybridisation,
resulting in a cell which had the immortal characteristics of a myeloma cell and the genetic
predisposition to secrete specific antibodies. The resultant cells may be maintained indefinitely in
vitro and are able to secrete antibodies into the culture supernatant (Kohler, Howe, & Milstein,

Development and Evaluation of Novel Monoclonal Antibodies to FR-α and FPGS
82
1976; Kohler & Milstein, 1975, 1976). Initially the Sendai virus was used in an attempt to generate
hybrid cells with little success. (Harris & Watkins, 1965). Later Polyethyleneglycol (PEG) was found
to be an effective method of cell fusion due to its ability to partially disrupt cell membranes,
causing lipid exchange between cells and integration of cell membranes and is now the standard
fusing agent employed in fusion techniques (Kohler & Milstein, 1976).
Cell fusion is a random process, creating multinucleate cells amongst which are the few binucleate
cells (hybridomas) of one myeloma cell and one B-cell. When the hybrid cells divide, the nuclei
initially form a mononuclear cell with tetraploid chromosomes, the additional two sets of
chromosomes are then lost, resulting in a diploid hybrid cell. All cells resulting from the fusion are
cultured in media containing hypoxanthine, aminopterin and thymidine (HAT), which is selective
for hybrid cells only and depends upon the fact that mammalian cells synthesize their nucleotides
via two different pathways as shown in Figure 3-1.
As reviewed in Chapter 1, the de novo pathway requires glutamine and aspartate as substrates for
purine and pyrimidine nucleotides which are in turn involved in DNA synthesis. Synthesis involves
the transfer of a methyl of formyl group from an activated form of tetrahydrofolate. The antifolate
aminopterin blocks this pathway thus inhibiting DNA synthesis via the de novo pathway. The
cultured cells are forced to utilise the salvage pathway in which nucleotides are synthesized via
the action of the enzymes hypoxanthine-guanine phosphoribosyl transferase (HGPRT) and
thymidine kinase (TK), (Figure 3-1).
The P3-NS-1/1-Ag-1 (NS-1) variant of the mouse myeloma cells are commonly used in the fusion
process as they only produce a κ light chain, reducing the amount of contaminating antibody
present. In addition, they are deficient in the enzyme HGPRT, which is used in the nucleotide
salvage pathway. The aminopterin present in the HAT media blocks the de novo pathway, cultured
cells such as NS-1 cells and NS-1-NS-1 hybrids which are deficient in this enzyme will not survive.
Despite possessing an intact HGPRT gene, splenocytes and splenocyte-splenocyte hybrids have a
finite lifespan of 1-2 weeks in culture and thus cannot survive alone. The only cell type able to
survive in these conditions are the hybridomas, which are HGPRT positive as they contain a copy
of the gene from the splenocyte. They are also able to survive in culture due to possessing the
immortal properties of a myeloma cell line.

Development and Evaluation of Novel Monoclonal Antibodies to FR-α and FPGS
83
Figure 3-1: Overview of de novo and nucleotide salvage pathways in mammalian cells. Aminopterin inhibits
the de novo synthesis of dATP, dGTP, dCTP and dTTP. If this is blocked, the two salvage pathways are activated via
the action of the enzymes HGPRT and TK.
3.1.2. Antibody Screening and Characterisation
The key aspect of monoclonal antibody generation is the screening protocol which must be
performed in order to select the specific antibody of choice. A number of different procedures are
performed in order to screen hybridoma culture supernatants to detect bound monoclonal
antibody. Taking advantage of the specific nature of the antibodies, fluorescent, enzyme linked or
otherwise tagged antibodies can be used in order to visualise the results. The most common
screening techniques used are ELISA, WB and IHC. The major advantage of such assays is the
speed at which they can be performed, their reliability and accuracy. Initial screening of fusions is
extremely important as it is on the basis of this result that hybridoma colonies are selected. ELISA
assays are often selected for initial fusion screening as it is regarded as a rapid, highly sensitive
assay and allows screening of the large numbers of hybridomas generated by fusions. Qualitative
results provide a simple positive or negative result for each supernatant sample and the margin

Development and Evaluation of Novel Monoclonal Antibodies to FR-α and FPGS
84
between positive and negative samples is determined via the use of positive and negative
controls. Secondary screening via immunohistochemical analysis on paraffin embedded sections
and via WB on cell lines and tissue extracts can also be performed to confirm specificity of the
antibody.
The hybridomas are then subsequently ‘cloned’ by limiting dilution three times, to eliminate any
cells which have lost their ability to secrete antibody which may exhibit growth advantage over
the desired cell population, and to ensure the probability that population of antibody secreting
cells are derived from one single cell (Figure 3-2).
After successful generation of antibodies, their specificity can then be assessed by both IHC and
WB analysis on normal, tumour and cell line panels to ensure they are specific for the target
protein.
A number of different cell line pellets including, ovarian, breast, colorectal and MPM malignancies
were obtained both from Novocastra and Newcastle University. In addition, a panel of leukaemia
cell lines kindly donated by Dr. Sally Coulthard were also included. As FPGS mRNA has been
reported to be expressed in a number of cell types, particularly cells of lymphoid origin, it was
thought that further investigation of FPGS expression in leukaemia cells would be interesting and
would fully characterise the antibody (Leclerec & Barredo, 2001; Nair & Mc Guire, 2005).
3.1.3. Epitope Mapping
Epitope mapping is a versatile technique as it can be used for a number of different applications; it
enables antibody specificity to be defined and may predict the occurrence of cross-reaction. It can
also be used in development of assays, to define sites of protein modification, to probe protein
structures, elucidate their functions and may also be used as a model for protein-protein
interactions. Epitope mapping can be performed by a number of different techniques for different
applications, each with their own inherent advantages and disadvantages. Mapping methods
include peptide arrays, phage displays of random peptide libraries, expressed protein fragments
via molecular biology, partial proteolysis and mass spectrometry.
The antigen binding site of an antibody is termed the paratope, where the region of an antigen
that binds to the paratope is termed the epitope, interactions between the antibody and antigen
are hydrophobic and electrostatic in nature and are noncovalent (Ramos-Vara, 2005).

Development and Evaluation of Novel Monoclonal Antibodies to FR-α and FPGS
85
Eptiope mapping was planned in order to bring closure to this part of work, depending upon the
time available the method used to perform epitope mapping may have varied. If possible, epitope
mapping was also planned for the mOV 18 and LK26 antibodies to observe any
similarities/differences between the epitopes recognised. This would be dependent upon the
method of epitope mapping selected. Epitope mapping is not routinely carried out to characterise
antibodies but in this study it was performed as it was necessary to confirm our antibodies
recognised an epitope present in the target sequence.

Development and Evaluation of Novel Monoclonal Antibodies to FR-α and FPGS
86
Figure 3-2: Overview of MAb production. Following immunisation, splenocytes were fused with NS-1 myeloma cells and incubated for 7-10 days and screened by ELISA to
select for hybridomas secreting antibody. Positive hybridomas were picked and screened via IHC and WB and cloned three times (7-10 days minimum for each round of cloning) to
ensure they were monoclonal.

Development and Evaluation of Novel Monoclonal Antibodies to FR-α and FPGS
87
3.2. Aims and Objectives
The aim of this part of the project was to develop specific antibodies to the FR-α and FPGS protein
targets and fully characterise the antigen specificity of the antibodies via ELISA, WB and IHC.
Immunise three sets of five female, Balb C mice with an optimal concentration of
recombinant protein targets FR-α, FPGS2 and FPGS3 generated previously.
Assess the immune response of the mice bleeds via WB and IHC.
Perform cell fusions on the splenocytes of the most responsive mice with NS-1 myeloma
cells to generate hybridomas.
Isolate and characterise the specific monoclonal antibodies via ELISA, WB and IHC.
Clone positive hybridomas three times, assessing the antibody specificity by ELISA and
WB at each stage on control tissues and cell lines.
Stability testing of positive hybridomas at different temperatures.
Weaning of positive hybridomas into non-supplemented media.
Full characterisation of the antibodies on panels of normal and tumour tissue
Further characterisation of the antibodies via WB analysis on cell line panels derived
from cell lysates grown in culture.
Epitope mapping of the antibodies to identify the region of the target sequence
recognised.

Development and Evaluation of Novel Monoclonal Antibodies to FR-α and FPGS
88
3.3. Materials and Methods
3.3.1. Mouse Immunisation Schedule
The immunisation schedule employed in this project was selected according to current guidelines
already in place at Novocastra Laboratories, as much success has already been seen via the use of
these methods. Many factors influence a successful immune response, including injection site,
adjuvant used and chemical nature/solubility of the immunogen.
For both the FR-α and the FPGS immunogens, five 6-7 week old female Balb/C mice, weighing 20-
40 g, supplied by Charles Rivers, were immunised subcutaneously with a mixture of 150-180µg
antigen (20µg/mouse plus extra material to account for losses during processing), 400µl PBS and
approximately 480µl Freunds complete adjuvant. The mixture was emulsified using a double –
hub emulsification needle and PBS containing 2% Tween 80 added to make the total volume 1.4
ml. All five mice were immunised with 200µl solution and the excess discarded. The 5 mice were
identified by labelling their ears as follows:
LN, (Left Notch).
RN, (Right Notch).
BN, (Both Notch).
NN, (No Notch).
2RN (2 Right Notch).
On day 14, all 5 mice received a second subcutaneous booster immunisation of 20µg/mouse of
recombinant protein, in Freund’s incomplete adjuvant.
On day 28, all 5 mice received an intraperitoneal (IP) immunisation of 20µg/mouse of recombinant
protein diluted in PBS solution only and on day 35 approximately 0.2 ml of blood was taken from
the tail vein of each mouse and tested via ELISA to assess the antibody response. This procedure
was performed at the Comparative Biology Centre, Newcastle University (CBC). Administration of
the immunogen intraperitoneally generates a strong immune response as it drains directly into the
thoracic lymphatic system and major veins where they have immediate, direct exposure to the
immune system, particularly the spleen.

Development and Evaluation of Novel Monoclonal Antibodies to FR-α and FPGS
89
On day 42, all 5 mice received a second IP booster immunisation of 20µg/mouse of recombinant
protein diluted in PBS and on day 49, approximately 0.2 ml of blood was taken from the tail vein of
each mouse and stored at -20oC. These bleeds were tested for specificity to both FR-α and FPGS
via WB and IHC. Multiple inoculations were performed and repeated in order to expose the
animals to a large amount of antigen, whilst concomitantly lowering the risk of hypersensitivity
reactions which may cause animal death.
Any mice found to produce specific antibody received an intravenous (IV) booster injection of
20µg of recombinant protein in PBS solution 5 days prior to fusion. This was performed in order to
boost blastogenesis in the immune system maximally, the primary site being in the spleen (Table
3-1). The mice were humanely sacrificed on the day of fusion by dislocation of the neck.
Immunisations, ELISA screening and sacrifices were carried out by trained staff at the CBC.
Table 3-1: Mouse immunisation schedules employed in this study.
Injection No
No of Mice/Project
Procedure/ Adjuvant
Site Immunogen (µg/mouse)
Schedule Day
1 5 Freunds Complete adjuvant
Subcutaneous 20 0
2 5 Freunds Incomplete Adjuvant
Subcutaneous 20 14
3 5 PBS Tween Intraperitoneal 20 28
4 5 PBS Tween Intraperitoneal 20 42
5 5 PBS Intravenous 20 5 days before fusion
3.3.2. Growth of Cell Lines
Frozen aliquots of cell lines were kindly donated by Dr. Sally Coulthard, Dr. Joyce Nutt and Dr. Jane
Margetts at Newcastle University in addition to the use of various cell lines already stored and
prepared at Novocastra Laboratories. The following cell lines were used in the characterisation of
the expression of the FR-α and FPGS antibodies. The cell lines, origin and culture conditions are
shown in Table 3-2.

Development and Evaluation of Novel Monoclonal Antibodies to FR-α and FPGS
90
Table 3-2: Human cell lines used for characterisation of FR-α and FPGS antibodies. Cell lines, types and
designations used in further WB studies using FR-α and FPGS antibodies.
Cell Line Type Culture Conditions
(2mM L-glutamine, 10% FBS, 5% CO2, 37
oC)
IGROV-1 Human ovarian epithelial carcinoma
RPMI-1640 monolayer
OVCAR-3 Human ovarian epithelial carcinoma
RPMI-1640
Bovine Insulin (0.01 mg/ml)
SKOV-3 Human ovarian carcinoma RPMI-1640 monolayer
SW626 Human ovarian adenocarcinoma
RPMI-1640 monolayer
PA-1 Human ovarian teratocarcinoma
RPMI-1640 monolayer
HeLa Human cervical carcinoma RPMI-1640 monolayer
BT20 Human breast ductal carcinoma RPMI-1640 monolayer
HBL100 Human normal breast epithelia RPMI-1640 monolayer
MCF7 Human breast adenocarcinoma RPMI-1640 monolayer
MSTO-211H Human lung mesothelioma RPMI-1640 monolayer
NCI-H28 Human lung mesothelioma RPMI-1640 monolayer
NCI-H226a Human lung mesothelioma RPMI-1640 monolayer
A549 Human lung alveolar basal epithelial cell carcinoma
Dulbeccos Modified Eagles media monolayer
HT29/219 Human colon epithelial carcinoma
RPMI-1640 monolayer
CaCo2 Human colon epithelial adenocarcinoma
Dulbeccos Modified Eagles media monolayer
HCT116 Human colon epithelial carcinoma
Dulbeccos Modified Eagles media monolayer
Bristol 8 Human B-lymphoblastoid line RPMI 1640 suspension
A375 Human epithelial malignant melanoma
RPMI-1640 monolayer
SJSA Human osteosarcoma RPMI 1640 suspension
SHSY5Y Human neuroblastoma Dulbeccos Modified Eagles media monolayer
Jurkat Human T-cell acute lymphoblastic leukaemia (ALL)
RPMI-1640 suspension
Molt 4 Human T-cell ALL RPMI-1640 suspension
CCRF-CEM Human T-cell ALL RPMI-1640 suspension
TK6 Human lymphoblastoid thymidine kinase heterozygote
RPMI 1640 suspension
PFI-285 Human T-cell lymphoma RPMI 1640 suspension
Pre-B Human pre-B cells RPMI 1640 suspension
ECR-293 Human embryonic kidney Dulbeccos Modified Eagles medium monolayer
3.3.3. Protein Estimation
Cell lines were cultured as described in Table 3-2. All protein lysates were prepared from the
different cell lines in exactly the same way. The protein concentration present in each sample was
estimated by an automated analyser.
A confluent monolayer or suspension of each cell line was grown in a 75cm2 flask (approx 8x10⁵
cells/ml) and the media removed by decanting. The cells were washed in Dulbeccos PBS (Sigma) to

Development and Evaluation of Novel Monoclonal Antibodies to FR-α and FPGS
91
remove any non adherent cells/cell debri, non cell associated proteins and contaminant from the
cell monolayer/suspension. The adherent cells were then incubated for 15 minutes in 15ml non-
enzymatic cell dissociation solution (0.2M EDTA, Sigma) and washed off with a 10ml pipette and
PBS. Trypsin was not used as it may have sheared the receptors from the cell surface. Cell
suspensions were centrifuged for 5 minutes at 300G, the supernatant discarded and washed in a
further 10ml PBS and centrifuged again. 100µl cell lysis buffer/107 cells (62.5 mM tris pH 6.8, 10%
glycerol, 2% (w/v) SDS) was added to each cell pellet to lyse the cells. Samples were then
sonicated to break the cells down further and boiled at 100oC for 10 minutes prior to protein
estimation.
Protein estimation was performed in a 96 well microtitre plate and was carried out using a Pierce
protein assay kit (Pierce, Rockford IL) according to the manufacturers instructions. The unknown
protein concentrations of the cell lysates were compared to that of known albumin protein
standards and the results read via the use of a Spectromax 250 Microplate spectrophotometer
system (Molecular Devices Corporation) according to the standard operating procedures. The
unknown protein concentrations were determined and the volume of lysate to ensure all samples
were loaded with equal amounts of protein calculated. The samples were stored at -20oC until
required.
3.3.4. Western Blotting (WB)
WB allows the identification of proteins recognised by specific antibodies which recognise linear,
rather then conformational epitopes as WB is typically performed under denaturing conditions.
The target recombinant proteins and appropriate cell lysates are first electrophoretically
separated via SDS-PAGE and then transferred onto a nitrocellulose membrane. This is then probed
with the antibody of interest to assess the specificity of binding to the required epitope present in
the antigen, corresponding to the correct molecular weight, as determined by known molecular
weight markers (see section 2.5.13 for SDS-PAGE method).
A number of detection methods are commonly used in WB, including colourimetric,
chemiluminescence, radioactive and fluorescent detection. Two techniques were utilised in this
study. The colourimetric alkaline phosphatase (AP) method and the horse radish peroxidise (HRP)
enhanced chemiluminescence (ECL) method. AP is conjugated to the secondary antibody and upon
reaction with a suitable substrate an insoluble dye is precipitated onto the membrane, staining it.
Development and Evaluation of Novel Monoclonal Antibodies to FR-α and FPGS
92
This technique is simple to perform, although is regarded as less sensitive than other methods. ECL
is considered to be one of the most sensitive detection methods, relying on a substrate which
luminesces when exposed to the reporter conjugated to the secondary antibody (HRP in this case).
The light is captured on photographic film; this does not degrade with time so a permanent record
can be kept.
3.3.5. Assessment of Bleeds via Western Blot
12% SDS polyacrylamide (PA) gels were prepared, recombinant proteins and cell line extracts at a
concentration between 0.2-0.5 µg/µl were electrophoresed for 45 minutes at a constant voltage
(170V), together with suitable molecular weight markers (Bio-Rad precision plus dual colour
protein standards). Satisfactory separation was judged by the visualisation of the bromophenol
blue dye and viewing the progress of the pre-stained standards reaching the base of the PA gel.
The gels were then equilibrated in ice-cold transfer buffer (0.025M Tris, 20% methanol, 0.1% SDS,
pH 8.6) for five minutes. Six sheets of blotting paper and one piece of nitrocellulose paper
(Hybond-C, Amersham) were cut into rectangles, slightly larger than the gel and soaked in transfer
buffer. Three sheets of blotting paper were placed in the semi-dry blotter (Hoeffer TE70) stacked
on top of each other, a sheet of nitrocellulose paper was added and then the gel. A further three
sheets of blotting paper were placed on top of the stack, taking care to exclude any air bubbles.
The semi-dry blotter was then run at a constant current of 60 mA for 30 minutes for one gel (or
120 ma for 2 gels), as shown in Figure 3-3.
.

Development and Evaluation of Novel Monoclonal Antibodies to FR-α and FPGS
93
Figure 3-3: Semi-dry blotting apparatus. The nitrocellulose gel underlaid with blotting paper was sandwiched
between blotting paper and placed in a semi dry blotter to facilitate transfer of the protein bands to the membrane.
The transferred proteins were visualised by incubation with Ponceau S red reversible stain (Sigma)
for 2 minutes, followed by destaining in distilled water. The protein tracks were cut into strips,
washed in PBS-tween (PBSt) rinse buffer and labelled NN, LN, RN, 2RN and BN. The strips were
placed in blocking solution (10% (w/v) skimmed milk in PBSt) to block free binding sites and reduce
non specific binding and incubated at room temperature for 1 hour or overnight at 4oC.
Each individual strip was then incubated at room temperature for 1 hour with the appropriate
bleed, diluted 1/250 in 10% foetal calf serum (FCS) (Sigma) in PBSt. The pre-immune bleeds were
used as a negative control. The AP detection method was considered to be the most suitable
detection method for WB of bleeds as ECL results are difficult to interpret due to excessive
background.
The strips were washed in several changes of PBSt rinse buffer and placed in rabbit anti-mouse
alkaline phosphatase (RAMAP) secondary antibody (Amersham), diluted 1/500 in 10% foetal calf
serum, for 1 hour at room temperature. The strips were washed again in several changes of PBS
rinse buffer, and then washed twice in alkaline phosphatase buffer (100mM NaCl, 5mM MgCl2,
100mM diethanolamine, pH 9.5). The antigen-antibody-antibody complex on the nitrocellulose
paper was then visualised by placing the strips in developer solution (10ml AP buffer, 33µl
nitrobluetetrazolium (NBT, 100mg/ml), 66µl 5-bromo4-chloro3-indolyl phosphate (BCIP, 50mg/ml)
(Sigma), until the bands could be visualised. The chromagen cleavage reaction was terminated by

Development and Evaluation of Novel Monoclonal Antibodies to FR-α and FPGS
94
briefly placing the strips in 10% acetic acid prior to air drying. The membrane was then scanned to
generate an electronic image and stored, protected from the light.
3.3.6. Immunohistochemistry
Immunohistochemistry is used to identify tissue components via the use of both polyclonal and
monoclonal antibodies. This technique has a long history, the first concepts of which were
described in 1941 via the use of an antibody containing a fluorescent group (Coons, Creech, &
Jones, 1941). The technique was used throughout the 1970’s, gaining application in the
identification of proteins on formalin fixed paraffin embedded tissue samples, although at this
time the applications were limited as not all proteins in samples were identified. This is largely due
to masking of epitopes caused by tissue processing. In 1991, Shi and colleagues identified a high
temperature unmasking method to expose target epitopes in fixed tissues; this revolutionised
immunohistochemistry as the sensitivity of the technique was greatly increased and many
antibodies previously regarded as being of little use in fixed tissue were found to be of much
greater value (Shi, Key, & Kalra, 1991).
It has been hypothesized that heating tissue sections to temperatures in excess of 100OC causes
disruption of cross links formed between formalin and the proteins tertiary or quaternary
structure. These cross links are considered to be responsible for the masking of epitopes
commonly seen. It may also restore antigens altered via acetylation or methylation. Dependent
upon the degree of cross linkage, epitope retrieval solutions with differing pH may be used in
order to optimise this technique.
IHC is extremely useful as it is able to provide information upon protein expression levels in tissues
and cellular localisation. In addition, it can be used to confirm the presence or absence of cellular
markers and based upon their location within the cell can often aid in the elucidation of the
function of particular proteins. IHC is able to detect relatively low levels of protein in tissues,
although it is not as sensitive as ELISA or WB analysis.
Various detections may be used in IHC, the techniques used in this study are the indirect
streptavidin-biotin (ABC) technique as described in Figure 3-4 and the newer, more sensitive
Novolink™ bench polymer kit (Novocastra laboratories, Figure 3-5). The basic methodology and
detection method used in both methods are similar, although a polymer replaces the secondary
antibody and avidin-biotin complex in the Novolink™ method. The advantages of the polymer kit

Development and Evaluation of Novel Monoclonal Antibodies to FR-α and FPGS
95
are the ease and efficiency of the steps involved and the increased sensitivity of a polymer based
detection kit.
Figure 3-4: Indirect ABC technique immunohistochemistry. The primary antibody binds to the target (step 1)
and a secondary biotinylated conjugate antibody binds to the complex (step 2). Biotin molecules are recognised by
streptavidin, which is conjugated to a horseradish peroxidise (HRP) enzyme. Each streptavidin binds four biotin
molecules and a macromolecule complex is formed (step 3). Addition of a chromogenic substrate such as 3’3-
diaminobenzidine tetrahydrochloride (DAB) causes the HRP to cleave it into an insoluble brown product which is
precipitated at the site of formation.

Development and Evaluation of Novel Monoclonal Antibodies to FR-α and FPGS
96
3.3.6.1. Indirect Avidin-Biotin (ABC) Technique Immunohistochemistry
IHC was carried out according to the method described by Hsu and colleagues (1981). 5 µm
sections of paraffin embedded tissue were cut using a microtome (Leica Biosystems) and placed
onto 3-aminopropyltriethoxysaline (APES) coated slides. Sections were incubated at 37OC
overnight, then baked at 60OC for 60 minutes, then deparaffinized in xylene and rehydrated
through graded alcohols (100%, 90% and 70% ethanol in dH2O). Endogenous peroxidase activity
was neutralised by incubating in a mixture of 3% H2O2 in methanol at room temperature for 10
minutes. The sections were washed in running tap water pre-treated with the appropriate
reagent at a given pH in a pressure cooker for 1 minute at maximum pressure in order to expose
antigenic epitopes. The sections were once again washed in tap water and placed in tris-buffered
saline (TBS) buffer, (140mM NaCl, 50mM Tris-HCl pH 7.6) for 5 minutes. In order to block any non-
specific tissue binding sites, the sections were incubated with 10% normal rabbit serum (NRS) in
TBS buffer for 10 minutes at RT. Excess blocking serum was removed and replaced with the
appropriate dilution of bleed/primary antibody and the sections were incubated at 25°C for 60
minutes. Following incubation, sections were washed in TBS for 5 minutes and covered with
biotinylated rabbit anti-mouse secondary antibody (Novocastra Laboratories), diluted 1/500 with
10% NRS in TBS buffer and the sections were incubated at 25°C for 30 minutes. Following
incubation sections were washed in TBS buffer for 5 minutes and then covered with peroxidase-
conjugated ABC complex (Novocastra Laboratories) diluted in TBS buffer and incubated again at
25°C for 30 minutes. After a final wash in TBS buffer, bound peroxidase was visualised using 3’3-
diaminobenzidine tetrachloride (DAB) chromogen. The sections were washed in tap water,
counterstained with haematoxylin, dehydrated through graded alcohols, cleared and mounted in a
mixture of Distyrene, Plasticizer and Xylene (DPX) (Sigma), (Figure 3-4).

Development and Evaluation of Novel Monoclonal Antibodies to FR-α and FPGS
97
3.3.6.2. Novolink™ Polymer Immunohistochemistry Figure 3-5: Novolink™ polymer methodology. Steps and methodology employed via the use of the Novolink™
polymer kit. N.B. Antigen retrieval was performed in a pressure cooker as previously described prior to the blocking
steps.
3.3.6.3. Bleed Assessment via Immunohistochemistry
All 5 bleeds, diluted 1:400 with 10% NRS in TBS, were tested on ovarian and colon
adenocarcinoma, normal colon and placental FFPE samples obtained from Novocastra archives
using IHC with the indirect ABC IHC technique and the Novolink polymer testing kit. The pre-
treatments used were high temperature citrate (200mM citric acid, 500mM NaOH, pH 6.0) and
Tris/EDTA (10mM Tris, 1mM EDTA, pH 9.0) unmasking in a pressure cooker at high pressure for 1
minute and the enzyme based proteinase-K bench unmasking technique. The unmasking solution

Development and Evaluation of Novel Monoclonal Antibodies to FR-α and FPGS
98
that gave the most specific staining was chosen and used in subsequent experiments. Mice with
positively responding sera were selected for the final IV injection and subsequent fusion.
3.3.7. NS-1 Myeloma Cell Culture
As described earlier, NS-1 cells are immortal cancer cell line variants of mouse cell myelomas
which have lost the ability to both synthesize and secrete immunoglobulin (Ig) heavy chains. They
are therefore ideal candidates for hybridoma development as they do not produce contaminating
antibody.
Cell culture was performed in a Class II tissue culture hood using aseptic techniques, typical culture
medium for myeloma cells is RPMI 1640 (Sigma), 20% (v/v) FCS (Sigma), 2mM L-glutamine (Sigma),
2.5ml penicillin/streptomycin (500 µg/ml) (Sigma), also known as R20 medium. The media was
stored at 4oC when not in use and from the date of production it had a shelf life of one month.
Media was pre-warmed to 37oC in a water bath prior to use.
Five days prior to cell fusion, a cryovial containing 1 x 10⁶, P3-NS-1/1-Ag-1 azaguanine selected
myeloma cells, was removed from liquid nitrogen and thawed rapidly in a 37OC water bath. The
cells were re-suspended in 10 ml R20 medium and centrifuged for 5 minutes at 125g. Following
centrifugation, the supernatant was discarded and the cells were re-suspended in 10 mls R20
medium and transferred to a 162cm² flask, where a further 30 ml of R20 was added. The cells
were stored in a 37OC incubator with 5% CO2. Cell growth was monitored daily by microscopic
examination until approximately 80% cell density was achieved. Upon reaching this density
(typically 2-3 days) the NS-1 cells were counted using a haemocytometer and trypan blue (Sigma)
was used to measure cell viability. A minimum of 2X10⁷ cells with a viability greater then 90% was
required in order to proceed with the cell fusion.
Typically, cells were fed once every 2-3 days by subculturing 1ml of the cell suspension into
approximately 30mls R20 media and expanded up to approximately 80mls two to three days prior
to cell fusion.

Development and Evaluation of Novel Monoclonal Antibodies to FR-α and FPGS
99
3.3.8. Cell Fusion Procedure
3.3.8.1. Fusion Preparation
One week after selection for IV, the positively responding mouse, as determined by WB and
immunohistochemical bleed assessment was sacrificed at the CBC and collected approximately 30
minutes before commencement of fusion. Prior to fusion, 5ml of HAT medium (Sigma), and 10%
(v/v) BM-Condimed H1 (Boehringer-Mannheim, UK) and 15% Foetal Calf Serum (Sigma), was
added to 190 ml of R20 medium (fusion medium) in a 75cm2 flask and warmed to 37OC in a water
bath. Condimed contains a mixture of growth factors and cytokines, including Interleukin-7 (IL-7)
which markedly stimulates growth of hybridoma cells in culture and aids in the production of
hybrids secreting antibody. A vial containing 4 ml of 50% PEG 1500 in 75 mM Hepes (Sigma) and a
universal containing 50 ml of R20 medium was also placed in the water bath.
3.3.8.2. Splenocyte Preparation
The mouse was drenched in 70% alcohol before being placed into the sterile hood. The mouse was
laid on its right side and using sterile scissors, the fur and skin was cut along the abdomen and the
spleen excised. All bound fat and additional tissue was removed and the spleen was washed in a
petri dish containing approximately 10mls warm, sterile R20 medium. The spleen was then
transferred to a further petri dish containing approximately 10 ml of R20 medium. Using sterile
forceps and a seeking tool, splenocytes were gently teased out of the splenic capsule and into the
medium, taking care not to disrupt the capsule itself. Once the majority of the splenocytes were
removed the splenic capsule and mouse were discarded. The cell suspension was slowly passed up
and down several times through a large 18 gauge needle. This large needle was then exchanged
for a smaller 25 gauge needle and the process was repeated in order to produce a single cell
suspension whilst avoiding rupture of the splenocytes.
3.3.8.3. NS-1 Myeloma Cells
Before preparing the cell suspension, an appropriate volume of NS-1 cells were calculated, in
order to provide 2x10⁷ cells necessary for the fusion, using a haemocytometer. The volume of
media, containing 2x10⁷ NS-1 cells was transferred into a 50 ml universal and centrifuged for 5
minutes at 125G. The supernatant was discarded and the cell pellet gently tapped to dislodge the
cells.

Development and Evaluation of Novel Monoclonal Antibodies to FR-α and FPGS
100
3.3.8.4. Fusion in PEG
The splenocyte single cell suspension prepared in the syringe was slowly added to the universal
containing the NS-1 cells and the mixture of both cells (NS-1:Spleen cells approx 1:8) was
centrifuged again at 125 G. The supernatant was discarded and the cell pellet gently tapped to
resuspend both types of cell into the residual medium. The cells were placed into a small 37OC
water bath where they remained throughout the fusion procedure. The universal was continually
rotated and 2ml of PEG 1500 (Sigma) was added to the cell mixture over 1 minute taking care not
to immerse the pipette tip into the cell suspension. 1ml of R20 media was then added over 1
minute with the tip of the pipette placed firmly against the bottom of the universal. Subsequently,
2x 10 mls R20 medium were added over 4 minutes with the tip placed just under the meniscus.
The cell mixture was decanted into the 75cm2 flask containing the fusion medium prepared
earlier. The suspension was plated out at 200 μl/well into twelve 96 well sterile culture plates,
leaving the final column on the 12th plate free for controls, and incubated at 37oC, 5% CO2 for 7
days. After approximately 7 days the plates were examined microscopically to identify hybridoma
colonies.
3.3.9. Enzyme Linked Immunosorbent Assay (ELISA)
ELISA is a solid phase binding assay used in a variety of applications, including determination of the
antigenic constituent of hybridoma supernatants by antigen-antibody interactions between the
recombinant protein used for immunisation and the antibodies generated resulting from fusions.
A secondary antibody is typically conjugated to an enzyme. In this case AP was conjugated to the
secondary antibody which cleaved a colourless P-nitrophenyl phosphate substrate to the yellow
cleavage product monophosphonitrophenol, the absorbance of which could then be measured by
a spectrophotometer (450nm).
3.3.9.1. Screening for Specific Hybridoma Colonies via ELISA
After approximately 7 days, the 12 fusion plates were screened by ELISA to detect any specific
anti-FR-α and FPGS antibodies. 100µl of the appropriate recombinant protein, at a concentration
of 1 µg/ml in coating buffer (15mM Na2CO3, 35mM NaHCO3, pH 9.6) were added to each well of
twelve 96 well ELISA plates and incubated either at 37OC for 2.5 hours or overnight at 4OC. The
plates were washed three times with PBSt, pH 7.2 to remove any unbound antigen, using a hand
operated plate washer (Dynatech Laboratories, UK). 50µl PBSt with 1% NRS was added to each

Development and Evaluation of Novel Monoclonal Antibodies to FR-α and FPGS
101
well to reduce any background resulting from pH variability between wells. 50μl of primary
supernatant from the fusion plates was then added to the corresponding ELISA plate via the use of
a 96 channel pipette transplater with sterile 96 tip transplate cartridge (Transtar, UK). A positive
control, using the corresponding positive bleed, diluted 1:1000 and 1:5000 in PBSt and a negative
control of PBSt only, was also added to the final column on the 12th plate and the plates were
incubated at 37oC for 1.5 hours.
After washing to remove any unbound antibody, the plates were incubated at 37oC for 1.5 hours
with 100μl/ well AP conjugated rabbit anti-mouse IgG (Sigma) diluted 1/2000 in PBSt. After the
final washing step to remove any unbound secondary antibody the plates were incubated with
100μl/well AP tablets (Sigma) dissolved in AP buffer (100mM diethanolamine, 100mM NaCl, 5mM
MgCl2, pH 9.5) at a concentration of 1 mg/ml for 15 minutes or until the colour developed (Figure
3-6). 50µl of 3M NaOH was added to each well to stop the reaction and the optical density of the
plates were then read on an MRX plate reader (Dynex Technologies) at 450 nm. Positive wells
were identified, using the positive controls as a guide and hybridomas in the corresponding wells
from the original fusion plates were picked off using a 10 μl pipette and transferred to a new 96
well ELISA plate. A positive response was determined by an optical density (OD) above the OD of
the control at 1/5000. The positive hybridomas were then supplemented with R20/condimed
medium and left to grow overnight at 37OC.
Figure 3-6: Positive ELISA plate. Photograph of an ELISA plate showing positive wells (yellow).

Development and Evaluation of Novel Monoclonal Antibodies to FR-α and FPGS
102
3.3.9.2. ELISA Screening of Hybridomas against Fusion Protein Tags
As the amino acid sequences of FR-α and FPGS were cloned into pET32a-Tx and pET41b-GST
tagged vectors respectively, the ELISA positive hybridomas were screened against both TX and GST
proteins by ELISA as previously described to ensure any hybridomas secreting antibodies
recognising either protein were identified and discarded. Any cells recognising the ‘tag’ were
located to the corresponding wells on the culture plate were removed. All remaining positive
hybridomas were supplemented with R20/condimed medium and left to grow overnight at 37OC.
3.3.10. Screening ELISA Positive Hybridomas via IHC
ELISA positive hybridoma supernatants were screened by IHC on FFPE tissue sections obtained
from the Novocastra archives, using the standard indirect ABC technique and Novolink Polymer kit
as described in section 3.3.6. The unmasking methods, as determined from the bleed assessment
were citrate pH 6 for FR-α and Tris EDTA pH9 for FPGS hybridomas.
At this stage the sections were scored as either negative, 1+ (weak), 2+ (moderate) or 3+ (strong)
using a light microscope and specific hybridomas were transferred to a 24 well plate and given the
appropriate volume of R20/condimed medium and left to grow
3.3.11. Cloning Hybridomas via Limiting Dilution
The ELISA and IHC positive hybridomas were cloned to ensure that the antibody secreting
hybridomas were from single parent cells and thus monoclonal in origin. This also ensured the
antibody secreting cells were not contaminated with more rapidly growing non-secreting cells
which often exhibit growth advantage over cells secreting antibody.
Two 96 well plates were prepared for each positive hybridoma by addition of 200 μl
R20/condimed medium to each well and pre-warming at 37oC. The calculated volume containing
1000 cells from each positive hybridoma was then diluted in 4mls R20/condimed medium and
100µl of cell suspension was then seeded into the first 2 columns of each 96 well plate. It was then
serially diluted across the plates by transferring 100 µl of cell suspension from rows 1 and 2 to
rows 3 and 4 respectively, continuing across to the end of the plate. Excess cell suspension was
discarded and the plates were incubated at 37OC until sufficient growth had been achieved,
typically 7-10 days; the hybridomas were then screened by ELISA.

Development and Evaluation of Novel Monoclonal Antibodies to FR-α and FPGS
103
Positive wells towards the right of the plate (typically one or two hybridomas per cloning plate)
were selected to be grown for IHC analysis to ensure the antibody gave specific tissue staining.
In order to produce a monoclonal antibody, this cycle of screening via ELISA and IHC and cloning
procedures needed to be repeated a minimum of three times to ensure the hybridoma clones
were statistically 99.99% monoclonal. The cells were also frozen down before cloning at each
stage to ensure a stock of hybridoma was available to return to if necessary in case of failure of
cloning or contamination.
3.3.11.1. Assessment of 1st and 3rd Clones via Western Blot Analysis
ECL WB was used to assess 1st and 3rd clones in addition to IHC analysis to confirm specific
reactivity with both the recombinant protein and cell lines known to express the protein. The
methods were performed as described in section 3.3.4. The more sensitive ECL detection method
was used to assess clones.
After addition of the primary antibody and washing steps, an HRP labelled anti-mouse IgG
secondary antibody (Amersham) at a dilution of 1/2000 in PBSt/ 10% foetal calf serum was added
to the membrane and incubated for 1 hour at room temperature. After several washes in rinse
buffer the antibody reaction was revealed using a chemiluminescence ECL detection kit
(Amersham) according to the manufacturer’s instructions. After addition of the appropriate
volume of reagents the membranes were wrapped in cling film (Saran wrap) and placed in an x-ray
film cassette with a sheet of autoradiography film (Kodak) in a dark room and exposed for the
appropriate length of time. The exposed film was then developed in an automatic x-ray film
processor (XOgraph X4, Xograph Imaging Systems Ltd, Gloucestershire).
3.3.12. Freezing Down Cells
Before and after each cloning procedure, cell samples were frozen down and stored in liquid
nitrogen. 1ml of cell solution was placed into a centrifuge tube and centrifuged for 5 minutes at
125G. The supernatant was discarded and 0.5 ml of freeze mix (90% FCS, 10% dimethyl sulphoxide
(DMSO, Sigma) was added to the cell pellet. The mixture was then transferred to a freezing vial,
labelled and placed in a cryo-freezing container at -80oC for no longer than one week prior to
being transferred to liquid nitrogen.

Development and Evaluation of Novel Monoclonal Antibodies to FR-α and FPGS
104
3.3.13. Weaning into R20 Medium
Positively responding clones were transferred into 6 well plates and weaned into R20 medium by
slowly decreasing the percentage of R20/condimed medium. Throughout the weaning process, a
well containing cells in R20/condimed medium was grown in the event that the weaned cells could
not survive in the lower concentrations of condimed medium. The weaning process duration can
range from 2 weeks to a few months depending upon the hybridomas response to the reduction in
condimed. Once the cells were successfully weaned into R20, approximately 50 ml of cell
suspension was grown in a 75 cm2 tissue culture flask, frozen down and stored in liquid nitrogen,
and approximately 70 ml of cell suspension was grown in a 162cm2 tissue culture flask as a pre-
production batch and left to overgrow for further testing.
3.4. Antibody Validation and Characterisation
3.4.1. Characterisation of Weaned Clones via Immunohistochemistry
Once the clones had been weaned into basic R20 media, they were tested via IHC using the
Novolink polymer kit on large panels of formalin fixed, paraffin embedded normal and tumour
tissues in order to fully assess the expression of the proteins on a wide variety of tissues. A panel
of normal and tumour samples were obtained from Novocastra archives. In addition, any tumour
samples stored in the Novocastra tissue archives thought to be of interest were also added to the
panel. Archival ovarian adenocarcinoma samples collected in connection with clinical trials of
pemetrexed which had appropriate ethical approval for use in this study were also added to the
panel as ovarian cancer is the main focus in this study. The results of these panels could then be
compared with literature on known expression of the proteins to assess the specificity of the
antibody.
3.4.2. Characterisation of Weaned clones via Western Blot Analysis
WB was performed on an extended panel of both positive and negative cell lines to further
characterise the antibodies and support the IHC studies as described in section 3.3.4. A large cell
line panel was used to assess the FPGS antibody as there was no IHC data to compare it to and
thus it relied heavily on the data obtained from WB analysis for characterisation.

Development and Evaluation of Novel Monoclonal Antibodies to FR-α and FPGS
105
3.4.3. Further Characterisation
In addition to IHC and WB analysis, the FR-α and FPGS antibodies were also assessed for their
suitability for use with no pre-treatment and alternative pH pretreatments to ensure the selected
pretreatment was still the most suitable. They were assessed for use with PBS buffer as this is
commonly used in America and in addition they were assessed for use on the automated Bond IHC
system. Most of these tests were performed to ensure the antibody was suitable as a marketable
product both in the UK and worldwide. Once all criteria had been satisfied the antibodies were
isotyped (Isostrip Mouse Isotyping Kit) according to the manufacturers instructions and sent for
review by both the managing director and Dr. Gary Hoffman, a consultant pathologist who
analysed the staining on the sections and the appropriate literature. Once satisfied the antibody
was specific for the target it was signed off and transferred to the production department where
additional stability tests would be performed in preparation for mass production.
3.4.4. Epitope Mapping
Finally, epitope mapping via the use of a peptide array was used to fully characterize the
antibodies and identify the epitope present on the target sequence. It was decided to use the
Cancer Research UK (CRUK) resource to generate the peptide array immobilised on a cellulose
membrane to map the FR-α and FPGS antibody epitopes. This technique used a multipeptide
synthesiser (Intavis) on which arrays of up to 600 peptides could be generated. The FR-α and FPGS
target sequences were sent to CRUK and overlapping peptides of 12 amino acids in length,
overlapping by one residue each time were generated and immobilised on to the membranes.
The advantage of use of this resource is the ease of the methods used, applying a simple WB
based technique for detection of positive peptides, it is also extremely fast and highly accurate
results are obtained. The disadvantages of this method are that peptide array generation is costly
and the coding sequence must be known. It was decided to use this technique primarily due to
time limitations as other techniques may take as long as 6 months to complete and the results of
this experiment would be valuable for completion and conclusion of this part of the work.
Two FPGS membranes were received and three FR-α membranes, suitable for use with five
different antibodies in total. It was decided to use one of the membranes to map the mOV 18
antibody in addition to the FR-α antibody to observe the similarities/differences between the
epitope recognition sites. The additional membrane was used to map the LK26 antibody.

Development and Evaluation of Novel Monoclonal Antibodies to FR-α and FPGS
106
The membranes were treated in the same way to the techniques used in WB as described in
section 3.3.4, beginning with the blocking step.
After treatment and development the membranes were stained with Ponceau S, an anionic
sodium salt of a diazo dye which binds to the basic amino groups of proteins in an acid solution. It
binds to primarily histidine, arginine and to a lesser extent lysine residues. Not all peptides react
with the dye as not all sequences contain these amino acids, however it was possible to accurately
infer the position of the other peptide spots based upon the positions of the visible peptides
(Thompson-Hayner, Driscoll, Ferayorni, Spies-Karotkin, & Jauregui, 1982).

Development and Evaluation of Novel Monoclonal Antibodies to FR-α and FPGS
107
3.5. Results – Hybridoma Technology
3.5.1. Mouse Immunisation and Polyclonal Assessment
3.5.1.1. FPGS Immunisations/Polyclonal Assessment
Five mice were successfully immunised with soluble FPGS2 pET41 protein, as this was the initial
project it was decided that all mice should be fused as a training exercise. However, further
studies highlighted a problem and all immunised mice subsequently failed, this will be discussed in
detail later in this chapter. The initial five mice appeared to have responded well, LN appearing to
have the best response via WB. The best responding mouse was then assessed via IHC on ovarian
and colon adenocarcinomas, term placenta and normal colon to assess the polyclonal response,
using Tris-EDTA for antigen retrieval. The staining observed was cytoplasmic and punctuate and
was inferred to be correct as there was no IHC data to compare it to. For this antibody WB results
were heavily relied upon as confirmation that the staining seen was correct. The staining was
thought to be correct as it was in the correct compartment within the cell and punctuate staining
was indicative of the type of staining expected from a cytoplasmic/mitochondrial enzyme (Figure
3-8). A single band was observed via WB at 60 kDa so it was thought that the positive staining
confirmed by a band at the correct molecular weight was confirmation of antibody specificity
(Figure3-7). Fusions were performed on all five mice, two clones reached the third and final
cloning stage before a cross reactivity issue and a gap in the screening procedure were identified,
this is discussed in detail in section 3.5.2.1. The following figures show the staining and WB
immunoreactivity observed, however, these clones were discarded at the final stage.

Development and Evaluation of Novel Monoclonal Antibodies to FR-α and FPGS
108
Figure 3-7: AP WB of FPGS polyclonal bleed. FPGS2 pET 41 polyclonal bleed. Note the band at the expected MW
of FPGS at 60 kDa and absence of band in the pre immune bleed. (-C - negative control lane, LN – Left Notch bleed).
Figure 3-8: Polyclonal and monoclonal comparison. IHC photographs of a paraffin embedded ovarian
adenocarcinoma sample stained with FPGS2 pET 41 LN bleed and third clone. Note the cytoplasmic punctuate staining
seen which was the expected FPGS staining pattern.
A further five mice were successfully immunised with FPGS3 pET 41 refolded protein, all five mice
were found to show a very weak response via both IHC and WB.

Development and Evaluation of Novel Monoclonal Antibodies to FR-α and FPGS
109
Given the problems highlighted above, five mice were also immunised with FPGS2 pET 32 refolded
protein, as it was found that immunisation with refolded rather than soluble proteins appeared to
eliminate the cross reaction problem described in section 3.5.2.1. All mice appeared to have
responded via WB and IHC, 2RN giving the strongest and most specific response. All mice were
selected for fusion.
In total 15 mice were immunised for the FPGS project and 15 fusions were performed.
3.5.2. FR-α Immunisations/Polyclonal Assessment
Initially five mice were successfully immunised with FR-α pET41 soluble protein, the polyclonal
assessment indicated only one strongly positively responding mouse (BN) so a further five were
immunised with FR-αF2 soluble protein. This was performed before the FPGS cross reactivity
problem was observed. Upon the bleed assessment for FR-αF2 it was observed that a single band
at 60 kDa appeared to be present on these WB’s. As the expected molecular weight for FR-α is 40
kDa this was the first indication that there may be a problem with the antibodies and initiated an
investigation into determination of the specificity of the antibodies via WB studies, described in
the following section. At first it was thought the proteins may have somehow become mixed up,
however subsequent tests ruled this out. In light of this problem highlighted with the FPGS
protein/antibodies and the possibility that it may also be affecting the FR-α samples, a further five
mice were immunised with the FR-α pET 32 refolded construct as this was thought to prevent
previous cross reaction problems. Again, in total 15 mice were immunised and 15 fusions
performed for the FR-α project. In the FR-α pET 41 immunisations, bleed BN was selected for
further IHC analysis, citrate buffer (pH6) was found to be the most suitable antigen retrieval
solution and IHC analysis on normal colon and ovarian adenocarcinoma showed
membrane/cytoplasmic punctuate staining (Figure 3-9). On further analysis this staining pattern
was seen to be strikingly similar to that of the staining observed for the FPGS2 bleeds.

Development and Evaluation of Novel Monoclonal Antibodies to FR-α and FPGS
110
Figure 3-9: FR-α polyclonal bleed. IHC photograph of FR-α pET 41 NN polyclonal bleed on normal colon (top) and
ovarian adenocarcinoma (bottom) x20. Note the membrane/cytoplasmic punctuate staining and the similarity in
staining with the FPGS LN bleed previously shown.

Development and Evaluation of Novel Monoclonal Antibodies to FR-α and FPGS
111
3.5.2.1. Western Blot Studies to Identify the Cause of Cross-Reactivity
The first indication of a cross reactivity problem was the assessment of the FR-αF2 bleeds which all
appeared to have single band reactivity with a 60 kDa protein. As the expected size of FR-α was 40
kDa and each bleed was producing a specific single band it appeared there may be a problem. It is
unusual for a bleed to give a single band under normal circumstances as many bands are usually
present due to the polyclonal nature of the serum. The first time this occurred with the FPGS
protein it was considered to be fortunate, however, concerns were raised when it also occurred
when the FR-α bleeds were assessed.
This had not been highlighted earlier due to the fact that the correct molecular weight for FPGS is,
in fact 60 kDa. It was decided that the FPGS antibodies, which by this stage were 3rd clones,
should be tested via WB studies to ensure they were recognising the correct protein.
At this stage it was thought that the immunoreactivity of both proteins may be due to either an
error in molecular biology where the proteins may have become mixed up, this may have occurred
at Novocastra or at the CBC during immunisation. Another hypothesis was cross reaction due to
the same polylinker region being present in both protein constructs.
The first step in investigation of this was to test this hypothesis and collect recombinant protein
samples in different constructs previously developed at Novocastra.
Proteins generated in the following constructs were collected;
pET 41 (GST)
pET 21 (Simple vector with no tag)
pET 32 (Tx)
pET 41s (GST with different flanking regions)
pET 32s (Tx with different flanking regions)
A simple ELISA was initially performed, coating an ELISA plate with each of the above proteins and
adding the FPGS2 BN 3rd clone. This was inconclusive as reactivity was observed with the both the
FPGS2 pET41 and FR-α pET 41 soluble proteins but only weak reactivity with the other protein

Development and Evaluation of Novel Monoclonal Antibodies to FR-α and FPGS
112
constructs. This may have indicated that the proteins were mixed up but further studies were
required.
WB was then performed using the same proteins; AP gave a very weak signal so it was decided to
use ECL. The result was surprising as it appeared that a single, 60 kDa band of immunoreactivity
was present in all the protein samples tested to varying degrees. As the target sequences were
different, the vector flanking regions of each construct were aligned to determine whether there
were similarities. Again, this proved inconclusive as the flanking regions differed significantly. The
most similar flanking region was in the pET 32 construct tested, however the signal did not appear
to be any stronger with this protein. As this band was in other proteins which could not have been
mixed up, the possibility of the proteins contaminating one another was not explainable in light of
this result, although the strongest reactivity was still seen with both the FR-α and FPGS pET41
soluble constructs. In fact, strongest reactivity was observed between the FR-α pET41 soluble
protein and the FPGS antibody. Similarly when another BLAST search was performed, aligning the
FR-α and FPGS sequences, no regions of homology were identified. It was then hypothesized that
the antibodies may just have a very high affinity for ‘sticky proteins’, ovalbumin and bovine serum
albumin are known to be extremely ‘sticky’ and had not been produced using vectors so they were
tested but no signal was observed for either protein.
Recombinant enterokinase enzyme was used to cleave the proteins into two fragments to identify
which region of the proteins the cross reaction occurred, as it cleaved the proteins before the tag,
it could be determined whether the epitope being recognised by the FPGS antibody is from the
vector sequence alone or part of the protein and vector sequence. Bands were observed
throughout the whole sequence, although it wasn’t clear how well the enterokinase enzyme kit
had worked as the protein was degraded. An anti GST antibody was used and gave a signal in the
cleaved protein where there was no signal using the FPGS antibody at the corresponding
molecular weight so it could be concluded the cross reaction was not due to the tagged region.
Another theory may have been that this was a WB artefact so two methods were applied to test
this theory. Both the FR-α and FPGS soluble pET41 proteins were tested against dilutions of
antibody to determine whether one signal reduced as the dilution of antibody increased, however
both signals stayed as strong as each other so the artefact theory was rejected.
The possibility of the positive signal being an artefact caused by the presence of SDS was also
examined. A ‘dot blot’ WB was performed with no SDS present and the proteins in their native

Development and Evaluation of Novel Monoclonal Antibodies to FR-α and FPGS
113
conformation. Again, all protein samples were tested but a signal was only observed
corresponding to the FR-α and FPGS soluble pET41 proteins.
While the blotting studies were being performed, it had been decided that new recombinant
proteins prepared in different vectors should be generated as screening antigens, as this cross
reaction problem had highlighted a gap in the screening protocol not previously observed. FR-α
and FPGS pET 32 constructs were successfully generated although this time they could not be
produced in their soluble form and required refolding.
Once these proteins were prepared they were tested with the FPGS clone and surprisingly, neither
protein showed any immunoreactivity with the FPGS antibody. As the target region was the same
it was concluded that all projects should be discarded as the results obtained could not be
considered accurate. Although not tested, it is now hypothesized that as both proteins are
cysteine rich, the E.coli may have produced soluble stress proteins, possibly a heat shock protein
which contaminated the soluble protein fractions in both the FR-α and FPGS pET41 soluble
recombinant proteins. The protein produced is likely to be microbial heat shock protein 60
(HSP60), similar to the human equivalent, produced in response to stress (Chen et al., 1998;
Kaufmann et al., 1991). Although not previously reported, this theory would also explain the
reason for signals being observed at varying levels in other protein samples, possibly dependent
upon the number of cysteine residues and relating to the level of stress placed upon the cells to
produce the proteins. As the main focus of the project was the generation of antibodies this was
not investigated any further and focus was placed upon new immunisation schedules, using the
new recombinant proteins with the target regions only for screening as this would ensure only the
target region was in common. This may also be supported by the absence of signal in the GST
protein as this is a water soluble protein which is not cysteine rich and would not have caused the
E.coli cells as much stress to produce.
Similar problems have been seen at Novocastra previously, although the reason for the
observations were unknown, a 27 kDa protein thought to be Heat shock protein 27 (HSP27) had
been found to commonly contaminate soluble protein samples and was taken into consideration
when producing recombinant proteins of 27kDa. It is unfortunate that in this case the contaminant
happened to be the same molecular weight as the target which misled us to believe the results
observed were correct.
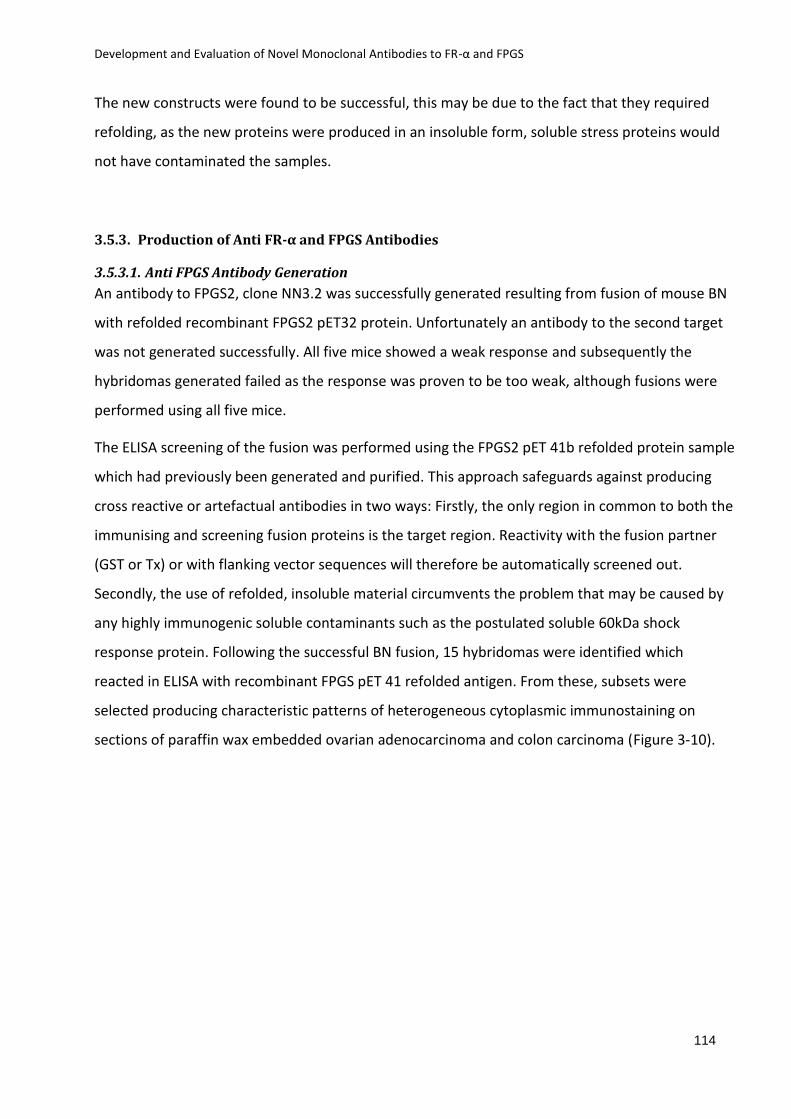
Development and Evaluation of Novel Monoclonal Antibodies to FR-α and FPGS
114
The new constructs were found to be successful, this may be due to the fact that they required
refolding, as the new proteins were produced in an insoluble form, soluble stress proteins would
not have contaminated the samples.
3.5.3. Production of Anti FR-α and FPGS Antibodies
3.5.3.1. Anti FPGS Antibody Generation
An antibody to FPGS2, clone NN3.2 was successfully generated resulting from fusion of mouse BN
with refolded recombinant FPGS2 pET32 protein. Unfortunately an antibody to the second target
was not generated successfully. All five mice showed a weak response and subsequently the
hybridomas generated failed as the response was proven to be too weak, although fusions were
performed using all five mice.
The ELISA screening of the fusion was performed using the FPGS2 pET 41b refolded protein sample
which had previously been generated and purified. This approach safeguards against producing
cross reactive or artefactual antibodies in two ways: Firstly, the only region in common to both the
immunising and screening fusion proteins is the target region. Reactivity with the fusion partner
(GST or Tx) or with flanking vector sequences will therefore be automatically screened out.
Secondly, the use of refolded, insoluble material circumvents the problem that may be caused by
any highly immunogenic soluble contaminants such as the postulated soluble 60kDa shock
response protein. Following the successful BN fusion, 15 hybridomas were identified which
reacted in ELISA with recombinant FPGS pET 41 refolded antigen. From these, subsets were
selected producing characteristic patterns of heterogeneous cytoplasmic immunostaining on
sections of paraffin wax embedded ovarian adenocarcinoma and colon carcinoma (Figure 3-10).

Development and Evaluation of Novel Monoclonal Antibodies to FR-α and FPGS
115
Figure 3-10: FPGS polyclonal bleed. IHC photograph of FPGS pET 32 NN polyclonal bleed on normal colon (top)
and ovarian adenocarcinoma (bottom) x20. Note the cytoplasmic staining and the difference between the staining
seen with this bleed compared with the cross reactive bleed shown previously (Figure 3-8).
3.5.4. FPGS Expression via Western Blot Analysis
The selected FPGS antibodies were tested for their ability to react specifically with the human
FPGS protein in a large panel of various different cell lines by WB as shown in section 3.5.4. The
FPGS antibody produced from clone BN3.2 detected a single band of approximately 60 kDa in the
majority of cell lines tested with varying levels of expression observed. An antibody to β-actin was
used to correct for variations in loading between samples.

Development and Evaluation of Novel Monoclonal Antibodies to FR-α and FPGS
116
3.5.4.1. FPGS Extended Panel Figure 3-11: FPGS extended panel WB. Representative WB (n=3) showing detection of FPGS WT protein on a
panel of cell lines via use of the generated FPGS NN3.2 antibody. An antibody to β-actin (42kDa) was used as a
loading control to correct for variations in loading between samples.
Moderate expression was observed in all samples tested with the exception of the A-549 lung
carcinoma and MCF7 breast cancer cell lines which displayed weaker expression of FPGS relative
to the other samples. Slightly higher expression of FPGS was seen in the mesothelioma samples
tested, although loading of these samples also appeared to be slightly higher.

Development and Evaluation of Novel Monoclonal Antibodies to FR-α and FPGS
117
Figure 3-12: FPGS extended panel (2) WB. Representative WB (n=3) showing detection of FPGS WT protein by
WB on a panel of cell lines via use of the generated FPGS NN3.2 antibody. An antibody to β-actin was used as a
loading control to correct for variations in loading between samples.
Weak expression was observed in the A-375 melanoma and SJSA osteosarcoma samples tested,
moderate expression was seen in the colon adenocarcinoma, B-cell lymphoma and neuroblastoma
samples tested.

Development and Evaluation of Novel Monoclonal Antibodies to FR-α and FPGS
118
3.5.4.2. FPGS Leukaemia Panel Figure 3-13: FPGS leukaemia panel WB. Representative WB (n=3) showing detection of FPGS WT protein by WB
on a panel of cell lines via use of the generated FPGS NN3.2 antibody. An antibody to β-actin (42kDa) was used as a
loading control to correct for variations in loading between samples.
Expression was observed in all samples tested, moderate expression was observed in leukaemia
cell lines Jurkat, CCRF-CEM, TK6, PFI-285, embryonic kidney ECR-293 (Figure 3-13) and the ovarian
carcinoma IGROV-1 positive control. Stronger expression was seen in Pre-B and Molt 4 cells.
3.5.5. FPGS Expression in Normal and Inflamed Tissues
Immunoreactivity with the NN3.2 FPGS MAb was detected in a wide range of normal and inflamed
human tissues. Positively staining samples included colon, kidney, liver, myocardium, tonsil, bone
marrow and stomach. Negative samples included cerebellum and spinal cord (Figure 3-14).
The reactivity of FPGS antibody, clone NN3.2, on a panel of normal and inflamed tissues is
summarised in Table 3-3.

Development and Evaluation of Novel Monoclonal Antibodies to FR-α and FPGS
119
Table 3-3: Immunostaining for wild-type FPGS NN 3.2 on normal and inflamed tissues.
Tissue Morphological Features FPGS cytoplasmic staining intensity
Adrenal Medulla
Cortex
Zona Granulosa
Strong
Weak
Negative
Inflamed appendix Lamina Propria/Crypts
Submucosa
Moderate
Weak-Negative
Bowel, large Brush Border/Crypts
Smooth Muscle
Moderate-Strong
Moderate
Bowel, small Villi/Crypts
Smooth Muscle
Moderate
Weak-Negative
Brain, cerebellum All elements Negative
Cervix Epithelium.Glands
Endothelium
Weak-Negative
Weak
Gall bladder Submucosa
Muscle Layers
Moderate-Weak
Weak
Kidney Glomeruli
Convoluted tubules
Kidney vasculature
Negative
Weak
Negative
Kidney Glomeruli
Convoluted tubules
Kidney vasculature
Weak-Negative
Moderate
Weak
Liver Hepatocytes/Parenchynal Cells
Endothelium
Moderate-Weak
Weak
Inflamed lung, peripheral Alveolar Macrophages
All elements
Moderate-Weak
Negative
Muscle, skeletal All elements Negative
Myocardium Muscle
Endothelium
Strong-Moderate
Weak
Ovary Stroma/connective tissue
Ovary vasculature
Weak
Weak-Negative
Placenta (term) Syncito/Cytotrophoblasts
Mesenchymal cells
Placental vasculature
Moderate-Strong
Moderate
Moderate
Inflamed skin All elements Moderate-Weak
Spinal cord All elements Negative
Testis Seminiferous tubules
Sertoli/Leydig Cells
Negative
Weak
Inflamed tonsil Follicles
Epithelia
Strong
Moderate-Weak
Ulcerative colitis All elements Moderate
Umbilical cord All elements Weak-Negative
Uterus (endometrium) All elements Moderate

Development and Evaluation of Novel Monoclonal Antibodies to FR-α and FPGS
120
Figure 3-14: FPGS normal panel. Cytoplasmic immunohistochemical staining for FPGS using clone NN 3.2 in
paraffin embedded normal tissues: a) adrenal gland; strong reactivity in the medulla, weaker reactivity in the cortex
and negativity in the zona granulosa (x20); b) gall bladder; moderate- weak reactivity in the submucosa and weak
reactivity in the muscle layers (x10); c) kidney; moderate reactivity in the tubules, weak/negative reactivity in the
glomeruli and weak reactivity in the vascular structures (x10); d) liver; moderate-weak reactivity in hepatocytes,
parencymal cells and endothelium (x10); (e) myocardium; strong-moderate reactivity in muscle and weak reactivity in
endothelium (x20); f) placenta; moderate-strong reactivity in trophoblast layers, moderate reactivity in vasculature
and mesenchymal cells (x40); g) ileum; moderate reactivity in villi/crypts, weak reactivity in smooth muscle layers
(x20); h) colon; moderate-strong reactivity in brush border/crypts, moderate reactivity in smooth muscle layers (x40).

Development and Evaluation of Novel Monoclonal Antibodies to FR-α and FPGS
121
3.5.6. FPGS Expression in Benign and Malignant Tissues
The reactivity of the FPGS antibody, clone NN3.2, on a panel of formalin-fixed and paraffin-
embedded tumour tissues samples is described in Table 3-4, this panel included tumour tissue
microarrays (TMA’s). The staining pattern of FPGS cytoplasmic positivity within each case was also
heterogeneous. Strongly positive cytoplasmic staining for FPGS in tumour cells was noted in the
majority of samples tested; lower staining intensity was also observed in adjacent normal tissue
and mixed germ cell choriocarcinoma, fibrothecoma, gangliobeuroma and solitary fibrous tumour
omentum (Figure 3-15).

Development and Evaluation of Novel Monoclonal Antibodies to FR-α and FPGS
122
Table 3-4: Immunostaining for FPGS on a range of benign and malignant tissues
Tissue FPGS cytoplasmic staining intensity
Bone Marrow Moderate
Bone Marrow Moderate-Weak
GIST Weak-Negative
Hairy Cell Leukaemia Negative
B-cell Lymphoma Moderate (cell aggregates)- Weak
B-cell Lymphoma Strong (cell aggregates)
Liver Moderate-Weak
Breast carcinoma Moderate-Weak
Melanoma Strong-Weak
Melanoma Weak
Mesothelioma Strong-Moderate (n=2)
Mesothelioma Moderate
Mesothelioma Weak-Negative
Breast Carcinoma Moderate-Weak
Breast Carcinoma Strong-Weak
Ovary Serous carcinoma Weak-Negative (n=3)
Ovary Serous carcinoma Weak-Moderate
Ovary Serous carcinoma Moderate-Negative (n=2)
Ovary Adenocarcinoma Weak-Negative
Ovary Adenocarcinoma Moderate-Weak (n=2)
Ovary Adenocarcinoma Moderate
Ovary Adenocarcinoma Strong (n=2)
Ovary Adenocarcinoma Strong-Moderate (n=2)
Colon Adenocarcinoma Strong-Moderate
Colon Adenocarcinoma Weak-Negative
Cholangiocarcinoma Strong-Moderate
Placenta A (term) Weak-Negative
Placenta B (mid-term) Weak-Negative
Placenta Moderate
Hepatoma Strong-Moderate
Fibrothecoma Negative
Ovary Clear cell Strong-Weak
Ovary thecoma Moderate
Ovary granulosa Weak-Negative
Gangliobeuroma Negative
Squamous Carcinoma of Cervix Strong
Bladder transitional cell carcinoma Strong
Bladder Transitional Cell Carcinoma Weak-Negative
Pancreatic Adenocarcinoma Negative
Gastric adenocarcinoma Weak
Renal cell carcinoma Negative
Renal cell carcinoma Weak-Negative
Prostate adenocarcinoma Moderate-Weak
Prostate adenocarcinoma Strong-Moderate
Thyroid papillary carcinoma Strong-Moderate
Thyroid follicular adenocarcinoma Moderate
Liver cell adenocarcinoma Moderate-Weak
Adrenal Oncocytoma Moderate
Desmoplastic SRCT Strong-Moderate
Ewings Sarcoma Weak-Negative
Basal Cell carcinoma Strong

Development and Evaluation of Novel Monoclonal Antibodies to FR-α and FPGS
123
Figure 3-15: FPGS tumour panel. Cytoplasmic immunohistochemical staining for FPGS using clone NN3.2 in a
selection of paraffin embedded benign and tumour tissues) a) Colon adenocarcinoma; strong reactivity in tumour
(x20); b) colon adenocarcinoma; strong reactivity in tumour (x40) c) B-cell lymphoma; moderate reactivity in tumour
cell aggregates (x20); d) Bone marrow; moderate reactivity in cell aggregates (x20); e) breast carcinoma; moderate-
weak reactivity in tumour (x10); f) mesothelioma; strong-moderate reactivity in tumour (x10); g) ovarian
adenocarcinoma moderate reactivity in tumnour islands (x10); h) ovarian adenocarcinoma; strong-moderate reactivity
in tumour islands (x10).

Development and Evaluation of Novel Monoclonal Antibodies to FR-α and FPGS
124
3.5.7. FPGS Further Characterisation
The FPGS antibody was found to be suitable for use with both TBS and PBS buffers, it was also
found to be suitable for use with both the ABC, Novolink™ polymer kit and a Bond Max™
automated immunostainer (Leica Biosystems, UK). Tris-EDTA was confirmed to be the best
method of unmasking as Citrate produced too little unmasking, as did proteinase K. No unmasking
was found to produce no staining at all (Figure 3-16). The antibody isotype was determined to be
Ig G1 κ.
Figure 3-16: FPGS pre-treatment evaluation. Immunohistochemical staining for FPGS using clone NN3.2 in a
selection of paraffin embedded ovarian adenocarcimoma samples with different pretreatments. Citrate (Cit) a,d&g;
Tris EDTA (TE) b,e&h; No pre-treatment (NP) c,f&i. Note the lack of staining in the NP samples, weak staining in the
CIT samples and optimal staining seen in the TE treated samples.

Development and Evaluation of Novel Monoclonal Antibodies to FR-α and FPGS
125
3.5.8. FPGS Epitope Mapping
Figure 3-17: FPGS epitope mapping. FPGS membrane (top) and the same membrane stained with Ponceau-S
(bottom) to observe the location on the peptide array recognised by clone NN 3.2.
Seven peptides reacted with the NN 3.2 antibody, corresponding to the following peptides on the
array as determined from the data sheet provided with the membranes. One peptide was positive
(N29), followed by two negative peptides (N30, O1), the final six peptides showing reactivity were
consecutive (O2-O8) (Figure 3-18).

Development and Evaluation of Novel Monoclonal Antibodies to FR-α and FPGS
126
Figure 3-18: FPGS epitope. Peptide sequences corresponding to the spots showing reactivity with the FPGS NN 3.2
antibody. Positive sequences are shown in blue and negative adjacent peptides in red. Most likely epitope is shown in
green.
N29 E-K-I-A-W-Q-K-G-G-I-F-K
N30 K-I-A-W-Q-K-G-G-I-F-K-Q
O 1 I-A-W-Q-K-G-G-I-F-K-Q-G
O 2 A-W-Q-K-G-G-I-F-K-Q-G-V
O 3 W-Q-K-G-G-I-F-K-Q-G-V-P
O 4 Q-K-G-G-I-F-K-Q-G-V-P-A
O 5 K-G-G-I-F-K-Q-G-V-P-A-F
O 6 G-G-I-F-K-Q-G-V-P-A-F-T
O 7 G-I-F-K-Q-G-V-P-A-F-T-V
O 8 I-F-K-Q-G-V-P-A-F-T-V-L
O 9 F-K-Q-G-V-P-A-F-T-V-L-Q
3.5.8.1. Anti FR-α Antibody Generation
An antibody to FR-α was successfully generated from mouse BN 3.2, surprisingly resulting from the
FR-α pET 41 soluble recombinant protein construct which was found to contain large amounts of
contaminating 60kDa protein. All 14 other fusions resulted in a weak response or the antibodies
generated were found to be cross reactive. The initial five fusions generated a large number of
positive hybridomas, however they were screened using protein containing the contaminant and it
is likely that all hybridomas were recognising this rather than the target. Later fusions resulted in
few positive wells when screened with the new FR-α pET32 refolded protein, despite the
polyclonal bleeds appearing to recognise a band at 40 kDa when blotted. The FR-α 3 mice fusions
were also unsuccessful with few positives resulting from fusions. The fusion which generated the
successful antibody was the last of the FR-α pET41 soluble fusions performed and screened using
the FR-α pET32 refolded protein, as at this stage the new protein had been generated. This fusion
resulted in only one positive hybridoma from beginning to end. This is highly unusual as, typically
fusions result in 50-100 positive hybridomas at fusion screen. Attempts to generate other positive
clones were made, however no more surviving positive clones could be generated. Characteristic
patterns of heterogeneous cytoplasmic and membrane immunostaining on sections of paraffin
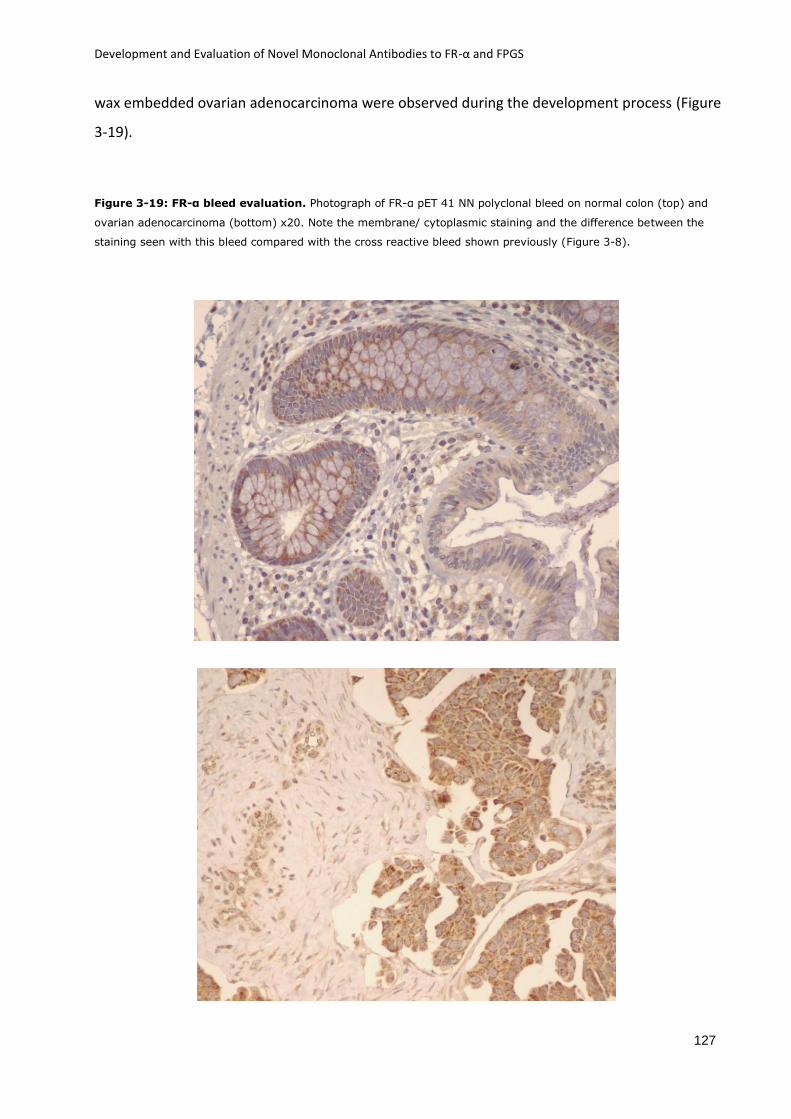
Development and Evaluation of Novel Monoclonal Antibodies to FR-α and FPGS
127
wax embedded ovarian adenocarcinoma were observed during the development process (Figure
3-19).
Figure 3-19: FR-α bleed evaluation. Photograph of FR-α pET 41 NN polyclonal bleed on normal colon (top) and
ovarian adenocarcinoma (bottom) x20. Note the membrane/ cytoplasmic staining and the difference between the
staining seen with this bleed compared with the cross reactive bleed shown previously (Figure 3-8).
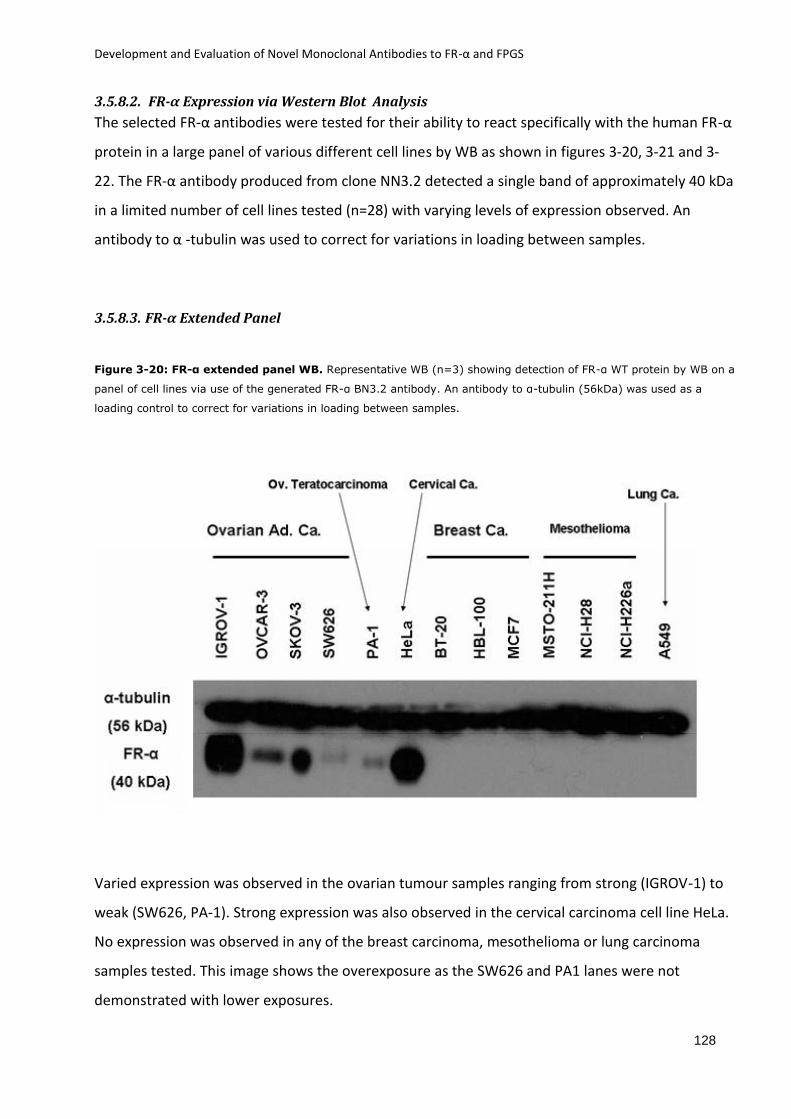
Development and Evaluation of Novel Monoclonal Antibodies to FR-α and FPGS
128
3.5.8.2. FR-α Expression via Western Blot Analysis
The selected FR-α antibodies were tested for their ability to react specifically with the human FR-α
protein in a large panel of various different cell lines by WB as shown in figures 3-20, 3-21 and 3-
22. The FR-α antibody produced from clone NN3.2 detected a single band of approximately 40 kDa
in a limited number of cell lines tested (n=28) with varying levels of expression observed. An
antibody to α -tubulin was used to correct for variations in loading between samples.
3.5.8.3. FR-α Extended Panel
Figure 3-20: FR-α extended panel WB. Representative WB (n=3) showing detection of FR-α WT protein by WB on a
panel of cell lines via use of the generated FR-α BN3.2 antibody. An antibody to α-tubulin (56kDa) was used as a
loading control to correct for variations in loading between samples.
Varied expression was observed in the ovarian tumour samples ranging from strong (IGROV-1) to
weak (SW626, PA-1). Strong expression was also observed in the cervical carcinoma cell line HeLa.
No expression was observed in any of the breast carcinoma, mesothelioma or lung carcinoma
samples tested. This image shows the overexposure as the SW626 and PA1 lanes were not
demonstrated with lower exposures.

Development and Evaluation of Novel Monoclonal Antibodies to FR-α and FPGS
129
Figure 3-21: FR-α extended panel (2) WB. Representative WB (n=3) showing detection of FR-α WT protein by WB
on a panel of cell lines via use of the generated FR-α BN3.2 antibody. An antibody to α-tubulin (56kDa) was used as a
loading control to correct for variations in loading between samples.
Expression was observed in one colon carcinoma cell line (CaCo2), and the ovarian carcinoma
positive control IGROV-1. No expression was observed in two other ovarian adenocarcinoma
samples, B-cell lymphoma, melanoma, osteosarcoma or neuroblastoma samples tested.

Development and Evaluation of Novel Monoclonal Antibodies to FR-α and FPGS
130
3.5.8.4. FR-α Leukaemia Panel
Figure 3-22: FR-α leukaemia panel WB. Representative WB (n=3) showing detection of FR-α WT protein by WB on
a panel of cell lines via use of the generated FR-α BN3.2 antibody. An antibody to α-tubulin (56kDa) was used as a
loading control to correct for variations in loading between samples.
Expression was observed only in the ovarian carcinoma IGROV-1 positive control and ECR-293
embryonic kidney sample. No FR-α expression was seen in any of the leukaemia samples tested.
Again the overexposure is shown to illustrate the reactivity seen in the ECR 293 which is not visible
in lower exposures.
3.5.9. FR-α Expression in Normal and Inflamed Tissues
Immunoreactivity with the BN3.2 FR-α MAb was detected in a limited number of normal and
inflamed human tissues. Syncitial trophoblasts of the placenta, the single layer of epithelium lining
the ovary follicle and proximal kidney tubules were positive and the remaining samples were
negative (Figure 3-23). The reactivity of FR-α antibody, clone BN 3.2, on a panel of normal and
inflamed tissues is summarised below.

Development and Evaluation of Novel Monoclonal Antibodies to FR-α and FPGS
131
Table 3-5: Immunostaining for wild-type FR-α BN 3.2 on normal and inflamed tissues.
Tissue Morphological Features FR-α membrane/cytoplasmic
staining intensity
Adrenal All elements Negative
Inflamed appendix All elements Negative
Bowel, large All elements Negative
Bowel, small All elements Negative
Brain, cerebellum All elements Negative
Cervix All elements Negative
Gall bladder All elements Negative
Kidney Glomeruli
Convoluted tubules
Kidney vasculature
Negative
Weak
Negative
Kidney Glomeruli
Convoluted tubules
Kidney vasculature
Negative
Moderate
Negative
Liver All elements Negative
Inflamed lung, peripheral All elements Negative
Muscle, skeletal All elements Negative
Myocardium All elements Negative
Ovary Stroma/connective tissue
Inner follicular epithelia
Peritoneal surface epithelia
Ovary vasculature
Negative
Moderate-Strong
Negative
Negative
Placenta (term) Syncito/Cytotrophoblasts
Mesenchymal cells
Placental vasculature
Moderate-Strong
Negative
Negative
Inflamed skin All elements Negative
Spinal cord All elements Negative
Testis All elements Negative
Inflamed tonsil All elements Negative
Ulcerative colitis All elements Negative
Umbilical cord All elements Negative
Uterus (endometrium) All elements Negative

Development and Evaluation of Novel Monoclonal Antibodies to FR-α and FPGS
132
Figure 3-23: FR-α normal panel. Membrane immunohistochemical staining for FR-α using clone BN 3.2 in paraffin
embedded normal tissues: a) ovary (inclusion cyst); strong reactivity in debri contained within cyst and epithelia lining
it (x4); b) strong reactivity in epithelia lining ovarian inclusion cyst (x10); c) kidney; weak reactivity in tubules (x20);
d) placenta; strong reactivity in trophoblast layers (x20).
3.5.10. FR-α Expression in Benign and Malignant Tissues
The reactivity of the FR-α antibody, clone BN3.2, on a panel of formalin-fixed and paraffin-
embedded tumour tissues samples is detailed in Table 3-5. The staining pattern of FR-α
cytoplasmic/membrane positivity within each case was also heterogeneous. Strongly positive
membrane/cytoplasmic staining for FR-α in tumour cells was noted in the majority of ovarian
adenocarcinomas; low staining intensity was observed in endometrial adenocarcinoma, lung
carcinoma, cholangiocarcinoma, thyroid papillary carcinoma, ovarian thecoma and granulosa and,
less frequently in breast carcinomas (Figure 3-24).

Development and Evaluation of Novel Monoclonal Antibodies to FR-α and FPGS
133
Table 3-6: Immunostaining for FR-α on a range of benign and malignant tissues
Tissue FR-α membrane/cytoplasmic staining intensity
Malignant melanoma Negative (n=4)
Endometrial adenocarcinoma Weak (tumour cells)
Pancreatic adenocarcinoma Weak (normal ducts)
Lung carcinoma Weak-Moderate (dysplastic epithelia/tumour)
Lung Squamous cell carcinoma Weak (tumour)
Mesothelioma Negative (n=6)
Breast sarcoma Negative
Leiomyosarcoma Negative
Ewings sarcoma Negative
Rhabdomyosarcoma Negative
Granulocytic sarcoma Negative
Anaplastic lymphoma Negative
Hodgkins lmphoma Negative
Breast Carcinoma Weak (tumour)
Breast Carcinoma Negative (n=6)
Breast Carcinoma Weak (tumour)
Ovary Serous carcinoma Strong
Ovary Serous carcinoma Moderate-Strong (n=4)
Ovary Serous carcinoma Weak
Ovary Adenocarcinoma Strong (n=4)
Ovary Adenocarcinoma Weak
Ovary Adenocarcinoma Weak-Moderate
Ovary Adenocarcinoma Moderate
Ovary Adenocarcinoma Moderate/strong
Ovary Clear cell Negative
Ovary thecoma Weak (tumour)
Ovary granulosa Strong (tumour)
Cholangiocarcinoma Weak (tumour)
GIST Negative
Gastric adenocarcinoma Negative
Bladder transitional cell carcinoma Negative
Renal cell carcinoma Negative (n=2)
Thyroid papillary carcinoma Weak (inner luminal surfaces)
Thyroid follicular adenocarcinoma Negative
Hepatoma Negative
Liver cell adenocarcinoma Negative
Prostate adenocarcinoma Negative (n=2)
Development and Evaluation of Novel Monoclonal Antibodies to FR-α and FPGS
134
Figure 3-24: FR-α tumour panel (1). Membrane immunohistochemical staining for FR-α using clone BN 3.2 in
paraffin embedded ovarian tumour tissues: a) adenocarcinoma of ovary 3c; strong membrane/cytoplasmic expression
in tumour and absence of expression in adjacent normal stroma (x40); b) poorly differentiated adenocarcinoma of the
ovary 3c (x20); c) serous carcinoma of ovary 3b; increased FR-alpha expression on inner luminal surfaces (x20); d)
serous carcinoma of ovary 3c; strong membrane/cytoplasmic expression in tumour and no expression in normal
surrounding stroma (x20); (e) poorly differentiated adenocarcinoma of ovary 3c (x20); f) serous carcinoma of ovary
3c (x40); g) poorly differentiated adenocarcinoma of the ovary 3c (x40); h) poorly differentiated adenocarcinoma of
ovary 3c (x40). The majority of other tumours showed weak expression, thus ovarian adenocarcinomas were selected
for use in the tumour panel.

Development and Evaluation of Novel Monoclonal Antibodies to FR-α and FPGS
135
3.5.11. FR-α Further Characterisation
The FR-α antibody was found to suitable for use with both TBS and PBS buffers, it was also found
to be suitable for use with both the ABC, Novolink™ polymer kit and the Bond Max
immunostainer. Citrate was confirmed to be the best method of unmasking as although very
similar in terms of staining intensity, Tris-EDTA gave cross reaction in areas of cell necrosis,
however, both methods could be deemed suitable. Proteinase K failed to produce a signal. No
unmasking was found to produce no signal in ovarian adenocarcinomas previously positive (Figure
3-25). The antibody isotype was determined to be Ig G1 κ (see 3.4.3 for method).
Figure 3-25: FR-α pre-treatment selection. Immunohistochemical staining for FR-α using clone BN3.2 in a
selection of paraffin embedded ovarian adenocarcimoma samples with different pretreatments. Citrate (Cit) a,d&g
(x40); Tris EDTA (TE) b,e&h; No pre-treatment (NP) c,f&i. Note the lack of staining in the NP samples, optimal
staining in the CIT samples and staining seen in the TE treated samples with increased background.

Development and Evaluation of Novel Monoclonal Antibodies to FR-α and FPGS
136
3.5.12. FR-α Epitope Mapping
Figure 3-26: FR-α epitope mapping. FR-α membrane (top) and the same membrane stained with ponceau-S
(bottom) to observe the location on the peptide array recognised by clone BN 3.2.
Seven peptides in total were highlighted by the BN 3.2 antibody, one peptide (A6) showed
weak reactivity, followed by one negative peptide (A7), followed by six consecutive positive
peptides (A8-A13) (Figure 3-27).

Development and Evaluation of Novel Monoclonal Antibodies to FR-α and FPGS
137
Figure 3-27: FR-α epitope. Peptide sequences corresponding to the spots showing reactivity with the FR-α BN
3.2 antibody. Positive sequences are shown in blue and negative adjacent peptides in red, epitope region is
shown in green. Most likely epitope is shown in green.
A 5 P-E-D-K-L-H-E-Q-C-R-P-W
A 6 E-D-K-L-H-E-Q-C-R-P-W-R
A 7 D-K-L-H-E-Q-C-R-P-W-R-K
A 8 K-L-H-E-Q-C-R-P-W-R-K-N
A 9 L-H-E-Q-C-R-P-W-R-K-N-A
A10 H-E-Q-C-R-P-W-R-K-N-A-C
A11 E-Q-C-R-P-W-R-K-N-A-C-C
A12 Q-C-R-P-W-R-K-N-A-C-C-S
A13 C-R-P-W-R-K-N-A-C-C-S-T
A14 R-P-W-R-K-N-A-C-C-S-T-N
3.5.13. mOV 18 Epitope Mapping
Figure 3-28: mOV18 epitope mapping. FR-α membrane (top) and the same membrane stained with
ponceau-S (bottom) to observe the location on the peptide array recognised by mOV18. This was performed to
compare epitope recognition between the BN3.2 antibody and the other commercially available antibodies
suitable for use on frozen tissue.

Development and Evaluation of Novel Monoclonal Antibodies to FR-α and FPGS
138
Only two peptides showed any reactivity with the mOV18 antibody (I3 & I4), these were
consecutive (Figure 3-29).
Figure 3-29: mOV18 epitope. Peptide sequences corresponding to the spots showing reactivity with the
mOV18 antibody. Positive sequences are shown in blue and negative adjacent peptides in red.
I 2 K-D-V-S-Y-L-Y-R-F-N-W-N
I 3 D-V-S-Y-L-Y-R-F-N-W-N-H
I 4 V-S-Y-L-Y-R-F-N-W-N-H-C
I 5 S-Y-L-Y-R-F-N-W-N-H-C-G
3.5.14. LK26 Epitope mapping
Figure 3-30: LK26 epitope mapping. FR-α membrane (top) and the same membrane stained with ponceau-
S (bottom) to observe the location on the peptide array recognised by LK26.
No peptides in the FR-α target sequence selected were found to react with the LK26
antibody.

Development and Evaluation of Novel Monoclonal Antibodies to FR-α and FPGS
139
3.6. Discussion
3.6.1. FPGS Antibody Development
A monoclonal antibody for the detection of FPGS in formalin-fixed, paraffin embedded
tissues has been developed using established hybridoma technology techniques at
Novocastra laboratories. Clone NN3.2 can also be used routinely in IHC using both ABC and
the more sensitive Novolink Polymer kit. In addition it is also suitable for use in WB and
ELISA. Its application for use on paraffin embedded samples enables expression profiles of
various tissues to be evaluated with ease. It has also been characterised via WB analysis on a
large panel of cell lysates from various tumour types. A large panel of cell lines (n=27) was
used in order to fully characterise the expression of this protein and to determine specificity
as there was little available data to compare it to. A single, 60kDa band was observed in the
samples tested.
3.6.1.1. FPGS WB Analysis
The FPGS antibody was found to be highly specific and was found to produce a single, 60 kDa
band on the extended panel. 27 cell lysates in total were tested and all samples showed
some degree of positivity, ranging from strong to very weak.
FPGS mRNA expression in the ovarian cancer cell lines OVCAR3, SKOV 3 and IGROV-1, the
mesothelioma cell line NCI-H226a, breast cancer cell line MCF-7 (Figure 3-11), the colon
cancer cell lines HCT116 and HT29 (Figure 3-12) and the human T-cell ALL cell lines CCRF-
CEM and MOLT-4 (Figure 3-13) have been previously reported and are consistent with the
data seen in this study (Ross et al., 2000). Similarly, low mRNA expression in the lung
carcinoma cell line A-549 has also been reported which is also consistent with the results
seen as this cell line contained a low level of FPGS expression relative to the other cell lines
tested (Ross et al., 2000).
Strongest expression was observed in the three MPM (Figure 3-11), colon adenocarcinoma
(Figure 3-12), leukaemia and B-cell lymphoma samples tested (Figure 3-13). The findings for
the leukaemia samples are supported by the observation that mRNA transcript levels have
been found to be high in B-lineage leukaemias (Freemantle & Moran, 1997). A polyclonal
antibody has also been used to detect the presence of FPGS in CCRF-CEM leukaemia cells
and was found to specifically recognise distinct immunoreactive bands at 60 kDa via WB

Development and Evaluation of Novel Monoclonal Antibodies to FR-α and FPGS
140
analysis, further supporting the data seen in these validation experiments (Mc Guire, Russell,
& Balinska, 2000). Stronger expression in Pre-B cells and lower expression in CCRF-CEM cells
(Figure 3-13) was also observed and this finding is consistent with two studies assessing
FPGS expression via gene reporter assays in B and T lineage leukaemia cells (Galpin et al.,
1997; Leclerec, Leclerec, Kinser, & Barredo, 2006). Knowledge of lineage specific expression
may assist in the predictive value of the antibodies as determinants of response to
antifolates, particularly MTX which is commonly used in leukaemia patients. This may also be
of value for pemetrexed as recent studies have indicated that this drug may be an effective
antimyeloma agent (Ramirez, Ocio, San Miguel, & Pandiella, 2007). Studies have also noted
high FPGS gene expression levels in colorectal tumour biopsies which supports the results
seen by these WB studies, high FPGS expression in such tumours may explain the activity of
raltitrexed in colorectal malignancies (Odin et al., 2003). The high expression of FPGS in the
MPM samples tested (Figure 3-11) may explain the reason for the effectiveness of
Pemetrexed in MPM, given that no detectable FR-α has yet been observed. This may offer a
potential alternative determinant of response to pemetrexed, although only three samples
were tested which is insufficient to draw any conclusion; further WB testing to assess FPGS
expression in MPM may be valuable. Increased expression of FPGS activity in model cells has
been found to lead to increased sensitivity to antifolate drugs whereas decreased FPGS
activity has been shown to be a mechanism of resistance to such drugs in both model cells
and clinical specimens (Chen et al., 1996). Mc Guire et al assessed FPGS expression in
antifolate sensitive and resistant cell lines via the use of a rabbit polyclonal antibody, FPGS
levels were found to be lower in the resistant cell lines, concluding that decreased FPGS
activity is a mechanism of resistance to antifolates, particularly MTX (Mc Guire & Russell,
1998). FPGS expression may be key in the determination of response to some antifolates,
particularly raltitrexed and pemetrexed; the route of entry of the drug into the cell has not
been found to affect the rate of polyglutamation. Rates of polyglutamation, particularly MTX
have not been found to be significantly different whether cells entered via the RFC or FR-α
(Spinella, Brigle, Freemantle, Sierra, & Goldman, 1996).

Development and Evaluation of Novel Monoclonal Antibodies to FR-α and FPGS
141
3.6.1.2. FPGS IHC Analysis
From the available mRNA data the IHC results appear to be comparable with expression seen
in a wide range of normal and inflamed tissues tested including colon, liver, kidney, tonsil,
heart, skeletal muscle and bone marrow (Table 3-3, Figure 3-14) . These findings were
consistent with previous published mRNA data (Freemantle & Moran, 1997; Leclerec &
Barredo, 2001). Negative tissues included brain and spinal cord (Table 3-3). Again, this was
as expected based on previous data (Leclerec & Barredo, 2001). Weak staining was observed
in placental samples, consistent with the finding of a low level of placental mRNA
(Freemantle et al., 1995). 19/22 normal samples tested showed some positivity, ranging
from weak to strong staining and upon further testing via the use of a normal tissue panel
microarray, 71/78 samples were found to display some positivity (Data not shown). Negative
samples included cerebrum and cerebellum (Table 3-3).
Positivity was also observed in the majority of malignancies tested from the tumour panels,
200/206 samples tested showed some positivity, ranging from weak to strong staining (Table
3-4). Negative tumour samples included mixed germ cell choriocarcinoma, fibrothecoma,
ganglioneuroma and solitary fibrous tumour omentum. Expression in these tumour
subgroups has not been previously reported. Further studies would be required to validate
these results fully as there was only a small area of tissue tested for each type which is not
fully representative of this tumour subgroup.
Of particular note was staining in ovarian adenocarcinoma islands which appeared to be
stronger than adjacent normal stromal tissue (Figure 3-15). This has been previously
reported in bowel tumour biopsies with higher levels of FPGS mRNA than adjacent
submucosa (Odin et al., 2003). Strong expression was also observed in one B-cell lymphoma
sample tested, which again is consistent with previous data which reported high levels of
FPGS mRNA in B-lineage leukaemias, but more WB and IHC studies are required to confirm
this (Freemantle & Moran, 1997).
3.6.1.3. FPGS Epitope Mapping
Peptide array epitope mapping analysis has demonstrated specific reactivity of FPGS clone
NN 3.2 with a linear target present within the FPGS sequence, confirming its monoclonal
nature and single defined specificity. The epitope recognised has been determined to be

Development and Evaluation of Novel Monoclonal Antibodies to FR-α and FPGS
142
between the regions of amino acids 237-258 as elucidated from the peptide array data
sheet; this region spans twenty one amino acids. Upon further analysis it was elucidated that
the epitope was most likely to be in the region of amino acids 246-251, protein sequence
IFKQGV as this is the region containing the most hydrophobic amino acids in sequence and
reactivity appears to be lost when the C terminal hydrophobic isoleucine residue is lost from
the peptide, indicating this is an important amino acid involved in antibody binding (Figure 3-
18). The two adjacent negative peptides in the middle of the positive sequences may be due
to a masking effect as the flanking amino acid is glutamine which is polar in nature and this
may have blocked binding of the antibody. Conformational changes bridging one or more
adjacent peptides together may also have affected the antibody binding as the peptides are
attached to the membrane at one end only with the remaining peptides free to attach to
each other; this may have masked the epitope causing negative results in between the
positive spots (Figures 3-17, 3-18). Knowledge of the precise region within the FPGS
sequence recognised by clone NN3.2 may be extremely valuable in future work as a recent
study identified 34 single nucleotide polymorphisms in the FPGS gene, suggesting that these
genetic variations in FPGS may alter the efficiacy of antifolate therapies (Leil et al., 2007).
It can be concluded that clone NN 3.2 is a sensitive tool for the detection of FPGS in paraffin
embedded samples, the detection of a single band via WB together with the cytoplasmic IHC
staining pattern are consistent with the known biology of FPGS and are evidence of the
specific affinity of NN3.2 to FPGS. The information provided from these validation
experiments may be useful as preliminary data in future IHC studies to assess FPGS
expression as an indicator of response to antifolates, as FPGS is known to be key in the
action of these drugs.
3.6.2. FR-α Antibody Development
A monoclonal antibody for the detection of FR-α in formalin-fixed, paraffin embedded
tissues has been successfully developed. Clone BN3.2 can also be used routinely in IHC via
both ABC and Novolink as described previously. In addition it is also suitable for use in WB
and ELISA. Its application for use on paraffin embedded samples overcomes previous
problems encountered with the mOV18 and 19 antibodies, which are only suitable for

Development and Evaluation of Novel Monoclonal Antibodies to FR-α and FPGS
143
immunohistochemical use on frozen tissue and its specificity has been further validated via
WB analysis, an application for which mOV 18 and 19 are also unsuitable.
Clone BN 3.2 was raised to a 189 amino acid region of the FR-α protein containing sequences
unique to the α isoform of the protein.
3.6.2.1. FR-α WB Analysis
The FR-α antibody was found to be highly specific and in the positive cell lysates produced a
single, 40 kDa band on an extended panel. 27 cell lysates in total were tested and 8 samples
showed some positivity, ranging from strong to weak. 5/5 ovarian cell lines showed some
positivity, including one ovarian teratocarcinoma sample, with the strongest expression in
the IGROV-1 cell line (Figure 3-20). Moderate expression was seen in the SKOV-3 and
OVCAR-3 cell lines and weaker expression in the SW626 and PA-1 cell lines. Strong
expression was also seen in the HeLa cervical carcinoma cell line (Figure 3-20) and the CaCo2
colon adenocarcinoma cell line (Figure 3-21). Expression via IHC in these tumours has been
previously reported via the use of the LK26 antibody (Rettig et al., 1985). Weak expression
was seen in the embryonic kidney cell line ECR-293 (Figure 3-22). No expression was seen in
any of the remaining cell lines tested. FR-α mRNA expression has been previously reported
in the ovarian cancer cell lines IGROV-1, SKOV-3 and OVCAR-3 (Ross et al., 2000) which is
consistent with the results seen in this study, the relative levels of expression are also
consistent with this study with IGROV-1 showing the highest FR-α expression, followed by
SKOV-3 and OVCAR-3 (Figure 3-20). These results support the general observation that FR-α
expression is extremely restricted, particularly to ovarian cancers which are known to
express the protein most consistently (Toffoli et al., 1997), although the number of cell lines
displaying positivity is still extremely limited. Negative expression has been previously
reported in the CCRF-CEM leukaemia cell line, mesothelioma cell line NCI-H226a, lung
adenocarcinoma cell line A549, colon adenocarcinoma cell line HCT116 and the breast
cancer cell line MCF-7 (Ross et al., 2000). All cell lines were also found to be negative in our
study which is consistent with this data (Figures 3-20, 3-21, 3-22) . Expression in embryonic
kidney has not been previously reported, however normal human kidney is known to
express FR-α (Mangiarotti et al., 2001). Of particular note is the lack of expression in the
three malignant pleural mesothelioma cell lines and one lung carcinoma cell line tested
(Figure 3-20). Although negative expression in the NCI-H226a and A-549 cells has been
Development and Evaluation of Novel Monoclonal Antibodies to FR-α and FPGS
144
previously reported there are no reports on the levels of expression in MSTO-211H and NCI-
H28 cells. This data alone is insufficient to draw an accurate conclusion on the expression of
FR-α in MPM as FR-α tissue expression patterns and mRNA transcripts have been extensively
studied and it has been found that in many cases the FR expression patterns in cell lines do
not reflect expression profiles in vivo. FR expression is commonly absent in cell lines derived
from malignant tissue known to be consistently FR positive (Elnakat & Ratnam, 2004). In
contrast to this a study by Tomassetti et al identified and purified both the soluble and
membrane bound forms in the ovarian adenocarcinoma cell line IGROV-1, suggesting that
some cell lines do express the protein in vitro. This study also supports the strong FR-α
expression seen in the IGROV-1 cell line with clone BN 3.2 (Figure 3-20) (Tomassetti et al.,
1993; Tomassetti et al., 2003). Expression of FR-α has also been reported in the colon
adenocarcinoma cell line HT29 and the leukaemic cell line MOLT-4. Neither of these cells
appeared to display FR-α expression in this study, although the colon adenocarcinoma cell
line CaCo2 was found to be positive (Figure 3-21). This has not been previously reported. A
potential problem with interpretation of these results may also be the culture conditions
used to grow the cells, the majority of the cell lysates obtained were kindly donated and
were cultured in commercial media. Standard RPMI contains supra-physiological
concentrations of folic acid which is thought to downregulate the expression of FR-α in some
cell lines and may be one of the reasons for the inconsistency of expression in cell lines often
observed (Miotti et al., 1995). A more suitable media to use would have been folate free
RPMI and dialysed FBS, supplemented with 20nM folinic acid which would have given folate
levels approximating physiological concentrations in humans (Miotti et al., 1995). As it is
time consuming to adapt cells to this type of media, this was not possible to perform within
the time frame and cells cultured in standard media were used. This should be considered
when interpreting these results as the level of FR-α expression may have been affected by
this, although it has been previously reported that the extracellular folate concentration
does not have an adverse effect on the expression of IGROV-1, OVCAR-3 and SW626 cells so
this may also apply to other cell lines (Miotti et al., 1995). It may be that the HT29 and
MOLT4 cell lines used in this study are, in fact positive but their expression has been
downregulated via use of supra physiological concentrations of folate in the media.

Development and Evaluation of Novel Monoclonal Antibodies to FR-α and FPGS
145
The FR-α antibody produced from clone BN3.2 also detected a single band of approximately
40kDa in the ovarian adenocarcinoma cell extracts IGROV-1, OVCAR-3 and SKOV-3, which is
consistent with previous published studies examining FR-α expression via mRNA, IHC on
frozen tissue and radioligand binding assay (Figure 3-20) (Parker et al., 2005; Toffoli et al.,
1997; Weitman et al., 1992b).
3.6.2.2. FRα IHC Analysis
Immunohistochemical studies using clone BN3.2 on formalin-fixed paraffin-embedded tissue
sections have shown that the expression of FR-α is low-negative in the majority of normal
and inflamed tissues, but its expression is seen to a varying degree and frequency in a range
of different tumour types, in a manner consistent with previous published data (Campbell et
al., 1991; Parker et al., 2005; Ross et al., 1994; Veggian et al., 1989). 3/22 normal samples
tested were found to show positive staining. 5/6 placental samples showed positive staining
upon further testing (Table 3-5, Figure 3-23).
Of particular interest is the strikingly high expression observed in the majority of ovarian
malignancies tested. The detection of a single band via WB of cell and tissue extracts,
together with the striking strong membrane and cytoplasmic staining are consistent with the
known biology of FR-α and evidence of the specific affinity of the BN3.2 antibody to FR-α.
Positive malignancies observed from the tumour panel (78 sections tested in total) included
very strong staining in various ovarian adenocarcinoma samples, with 14/15 sections tested
showing positivity. Less frequently, weaker staining was observed in endometrial
adenocarcinomas (1/1), lung carcinomas (1/1) and breast carcinomas (2/8) (Table 3-5).
Moderate to weak staining was observed in endometrial adenocarcinoma, lung carcinoma,
thyroid papillary carcinoma, ovarian thecoma and granulosa. Expression in these tissues has
been previously reported (Evans et al., 2001; Ross et al., 1994; Wu et al., 1999). One recent
study found 69% of frozen uterine serous carcinoma samples tested to express FR-α protein.
As only 1 sample was assessed in this study, further analysis of FR-α expression in these
tumours would be of interest (Dainty et al., 2007).
Weak expression in cholangiocarcinoma was also noted, which has not been previously
reported. However, the result obtained was from one case on a tissue microarray and

Development and Evaluation of Novel Monoclonal Antibodies to FR-α and FPGS
146
further testing would need to be performed to validate this observation and assess the
frequency of expression in this tumour type.
Also of interest was the lack of expression in both mesothelioma cell lines and paraffin
embedded mesothelioma tissue (n=6 tumour samples), This result was surprising, as high
expression in mesothelioma has been previously reported and cited as a possible
explanation for the responsiveness of mesothelioma to the novel antifolate pemetrexed
(Bueno, Appasani, Mercer, Lester, & Sugarbaker, 2001). However, other reports have cast
doubt on both the expression of FR-α in mesothelioma and on the importance of FR-α as an
uptake mechanism and determinant of response to pemetrexed (Chattopadhyay, Wang,
Zhao, & Goldman, 2004). More samples would be required to investigate this further.
3.6.2.3. FR-α Epitope Mapping
Peptide array epitope mapping analysis has demonstrated specific reactivity of FR-α clone
NN3.2 with a linear target present in the FR-α target sequence, which began at amino acid
45 and ended at amino acid 233. The epitope was found to map to amino acids 57-62 and is
hypothesised to be contain the following amino acids; CRPWRK. Reactivity was found to be
lost when the cysteine residue was lost from the peptide sequence, indicating the presence
of this hydrophobic amino acid being significant for immunoreactivity to the peptide (Figure
3-27).
The epitope recognised contained a cysteine residue, when the protein is in its native
conformation this cysteine is likely to be involved in a disulphide bridge, requiring breakage
to expose the epitope, such as the antigen retrieval step required to expose this epitope in
paraffin embedded tissues. This is supported by the lack of staining observed when no pre-
treatment was assessed for antibody validation (Figure 3-25). However, the presence of this
cysteine residue also led to the proposal that use of reducing agents such as DTT may break
the bridges and allow the antibody to be used in applications such as IF and frozen IHC. The
cysteine may also contribute to the negative adjacent peptide (A7, Figure 3-27) causing
variable intensity of reactivity between peptide spots, this region of the sequence is
relatively cysteine rich and the cysteine residues present in adjacent peptides may have
formed disulphide bridges, linking the adjacent peptides and masking the epitope present in
this part of the sequence. Another possible explanation for the variation in reactivity is the
Development and Evaluation of Novel Monoclonal Antibodies to FR-α and FPGS
147
location of the epitope towards the outer amino acids of the peptide; reactivity may not be
as strong when the antibody binds to an epitope further from the site of attachment.
The mOV 18 epitope mapping experiment also supported this theory and demonstrated the
opposite action occurring, only two peptides were found to display positive
immunoreactivity, indicating that the epitope is likely to be conformational rather than
linear in nature, the location of the epitope was also different to that of clone BN 3.2. For
this reason it is not possible to determine the precise epitope sequence for mOV18 (Figures
3-28, 3-29). This also explains the reason for the epitope being destroyed by treatment with
a reducing agent as the disulphide bridges would be broken, shearing the epitope and
causing loss of binding affinity. Both the N-terminal and C terminal hydrophobic
transmembrane alpha helices were missing from this target and it is likely that the
conformational epitope bridges some of the target and one of the alpha helices missing from
the peptide array.
No reactivity was observed on the peptide array treated with LK26 antibody, indicating that
the epitope recognised by this antibody is different from that of the BN 3.2 clone and mOV
18 antibody and is likely to be located in a region not targeted by the peptide array, it can
not be determined whether the epitope recognised is conformational or linear in nature as
the peptide array does not cover the full sequence (Figures 3-30, 3-31). Although the
staining was found to be comparable caution should be taken when using this antibody in
IHC as it is a relatively insensitive method of interpreting protein expression when not
supported by another application for confirmation. As learned previously from the cross
reaction encountered it is advantageous for the antibody to be suitable for a number of
applications to confirm its specificity. Despite this it has been reported that the LK26
antibody has been successfully humanised (MORAb-003) and in preclinical evaluation it has
been found to possess novel, growth inhibitory properties both in vitro and in vivo and as a
result has recently been advanced to clinical trials involving ovarian cancer patients (Ebel et
al., 2007).
This antibody may be more suited to applications where the protein is present in its native
conformation and this is supported by the results from this mapping experiment as there is
no evidence to suggest that it recognises a linear target, unless it is in a region not covered
by our target. It may also bridge one of the transmembrane alpha helices missing from the

Development and Evaluation of Novel Monoclonal Antibodies to FR-α and FPGS
148
target or the epitope may span a number of folded regions, fragmenting the epitope so it is
not detected at all on a linear seqiuence.
It can be concluded that clone BN 3.2 is a sensitive tool for the detection of FR-α in paraffin
embedded tissues and that this validation data supports its use in immunohistochemical
studies to determine the role of FR-α as a tumour prognostic marker, potential predictive
biomarker for response to antifolates and possible therapeutic target. This would be
particularly useful in clinical trials of antifolates which are targeted to FR-α and may help to
identify responsive subgroups of patients to whom such agents would be of particular
benefit (Jackman et al., 2004).

Development and Evaluation of Novel Monoclonal Antibodies to FR-α and FPGS
149
Chapter Four
Development and Evaluation of Novel Monoclonal Antibodies to FR-α and FPGS
150
Chapter Four
4. Ovarian Tissue Microarray Analyses Ovarian cancer is the major focus of this study largely due to its strikingly high frequency and
level of expression of FR-α compared with other tumour types and other normal tissues. This
offers an exciting target both for further studies assessing the frequency of expression in
such tumours and also its relationships to survival and as a predictor of response to folate
targeted therapies.
Few studies have investigated the relationship between tumour levels of FR-α and survival,
largely due to limitations with the other commercially available antibodies, discussed in
detail in section 1.8.3. However, due to the nature of FR-α and its role in folate transport and
metabolism it is thought that high expression levels of FR-α are associated with poor
prognosis and tumour progression (Toffoli et al., 1998). Similarly, its potential role in
antifolate transport, coupled with its role in folate receptor targeted therapies may also
indicate a role for FR-α in tumour targeted drug delivery as discussed in section 1.8.5. As
indicated by the mOV18 and 19 antibodies by IHC on frozen tissue, ovarian cancer appears
to be the major tumour type associated with overexpression of FR-α. It was thus the aim to
obtain a TMA containing ovarian cancer cases to assess FR-α expression on a large scale in
these samples. The data could then also be analysed in relation to FPGS expression. In
addition, relationships between expression and survival could also be analysed to assess
whether FR-α and FPGS expression may be independent prognostic markers for both overall
and relapse free survival. The results observed were primarily part of the antibody validation
process, to ensure the data generated from this larger study were consistent with previous
published data in relation to both frequency of expression in ovarian cancer and its role as a
marker of poor prognosis.

Development and Evaluation of Novel Monoclonal Antibodies to FR-α and FPGS
151
4.1. Ovarian TMA Study Aims and Objectives
Obtain ovarian TMA slides, perform IHC using the Novolink polymer detection kit
and accurately score based on intensity and % tumour cells stained by two
independent observers.
Obtain some statistical data via univariate and multivariate analysis on the TMA’s
to assess the relationship between the expression of FR-α, FPGS and other known
prognostic markers in ovarian cancer.
Identify whether FR-α and FPGS are independent markers of prognosis in ovarian
cancer patients.
Correlate the results obtained with previous published work to further confirm
the validity of the antibodies.
4.2. Ovarian TMA Study Materials and Methods
A total of 167 ovarian cancer samples were collected over a period of five years, differing in
stage, grade and tumour type. All samples used in the archival TMA had appropriate ethical
approval and known patient clinical data collected from hospital records. Cell cores were
taken from tumour–rich areas and assembled into a TMA, each core was duplicated to
account for loss of tissue during processing. There were a total of four TMA’s (designated
OVCA 1, 2, 3 and 4), each containing ovarian carcinoma samples only with the exception of
mouse liver cell cores placed on different edges of the slides used as markers to differentiate
one TMA from another and a small panel of normal and tumour tissues on TMA four, which
included breast, thyroid, liver, lung, colon, and kidney.
The TMA’s were collected and prepared by Dr. Ann Fisher, Dr. Richard Edmondson and Dr.
Ali Kucukmetin at Newcastle University.
IHC staining using the Novolink polymer kit was performed on the samples with the FR-α and
FPGS antibodies employing the techniques described in section 3.3.6.

Development and Evaluation of Novel Monoclonal Antibodies to FR-α and FPGS
152
4.2.1. Assessment of TMA IHC Staining- Scoring System Used
The IHC staining of tissues was scored according to the proportion of tumour cells staining
and the staining intensity. Reactivity was also determined to be cytoplasmic (C), nuclear (N),
membrane (M) or any combination of the three. This gave a numerical result and was carried
out by two observers independently. Tissues were visualised under a light microscope, the
proportion and intensity of cytoplasmic/membrane staining for FR-α and cytoplasmic
staining for FPGS were estimated, no nuclear reactivity was observed for either antibody.
Inter scorer variablility was assessed by scoring independently, once scores were recorded
they were then analysed together and in the event of a discrepancy an agreed score was
decided upon further inspection of the core.
Intensity was assessed on a four point scale as follows:
0 = Negative
1= Weak
2 = Intermediate
3 = Strong
Concurrently the percentage of tumour cells stained was assessed on a four point scale as
follows:
1 = 0-25%
2 = 25-50%
3= 50-75%
4= 75-100%
The scores for intensity and proportion were then multiplied to give a score intensity rating
of between 0 and 12. Where staining was heterogeneous different intensity and proportion
scores were multiplied, ensuring the total percentage of tumour cells equaled 100% (or four
scale points) to give a score intensity, the different scores were then added together to give

Development and Evaluation of Novel Monoclonal Antibodies to FR-α and FPGS
153
an overall score. E.g. weak staining in 25% of tumour, intermediate staining in 50% of
tumour and strong staining in the remaining 25% of tumour would be calculated as (1x1) +
(2x2) + (3X1) = a total score of 8 (note the total percentage of tumour cells stained equaled 4
score points as 100% of the tumour was immunoreactive). As there were two cores
representing one tumour per TMA an average score from both duplicate cores was also
recorded.
4.2.2. Statistical Analysis
Statistical analysis was carried out by Mr M. Cole, NICR, Newcastle using Stata 10 software.
Survival and time to recurrence were analysed by the construction of Kaplan Meier curves
for patient overall survival, stage, grade, histology, CA125, residual disease, chemotherapy
before surgery, FR-α and FPGS expression. Cox’s proportional hazards model was used to
compare survival curves to identify any statistically significant differences and was also used
in a forward stepwise approach to perform multivariate analysis of the variables which on
univariate analysis were significantly associated with clinical outcome to determine their
utility as independent prognostic variables. In addition one way Anova and Bartletts tests
were used to ensure equal variance across groups and to look for evidence of statistically
significant relationships between FR-α and FPGS expression and some of the other variables
including grade, histology and CA125 values.
4.2.2.1. Kaplan-Meier Survival Plots and Log-Rank Test
The relationship to survival was tested via the use of Kaplan-Meier survival plots and the the
log-rank test to examine the significance of any differences in the rate of survival between
patient subgroups defined by the variables under consideration taking into account the
follow up time of the patients. Kaplan- Meier survival graphs are generated by estimation of
conditional probabilities of events occurring at each time point when an event (such as
death, relapse or loss of follow up) occurs and estimating the rate of survival at each time
point taking this into consideration. The log-rank test employs logarithms of the ranks of the
data to compare the survival curves and computes a p-value to indicate whether the overall
differences between survival curves are statistically significant or if they could have been
due to chance.

Development and Evaluation of Novel Monoclonal Antibodies to FR-α and FPGS
154
4.3. Ovarian TMA Study - Results
4.3.1. FR-α and FPGS Images and Scoring
Photographic images were taken from the TMA slides using the Aperio Scan Scope CS
automated scanning and scoring system (Aperio Technologies Inc., Figure 4-1).
For FR-α, patterns of membrane/cytoplasmic heterogeneous staining were observed on all
four TMA slides tested (Figure 4-2 and Figure 4-3). For FPGS, patterns of cytoplasmic
heterogeneous staining were observed on all four TMA slides tested (Figure 4-5 and Figure
4-6). Staining for FR-α was predominantly membrane (Figure 4-8) and staining for FPGS was
predominantly cytoplasmic (Figure 4-9). For both FR-α and FPGS the majority of samples
were found to show some positivity ranging from strong (Figure 4-4 and Figure 4-7) to
moderate/weak expression. Scores were recorded on a spreadsheet and statistical analysis
performed to assess the relationship between expression of FR-α or FPGS and patient
survival. Of 167 samples tested, 63 cases (38%) were found to have low FR-α expression
(score 0.5-4), 46 (28%) were found to moderately express FR-α (score 4.5-8) and 57 (34%)
were found to have high expression (8.5-12). Of 167 cases 30 (18%) were found to have low
FPGS expression 70 (42%) were found to have moderate expression and 67 (40%) were
found to have high FPGS expression.
Figure 4-1: Photograph of the OVCA TMA slides. Complete set of ovarian TMA’s -OVCA1, 2, 3 and 4
stained with FR-α to illustrate the layout of the slides.

Development and Evaluation of Novel Monoclonal Antibodies to FR-α and FPGS
155
Figure 4-2: Photograph of OVCA1 stained with FR-α. Each core was assigned an identifier and linked to the corresponding patient data on an excel spreadsheet.
Illustrates the layout of the TMA. Each TMA contains two cores taken from the same patient. FR-α gave variable intensity staining which was predominantly membrane and
cytoplasmic.

Development and Evaluation of Novel Monoclonal Antibodies to FR-α and FPGS
156
Figure 4-3: Photograph of twelve TMA cell cores (x1) stained with FR-α. Note the difference in staining intensity between cores Strong (3+) reactivity is represented
by cores b, g, h and l,. Moderate (2+) reactivity is represented by cores c, d, e, f and j, weak (1+) reactivity is represented by cores a, i and k.
a b c d
e f g h
i j
k l
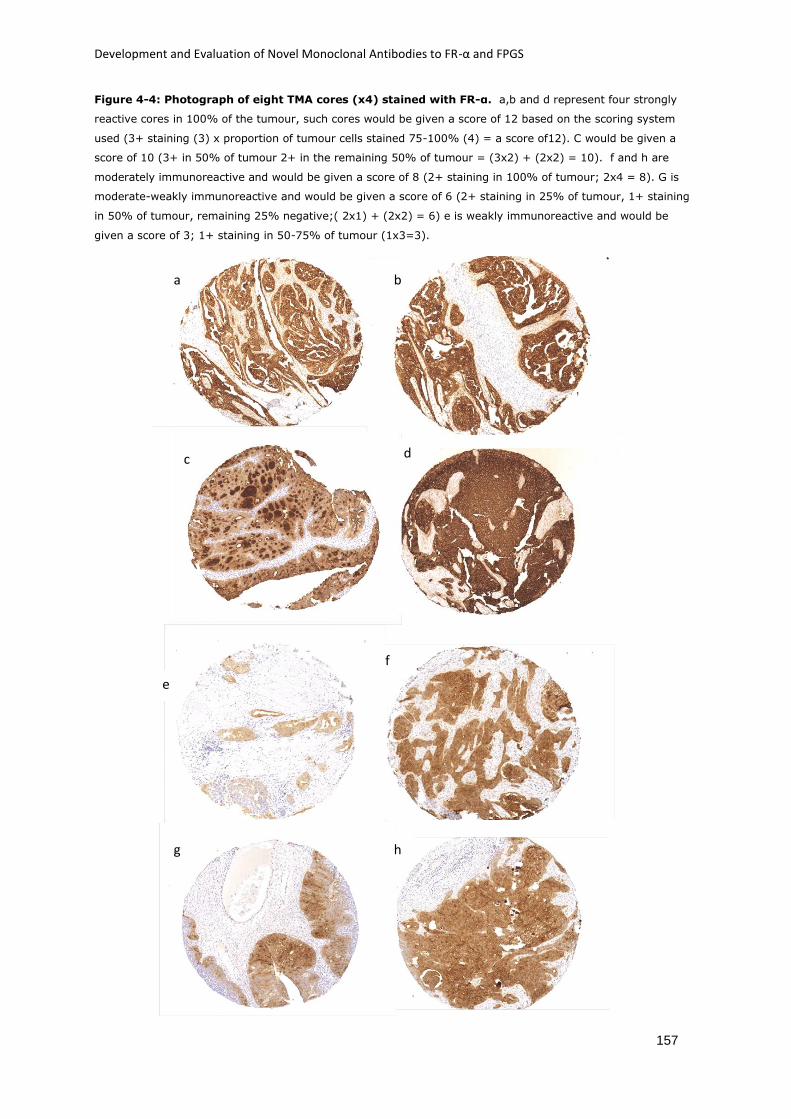
Development and Evaluation of Novel Monoclonal Antibodies to FR-α and FPGS
157
Figure 4-4: Photograph of eight TMA cores (x4) stained with FR-α. a,b and d represent four strongly
reactive cores in 100% of the tumour, such cores would be given a score of 12 based on the scoring system
used (3+ staining (3) x proportion of tumour cells stained 75-100% (4) = a score of12). C would be given a
score of 10 (3+ in 50% of tumour 2+ in the remaining 50% of tumour = (3x2) + (2x2) = 10). f and h are
moderately immunoreactive and would be given a score of 8 (2+ staining in 100% of tumour; 2x4 = 8). G is
moderate-weakly immunoreactive and would be given a score of 6 (2+ staining in 25% of tumour, 1+ staining
in 50% of tumour, remaining 25% negative;( 2x1) + (2x2) = 6) e is weakly immunoreactive and would be
given a score of 3; 1+ staining in 50-75% of tumour (1x3=3).
a b
c d
e
f
g h

Development and Evaluation of Novel Monoclonal Antibodies to FR-α and FPGS
158
Figure 4-5: Photograph of OVCA1 stained with FPGS. Each core was assigned an identifier and linked to the corresponding patient data on an excel spreadsheet.
Illustrates the layout of the TMA. Each TMA contains two cores taken from the same patient. FPGS gave variable intensity staining which was predominantly cytoplasmic.

Development and Evaluation of Novel Monoclonal Antibodies to FR-α and FPGS
159
Figure 4-6: Twelve TMA cell cores (x1) stained with FPGS. Note the difference in staining intensity between cores Strong (3+) reactivity is represented by cores a,g,h
and k. Moderate (2+) reactivity is represented by cores b,d,i,j and l,weak (1+) reactivity is represented by cores c,e, and f.
a b
c d
e f g
h
i
j k l
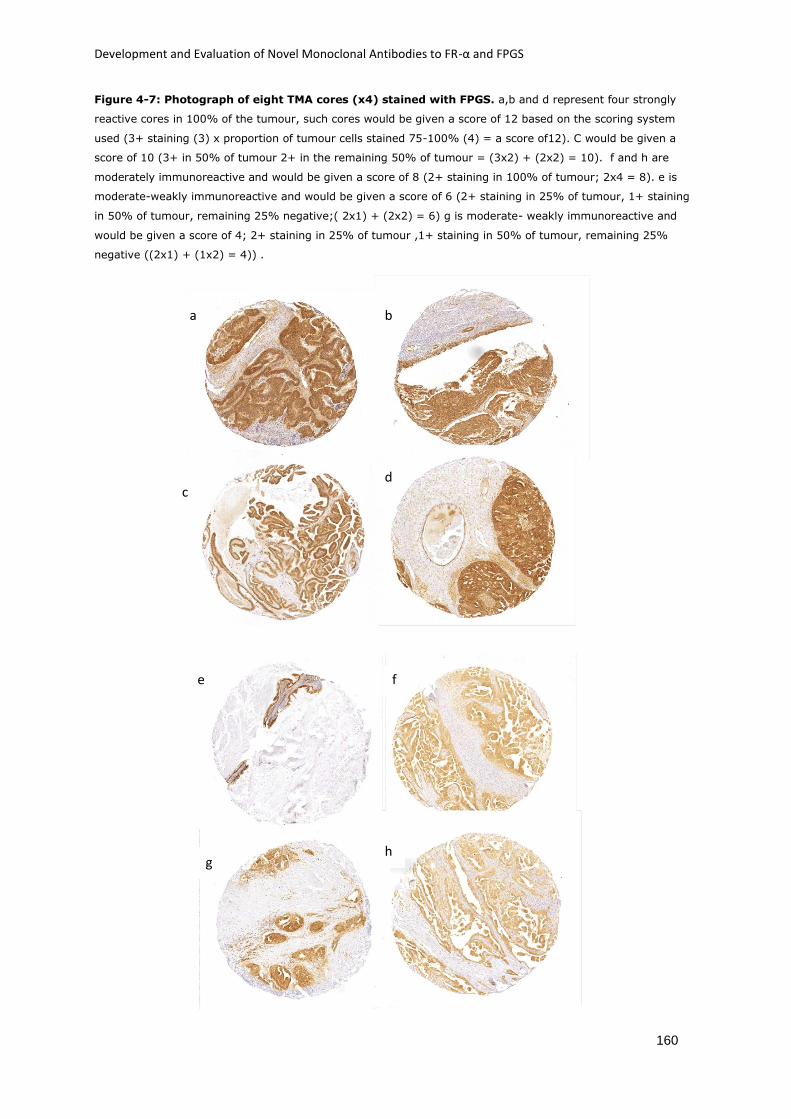
Development and Evaluation of Novel Monoclonal Antibodies to FR-α and FPGS
160
Figure 4-7: Photograph of eight TMA cores (x4) stained with FPGS. a,b and d represent four strongly
reactive cores in 100% of the tumour, such cores would be given a score of 12 based on the scoring system
used (3+ staining (3) x proportion of tumour cells stained 75-100% (4) = a score of12). C would be given a
score of 10 (3+ in 50% of tumour 2+ in the remaining 50% of tumour = (3x2) + (2x2) = 10). f and h are
moderately immunoreactive and would be given a score of 8 (2+ staining in 100% of tumour; 2x4 = 8). e is
moderate-weakly immunoreactive and would be given a score of 6 (2+ staining in 25% of tumour, 1+ staining
in 50% of tumour, remaining 25% negative;( 2x1) + (2x2) = 6) g is moderate- weakly immunoreactive and
would be given a score of 4; 2+ staining in 25% of tumour ,1+ staining in 50% of tumour, remaining 25%
negative ((2x1) + (1x2) = 4)) .
a b
c d
e f
g h

Development and Evaluation of Novel Monoclonal Antibodies to FR-α and FPGS
161
Figure 4-8: FR-α membrane staining. Image demonstrating strong membrane and cytoplasmic
immunoreactivity of FR-α on one of the ovarian cancer cores (x20). Note the strong staining in tumour
(brown)compared with adjacent stromal tissue (blue).
Figure 4-9: FPGS cytoplasmic staining. Image demonstrating moderate-strong cytoplasmic
immunoreactivity of FPGS on one of the ovarian cancer cores (x20). Note the staining in tumour islands
(brown) weaker reactivity in stromal tissue and negativity in lymphoid aggregates (blue).

Development and Evaluation of Novel Monoclonal Antibodies to FR-α and FPGS
162
4.3.2. Statistical Analysis of Overall Survival
Statistical analysis of overall survival was performed to assess the association between all
the variables and survival to ensure the data from this cohort of patients followed similar
trends to those seen in patients with ovarian cancer.
For survival, no significant associations were found for age, chemotherapy before surgery or
FPGS score. Statistically significant associations were found for stage, grade, histology, Log10
CA125, residual disease and FR-α IHC scores. (Table 4-1)

Development and Evaluation of Novel Monoclonal Antibodies to FR-α and FPGS
163
Table 4-1: Summary of statistical analysis of overall survival
Variable Events (Total
number) i.e. death
P value (Cox
regression)
Hazard Ratio (HR) 95% CI
Age at operation
<60 No 66 (108) 0.9359 1.00 0.98-1.01
<60 Yes 36 (58)
Stage
1 5 (27)
2 6 (14) 0.180 2.25 0.69-7.38
3 67 (91) < 0.000 6.99 2.80-17.44
4 17 (18) < 0.000 22.41 8.04-62.44
Grade Well diff vs rest 0.004 2.39 1.33-4.28
Poorly differentiated 56 (80) 0.003 0.40 0.22-0.73
Moderately differentiated 33 (45) 0.503 0.86 0.56-1.33
Well differentiated 13 (42)
Histology Endo vs rest 0.006 0.53 0.34-0.84
Adenocarcinoma 3 (3) omitted omitted omitted
Endometrioid 25 (51)
Papillary Serous 27 (41) 0.624 0.74 0.22-2.45
Clear Cell 12 (16) 0.930 0.94 0.27-3.36
Mucinous 7 (18) 0.206 0.42 0.11-1.62
Serous 28 (38) 0.796 0.85 0.26-2.82
CA125
<480 No 50 (70) 0.157 1.00 0.99-1.00
<480 Yes 39 (70)
Log10 CA125 0.040 1.36 1.01-1.83
Residual Disease
Suboptimal cytoreduction 58 (64) < 0.000 0.14 0.77-0.67
Optimal cytoreduction 18 (30) 0.001 0.39 0.76-0.24
Complete cytoreduction 18 (54)
Chemo before surgery
No 88 (138)
Yes 4 (7) 0.522 1.39 0.51-3.80
FR-α 1
Below median 36
Above Median 63 0.044 0.655 0.43-0.98
Continuous variable 148 0.013 1.06 1.01-1.11
FR-α 2
Below median 39
Above median 59 0.030 0.64 0.424-0.958
Continuous variable 146 0.006 1.066 1.02-1.12
FR-α Mean
Below median 39
Above median 63 0.052 0.672 0.45-1.00
Continuous variable 152 0.009 1.06 1.02-1.12
FPGS 1
Below median 28
Above median 69 0.832 0.95 0.61-1.48
Continuous variable 145 0.81 1.00 0.95-1.08
FPGS 2
Below median 30
Above median 67 0.976 0.99 0.65-1.53
Continuous variable 143 0.802 1.01 0.94-1.07
FPGS Mean
Below median 78
Above median 24 0.713 0.91 0.58-1.45
Continuous variable 152 0.845 1.00 0.94-1.08
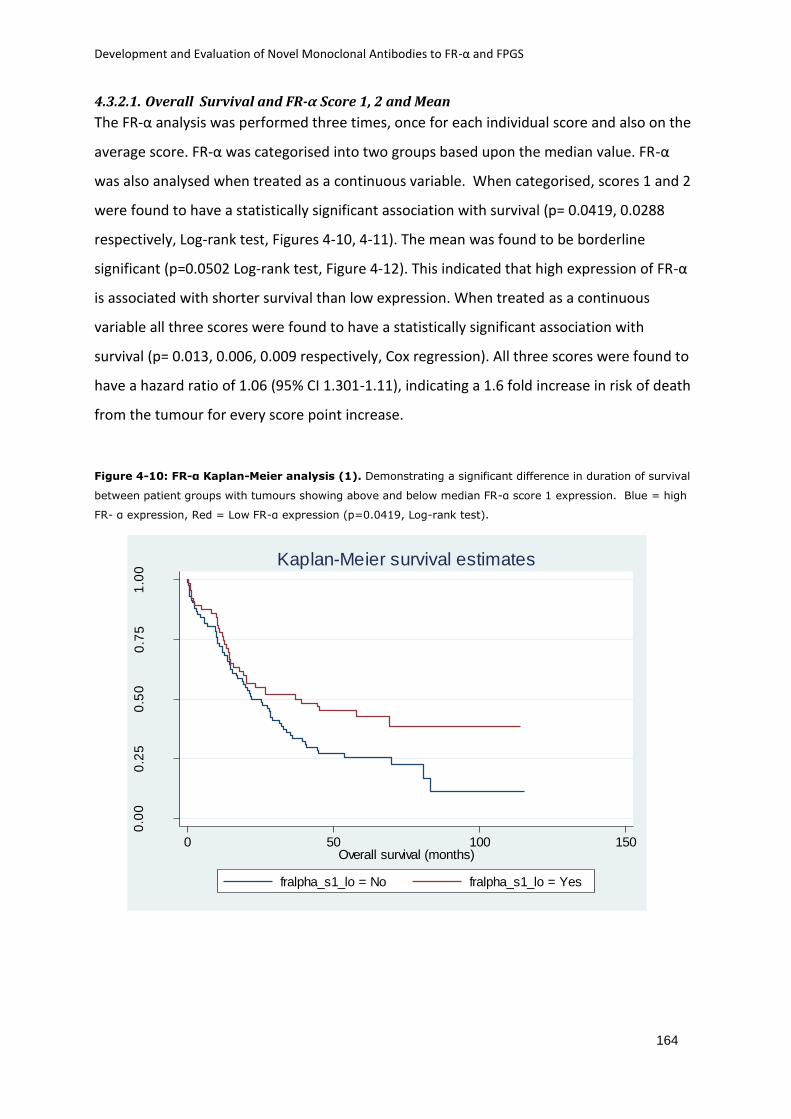
Development and Evaluation of Novel Monoclonal Antibodies to FR-α and FPGS
164
4.3.2.1. Overall Survival and FR-α Score 1, 2 and Mean
The FR-α analysis was performed three times, once for each individual score and also on the
average score. FR-α was categorised into two groups based upon the median value. FR-α
was also analysed when treated as a continuous variable. When categorised, scores 1 and 2
were found to have a statistically significant association with survival (p= 0.0419, 0.0288
respectively, Log-rank test, Figures 4-10, 4-11). The mean was found to be borderline
significant (p=0.0502 Log-rank test, Figure 4-12). This indicated that high expression of FR-α
is associated with shorter survival than low expression. When treated as a continuous
variable all three scores were found to have a statistically significant association with
survival (p= 0.013, 0.006, 0.009 respectively, Cox regression). All three scores were found to
have a hazard ratio of 1.06 (95% CI 1.301-1.11), indicating a 1.6 fold increase in risk of death
from the tumour for every score point increase.
Figure 4-10: FR-α Kaplan-Meier analysis (1). Demonstrating a significant difference in duration of survival
between patient groups with tumours showing above and below median FR-α score 1 expression. Blue = high
FR- α expression, Red = Low FR-α expression (p=0.0419, Log-rank test).
0.0
00
.25
0.5
00
.75
1.0
0
Su
rviv
ing
pro
po
rtio
n
0 50 100 150Overall survival (months)
fralpha_s1_lo = No fralpha_s1_lo = Yes
Kaplan-Meier survival estimates

Development and Evaluation of Novel Monoclonal Antibodies to FR-α and FPGS
165
Figure 4-11: FR-α Kaplan-Meier analysis (2). Demonstrating a significant difference in duration of survival
between patient groups with tumours showing above and below median FR-α score 2 expression. Blue = high
FR- α expression, Red = Low FR-α expression (p=0.0288, Log rank test).
Figure 4-12: FR-α Kaplan-Meier analysis (3). Demonstrating a borderline significant difference in duration
of survival between patient groups with tumours showing above and below median FR-α mean score
expression. Blue = high FR- α expression, Red = Low FR-α expression (p=0.0502, Log-rank test).
0.0
00
.25
0.5
00
.75
1.0
0
Su
rviv
ing
pro
po
rtio
n
0 50 100 150Overall survival (months)
fralpha_s2_lo = No fralpha_s2_lo = Yes
Kaplan-Meier survival estimates
0.0
00
.25
0.5
00
.75
1.0
0
Su
rviv
ing
pro
po
rtio
n
0 50 100 150Overall survival (months)
fralpha_mean_lo = No fralpha_mean_lo = Yes
Kaplan-Meier survival estimates

Development and Evaluation of Novel Monoclonal Antibodies to FR-α and FPGS
166
4.3.2.2. Overall Survival and FPGS Score 1, 2 and Mean
The FPGS analysis was also performed three times and categorised by the median value and
treated as a continuous variable. When categorised, none of the three scores were found to
have a significant association with survival. (p=0.8318, 0.9761 and 0.7124 respectively, Log-
rank test (Figure 4-13). Treating FPGS as a continuous variable did not generate any
difference with no significant association with survival (p= 0.013, 0.006, 0.009 respectively,
Cox regression).
Figure 4-13: FPGS Kaplan-Meier analysis (1). Demonstrating no significant difference in duration of
survival between patient groups with tumours showing above and below median FPGS score 1 expression. Blue
= high FPGS expression, Red = Low FPGS expression. (p=0.08318, Log-rank test) Similar patterns were
observed for score 2 and mean score (data not shown).
4.3.2.3. Overall Survival Multivariate Analysis
In a multivariate model performed in a forward stepwise approach, both FR-α and FPGS
failed to retain significance independent of residual disease, histology and stage, the most
statistically significant variables deduced from the overall survival analysis which dominated
the model (p=0.000 Cox regression). Both significant FR-α scores were used in the analysis
(p=0.486, 0.338, Cox regression). Both significant FPGS scores were also analysed (p=0.664,
0.445, Cox regression).
0.0
00
.25
0.5
00
.75
1.0
0
Su
rviv
ing
pro
po
rtio
n
0 50 100 150Overall survival (months)
fpgs_s1_lo = No fpgs_s1_lo = Yes
Kaplan-Meier survival estimates

Development and Evaluation of Novel Monoclonal Antibodies to FR-α and FPGS
167
4.3.3. Statistical Analysis of Time to Relapse
For relapse free survival, no significant associations were found for age, chemotherapy
before surgery or FPGS score. Statistically significant associations were found for stage,
grade, histology, log10 CA125, residual disease and FR-α IHC scores. (Table 4-2) Results
observed followed a similar pattern to that of the overall survival analysis and are consistent
with previous published data on ovarian cancer survival (Yancik, 1993).

Development and Evaluation of Novel Monoclonal Antibodies to FR-α and FPGS
168
Table 4-2: Summary of statistical analysis of time to relapse
Variable Events (Total
number) i.e. death
P value HR 95% CI
Age at operation
<60 No 76 (119) 0.807 1.00 0.98-1.01
<60 Yes 38 (40)
Stage
1 5 (27)
2 6 (14) 0.186 2.22 0.69-7.30
3 79(91) < 0.00 9.18 3.68-22.83
4 18(18) < 0.00 23.91 8.66-66.04
Grade
Poorly Differentiated 65 (80) 0.132 0.72 0.47-1.10
Moderately Differentiated 33 (45) < 0.000 0.361 0.20-0.64
Well Differentiated 16 (42)
Histology Endo vs rest 0.0087 0.57 0.37-0.87
Adenocarcinoma 3 (3) 0.993 1.00 0.61-1.65
Endometrioid 12 (51) 0.070 0.47 0.20-1.07
Papillary Serous 30 (41) 0.961 1.01 0.52-1.99
Clear Cell 8 (16) 0.993 1.00 0.61-1.65
Mucinous 31 (18) 0.013 0.53 0.32-0.88
Serous 30 (38)
CA125
<480 No 58 (70) 0.144 1.00 0.99-1.00
<480 Yes 43 (70)
Log 10 CA125 0.011 1.44 1.09-1.90
Residual Disease
Suboptimal cytoreduction 60 (64) < 0.000 0.15 0.86-0.25
Optimal cytoreduction 25 (30) 0.029 0.59 0.37-0.95
Complete cytoreduction 22 (54)
Chemo before surgery
No 99 (138)
Yes 6 (7) 0.268 1.60 0.70-3.65
FR alpha 1
Below median 40
Above Median 71 0.013 0.61 0.41-0.90
Continuous variable 111 0.003 1.06 1.02-1.11
FR alpha 2
Below median 46
Above median 63 0.053 0.68 0.46-1.00
Continuous variable 109 0.002 1.07 1.03-1.12
Mean Fr alpha
Below median 44
Above median 70 0.020 0.64 0.43-0.93
Continuous variable 114 0.003 1.07 1.02-1.12
FPGS 1
Below median 29
Above median 80 0.588 0.89 0.58-1.36
Continuous variable 109 0.62 1.01 0.96-1.08
FPGS 2
Below median 31
Above median 77 0.663 0.9121 0.60-1.38
Continuous variable 108 0.396 1.03 0.97-1.09
Mean FPGS
Below median 26
Above median 88 0.592 0.89 0.57-1.38
Continuous variable 114 0.524 1.02 0.96-1.09

Development and Evaluation of Novel Monoclonal Antibodies to FR-α and FPGS
169
4.3.3.1. Relapse Free Survival and FR-α Score 1, 2 and Mean
As for overall survival, FR-α analysis was performed for the three scores and also treated as a
continuous variable. When categorised, scores 1 and mean were found to have a statistically
significant association with survival (p= 0.0116, 0.0190 respectively, Log-rank test, Figures 4-
14, 4-16). Score 2 was found to be borderline significant (p=0.0509 Log-rank test, Figure
4-15). This indicated that high expression of FR-α is associated with shorter survival than low
expression. When treated as a continuous variable all three scores were found to have a
statistically significant association with survival (p= 0.03, 0.002, 0.003 respectively, Cox
regression). All three scores were found to have a hazard ratio of 1.07 (95% CI 1.02-1.12),
indicating a 1.7 fold increase in risk of death from the tumour for every score point increase.
Figure 4-14: FR-α Kaplan-Meier analysis (4). Demonstrating a significant difference in duration of survival
between patient groups with tumours showing above and below median FR-α score 1 expression. Blue = high
FR- α expression, Red = Low FR-α expression (p=0.0116, Log-rank test).
0.0
00
.25
0.5
00
.75
1.0
0
Su
rviv
ing
pro
po
rtio
n
0 50 100 150Relapse free survival (months)
fralpha_s1_lo = No fralpha_s1_lo = Yes
Kaplan-Meier survival estimates

Development and Evaluation of Novel Monoclonal Antibodies to FR-α and FPGS
170
Figure 4-15: FR-α Kaplan-Meier analysis (5). Demonstrating a borderline significant difference in duration
of survival between patient groups with tumours showing above and below median FR-α score 2 expression.
Blue = high FR- α expression, Red = Low FR-α expression (p=0.0509, Log rank test).
Figure 4-16: FR-α Kaplan-Meier analysis (6). Demonstrating a significant difference in duration of survival
between patient groups with tumours showing above and below median FR-α mean score expression. Blue =
high FR- α expression, Red = Low FR-α expression (p=0.0190, Log-rank test).
0.0
00
.25
0.5
00
.75
1.0
0
Su
rviv
ing
pro
po
rtio
n
0 50 100 150Relapse free survival (months)
fralpha_s2_lo = No fralpha_s2_lo = Yes
Kaplan-Meier survival estimates
0.0
00
.25
0.5
00
.75
1.0
0
Su
rviv
ing
pro
po
rtio
n
0 50 100 150Relapse free survival (months)
fralpha_mean_lo = No fralpha_mean_lo = Yes
Kaplan-Meier survival estimates

Development and Evaluation of Novel Monoclonal Antibodies to FR-α and FPGS
171
4.3.3.2. Relapse Free Survival and FPGS Score 1, 2 and Mean
The FPGS analysis was also performed three times and categorised by the median value and
treated as a continuous variable. When categorised, none of the three scores were found to
have a significant association with survival. (p=0.5879, 0.6629 and 0.5916 respectively, Log-
rank test, Figure 4-17). Treating FPGS as a continuous variable did not generate any
difference with no significant association with survival (p= 0.620, 0.396, 0.524 respectively,
Cox regression).
Figure 4-17: FPGS Kaplan-Meier analysis (2). Demonstrating no significant difference in duration of
survival between patient groups with tumours showing above and below median FPGS score 1 expression.
(p=0.5879, Log-rank test) Blue = high FPGS expression, Red = Low FPGS expression. Similar patterns were
observed for score 2 and mean score (data not shown).
4.3.4. Relapse Free Survival Multivariate Analysis
In a multivariate model performed in a forward stepwise approach, both FR-α and FPGS
failed to retain significance independent of residual disease, histology, grade and stage, the
most statistically significant variables deduced from the relapse free survival analysis which
dominated the model (p=0.000 Cox regression). Both significant FR-α scores were used in
0.0
00
.25
0.5
00
.75
1.0
0
Su
rviv
ing
pro
po
rtio
n
0 50 100 150Relapse free survival (months)
fpgs_s1_lo = No fpgs_s1_lo = Yes
Kaplan-Meier survival estimates

Development and Evaluation of Novel Monoclonal Antibodies to FR-α and FPGS
172
the analysis (p=0.441, 0.303, Cox regression). Both significant FPGS scores were also
analysed (p=0.506, 0.911, Cox regression).
4.3.4.1. Correlations between FR-α, FPGS and Other Prognostic Variables
In addition to the univariate and multivariate analyses, FR-α and FPGS scores were analysed
to identify and correlation between them and the other prognostic variables using Bartletts
test for equal variances. Significant correlations were found between FR-α and grade
(p=0.0242), histology (p=0.0000), residual disease (p=0.0046), age (p=0.0205) and borderline
significant association with CA125 (0.0549), no association was observed between FR-α and
chemotherapy before surgery (p=0.2268) (Figure 4-18). The highest mean FR-α scores were
observed in poorly differentiated tumours (7.12) of serous/papillary serous origin (7.16, 7.93
respectively). Patients over the age of 60, with suboptimal cytoreduction and CA125 levels of
above 480 were also associated with a higher mean FR-α score (6.82, 7.82, 6.83
respectively). Significant correlations were found between FPGS and histology (p=0.0001),
with the highest mean FPGS scores being observed in papillary serous tumours (8.74) (Figure
4-19). No significant associations were observed between FPGS and grade (p=0.8207),
residual disease (p=0.0755), chemotherapy before surgery (p=0.7304), CA125 (p=0.1244) or
age (0.2454).

Development and Evaluation of Novel Monoclonal Antibodies to FR-α and FPGS
173
Table 4-3: Summary of the correlations between FR-α/FPGS and the other prognostic variables.
Variable Frequency
FR-α P value (one way
Anova)
Mean FR-α Score
Std Dev
FPGS P value (one way
Anova)
Mean FPGS Score
Std Dev
Grade 0.0242
0.8207
Poorly
Differentiated 77 7.12 4.06 7.68 3.10
Moderately
Differentiated 45 6.09 4.32 7.32 3.36
Well Differentiated 41 4.88 4.42 7.67 3.22
Histology < 0.0000 0.0001
Adenocarcinoma 2 6.50 7.78 6.00 2.83
Endometrioid 49 6.33 4.46 7.63 3.10
Papillary Serous 41 7.93 3.66 8.74 2.98
Clear Cell 16 4.75 3.17 4.18 1.94
Mucinous 17 1.53 3.00 7.47 3.00
Serous 38 7.16 3.99 7.92 3.16
Residual Disease 0.0046 0.0755
Suboptimal
cytoreduction 62 7.28 4.30 7.92 3.26
Optimal
cytoreduction 30 6.63 3.92 7.96 3.03
Complete
cytoreduction 52 4.69 4.18 6.65 3.17
Chemo before
surgery
0.2268 0.7304
No 134 6.12 4.31 7.43 3.25
Yes 7 8.14 4.10 7.00 3.00
CA125 0.0549 0.1244
<480 No 69 6.83 4.08 7.83 3.10
<480 Yes 67 5.40 4.49 6.99 3.18
Age at operation 0.0205 0.2454
<60 No 106 6.82 4.10 7.80 3.15
<60 Yes 56 5.18 4.51 7.18 3.26

Development and Evaluation of Novel Monoclonal Antibodies to FR-α and FPGS
174
Figure 4-18: Statistical analysis of the relationship between FR-alpha IHC score 1 and the other prognostic variables. (p= 0.0242 grade; 0.000 histology;
0.0046 residual disease; 0.227 chemo before surgery, 0.0549 CA125 less than 480; 0.0205 age less than 60, Bartletts test).
05
10
15
FR
alp
ha
IH
C S
core
1
P oorly differentiated Moderately differenti ated W ell differentiated
Grade
05
10
15
FR
alp
ha
IH
C S
core
1
A denocarcinoma Clear cell E ndometrioid Mucinous P apillary serous S erous
Histology
05
10
15
FR
alp
ha
IH
C S
core
1
S ubopitmal cy toreduction Optimal cytoreduction Complete cytoreduc tion
Residual disease
05
10
15
FR
alp
ha
IH
C S
core
1
No Y es
Chemotherapy before surgery
05
10
15
FR
alp
ha
IH
C S
core
1
No Y es
CA125 less than 480
05
10
15
FR
alp
ha
IH
C S
core
1
No Y es
Age less than 60
FR Alpha IHS score 1

Development and Evaluation of Novel Monoclonal Antibodies to FR-α and FPGS
175
Figure 4-19: Statistical analysis of the relationship between FPGS IHC score 2 and the other prognostic variables. (p=0.821 grade; 0.001 histology; 0.076
residual disease; 0.730 chemo before surgery, 0.124 CA125 less than 480; 0.245 age less than 60, Bartletts test).
05
10
15
FP
GS
IHC
Sco
re 2
P oorly differentiated Moderately differenti ated W ell differentiated
Grade
05
10
15
FP
GS
IHC
Sco
re 2
A denocarcinoma Clear cell E ndometrioid Mucinous P apillary serous S erous
Histology
05
10
15
FP
GS
IHC
Sco
re 2
S ubopitmal cy toreduction Optimal cytoreduction Complete cytoreduc tion
Residual disease
05
10
15
FP
GS
IHC
Sco
re 2
No Y es
Chemotherapy before surgery
05
10
15
FP
GS
IHC
Sco
re 2
No Y es
CA125 less than 480
05
10
15
FP
GS
IHC
Sco
re 2
No Y es
Age less than 60
FPGS IHC Score 2

Development and Evaluation of Novel Monoclonal Antibodies to FR-α and FPGS
176
4.4. Discussion
The results of our study found FR-α expression in 89% of 167 ovarian cancer cases tested.
This is in concordance with previous published data using LK26 and mOV18 antibodies on
frozen tissue (Garin-Chesa et al., 1993; Miotti et al., 1987).
Significant correlation between FR-α expression and survival was observed, this is consistent
with previous work, indicating a role for FR-α as a prognostic marker and potential
therapeutic target for ovarian cancer (Toffoli et al., 1997). FR-α was found to be significantly
associated with both overall survival (Figures 4-10 to 4-12) and relapse free survival (Figures
4-14 to 4-16), with patients with above median expression of FR-α having a significantly
worse outcome than those with high expression. This indicates the role for high FR-α
expression as an indicator of poor survival. Despite showing promising results in univariate
analysis it did not, however retain its significance as a marker of prognosis independent of
the other significant prognostic markers. When analysed in combination with grade,
histology, residual disease, age and CA125 values it did retain its significance (Figure 4-18).
Toffoli et al (1997) found high expression of FR- α in 122 out of 136 (90%) ovarian tumour
samples in a univariate analysis using the mOV18 monoclonal antibody and cytofluorometric
analysis. FR-α was found to be overexpressed to a higher degree in ovarian neoplasms with a
high histologic grade, advanced stage, serous histology and in a high percentage of cells in
the S-phase (Toffoli et al., 1997). Our results support the results of this study as the
frequency of expression is similar and the highest mean FR-α scores were observed in the
serous and papillary serous histological subtypes. Strong FR-α expression was also associated
with higher grade tumours with the poorly differentiated tumour group having the highest
mean FR-α score. The lowest expression was observed in the mucinous tumour group, again
this is consistent with previous published data suggesting non mucinous tumours have the
lowest expression of FR-α (Elnakat & Ratnam, 2004; Mangiarotti et al., 2001).
More recently FR-α has been analysed in other tumour types including breast, colorectal and
endometrial neoplasms with similar results (Brown Jones et al., 2008; Hartmann et al., 2007;
Shia et al., 2008). All three of these studies were performed via the use of an antibody
(mab343) developed by Wilbur Franklin and Philip Low, this antibody has not been
previously described in the literature. It has recently been reported to be suitable for use on
paraffin embedded tissue but is not commercially available. Shia et al tested mab343 on a

Development and Evaluation of Novel Monoclonal Antibodies to FR-α and FPGS
177
tissue microarray containing 152 normal colorectal mucosa samples, 42 adenomas, 152
primary and 52 metastatic colorectal carcinomas. Positive immunoreactivity was observed in
7% normal mucosa samples, 7% adenomas, 33% primary and 38% metastatic tumours.
Positive expression was found to be significantly associated with age (<65 years, p=0.08) and
presence of distant metastases (p=0.43), in addition univariate, but not multivariate analysis
identified FR-α as a marker of poor 5 year disease specific survival (p=0.04) (Shia et al.,
2008). Correlation between poor survival and high FR-α expression is consistent with the
results observed in our study, however there is a contrast between age and survival with the
highest expression observed in patients over the age of 60 in our study. The frequency of
expression in colorectal cancer also appears to be higher than the results seen with the LK26
antibody where 6/27 (22%) cases were found to be positive, however this is inconclusive as
our clone has not been tested on a cohort of this magnitude and it may be that FR-α
expression is observed more frequently in colorectal carcinomas. Further work assessing the
frequency of FR-α expression in colorectal carcinomas would be interesting.
Hartmann et al (2007) analysed FR-α expression using mab343 in breast cancer, a total of
sixty three invasive breast cancer patient samples were analysed with divergent outcomes,
thirty three had poor outcome with a median time to recurrence of 1.9 years. Thirty women
comprised the good outcome group and were free of recurrence a minimum of seven years
post diagnosis. High FR-α expression was found to be strongly associated with outcome
(p=0.001). Staining was divided into two groups, strong (n=21) or weak (n=42). In the strong
staining group 17 of 21 (81%) women had recurred compared with 16 of 42 women (38%) in
the weak staining group (Hartmann et al., 2007). Again, the results of this study are
consistent with the results observed in our study with the exception of the frequency of
staining observed in breast cancer samples being significantly higher than our observations.
33% of breast cancer cases tested were found to display strong FR-α immunoreactivity, this
is also in contrast to the results observed via the use of the LK26 antibody which reported
strong FR-α immunoreactivity in 2/53 (3.4%) breast cancer samples tested with patchy
staining observed in a further nine samples. This is more consistent with our results from our
breast cancer case study where 2/49 (5%) of samples were found to be positive.
Finally, mab 343 was analysed on a TMA containing 310 evaluable cases of endometrial
adenocarcinoma. Forty one percent were found to stain moderate/strongly. In addition to a

Development and Evaluation of Novel Monoclonal Antibodies to FR-α and FPGS
178
correlation with poor outcome this group were also found to be significantly associated with
other poor prognostic factors such as advanced stage (p=0.028), nonendometreoid histology
(p=0.001) and high grade (p=0.001). An association was also observed between
moderate/strong staining and recurrence (p=0.0014) (Brown Jones et al., 2008). The results
observed in this study were similar to the results observed in our study, with significant
associations between FR-α being observed in relation to the same poor prognostic factors
such as grade, stage and nonendometreoid histology. Similarly, in multivariate analysis, FR-α
failed to retain its significance as an independent prognostic marker in both studies.
The results of these studies appear to correlate in the most part with the results observed in
our study, despite this promise, studies using mab343 should be analysed with caution until
more information is recorded, as the frequency of expression in all three tumour types
analysed do not appear to be completely consistent with previous studies using mOV18 and
LK26 antibodies on frozen tissues, nor are they completely consistent with the analysis
performed using our antibody. There have also been reports of primarily cytoplasmic rather
than membrane immunoreactivity and nuclear cross reaction with the use of mab343 which
is inconsistent with the results of our study which clearly displays primarily membrane
staining. It may be that mab343 is slightly cross reactive which may be the reason for the
increased frequency of expression. This does not, however, appear to affect the survival
results which appear to correlate well with the results of our study.
No significant associations were observed for FPGS expression and survival in either
univariate or multivariate analysis (Figures 4-13, 4-17) and studies analysing this have not
been previously reported. Despite this the expression of FPGS did follow similar trends to
that of FR-α with the highest mean FPGS expression being observed in tumours of serous
histology and lowest FPGS levels being observed in patients under the age of 60 with
complete cytoreduction and CA125 values below 480 (Figure 4-19). The constitutive
expression of FPGS in normal as well as tumour tissue may be the reason the correlations
with survival are less obvious. Although a differential can be observed, with stronger
immunoreactivity in tumour tissue than adjacent normal tissue the results may have been
affected by this effect.
Age independently was not found to be a significant factor in prediction of survival in this
cohort, although age is usually an important prognostic factor it may not be the most

Development and Evaluation of Novel Monoclonal Antibodies to FR-α and FPGS
179
important factor in ovarian cancer as the majority of women diagnosed are over the age of
40. Other factors may dominate in this disease such as stage and grade of tumour as often it
is not diagnosed until later stages when disease has already advanced and spread beyond
pelvic cavity. However when age is analysed in combination with FR-α scores it may be of
more prognostic significance as patients over the age of 60 with high FR-α scores may be at a
higher risk of death from the tumour than those patients with lower scores.
The results seen from this and the other studies described clearly indicate a role for high FR-
α expression as an indicator of poor response and shorter survival when analysed taking into
consideration the other significant prognostic variables. The reason for this is probably due
to the cells conferring a growth advantage over other adjacent cells as the high affinity FR-α
has for folic acid would allow maximal amounts of folate to be transported into the cell and
used for the cells formation of new DNA and ultimately proliferation. Although this initially
appears to be a negative attribute it may also be of great value in the determination of
response of these patients to antifolates such as pemetrexed and additional studies using
the antibody in combination with clinical data assessing response to pemetrexed would be
extremely useful. As antifolates are not a first line therapy for the treatment of ovarian
cancer the results of this study certainly warrant further analysis and investigation into the
use of antifolates in this area and also in other tumours such as breast and colorectal
cancers.
The Aperio Scan Scope CS system used for the generation of images can also be used for
score analyses, producing computer generated scores. It would have been extremely
interesting to use this software and use the results to compare the effectiveness of the
automated system with manual scoring. Unfortunately, as this equipment was only recently
purchased this was not possible and is beyond scope of this study, whose primary aim was
not to test the effectiveness of a new technique, however this would be useful in future
work.
In conclusion, FR-α but not FPGS shows great promise as both a prognostic marker of poor
outcome and a potential determinant of response to both folate receptor targeted therapies
and some antifolates such as pemetrexed which have a high affinity for FR-α, cells with high
expression may take up the drug more readily, increasing the drug concentration in
pathologic cells and reducing toxicity in normal tissue. Ovarian cancer was the main focus of

Development and Evaluation of Novel Monoclonal Antibodies to FR-α and FPGS
180
this study as it appears to express FR-α most consistently but use of our antibody to
investigate expression in other tumour types would also be of great value, particularly as
antifolates are already routinely used in various other solid tumours.

Development and Evaluation of Novel Monoclonal Antibodies to FR-α and FPGS
181
Chapter Five

Development and Evaluation of Novel Monoclonal Antibodies to FR-α and FPGS
182
Chapter Five
5. Cell Studies After successful generation, characterisation and validation of anti-FR-α and FPGS MAbs at
Novocastra laboratories via the methods described in chapters 2 and 3, it was the aim to exploit
the novel antibodies via the generation of as much preliminary data as possible before the
antibodies became commercially available. There were a number of different study ideas and
paths to follow to generate interesting preliminary information to assess the potential of the
antibodies for a number of different applications. Once the antibodies were submitted for
approval by the consultant pathologist Dr. Hoffman and transferred to the production department
at Novocastra all subsequent studies were carried out at the Northern Institute for Cancer
Research (NICR) at Newcastle University.
As expression of both FR-α and FPGS may be important in the determination of response to
antifolates and folate targeted therapies this was another area in which generation of data may be
significant. A number of studies have identified potential modulators of FR-α expression including
oestrogen regulation and extracellular folate concentration as reviewed in section 1.8.4, which
would potentially increase the efficiacy of folate targeted therapies by selectively upregulating its
expression (Kane et al., 1988; Kelemen, 2006; Kelley et al., 2003). Based on previous studies it is
hypothesised that cells maintained in low folate conditions would express more FR-α than cells in
high folate conditions (Kelley et al., 2003), detectable by WB using clone BN 3.2.
It is also hypothesised that cells treated with oestrogens may downregulate FR-α expression as
oestrogen is thought to have a negative correlation with FR-α expression (Kane et al., 1988). The
relationship between folate concentration, oestrogen regulation and FPGS were also investigated
as an adjunct to the FR-α studies.
Comparative studies using the FR-α antibody generated in this project and the mOV18 antibody
were also planned in order to determine whether the FR-α antibody was suitable for use on frozen
tissue and to compare the staining with the only commercially available product.
During the work another antibody directed against FR-α was identified, known as the LK26
antibody. It was generated in 1985 to an antigen termed LK26 which was subsequently found to
be FR-α (Garin-Chesa et al., 1993). Like the mOV 18 antibody this antibody is unsuitable for use on

Development and Evaluation of Novel Monoclonal Antibodies to FR-α and FPGS
183
paraffin embedded samples or for WB. It was decided that, where possible this antibody would
also be used to generate extra data although not all samples could be tested due to limitations
with tissue availability. Some IHC on frozen tissue was planned to observe any similarities or
differences between the staining using all three antibodies. Like mOV18 and the data generated
from initial FR-α experiments on paraffin embedded tissue panels, LK26 expression has been
reported to be highly restricted in normal tissues with the exception of placenta and a subset of
simple epithelia. Ovarian adenocarcinomas were also found to have high expression which is
consistent with the data generated in this project and previous published data using mOV18. LK26
expression was not seen in normal adult ovary with the exception of the epithelial lining of some
benign ovarian cysts (Garin-Chesa et al., 1993). This is consistent with the expression observed
with the FR-α antibody clone BN 3.2. Mesothelioma samples were found to express little LK26,
again this is consistent with the FR-α data generated from the BN3.2 antibody.
Low/heterogeneous levels of expression were observed in endometrial, breast, lung and renal cell
carcinomas, again this was consistent with the results seen with the BN3.2 antibody which is
extremely encouraging (Garin-Chesa et al., 1993).
Assessment of the antibodies for other applications such as immunofluorescence (IF) and
fluorescence activated cell sorting (FACS) may also be useful, it was planned to carry out
preliminary studies to test the suitability of the antibodies for these applications. If successful it is
likely that the antibody may have potential neutralising properties and it was planned to perform
growth assays on cells known to express FR-α for any such properties it may possess, as the
antibody alone may have direct therapeutic potential. In order to achieve this some FR-α antibody
was purified in preparation for growth assays. This was achieved by column chromatography on a
protein A sepharose (Prosep A, Millipore) column. The resultant purified antibody was stored in
PBS in preparation for use in growth assays. This ensured that any growth factors present in the
neat media would not have any effect on the cell growth and the effects observed would be due
to the antibody alone.
As FR-α is already known to be highly expressed in the majority of ovarian tumours, these patients
may all be selected for folate targeted therapies automatically without the need for a prior
screening IHC test. It is hypothesised that use of the BN 3.2 antibody as a companion diagnostic
may be more relevant in tumours overexpressing FR-α at a lower frequency in other tumour types.
Breast cancer samples, collected in conjunction with clinical trials of the antifolate pemetrexed

Development and Evaluation of Novel Monoclonal Antibodies to FR-α and FPGS
184
were also analysed to observe the frequency of expression in these tumours as it may have a role
in the prediction of response to pemetrexed where its expression is high.
5.1. Cell Studies - Aims and Objectives
Generate some preliminary data on the potential applications of the antibodies
generated.
Investigate the effect of oestrogen modulation on expression of FR-α and FPGS proteins.
Investigate the effect of folate modulation on expression of FR-α and FPGS protein.
Assess suitability of FR-α antibody for IHC on frozen tissue and comparative studies with
the commercially available mOV18 antibody.
Assess expression of FR-α on a breast tumour panel provided by Eli-Lilly collected in
conjunction with clinical trials of pemetrexed.
Assessment of suitability of the FR-α antibody for application in IF and FACS.
If IF and FACS successful perform cell growth assays for identification of any potential
neutralising properties the FR-α antibody may possess.

Development and Evaluation of Novel Monoclonal Antibodies to FR-α and FPGS
185
5.2. Oestrogen Regulation Study – Materials and Methods
5.2.1. Culture and Treatment of Cells
The human ovarian cell lines OSEC2 (normal human ovarian surface epithelium), OVCAR-3 (human
ovarian adenocarcinoma) and MDAH 2774 (human ovarian adenocarcinoma) were kindly grown
and provided by Dr. Ann Fisher for use in this study. Cells were cultured in 96 well sterile culture
plates in RPMI 1640 (Sigma) overnight, washed and grown for 72 hours in oestrogen depleted
conditions in phenol red free (PRF) RPMI with dextran coated charcoal (DCC), the purpose of the
DCC was to remove any steroid hormones from the media. Cells were then treated in PRF-RPMI-
DCC for 48 hours.
Treatments were either;
No treatment
Vehicle (ethanol)
Oestrogen (oestraidol) 10-6, 10-8, 10-9, 10-12 M doses.
Cell pellets were then obtained and prepared for WB according to the methods previously
described (section 3.3.4) to determine the effect of oestrogen treatment on the level of expression
of FR-α. It is hypothesised that oestrogen treatment may downregulate the expression of FR-α.
(Kelley et al., 2003; Rochman, Selhub, & Karrison, 1985, Kelley, 2003 #37) As the point at which
FR-α expression is first initiated between normal and tumour cells and the mechanism by which
this occurs is still unknown, normal human ovarian surface epithelial cells were also used in this
study to observe any changes in expression which oestrogen treatment may cause in these cells.

Development and Evaluation of Novel Monoclonal Antibodies to FR-α and FPGS
186
5.3. Oestrogen Regulation Study - Results Figure 5-1: FR-α oestrogen regulation WB. Detection of FR-α WT protein by WB on three cell lines; OVCAR-3;
OSEC2 and MDAH treated with oestrogen via use of the generated FR-α BN3.2 antibody. 0= no treatment, V= vehicle.
An antibody to α-tubulin (55kDa) was used as a loading control to correct for variations in loading between samples.
No FR-α expression was observed in the OSEC-2 or MDAH cell lines. Expression was observed in
the OVCAR-3 cell line although this did not appear to alter with oestrogen treatment (Figure 5-1).

Development and Evaluation of Novel Monoclonal Antibodies to FR-α and FPGS
187
5.4. Oestrogen Regulation Study – Discussion
The results generated from the oestrogen regulation study were limited as only one cell line
(OVCAR-3) showed any reactivity to FR-α and the expression did not appear to decrease with
oestrogen treatment (Figure 5-1), as hypothesised and as has been previously reported in the
literature (Kelley et al., 2003). It was planned to carry out an additional control experiment to
ensure the system was working and to show that oestrogen treatment did have an effect by
probing the membranes with a known oestrogen regulated protein. Western blotting to detect
oestrogen receptor expression was initially planned as the control experiment, using an oestrogen
receptor antibody (Novocastra Laboratories), however no specific reactivity was observed via WB
in any of the cell lines used. A number of different antibodies to other oestrogen regulated
proteins were also tested until availability of sample limited further tests, progesterone receptors
A and B, PS2, cathepsin B and D, heat shock protein (HSP) 27 and C Myc were identified as
oestrogen regulated proteins (Langdon et al., 1995; Nakopolou et al., 1995; Rochefort, 1995).
Antibodies were located and tested via WB analysis, however, none of the antibodies tested
appeared to show any reactivity with any of the cell lines. It may be that the cell lines selected for
use in this work are not the optimal selection of cell lines to use for the control proteins tested,
and the results of these studies cannot be relied on without a valid control antibody known to
react with a protein regulated by oestrogen.
Unfortunately, due to time limitations it was not possible to culture these cells specifically for this
experiment. The cells used were kindly donated by Dr. Ann Fisher and were unfortunately not
optimal for use in this experiment. Additional experiments would need to be performed using
different cell lines to clarify this result as these results are, at present inconclusive as FR-α does
not appear to alter upon treatment with oestrogen. With the failure to generate any data at all in
2/3 cell lines and the absence of a valid control it is not possible to determine whether the results
of this experiment are accurate and reproducible. To draw a conclusion different cell lines such as
IGROV-1 ovarian cancer and HeLa cervical cancer cell lines should have been used as these are the
cells reported to respond to oestrogen treatment in the literature and are both known to express
high levels of FR-α (Kelley et al., 2003). In addition, these experiments were performed in media
containing supra physiological levels of folate which may also have had an effect on FR-α
expression. The media used in these experiments may have downregulated FR-α expression
therefore even if there had been an effect on the expression it would not have been possible to
determine if this was due to the oestrogen or the effect of the use of supra physiological levels of
Development and Evaluation of Novel Monoclonal Antibodies to FR-α and FPGS
188
folate in the media. Treatment of the cells with an antioestrogen such as Tamoxifen may have also
been tested in addition to oestrogen treatment as this would have potentially upregulated FR-α
and would be a useful additional experiment. Unfortunately as there was insufficient time
available to carry out these experiments independently it had to be concluded at this point with a
view to re-investigating this as future work, despite this the fact the experiment was performed
was worth mentioning as there is much possibility for expansion and further investigation. Despite
this the potential still remains to selectively upregulate FR-α expression to increase the efficiacy
and frequency of tumours for folate receptor targeted therapies.
5.5. Extracellular Folate Concentration Study – Materials and Methods
Extracellular folate concentration is hypothesised to affect the level of expression of FR-α; as the
requirement for folate is altered the expression of the receptor is thought to alter to reflect this
change, with upregulation in folate depleted conditions and downregulation in high folate
conditions where there is lesser need for a high intracellular folate concentration. In vitro studies
have also demonstrated that this is the case (Kane, Elwood et al. 1988; Doucette and Stevens
2001).
The human ovarian carcinoma cell lines IGROV-1, SKOV-3 and SW626 and the cervical carcinoma
cell line HeLa were selected for use in this study due to their known, varied levels of expression of
FR-α as seen from previous WB data and as these cells have been used previously in the literature
to investigate the effect of folate concentration on FR-α expression (Miotti et al., 1995).
Cell lines were cultured in normal conditions (2mM L-glutamine, 5% CO2, 37 oC) using standard
aseptic tissue culture techniques. The different culture conditions were as follows:
High folate (HF) media – 500 mls RPMI 1640 (Sigma), 50 mls FBS, 5 mls
penicillin/streptomycin. This media contains supra physiological concentrations of folate
but the precise level of folate cannot be measured.
Normal folate (NF) media – 500 mls folate free RPMI 1640 (Gibco cytogenetics), 50 mls
dialysed FBS, 20μM folinic acid, 5mls penicillin/streptomycin. This media also contains

Development and Evaluation of Novel Monoclonal Antibodies to FR-α and FPGS
189
supra physiological concentrations of folate but the concentration can be more
accurately determined via the use of folate free media.
Low folate (LF) media – 500 mls folate free RPMI, 50 mls dialysed FBS, 20 nM folinic
acid, 5mls penicillin/streptomycin. Although termed low-folate this media actually
contains a concentration of folate approximating physiological levels in humans, for the
purpsose of this study it was termed low folate media.
Once adapted to low folate media the cells were maintained for a period of one month before
collection of cell pellets for subsequent protein estimation and WB using the methods described in
section 3.3.4. All four cell lines were tested by WB for HF, NF and LF media to observe the effect of
alteration of extracellular folate concentration on both FR-α and FPGS expression.
5.6. Extracellular Folate Concentration Study – Results
5.6.1. FPGS Figure 5-2: FPGS extracellular folate concentration WB. Representative WB (n=3) showing detection of FPGS WT
protein by WB on four cell lines (IGROV-1, SKOV-3, SW626 and HeLa) grown in LF, NF and HF media via use of the
generated FPGS NN3.2 antibody. An antibody to β-actin was used as a loading control to correct for variations in
loading between samples.
Slightly lower FPGS expression was observed in the IGROV-1 LF cell line relative to the NF and HF
conditions. Similar expression was observed in all three of the SKOV-3 and SW626 cell lines.
Similar expression was also observed in HeLa cells, although a little less sample was loaded in the

Development and Evaluation of Novel Monoclonal Antibodies to FR-α and FPGS
190
HF sample which may indicate that FPGS expression in the HF condition was slightly lower than in
the NF and LF conditions (Figure5-2).
5.6.2. FR-α Figure 5-3: FR-α extracellular folate concentration WB. Representative WB (n=3) showing detection of FR-α WT
protein by WB on four cell lines grown in LF, NF and HF media via use of the generated FR-α BN3.2 antibody. An
antibody to α-tubulin was used as a loading control to correct for variations in loading between samples.
Slightly lower expression was observed in the IGROV-1 LF cell line. Lower expression was observed
in the SKOV-3 HF and LF cells and higher expression in the NF cells. High expression was seen in
the SW626 HF cells and lower expression in the NF and LF cells. Slightly lower expression was
observed in the HeLa LF cells relative to the NF and HF cells (Figure5-3).
5.7. Extracellular Folate Concentration Study – Discussion
The results of this preliminary study indicate there was no significant correlation between folate
concentration and FPGS expression, this is not consistent with the results from a previous study
indicating that folate restriction significantly increases FPGS activity (Gates, Worzalla, Shih,
Grindley, & Mendelsohn, 1996). In the IGROV-1 cells, a subtle difference was observed with lower
FPGS expression in the LF cells in relation to HF and NF (Figure 5-2). This contradicts the results
observed in this study as the LF condition appeared to have reduced the expression of FPGS. Little
fluctuation between FPGS expression was observed in the SKOV-3 and SW626 cells, indicating

Development and Evaluation of Novel Monoclonal Antibodies to FR-α and FPGS
191
extracellular folate concentration does not affect FPGS expression in these cells. The result
obtained from the HeLa cells, although very subtle also indicated that FPGS expression was slightly
higher in cells grown HF media, although in this HF condition the exact level of folate present in
the media is not measurable (Figure 5-2). Again these results appear to contradict the results seen
in previous studies (Gates et al., 1996).
For FR-α expression both the IGROV-1 and HeLa LF cells appeared to have slightly lower expression
compared to the HF and NF condition, again this is in contrast to the hypothesis (Figure 5-3).
SKOV-3 NF was found to have significantly higher expression than the HF and LF conditions, again
this does not support the hypothesis that FR-α is upregulated in response to lower concentrations
of folate. For the SW626 cells the HF condition was found to have the highest FR-α expression.
(Figure 5-3) None of the results from this preliminary study appear to support the hypothesis that
low folate concentration increases FR-α expression, despite previous reports indicating that folate
receptor function is regulated in response to altered folate concentration in culture (Doucette &
Stevens, 2001; Kane et al., 1988; Kelemen, 2006). This may have been due to fluctuations in
concentration of folate in the dFCS, although the same batch was used in all experiments.
Although denoted LF, the lowest folate condition actually contained a concentration of folate
(20nM) approximating physiological levels in humans. Future work may be focused upon repeating
this experiment with a true low folate condition, i.e. containing 10nM folinic acid or below to
observe any differences restricted folate has upon FR-α expression. As for the results observed in
the oestrogen regulation experiment this is a useful initial experiment which is worthy of further
investigations, although due to time limitations expansion was not possible in this project.
5.8. mOV18 Comparative Study –Materials and Methods
IHC on frozen placenta and normal, primary and metastatic ovarian tumour tissue sections, kindly
donated by Dr. Jane Margetts was performed to generate results to satisfy two aims;
To assess the suitability of the FR-α antibody for application on frozen tissue – if specific
staining was observed it may have been likely that the antibody recognises the native
conformation of the protein and may possess neutralising properties.
To directly compare the expression and staining between FR-α and the commercially
available mOV18 antibody to observe any correlation in the staining between them. As

Development and Evaluation of Novel Monoclonal Antibodies to FR-α and FPGS
192
no other known antibodies suitable for use on paraffin embedded tissue exist, much of
the information on FR-α tissue expression had been elucidated by the use of the mOV18
antibody on frozen tissue. It would be expected that the staining would be similar in
both intenstity, proportion of tumour stained and cellular localisation.
A total of 39 samples were available for testing, although there were limitations upon the amount
of tissue which could be used. In addition to placenta and normal ovary, samples from 10 ovarian
cancer patients were available for use, primary tumour samples and metastases from the same
patient were collected. Each patient sample was numbered 1-10 and metastases were numbered
with the patient number and M1,2 3 etc to identify metastases from each patient. The FR-α
antibody only was used in this study.
Frozen sections were air dried under a fan for 1 hour prior to fixation. Initially a pilot test was
performed to determine the optimal fixation method, no fixation, methanol, acetone and formalin
were used and the sections were incubated for 10 minutes and air dried for 10 minutes post
fixation. The remaining IHC was carried out using the same Novolink polymer method as used
throughout the project and sections were treated in the same way as paraffin embedded samples,
differing only in the initial steps and omitting the antigen retrieval step.
5.9. mOV18 Comparative Study - Results
Initial tests on ovarian sections showed little/ no correlation between the staining using the
mOV18 antibody and the BN 3.2 antibody. As this study was not conclusive it was decided to
discontinue this study as accurate comparisons could not be drawn from the data generated. The
FR-α staining was not similar to the mOV 18 staining in intensity or pattern, although there was
some staining seen it was weak and heterogeneous. It was decided that unless corresponding
frozen and paraffin samples could be collected that accurate comparisons could not be made
between the antibodies and that the generated BN 3.2 antibody was not suitable for use on frozen
tissue. As it was the significance of the comparative study which was most important the data
generated from use of the mOV18 antibody was not thought to be significant alone. As the BN 3.2
antibody was found to be unsuitable for use on frozen tissue it was also unlikely that it would have
any neutralising properties and recognise the protein in its native conformation via growth assays,
Development and Evaluation of Novel Monoclonal Antibodies to FR-α and FPGS
193
although it was decided to assess the suitability for use in IF before deciding whether to proceed
with growth assay experiments.
It was not until epitope mapping the BN 3.2 antibody that a significant development was observed
which may enable the antibodies to be compared on frozen tissue, it was at this point that this
experiment was revisited. Epitope mapping and the analysis is described in section 3.5.12. It was
hypothesised that addition of a reducing agent to the tissue may denature the sample and expose
a linear epitope recognised by the BN 3.2 antibody. The sections were treated with 5% DTT in
protein block for 10 minutes prior to addition of the primary antibody. This additional step had not
been previously reported as an IHC technique as it was thought this may destroy the antibody
conformation; however the step appeared to restore the epitope recognised by the BN 3.2
antibody, allowing it to bind to the tissue in a similar manner to that of both the mOV18 and LK26
antibodies. Similarly treatment with DTT was also seen to destroy the epitope recognised by the
mOV18 antibody causing a reduction in staining. In this study five sections only were used for each
antibody and treatment due to limited supplies of tissue.

Development and Evaluation of Novel Monoclonal Antibodies to FR-α and FPGS
194
Figure 5-4: FR-α mOV18 comparative study. Immunohistochemical staining for FR-α using clone BN 3.2, mOV18
and LK26 antibodies on sections of freshly frozen placenta, normal ovary and ovarian adenocarcinoma primary and
metastases. Note the similarities in staining between the mOV 18, LK 26 non reduced and the BN 3.2 reduced
samples. Also of particular note is the atypical staining in the BN 3.2 non-reduced samples and reduction in staining in
the mOV18 reduced samples.

Development and Evaluation of Novel Monoclonal Antibodies to FR-α and FPGS
195
5.10. mOV18 Comparative Study – Discussion
When compared with the mOV18 antibody on frozen ovarian tumour tissue the staining did not
appear to be comparable, BN3.2 did not stain any of the tissues as strongly as mOV18. The FR-α
antibody may not be as effective in detection of the native conformation of the protein although it
does, however appear to recognise an epitope linear in nature as it is suitable for WB. It is likely
that the mOV18 antibody recognises a conformational epitope as it is unsuitable for WB analysis.
Treatment of the tissue with DTT and IHC with mOV18 causes a reduction in staining, indicating
that the epitope is destroyed by reduction, again supporting the theory that mOV18 recognises a
conformational epitope (Figure 5-4). This was not performed on LK26 due to tissue limitations.
The data generated from this study has shown that treatment of frozen tissue with a reducing
agent exposes the epitope recognised by BN 3.2, allowing more accurate comparisons between
the staining seen from clone BN 3.2 compared with the other antibodies on the market, LK26 and
mOV18. Although more studies were not carried out due to time limitations this would be an
interesting experiment to perform and tissue may be easier to obtain than attempting to find
corresponding frozen and paraffin embedded samples from the same patient. The technique of
reducing samples before performing IHC is not commonly used, possibly due to the assumption
that reduction of a sample may destroy the antibody structure. One report of use of reducing
agents was found where paraffin embedded samples were treated with DTT and 2-
mercaptoethanol before performing IHC, although in this case no effect was observed (Costa,
Jacobsson, Collins, & Biberfeld, 1986). The results seen were comparable to that of the non-
reduced LK26 and mOV18 samples, however, there were insufficient samples to score and
perform statistical correlative analysis. A study using a larger number of samples and statistical
analysis may be of value, although may not be necessary as sufficient data has been generated to
fully validate the BN 3.2 antibody and to ascertain that is it specific for its target.
5.11. Breast Cancer Case Study – Materials and Methods
Samples of breast cancer cases collected in conjunction with clinical trials of Pemetrexed were
provided by Eli Lilly to observe the frequency of expression of FR-α in breast cancer. Clinical data
was not available so analysis of response could not be performed. Forty nine samples in total were
provided and IHC was performed using the Novolink polymer kit as previously described in section
3.3.6.2.

Development and Evaluation of Novel Monoclonal Antibodies to FR-α and FPGS
196
5.12. Breast Cancer Case Study – Results
Of thirty eight evaluable cases only two (5.3%) displayed strong immunoreactivity, one section
(2.6%) displayed moderate reactivity, ten (26%) displayed weak reactivity and the remaining
twenty five samples (66%) were negative.
Figure 5-5: FR-α Breast cancer IHC case study. Immunohistochemical staining for FR-α on six breast cancer case
studies using clone BN3.2. Negative/very weak staining was observed in the majority of samples (a,b,c), moderate
staining (1+-2+) was observed in one sample (d) and strong staining (3+) observed in two samples tested. (e,f).

Development and Evaluation of Novel Monoclonal Antibodies to FR-α and FPGS
197
5.13. Breast Cancer Case Study - Discussion
Few samples showed FR-α expression, out of thirty eight evaluable samples tested only two (5.3%)
displayed strong FR-α expression (Figure 5-5). These samples were collected in connection with
clinical trials of Pemetrexed and it was inferred that this would be the key in determination of
response, however this has not been found to be the case and unfortunately the clinical data has
not been made available so no precise conclusions can be drawn from this study. Although only a
small number of cases were found to be positive this may still be of significance as it may indicate
a subset of breast cancer patients with tumours which may respond well to folate receptor
targeted therapies. The striking difference between the weak and strongly immunoreactive
samples would allow for a distinguishable positive or negative result. Unfortunately it is not known
whether these tumours are primary or metastatic tumours. It would be interesting to observe the
clinical information as it may be that the strong subset of tumours are oestrogen regulated or may
even be be ovarian metastases. Such patients may benefit from other therapies aimed at
modulating FR-α expression to increase the potential efficiacy of folate targeted therapies.
Despite the lack of clinical data this study has been useful as the results obtained are concomitant
with the results previously seen via the use of the LK26 antibody on frozen breast cancer tissue, of
fifty evaluable cases only two (4%) showed homogeneous LK26 expression with a further nine
(18%) cases displaying weak, patchy expression.
Additional studies assessing the frequency of expression of FPGS may also be useful although in
this study there were only sufficient samples to test FR-α.
Future testing on larger cohorts of breast cancer samples to further test the frequency of FR-α
expression in breast cancers would be extremely interesting and this is a useful preliminary
experiment demonstrating that investigation of FR-α expression in breast cancer is worthy of
further investigation.
5.14. Immunofluorescence Studies – Materials and Methods
The suitability of the FR-α antibody for application in IF was assessed, if successful it was
hypothesized that clone BN 3.2 may also possess potential neutralising properties as, like frozen
tissue, the cells are in their native conformation. mOV 18 was also tested for comparison.

Development and Evaluation of Novel Monoclonal Antibodies to FR-α and FPGS
198
Multiple 8 well glass culture chamber slides (Nunc) were used for IF. The IGROV-1 ovarian
carcinoma cell line was used in all IF studies as it has been found to express a high level of FR-α
protein in previous studies. Initially a pilot study to determine the optimal cell seeding density,
antibody concentration and cell fixation method was performed. 100, 1000, 2000 and 5000 cells
were added to the first 4 wells of the 8-well chambers and repeated until a total of 10 chambers
had been seeded. The cells were incubated for 48 hours at 37oC to allow the cells to adhere and
multiply, spreading over the surface of the slide. The chambers were then washed in ice cold PBS
and fixed with either ice cold methanol at -20oC or 10% formalin for 10 minutes. The
methanol/formalin was aspirated and cells were rehydrated in PBS for 5 minutes then washed
twice in PBS prior to blocking for 1 hour at RT or 4oC overnight in blocking solution. (KCM buffer-
[120mM KCl, 20 mM NaCl, 10 mM Tris/HCl pH 8, 1 mM EDTA] + 0.1% Triton-x-100 (Sigma) , 2%
BSA, 10% dried milk powder). After incubation the blocking solution was removed and FR-α, FPGS
and mOV 18 antibodies at 1/10, 1/20, 1/50 and 1/100 dilutions in blocking solution were added to
the wells and incubated for 1-2 hours at RT or overnight at 4oC. The cells were then washed three
times for 15 minutes each time in washing solution (KCM buffer + 0.1% Triton-x-100) on a platform
shaker. A fluorescent labelled antibody, Alexa fluor 594 (red) labeled goat-anti mouse IgG,
(Invitrogen, Molecular Probes) at a dilution of 1/200 in blocking solution was then added to the
cells and incubated in the dark for 1-2 hours at RT or 4oC overnight. The cells were again washed
three times in PBS, protected from the light, allowed to dry and mounted using hard set
Vectashield mounting medium with DAPI to allow visualisation of the nucleus. The cells were
analysed by fluorescence microscopy.
5.15. Immunofluorescence Studies - Results
The initial pilot studies were unsuccessful, fluorescence was observed via use of the mOV18
control antibody although no specific fluorescence could be seen with the FR-α antibody.
This experiment was discontinued but following epitope mapping it was decided to revisit the IF
studies, discussed in detail in section 3.5.12. It was decided that another study would be
performed as with the frozen study, this time reducing the samples with 5% DTT during the
blocking step to observe the effect this may have on fluorescence.

Development and Evaluation of Novel Monoclonal Antibodies to FR-α and FPGS
199
The reducing agent appeared to alter the protein structure, allowing the FR-α antibody to bind to
the membranes. The opposite effect occurred with the mOV18 antibody and after treatment with
DTT the fluorescent signal was reduced (Figure 5-6).

Development and Evaluation of Novel Monoclonal Antibodies to FR-α and FPGS
200
Figure 5-6: IF comparative study WB. IF photographs comparing fluorescence between the mOV 18 antibody and
the BN3.2 antibody. Blue reactivity illustrates the cell nuclei and red reactivity illustrates the reactivity of the antibody.
A merged image was also taken to illustrate the location of the antibody reactivity in relation to the cell. Note the
membrane fluorescence (red) in the mOV 18 non-reduced photographs and reduction in fluorescence when the cells
are reduced. Also note the opposite occurring in the NN 3.2 antibody treated cells.
Development and Evaluation of Novel Monoclonal Antibodies to FR-α and FPGS
201
5.16. Immunofluorescence Studies - Discussion
The results seen for the IF studies are similar to that of the frozen studies as it was treatment
with a reducing agent which allowed for comparison of fluorescence between the BN3.2 and
mOV18 antibodies. The fluorescence observed with the reduced FR-α sample was similar to
that of the non-reduced mOV18 control fixed in methanol. The fixation method used did not
appear to have a significant effect on the epitope recognised by the BN 3.2 antibody, however,
methanol was the only fixation method suitable for the mOV18 antibody (Figure 5-6). This
suggests that the mOV 18 epitope is quite unstable and treatment of the cells easily destroys
the epitope, this also supports the fact mOV 18 is unsuitable for use on FFPE samples.
Although these studies have provided interesting information on the applications of the BN 3.2
antibody the main focus of these studies has been proven to be unsuccessful. It was hoped that
the BN 3.2 antibody, if suitable for use on frozen tissue and by IF may have potential
neutralising properties, however these results have indicated that the epitope recognised,
although linear is not exposed on the surface of cells in their native conformation. Although
treatment with reducing agents caused epitope retrieval, this would be unsuitable for
treatment of cells via growth assays in vitro and subsequent in vivo studies due to the toxic
effects of reducing agents. For this reason it was decided not to perform FACS or growth assays
as both these methods are dependent upon the antibody being able to recognize the protein in
its native conformation.
It can be concluded that, although possible our antibody is not suited to IF, antibodies such as
mOV18 and LK26 may have greater utility in this area as they detect the protein in its native
conformation. This is not entirely bad news as there are already two antibodies potentially
suitable for this application and the major aim was to generate something novel; these
antibodies are also currently in trials as immunotherapeutic agents so the fact our antibody is
unlikely to be suitable for this too is neither surprising or disappointing as there is still a gap in
the market for antibodies suitable for use on FFPE samples.

Development and Evaluation of Novel Monoclonal Antibodies to FR-α and FPGS
202
Chapter Six

Development and Evaluation of Novel Monoclonal Antibodies to FR-α and FPGS
203
Chapter Six
6. Concluding Remarks and Future Direction The major aim of this study, which was primarily to generate two monoclonal antibodies with
specific reactivity for FR-α and FPGS, suitable for use on paraffin embedded samples, has been
successfully achieved. In addition, both antibodies are suitable for use in WB analysis. Prior
attempts to generate a specific antibody to FR-α suitable for this application have been
unsuccessful. Valuable knowledge has been gained in overcoming problems associated with the
generation of antibodies to difficult targets, including comprehensive screening protocols which
could also be applied to other difficult targets.
In addition to successful generation of the antibodies, the ovarian TMA study and subsequent
statistical analysis found a significant association between high FR-α expression and poor
survival, which indicates a role for FR-α as a valuable prognostic marker of survival in ovarian
cancer patients in combination with other independent markers of prognosis. Future studies
using the FR-α antibody on paraffin embedded tissue may be extremely significant in the
diagnosis, treatment and prognostic outcome of patients with ovarian cancer.
It was hypothesized that BN3.2 may also be of potential use in trials using pemetrexed as an
indicator of response to this drug. It was disappointing to subsequently find no association
between expression of FR-α and pemetrexed activity in MPM. Although this may not be the
case for pemetrexed, there are now a number of small molecule therapies currently being
evaluated which have been shown to have high affinity for FR-α over the RFC. BN3.2 may have
a role to play as a companion disgnostic for these compounds if they are found to be effective
antitumour agents.
Future work to carry out additional testing using FR-α on panels of tumours other than ovarian
cancers or MPM such as colon carcinomas, breast, endometrial cancer and other solid tumour
samples may also be of value. Although these tumours may not express FR- α as consistently,
identification of subgroups of patients likely to respond to FR-α targeted therapies would also
indicate a role for our antibody, again as a companion diagnostic.

Development and Evaluation of Novel Monoclonal Antibodies to FR-α and FPGS
204
A study assessing the expression of FPGS and response to pemetrexed in various tumours,
particularly MPM would be extremely interesting as this protein may also be of importance in
the determination of response since antifolates are polyglutamated. Although the FPGS
statistical analysis did not find it to be a significant marker of prognosis it did follow a very
similar trend to that of FR-α and use of the FPGS antibody as a predictor of response cannot be
ruled out. This may not be restricted to ovarian cancer, particularly as it has a much wider
pattern of expression than FR-α. Although it is constitutively expressed in the majority of
proliferating cells its expression is higher in tumours and the difference in intensity can be
easily observed via IHC analysis.
The cell studies discussed in this project provide useful preliminary data, investigation of the
effect of oestrogen regulation, extracellular folate concentration and the expression of FR-α in
breast cancer are worthy of further investigation and the results of our studies support this as
there is much to learn in these areas.
The initial aim was to generate a panel of antibodies suitable for a number of different
applications, however the problems encountered during molecular biology limited this and
eventually only one successful antibody was generated for each protein. This is likely to be due
to the extensive additional antibody screening protocol designed to ensure the antibodies
generated were specific for the target alone which significantly reduced the number of clones
handled at each stage. This was necessary to ensure there were no soluble stress proteins
contaminating the samples to which antibodies could be generated. Despite this, the antibodies
generated have now been proven to be highly specific for their targets and are suitable for use
both on paraffin sections and via Western blot. Their specificity has been further confirmed by
epitope mapping analysis which confirmed that both antibodies recognised a linear epitope
present in their target sequence. The problems encountered in molecular biology may also
explain the reason for previous unsuccessful attempts to generate an antibody to FR-α suitable
for use on paraffin sections.
The frozen and IF studies have been able to provide valuable insight into the potential uses of
the FR-α antibody, indicating uses not only for FFPE IHC and WB but, with modification of
existing techniques, potential application in both IF and Frozen IHC. It is unlikely it will routinely

Development and Evaluation of Novel Monoclonal Antibodies to FR-α and FPGS
205
be utilised for such techniques when antibodies suitable for use in these applications are
already commercially available and have been for a significant time.
It is disappointing that the application of BN3.2 in FACS and growth assays were found to be
limited, however, it is not surprising as this antibody was specifically designed for use on FFPE
sections. It is highly unlikely that one antibody be suitable for applications where the protein is
both fixed and in its native conformation, as demonstrated previously by the mOV 18 and LK26
antibodies which carry unstable, conformational epitopes and are only suitable for IHC on
frozen tissue. As these antibodies are unsuitable for routine applications it makes the work
performed in this project novel, it also indicates a role for BN3.2 as a companion diagnostic to
be used in combination with potential neutralizing antibodies as well as small molecule
therapies. BN3.2 was not found to have any potential as a neutralising antibody, this is likely to
be due to both the avoidance of key residues required for protein activity in order to comply
with GMAG regulations and the cysteine rich sequence causing extensive folding of the protein.
Neutralising antibodies are likely to recognise active residues and recognise epitopes in their
native, conformational form. As these antibodies were specifically designed for use on paraffin
sections, in hindsight, this is probably not the most appropriate method to use for neutralising
antibody design. Generation of an antibody suitable for use on paraffin is probably of more
value in this instance as there are already two potential neutralising antibodies on the market
which are both undergoing trials.
The results of the oestrogen regulation study could also be expanded upon by repeating this
experiment, assessing other potential modulators of FR-α expression such as caveolin 1
(Bagnoli et al., 2000; Sanna et al., 2007), the glucocorticoid receptor (Tran et al., 2005) or
retinoic acid receptor would also be an interesting area of investigation, unfortunately in this
particular study time limited further investigations in this area (Bolton et al., 1999). This is a
particularly important area of research as modulation to selectively overexpress FR-α in
malignant cells would be extremely advantageous in enhancing antifolates uptake by
pathologic cells and reduction of toxicity in normal tissue. This ‘magic bullet’ approach is the
major aim in the research of all types of cancer and the antibodies generated in this project will
greatly assist such future studies.

Development and Evaluation of Novel Monoclonal Antibodies to FR-α and FPGS
206
Useful information on the antibody epitope recognition sites has also been elucidated, allowing
future work to be directed appropriately. Both antibodies are also commercially available, filling
the gap in the market and increasing the potential for further, large scale studies to be carried
out.
In conclusion, both antibodies will be valuable tools for assessment of FR-α and FPGS
expression in a variety of tumours, I confident that now they are commercially available they
are an important tool and will play an extremely valuable role in both the diagnosis and
treatment of not only ovarian malignancies but also subsets of other human cancers with high
FR-α expression. Perhaps they may be even more important as companion diagnostics for
tumours other than ovarian malignancies where the expression is less consistent and as
determinants of response for all future FR-α directed therapies.

Development and Evaluation of Novel Monoclonal Antibodies to FR-α and FPGS
207
References

Development and Evaluation of Novel Monoclonal Antibodies to FR-α and FPGS
208
References Alberts, B., Johnson, A., Lewis, J., Raff, M., Roberts, K., & Walter, P. 2002. Molecular Biology of
the Cell (Fourth ed.): Garland Science Taylor and Francis Group. Alkan, S. S. 2004. Monoclonal antibodies: The story of a discovery that revolutionised science
and medicine. Nature Review Immunology, 4: 153-156. Antony, A. C. 1992. The biological chemistry of folate receptors. Blood, 79: 2807-2820. Antony, A. C. 1996. Folate Receptors. Annual Review of Nutrition, 16: 501-521. Antony, A. C., Kane, M. A., Portillo, R. M., Elwood, P. C., & Kolhouse, J. 1985. Studies of the role
of a particulate folate binding protein in the uptake of 5-methyltetrahydrofolate by cultured human KB cells. Journal of Biological Chemistry, 260: 14911-14917.
Antony, A. C., Tang, Y. S., Khan, R. A., Biju, M. P., Xiao, X., Li, Q. J., Sun, X. L., Jayaram, H. N., & Stabler, S. P. 2004. Translational upregulation of folate receptors is mediated by homocysteine via RNA-heterogenous nuclear riboprotein E1 interactions. Journal of Clinical Investigation, 113(2): 285-301.
Armstrong, D. K. 2009. Efficacy and safety of farletuzumab, a humanized monoclonal antibody to folate receptor alpha, in platinum-sensitive relapsed ovarian cancer subjects: preliminary data from a phase-2 study. European Journal of Cancer, 7(7): 449.
Bagnoli, M., Tomassetti, A., Figni, M., Flati, S., Dolo, V., Canevari, S., & Miotti, S. 2000. Downmodulation of caveolin-1 expression in human ovarian carcinoma is directly related to alpha folate receptor overexpression. Oncogene, 19: 4754-4763.
Baneyx, F. 1999. Recombinant protein expression in Escherichia coli. Current Opinion in Biotechnology, 10: 411-421.
Barredo, J. C., & Moran, R., . 1992. Determinants of antifolate cytotoxicity: folylpolyglutamate synthetase activity during cellular proliferation and development. Molecular Pharmacology, 42: 687-694.
Basal, E., Eghbali-Fatourechi, G. Z., Kalli, K. R., Hartmann, L., Goodman, K., Goode, E. L., Kamen, B. A., Low, P. S., & Knutson, K. L. 2009. Functional folate receptor alpha is elavated in the blood of ovarian cancer patients. PLoS One, 4(7): e6292.
Berg, J. M., Tymoczko, J. L., & Stryer, L. 2002. Biochemistry (5th ed.): W.H Freeman and Co New York.
Berry, J. D. 2005. Rational monoclonal antibody development to emerging pathogens, biothreat agents and agents of foreign animal disease: The antigen scale. The Veterinary Journal, 170: 193-211.
Bolton, J. A., Wood, S. A., Kennedy, D., Don, R. H., & Mattick, J. S. 1999. Retinoic acid-dependent upregulation of mouse folate receptor alpha expression in embryonic stem cells, and conservation of alternate splicing patterns. Gene, 230(215-224).
Brown Jones, M., Neuper, C., Clayton, A., Mariani, A., Konecny, G., Bijoy Thomas, M., Keeney, G., Hartmann, L., & Podratz, K. C. 2008. Rationale for folate receptor alpha targeted therapy in high risk endometrial carcinomas. International Journal of Cancer, 123: 1699-1703.
Brzczinsca, A., Winska, P., & Balinska, M. 2000. Cellular aspects of folate and antifolate membrane transport. Acta Biochimica Polonica, 47(3): 735-749.

Development and Evaluation of Novel Monoclonal Antibodies to FR-α and FPGS
209
Bueno, R., Appasani, K., Mercer, H., Lester, S., & Sugarbaker, D. 2001. The alpha folate receptor is highly activated in malignant pleural mesothelioma. Journal of Thoracic and Cardiovascular Surgery, 121(2): 223-233.
Campbell, I. G., Jones, T. A., Foulkes, W. D., & Trowsdale, J. 1991. Folate binding protein is a marker for ovarian cancer. Cancer Research, 51: 5329-5338.
Chattopadhyay, S., Wang, Y., Zhao, R., & Goldman, I. D. 2004. Lack of impact of the loss of constitutive folate receptor alpha expression, achieved by RNA interference, on the activity of the new generation antifolate Pemetrexed in HeLa cells. Clinical Cancer Research, 10: 7986-7993.
Chen, L., Qi, H., Korenberg, J., Garrow, T., Choi, Y., J., & Shane, B. 1996. Purification and properties of human cytosolic folylpolyglutamate synthetase and organization, localization, and differential splicing of its gene. Journal of Biological Chemistry, 271(22): 13077-13087.
Chen, V. J., Bewley, J. R., Andis, S. L., Schulz, R. M., Iversen, P. W., Shih, C., Mendelsohn, L. G., Seitz, D. E., & Tonkinson, J. L. 1998. Preclinical cellular pharmacology of LY231514 (MTA): A comparison with methotrexate, LY309887 and raltitrexed for their effects on intracellular folate and nucleoside triphosphate pools in CCRF-CEM cells. British Journal of Cancer, 78: 27-34.
Coney, L. R., Tomassetti, A., Carayannopoulos, L., Frasca, V., Kamen, B. A., Colnaghi, M. I., & Zurawski, D. S. 1991. Cloning of a tumor-associated antigen: mOV18 and MOv19 antibodies recognize
a folate-binding protein. Cancer Research, 51: 6125-6132. Coons, A. H., Creech, H. J., & Jones, R. N. 1941. Immunological properties of an antibody
containing a fluorescent group. Proceedings of the Society for Experimental Biological Medicine, 47: 200-202.
Costa, P. P., Jacobsson, B., Collins, P., & Biberfeld, P. 1986. Unmasking antigen determinants in amyloid. Journal of Histochemistry and Cytochemistry, 34(12): 1683-1685.
Crippa, F., Bolis, G., Seregni, E., Gavoni, N., Scarfone, G., Ferraris, C., Buraggi, G. L., & Bombardieri, E. 1994. Single-dose intraperitoneal radioimmunotherapy with the murine monoclonal antibody I-131 MOv18: Clinical results in patients with minimal residual disease of ovarian cancer. European Journal of Cancer, 31a(5): 686-690.
Dainty, L. A., Risinger, J. I., Morrison, C., Chandramouli, G. V. R., Bidus, M. A., Zahn, C., Rose, S., Fowler, J., Berchuck, A., & Maxwell, G. L. 2007. Overexpression of folate binding protein and mesothelin are associated with uterine serous carcinoma.
Doucette, M. M., & Stevens, V. L. 2001. Folate receptor function is regulated by response to different cellular growth rates in cultured mammalian cells. Biochemical and Molecular Action of Nutrients, 14: 2819-2825.
Ebel, W., Routhier, E. L., Foley, B., Jacob, S., McDonough, J. M., Patel, R. K., Turchin, H. A., Chao, Q., Kline, B., Old, L. J., Phillips, M. D., Nicolaides, N. C., Sass, P., & Grasso, L. 2007. Preclinical evaluation of MORAb003, a humanized monoclonal antibody antagonising folate receptor alpha. Cancer Immunity, 7: 6-12.

Development and Evaluation of Novel Monoclonal Antibodies to FR-α and FPGS
210
Egan, M. G., Sirlin, S., Rumberger, B. G., Garrow, T. A., Shane, B., & Sirotnak, F. M. 1995. Rapid decline in folylpolyglutamate synthetase activity and gene expression during maturation of HL-60 cells. Journal of Biological Chemistry, 270: 5462-5468.
Elnakat, H., Gonit, M., Alincourt., D., Salazar, M., Zhang, J., Basrur, V., Gunning, W., Kamen, B. A., & Ratnam, M. 2009. regulation of folate receptor internalisation by protein kinase C alpha. Biochemistry, 48: 8429-8260.
Elnakat, H., & Ratnam, M. 2004. Distribution, functionality and gene regulation of folate receptor isoforms: implications in targeted therapy. Advanced Drug Delivery Reviews, 56: 1067-1084.
Elwood, P. C., Nachmanoff, K., Saikawa, Y., Page, S. T., Pacheco, P., Roberts, S., & Chung, K. N. 1997. The divergent 5 termini of the human folate receptor (hFR) mRNA's originate from two tissue specific promoters and alterative splicing: characterisation of the hFR gene structure. Biochemistry, 36: 1467-1478.
Evans, C. O., Young, A. N., Brown, M. R., Brat, D. J., Parks, J. S., Neish, A. S., & Oyesiku, N. M. 2001. Novel patterns of gene expresison in pituitary adenomas identified by complementary deoxyribonucleic acid microarrays and quantitative reverse transcription polymerase chain reaction. Journal of Clinical Endocrinological Metabolism, 86: 3097-3107.
Exinger, D., Exinger, F., Mennecier, B., Limacher, J. M., Dufour, P., & Kurtz, J. E. 2003. Multitargeted antifolate (Pemetrexed): A comprehensive review of its mechanisms of action, recent results and future prospects. Cancer Therapy, 1: 315-322.
Fitzpatrick, A. 2003. Folate (Folic Acid): Implications for health and disease. In A. F. Industry (Ed.), May/June ed., Vol. 2003. Chatsworth, CA.
Freemantle, S. J., & Moran, R. 1997. Transcription of the human folylpolyglutamate synthetase gene. Journal of Biological Chemistry, 272(40): 25373-25379.
Freemantle, S. J., Taylor, S., M., Krystal, G., & Moran, R., . 1995. Upstream organization of and multiple transcripts from the human folylpolyglutamate synthetase gene. Journal of Biological Chemistry, 270(16): 9579-9584.
Freund, J. 1956. The mode of action of immunologic adjuvants. Bibl Tuberc, 10: 130-148. Freund, J., & Mc Dermott, K. 1942. Sensitization to horse serum by means of adjuvants.
Proceedings of the Society for Experimental Biological Medicine, 49: 548-553. Galpin, A. J., Schuetz, J. D., Masson, E., Yanishevski, Y., Synold, T. W., Barredo, J. C., Pui, C. H.,
Relling, M. V., & Evans, W. E. 1997. Differences in folylpolyglutamate synthetase and dihydrofolate reductase expression in human B- lineage versus T- lineage leukaemic lymphoblasts: mechanisms for lineagic differences in methotrexate polyglutamation and cytotoxicity. Molecular Pharmacology, 52: 155-163.
Garin-Chesa, P., Campbell, I. G., Saigo, P. E., Lewis, J. L. J., Old, L. J., & Rettig, W. J. 1993. Trophoblast and ovarian cancer antigen LK26. Sensitivity and specificity in immunopathology and molecular identification as a folate binding protein. American Journal of Pathology, 142(2): 557-567.
Gates, S. B., Worzalla, J. F., Shih, C., Grindley, G. B., & Mendelsohn, L. G. 1996. Dietary folate and folylpolyglutamate synthetase activity in normal and neoplastic murine tissues and human tumour xenografts. Biochemical Pharmacology, 52: 1477-1479.

Development and Evaluation of Novel Monoclonal Antibodies to FR-α and FPGS
211
Gibbs, D. D., Theti, D. S., Wood, N., Green, M., Raynaud, F., Valenti, M., Forster, M. D., Mitchell, F., Bavetsias, V., Henderson, E., & Jackman, A. L. 2005. BGC 945, a novel tumor-selective thymidylate synthase inhibitor targeted to alpha folate receptor overexpressing tumours. Cancer Research, 65(24): 11721-11728.
Gish, W., & States, D. J. 1993. Identification of protein coding regions by database similarity search. Nature Genetics, 3(3): 266-272.
Goldsby, R. A., Kindt, T. J., Osborne, B. A., & Kiuby, J. 2003. Immunology (Fifth Edition). New York.
Green, J. M., MacKenzie, R. E., & Matthews, R. G. 1988. Substrate flux through methylenetetrahydrofolate dehydrogenase: predicted effects on the concentration of methylenetetrahydrofolate on its partitioning into pathways leading to nucleotide biosynthesis or methionone regeneration. Biochemistry, 27: 8014-8022.
Guyton, A. C., & Hall, J. E. 1997. Immunity, Allergy, Blood Groups and Infection: Human Physiology Mechanisms and Disease. Philadelphia.
Hainsworth, J. D. 2000. Monoclonal antibody therapy in lymphoid malignancies. Oncologist, 5: 376-384.
Hainsworth, J. D., Burris, H. A., Morrisey, L. H., Litchey, S., Scullin, D. L., Bearden, J. D., Richards, P., & Greco, F. A. 2000. Rituximab monoclonal antibody as initial systemic therapy for patients with low-grade non-Hodgkin lymphoma. Blood, 95: 3052-3056.
Haller, D. G. 2001. Update of clinical trials with edrecolomab: a monoclonal antibody therapy for colorectal cancer. Seminars in Oncology, 28: 25-30.
Hanauske, A., R., Eismann, U., Oberschmidt, O., Pospisil, H., Hoffman, S., Hanauske-Abel, H., Ma, D., Chen, V. J., Paoletti, P., & Niyikiza, C. 2007. In vitro chemosensitivity of freshly explanted tumour cells to pemetrexed is correlated with target gene expression. Invest New Drugs, 10: 9060-9069.
Harris, H., & Watkins, J. F. 1965. Hybrid cells derived from mouse and man: Artificial heterokaryons of mammalian cells from different species. Nature, 205: 640-646.
Hartmann, L. C., Keeney, G., Lingle, W. L., Christianson, T. J. H., Varghese, B., Hillman, D., Oberg, A., & Low, P. S. 2007. Folate receptor expression is associated with poor outcome in breast cancer. International Journal of Cancer, 121: 938-942.
Henderson, G. B. 1990. Folate-binding proteins. Annual Review of Nutrition, 10: 319-335. Hernando, J. J., Park, T. W., Fishcher, H. P., Zivanovic, O., Braun, M., Polcher, M., Grunn, U.,
Leutner, C., Potszch, B., & Kuhn, W. 2007. Vaccination with dendritic cells transfected with mRNA encoded folate receptor alpha for relapsed metastatic ovarian cancer. The Lancet Oncology, 8: 451-454.
Jackman, A. L., Theti, D. S., & Gibbs, D. D. 2004. Antifolates targeted specifically to the folate receptor. Advanced Drug Delivery Reviews, 56: 1111-1125.
Jaton, J. C., & Riesen, W. 1976. The relationship between hypervariable regions, antigen binding specificity and the three dimensional structure of antibodies. Annals of Immunology, 127(3-4): 273-283.
Kamen, B. A., & Smith, A. K. 2004. A review of folate receptor alpha cycling and 5-methyltetrahydrofolate accumulation with an emphasis on cell models in vitro. Advanced Drug Delivery Reviews, 56: 1085-1097.
Development and Evaluation of Novel Monoclonal Antibodies to FR-α and FPGS
212
Kamen, B. A., Wang, M. T., Streckfuss, A. J., Peryea, X., & Anderson, R. 1988. Delivery of folates to the cytoplasm of MA104 cells ismediated by a surface receptor thay recycles. Journal of Biological Chemistry, 263: 13602-13609.
Kane, M. A., Elwood, P. C., Portillo, R. M., Antony, A. C., Najfield, V., Finley, A., Waxman, S., & Kolhouse, J. 1988. Influence on immunoreactive folate binding proteins of extracellular folate concentration in cultured human cells. Journal of Clinical Investigation, 81: 1398-1406.
Kaufmann, S. H. E., Schoel, B., van Embden, J. D. A., Koga, T., Wand-Wurtenburger, A., Munk, M. E., & Steinhoff, U. 1991. Heat shock protein 60: Implication for pathogenesis and protection against bacterial infection. Immunological Reviews, 121: 67-90.
Kelemen, L. 2006. The fole of folate receptor alpha in cancer development, progression and treatment: Cause, consequence or innocent bystander? International Journal of Cancer: 1-13.
Kelley, K. M. M., Rowan, B. G., & Ratnam, M. 2003. Modulation of the folate receptor alpha gene by the estrogen receptor: Mechanism and implications in tumour targeting. Cancer Research, 63: 2820-2828.
Kiessling, R., Wasserman, K., & Horiguchi, S. 1999. Tumour induced immune dysfunction. Cancer Immunology and Immunotherapy(48): 353-362.
Kohler, G., Howe, S., & Milstein, C. 1976. Fusion between immunoglobulin-secreting and non-secreting myeloma cell lines. European Journal of Immunology, 6: 292-295.
Kohler, G., & Milstein, C. 1975. Continuous cultures of fused cells secreting antibody of pre-defined specificity. Nature, 495-497.
Kohler, G., & Milstein, C. 1976. Derivation of specific antibody producing tissue culture and tumour lines by cell fusion. European Journal of Immunology, 6: 511-519.
Konner, J. A., Bell-McGuinn, K. M., Sabbatini, P., Hensley, M. L., Tew, W. P., Pandit-Taskar, N., Vander Els, N., Phillips, M. D., Schweizer, C., Weil, S. C., Larson, S. M., & Old, L. J. 2010. Farletuzumab, a humanized monoclonal antibody against folate receptor alpha, in epithelial ovarian cancer: a phase I study. Clinical Cancer Research, 16(21): 5288-5295.
Kranz, D. M., Partrick, T. A., Brigle, K. E., Spinella, M. J., & Roy, E. J. 1995. Conjugates of folate and anti T-cell-receptor antibodies specifically target folate receptor positive tumour cells for lysis. Proceedings of the National Academy of Sciences, 92: 9057-9061.
Langdon, S. P., Rabiasz, G. J., Hirst, G. L., King, R. B., Hawkins, R. A., Smyth, J. F., & Miller, W. R. 1995. Expression of heat shock protein HSP 27 in human ovarian cancer. Clinical Cancer Research, 1: 1603-1609.
Le Roy, C., & Wrana, J. 2005. Clathrin and non-clathrin mediated endocytic regulation of cell signalling. Nature Reviews Molecular Cell Biology.
Leclerec, G. J., & Barredo, J. C. 2001. Folylpolyglutamate synthetase gene mRNA splice variants and protein expression in primary human leukaemia cells, cell lines and normal human tissues. Clinical Cancer Research, 7: 942-951.
Leclerec, G. J., Leclerec, G. M., Kinser, T. T. H., & Barredo, J. C. 2006. Analysis of folylpolyglutamate synthetase gene expression in human B-precursor ALL and T-lineage ALL cells. Cancer, 6: 132-143.

Development and Evaluation of Novel Monoclonal Antibodies to FR-α and FPGS
213
Leil, T. A., Endo, C., Adjei, A. A., Dv, G. K., Salavaggione, O. E., Reid, J. R., Ames, M. M., & Adjei, A. A. 2007. Identification and characterisation of genetic variation in the folylpolyglutamate synthetase gene. Cancer Research, 67(18): 8772-8782.
Luckow, V. A., & Summers, M. D. 1988. Trends in the development of baculovirus expression vectors. Biotechnology, 6: 47-55.
Lucock, M. 2000. Folic Acid: Nutritional Biochemistry, molecular biology, and role in disease processes. Molecular Genetics and Metabolism, 71: 121-138.
Mangiarotti, F., Miotti, S., Galmozzi, E., Mazzi, M., Sforzini, S., Canevari, S., & Tomassetti, A. 2001. Functional effect of point mutations in the alpha folate receptor gene of CABA I ovarian carcinoma cells. Journal of Cellular Biochemistry, 81: 488-498.
Mantovani, L. T., Miotti, S., Menard, S., Canevari, S., Raspaglesi, F., Bottini, C., Bottero, F., & Colnaghi, M. I. 1994. Folate binding protein distribution in normal tissues and biological fluids from ovarian carcinoma patients as detected by the monoclonal antibodies mOV18 and mOV 19. European Journal of Cancer, 30A(3): 16-39.
Mattanovich, D., Gasser, B., Hohenblum, H., & Sauer, M. 2004. Stress in recombinant protein producing yeasts. Journal of Biotechnology, 113: 121-135.
Matthews, R. G. 1984. Methionine biosynthesis: In folates and pterins. New York: Wiley. Mayor, S., & Reizman, H. 2004. GPI anchored protein precursor and anchor structure. Nature
Reviews Molecular Cell Biology, 5: 110-120. Mayor, S., Rothberg, K. G., & Maxfield, F. 1994. Sequestration of GPI-anchored proteins in
caveolae triggered by cross-linking. Science, 264(1948-1951). Mayor, S., Sabharanjak, S., & Maxfield, F. 1998. Cholesterol-dependent retention of GPI-
anchored proteins in endosomes. EMBO Journal. Mc Guire, J. J., Russell, C., & Balinska, M. 2000. Human cytosolic and mitochondrial
folylpolyglutamate synthetase are electrophoretically distinct. Journal of Biological Chemistry, 275(17): 13012-13016.
Mc Guire, J. J., & Russell, C. A. 1998. Folylpolyglutamate synthetase expression in antifolate-sensitive and resistant human cell lines. Oncology Research, 10(4): 193-200.
Miotti, S., Canevari, S., Menard, D., Mezzanzanica, D., Porro, G., Pupa, S. M., Regazzoni, M., Talgiabue, E., & Colnaghi, M. I. 1987. Characterisation of human ovarian carcinoma associated antigens defined by novel monoclonal antibodies with tumour restricted specificity. International Journal of Cancer, 39: 297-303.
Miotti, S., Facheris, P., Tomassetti, A., Bottero, F., Bottini, C., Ottone, F., Colnaghi, M. I., Bunni, M. A., Priest, D. G., & Canevari, S. 1995. Growth of ovarian-carcinoma cell lines at physiological folate concentration: effect on folate-binding protein expression in vitro and in vivo. International Journal of Cancer, 63(3): 395-401.
Mitchell, H. K., Snell, E. E., & Williams, R. J. 1941. The concentration of folic acid. Journal of the American Chemical Society, 63: 2284.
Morshed, K. M., Ross, D. M., & McMartin, K. E. 1997. Folate transport proteins mediate the bidirectional transport of 5-methyltetrahydrofolate in cultured human proximal tubule cells. Journal of Nutrition, 127: 1137-1147.
Mullis, K., Faloona, F., Scharf, S., Salki, R., Horn, G., & Erlich, H. 1986. Specific enzymatic amplification of DNA in vitro, The polymerase chain reaction. Cold Spring Harbour Symposium of Quantitative Biology, 51: 263-273.

Development and Evaluation of Novel Monoclonal Antibodies to FR-α and FPGS
214
Nair, J. R., & Mc Guire, J. J. 2005. Submitochondrial localization of the mitochondrial isoform of folylpolyglutamate synthetase in CCRF-CEM human T-lymphoblastic leukaemia cells, Biochimica et Biophysica Acta.
Nakopolou, L., Lazaris, A. C., Baltas, D., Giannopolou, I., Kanvantzas, N., & Tzonou, A. 1995. Prognostic evaluation of oestrogen regulated protein immunoreactivity in ductal invasive (NOS) breast cancer. Virchows Archiv, 427(1): 33-40.
Nutt, J.E., Razak, A.R.A., O'Toole, K., Black, F., Quinn, A.E., Calvert, A.H., Plummer, E.R., & Lunec, J. (2010) The role of folate receptor alpha (FRα) in the response of malignant pleural mesothelioma to pemetrexed-containing chemotherapy. British Journal of Cancer, 102: 553-560.
Odin, E., Wettergren, Y., Nilsson, S., Willen, R., Carlsson, G., Spears, C. P., Larsson, L., & Gustavvson, B. 2003. Altered gene expression of folate enzymes in adjacent mucosa is associated with outcome of colorectal cancer patients. Clinical Cancer Research, 9: 6012-6019.
Parker, N., Turk, M. J., Westrick, E., Lewis, J. D., Low, P. S., & Leamon, C. 2005. Folate receptor expression in carcinomas and normal tissues determined by quantitative radioligand binding assay. Annals of Biochemistry, 338: 284-293.
Polonen, L. 2000. http://ethesis.helsinki.fi/julkaisut/maa/kotie/vk/polonen/fig3.gif. In U. o. Helsinki (Ed.).
Qiu, A., Jansen, M., Sakaris, A., Min, S. H., Chattopadhyay, S., Tsai, E., Sandoval, C., Zhao, R., Akabas, M. H., & Goldberg, I. D. 2006. Identification of an intestinal folate transporter and the molecular basis for hereditary folate malabsorption. Cell, 127(5): 917-928.
Ramaekers, V. T. H., & Blau, N. 2004. Cerebral folate deficiency. Developmental Medicine and Child Neurology, 46(12): 843-851.
Ramirez, J. M., Ocio, E. M., San Miguel, J. F., & Pandiella, A. 2007. Pemetrexed acts as an antimyeloma agent by provoking cell cycle blockade and apoptosis. Leukaemia, 21: 797-804.
Ramos-Vara. 2005. Technical aspects of immunohistochemistry. Vet Pathology, 42(405-426). Ratnam, M., Marquardt, H., Duhring, J. L., & Freisheim, J. H. 1989. Homologous membrane
folate binding proteins in human placenta, cloning and sequence of cDNA. Biochemistry, 28: 8249-8254.
Reddy, J. A., & Low, P. S. 1998. Folate mediated targeting of therapeutic and imaging agents to cancers. Critical Reviews in Therapeutic Drug Carrier Systems, 15: 587-627.
Rettig, W. J., Cordon-Cardo, C., Koulos, J. P., Lewis, J. L., Oettgen, H. F., & Old, L. J. 1985. Cell surface antigens of human trophoblast and choriocarcinoma defined by monoclonal antibodies. International Journal of Cancer, 35(4): 469-475.
Ritter, T. E., Fajardo, O., Matsue, H., Anderson, R. G. W., & Lacey, S. 1995. Folate receptors targeted to clathrin-coated pits cannot regulate vitamin uptake. Proceedings of the National Academy of Sciences.
Rochefort, H. 1995. Oestrogen and anti-oestrogen regulated genes in human breast cancer. Ciba Found Symp, 191: 254-265.
Rochman, H., Selhub, J., & Karrison, T. 1985. Folate binding protein and the estrogen receptor in breast cancer. Cancer Detection and Prevention, 8(1-2): 71-75.

Development and Evaluation of Novel Monoclonal Antibodies to FR-α and FPGS
215
Romanoff, R. L., Ross, D. M., & Mc Martin, K. E. 2007. Acute ethanol exposure inhibits renal folate transport, but repeated exposure upregulates folate transport proteins in rats and human cells. Journal of Nutrition, 137: 1260-1265.
Rosenberg, A. H., Lade, B. N., Chui, D., Lin, S., Dunn, J. J., & Studier, F. W. 1987. Vectors for selective expression of cloned DNA's by T7 RNA polymerase. Gene, 56: 125-135.
Rosenblatt, D. S. 1995. Inherited disorders of folate transport and metabolism (7th ed.). New York: Mc Graw Hill book Co.
Ross, D. T., Scherf, U., Eisen, M. B., Perou, C. M., Rees, C., Spellman, P., Lyer, V., Jeffrey, S. S., Van de rijn, M., Waltham, M., Pergamenschikov, A., Lee, J. C., Lashkari, D., Shalon, D., Myers, T. G., Weinstein, J. N., Botstein, D., & Brown, P. O. 2000. Systematic variation in gene expression patterns in human cancer cell lines. Nature Genetics, 24(3): 208-209.
Ross, J. F., Chaudhuri, P. K., & Ratnam, M. 1994. Differential regulation of folate receptor isoforms in normal and malignant tissues in vivo and in established cell lines. Physiologic and clinical implications. Cancer, 73: 2431-2443.
Ross, J. F., Wang, H., Behm, F. G., Mathew, P., Wu, M., Booth, R., & Ratnam, M. 1999. Folate receptor type beta is a neutrophilic lineage marker and is differentially expressed in myeloid leukaemia. Cancer, 85: 348-357.
Rothberg, K. G., Ying, Y. S., Kolhouse, J. F., Kamen, B. A., & Anderson, R. 1990. The glycophospholipid-linked folate receptor internalises folate without entering the clathrin-coated pit endocytic pathway. Journal of Cell Biology, 110: 637-649.
Sabharanjak, S., & Mayor, S. 2004. Folate receptor endocytosis and trafficking. Advanced Drug Delivery Reviews, 56: 1099-1109.
Sadlish, H., Williams, F. M. R., & Flintoff, W. 2002. Cytoplasmic domains of the reduced folate carrier are essential for trafficking, but not function. Journal of Biochemistry, 364: 777-786.
Saiwaka, Y., Price, D., Hance, K. W., Chen, T. Y., & Elwood, P. C. 1995. Structural and functional analysis of the human KB cell folate receptor gene p4 promoter: co-operation of three clustered Sp-1 binding sites with initiator region for basal promoter activity. Biochemistry, 34(9951-9961).
Salih, H. R., & Nussler, V. 2001. Immune escape versus tumour tolerance: how do tumours evade immune surveillance? European Journal of Medical Research, 6: 323-332.
Sanghani, S. P., Sanghani, P. C., & Moran, R. G. 1999. Identification of three key active siteresidues in the c-terminal domain of human recombinant folylpolyglutamate synthetase by site-directed mutagenesis. Journal of Biological Chemistry, 274(38): 27018-27027.
Sanna, E., Miotti, S., Mazzi, M., De Santis, G., Canevari, S., & Tomassetti, A. 2007. Binding of nuclear caveolin 1 to promoter elements of growth associated genes in ovarian carcinoma cells. Experimental Cell Research, 313: 1307-1317.
Schroff, R. W., Foon, K. A., Beatty, S. M., Oldham, R. K., & Morgan, A. C. 1985. Human anti-murine immunoglobulin responses in patients receiving monoclonal antibody therapy. Cancer Research, 45: 879-885.
Shi, S. R., Key, M. E., & Kalra, K. L. 1991. Antigen retrieval in formalin fixed, paraffin embedded tissues: An enhancement method for immunochemical stainingbased on microwave

Development and Evaluation of Novel Monoclonal Antibodies to FR-α and FPGS
216
oven heating of tissue sections. Journal of Histochemistry and Cytochemistry, 39: 741-748.
Shia, J., Klimstra, D. S., Nitzkorski, J. R., Low, P. S., Gonen, M., Landmann, R., Weiser, M. R., Franklin, W. A., Prendergast, F. G., Murphy, L., Tang, L. H., Temple, L., Guillem, J. G., Wong, W. D., & Paty, P. B. 2008. Immunohistochemical expression of folate receptor alpha in colorectal carcinoma: patterns and biological significance. Human Pathology, 39: 498-505.
Simons, K., & Ikonen, E. 1997. Functional rafts in cell membranes. Nature, 387: 569-572. Singh, S. M., & Panda, A. K. 2005. Solubilization and refolding of bacterial inclusion body
proteins. Journal of Bioscience and Bioengineering, 99(4): 303-310. Smith, H. O. 1979. Nucleotide sequence specificity of restriction endonucleases. Science, 205:
455-462. Smith, H. O., & Nathans, D. 1973. A suggested nomenclature for bacterial host modification.
Journal of Molecular Biology, 81(419-423). Sohn, K. J., Smirnakis, F., Moskovitz, D. N., Novakovic, P., Yates, Z., Lucock, M., Croxford, R., &
Kim, Y. I. 2004. Effects of folylpolyglutamate synthetase modulation on
chemosensitivity of colon cancer cells to 5-fluorouracil and methotrexate. Gut, 53: 1825-1831. Spinella, M. J., Brigle, K. E., Freemantle, S. J., Sierra, E. E., & Goldman, I. D. 1996. Comparison of
methotrexate polyglutamation in L1210 leukaemia cells when influx is mediated by the reduced folatre carrier or folate receptor. Biochemical Pharmacology, 52: 703-712.
Studier, F. W., & Moffatt, B. A. 1986. Use of bacteriophage T7 rNA polymerase to direct selective high level expression of cloned genes. Journal of Molecular Biology, 189: 113-120.
Sun, X., Bognar, A. L., Baker, E. N., & Smith, C. A. 1998. Structural homologies with ATP and folate binding enzymes in the srystal structure of folylpolyglutamate synthetase. Proceedings of the National Academy of Sciences, 95: 6647-6652.
Sun, X. L., Cross, J. A., Bognar, A. L., Baker, E. N., & Smith, C. A. 2001. Folate binding triggers the action of folylpolyglutamate synthetase. Journal of Molecular Biology, 310: 1067-1078.
Takimoto, C. H. 1997. Antifolates in clinical development. Seminars in Oncology, 24(18): 40-51. Theti, D. S., & Jackman, A. L. 2004. The role of alpha-folate receptor-mediated transport in the
antitumour activity of antifolate drugs. Clinical Cancer Research, 10: 1080-1089. Thompson-Hayner, N., Driscoll, J., Ferayorni, L., Spies-Karotkin, G., & Jauregui, H. O. 1982.
Ponceau S: A sensitive method for protein determination in freshly isolated and cultured cells. Methods in Cell Science, 7(2): 77-80.
Toffoli, G., Cernigoi, C., Russo, A., Gallo, A., Bagnoli, M., & Boiocchi, M. 1997. Overexpression of folate binding protein in ovarian cancers. International Journal of Cancer, 74: 193-198.
Toffoli, G., Russo, A., Gallo, A., Cernigoi, C., Miotti, S., Sorio, R., Tumolo, S., & Boicchi, M. 1998. Expression of folate binding protein as a prognostic factor for response to platinum containing chemotherapy and survival in human ovarian cancer. International Journal of Cancer, 79: 121-126.
Tomassetti, A., Coney, L. R., Canevari, S., Miotti, S., Facheris, P., Zurawski, V. R., & Colnaghi, M. I. 1993. Isolation and biochemcal characterisation of the soluble and membrane forms

Development and Evaluation of Novel Monoclonal Antibodies to FR-α and FPGS
217
of folate binding protein expressed in the ovarian carcinoma cell line IGROV-1. Federation of European Biochemical Societies, 317(1,2): 143-146.
Tomassetti, A., Mangiarotti, F., Mazzi, M., Sforzini, S., Miotti, S., Galmozzi, E., Elwood, P. C., & Canevari, S. 2003. The variant hepatocyte nuclear factor 1 activates the P1 promoter of the human alpha folate receptor gene in ovarian carcinoma. Cancer Research, 63: 696-704.
Tran, T., Shatnawi, A., Zheng, X., Kelley, K. M. M., & Ratnam, M. 2005. Enhancement of folate receptor alpha expression in tumour cells through the glucocorticoid receptor: a promising means to improved tumour detection and targeting. Cancer Research, 65(10): 4431-4441.
Veggian, R., Fasolato, S., Menard, D., Minucci, D., Pizzetti, P., Regazzoni, M., Tagliabue, E., & Colnaghi, M. I. 1989. Immunohistochemical reactivity of a monoclonal antibody prepared against human ovarian carcinoma on normal and pathological female genital tissues. Tumori, 75: 510-513.
Voet, D., & Voet, J. G. 2004. Biochemistry (3rd ed.): Wiley. Wang, y., Zhao, R., & Goldman, I. D. 2003. Decreased expression of the reduced folate carrier
and folylpolyglutamate synthetase is the basis for acquired resistance to the pemetrexed antifolate (LY231514) in an L210 murine leukaemia cell line. Biochemical Pharmacology, 65(1163-1170).
Ward, R. L., Hawkins, N. J., Coomber, D., & Disis, M. L. 1999. Antibody immunity to the HER-2/neu oncogenic protein in patients with colorectal cancer. Human Immunology, 60: 510-515.
Weitman, S. D., Lark, R. H., Coney, L. R., Fort, D. W., Frasca, V., Zurawski, V. R., & Kamen, B. A. 1992a. Distribution of the folate receptor GP38 in normal and malignant cell lines and tissues. Cancer Research, 52: 3396-3401.
Weitman, S. D., Weinberg, L. R., Coney, L. R., Zurawski, D. S., Jennings, D. S., & Kamen, B. A. 1992b. Cellular localisation of the folate receptorpotential role in drug toxicity and folate homeostasis. Cancer Research, 52: 6708-6711.
Whetstine, J. R., Flatley, R. M., & Matherley, L. H. 2002. The human reduced folate carrier gene is ubiquitously and differentially expressed in normal human tissues: identification of seven non-coding exons and characterisation of a novel promoter. Journal of Biochemistry, 367: 629-640.
Wollack, J. B., Makori, B., Ahlawat, S., Koneru, R., Picinich, S. C., Smith, A. K., Goldman, I. D., Qiu, A., Cole, P. D., Glod, J., & Kamen, B. A. 2007. Characterization of folate uptake by choroid plexus epithelial cells in a rat primary culture model. Journal Of Neurochemistry, 104(6): 1494-1503.
Wu, M., Gunning, W., & Ratnam, M. 1999. Expression of folate receptor type alpha in relation to cell type, malignancy and differentiation in ovary, uterus and cervix. Cancer Epidemiology, 8: 775-782.
Yancik, R. 1993. Ovarian Cancer. Age contrasts in incidence, histology, disease sytage at diagnosis. Cancer, 72(2): 517-523.
Yang, R., Kolb, A., Qin, J., Chou, A., Sowers, R., Hoang, B., Healey, J. H., Huvos, A. G., Meyers, P. A., & Gorlick, R. 2007. The folate receptor alpha is frequently overexpressed in

Development and Evaluation of Novel Monoclonal Antibodies to FR-α and FPGS
218
osteosarcoma samples and plays a role in the uptake of the physiologic substrate 5-methyl tetrahydrofolate. Clinical Cancer Research, 13(9): 2557-2567.
Yasuda, S., Hasui, S., Yamamoto, C., Yoshioka, C., Kobayashi, M., Itagaki, S., Hirano, T., & Iseki, K. 2008. Placental Folate Transport during Pregnancy. Bioscience, Biotechnology, and Biochemistry, 72(9): 2277-2284.
Zhao, R., & Goldman, I. D. 2007. The molecular identity and characterization of a proton-coupled folate transporter - PCFT; biological ramifications and impact on the activity of pemetrexed. Cancer Metastasis Reviews, 26: 129-139.
Zhao, X., Li, H., & Lee, R. J. 2008. Targeted drug delivery via folate receptors. Expert Opinion in Drug Delivery, 5(3): 309-319.

Development and Evaluation of Novel Monoclonal Antibodies to FR-α and FPGS
219
Appendices

Development and Evaluation of Novel Monoclonal Antibodies to FR-α and FPGS
220
Publications