the development of a biofuels engine testing facility · the development of a biofuels engine...
TRANSCRIPT

The Development of a Biofuels Engine Testing Facility
by
Duncan Palmer
Thesis submitted in fulfilment
of the requirements for the Degree
of
MASTER OF SCIENCE IN ENGINEERING (CHEMICAL ENGINEERING)
in the Department of Process Engineering at the University of Stellenbosch
Supervised by
Leon Lorenzen (Process Engineering) Johan van der Spuy (Mechanical and Mechatronic
Engineering)
STELLENBOSCH
DECEMBER 2008

i
Declaration I, the undersigned, hereby declare that the work contained in this thesis is my own
original work and that I have not previously in its entirety or in part submitted it at any
university for a degree.
Signature: Date: 1 June 2008_______
Copyright © 2008 Stellenbosch University All rights reserved

ii
Abstract This report covers the development of a biofuels engine testing facility at Stellenbosch
University. The motivation for the project was three fold: a) a desire to establish biofuels
and engine testing know-how; b) to test the performance characteristics of biodiesel; and
c) make a facility available for future research. The two main conclusions drawn from the
initial test results are: 1) the test cell is fully operational and 2) biodiesel can be
substituted for mineral diesel. To the author’s knowledge this is the first biofuel specific
engine testing facility in South Africa.
After a literature study the test cell was realised in three phases.
• Firstly, the hardware layout was designed and the necessary equipment was
sourced from respectable suppliers including the judicious use of good qaulity
second hand components to minimize capital cost.
• The test cell was then instrumented with new sensors. Key components among
these are the K-type thermocouples, barometric pressure, humidity, oil pressure
and an Allen-Bradley programmable controller to serve as a data acquisition
card. Two software programs were chosen, ETA for the control of the test cell
and RSLogix to program the programmable logic controller (PLC).
• The complete system was then integrated, debugged and validated.
The design methods and procedures have been documented throughout the project
along with user manuals to facilitate further research.
To determine the difference in combustion parameters between biodiesel and mineral
diesel an autonomous power curve test was conducted. This revealed little difference in
terms of performance between the two fuels, although biodiesel had on average a
marginal 0.4% decrease in power over mineral diesel. The fuel consumption for pure
biodiesel was found to be higher, which is as expected as it is has a lower calorific value
than mineral diesel.
As a final validation an energy balance was conducted. Here the calculated calorific
value of biodiesel was compared to the results from a calorie bomb test, and the two
results were found to be within 2% of each of other.

iii
Opsomming Hierdie tesis handel oor die ontwikkeling van ‘n biobrandstof-enjintoetsfasiliteit by die
Universiteit van Stellenbosch. Die motivering agter die projek was drieledig: a) ‘n behoefte
aan kennis rakende biobrandstof en enjin proefneming; b) die toets van biobrandstof
uitvoerbaarheid; c) die beskikbaarstelling van ‘n fasiliteit vir toekomstige navorsing. Twee
hoof gevolgtrekkings kan van die aanvanklike toetsresultate gemaak word: 1) die toetssel is
volledige bedryfbaar en 2) mineraaldiesel kan met biodiesel vervang word. Volgens die
outeur se kennis is dit die eerste biobrandstof-enjintoetsfasiliteit in Suid Afrika.
Na ‘n literatuuroorsig was die toetssel in drie fases ontwikkel:
• Eerstens was die hardeware uitleg ontwerp en die nodige toerusting van die
onderskeie verskaffers bekom terwyl goeie kwaliteit tweehandse komponente
oordeelkundig gebruik is om kapitaalkoste te sny.
• Die toetssel was daarna toegerus met instrumentasie sensors. Die hoofkomponente
was die K-tipe termokoppels, barometriese druk, humiditeits-en olie-druk sensors en
‘n Allen-Bradley programmeerbare beheerder wat het gedien het as ‘n data-
insamelingskaart. Twee sagteware programme was gebruik, ETA vir die beheer van
die toetssel en RSLogic vir die programmering van die programmeerbare logiese
beheerder (PLC).
• Die volledige sisteem was daarna geïntegreer, foute gekorrigeer en die sisteem
gevalideer.
Die ontwerps metode agter die ontwerp en prosedures is voordurent gedokumenteer asook
handleidings om toekomstige navorsing moontlik te maak.
‘n Selfregulerende werkverrigtingskurwe toets was bewerkstellig om die verskil tussen
biodiesel en mineraaldiesel verbrandingsparameters vas te stel. ‘n Klein verskil in terme van
werkverrigting was waargeneem tussen die twee brandstowwe, met biodiesel wat ‘n
gemiddelde afname van 0.4% in werkverrigting teen oor mineraaldiesel vertoon het. Die
brandstofverbruik vir suiwer biodiesel was hoër, soos wat verwag sal word aangesien dit ‘n
laer kaloriese waarde het in vergelyking met mineraaldiesel.
‘n Energiebalans was uitgevoer as finale validasie. Hiermee was die berekende
kaloriesewaarde van biodiesel vergelyk met die resultate van ‘n kalorie-bomtoets. ‘n 2%
verskil in die resultate is verkry.

iv
Thank you to my two study leaders; Prof Leon Lorenzen and Mr Johan van der Spuy
and a special thanks to my father for the unending support and answers to my
questions
My family, I love them dearly.

v
Table of Contents Declaration .................................................................................................................. i
Abstract .......................................................................................................................ii
Opsomming................................................................................................................iii
Table of Contents....................................................................................................... v
List of Figures...........................................................................................................viii
List of Abbreviations ...................................................................................................xi
1. Introduction ......................................................................................................... 1
2. Literature review.................................................................................................. 5
2.1 Biodiesel production..................................................................................... 5
2.1.1 Raw materials ....................................................................................... 5
2.1.2 Transesterfication ................................................................................. 6
2.1.3 Separation and washing ....................................................................... 7
2.2 Properties of biodiesel ................................................................................. 8
2.2.1 Density.................................................................................................. 9
2.2.2 Cetane number ..................................................................................... 9
2.2.3 Flash point .......................................................................................... 10
2.2.4 Kinematic viscosity ............................................................................. 11
2.2.5 Sulphur content................................................................................... 13
2.2.6 Cold flow properties ............................................................................ 14
2.3 Biodiesel combustion parameters .............................................................. 14
2.4 Overview of test cells in general ................................................................ 15
2.4.1 Vibration and Noise ............................................................................ 16
2.4.2 Electrical design.................................................................................. 17
2.4.3 Ventilation and air handling................................................................. 18
2.4.4 Test cell building and control room design.......................................... 18
2.4.5 Water cooling and exhaust systems ................................................... 21
2.5 Dynamometer and coupling ....................................................................... 22
2.6 Sensors...................................................................................................... 24
2.6.1 Oxygen ............................................................................................... 24
2.6.2 Cylinder, manifold and ambient pressure............................................ 24
2.6.3 Engine speed and crankshaft angle.................................................... 25

vi
2.6.4 Temperature ....................................................................................... 26
2.7 Data collection and processing .................................................................. 26
2.8 Summary.................................................................................................... 27
3. Mechanical design and system integration ....................................................... 28
3.1 Test cell layout ........................................................................................... 28
3.2 Engine and fuel supply............................................................................... 31
3.3 Engine oil: pressure and temperature ........................................................ 33
3.4 Water supply and engine coolant............................................................... 36
3.4.1 Water supply....................................................................................... 36
3.4.2 Closed loop engine coolant system .................................................... 37
3.5 Dynamometer and fuel balance operation ................................................. 39
3.5.1 Dynamometer operation ..................................................................... 39
3.5.2 AVL operation ..................................................................................... 43
3.5.3 Calibration of AVL and D360 .............................................................. 44
3.6 Ventilation .................................................................................................. 45
3.7 Wiring, sensors and electronics ................................................................. 47
3.7.1 Emergency stop and fuel relay ........................................................... 48
3.7.2 Glow plug and starter relays ............................................................... 50
3.7.3 Throttle controller ................................................................................ 52
3.7.4 Water temperature controller .............................................................. 54
3.7.5 Ambient Measurements and AVL ....................................................... 56
3.7.6 Schenck D360 controller..................................................................... 58
3.7.7 Wall mounted junction box.................................................................. 59
3.7.8 19” Cabinet ......................................................................................... 60
3.8 Software and automation ........................................................................... 61
3.8.1 ETA..................................................................................................... 61
3.8.2 PLC ladder program ........................................................................... 65
3.8.3 Test program ...................................................................................... 66
3.8.4 Backups and storing data ................................................................... 67
3.9 Summary.................................................................................................... 67
4. Testing and results............................................................................................ 68
4.1 Test fuel properties .................................................................................... 68
4.2 Problem solving and commissioning.......................................................... 69

vii
4.2.1 Engine over heating............................................................................ 69
4.2.2 Perceived anomaly in the power curve ............................................... 71
4.2.3 Commissioning ................................................................................... 72
4.3 Automated test and repeatability................................................................ 72
4.4 Performance curves................................................................................... 75
4.5 Fuel consumption....................................................................................... 77
4.6 Energy balance .......................................................................................... 79
4.8 Summary.................................................................................................... 80
5. Conclusions and recommendations .................................................................. 82
References............................................................................................................... 84
Appendix A: Research methodology mind map ....................................................... 87
Appendix B: Gantry crane calculations..................................................................... 88
Appendix C: Dynamometer calibration arms ............................................................ 92
Appendix D: Servo Specifications ............................................................................ 94
Appendix E: PLC pin connections ............................................................................ 95
Appendix F: Löbro shaft catalogue pages ................................................................ 96
Appendix G: Calibrated channels in ETA ................................................................. 98
Appendix H: IN and OUT ladder logic for the PLC ................................................. 101
Appendix I: Water temperature controller flow diagram and ladder logic ............... 104
Appendix J: Performance curves; ULSD1, ULSD2, B5, B10, B15 and B50 ........... 107
Appendix K: Wiring diagrams ................................................................................. 109
Appendix L: Fuel and water supply schematics with pictures................................. 110
Appendix M: Energy balance calculations.............................................................. 112
Appendix N: Press articles ..................................................................................... 117
Appendix O: BTF Corporate logo ........................................................................... 122

viii
List of Figures Figure 1-1: Project Constraints................................................................................... 2
Figure 2-1: Sample showing biodiesel on top and glycerol at the bottom................... 7
Figure 2-2: Biodiesel sample on left hand side and mineral diesel on the right.......... 8
Figure 2-3: Cetane values (Mittelbach and Remschmidt, 2005)............................... 10
Figure 2-4: Axis of engine vibration.......................................................................... 16
Figure 2-5: Shared control room .............................................................................. 19
Figure 2-6: Separate control room entry................................................................... 20
Figure 3-1: Test bed and dynamometer ................................................................... 29
Figure 3-2: Test cell layout ....................................................................................... 30
Figure 3-3: Completed test bed................................................................................ 30
Figure 3-4: Toyota 2C turbo diesel ........................................................................... 31
Figure 3-5: Fuel supply schematic ........................................................................... 32
Figure 3-6: Exhaust system...................................................................................... 33
Figure 3-7: Oil pressure transducer adaptor............................................................. 34
Figure 3-8: Oil pressure transducer connected to braided hose............................... 34
Figure 3-9: Oil pressure braided hose with adapter ................................................. 35
Figure 3-10: Sump plug with thermocouple.............................................................. 36
Figure 3-11: Water supply layout ............................................................................. 37
Figure 3-12: 3-way valve actuator ............................................................................ 38
Figure 3-13: Dynamometer operating quadrants (Martyr and Plint, 2007) ............... 40
Figure 3-14: Dynamometer-CV coupling (see Figure 3-16 for complete coupling)... 41
Figure 3-15: Engine-CV coupling (see Figure 3-16 for complete coupling) .............. 41
Figure 3-16: Cardan shaft coupling (Figure 3-17 shows the closed protective
housing) ................................................................................................................... 42
Figure 3-17: Shaft protector made from 16mm thick steel pipe................................ 42
Figure 3-18: AVL internal view of the vessel and electronics ................................... 43
Figure 3-19: Test cell air flow showing air flow past the engine ............................... 46
Figure 3-20: 18" Spot fan for additional air movement ............................................. 46
Figure 3-21: Allen-Bradley Micrologix PLC on the left with the 5 expansion modules
on the right ............................................................................................................... 48
Figure 3-22: Emergency stop opened displaying contactors.................................... 49

ix
Figure 3-23: Emergency stop wiring diagram........................................................... 49
Figure 3-24: Glow plug relay .................................................................................... 50
Figure 3-25: Starter wiring diagram.......................................................................... 51
Figure 3-26: Glow plug wiring diagram..................................................................... 51
Figure 3-27: Throttle servo ....................................................................................... 52
Figure 3-28: JR servo wiring (Venter, 2005)............................................................. 53
Figure 3-29: PWM module to modulate a 0-10 V output voltage.............................. 53
Figure 3-30: Throttle servo wiring diagram............................................................... 54
Figure 3-31: Actuator internal wiring (Honeywell, 2006)........................................... 55
Figure 3-32: 3-way valve actuator wiring diagram.................................................... 55
Figure 3-33: Ambient pressure sensors; barometric pressure on the left, humidity
probe above right and the thermocouple.................................................................. 56
Figure 3-34: Ambient sensor's enclosure ................................................................. 57
Figure 3-35: 4 Channel analogue inputs .................................................................. 58
Figure 3-36: Dynamometer wiring diagram .............................................................. 59
Figure 3-37: Junction box......................................................................................... 59
Figure 3-38: Thermocouple wiring............................................................................ 60
Figure 3-39: 19" Cabinet .......................................................................................... 61
Figure 3-40: ETA's user interface, labelled for explanations .................................... 63
Figure 4-1: Damaged coolant outlet pipe limiting flow.............................................. 70
Figure 4-2: Redesigned coolant outlet pipe.............................................................. 70
Figure 4-3: Anomaly in power curve......................................................................... 71
Figure 4-4: Test with preloads showing the anomaly in the power curve is not
introduced by the test cell but rather an engine characteristic.................................. 72
Figure 4-5: Automated test successfully executed ................................................... 73
Figure 4-6: ULSD Performance curves showing repeatability .................................. 74
Figure 4-7: AVL results showing ULSD fuel consumption ........................................ 74
Figure 4-8: Power curves of ULSD, biodiesel and its blends.................................... 75
Figure 4-9: Torque curve for ULSD, biodiesel and its blends ................................... 76
Figure 4-10: B100 performance curve...................................................................... 76
Figure 4-11: Fuel consumption curves for ULSD, biodiesel and its blends .............. 78
Figure 4-12: Energy consumption in kg/kWh............................................................ 78
Figure B-1: Picture of the gantry crane with a hoist and beam trolley ...................... 88

x
Figure B-2: I-beam moment of inertia....................................................................... 89
Figure C-1: Calibration arm drawing......................................................................... 92
Figure C-2: Dynamometer calibration setup............................................................. 93
Figure J-1: ULSD1 Performance curve .................................................................. 107
Figure J-2: ULSD2 Performance curve .................................................................. 107
Figure J-3: B5 Performance curve.......................................................................... 107
Figure J-4: B10 Performance curve........................................................................ 108
Figure J-5: B15 Performance curve........................................................................ 108
Figure J-6: B50 Performance curve........................................................................ 108
Figure M-1: Standard orifice plate setup as used in to determine the flow rate (Crowe
et al., 2001) ............................................................................................................ 112
Figure M-2: Flow coefficient K and Red/K versus the Reynolds number (Crowe et al.,
2001) ...................................................................................................................... 113
xi
List of Abbreviations A Ampere
A/D Analogue to digital
AC Alternating current
AVL Company manufacturing testing equipment
BSFC Brake specific fuel consumption
BTF Biofuel test facility
CCTV Closed circuit television
CI Compression ignition
CFPP Cold-filter plugging point
CO Carbon monoxide
CP Cloud point
CV Constant velocity
D/A Digital to analogue
DC Direct current
ECU Engine control unit
EGR Exhaust gas recirculation
EMC Electromagnetic coupling
FAME Fatty acid methyl ester
FFA Free fatty acid
g Gravitational constant
GPa Giga Pascal
GUI Graphical user interface
HC Hydro carbon
kg Kilogram
kW Kilowatt
MPa Mega Pascal
NC Normally closed
Nm Newton meter
NO Normally open
NOx Nitrogen oxides
Pa Pascal

xii
PLC Programmable logic controller
PM Particulate matter
PP Pour point
PPM Parts per million
PWM Pulse width modulation
RME Rapeseed methyl ester
RPM Revolutions per minute
s Second
TDC Top dead centre
ULSD Ultra low sulphur diesel
VO Vegetable oil

1
1. Introduction The use of biodiesel blends are becoming more prevalent as there is greater
awareness about the environmental impact effects, depleting mineral oil reserves
and dependency on the oil supply. Biodiesel can be manufactured from various raw
materials such as fish or vegetable oil. The production of biodiesel from the various
raw materials lends itself to small, localised plants making quality control, testing and
distribution difficult. The chemical composition of biodiesel can be tested in a
laboratory, though more in depth research is required to determine the combustion
parameters.
An autonomous test cell has been developed to test the combustion properties of
biodiesel. The design was completed in three phases: hardware (dynamometer and
test bed); electronics (PLC and sensors) and software to control the test cell. From
the test results conclusions are drawn about the differences between mineral diesel
and biodiesel as well assessing the accuracy of the test cell.
Three specifications need be considered when a new test cell is being
commissioned, namely the operational, functional and detailed functional
specification. The operational specification describes what the test cell is going to be
used for, the functional specification describes what it consists of and its purpose
while the detailed functional specification describes how it fits together and works as
a unit (Martyr and Plint, 2007). The following points describe the objective
specifications for the biofuels testing facility:
• The primary function is to provide an autonomous test cell which can be
used for both research and future education.
• The secondary function is to test the performance characteristics of locally
manufactured biodiesel and biodiesel:diesel blends.
The three major constraints for most projects are applicable here. These are: quality,
time and cost, shown in Figure 1-1. These constraints are interlinked, that is one
cannot change without affecting the other, and the importance of each is project
dependant. For the biofuels testing facility (BTF), cost is the most important factor as

2
there is a fixed budget while, secondly, the project has to be completed within a time
frame of 2 years. Since two of the constraints are fixed the third constraint, quality,
can be expected to vary (Martyr and Plint, 2007). To optimise the quality of the final
product within the two given constraints used equipment from reputable suppliers
was sourced. This could however increase future maintenance costs.
Figure 1-1: Project Constraints
The following steps were followed to develop the test cell;
• A literature study was conducted.
• The hardware was designed and implemented.
• The software purchased and programmed.
• The automated test procedure was coded.
• The documentation for future operators was written.
A mind map showing these fives steps and their breakdown is shown in Appendix A.
Despite the literature study being at the start of the project report constant
references and updates where made for the duration of the project. The first stage
was to select the correct hardware, purchase and install it and then verify that each
component functioned. This is not ideal as it would be better to verify the system
integration with the addition of each component, but this was not possible until the
software was installed. When the hardware was completed the software was
installed and each system checked individually. The system was then integrated and

3
manual test runs were executed after which it was automated. Problems that
occurred during the automated run were addressed, the test cell commissioned,
various tests performed and finally a user manual compiled.
This thesis layout is as follows:
Chapter 1: This introduction
Chapter 2: Literature review
The literature study is divided into two sections; biodiesel and the test facility.
The important characteristics for biodiesel in terms of combustion are
dependant on the manufacturing process as this determines the quality, the
chemical composition of biodiesel and the combustion parameters. Types of
sensors, data acquisition systems, test cell layout and ventilation for test cells
were researched.
Chapter 3: Mechanical design and system integration
This is the core chapter as it discusses the development of the test cell. The
following hardware aspects are covered; test cell layout, fuel and coolant
systems, ventilation, calibration, wiring, sensors and electronics. This chapter
concludes with a discussion of the two software packages, the coded
programs and the manipulation of the data.
Chapter 4: Testing and results
The results from the biodiesel analysis are discussed, followed by the
problems that were encountered during testing and how they were solved.
Results from the automated engine test are used to check repeatability of
measurements and thus, determine whether the test cell meets the
specifications. From the performance and fuel consumption graphs the
differences between mineral diesel, biodiesel and its blends can be
determined.
Chapter 6: Conclusions and recommendations
In this chapter conclusions are drawn and recommendations are suggested.

4
During the project term several press articles were released in various newspapers
and publications, they have been included in Appendix N. The corporate logo that
was designed is shown in Appendix O.

5
2. Literature review
2.1 Biodiesel production
In order to understand the properties of biodiesel and how they affect the
performance of an internal combustion engine, a brief background on biodiesel
production and its combustion properties is given.
2.1.1 Raw materials
There are approximately 350 oil bearing crops that can be used for biodiesel
production, of which only a handful can be considered as a viable replacement for
mineral diesel because the others are not produced in sufficient quantities. These
are: sunflower, safflower, soybean, cotton seed, rapeseed (also known as canola)
and peanut oils (Dermibas, 2005). It is impossible to replace all mineral oil with
vegetable oil (VO) as there is not enough land or water to grow the needed crops,
however, a partial replacement of say 10%, could reduce a country’s dependency on
mineral imports and stimulate its economy through work creation.
A further problem is that the food market is in direct competition with the fuel market,
with the fuel market willing to pay a premium for the oil. This leads to an increase in
price and shortage issues for food consumers. As vegetable oils are freely available
as fuel replacements, the market must be controlled to ensure fairness to the food
industry and to meet the required mineral replacements.
Other sources for biodiesel production are used cooking oils and animal derived fats
(lard and tallow). Used cooking oils previously considered a waste by-product are
now sought after by both the animal feed and biodiesel manufacturers. The used oil
contains food particles that must be filtered out and possibly water contamination. A
more important contamination is the free fatty acids (FFA) contained in the oil
because these cannot be converted to biodiesel with the use of an alkali catalyst
(Dermibas, 2005). This limits the number of available processes when used cooking
oil is considered, but it still provides a low cost raw material for the manufacturing of
biodiesel.

6
Oil production from sources such as algae and sewage are currently being
investigated, because these alternative sources, unlike crops, are not limited by
agricultural capacity, have high yields and may contribute to the raw materials
needed along with the conventional feedstock’s (Kiong, 2006).
2.1.2 Transesterfication
Transesterfication is one of the most common chemical processes by which
vegetable oil is converted to biodiesel. Vegetable oils are typically made of
triglycerides, which when reacted with alcohol in the presence of a catalyst create an
alcohol ester and glycerol. The reaction is shown in Equation 1 (van Gerpen, 2005).
(Eq. 1)
The most common reactant is methanol (Dermibas, 2006) with sodium or potassium
hydroxide (NaOH and KOH) as the catalyst respectively. The most important
variable to ensure maximum methyl ester production is the molar ratio of
methanol:VO, which should be 6:1 for optimum results (Felizardo et al., 2005). The
oil, alcohol and excess catalyst are combined in the reactor and then heated to
reduce the reaction time. Excess catalyst can be used because it is recovered at the
end of the process and fed back into the system.
Several types of transesterification processes exist: batch; continuous; ultra- and
high shear; and ultrasonic reactors. The batch reactors are typically used by the
individual or small companies who are producing biodiesel for own use and require a

7
fixed amount of fuel. The continuous reactors are for uninterrupted biodiesel
manufacturing, producing higher volumes than the batch reactors but having a
higher capital cost. The remaining reactors are variations on the continuous reactor
where detail design depends on: space available; oil to be processed; time; cost;
manpower and quality of biodiesel required.
2.1.3 Separation and washing
Two liquid phases are produced by a successful transesterfication reaction: glycerol
(crude glycerine) and biodiesel (Figure 2-1). The free glycerol has a higher density
than the biodiesel and can be removed through settling or centrifugation. Most of the
catalyst will also be removed in this step as the alkaline catalysts are more soluble in
the polar glycerol phase (van Gerpen, 2005). Some dissolved glycerol will remain in
the biodiesel after the decanting process, but can be removed during the water
washing phase. In Figure 2-2 samples of pure biodiesel are shown on the left and
ultra low sulphur diesel on the right.
Figure 2-1: Sample showing biodiesel on top and glycerol at the bottom

8
Figure 2-2: Biodiesel sample on left hand side and mineral diesel on the right
If not completely removed, glycerol can plug filters, damage the injector pump and
settle out in storage tanks. The remaining dissolved glycerol can be removed by
repeated washing steps, using either water or a 0.5% HCl solution. The remaining
methanol (or catalyst) will also be removed during the washing phase, which also
raises the flash point of the biodiesel. A proposed more elegant removal of the
dissolved glycerol and partial glycerides is to convert them to a triglyceride (Klok and
Verveer, 1990), which allows for easy separation. This is done by adding extra
alkaline catalyst to the biodiesel and heating the mixture from 80 to 100°C, also
distilling off the excess methanol. After removing traces of soap and methyl esters,
the triglycerides can be reintroduced to the reactor with the new oils.
2.2 Properties of biodiesel
As biodiesel is a replacement fuel for mineral diesel it has similar properties,
although there are some minor differences. There is no accepted international
standard to which biodiesel must comply, thus these differences will be dependant
9
on that countries standards. The following section considers the most applicable
properties of biodiesel affecting combustion and the difference in reference
standards.
2.2.1 Density
Density is the mass of fluid per unit volume, given in kg/m3. Biodiesel generally has a
density of 860-900 kg/m3 which complies with the fatty acid methyl ester (FAME)
standard (Dermibas, 2005) where mineral diesel has a density of 820-845 kg/m3 at
15°C. This slight difference will not be significanct if the temperature remains
relatively high as biodiesel has a low cloud point (see Section 2.2.6). The fuel
injected into the combustion chamber is measured on a volumetric basis, thus the
amount of fuel (or energy) injected per cycle will increase with increasing fuel
density, negatively affecting the fuel consumption.
2.2.2 Cetane number
The cetane number is a measure of the ignition quality and relates to the delay time
between being injected into the combustion chamber and igniting (Dermibas, 2005).
A higher cetane value indicates a shorter time between injection and ignition which
improves cold starting and smoothness of the engine. A shorter ignition time will
have a more complete combustion, reducing the exhaust emissions, engine deposits
and knocking. On average biodiesel has an equivalent or higher cetane value than
mineral diesel as indicated in Figure 2-3.

10
Figure 2-3: Cetane values (Mittelbach and Remschmidt, 2005)
Longer fatty acid carbon chains and more saturated molecules increase the cetane
number while the number of double bonds decrease it. When the fuel is injected into
the cylinder, it is subjected to a gradual increase in pressure and temperature during
which various chemical reactions take place, such as producing aromatics which
offers an explanation as to why unsaturated esters tend to have a lower cetane
value. A higher cetane value can be obtained by choosing a feedstock with a high
proportion of medium or long saturated fatty acids, this however negatively affects
the viscosity and cold temperature properties (Mittelbach and Remschmidt, 2005;
Dermibas, 2005).
2.2.3 Flash point
The flash point of a fuel is the stage at which the vapour will combust when exposed
to a spark or flame. Biodiesel typically has a flash point of 150°C or higher while
mineral diesel is around 70°C (www.biodieselsa.co.za, 2007) and this is a good
measure of how safely a fuel can be transported, stored and used. Biodiesel’s flash
point is more than double that of mineral diesel making it useful for applications that
would otherwise be unsuitable for diesel. The standards to which biodiesel and

11
mineral diesel must comply to in Europe are the EN ISO 3679 and EN ISO 2719,
respectively. Properties such as the flash point are determined using the same basic
principles although the methods differ for mineral and biodiesel (Mittelbach and
Remschmidt, 2005).
2.2.4 Kinematic viscosity
The measure of a fluid’s resistance to flow under gravity is called the kinematic
viscosity (www.britannica.com, 2008). This is one of the most important parameters
of biodiesel in terms of engine operation because it affects both the combustion
process and the injector pumps. Incorrect viscosity can cause mechanical damage to
the injector pump, poor fuel atomization when injected into the cylinder and will
eventually lead to the coking of the injector tips. This coking may eventually cause
the engine to lose power or component failure.
The viscosity standards for diesel (both regular and low sulphur diesel), stipulate
values between 2.2 to 5.3 mm2/s (Standards South Africa, 2002). From Table 2-1 it
can be seen that most countries require biodiesel to be between 3.5 and 5.0 mm2/s,
America is the most lenient and requires the viscosity to be between 1.9 and 6
mm2/s (Felizardo et al., 2005; www.shaval.co.za, 2007). Excluding America,
biodiesel and mineral diesel meet similar standards and can thus be interchanged
without any noticeable changes in performance or damage to the engine.

12
Table 2-1: Biodiesel properties (www.shaval.co.za, 2007)
Biodiesel’s viscosity is inversely related to temperature, increasing as it gets colder
while the viscosity of mineral diesel varies less over the normal temperature range.
This is a negative characteristic as in colder countries an additive must be used,
resulting in a higher monetary and environmental cost. The major viscosity increase
in biodiesel starts below around 5°C and solids will form soon after dropping below
0°C. This can be reduced by blending it with mineral diesel. See Table 2-2 and Table
2-3, respectively.

13
Table 2-2: Viscosities of biodiesel and mineral diesel (Knothe and Steidley, 2006)
Table 2-3: Viscosities of blends with low-sulphur diesel (Knothe and Steidley, 2006)
2.2.5 Sulphur content
Sulphur acts as a lubricating agent, although in certain countries new mineral diesel
regulations stipulate that the sulphur content may not exceed 50ppm. This has led to
a reduction in sulphur dioxide and particulate matter emissions and lubricity of the
fuel. Low sulphur fuel reduces human and environmental impact and increases the
life of the catalytic converter, although extra lubricating agents are required to
prevent damage to the injector pump and reduce engine wear. Biodiesel has
traditionally been perceived as being sulphur free, but this only holds true for fatty
acid methyl esters produced without the use of sulphuric acid and for fresh vegetable
oils (Mittelbach and Remschmidt, 2005). In reality there are traces of sulphur, around
31ppm for most types of biodiesel produced around the world (Waina et al., 2005).
Biodiesel has an advantage over mineral diesel in that it has an inherent high

14
lubricity, because of its chemical structure and oxygen content, eliminating the need
for additives (www.biodiesel.org, 2007) while maintaining the benefit of low sulphur
content.
2.2.6 Cold flow properties
The cloud point (CP) is the temperature at which visible crystals start to form and the
pour point (PP) is the temperature when the fluid starts to gel (or is no longer
viscous). Biodiesel has a higher CP and PP than mineral diesel, which must be
taken into account in countries with colder climates. The cold flow properties of
biodiesel derived from some common vegetable oils are compared with mineral
diesel in Table 2-4. The cold-filter plugging point (CFPP) is the point at which the
fluid fails to pass through a standardized filter in a given amount of time under set
conditions.
Table 2-4: Cold flow properties (Mittelbach and Remschmidt, 2005)
Diesel fuel Rapeseed Olive Sunflower Soybean Coconut Palm Tallow
CP [°C] -15 -2 -2 -1 0 12 13 14
PP [°C] -33 -9 -6 -3 -2 - - 12
CFPP [°C] -18 -15 -9 -3 -2 8 1 13
Cold flow parameters do not influence the combustion process but affect the injector
pumps and the vehicle fuelling system. To improve these properties, additives such
as those used in the petroleum industry, can be used. Another option to improve the
cold properties in low temperature environments is to mix biodiesel and mineral
diesel, which eliminates the need for expensive additives and has a reduced
influence on combustion. Through extensive vehicle modification this problem can be
solved mechanically by placing a heater in the fuel tank, fuel line or filter and a
parallel electric heater system. The modifications however have a high capital cost
and affect the reliability of the engine.
2.3 Biodiesel combustion parameters
When biodiesel is injected the spray penetration and pattern are the first in a
sequence of parameters to be affected in a standard diesel compression ignition (CI)

15
engine. The primary factors affecting the spray are the spray angle, volatility, surface
tension and viscosity. The spray angle of biodiesel is narrowed to about half that of
diesel (Li et al., 2006) and the higher viscosity and surface tension combined with a
lower volatility lead to reduced atomisation. Poor atomisation causes larger droplet
formation and a longer ignition delay but can be improved by higher injection
pressures, assistant swirl and a smaller orifice diameter.
Apart from being a renewable energy source, biodiesel is a cleaner burning fuel than
mineral diesel as it results in lower emissions. One possible exception is that
nitrogen oxides (NOx) emissions are in some cases adversely affected, which can be
attributed to the small advance in fuel injection timing needed due to the different
biodiesel combustion characteristics (McCormick et al., 2005). The literature differs
widely with regards to NOx emissions though the general trend is that there is a slight
increase in NOx emissions with respect to mineral diesel. Although in some cases a
NOx reduction is reported (Desantes et al., 1999). Carbon monoxide, (CO), hydro
carbons (HC) and smoke are also reduced, with the latter being reduced as a result
of the additional oxygen content in biodiesel (Tsolakis et al., 2007).
The power developed by an engine running on biodiesel is similar to that of mineral
diesel, while the exhaust gas and lubricating oil temperatures are lower (Tsolakis et
al., 2007) with no reported problems of hot or cold starting. The thermal efficiency
remains similar, although the brake specific fuel consumption (BSFC) increases
because of the lower calorific value of the biodiesel. Blending of biodiesel with
mineral diesel, such as B20 (20% biodiesel + 80% mineral diesel) can reduce
emissions without affecting the fuel combustion or injection properties.
It can be concluded that biodiesel can be substituted for mineral diesel without any
negative engine combustion effects.
2.4 Overview of test cells in general
The following sections present a brief overview of the main considerations when
designing and building an engine test cell. This is given as background study as the

16
current project utilizes existing buildings, water supply and ventilation systems, which
have to be taken into account when installing and commissioning the equipment.
2.4.1 Vibration and Noise
In the test cell most of the noise and vibration comes from the engine itself with
secondary sources such as pumps and ventilation fans also contributing to these
effects. The engine is considered to have six degrees of vibration about the axis’
running through the centre of gravity, as shown in Figure 2-4 (Martyr and Plint,
2007).
Figure 2-4: Axis of engine vibration
There are only three modes that need to be taken into consideration when designing
for vibration, according to Martyr and Plint (2007):
• Vertical X-axis oscillations due to unbalanced forces
• Y-axis rotation due to cyclic variations in torque
• Unbalanced forces in different transverse planes because of rotation
about the Z-axis
When designing the test bed and engine mounts, the following have to be
considered, bearing in mind the three modes stated above: the force to be
attenuated; the natural frequency range of the engine; the load distribution of the

17
engine; the vibration amplitudes; higher frequency structure borne noise; transient
forces and the effect of the environment (Martyr and Plint, 2007). It can be assumed
that the engine manufacturer took these into consideration when designing the
engine mountings. The approach adopted here is to use the engine manufacturers
standard mounts, replicating the vehicle setup as closely as possible. The test bed
can be mounted on a seismic block or sprung steel frame to reduce vibration. The
seismic block, whether on isolated, resilient matting or air spring foundation is
expensive and requires a pit to be dug for the block. This type of test bed is
expensive and increases the complexity of the test cell and mounting of the engine.
The most common test bed, and the one used in this design, is a steel frame
mounted on spring-rubber supports or air springs.
Noise in a test cell can be problematic when anechoic testing is required. There are
two types of anechoic cells: semi-anechoic with reflective floors and insulated walls
to simulate a vehicle on the road or a full anechoic cell in which all surfaces are
sound absorbent. Anechoic cells are expensive, require specialist design and are
normally only used during engine development. Noise however, must still be
attenuated to permissible levels as there will inevitably be an operator on duty and
there may be more than one test cell in the vicinity. The facility under development
used a double glass pane control room to isolate the operator from the cell noise.
Along with vibration, noise can also be used for fault finding and alarm monitoring
but this would have to be based on statistical data obtained through many hours of
testing.
2.4.2 Electrical design
The electrical system is the life line of the test cell as it is used to control the tests,
monitor alarms and sample data. The physical environment in which the electronics
operate can vary widely in test cells, anywhere from -30°C to 45°C with relative
humidity ranging from 0-100%. Thus the electronics either have to be certified for the
given conditions or installed in such a way that they are protected from these
conditions. Electromagnetic coupling (EMC) and cross signal interference must be
considered, especially for the signal carrying cables. For example, a 3–phase power

18
supply cable running into the control room could readily interfere with a poorly
designed 4-20mA signal cable running parallel with it. Correct earthing of cables and
shields not only reduce interference, but are also safety requirements.
2.4.3 Ventilation and air handling
An engine on a test bed can be seen as a large heater from which all the waste
energy has to be removed, using water or air. Approximately one third of the power
developed by the engine is removed by the engine coolant, another third is
converted to shaft work and the remaining third has to be removed by the ventilation
system. Sufficient air flow in a test cell is therefore important to prevent temperature
build-up which may affect engine operation.
The rate at which air (at standard atmospheric pressure and temperature) has to be
removed from the test cell with a constant temperature rise is calculated using
Equation 2. Auxiliary equipment such as the fans, lights and instrumentation
generate additional heat, which, however small in comparison with the engine, also
has to be removed and accounted for in the design.
p
PmC t
=Δ
(Eq. 2)
From Equation 2 it can be seen that the mass flow is directly proportional to power
(engine + auxiliaries), and inversely proportional to the change in temperature. The
specific heat for air is approximately, Cp=1005 J.kg-1.K-1, roughly four times less than
that of water. The air flow should be designed for maximum rated engine power,
usually obtained from the specifications.
2.4.4 Test cell building and control room design
The layout and detail design of the test cell building and the associated control room
was not required for this project as an available test cell was used. The key aspects
are however discussed.

19
The size and layout of the test cell is determined by the type of tests that are going to
be performed. For example, an engine test cell requires less floor space than a test
cell which houses the complete drive train. When designing the test cell layout there
must be enough space for personnel to move around freely, preventing potential
accidents resulted from working in confined spaces. Two typical cell layouts are
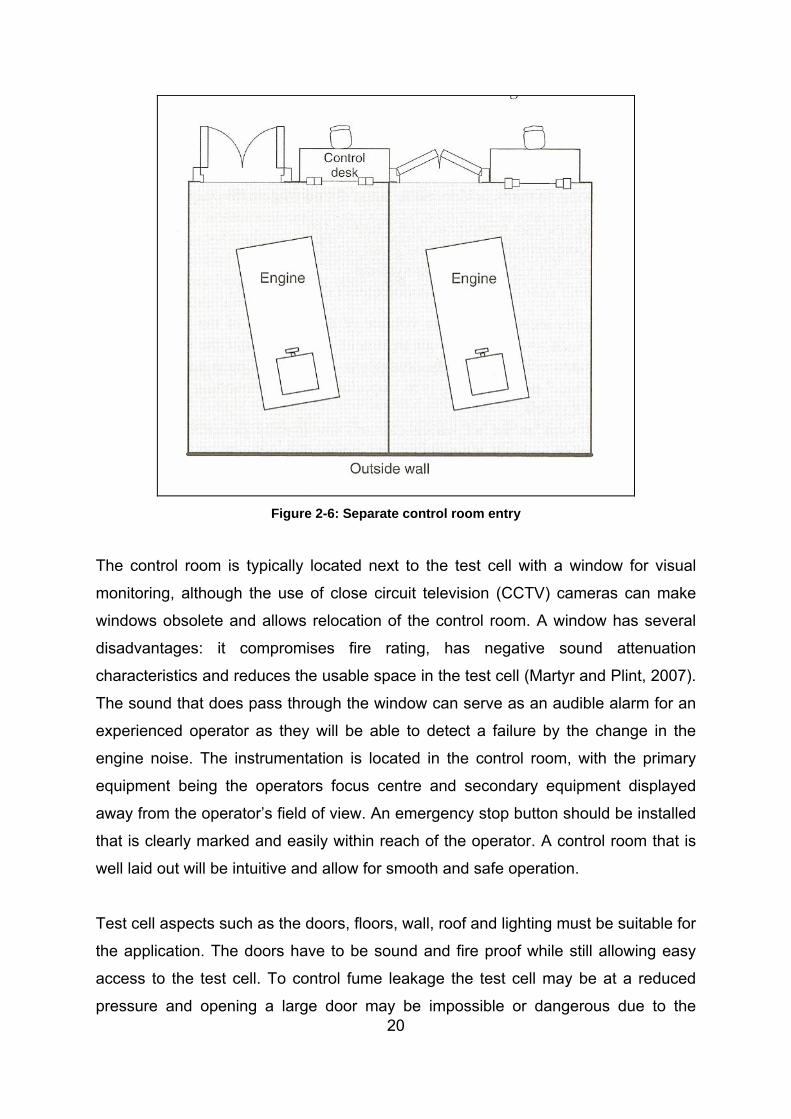
shown in Figure 2-5 and Figure 2-6 (Martyr and Plint, 2007). As can be seen the
cells have large doors through which the equipment and engines can be brought in,
typically with a roof crane or pallet system.
Figure 2-5: Shared control room
20
Figure 2-6: Separate control room entry
The control room is typically located next to the test cell with a window for visual
monitoring, although the use of close circuit television (CCTV) cameras can make
windows obsolete and allows relocation of the control room. A window has several
disadvantages: it compromises fire rating, has negative sound attenuation
characteristics and reduces the usable space in the test cell (Martyr and Plint, 2007).
The sound that does pass through the window can serve as an audible alarm for an
experienced operator as they will be able to detect a failure by the change in the
engine noise. The instrumentation is located in the control room, with the primary
equipment being the operators focus centre and secondary equipment displayed
away from the operator’s field of view. An emergency stop button should be installed
that is clearly marked and easily within reach of the operator. A control room that is
well laid out will be intuitive and allow for smooth and safe operation.
Test cell aspects such as the doors, floors, wall, roof and lighting must be suitable for
the application. The doors have to be sound and fire proof while still allowing easy
access to the test cell. To control fume leakage the test cell may be at a reduced
pressure and opening a large door may be impossible or dangerous due to the
21
pressure differential. The floors and sub floor should be strong enough to handle the
load as well as the induced vibration. The coating of the floor should not become
slippery or react with the spilled fluids. Walls and roofing have be to fire proof, strong
enough to carry loads such as the crane and have suitable sound damping material.
Lighting is normally a last consideration when designing a test cell, although it is
important to provide good lighting for working purposes. The lights may also interfere
with the mounting of equipment and or the roof mounted crane. Prior design and
consideration is therefore essential.
2.4.5 Water cooling and exhaust systems
Water is an almost ideal cooling fluid as it has a high specific heat value, low
viscosity, relatively low corrosivity and is freely available (Martyr and Plint, 2007).
The required flow rates can be calculated similarly to that of air if the heat to be
transferred and the change in temperature is known. Additives such as ethylene
glycol (antifreeze) can be added to the water to improve the operating temperature
range of the cooling system and inhibit corrosion, although the specific heat value
will be reduced. Water quality is as important as the ability to transfer heat since it
will cause engine and dynamometer failure if the specifications of cleanliness are not
met. All solids must be removed and if there is hard water (high concentration of
calcium carbonate) the temperature must be kept below 70°C. Soft water (water
contain few or no magnesium or calcium irons) can cause corrosion and can be as
harmful as hard water. The water quality and flow rate specifications for equipment
should be obtained from the manufacture.
The exhaust system layout is important for emissions testing and correct engine
operation. Ideally it should mimic that of the vehicle in operation. This is problematic
as each engine has a different layout and has to be located near a scavenge duct.
The exhaust system, especially from turbo charged engines, runs at a high
temperature and adds a large heat load on the ventilating system. If comparative
testing is to be done, using a standard exhaust is less important unless it contains a
catalytic converter or is required by the engine control unit (ECU). For this project a
custom exhaust was manufactured as the engine has neither a catalytic converter

22
nor ECU. There are three possible exhaust layouts: a closed coupled system in
which the exhaust is vented outside, a scavenge duct for each cell or a common
scavenge duct for multiple test cells. The common scavenge duct is most prevalent
for multiple cell installations as it requires one fan and exhaust termination. The
exhaust must be located away from the air inlet to prevent recirculation and
terminated with the correct cowl.
The follow guidelines should be followed when designing the duct (Martyr and Plint,
2007):
• The duct should be made of stainless steel to prevent corrosion.
• Soot deposits and staining condensate should not affect maintenance.
• Exhaust backpressure should not be affected by an increase in air flow
rate.
• The air flow must be sufficient to maintain an acceptable duct
temperature, this can however, cause an undesired drop in temperature
in the test cell on a cold day.
2.5 Dynamometer and coupling
The dynamometer provides an external load that allows the engine to operate under
controlled load. The early dynamometer’s used a mechanical brake mechanism to
dissipate the power, hence the name “brake horsepower” (Ferguson and Kirkpatrick,
2001). Due to the fact that these relied on friction to dissipate power, they
overheated and had a limited power rating.
There are several different types of dynamometers, chiefly; water brake, eddy
current, direct current (DC) and alternating current (AC). The water brake
dynamometer dissipates power through shearing water by means of a vaned rotor
and is controlled by the amount of water in the casing. These dynamometers are
inexpensive although they are difficult to control, require a cooler to maintain the
water temperature and are not suitable for dynamic testing due to there slow
response. The direct current dynamometer has traditionally been the most flexible
but at a high cost, recently being replaced by the AC dynamometer. The electrical

23
dynamometers are easier to control and the power generated can be used to power
auxiliary equipment or routed back into the electrical supply grid.
Depending on the desired application, it may be necessary for the dynamometer to
act as a generator and transmit power back into the engine. This would simulate a
vehicle going downhill with the throttle in the closed position. When this is the
desired result, an AC or DC dynamometer is generally used, although an eddy
current dynamometer can be configured with an electric motor to yield the desired
results. The water brake dynamometer is also limited to horizontal operation,
whereas a closed loop unit like the eddy current and AC/DC dynamometers can
operate at any given angle. Testing at angles is typically used in the marine industry
or to simulate an ascending or descending off road vehicle.
There are five major types of couplings used for connecting the engine to the
dynamometer (Martyr and Plint, 2007):
• Quill shaft with internal flanges and rigid couplings:
These are used when the drive and the driven machine are
permanently coupled as they are vibration and misalignment intolerant.
• Quill shaft with toothed or gear type coupling:
The geared couplings are inherently stiff, suitable for high speed and
power and allow for a small amount of misalignment. They, however,
require lubrication to prevent wear and once tooth to tooth seizure
takes place the shaft failure may be rapid and catastrophic.
• Cardan shaft:
Cardan shafts are the most commonly used shafts and consist of two
universal or constant velocity (CV) joints connected with a solid shaft.
They are prone to give trouble when fretting of the needle roller
bearings occurs.
• Multiple membrane couplings:
They are used for high speeds, are stiff and tolerate a moderate
degree of misalignment and axial displacement.
• Elastomeric couplings:

24
There are a wide number of designs on the market to suite different
applications, but the basic principle is an interchangeable elastic
element that can be changed to vary the torsional stiffness, thereby
eliminating problems with critical speeds and torsional vibration.
For this biofuel test facility a cardan shaft will be used as it is an inexpensive
standard engine test setup. As the engine will not be changed on a regular basis the
problem of alignment can be addressed once in the initial setup and the shaft will be
designed to handle the speed and torque of a particular engine.
2.6 Sensors
The following sensors are used to measure engine parameters, both for the ECU
and testing purposes.
2.6.1 Oxygen
A lambda sensor placed in the exhaust can be used to measure the amount of
oxygen in the exhaust gas. This sensor is constructed from solid zirconium oxide
(ZrO3) electrolyte stabilised with yttrium oxide (Y2O3) and is in the shape of a thimble.
Porous platinum is used to coat the inner and outer surfaces which form interior and
exterior electrodes.
Negative oxygen ions are produced on the electrodes by means of an
electrochemical reaction, which then gives rise to a voltage across the electrolyte.
The voltage produced is dependant on the flow of oxygen ions, which is proportional
to the oxygen partial pressure at the electrodes. This voltage can be sampled and
the oxygen content calculated.
2.6.2 Cylinder, manifold and ambient pressure
In-cylinder pressure is measured with a piezo-electric pressure transducer and a
high speed sampling device. Since the transducer is in contact with the combustion
flame the older types needed cooling. There are however newer transducers on the
market for which this is no longer required. In diesel engines it is possible to replace

25
one of the glow plugs with a transducer, which eliminates the need to drill and tap
the cylinder head, although this may conceivably have adverse effects on the
starting of the engine. Spark plugs combined with a pressure transducer are
available for petrol engines but are expensive and have a limited life, therefore
drilling the cylinder head is the best option.
The manifold pressure gives an indication whether the engine is under load or not.
For a turbo charged engine, high pressures equals high load and vice versa. These
data are then used by the ECU to make the necessary adjustments. A diaphragm
sensor, which consists of a rubber diaphragm with strain gauge (in Wheatstone
bridge layout) attached, is used in such cases. The deflection of the diaphragm
causes the resistance in the strain gauge to vary, from which the pressure can be
determined. In this design no cylinder or manifold pressures are measured, although
a high speed data acquisition unit is provided should transducers be fitted at a later
stage.
A digital barometer and humidity sensor are used to record the ambient pressure
and relative humidity should a climate controlled test cell not be available. All engine
performance tests must be carried out at standard atmospheric pressure (101,325
kPa) to ensure consistency, but because the ambient pressure changes day to day
and a climate controlled test cell is not economically viable, the use of a correction
factor is a viable cheaper solution. The correction factor is discussed in section 3.8.1.
2.6.3 Engine speed and crankshaft angle
The engine speed and crankshaft angle can be determined at any of the following
places; crankshaft, camshaft, distributor shaft or on the output shaft. Electronic
sensors are the most popular and employ magnetic or optical detection, with
magnetic detection being the more robust of the two.
Magnetic sensors operate on the Hall Effect which is the electromagnetic force
acting on electrons in metals and semiconductors (Ferguson and Kirkpatrick, 2001).
When current is passed through a semiconductor and a magnet is placed close by, a

26
voltage is induced in the direction of current flow. The voltage is proportional to the
magnetic flux, therefore the change in voltage can be measured and the speed is
determined by the frequency of this change in voltage. Top dead centre (TDC) or
crankshaft angle can be determined by using a different notch in the Hall Effect
sensor or by placing a notch in the fly wheel and noting the change in voltage as it
passes.
2.6.4 Temperature
The inlet air, coolant inlet and outlet, exhaust and oil temperatures can be measured
with thermocouples. Depending on the temperature to be measured, K and J type
thermocouples are the most common thermocouples available. J types operate in a
smaller range, approximately to 150°C while K types operate up to 1500°C. As the K
type spans a larger range it is less accurate, although for general engine testing the
accuracy difference is not of concern. When ordering thermocouples the following
can be specified: type, probe length, type of cable (PVC, screened or fibre glass),
wire length and a probe diameter of 1.6 or 3 mm.
For this test cell the 3 mm diameter K-type probe is used as there are relatively few,
if any, rapidly fluctuating temperatures and is more robust. The screened cable is
used in high interference and heat environments but is prone to breaking due to
flexing. Through careful layout the PVC or fibre glass cables can be used, reducing
the cost of the thermocouples.
2.7 Data collection and processing
The outdated method of recording data with a pen and paper on the appropriate form
has not been completely eliminated as it is still used when facilities and budgets are
limited, but the PC has automated this process in virtually all cases. Signals from
analogue components are captured with the use of an analogue to digital (A/D) card
as well as signals being sent to analogue card via a digital to analogue (D/A) card,
enabling completely autonomous control. The most likely information to be recorded
is torque, speed, fuel consumption, fluid temperatures and pressures.

27
After the test is completed the data will be contained in a file format specific to that
software package. This generally does not allow the user to access and manipulate
the data. The simplest solution is to import it into Microsoft Excel® or a similar
program and manipulate the data into desired form or generate easy to read graphs.
Data can also be imported into statistical packages to determine trends, means or
variances. The data is now in such a form that it can be submitted in a report or
reviewed to determine results of the test.
2.8 Summary
Biodiesel can be produced from variety of raw materials, such as sunflower and
canola oil, but the availability of the oils is limited so only a partial replacement of
mineral diesel would be possible. The raw oils are converted to biodiesel through a
transesterification reaction which results in two liquid phases. The glycerol is
removed through settling and the remaining biodiesel is then washed to remove any
dissolved glycerol. Relevant chemical properties, such as density and kinematic
viscosity are discussed along with the relevant standards and their influence on the
engine and combustion.
A brief overview of the main considerations when designing a test cell is given.
Vibration and noise are not problematic, expect in the case of anechoic testing as
they would influence the data set. The types of test cells and control room layouts
were presented although an existing facility was used. Other design considerations,
such as electrics, ventilation and air handling, water cooling, exhaust systems,
dynamometers and sensors were also discussed.

28
3. Mechanical design and system integration This chapter details the organization, layout, design, equipment and software of the
test cell. Initially the test cell layout is discussed along with the engine and fuel
supply. Thereafter water cooling system is discussed followed by the operation of the
dynamometer and the fuel balance.
3.1 Test cell layout
It was decided that the test cell hardware was to be housed in one of the unused
existing test cells because the cells already have a water supply and ventilation
system. Rooms 166 and 169 in the Mechanical and Mechatronic Engineering
building were chosen as the control room and test cell as Room 169 is the only test
cell with a dedicated control room.
This section gives a system layout and explains where each piece of equipment is
mounted. Detailed explanations of the equipment and how they work are provided in
later sections of this chapter, but a paragraph and discussion are first given to
orientate the reader.
Figure 3-1 shows the first skeletal components, the test bed and the dynamometer.
The test cell layout is shown in Figure 3-2 and a photograph of the completed test
bed in Figure 3-3. In Figure 3-3 it can be seen the engine, tube-in-shell heat
exchanger and dynamometer are bolted to the test bed with an 18” spot fan on either
side providing air movement to prevent localised temperature build ups. The wo
water supply inlets are located in the centre of the test cell on opposing sides. The
AVL fuel balance, fuel pump and fuel filter are mounted 1m above the floor in the
corner nearest the access hole. Most of the equipment required special brackets to
be made in order to secure it to the wall or test bed. This was done in the
departmental workshop. A gantry crane was manufactured (Appendix B) for in-cell
lifting and is stored in the corner opposite the access hole so that it does not interfere
with movement in the test cell. The ventilation system is located 2.5m off the floor

29
and is bolted to the wall inside the test cell, while the extraction duct is outside the
cell with the vents approximately 3.5m from the floor.
Figure 3-1: Test bed and dynamometer

30
Figure 3-2: Test cell layout
Figure 3-3: Completed test bed
All the wiring between the control room and the test cell passes through the access
hole (behind the dynamometer in Figure 3-3) located near the door of the control
room. In the control room a 19” cabinet houses the PLC, dynamometer controller,

31
Honeywell temperature controller and the AVL fuel balance controller. A standard PC
serves as the operators test cell interface.
3.2 Engine and fuel supply
An imported low cost second hand 2 litre Toyota 2C turbo diesel engine (Figure 3-4)
was purchased and mounted on the adjustable engine stands with standard Toyota
engine mounts. This is a 65kW, 176Nm engine that uses a mechanical injection
pump with no ECU. It was chosen because of its price and commissioning simplicity.
Figure 3-4: Toyota 2C turbo diesel
As different blends of biodiesel are to be tested, a large fuel tank is not needed so
the biodiesel and its blends are stored in small portable fuel containers as any one
test will not require more than 10l of fuel. The fuel is pumped into the AVL fuel
balance via a filter using a Bosch fuel pump. The fuel pump relay is wired in parallel
with the fill valve so that when the controller opens the valve, the pump will switch on
and fill the AVL. An inline primer bulb was fitted to allow manual bleeding when the
fuel is changed. The return fuel from the engine is returned back into the AVL. Figure

32
3-5 shows the schematic while in Appendix M the symbols have been replaced with
photos.
Figure 3-5: Fuel supply schematic
An exhaust system was manufactured in-house from 50mm stainless steel pipe and
a standard Toyota diesel vehicle silencer (from the 2.4D series) and configured to
vent directly into the extraction duct. This layout is not always suitable as ideally the
exhaust should be the same as that on the vehicle, especially when there is a
catalytic converter in the system and emissions testing are being done. At present
only reference testing is being done so the original exhaust system was not required,
but it should be added in future research. Figure 3-6 shows the bottom half of the
exhaust system and silencer and that the exhaust is terminated in the extraction duct
(out of picture).

33
Figure 3-6: Exhaust system
3.3 Engine oil: pressure and temperature
A Wika Ecotronic 0-10 bar pressure transducer is used to measure oil pressure. The
original motor oil light switch connects to the oil system with a 1/8” BSPF male
connector. This switch was modified from a 1/8 BSPF male to 1/4 BSP male adapter
(Figure 3-7), allowing a 1 m braided hose and pressure transducer to be connected
(Figure 3-8 and Figure 3-9). The hose is required to reduce the temperature of the oil
as the pressure transducer operates up to 85°C while the engine oil temperature can
reach 110°C.

34
Figure 3-7: Oil pressure transducer adaptor
Figure 3-8: Oil pressure transducer connected to braided hose

35
Figure 3-9: Oil pressure braided hose with adapter
A thermocouple is used to measure the oil temperature. The sump plug was drilled
out and welded to a compression fitting so that the thermocouple can be placed in
the engine oil. Figure 3-10 shows the thermocouple mounted in the sump plug.

36
Figure 3-10: Sump plug with thermocouple
3.4 Water supply and engine coolant
The water supply to the test cell and dynamometer and the coolant system are
explained in this section.
3.4.1 Water supply
Water provides cooling for the engine and is the working fluid for the dynamometer.
The water supply is a closed loop system to prevent wastage and to maintain a
stable water temperature. The water supply consists of an underground tank to
which the warm water is returned. From there is it is passed through a chiller and
then pumped up to the holding tank on the roof of the Mechanical and Mechatronic
Engineering building. This arrangement ensures that water supplied to the test cell at

37
a constant pressure of approximately 2 bar. Connectors and gate valves allow the
flow in and out of the test cell and are located under protective covers. Figure 3-11
gives a schematic layout of the water supply.
Figure 3-11: Water supply layout
In Appendix L is a similar schematic to that of Figure 3-11 where the symbols have
been replaced with photographs. A centrifugal pump pumps the water to the header
tank and is controlled by means of level switches. When the tank level is low the
pump will operate until the upper limit is reached. There is a safety overflow should
the pump fail to switch off. A Searle Bush chiller is used to cool the water. The
engine coolant system is explained in the following section (see coolant supply and
coolant return in Figure 3-11).
3.4.2 Closed loop engine coolant system
The test cell water supply cannot be used to cool the engine directly as it contains
impurities and antifreeze cannot be added. To overcome this a separate closed loop

38
system is created with a tube-in-shell heat exchanger, as shown in Figure 3-11. A
closed loop system allows antifreeze to be added and enables the temperate of the
engine coolant to the controlled. A radiator is not suitable for a hot test cell
environment since it will not provide sufficient cooling due to the difficulty of moving
large volumes of air through it. The volume of the coolant in the closed loop system
is more than that on the standard radiator, so a larger radiator reservoir bottle was
made to accommodate the water expansion.
In the closed loop system the inlet coolant temperature is kept at a constant 65°C to
mimic the situation found in the case of water coming from a radiator. This is done
buy using a 3-way mixing valve that is controlled by the PLC. Without this valve the
temperature would be around 20°C because of the large capacity heat exchanger
and will not allow the engine to heat up quickly. The 3-way valve is shown in Figure
3-12 and its operation is discussed in section 3.7.4 as part of the discussion under
controllers.
Figure 3-12: 3-way valve actuator

39
3.5 Dynamometer and fuel balance operation
A Schenck D360 water brake dynamometer is used to dissipate the engine load and
an AVL fuel balance provides an accurate fuel consumption measurement. The
operating and calibration procedure for this equipment is discussed in this section.
3.5.1 Dynamometer operation
The water brake dynamometer is used to dissipate work by transferring the energy to
the water by means of a vaned rotor. The torque is controlled by varying the amount
of water in the casing by means of a servo actuated valve. The heated water must
continuously be removed and cooled before being pumped up to the header tank.
The water is fed directly into the dynamometer, but because the pressure in the
system is high a gate valve was placed before the dynamometer to reduce the flow.
The maximum inlet pressure for the dynamometer is 0.6 bar with a 1.6 m3/s
minimum flow rate (Schenck Pegasus GmbH, 2001). The flow through the gate valve
is set by running the engine at full power and closing the gate valve until water outlet
temperature is at 50°C, after which the handle is removed to prevent tampering. This
setup optimises the dynamometer control because it allows the control value to be
used over a wide part of its range.
There are four quadrants in which a dynamometer can operate: rotating clockwise
producing or absorbing torque and rotating counter clockwise producing or absorbing
torque. Figure 3-13 gives a diagrammatical layout of these four quadrants. Most
water brakes can only operate in the first quadrant. Eddy current dynamometers can
operate in the first two quadrants, while AC/DC dynamometers can be used in all
four quadrants. Since a water brake is being used, only first quadrant operation is
possible. This simplifies the control system since no power can be returned to the
engine.

40
Figure 3-13: Dynamometer operating quadrants (Martyr and Plint, 2007)
A Cardan Shaft is used to connect the engine to the dynamometer. To reduce cost,
an available shaft from a Löbro catalogue was reverse engineered. The desired
properties of the couplings are determined by the engine parameters (speed and
torque), and the dimensions of the CV joint and shaft were obtained accordingly. A
Löbro Type 104 shaft was selected and the relevant catalogue pages are displayed
in Appendix F. The CV joint and side shaft from a VW Microbus were chosen as they
had suitable dimensions, although the shaft was 1mm thicker that the one specified
in the catalogue. Holes where then drilled and tapped in the dynamometer and a
spigot manufactured to connect the CV joint to the engine. The joints were then
greased and bolted in place (see Figure 3-14, Figure 3-15 and Figure 3-16). A strong
protective shaft housing was added to contain the shaft in the event of a failure. The
protective housing was built from 16mm steel pipe (Figure 3-17).

41
Figure 3-14: Dynamometer-CV coupling (see Figure 3-16 for complete coupling)
Figure 3-15: Engine-CV coupling (see Figure 3-16 for complete coupling)

42
Figure 3-16: Cardan shaft coupling (Figure 3-17 shows the closed protective housing)
Figure 3-17: Shaft protector made from 16mm thick steel pipe

43
3.5.2 AVL operation
The AVL 7030 is a dynamic fuel balance that is used to measure the fuel
consumption on a mass basis. A vessel is mounted on blade springs and the fuel
mass is measured by means of a capacitive bridge supplied with a 500Hz square
wave signal. The capacity of the bridge branches are measured and then returned
via an amplifier resulting in a linear relationship between differential capacity and
output voltage. Blade springs are used in the fuel balance as they have no
hysteresis. When the vessel is empty it is filled automatically by opening a fuel valve
and is often gravity fed. As there is no header tank this design replaces gravity feed
by a Bosch fuel pump to fill the vessel. While the vessel is being filled the mass is
changing and no measurement is possible. The AVL returns a zero reading for the
duration of the filling. The return fuel from the engine is returned back to the AVL
without influencing the flow reading. A photograph of the AVL with the covers
removed in Figure 3-18.
Figure 3-18: AVL internal view of the vessel and electronics

44
The AVL is connected to a controller in the 19” cabinet and transfers the following: a
fuel level display; settings for the time measurement increments; calibration
instructions; type of reading (kg/h or g) and a 0-10V output for external readings.
Since the fuel level is changing and the vessel is mounted on blade springs
oscillations may occur causing incorrect readings. To prevent this there is a damping
pot, but on taking delivery of the unit this was not filled to the correct level as oil had
been spilled during transportation. To correct this, the remainder of the oil was
drained and the damper was refilled with a single grade 10 weight oil (Castrol Fork
Oil SAE 10W). This eliminated the oscillations and stable readings were obtained.
3.5.3 Calibration of AVL and D360
The AVL calibration of the controller is a simple step that can be done from the
control room. The controller must be switched on in the following sequence, module
7030-F02 and then 7030-F01 to ensure that the processor starts correctly. When this
is done the “CAL. WEIGHT” button on the controller must be held down for 10
seconds until a calibrated concentric weight has been lowered. The button can then
be released removing the weight from the vessel. It is also important to verify that the
gain and linearity are correct as the vessel operates between a full and empty state.
The procedure and associated adjustments are clearly documented in the AVL user
manual (AVL, 1984). The voltage output of the AVL is calibrated using a laboratory
scale and a stop watch. Fuel is allowed to flow into the calibration container at
various flow rates over the AVL’s operating range while the time is recorded. The
mass of fuel is then weighed and the flow rate is determined by dividing the mass by
the time. Table 3-1 shows the data recorded from which the AVL is calibrated.
Table 3-1: Recorded data for AVL calibration
Low flow Medium flow High flow
Fuel (g) 287.00 316.20 517.20
Time (s) 97.00 49.00 36.60
Calculated flow rate (g/s) 2.96 6.45 14.13
The load cell of the dynamometer must also be calibrated with weights placed on a
calibration arm. The calibration arms were manufactured in the workshop with the

45
calibration setup is shown in Appendix C. When the controller is switched on a zero
reading must be obtained or it must be adjusted to 0 Nm on the torque unit. The
calibrations arms can then be bolted to the dynamometer, the weight tray added, and
a counter weight used to adjust the torque reading to 0 Nm. 10 kg weights are then
packed on the weight tray one at a time and the reading noted. Each kilogram
corresponds to 10 Nm for the 1021 mm arm, so the reading can be adjusted
accordingly. Once all the weights are present, they are removed one at a time and
the readings rechecked to ensure that there is no hysteresis in the system.
The calibration certificates are stored in the “Test” file in the control room, along with
the other calibration certificates and test results.
3.6 Ventilation
Ventilation in the test cell and control room is important because air is the medium
through which excess heat, fumes and gasses are removed. An overview of the
existing ventilation system is given in this section.
The inlet air comes in half way up the wall on the opposite side of the extraction duct.
This flow arrangement is suitable as the air in the test cell is moved past the engine.
A cross section schematic as viewed towards the control room is shown in Figure
3-19 to illustrate the flow of air in the test cell. As can be seen the inlet is slightly
above the engine so two floor fans (Figure 3-20) are added on either side of the
engine to help move air over it and out the extraction duct.
In control rooms with emissions testing equipment the power into the room must be
calculated to check heat loading. If this is the case, ventilation or an air conditioning
unit must be installed. For the BTF control room there are no large heat generators,
so open windows or doors suffice.

46
Figure 3-19: Test cell air flow showing air flow past the engine
Figure 3-20: 18" Spot fan for additional air movement

47
3.7 Wiring, sensors and electronics
The electronics and wiring for the test cell will be described in sections to simplify the
explanation and understanding of the wiring diagrams. The pin labelling is consistent
throughout so, for example if the label “IN1+” appears in separate diagrams, it refers
to the same physical pin.
The labels should be interpreted as follows:
• Vps : Separate power supply connected to the mains
• Vdc : Power supplied by the PLC
• Vbat : Power from the battery in the test cell
• Italics : Pins on the PLC
The PLC (Allen Bradley Micrologix 1200) is used to sample all analogue and digital
channels as well as providing the various voltage and current outputs. The PLC
consists of the main 1200 module, a 4 channel analogue input module, a two input,
two output analogue module and 3 thermocouple modules. Figure 3-21 shows the
main 1200 module on the left with the 5 expansion modules on the right. The serial
port on the PC is used to communicate with the PLC using the RsLinx® software.
RsLogix® is Rockwell Automation® ladder logic software in which the PLC is
programmed to perform the desired functions.
In this facility the majority of the programming and channel setup will be done via the
PC and the software package called ETA® (see section 3.8.1).
The upper rows of connections of the 1200 module (Figure 3-21) are the inputs, in
this case the only input used is allocated as the emergency stop. The bottom rows
are the output relays used for the starter, glow plugs, 3-way valve actuator and the
ignition. The first module’s (2A2D in Figure 3-21) consists of two analogue inputs
and one analogue output connected to the D360 controller and the other output
controls the throttle. The four analogue inputs (4A) are ambient pressure, relative
humidity, oil pressure and fuel consumption. The three remaining cards (T1, T2 and
T3) are coupled to the thermocouples. The pin connections for the PLC are shown in
Appendix E and the wiring diagrams in Appendix K.

48
Figure 3-21: Allen-Bradley Micrologix PLC on the left with the 5 expansion modules on the
right
3.7.1 Emergency stop and fuel relay
There is an emergency stop mounted in the middle of the desk within easy reach of
the operator should a catastrophic failure occur. The emergency stop or e-stop
consists of two contactors, one normally open (NO) and the other normally closed
(NC) (see Figure 3-22). The NO contactor is connected to pin IN0 and is a software
interrupt. When the interrupt occurs the software will take the throttle position to 0
and set the dynamometer to full load, stopping the test in the shortest possible time.
This can damage the engine due to the shock loading of the dyno. The NC contactor
is hard wired to the injection pump in the event of a software failure or if the PC
hangs. The emergency stop wiring diagram is shown in Figure 3-23.
PLC inputs
PLC outputs

49
Figure 3-22: Emergency stop opened displaying contactors
Figure 3-23: Emergency stop wiring diagram
The injection pump relay is energised from a 24V switch mode power supply
(labelled: 24Vps). Pin OUT1 is used to close the relay via a radio button in ETA to

50
activate the injection pump. This control is also used to switch the engine off.
Flywheel diodes are placed over all the internal and external DC relay coils to
prevent voltage spikes. The relay circuit is interlocked with the emergency stop and
is shown in Figure 3-23.
3.7.2 Glow plug and starter relays
The glow plug and starter relays operate in a similar fashion to the fuel pump relay
using pins OUT2 and OUT3 and “bounce back” radio buttons. When the engine has
been started these buttons are deactivated to prevent them from being “pushed”. If
the engine stops, the injection pump will have to be switched off and back on again
to reset the buttons. The glow plug relay drives a larger relay located on the engine
as the glow plugs can draw up to 70A (Figure 3-24). The diagrams for the starter and
glow plugs are given in Figure 3-25 and Figure 3-26, respectively.
Figure 3-24: Glow plug relay

51
Figure 3-25: Starter wiring diagram
Figure 3-26: Glow plug wiring diagram

52
3.7.3 Throttle controller
Off-the-shelf throttle actuators are expensive so an in-house design was
implemented. This particular throttle linkage on the Toyota engine allows a coupling
directly on its shaft, eliminating the need for cables. A JR 8511 digital servo from a
model shop was used to actuate the throttle. The specifications are shown in
Appendix D and the mounted servo is shown in Figure 3-27.
The servo operates on 5V DC and can draw up to 700mA depending on the load. A
small switch mode power supply (labelled: 5Vps) was purchased to power the servo.
Three wires have to be connected to the servo for it to operate: +5V (red), ground
(brown) and a pulse width modulation (PWM) signal (orange). These colours are
specific to JR servos and other manufactures will have different colour codes (see
Figure 3-28).
Figure 3-27: Throttle servo

53
Figure 3-28: JR servo wiring (Venter, 2005)
The duty cycle of the 50 Hz PWM signal will determine the position of the servo. The
servo operates as follows: with a 600μs pulse width the servo will be at -450 and with
a 2.4 ms pulse width at +450. The servo is able to rotate at a speed of 0.19 s/600,
which is faster than the reaction time of the engine. As the PLC is not able to
generate a PWM output, a custom built modulator was obtained to convert the 0-10V
analogue voltage to a PWM signal (see Figure 3-29). The converter has a voltage
divider circuit to limit the input to 5V and a PIC microprocessor to generate the PWM
signal. The power supply and servo grounds are connected in the analogue to PWM
converter box. Figure 3-30 shows the servo and converter wiring diagram.
Figure 3-29: PWM module to modulate a 0-10 V output voltage

54
Figure 3-30: Throttle servo wiring diagram
3.7.4 Water temperature controller
The function of the water controller has been discussed in section 3.4.2 which shows
that the mixing of cold and recycled hot engine coolant is set by the position of the
mixing valve. The mixing valve actuator is driven by a bi-directional 24Vac motor
without feedback or settable limits, but the actuator has internal protection to protect
the motor should the mixing valve limits be reached. The available 3-way valve was
originally part of a stand-alone Honeywell temperature controller but has been
modified to allow PLC control. The Honeywell controller is still used to power the
actuator and allow communication between the PLC and actuator.
There is only one supply wire to the actuator, but two return wires that connect to a
common point. Depending on which of the two return wires is connected to the
common point; the actuator will open or close. The PLC connection with the two
inputs and one common was chosen for this purpose. The internal wiring of the
actuator is shown in Figure 3-31 and the wiring to the PLC in Figure 3-32.

55
Figure 3-31: Actuator internal wiring (Honeywell, 2006)
Figure 3-32: 3-way valve actuator wiring diagram

56
3.7.5 Ambient Measurements and AVL
The barometric pressure, relative humidity and temperature are recorded and used
in a correction factor to compensate for day to day changes in ambient test cell
conditions. An in depth explanation of the compensation is given in section 3.8.1.
The sensors were mounted on the wall in the test cell and a protective plate was
made to prevent physical damage and limit the effect of direct heat radiation. Figure
3-33 shows the sensors and Figure 3-34 shows the protective covering.
Figure 3-33: Ambient pressure sensors; barometric pressure on the left, humidity probe above
right and the thermocouple

57
Figure 3-34: Ambient sensor's enclosure
The Vaisala PTB 110 barometric pressure transducer has a 0-5V output and is
connected to IN2+. The input channels on the PLC are normally set for current input,
so this channel had be reconfigured. The configuration switch is located on the top of
the module and switches the input form the 4-20 mA to a high impedance sensing
one. The Vaisala HMD60 relative humidity sensor is a 4-20mA sensor and the
thermocouple to record temperature is wired onto the thermocouple card.
The connections to the 4 channel input card are shown in Figure 3-35.

58
Figure 3-35: 4 Channel analogue inputs
3.7.6 Schenck D360 controller
Similar to the AVL the D360 controller has 0-10V torque and speed outputs. The
D360 also requires a voltage input to control the stepper motor which sets the
torque. The D360 input voltage is written out from the PLC pin Vout2 and its output
voltages sensed on IN0+ and IN1+ (see Figure 3-36).

59
Figure 3-36: Dynamometer wiring diagram
3.7.7 Wall mounted junction box
A junction box was installed on the wall between the control room and the test cell to
facilitate engine changes. The box is permanently wired with screened cable to the
PLC. When the engine is changed the sensors can simply be plugged into or out of
the junction box as needed. The engine has been instrumented with thermocouples
to record various temperatures: Inlet and outlet water, oil, exhaust, inlet air and
dynamometer temperatures. The junction box also provides for the throttle servo and
oil pressure transducer to be readily unplugged. The junction box is shown in Figure
3-37 and the wiring for the thermocouples in Figure 3-38.
Figure 3-37: Junction box

60
Figure 3-38: Thermocouple wiring
3.7.8 19” Cabinet
The PLC, controllers, power supplies and wiring are located in a 19” cabinet in the
control room. Each wire in the cabinet has been labelled for future reference and
each connection to the PLC has been documented. The cabinet contains the
following from top to bottom: PLC, Honeywell controller, AVL controller, Schenck
torque unit and the Schenck controller. The equipment in the cabinet has been
labelled in Figure 3-39.

61
Figure 3-39: 19" Cabinet
3.8 Software and automation
Two software packages were installed and commissioned; ETA and the RSLogix
500. They are programmed to sample and store the data and to automate the test
cell.
3.8.1 ETA
ETA or ‘Engine Test Automation’ was written in Delphi to integrate different
manufacturer’s hardware into a single environment. ETA communicates with the
hardware by using various PC’s communication protocols. The data written to the
PLC
Honeywell controller
AVL controller
Schenck torque unit
Schenck controller

62
hardware is typically used for controlling the test while the data received from the
hardware is used to determine the state of the test or for test analysis. The data
obtained is stored for future access in ETA’s database. Listed below are some of
ETA’s features (CAE, 2005):
• Alarms
• Automated test control
• Sensor calibration
• Equation editor
• Signal conditioning tools
• Data logging, analysis and reporting
ETA was purchased from and installed by CAE (Cape Advanced Engineering). ETA
controls the engine test, monitors conditions and records the data. After installation
ETA was set up for the type of test that is going to be performed, namely an
autonomously run performance curve.
The PLC is linked to ETA using the RSLinx software. Initially there was a problem
interfacing the two components as the freeware version of RSlinx does not support
DDE communication. The full version of RSLinx was purchased which solved this
problem. Data are passed on the DDE client between ETA and the PLC by setting
up input (labelled: N10) and output channels (labelled: N14). Dedicated digitals
channels but be created by using an analogue base channel and addressing the
individual bits. When the channel has been created the desired output is specified on
the PLC. All data are passed as raw values from zero to 32767 (equivalent to 15
bits). For example a 10 V output from ETA is passed as 32767 to the PLC which
then converts it back to 10 V.
It is not always possible to have a test cell at reference conditions; therefore a
correction factor can be implemented if ambient temperature, barometric pressure
and relative humidity are known. The EEC correction factor is implemented in ETA.
The formula for this calculated factor is obtained from the 80/1269/EEC European
Union agreement for adoption of uniform conditions for vehicle and parts testing.
Equation 3 is the implemented equation for a turbo charged engine.

63
0.7 1.5990
298s d
TP P
α⎛ ⎞ ⎛ ⎞= ×⎜ ⎟ ⎜ ⎟− ⎝ ⎠⎝ ⎠
(Eq. 3)
Where:
Ps = Pressure at the engine air inlet (mbar).
Pd = Vapour partial pressure determined by multiplying the relative humidity with the
saturation vapour pressure with is a function of temperature (mbar).
T = Ambient temperature in Kelvin.
ETA’s user interface was optimised for the Biofuel Test Facility. The interface is
shown in Figure 3-40 and each channel is labelled followed by an explanation.
Figure 3-40: ETA's user interface, labelled for explanations
1. Automated test sequence

64
2. Radio buttons for starting and stopping the engine.
3. ~Torque: The measured torque multiplied by the correction factor is the value
recorded and used for calculation (Nm). ~Power: ~Torque x Speed x 104.72 x
10-6 (kW)
4. Dials for graphical indication of torque and speed
5. Speed/Torque control and their set points
6. Throttle control: 0% is closed and 100% is fully open
7. Set point for the water temperature controller (°C) and time constant for the
water temperature controller.
8. Emergency stop button indicator to notify user if the emergency button is
depressed.
9. AVL: Fuel consumption in g/s obtained from the AVL dynamic fuel balance.
10. T.Water.Out: Engine coolant temperature on the outlet side of the engine (°C).
11. T.Water.In: Engine coolant temperature on the inlet side of the engine. This
value is also fed back into the water temperature controller and is used to
determine one of the controllers time constants (°C).
12. T.Exhaust: Exhaust gas temperature. As there is no shielding over the
thermocouple it is only an indication of the exhaust gas temperature. The
exact temperature is not required as comparative testing is being done (°C).
13. T.Dynamometer: Water temperature on the outlet side of the dynamometer
(should never exceed 50°C).
14. T.Control.Room. Temperature measured behind the 19” cabinet in the control
room (°C).
15. T.Ambient: Ambient temperature in the test cell (°C).
16. P.Ambient: Ambient pressure (bar).
17. RH.Ambient: Ambient relative humidity (%).
18. ~Partial vapour pressure: Calculation of the partial saturation vapour pressure
used in the EEC correction factor (mbar).
19. ~Correction factor: Correction factor calculated to compensate for the change
in ambient conditions according to the EEC specification.
20. T.Oil: Oil temperature in the sump (°C).
21. P.Oil: Oil pressure in the crankcase (bar).

65
When the graphical user interface (GUI) has been created, each channel can be
calibrated in ETA by creating a trend line from two or more points. The
thermocouples were calibrated with a Unomat Druk calibration unit. The
thermocouple is replaced with the Druk that simulates a temperature so the channel
can be adjusted accordingly. Pressures are also calibrated with the Druk calibration
unit. The speed pickup on the dynamometer has 60 teeth so 1 Hz is equal to 1 RPM.
A signal generator can therefore be substituted for the speed pickup and the speed
input calibrated. Torque and speed outputs where calibrated while the engine was
running and the signal should be the inverse of their respective input channels,
which can be used as a validation check. The Schenck dynamometer calibration
procedure was followed as explained in section 3.5.3 and the trend line recorded.
Screen shots of channel calibration are shown in Appendix G for each type of
channel.
ETA’s “User Administrator Manual” was printed, bound and stored in the test cell. It
gives in-depth explanations on creating channels, automated tests and using ETA.
3.8.2 PLC ladder program
The PLC firmware was programmed in RSLogix 500 and is subdivided into three
sections. The MAIN program runs continuously and calls the two subroutines; IN and
OUT.
The IN ladder samples the channels on the PLC (temperature and analogue inputs)
and then passes them to ETA as a N10:x value. The N99 buffer is reserved for the
digital inputs while the other channels are from N10:0 to N10:13. The ladder code is
shown in Appendix H and Appendix I and is coded according to the specific
expansion modules.
Similar to the IN ladder, the OUT ladder places the values from ETA onto the PLC.
The N14:99 buffer is reserved for the digital outputs (injection pump; starter and glow
plugs) while N14:1 and N14:2 are for the voltage outputs. In order to switch the
Schenck controller between torque and speed mode the relevant pin must be

66
grounded and the torque or speed output channel selected. This was implemented
with a timer to prevent both pins being grounded at the same time. The ladder logic
is shown in Appendix H.
The program code for the water temperature controller had to be programmed in the
PLC as ETA does not facilitate on/off control. As it is an output, it is coded in the
OUT ladder, but shown in Appendix I separately for clarity. A partial controller was
implemented, with adjustable set points and system time constants, through ETA.
The set point is the desired engine coolant inlet temperature and the feedback is
from T.Water.In. The difference between the set point and the actual value is scaled
and used to determine the time that the valve must be open or closed. The system is
then allowed settling time according to a system time constant.
3.8.3 Test program
Torque or speed mode can be selected by clicking on the “bumpless control” in ETA
(see number 5 in Figure 3-40). In torque mode the user defines the torque set point
and throttle position. This is used mostly for emissions testing and will only be used
when such equipment is available. When speed mode is selected the speed set
point is set and the control system varies the torque until the set point is reached. A
performance curve utilises speed mode control and generates a curve as follows: the
throttle is set to fully open and then measurements are taken at 250 RPM intervals.
The test sequence steps are executed automatically in ETA:
• 100% Throttle
• 4000 RPM to 1500 RPM
• Idle
• Engine off
The ramp time and settle time for each of the 4000 RPM to 1500 RPM steps was set
to 5 and 10 seconds respectively, after which the data were recorded for 10 seconds
to allow averaging. In the idle state the engine runs at 1000 RPM for one minute to
allow the turbo to cool down. The ignition is then switched off.
67
The data are stored in ETA’s data base and can be exported to a .csv file to allow
the user to manipulate the data post acquisition.
3.8.4 Backups and storing data
An image of the hard drive is stored on a removable USB storage disk. Should a
failure occur, all data and programs can be reinstalled.
Data from tests and calibration certificates are printed and stored in a labelled file in
the control room and organised according to the date of the test. Electronic copies
are available in the C:\BTF\Test directory.
The “User manuals” file in the control room contains all the manuals for the
equipment in the test cell and in the control room. Items are filed alphabetically.
3.9 Summary
As with any design there are teething problems and limitations. The basic hardware
for the test cell was installed along with the various sensors and software. During the
first test an overheating problem was solved and a perceived anomaly in a power
curve was examined and resolved (section 4.2). The implemented test cell can
measure performance and fuel consumption but not having emissions testing
equipment is a limitation. Emissions testing is important for industry but less so for
student research. The data obtained from testing were within boundaries, test work
on the biodiesel commenced.

68
4. Testing and results The following section presents results from fuel and performance testing. These
results are used to evaluate the performance of the test cell and draw conclusions
with regards to the performance of biodiesel compared to that of mineral diesel.
4.1 Test fuel properties
The biodiesel used for testing was donated by The Biodiesel Centre and was
manufactured from waste vegetable cooking oil sourced in the Western Cape. A
sample of the biodiesel was sent away for chemical analysis at Bioservices CC and
yielded the following results (Table 4-1).
Table 4-1: Biodiesel properties from chemical analysis
Analysis Specification: SANS 1935:2004 Result
Appearance Clear
Density @ 15°C (kg/l) 0.860-0.900 0.893
Viscosity @ 40°C (mm2/s) 3.5-5.0 7.91
Flash point (°C) 120 min Fail
Calculated cetane index 51 min 49
Sulphated ash (%) 0.02 max 0.025
Water content (%) 0.05 max 0.08
Acid value (mg KOH/g) 0.5 max 0.78
Iodine value (mg I/g) 140 max 69.5
Free glycerol (%) 0.02 max 0.041
Total glycerol (%) 0.25 max 3.44
As can be seen from Table 4-1 it is not a high quality biodiesel because only the
iodine and density properties are within specification. This fuel should not be used
for prolonged periods in the engine as it could cause corrosion damage due to the
high water and acid content and the high viscosity may damage the injector pump.

69
However, normally these shortcomings are negated when the biodiesel is blended
with mineral diesel in low ratios.
Ultra low sulphur diesel (ULSD) was used as the comparative base line to which the
biodiesel would be compared. The biodiesel was also mixed with ULSD in the
following biodiesel:ULSD diesel ratios: 5%; 10%; 15%; 50%, also known as B5, B10,
B15 and B50. The blending was done on a volumetric basis in 20 litre fuel containers
which can easily be interchanged during testing. Pure biodiesel was run directly from
the 20 litre shipping containers after which the fuel system was flushed with mineral
diesel.
4.2 Problem solving and commissioning
There were two problems discovered during the first autonomous test; the engine
was over heating and there was a power curve dip anomaly near the top of the
power curve. After these problems were solved (see section 4.2.1 and 4.2.2) the test
cell was commissioned.
4.2.1 Engine over heating
During the first tests, the engine was over heating with the water temperature
approaching boiling point, resulting in the test having to be terminated. The exact
cause of this problem was not known as the engine was within its temperature limit
at high revolutions but would heat up at lower RPM’s. It was suspected that the
water pump was functional but the frictional losses in the system were too high. The
water system was therefore disassembled and inspected internally for restrictions
and the coolant outlet hose tail was found to be damaged causing a restriction in the
flow. A replacement part was designed and manufactured. The old hose tail with the
restriction is shown in Figure 4-1 and the redesigned item in Figure 4-2. The
thermostat was another possible cause of restriction in the flow, so it was removed.
The engine was then run at full power and reached 63 0C, which is too cold for
normal operating conditions. Various size orifice plates were inserted instead of the
thermostat until the engine ran at the correct temperature.

70
Figure 4-1: Damaged coolant outlet pipe limiting flow
Figure 4-2: Redesigned coolant outlet pipe

71
4.2.2 Perceived anomaly in the power curve
It was discovered at the top end of the power curve that there was a slight decrease
in power at 3750 RPM (Figure 4-3). The decrease in power could be a characteristic
of the particular Toyota engine, but there is also the possibility that it was a test cell
error.
To investigate this anomaly it was decided to introduce a constant offset in the cell
torque measurement. If after mathematically compensating for this offset the
resulting power curve was unchanged the source of the anomaly is considered part
of the motor and is not introduced by the test cell. The dynamometer was therefore
loaded with a fixed weight to give an offset of 174 Nm and then 274 Nm and the test
repeated. This introduces a shift in the operating point.
25
30
35
40
45
50
55
60
1000 1500 2000 2500 3000 3500 4000 4500
Engine speed [RPM]
Pow
er [k
W]
ULSD1 kWULSD2 kWB5 kWB10 kWB15 kWB50 kWB100 kW
Figure 4-3: Anomaly in power curve
The test was repeated and yielded the same results with the anomaly in power curve
at 3750 RPM. The torque preload was subtracted from the readings before the graph
was plotted so the results could be compared (Figure 4-4). The axes were also kept
the same so the results can be compared with Figure 4-3. Since a preload was
added it required the control system to adapt and move away from the previous

72
operating point. The results show that the dip in power is a characteristic of the
engine at 3750 RPM and not of the test cell.
25
30
35
40
45
50
55
60
1500 2500 3500 4500
Engine speed [RPM]
Pow
er [k
W]
No Load174Nm Preload274Nm Preload
Figure 4-4: Test with preloads showing the anomaly in the power curve is not introduced by
the test cell but rather an engine characteristic
4.2.3 Commissioning
After the problems discussed in the previous section had been solved and the
perceived anomaly proved to be an engine characteristic, the test cell was
commissioned for the testing of biofuels.
4.3 Automated test and repeatability
The automated test is started by the operator and executes the programmed test
sequence, allows the engine to cool and then switches off the engine. The
automated test in Figure 4-5 was implemented and executed successfully in the test
cell and has been set as the default test to ensure repeatability.

73
Figure 4-5: Automated test successfully executed
After the dynamometer had been calibrated a fixed weight was applied and the value
recorded as a reference test. This reference weight is applied immediately before
and after each test to ensure consistency and to verify that the system maintains
calibration. A reading of 473 Nm was recorded before and after testing, indicating
that no change in setup conditions occurred. The reference weights are labelled and
stored in the test cell for easy access.
Ultra low sulphur diesel (ULSD) was tested before and after the biofuel mixtures
tests to ensure repeatability and to be used as a reference. The maximum deviation
in power was 1.5% between the two tests. The dynamometer was run without water
and it was recorded that there was a 25 Nm frictional force in the bearings of the

74
dynamometer at full throttle which can account for the small deviation between tests.
The performance curve illustrating the repeatability is shown in Figure 4-6, where
ULSD1 was the initial run and ULSD2 the final run.
0
10
20
30
40
50
60
0 1000 2000 3000 4000 5000
Engine speed [RPM]
Pow
er [k
W]
80
100
120
140
160
180
200
Torq
ue [N
m]
ULSD1 kWULSD2 kWULSD1 NmULSD2 Nm
Figure 4-6: ULSD Performance curves showing repeatability
Similar to the power curves, the fuel consumption measurement from the AVL fuel
balance must also be checked for repeatability. The measurements from the before
and after ULSD tests are plotted in Figure 4-7. The two curves are almost identical
with maximum deviation of 0.324 g/s (or 2.74%) occurring at 4000 RPM, concluding
that the consumption readings are repeatable.
1
2
3
4
5
6
7
1000 1500 2000 2500 3000 3500 4000 4500
Engine speed [RPM]
Fuel
con
sum
ptin
[g/s
]
ULSD1 g/sULSD2 g/s
Figure 4-7: AVL results showing ULSD fuel consumption

75
4.4 Performance curves
The ULSD, biodiesel and its blends were tested and the power curve results plotted
to graphically illustrate the performance differences of each fuel (Figure 4-8). It can
be seen that the fuels are similar in performance, though the engine produces
slightly less power when operating on B100. The maximum difference between
biodiesel and ULSD is 1.58% at 3750 RPM and on average there is a 0.42%
decrease in power. Under normal driving conditions this would barely be noticeable
as it is a 0.85 kW power decrease, while ambient conditions such as temperature
and altitude can be expected to have a bigger effect. Diesel engines generally
produce maximum power between 1800 and 2100 RPM and for this particular
engine it is around 1900 RPM. Figure 4-9 shows the test torque curves.
25
30
35
40
45
50
55
60
1000 1500 2000 2500 3000 3500 4000 4500
Engine speed [RPM]
Pow
er [k
W]
ULSD1 kWULSD2 kWB5 kWB10 kWB15 kWB50 kWB100 kW
Figure 4-8: Power curves of ULSD, biodiesel and its blends

76
120
130
140
150
160
170
180
190
1000 1500 2000 2500 3000 3500 4000 4500
Engine speed [RPM]
Torq
ue [N
m]
ULSD1 NmULSD2 NmB5 NmB10 NmB15 NmB50 NmB100 Nm
Figure 4-9: Torque curve for ULSD, biodiesel and its blends
The individual performance curve for B100 (pure biodiesel) is plotted in Figure 4-10.
The performance curves for the blends are shown in Appendix J as they are almost
identical to the B100 plot. Differences between performance curves can only be
observed when plotted together, as in Figure 4-8 and Figure 4-9. In Figure 4-10 the
power (kW) is displayed in pink and plotted against the left hand side y-axis while the
torque (Nm) is plotted in blue against the right hand side y-axis.
0
10
20
30
40
50
60
0 1000 2000 3000 4000 5000
Enginen speed [RPM]
Pow
er [k
W]
80
100
120
140
160
180
200
Torq
ue [N
m]
PowerTorque
Figure 4-10: B100 performance curve
Diesel engines are often preferred for normal driving conditions because the
maximum torque is available from lower revolutions when compared to petrol

77
engines. The torque curve for this Toyota engine running on biodiesel (Figure 4-10)
tapers off almost linearly from 1900 RPM as reflected in the linear power increase
because power = torque x speed (P=Tω). The performance curve not only shows the
engine power characteristics but can also be used to check engine condition as the
power will decrease if there is a non critical fault.
All engine parameters, such as exhaust and oil temperatures, are approximately the
same whether running on biodiesel or ULSD. For example at 2750 RPM (halfway
through a test) the exhaust temperature for diesel and biodiesel are 757.8°C and
753.2°C, respectively. The 4.5°C or 0.59% decrease is negliable. Similarly, the
difference in coolant temperature is 0.1°C, oil temperature is 0.2°C and oil pressure
is 0.1 bar. For practical purposes the results can be seen as the same because they
are within the tolerance of the sensors. Engine operating parameters thus stay the
same when biodiesel or mineral diesel is used.
4.5 Fuel consumption
The fuel consumption results from the tests are plotted in Figure 4-11. From the
figure it can be seen that pure Biodiesel has the worst fuel consumption which
improves as the mineral diesel:biodiesel ratio increases. This was expected since
the energy content of biodiesel is lower than that of mineral diesel (section 4.6). The
lower blends, B5 to B15 have a minimal effect on the fuel consumption. Government
legislation (as stipulated in the 2013 White Paper) requires 10,000 GWh of
renewable energy to be contributed to the final energy consumption by 2013
(Department of Minerals and Energy, 2003). The use of low biodiesel blends could
help meet this target.
Even though the biodiesel used for testing was of poor quality (section 4.1) it has
little effect on the performance relative to diesel, though the long term effects are not
known as endurance tests were not performed. From the performance and fuel
consumption results it can be concluded that biodiesel quality has little effect on fuel
combustion.

78
2
2.5
3
3.5
4
4.5
5
5.5
6
0 500 1000 1500 2000 2500 3000 3500 4000 4500
Engine speed [RPM]
Fuel
con
sum
ptio
n [g
/s]
ULSD1 g/sULSD2 g/sB5 g/sB10 g/sB15 g/sB50 g/sB100 g/s
Figure 4-11: Fuel consumption curves for ULSD, biodiesel and its blends
The energy consumption was also plotted in kg/kWh to visually illustrate that the fuel
consumptions readings are consequent. It can be assumed that the thermal
efficiency of the engine remains constant throughout testing so the fuel consumed
per unit of work should stay the same. The energy consumption should thus remain
constant, which is the case as shown by Figure 4-12.
0.001
0.002
0.003
0.004
0.005
0.006
0.007
0.008
0.009
0.01
1000 1500 2000 2500 3000 3500 4000 4500
Engine speed [RPM]
Ener
gy c
onsu
mpt
ion
[kg/
kWh]
ULSD1 g/sULSD2 g/sB5 g/sB10 g/sB15 g/sB50 g/sB100 g/s
Figure 4-12: Energy consumption in kg/kWh

79
4.6 Energy balance
To determine the efficiency of the engine an energy balance test was designed and
executed. An energy balance was performed by subtracting the energy flow out of a
system from the energy into the system. The difference is the loss due to convection
and radiation, which would otherwise be nearly impossible to measure. The energy
balance is also used as a final validation for the test cell as the equation will not
balance if all energies cannot be accounted for.
The results from the test are shown in Table 4-2. The energy balance for diesel was
calculated first, from which the calorific value of biodiesel could be determined. This
calculated calorific value was then compared to the value from a calorie bomb test.
The calorific value for diesel was obtained from Ferguson and Kirkpatrick (2001).
Table 4-2: Energy balance data (table adapted from Martyr and Plint, 2007)
Results
Parameter Symbol Mineral diesel Biodiesel
Engine speed (RPM) ω 3000 3000
Power output (kW) Ps 49.12 47.45
Fuel consumption rate (kg/s) ~mf 0.0043 0.00459
Air consumption rate (kg/s) ~ma 0.0657 0.0657
Lower calorific value of the fuel (MJ/kg) CL 42.5 ?
Exhaust temperature (°C) Tc 767.937 746.687
Coolant flow rate (kg/s) ~mw 0.564 0.564
Coolant inlet temperature T1w 47.57 47.94
Coolant outlet temperature T2w 68.82 68.35
Inlet air temperature Ta 21.81 21.81
The calorific value for biodiesel was calculated in Appendix M using the convection
and radiation energy losses calculated from the mineral diesel tests. The losses are
assumed to be the same as the test setup did not change between the two fuel tests.
The calculated calorific value for biodiesel (38.462 MJ/kg) is within 2.1% of the
calorie bomb test (39.336 MJ.kg). The thermal efficiency of the engine can then be
calculated:
80
1
1
26.87 %
26.61%
DsDiesel
D
Diesel
BsBiodiesel
B
Biodiesel
PH
PH
η
η
η
η
=
=
=
=
As can be seem from the thermal efficiencies there is no noticeable difference
whether the engine is running on mineral diesel or biodiesel. This is to be expected
as the thermal efficiency is an engine characteristic, and thus independent of what
fuel is used. From the above discussion it can be concluded that a diesel engine can
be run on biodiesel without any modifications. Fuel consumption is the only
parameter that is immediately affected while long term effects require further
investigation.
The energy balance calculations are the final check that the test cell has been
correctly calibrated. The engine is operating at a 26.87% thermal efficiency which
corresponds to the literature (25-30%) for an engine of similar size (Martyr and Plint,
2007). The losses to convection and radiation are 13.56%, which is also similar to
the literature (Martyr and Plint, 2007).
4.8 Summary
Tests were conducted to ensure that the test cell operates autonomously and the
results are repeatable and accurate.
The results from the biodiesel analysis showed that most chemical properties were
not within specification, indicating a low quality biodiesel. After testing it can be
concluded that this does not have a major influence on the performance of biodiesel
in a compression ignition engine.
Biodiesel and its blends were tested against ultra low sulphur diesel to determine the
differences in performance and fuel consumption. The data shows that the two fuels

81
are similar in performance but the fuel consumption for biodiesel is higher as it is has
a lower calorific value. The calorific value of biodiesel was determined from an
energy balance and compared with the laboratory calorie bomb experiment. Similar
calorific values were obtained indicating that the test cell is correctly calibrated and
that the measurements are accurate. The successful testing and analysis of
biodiesel concluded that the project goals were met.

82
5. Conclusions and recommendations The following conclusions are based on the work performed and the results obtained
during the development of a biofuels engine testing facility at Stellenbosch
University.
• An extensive literature review on biodiesel has shown it to be a potentially
viable automotive engine fuel replacement despite its possible influence on
the food industry (see sections 2.1-2.3)
• A further literature study on engine test cells showed that most of the
information needed to design a test cell is available in the literature (see
sections 2.4-2.7). There are however some aspects that can only be gained
from experience, for example how to best set the water flow to the
dynamometer using a gate valve coupled directly to the supply (see section
3.5.1) .
• An engine test cell has been designed, built and commissioned in less than 2
man-years (see chapter 3). Of note is that:
o The cell was designed from the ground up and conforms to the
traditional test cell layout;
o A test cell can be designed on a stringent budget, but at the expense of
time and effort to source used equipment and information.
• The test results are repeatable and accurate (see section 4.3). An anomaly in
the power curve cure was found during a validation test but was proven, by
shifting the work point of the control system, to be an engine characteristic
(see section 4.2.2).
• Final validation of the test cell was performed by means of an energy balance.
The calorific value for biodiesel was determined to be 38.5 MJ/kg and was
within the assumed accuracy of the system (see section 4.6).
• The engine successfully ran on biodiesel for the duration of testing where:
o No engine modifications were needed;
o The combustion energy released and the yield properties showed no
dependence on the quality of the biodiesel (see section 4.1);

83
o The fuel consumption using pure biodiesel was, as expected, higher
than when using mineral diesel because of the lower energy content.
Biodiesel blends show little or no consumption difference (see section
4.5).
• The test cells software and graphical user interface were designed in such a
way to make it an adaptable research tool that can be used by a technically
competent person. Careful attention has been paid to detailed and extensive
documentation to ensure this is possible.
The following test cell upgrades are recommended to improve the functionality and
scope of the test cell when the appropriate budget is available:
• Develop customised in-house test cell control software
• Implement a permanent air and water flow meter to calculate energy
balance;
• Control the temperature and humidity in the test cell;
• Add emissions testing equipment, in-cylinder pressure transducer, fuel
conditioning unit, carbon monoxide detector and a ‘Druk’ test cell
calibration unit;
• Design a palette system for mounting and aligning engines with a quick
connector box.

84
References AVL, Dynamic fuel consumption operation equipment 7030, Australia, 1984.
CAE, ETA power user manual, SSI002, Version 2.0, December 2005.
Craig, R.R. Jr., Mechanics of materials, USA, Wiley and Sons, 2000.
Crowe, C.T., Elger, D.F., Roberson, J.A., Engineering fluid mechanics, USA, John
Wiley and Sons, 2001.
Demirbas, A., Biodiesel fuels from vegetable oils via catalytic and non-catalytic
supercritical alcohol transesterfication and other methods: a survey, Turkey,
Karadeniz Technical University, December 2002.]
Demirbas, A, Biodiesel production via non-catalytic SCF method and biodiesel fuel
characteristics, Turkey, Karadeniz Technical University, 2006.
Department of minerals and energy, White paper on the renewable energy policy of
the republic of South Africa, Notice 513 of 2004, November 2003.
Desantes, J.M., Arregle, J. Ruiz, S., Delange, A., Characterization of the injection-
combustion process in a D.I. diesel engine running with rape oil methyl ester, SAE,
1999.
Felizardo, P., Correia, M., Raposo, I., Mendes, J., Berkemeier, R., Bordado, J.,
Production of biodiesel from waste frying oils, Elsevier, 17 June 2005.
Ferguson, C.R. and Kirkpatrick, A.T., Internal combustion engines, John Wiley and
Sons Inc, 2001.
Honeywell, ML6420A/ML7420A Electric linear valve actuators, USA, 2006.

85
http://www.biodiesel.org/markets/pre/, 11 September 2007.
http://www.biodieselsa.co.za/what.htm, 6 Spetember 2007.
http://www.britannica.com/eb/article-9075513/viscosity20 February 2008.
http://www.salvadori.org/aobc/handouts/handout_inertia.pdf, 10 October 2007.
http://www.shaval.co.za/index.jsp?page=warranties, 10 September 2007.
Kiong, E,. NZ firm makes bio-diesel from sewage in world first, New Zealand, NZ
Herald, 12 May 2006.
Klok, R. and Verveer, H.H., Process for producing fatty-aid lower-alkyl mono esters
European, patent EP 0391 485 A1, 1990.
Knothe, G. and Steidley, K.R, Kinematic viscosity of biodiesel components (fatty acid
alkyl esters) and related compounds at low temperatures, USA, Elsevier, 27
September 2006.
Li, Z., Zhang, X., Wu, Z., Deng, J.,Huang., Experimental study of biodiesel spray and
combustion parameters, Shanghai, Tongi & Shanghai Jiao Tong Universities, 2006.
Martyr, A.J. and Plint, M.A., Engine testing, United Kingdom, Elsevier, 2007 Third
edition.
McCormick, R.L., Tennant, C., Hayes, R.R., Black, S., Irelan, J., McDaniel, T.,
Williams, A.,Frailey, M., Sharp, C., Regulated emissions from biodiesel tested in
heavy duty engines meeting 2004 emission standards, USA, Department of Energy
& Southwest Research institute, 2005.
Mittlebach, M. and Remschmidt, C., Biodiesel, the comprehensive handbook,
Vienna, Boersedruck Ges.m.b.H, 2005.

86
Schenck Pegasus GmbH, Test- and Automation Systems: MTU_D2-
7600_GD03en.doc, Schenck, 23 July 2001.
Shigley, J.E. and Mischke, C.R., Mechanical engineering design, Singapore,
Mcgraw-hill, 2001.
Sonntag, R.E. and Borgnakke, C., Introduction to engineering thermodynamics,
USA, John Wiley and Sons, 2001.
Standards South Africa, Automotive diesel fuel, South Africa, South African National
Fuel Standards, 8 November 2002.
Tsolakis, A., Megaritis, A., Wyszynski, M.L., Theninnoi, K., Engine performance and
emissions of a diesel engine operating on diesel-RME blend with EGR, United
Kingdom, Elsevier, 2007.
Van Gerpen, J., Biodiesel production and fuel quality, University of Idaho, 2005.
Venter, J., The A to Z of Servos, Stellenbsoch, 5 May 2005.
Waina, K.S., Pereza, J.M., Chapmanb, E., Boehman, A.L, Alternative and low sulfur
fuel options: boundary lubrication performance and potential problems, USA,
Tribology International, 2005.

87
Appendix A: Research methodology mind map

88
Appendix B: Gantry crane calculations A crane was required to get the equipment on and off the test bench. It was thought
to mount a beam on the roof of the test cell parallel with the test bed. This was
however discarded as it is not used on a regular basis and cannot be used
elsewhere in the test cell. A portable gantry on castor wheels (see Figure B-1) was
design and manufactured.
Figure B-1: Picture of the gantry crane with a hoist and beam trolley
The initial Toyota engine setup weighed around 300kg, which would only require a
half ton gantry. The test cell, however, may be used for commercial engines such as
the 300kW John Deere tractor engines, which would weigh more. It was decided to
construct a 1 ton gantry that could be disassembled to get it in and out of the test cell
doors. Since a beam trolley is being used, the weight of the load could be carried by

89
a single support when the trolley is moved to the side. All equations and material
properties were obtained from Craig (2000).
A fixed-free column is assumed as the horizontal beam is bolted to the supports
while the wheels are free to rotate on the ground, thus K = 2 (effective length factor).
The Eluer buckling load (compressive force) is given in Equation B-1. The column
however is most stressed under the elastic buckling load, given in Equation B-2.
2EIPcrL
π= (Eq. B-1)
2
2( )EIPcr
KLπ
= (Eq. B-2)
Where:
E = 200 GPa for structural steel
I = Moment of inertia for an I-beam
L = Effective length
K = Effective length factor
The moment of inertia for an I-beam illustrated in Figure B-2 (www.salvadori.org,
2007) is calculated using Equation B-3.
Figure B-2: I-beam moment of inertia
2 3H A CH2(AB) + +
2 2 12I ⎛ ⎞ ⎛ ⎞= ⎜ ⎟ ⎜ ⎟
⎝ ⎠ ⎝ ⎠ (Eq. B-3)

90
Two ∅ 77x2300x3 mm pipe sections were in stock, already with flat plates welded on
either end. The above equations were put into an Excel document (see Table B-1).
Table B-1: Gantry calculations
Material properties
E = 2.00E+11 GPa
Effective Length factor – K = 2
Ro = 38.5 mm
Wall thickness = 3 mm
Ri = 35.5 mm
I = 4.78E-07 m^4
L = 2.3
Governing Equation Pcr = (pi^2*EI)/((KL)^2)
Calculations
Tubing: compression only
Pcr = 1.78E+02 kN
= 18.19 tons
Tubing: Elastic Buckling Load
Pcr = 4.46E+01 kN
= 4.55 tons
From the above table it can be seen that the tube maximum Euler buckling load is 18
tons and the maximum Elastic buckling load is 4.5 tons. The tube section is therefore
more than sufficient for the given 1 ton load.
The stress in the 150mm plate which was welded to the I-beam and bolted to the
uprights was calculated to be 4.62 MPa under maximum load, far less than the
300MPa yield strength for a steel weld (Shigley and Mischke, 2001). Removable
gussets were later added to reduce the flex in the uprights when the gantry is moved

91
by applying force to one side (i.e. when moved by one person). The addition of the
gussets further reduced the stress in the weld, making it neglible.
The maximum load of 500kg/castor would occur when the trolley is moved to one
side (1000kg divided between the two castors). After some research it was found
that the maximum rating of most common castors was 450 - 480kg. These may be
acceptable although not too spec, therefore it was decided to source and use larger
680kg rated castors.
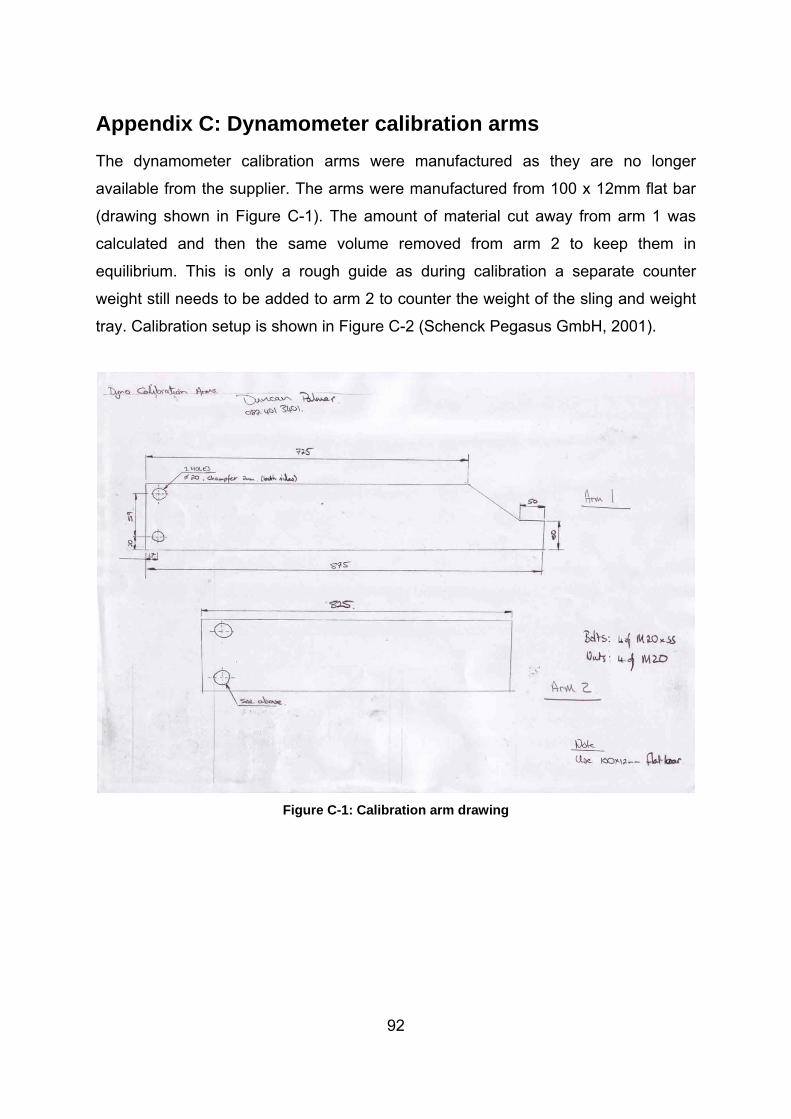
92
Appendix C: Dynamometer calibration arms The dynamometer calibration arms were manufactured as they are no longer
available from the supplier. The arms were manufactured from 100 x 12mm flat bar
(drawing shown in Figure C-1). The amount of material cut away from arm 1 was
calculated and then the same volume removed from arm 2 to keep them in
equilibrium. This is only a rough guide as during calibration a separate counter
weight still needs to be added to arm 2 to counter the weight of the sling and weight
tray. Calibration setup is shown in Figure C-2 (Schenck Pegasus GmbH, 2001).
Figure C-1: Calibration arm drawing

93
Figure C-2: Dynamometer calibration setup
The manufacturer recommended a distance of 1019mm from the centre of the
dynamometer to the weight tray with a g = 9.81 m3.kg-1.s-2 to give a reading of 1Nm
per kilogram added. In Stellenbosch g =9.79325 m3.kg-1.s-2, thus the length of the
arm was recalculated to 1021mm. The manufactured arms were then attached,
levelled, and 1021mm was measured and marked on arm 1. The arm was returned
to the workshop to machine a V shape slot into which the sling will rest. It was
decided not to make the arm adjustable as this will prevent any tampering or
incorrect readings in the future.

94
Appendix D: Servo Specifications

95
Appendix E: PLC pin connections Module Pin Connection
1200+24Vdc Emergency stop +IN 0 Emergency stop -IN 2C0M 1IN 5IN 7IN 9IN 11IN 1324 COM COM 0COM 0 24 COMIN 1IN 3IN 4IN 6IN 8IN 10IN 12VAC L1 220 Vac LiveVAC NEUT 220 Vac NeutralOUT 0OUT 1 Fuel relay +24VpsOUT 2 Starter relay +24VpsVAC DC 3OUT 5 3-way valve actuator UPOUT 6OUT8EARTH 220 Vac Protective earthVAC DC 0VAC DC 1 Fuel relay EarthVAC DC 2 Starter/Glow plug relay Common earthOUT 3 Glow plug relay +24VpsOUT 4 3-way valve actuator DOWNVAC DC 4OUT 7OUT 9
2A + 2DIN 0 D360 SpeedIN 1 D360 TorqueOUT 0 D360 ControlOUT 1 PWM Throttle controller
4AIN 0 AVL Fuel consumptionIN 1 P.oil 4-20mAIN 2 P.ambient 0-5V IN 3 Relative humidity 4-20mA
T1IN 0 T.ambientIN 1 T.water.outIN 2 T.water.inIN 3 T.oil
T2IN 0 T.exhaustIN 1 T.dynoIN 2 T.inlet.airIN 3 T.spare
T3IN 0 T.control.roomIN 1IN 2IN 3

96
Appendix F: Löbro shaft catalogue pages

97

98
Appendix G: Calibrated channels in ETA

99

100

101
Appendix H: IN and OUT ladder logic for the PLC

102

103

104
Appendix I: Water temperature controller flow diagram and ladder logic

105

106

107
Appendix J: Performance curves; ULSD1, ULSD2, B5, B10, B15 and B50
0
10
20
30
40
50
60
0 1000 2000 3000 4000 5000
Engine speed [RPM]
Pow
er [k
W]
80
100
120
140
160
180
200
Torq
ue [N
m] Power
Torque
Figure J-1: ULSD1 Performance curve
0
10
20
30
40
50
60
0 1000 2000 3000 4000 5000
Engine speed [RPM]
Pow
er [k
W]
80
100
120
140
160
180
200
Torq
ue [N
m]
PowerTorque
Figure J-2: ULSD2 Performance curve
0
10
20
30
40
50
60
0 1000 2000 3000 4000 5000
Engine speed [RPM]
Pow
er [k
W]
80
100
120
140
160
180
200
Torq
ue [N
m] Power
Torque
Figure J-3: B5 Performance curve

108
0
10
20
30
40
50
60
0 1000 2000 3000 4000 5000
Engine speed [RPM]
Pow
er [k
W]
80
100
120
140
160
180
200
Torq
ue [N
m]
PowerTorque
Figure J-4: B10 Performance curve
0
10
20
30
40
50
60
0 1000 2000 3000 4000 5000
Engine Speed [RPM]
Pow
er [k
W]
80
100
120
140
160
180
200
Torq
ue [N
m]
PowerTorque
Figure J-5: B15 Performance curve
0
10
20
30
40
50
60
0 1000 2000 3000 4000 5000
Engine speed [RPM]
Pow
er [k
W]
80
100
120
140
160
180
200
Torq
ue [N
m]
PowerTorque
Figure J-6: B50 Performance curve

109
Appendix K: Wiring diagrams

110
Appendix L: Fuel and water supply schematics with pictures

111

112
Appendix M: Energy balance calculations A sharp edged orifice plate was used to determine the flow rate of engine coolant.
The equations and methodology for the water flow calculations were obtained from
Crowe et al (2001). The plate was installed as in Figure M-1, with D = 55 mm and d
= 26 mm. A mercury-water manometer was used to measure the pressure difference
of 10 mmHg. The water and air flow rates remained constant for both diesel and
biodiesel.
Figure M-1: Standard orifice plate setup as used in to determine the flow rate (Crowe et al.,
2001)
Through interpolation of the water tables in Crowe et al (2001), the following water
properties were obtained at 65°C to calculate the water flow rate:
• Kinematic viscosity: v = 4.435 X 10⁻⁶ m2/s
• Density: ρ = 980 kg/m3
Initially the piezometric head is calculated:
6
( 1)
128.776 10
Hg
w
h l
h m of water
ρρ
−
Δ = Δ −
Δ = ×
With the head the known the parameter (Red/K) can be calculated:

113
6
6
2 0.026 2 9.81 128.778 104.435 10
29.318
d g hv
d g hv
−
−
Δ × × ×=
×Δ
=
From Figure M-2 with 0.473dD
= and 2
9.318d g h
vΔ
= the value for flow coefficient
(K) can be read off:
Figure M-2: Flow coefficient K and Red/K versus the Reynolds number (Crowe et al., 2001)
K=0.69. Substituting this into the flow equation:
2
6 3
3
24
576.454 10 /
10 /
w
w
w
Q K d g h
Q m s
or Q kg s
π
−
−
= Δ
= ×
= 564.925×

114
The following ambient air conditions and flow rates were recorded during the test
using a handheld flow meter held at the engines air inlet and the test cell’s ambient
sensors:
• Temperature: T = 21.81°C
• Pressure: P = 100.07 kPa
• Air velocity: v = 16 m.s-1
• Pipe diameter: d = 67 mm
The density of air at the given conditions was obtained from Sonntag and Borgnakke
(2001).
• Density: ρ = 1.169 kg/m3
The flow rate of the air into the engine can thus be determined:
3 3
3
56.41 10 /
65.662 10 /
a
a
a
Q vA
Q m s
or Q kg s
−
−
=
= ×
= ×
From Martyr and Plint (2007) the following data were obtained:
• Specific heat of air at constant pressure: Cp = 1.004 kJ/kg.K
• Specific heat of water: Cw = 4.18 kJ/kg.K
The steady flow of energy (Martyr and Plint, 2007) was then calculated for diesel
using the data in Table 4-2. All values are given in kW:
Combustion energy of fuel 3
1
1
~ 10
182.81D f L
D
H m C
H
= ×
=
Enthalpy of exhaust gas
2
2
(~ ~ )
78.166D f a p e
D
H m m C T
H
= +
=
Enthalpy of inlet air

115
3
3
~
19.37D a p a
D
H m C T
H
=
=
Heat to cooling water
1 2 1
1
~ ( )50.05
D w w w w
D
Q m C T TQ
= −=
The only remaining unknown is the loss due to convection and radiation. This is
determined by drawing up an energy balance and subtracting the flow of energy out
of the control volume (taken as the engine block) from the energy flowing into the
control volume.
1 2 3 1 2
2 1 3 2 1
2
( )D s D D D D
D D D s D D
D
H P H H Q QQ H H P H Q
Q
= + − + +∴ = + − − −
= 24.843
The flow of energy out of the control volume was calculated for biodiesel with the
data in Table 4-2.
Enthalpy of exhaust gas
2
2
(~ ~ )
77.308B f a p e
B
H m m C T
H
= +
=
Enthalpy of inlet air
3
3
~
19.37B a p a
B
H m C T
H
=
=
Heat to cooling water
1 2 1
1
~ ( )48.117
B w w w w
B
Q m C T TQ
= −=
Since the engine and setup conditions were kept the same, it can assume that the
convection and radiation losses remained the same. The remaining unknown is the

116
combustion energy which can now be calculated, and thus the calorific value of the
biodiesel obtained.
2 2
1 2 3 1 2
1
13
( )178.348
~ 10
38.462 /
B D
B s B B B D
B
BL
f
L
Q QH P H H Q QH kW
HCm
C MJ kg
== + − + +=
∴ =×
∴ =

117
Appendix N: Press articles Die Burger: 10 September 2007

118
Engineering News: 21-27 September 2007
Ingligting: 4 October 2007

119
The Matie: 23 September 2007

120
Alumni Ingligting: November 2007
www.sun.ac.za/index.asp: 8 August 2007

121
SACHIe Research and Development conference: 26 June 2007
1st prise won for best poster
The development of a biofuels evaluation laboratory (Production and Engine Testing) with emphasis on
biodieselD Palmer, G Griffin, L Lorenzen, J van der Spuy*
Department of Process Engineering, University of Stellenbosch, Private Bag X 1, Matieland, 7602*Department of Mechanical and Megatronic Engineering, University of Stellenbosch, Private Bag X1, Matieland, 7602
[[email protected] ; [email protected]]
BackgroundBiodiesel is fast becoming an attractive substitute of petroleum diesel due to cleaner combustion and the depleting mineral oil reserves.
Further research is needed to make the production process feasible, sustainable and financially viable and to measure the performance characteristics of engines using the fuel. Research Development
Objectives• The research is aimed to produce a process unit capable of handling different feedstock with varying quality whilst still maintaining the maximum yield.
• Yield properties should be similar to that of mineral diesel and meet the legal requirements and standards for South Africa.
At this level, research is done to define and optimize the process variables to:
• Accelerate the batch production process,
• Increase the yield and
• Minimise energy input into the system.
•
References: [1] Gavi, E., 2007. CFD modelling and scale-up of confined impinging jet reactors. Chemical Engineering Science, pp 2228-2241.
At this level, research is done to define and optimize the process variables to:
• Accelerate the batch production process,
• Increase the yield and
• Minimise energy input into the system.
The outcomes of this stage is then used to:
• Improve the efficiency an existing batch production process using waste vegetable oil
•
Who can say what the future holds?
Engine testing will be done in a biofuel specific facility. Biodiesel combustion properties, such as energy content and emissions data will be obtained.
The biodiesel results will then be used to refine an optimise the manufacturing process. On road tests may also be performed using a fleet vehicle.

122
Appendix O: BTF Corporate logo