the development of conceptual, mathematical and system
TRANSCRIPT

151
JIOS, VOL. 39, NO. 2 (2015), PP. 151-162
JIOS, VOL.39, NO. 2 (2015) SUBMITTED 9/15; ACCEPTED 11/15
The Development of Conceptual, Mathematical and System
Dynamics Model for Food Industry Wastewater Purifying System
Lovorka Gotal Dmitrović [email protected] University centre Varaždin,
University North, Varaždin, Croatia
Vesna Dušak [email protected] Faculty of Organization and Informatics
University of Zagreb, Varaždin, Croatia
Aleksandra Anić Vučinić [email protected] Faculty of Geotehnical Engineering
University of Zagreb, Varaždin, Croatia
Abstract
The paper presents the development of the conceptual, mathematical and system dynamics
model for the food industry wastewater purification system which removes organic matter.
The food industry often located in places where is difficult to install large systems for water
purification while small sophisticated systems are expensive. Wastewater food industry is
contaminated with organic matter, phosphorus and nitrogen compounds. This paper presents a
model of the small, cheap and effective cleaner water. The goal of the scientific investigation
is developing such a model for purification wastewater and methodology design suitable to
significant behavior patterns of contamination matter. Developed conceptual model is a
computer variables model uses randomly chosen values from the theoretical probability
distribution of the variable applied. For the validation of the model, considering that the
distributions are asymmetrical non-Gaussian distributions, a non-parametric test was applied.
Methodology proposed in the paper is mostly based on the simulation modeling.
Keywords: Conceptual model, Mathematical model, System Dynamics model, Wastewater
Purifying System
1. Introduction
Environmental protection as an interdisciplinary scientific discipline is rapidly developing,
using information and communication technology (ICT). Discovering, integrating and
analyzing huge amounts of heterogeneous data is crucial in exploring the complex issues in
environmental protection. Environmental informatics offers tools and approaches for the
management of environmental data and transforms it into information and knowledge. The
development of information technology affects the quality of data and research itself and
moreover, it provides a stable base for their further development.
The goal of the simulation modeling is purification wastewater optimization process and
methodology design suitable to significant behavior patterns of contamination matter.
Mathematical models for the modeling and analyzing system, such as models of differential
equations in continuous time models of differential equations with discrete time, the
techniques of operations research and simulation models of discrete events, are well described
in the literature, but the overall analysis behavior of technical systems including a dynamic
approach (P. T. Hello6).
The choice of methodology for the analysis and design of water treatment processes
continuous-discrete processesis very sensitive. Analyzing, modeling and optimization of the
UDC 004.94:628.3:664Original Scientific Paper

152
JIOS, VOL. 39, NO. 2 (2015), PP. 151-162
GOTAL DMITROVIC, DUŠAK AND ANIĆ VUČINIĆ THE DEVELOPMENT OF CONCEPTUAL…
system behavior is based on the process modeling approach. This approach ensures the
correct description of the structure, the entities and features relationships of the system, while
modeling allows development of technical systems models regardless the diversity of
behavior of their components. Studies on process modeling and model selection can be found
in other works in this field (Pidd18). As simulation modeling, includes methods and techniques
for the development of continuous and discrete systems models, as and the mechanism of the
transition from one to the other components stage, assure correct choice for model designing
(P. Klingstam12).
Also, simulation modeling can display the system at various levels. Conceptual models offer a
presentation given to the lawfulness of its behavior and structure, and thus allow the study of
the most important parameters of the functioning the entire system or its components. Using
mathematical, statistical and algorithmic presentation system, allowing to explore the legality
of the system behavior, as well as the interdependence of its entities, and the development of a
system dynamics model of the system. In this way, simulation modeling is a powerful tool for
analyzing the state system, alignment parameters and the selection of the appropriate mode of
operation of technical systems.
The focus of this paper is modeling the purifying systems for food industry wastewater. In
order to make the systems work in optimal conditions that are based on the concentrations of
pollution data, the designing of a conceptual as well as a mathematical model was required.
These models can show the reduction in the observed pollutants concentration, by using the
systems of differential-difference equations for the purifiers considered, along with function
equations for each substance. After checking the goodness of these models by comparing the
actual output value of the pollution concentration with the outputs of experiments, it was
verified, that they adequately represent the real system.
Following the mathematical model functions work development, it was necessary to
design a computer model as well. Mathematical functions present independent variables,
while the water quality in the supplied water purification systems, presents a dependent
variable.
2. The Conceptual Model of Real System
From Water and Environment Joint Stock Company (WACO) database in Čakovec, North
Croatia, the actual water treatment data, for the period of 5 years, was obtained. Due to the
limited research material, the samples were based on the organic matter concentration. The
weekly mean value of the data was calculated, while the Missing data (P.D. Allison1) belongs
to Missing at random (MAR)), the sample remains representative. For the data processing
(J.G. Ibrahim5, L. Gotal Dmitrović3) the recommended deletion method is Listwise deletion,
which is only used for the complete rows of table data.
Values Missing at random (MAR) is an alternative to data Missing completely at random
(MCAR), which occurs when the missing data is relating to a particular variable, like for
example an accidentally skipped answer from a questionnaire (Little, R.J.A.13).
When one or more values are missing in a set of numbers, most software packages use
Listwise Deletion Method. It is a simple method, most commonly used for missing data
management. This method deletes rows containing gaps, and uses only the complete ones
(P.D.Allison1; J.G.Ibrahim8). The interesting fact (L. Gotal Dmitrović5) is that the Listwise
Deletion Method, which is the simplest method, provides very good matching results with the
probability distributions. This method, in non-Gaussian probability distribution, closely
follows the observed distributions, with the exception of a deviation from the actual value at
the peak of the distribution.
For the purposes of this study, the actual, empirical data was collected and used from the
non-Gaussian probability distribution of the observed technical system. These are asymmetric
probability distributions with a tail, as is often the case in modeling complex technical
systems (GotalDmitrović, L.6).

153
JIOS, VOL. 39, NO. 2 (2015), PP. 151-162
JOURNAL OF INFORMATION AND ORGANIZATIONAL SCIENCES
To achieve the authenticity of the model, it is necessary to incorporate the actual system
behavior using the weekly mean concentration values, which were determined from the
typical theoretical distribution of probability for every particular event frequency.
Using the applications Stat::Fit simulation packages Servicemodelv4.2., the characteristic
theoretical distribution of the organic matter concentration, as well as the basic characteristics
of descriptive statistics, were obtained at each checkpoint (at the entrance and the exit). These
data is shown in Table 1.
The entrance to the
bioaeration tank
Output from to the bioaeration
tank
Theoretical
distribution
Lognormal (-207; 6,63;
0,483)
Lognormal (4,68; 3,28; 0,576)
Data points 261 260
Minimum (mgO2/l) 36,1429 9,71429
Maximum (mgO2/l) 1 947,43 146,857
Mean (mgO2/l) 641,144 36,0885
Median (mgO2/l) 548,429 32
Mode (mgO2/l) 243,786 24,1429
Standard deviation
(mgO2/l) 403,587 19,9632
Variance ((mgO2/l)2) 162 882 398,529
Coefficient of
variation (mgO2/l) 62,9479 55,3174
Table 1 Descriptive statistics and characteristic theoretical probability distribution of organic
matter in the control point
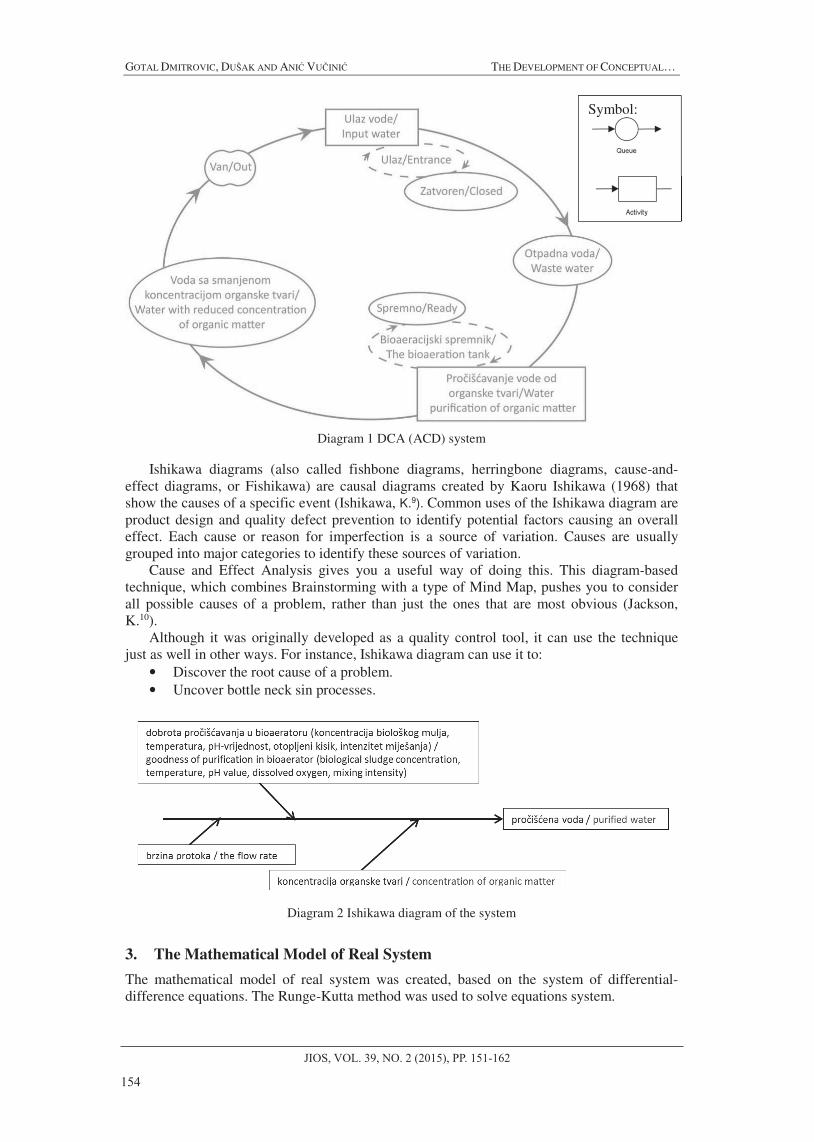
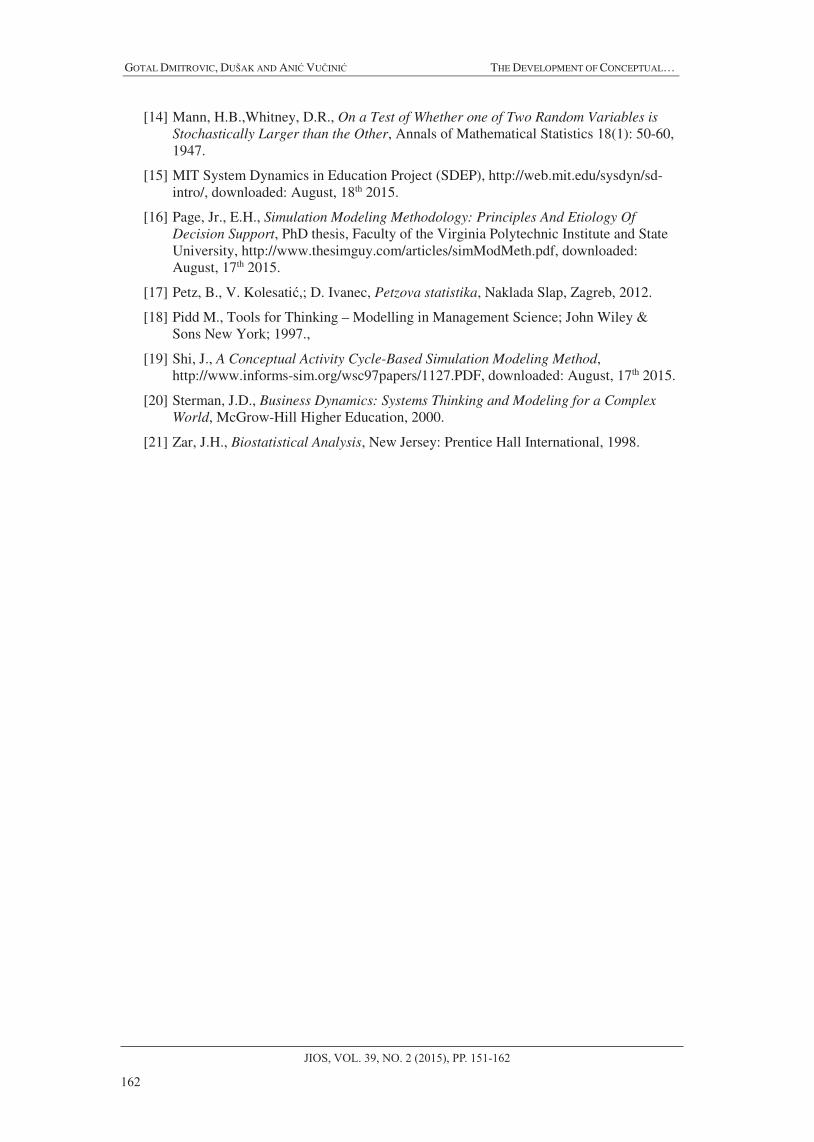
After processing the data, the conceptual model was developed. The conceptual model of
real system in the Diagram cycle activity - DCA(or Activity cycle diagram - ACD) form was
created (Diagram 1), as well as Ishikawa diagram (Diagram 2).
There are many known modeling paradigms to describe the dynamics of system in
process-oriented, event-based and activity-based viewpoints. Among those modeling
paradigms, the activity-based modeling is a natural way to represent the activity paradigm of
discrete event simulation, our knowledge about a system components patterns behavior. In
activity-based modeling the dynamics of system is represented as an ACD (activity cycle
diagram) which is a network model of the logical and temporal relationships among the
activities (Shi, J.19). An ACD is easily implemented with the activity scanning method of
simulation execution (Page, Jr., E.H.16). The activity cycle diagram (ACD) is a method to describe the interactions of objects in a
system. It uses the common graphical modeling notation to explain series of activities in real-
life diverse circumstances. The core idea of the ACD was conceived by Tocher to describe the
congestion problem at the steel plant in a general framework, called flow diagram with the
three-phase rule (Kang, D.11). The objects in a system can be classified into two classes:
1) Transient object or entity that receives the services and leaves the system,
2) Resident object or resource that serves the entities.
In the ACD, the behavior or lifecycle of an entity or resource in the system is represented
by an activity cycle, which alternates the active states with the passive states. The passive
state of an entity or resource is called a queue in a circle, and the active state is called an
activity in a rectangle as shown in Diagram 1. The arc is used to connect the activity and
queue. The activity represents the interaction between an entity and resource(s), which usually
takes a time delay to finish it. The token is used to represent the state of the queue and
activity. All activity cycles are closed on itself ((Kang, D.11).
154
JIOS, VOL. 39, NO. 2 (2015), PP. 151-162
GOTAL DMITROVIC, DUŠAK AND ANIĆ VUČINIĆ THE DEVELOPMENT OF CONCEPTUAL…
Diagram 1 DCA (ACD) system
Ishikawa diagrams (also called fishbone diagrams, herringbone diagrams, cause-and-
effect diagrams, or Fishikawa) are causal diagrams created by Kaoru Ishikawa (1968) that
show the causes of a specific event (Ishikawa, K.9). Common uses of the Ishikawa diagram are
product design and quality defect prevention to identify potential factors causing an overall
effect. Each cause or reason for imperfection is a source of variation. Causes are usually
grouped into major categories to identify these sources of variation.
Cause and Effect Analysis gives you a useful way of doing this. This diagram-based
technique, which combines Brainstorming with a type of Mind Map, pushes you to consider
all possible causes of a problem, rather than just the ones that are most obvious (Jackson,
K.10).
Although it was originally developed as a quality control tool, it can use the technique
just as well in other ways. For instance, Ishikawa diagram can use it to:
• Discover the root cause of a problem.
• Uncover bottle neck sin processes.
Diagram 2 Ishikawa diagram of the system
3. The Mathematical Model of Real System
The mathematical model of real system was created, based on the system of differential-
difference equations. The Runge-Kutta method was used to solve equations system.
Symbol:

155
JIOS, VOL. 39, NO. 2 (2015), PP. 151-162
JOURNAL OF INFORMATION AND ORGANIZATIONAL SCIENCES
Mathematical modeling framework was applied to develop the model component of water
treatment system using differential and difference-differential equations. This occurs for the
component according to the following reaction (1) written as differential equation.
S = (D·(I - S) – dS/dt) / (K + D) (1)
Whereas:
I – input concentration in system (mg/l),
S – output concentration in system (mg/l),
dS/dt - changes in water cleanliness (mg/l/h),
K – goodness of purification (1/h),
1/D – time in the water holding in components (h).
The changes in water cleanliness are:
dS/dt = D·(I-S) - S·(K+D) (2)
Initial equation in system component, according to equation (2), is:
dS/dt = D ∙ (I - S) – K ∙ S (3)
dS/dt = (-D - K) ∙ S + D ∙ I (4)
dS/dt + (D + K) · S = D · I (5)
Written in the form of difference equations:
S(t+Δt) = S(t) + D·(I – S)·Δt – K·S·Δt (6)
In the component, the difference equation was generated by using the Runge-Kutta
method. Assuming that t(0) = 0, that is, at time t(0), the output S(0) = 0, according to the
Runge-Kutta (IV) method, applies:
S(ti+1) = S(ti+Δti) = S(ti) + 1/6 [K1(i)+K2
(i)+K3(i)+K4
(i)] (8)
Whereas:
K1(i) = Δti· F(ti, S(ti)) (9)
F(ti, S(ti)) = D · (I(ti) – S(ti) – K(ti) · S(ti) (10)
K2(i) = Δti· F(ti + Δti/2, S(ti) + 1/2K1
(i)) (11)
F(t, S) = (-D – K) · S + D · I (12)
F(ti + Δti/2, S(ti) + ½ K1(i)) =
= (-D – K(ti + Δti/2)) · [S(ti) + 1/2 K1(i) +D · I(ti+Δti/2)] (13)
K3(i) = Δti· F(ti + Δti/2, S(ti) + 1/2K2
(i)) (14)
F(ti + Δti/2, S(ti) + ½ K2(i)) =
= (-D – K(ti + Δti/2)) · [S(ti) + 1/2 K2(i) +D · I(ti+Δti/2)] (15)
K4(i) = Δti· F(ti + Δti/2, S(ti) + K3
(i)) (16)
F(ti + Δti, S(ti) + K3(i)) =
= (-D – K(ti + Δti)) · [S(ti) + K3(i) +D · I(ti+Δti)] (17)
The goodness of purification isn't constant and it is presented as a theoretical probability
distribution (Table 2):
K = f(S)/S = {{{{[(I-S)·D]-dS/dt}}}}/S (18)
A variables model uses randomly chosen values from the theoretical probability
distribution of the applied variable (Table 1 for input concentration (I) and Table 2 for
goodness of purification (K)).

156
JIOS, VOL. 39, NO. 2 (2015), PP. 151-162
GOTAL DMITROVIC, DUŠAK AND ANIĆ VUČINIĆ THE DEVELOPMENT OF CONCEPTUAL…
Goodness of purification in the bioaeration tank (K) Theoretical distribution Lognormal (-21,3; 3,63; 0,239)
Data points 260 Minimum (1/h) 0,856716 Maximum (1/h) 55,7228
Mean (1/h) 17,504 Median (1/h) 15,8148 Mode (1/h) 15,1228
Standard deviation (1/h) 9,35954 Variance (1/h)2 87,6011
Table 2 Descriptive statistics and characteristic theoretical probability distribution for
goodness of purification
Retention time (1 / D) is obtained from the expression:
1/D=V/Q (19)
Whereas :
V - volume component (m3) and
Q - flow rate of water through a component (m3 / day).
4. The System Dynamics Model of Real System
System dynamics is an approach to understanding the nonlinear behavior of technical systems
over time using stocks and flows, internal feedback loops and time delays (MIT15).
John Sterman, in his book “Business Dynamics: Systems Thinking and Modeling for a
Complex World” said: “System dynamics is a perspective and set of conceptual tools that
enable us to understand the structure and dynamics of complex systems. System dynamics is
also a rigorous modeling method that enables us to build formal computer simulations of
complex systems and use them to design more effective policies and organizations. Together,
these tools allow us to create management flight simulators-micro worlds where space and
time can be compressed and slowed so we can experience the long-term side effects of
decisions, speed learning, develop our understanding of complex systems, and design
structures and strategies for greater success” (Sterman, J.D.20).
The system dynamics model was created using the Powersim Constructor program v. 2.51
(Figure 1).
Figure 1 System dynamics model of water purification of organic matter in the bioaeration
tank (L. Gotal Dmitrović3)
Symbol:

157
JIOS, VOL. 39, NO. 2 (2015), PP. 151-162
JOURNAL OF INFORMATION AND ORGANIZATIONAL SCIENCES
The model system pseudo code is shown in Figure 2.
Figure 2 Pseudo code model systems
The main object of interest was exploring the behavior of the crucial variable driving the
purifying process (values of waste concentration and parameters of purifying equipment).
Within the researched complex technical purifying system, all variables are non-Gaussian.
According to the amount of data and its occupancy and behavior, the exploratory statistics
along with a nonparametric test were applied for the validation of the model.
The two independent samples were used for the rank the sum test (the Mann-Whitney U-
test). In statistics, the Mann-Whitney U test (also called the Mann-Whitney-Wilcoxon
(MWW), Wilcoxon rank-sum test (WRS), or Wilcoxon-Mann-Whitney test) is a
nonparametric test of the null hypothesis that two samples come from the same population
against an alternative hypothesis, especially that a particular population tends to have larger
values than the other. It can be applied on unknown distributions contrary to t-test which has
to be applied only on normal distributions, and it is nearly as efficient as the t-test on normal
distributions. (Mann, H.B.14).
The test involves the calculation of a statistic, usually called U, whose distribution under
the null hypothesis is known. The U test is included in most modern statistical packages. It is
also easily calculated by hand, especially for small samples. There are two ways of
calculating U.
1. For comparing two small sets of observations, a direct method is quick, and gives
insight into the meaning of the U statistic, which corresponds to the number of wins out of all
pairwise contests. For each observation in one set, count the number of times this first value
wins over any observations in the other set (the other value loses if this first is larger). Count
0.5 for any ties. The sum of wins and ties is U for the first set. U for the other set is the
converse.
2. Assign numeric ranks for larger samples to all the observations, beginning with 1 for
the smallest value. Where there are groups of tied values, assign a rank equal to the midpoint
of unadjusted rankings [e.g., the ranks of (3, 5, 5, 9) are (1, 2.5, 2.5, 4)].
U is then given by (Zar, J.H.21):
= − () (20)
where n1 is the sample size for sample 1, and R1 is the sum of the ranks in sample 1.

158
JIOS, VOL. 39, NO. 2 (2015), PP. 151-162
GOTAL DMITROVIC, DUŠAK AND ANIĆ VUČINIĆ THE DEVELOPMENT OF CONCEPTUAL…
Note that it doesn't matter which of the two samples is considered sample 1. An equally
valid formula for U is
= − () (21)
The smaller value of U1 and U2 is one consulting significance tables. The sum of the two
values is given by
+ = − () + − ()
(22)
Knowing thatR1+R2=N(N+1)/2 and N=n1+n2, and doing some algebra, we find that the
sum is
+ = (23)
After confirming the goodness of the model, the actual system was designed (Table 3) to
experiment with concentrations of organic matter in the food industry unpurified wastewater.
The environmental data was transferred to the adaptive model within the various conditions,
by the means of visualization and manipulation of basic system parameters, which are
portable and adaptable to possible crisis situations.
Real v. Model Mann-
Whitney U test
The bioaeration tank -
organic matter
Minimum (mgO2/l) 9,71 10,09 H0
Z = -1,62996
p= 0,103106 Maximum (mgO2/l) 146,85 135,03 Mean (mgO2/l) 36,18 41,25
Table 3 Comparison of the real data and the data obtained by model
5. The Model of Food Industry Wastewater Purifying System
The adaptability of this model has been verified by the experiment in which the input
variables were the organic matter concentrations from food industry wastewater (Table 4).
Organic compounds consist mainly of carbon, hydrogen and oxygen. The organic matter
in wastewaters is typically a mixture of proteins and carbohydrates as well as oils and fats. In
the slaughterhouse and meat industry wastewaters, for example, the organic content is mainly
composed of grease which can be solid, suspended or emulsified.
The low solubility of fats and oils reduces the rate of their biological decomposition while
in the wastewater treatment plant, fats can block up the wastewaters’ treatment devices. If
grease is not removed before the discharge of the treated wastewater, it can interfere with
biological life in surface waters.
Wastewater also contains urea and small quantities of simple and extremely complex
synthetic organic molecules. There are different analyses to determine the organic content of
wastewater. The analyses can be divided into those that are used for measuring aggregate
organic matter content in wastewater and those that are used for analyzing the individual
organic compounds quantity. As a rule, only the aggregate organic matter content is
measured. It consists of biochemical oxygen demand (BOD), chemical oxygen demand
(COD) and total organic carbon (TOC).
Conc. of org. matter in the wastewater
Theoretical distribution Exponential (8,33; 223)
Data points 17
Minimum (mgO2/l) 8,33
Maximum (mgO2/l) 677
Mean (mgO2/l) 231,722
Median (mgO2/l) 176

159
JIOS, VOL. 39, NO. 2 (2015), PP. 151-162
JOURNAL OF INFORMATION AND ORGANIZATIONAL SCIENCES
Mode (mgO2/l) 8,33
Standard deviation (mgO2/l) 204,544
Variance (mgO2/l) 41 838,2
χ2-test p-value: 0,662 H0
Kolmogorov-Smirnov test p-value: 0,952 H0
Anderson-Darling test p-value: 0,054 H0
Table 4 Descriptive statistics and theoretical probability distribution of organic matter in food
industry wastewater
The system dynamics model of food industry wastewater purifying system is shown in
Figure 3.
Figure 3 System dynamics model of food industry wastewater purifying system
Pseudo code of food industry wastewater purifying system is shown in Figure 4.
Figure 4 Pseudocode of food industry wastewater purifying system
As the result, the wastewater has been purified from organic matter and turned into
quality water suitable for releasing into a public sewerage system (Figure 5).
Symbol:

160
JIOS, VOL. 39, NO. 2 (2015), PP. 151-162
GOTAL DMITROVIC, DUŠAK AND ANIĆ VUČINIĆ THE DEVELOPMENT OF CONCEPTUAL…
Figure 5 Results output concentrations (maximum allowable value is 125 mg O2/l)
Maximum Permissible Concentration (MPC) for the organic matter in effluents from
wastewater, discharged into the public sewage system is 125 mg O2/l. According to the
concentration of the organic matter at the exit from the model (after waste water treatment)
will not exceed a value of 90 mg O2/l.
6. Conclusion
Based on the study and the developed model, the food industry wastewater purifying system
has been designed and recommended. Academic literature frequently publishes articles in
which such systems describe the construction and technological solutions.
Discovering, integrating and analyzing huge amounts of heterogeneous data, often
referred to as ‘big data’, is a key point in exploring complex technical systems. The
development of information technologies with a special emphasis on the research methods of
gathering and analyzing data and their storage and data access, have significantly enhanced
the laboratory methods and their reports. Relational database allows employing constraints
and roles on data types that can be entered (e.g. data typing), which can be used to assure the
data quality with great multimedia approach involving related to adequate data or system
representation on different level. Therefore, databases are crucial for analyzing and metadata
preparation, as well as simulation modeling in order to establish conceptual models. Statistical
software tools support many functions of simulation modeling, providing the additional
benefit of supporting robust calculations, data analysis, quality assurance, visualization and
data sub-setting.
The scientific community (as are G. H. Huang, N. B. Chang7 in Journal of Environmental
Informatics, or Marie S. Burbano2 leads CDM Smith's wastewater modeling group etc.), has
recently highlighted the need for the conceptualization and parameterization of the system
model before the construction of the system itself. Also, large amounts of data often require
special attention during their analysis and purification especially in the case of significant
number of non-existing data. Large amounts of data requires in-depth analysis as well as a
post hoc analysis, because a large amount of data can contain hidden knowledge reaching
only by data mining in their depth, required to detect patterns of behavior observed entities
and the media system as a whole.
The model was developed in order to gain the information on water purification. The
input variables were used according to the results of the organic matter concentrations from

161
JIOS, VOL. 39, NO. 2 (2015), PP. 151-162
JOURNAL OF INFORMATION AND ORGANIZATIONAL SCIENCES
the waste water. What is more, the model is adaptable and can also be used for other
concentrations or for studying the contamination of other substances. The methods of
modeling and conceptualization of such situations contribute significantly to environmental
protection and human health.
In addition, the economic component of the system should also be taken into
consideration. The developed adaptive model allows setting the optimal structure of the
model according to the needs and working environment.
Based on conducted research, developed and designed wastewater purification system,
simulation model for food industry was done. Authors recommended implementations of
developed model to optimized purification process parameters in accordance to legislation.
References
[1] Allison P.D., Missing Data, Sage University Papers Series on Quantitative
Applications in the Social Science, 2001.
[2] Burbano, M. S., Process Modeling Simulates Wastewater Treatment System
Behavior, CDM Smith, http://cdmsmith.com/en-US/Insights/Viewpoints/Process-
Modeling-Simulates-Wastewater-Treatment-System-Behavior.aspx, downloaded:
October, 5th 2015.
[3] Gotal Dmitrović, L.,Razvoj složenih inženjerskih sustava za pročišćavanje vode, PhD
thesis, Sveučilište u Zagrebu, Fakultet organizacije i informatike, 2015.
[4] Gotal Dmitrović, L.; Dušak, V.; Dobša, J.Misssing data problems in Non-Gaussian
probability distributions, Informatologia, Vol. 49, 3- 4, 2016.
[5] Gotal, L.; V. Dušak; T. Legović, A Proposal for Satisfactory Potable Water Quality
in the City of Varazdin, Geographical Information Systems, International Conference
and Exhibition/D. Kereković (ur.), Hrvatskiinformatičkizbor - GIS Forum, 415-426,
2002.
[6] Helo P.T., Dynamic modelling of surge effect and capacity limitation in supply
chains; International Journal of Production Research; Volume 38, Number 17, 2000.,
[7] Huang, G. H., Chang, N. B., Perspectives of Environmental Informatics and Systems
Analysis, Journal of Environmental Informatics, Volume 1 (1), 1-6, 2003.,
[8] Ibrahim, J. G.; M. H. Chen; S. R. Lipsitz; A. H. Herring, Missing-Dana Methods for
Generalised Linear Models: A Comparative Review, Journal of the American
Statistical Association, 2005.
[9] Ishikawa, K., Guide to Quality Control, Asian Productivity Organization, UNIPUB.
ISBN 92-833-1036-5, 1976.
[10] Jackson, K., Cause and Effect Analysis - Identifying the Likely Causes of Problems,
https://www.mindtools.com/pages/article/newTMC_03.htm, downloaded: August,
18th 2015.
[11] Kang, D., Choi, B. K., Visual Modeling And Simulation Toolkit For Activity Cycle
Diagram, http://www.scs-
europe.net/conf/ecms2010/2010%20accepted%20papers/ibs_ECMS2010_0037.pdf,
downloaded: August, 18th 2015.
[12] Klingstram P., A methodology for supporting manifacturing system development;
success factors for integrating simulation in the engineering process; New
Supporting Tools for Designing Products and Producion Systems, Leuven, 1999.,
[13] Little, R.J.A., A Test of Missing Completely at Random for Multivariate Data with
Missing Values, Journal of the American Statistical Associatian, 83, 404, 1198-1202,
1988.
162
JIOS, VOL. 39, NO. 2 (2015), PP. 151-162
GOTAL DMITROVIC, DUŠAK AND ANIĆ VUČINIĆ THE DEVELOPMENT OF CONCEPTUAL…
[14] Mann, H.B.,Whitney, D.R., On a Test of Whether one of Two Random Variables is
Stochastically Larger than the Other, Annals of Mathematical Statistics 18(1): 50-60,
1947.
[15] MIT System Dynamics in Education Project (SDEP), http://web.mit.edu/sysdyn/sd-
intro/, downloaded: August, 18th 2015.
[16] Page, Jr., E.H., Simulation Modeling Methodology: Principles And Etiology Of
Decision Support, PhD thesis, Faculty of the Virginia Polytechnic Institute and State
University, http://www.thesimguy.com/articles/simModMeth.pdf, downloaded:
August, 17th 2015.
[17] Petz, B., V. Kolesatić,; D. Ivanec, Petzova statistika, Naklada Slap, Zagreb, 2012.
[18] Pidd M., Tools for Thinking – Modelling in Management Science; John Wiley &
Sons New York; 1997.,
[19] Shi, J., A Conceptual Activity Cycle-Based Simulation Modeling Method,
http://www.informs-sim.org/wsc97papers/1127.PDF, downloaded: August, 17th 2015.
[20] Sterman, J.D., Business Dynamics: Systems Thinking and Modeling for a Complex
World, McGrow-Hill Higher Education, 2000.
[21] Zar, J.H., Biostatistical Analysis, New Jersey: Prentice Hall International, 1998.