the development of easycbm spanish literacy … · the development of easycbm spanish literacy...
TRANSCRIPT

Technical Report # 1301
The Development of easyCBM Spanish Literacy
Assessments for Use in
Grades K-2
Julie Alonzo
Magaly Gonzalez
Gerald Tindal
University of Oregon
Published by Behavioral Research and Teaching University of Oregon • 175 Education 5262 University of Oregon • Eugene, OR 97403-5262 Phone: 541-346-3535 • Fax: 541-346-5689 http://brt.uoregon.edu
Author Note: An earlier draft of this manuscript was previously presented at the American Educational Research Association’s 2008 Annual Meeting, New York, NY.

Abstract
In this study, we describe two studies used to select appropriate assessments to measure
phonemic awareness, alphabetic principle, and fluency in the Spanish language for
students receiving literacy instruction in Spanish. We first describe two studies in which
we use linear regression and correlations to examine the appropriateness of different
types of phonological awareness and early reading measures for first- and second-grade
students receiving literacy instruction in Spanish. We report our findings from two
studies carried out with two distinct populations: native English speakers enrolled in a
Spanish language immersion program at a small suburban school and native Spanish
speakers enrolled in a dual language immersion program at a large urban school (reported
in the section identified as Initial Item Development Study). In both studies, performance
on a measure of Syllable Sounds reading was the most significant predictor of oral
reading fluency. We then provide alternate form reliability information for each of the
easyCBM Spanish literacy measures (reported in the section identified as Reliability
Study).
SPANISH EASYCBM Page 4
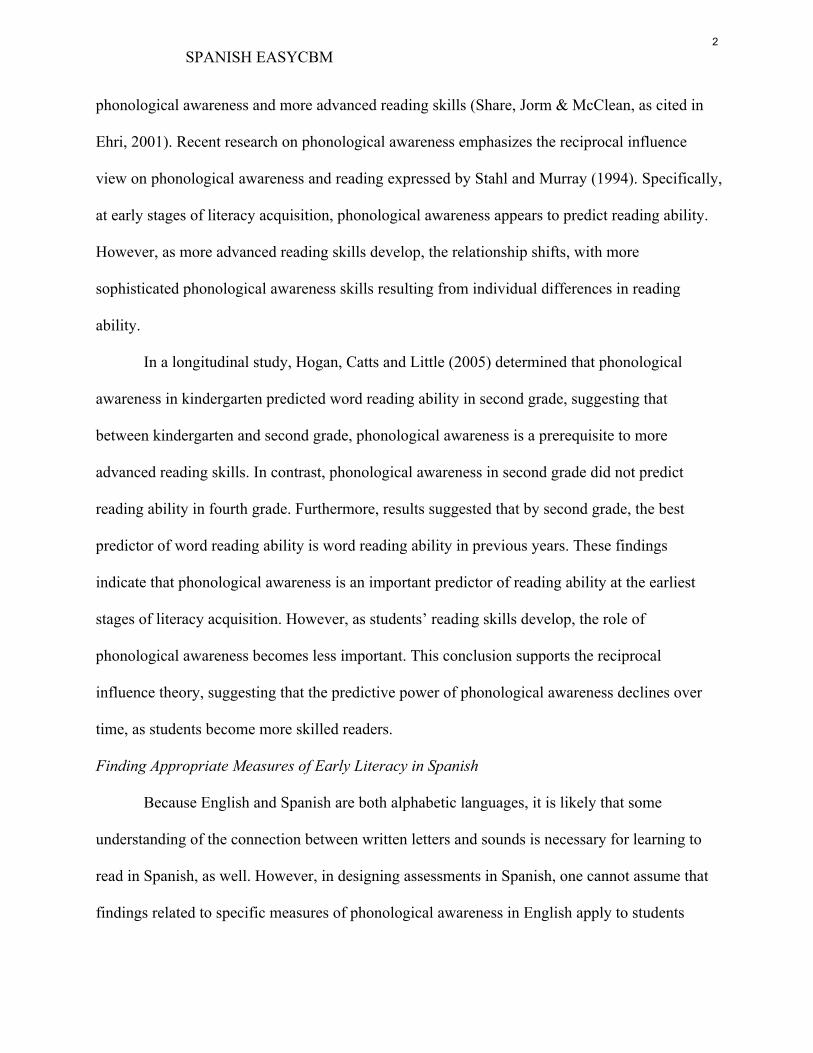
The Development of the easyCBM Spanish Literacy Assessments for Use in Grades K-2
Over the past decade, there has been a 65% increase in the number of Spanish-speaking
students attending school in the United States (Woolfolk, 2004). In the 1999-2000 school year,
12.7% of all public and public charter schools in the United States included immersion programs
(National Center for Education Statistics, 2002). In many of these schools, students received at
least part of their instruction in Spanish. Educators at these schools are often faced with a
dilemma if they want to use student performance assessments to monitor the progress students
are making in developing literacy skills. Measures developed for use with English-speaking
populations may not be appropriate for use with students receiving instruction in a language
other than English. Our study addresses this concern. We examine the appropriateness of
different measures of early literacy designed for use with students receiving instruction in
Spanish.
Measuring Early Literacy Skills in English
One skill area commonly included in English literacy assessments is phonological
awareness, or an understanding of the smaller units of speech contained within a word. In
English, phonemic segmentation and blending are two areas of phonological awareness
commonly assessed. However, teachers who work with students receiving literacy instruction in
Spanish express dissatisfaction with these measures for their students, suggesting that syllables,
rather than phonemes are more appropriate for students receiving literacy instruction in Spanish
(Gonzalez, Alonzo, & Tindal, 2007).
The majority of research on the relationship between phonological awareness and more
advanced reading skills focuses on students who speak English as a first language and are
receiving literacy instruction in English. Early studies in this area show a correlation between
1
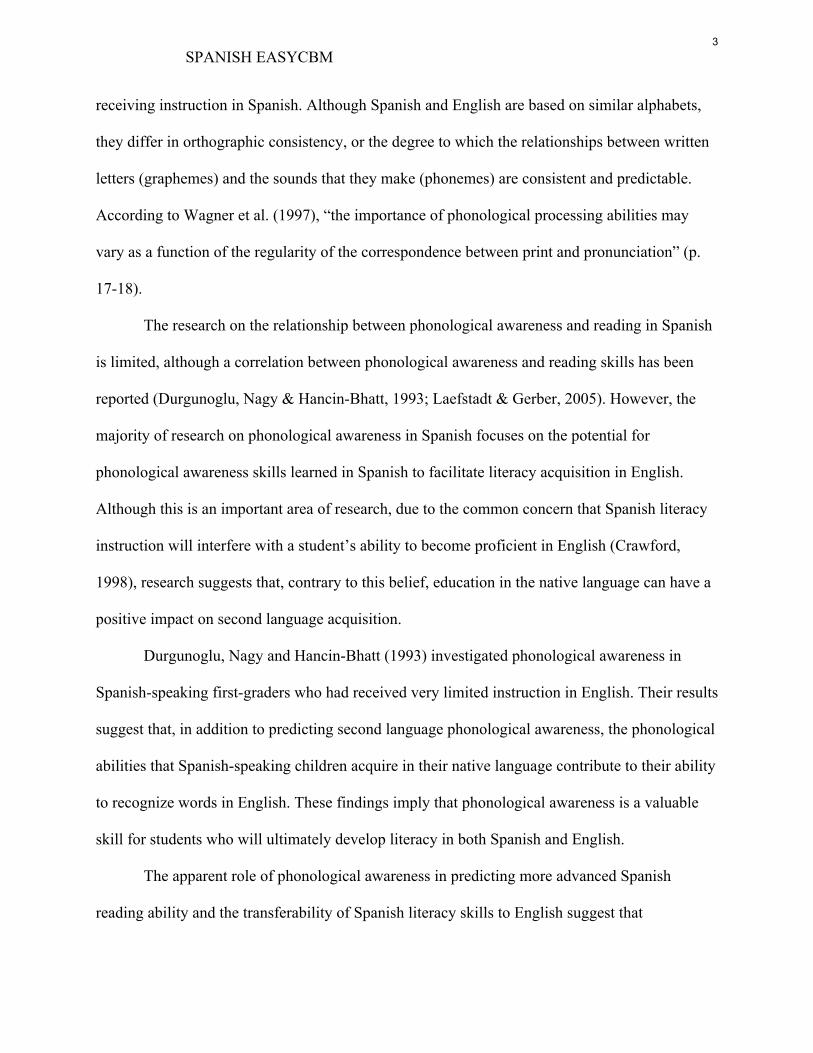
SPANISH EASYCBM Page 5
phonological awareness and more advanced reading skills (Share, Jorm & McClean, as cited in
Ehri, 2001). Recent research on phonological awareness emphasizes the reciprocal influence
view on phonological awareness and reading expressed by Stahl and Murray (1994). Specifically,
at early stages of literacy acquisition, phonological awareness appears to predict reading ability.
However, as more advanced reading skills develop, the relationship shifts, with more
sophisticated phonological awareness skills resulting from individual differences in reading
ability.
In a longitudinal study, Hogan, Catts and Little (2005) determined that phonological
awareness in kindergarten predicted word reading ability in second grade, suggesting that
between kindergarten and second grade, phonological awareness is a prerequisite to more
advanced reading skills. In contrast, phonological awareness in second grade did not predict
reading ability in fourth grade. Furthermore, results suggested that by second grade, the best
predictor of word reading ability is word reading ability in previous years. These findings
indicate that phonological awareness is an important predictor of reading ability at the earliest
stages of literacy acquisition. However, as students’ reading skills develop, the role of
phonological awareness becomes less important. This conclusion supports the reciprocal
influence theory, suggesting that the predictive power of phonological awareness declines over
time, as students become more skilled readers.
Finding Appropriate Measures of Early Literacy in Spanish
Because English and Spanish are both alphabetic languages, it is likely that some
understanding of the connection between written letters and sounds is necessary for learning to
read in Spanish, as well. However, in designing assessments in Spanish, one cannot assume that
findings related to specific measures of phonological awareness in English apply to students
2
SPANISH EASYCBM Page 6
receiving instruction in Spanish. Although Spanish and English are based on similar alphabets,
they differ in orthographic consistency, or the degree to which the relationships between written
letters (graphemes) and the sounds that they make (phonemes) are consistent and predictable.
According to Wagner et al. (1997), “the importance of phonological processing abilities may
vary as a function of the regularity of the correspondence between print and pronunciation” (p.
17-18).
The research on the relationship between phonological awareness and reading in Spanish
is limited, although a correlation between phonological awareness and reading skills has been
reported (Durgunoglu, Nagy & Hancin-Bhatt, 1993; Laefstadt & Gerber, 2005). However, the
majority of research on phonological awareness in Spanish focuses on the potential for
phonological awareness skills learned in Spanish to facilitate literacy acquisition in English.
Although this is an important area of research, due to the common concern that Spanish literacy
instruction will interfere with a student’s ability to become proficient in English (Crawford,
1998), research suggests that, contrary to this belief, education in the native language can have a
positive impact on second language acquisition.
Durgunoglu, Nagy and Hancin-Bhatt (1993) investigated phonological awareness in
Spanish-speaking first-graders who had received very limited instruction in English. Their results
suggest that, in addition to predicting second language phonological awareness, the phonological
abilities that Spanish-speaking children acquire in their native language contribute to their ability
to recognize words in English. These findings imply that phonological awareness is a valuable
skill for students who will ultimately develop literacy in both Spanish and English.
The apparent role of phonological awareness in predicting more advanced Spanish
reading ability and the transferability of Spanish literacy skills to English suggest that
3
SPANISH EASYCBM Page 7
phonological awareness is an important area of instruction and assessment for students
developing literacy in Spanish. However, care must be taken in determining how best to assess
phonological awareness in Spanish.
One of the most fundamental differences between Spanish and English is the consistency
of their orthographies. The Spanish language has a highly consistent orthography. According to
DeFior, Martos and Cary (2002), “Spanish is a clear example of a shallow orthography. Each
grapheme has a clear and precise phonemic translation” (p.137). In contrast, grapheme-phoneme
correspondences in English are much less consistent, resulting in many irregularly spelled words.
Because of the regularity of phonemes, literacy instruction in Spanish often emphasizes syllables,
rather than individual phonemes (Alvarez, Carreiras & Perea, 2004; Carreiras & Perea, 2004;
Jimenez Gonzalez & Garcia, 1995). According to Alvarez, Carreiras and Perea (2004), “most
readers in Spanish have learned to read via a syllabic method, taking advantage of the fact that
Spanish has clear syllable boundaries” (p. 430). This syllable-based instruction is supported by
recent studies on the importance of the syllable as a unit of processing in Spanish. Alvarez,
Carreiras and Perea’s (2004) study indicates that the syllable is an important unit of processing in
Spanish, and that it exerts an effect on language comprehension at the level of phonological
understanding.
The effect of syllable-level word properties on Spanish-speaking students’ reading skills
implies that understanding the syllables within words represents an important component of
literacy in Spanish. Considering this evidence for attention to the syllable, along with the relative
consistency of the phonemes within Spanish syllables, it is logical to propose that phonemic
awareness may not be as important in Spanish as it is in a less orthographically consistent
language such as English. It is clear that phonemic awareness is a useful predictor of early
4
SPANISH EASYCBM Page 8
reading skills in English. Despite limited evidence, preliminary findings suggest that
phonological awareness is an important early reading skill in Spanish as well. However, it does
not necessarily follow that the same ways of measuring phonological awareness will be equally
appropriate across the two languages. In our study, we examine the appropriateness of different
early reading measures for use with elementary students receiving instruction in Spanish as
opposed to English.
Methods: Initial Item Development Study
We used a correlational design to study the relative validity of the use of different
measures of phonological awareness for first- and second-grade students receiving literacy
instruction in Spanish. We conducted the study twice, with different study populations, to test the
robustness of our findings across different samples with different language backgrounds. In both
the initial (Study 1) and the replication study (Study 2), we administered the same measures of
early literacy using the same standardized administration protocol. The different measures were
administered in the same order across all participants in both studies.
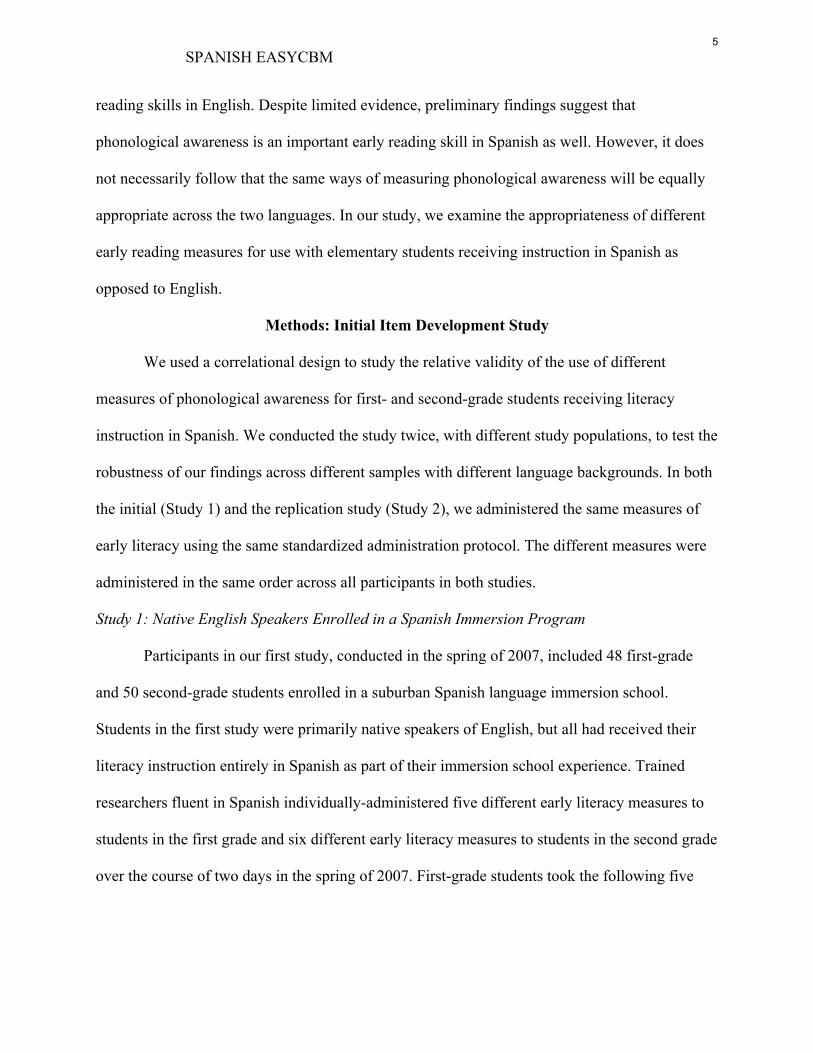
Study 1: Native English Speakers Enrolled in a Spanish Immersion Program
Participants in our first study, conducted in the spring of 2007, included 48 first-grade
and 50 second-grade students enrolled in a suburban Spanish language immersion school.
Students in the first study were primarily native speakers of English, but all had received their
literacy instruction entirely in Spanish as part of their immersion school experience. Trained
researchers fluent in Spanish individually-administered five different early literacy measures to
students in the first grade and six different early literacy measures to students in the second grade
over the course of two days in the spring of 2007. First-grade students took the following five
5
SPANISH EASYCBM Page 9
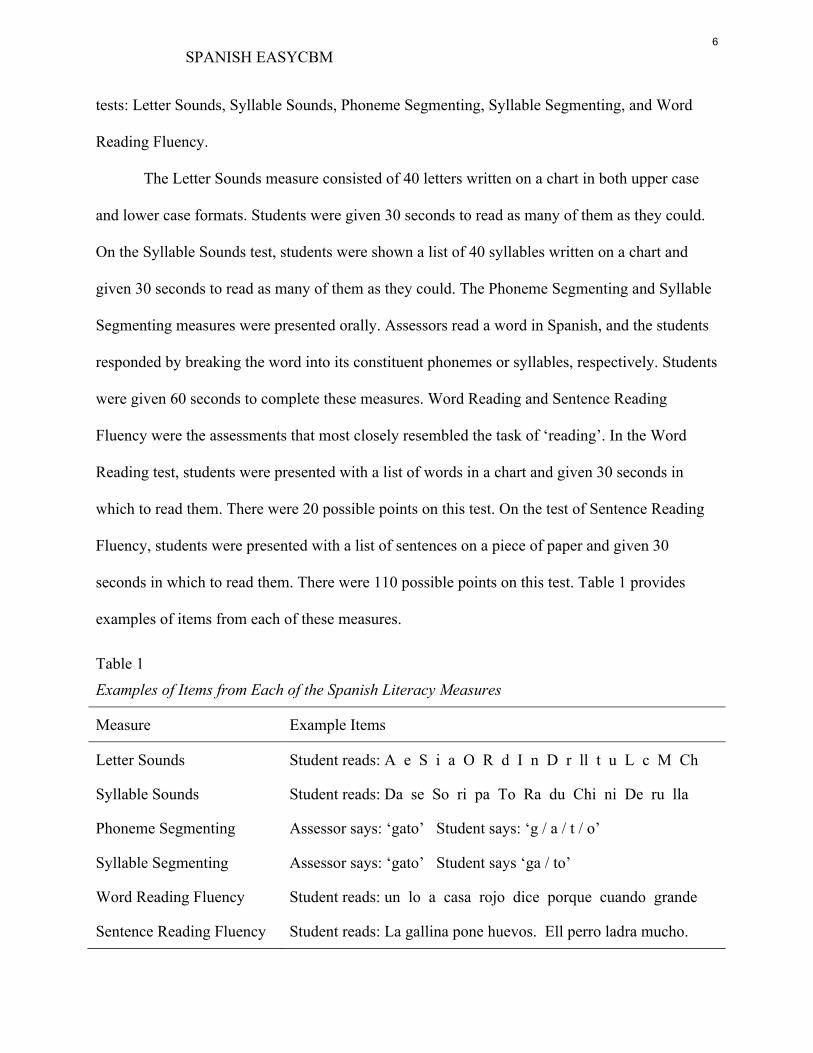
tests: Letter Sounds, Syllable Sounds, Phoneme Segmenting, Syllable Segmenting, and Word
Reading Fluency.
The Letter Sounds measure consisted of 40 letters written on a chart in both upper case
and lower case formats. Students were given 30 seconds to read as many of them as they could.
On the Syllable Sounds test, students were shown a list of 40 syllables written on a chart and
given 30 seconds to read as many of them as they could. The Phoneme Segmenting and Syllable
Segmenting measures were presented orally. Assessors read a word in Spanish, and the students
responded by breaking the word into its constituent phonemes or syllables, respectively. Students
were given 60 seconds to complete these measures. Word Reading and Sentence Reading
Fluency were the assessments that most closely resembled the task of ‘reading’. In the Word
Reading test, students were presented with a list of words in a chart and given 30 seconds in
which to read them. There were 20 possible points on this test. On the test of Sentence Reading
Fluency, students were presented with a list of sentences on a piece of paper and given 30
seconds in which to read them. There were 110 possible points on this test. Table 1 provides
examples of items from each of these measures.
Table 1 Examples of Items from Each of the Spanish Literacy Measures
Measure Example Items
Letter Sounds Student reads: A e S i a O R d I n D r ll t u L c M Ch
Syllable Sounds Student reads: Da se So ri pa To Ra du Chi ni De ru lla
Phoneme Segmenting Assessor says: ‘gato’ Student says: ‘g / a / t / o’
Syllable Segmenting Assessor says: ‘gato’ Student says ‘ga / to’
Word Reading Fluency Student reads: un lo a casa rojo dice porque cuando grande
Sentence Reading Fluency Student reads: La gallina pone huevos. Ell perro ladra mucho.
6

SPANISH EASYCBM Page 10
In all cases, students were supplied the correct answer if they paused longer than 3
seconds on a particular item and asked to continue. In these cases, the item was scored incorrect.
Student self-corrections were counted as correct. Raw scores “Total correct in a given amount of
time” were used in all analyses. We analyzed the results by running correlations and linear
regressions to test the strength of the relationship between the different early literacy measures
and the measure used to assess student ability to read orally in Spanish.
Study 2: Native Spanish Speakers Enrolled in an English/Spanish Bilingual Program
Our replication study, conducted in January of 2008, included 72 students, divided into
two approximately equal groups of students in grade 1 and 2. Students for the second study were
native Spanish speaking students enrolled in an urban dual language bilingual immersion
program. The program uses the Estrellita's phonics program starting in kindergarten. Students
are first taught initial letter sounds. After they know the initial sounds, they are taught to blend
each initial sound with "a", hence they learn syllables with "a". Next, they move on to learn
syllables with "e". Once students have been taught this pattern, they generalize their learning to
the other vowel sounds used in the creation of syllables without explicit instruction.
As in the initial study, all literacy instruction for these students had been provided in
Spanish. Two changes were made in test administration from Study 1 to Study 2. To avoid a
‘ceiling effect’ on the two orally-administered tests (phoneme and syllable segmenting), we
shortened the administration timing from one minute to 30 seconds. In addition, because first-
grade students in Study 1 had done so well on the Word Reading measure, we added the
Sentence Reading measure to the battery of tests administered to the first-grade students in Study
2. All other methodological features of the two studies were identical.
7
SPANISH EASYCBM Page 11
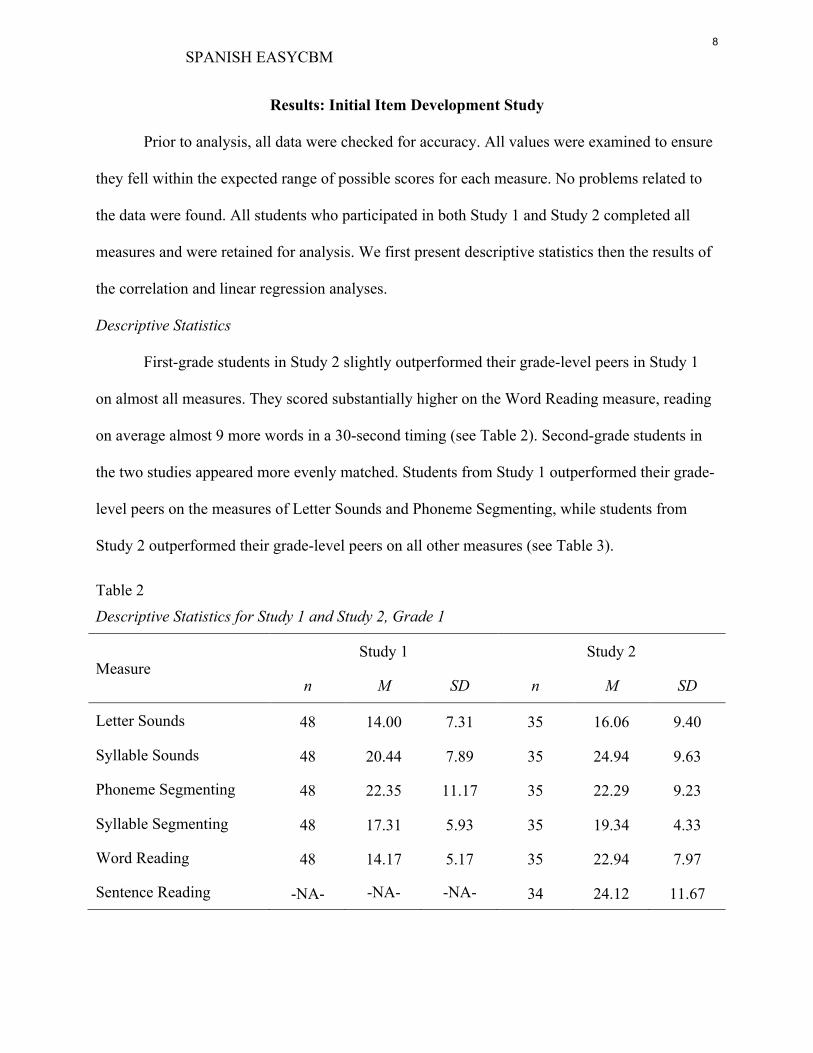
Results: Initial Item Development Study
Prior to analysis, all data were checked for accuracy. All values were examined to ensure
they fell within the expected range of possible scores for each measure. No problems related to
the data were found. All students who participated in both Study 1 and Study 2 completed all
measures and were retained for analysis. We first present descriptive statistics then the results of
the correlation and linear regression analyses.
Descriptive Statistics
First-grade students in Study 2 slightly outperformed their grade-level peers in Study 1
on almost all measures. They scored substantially higher on the Word Reading measure, reading
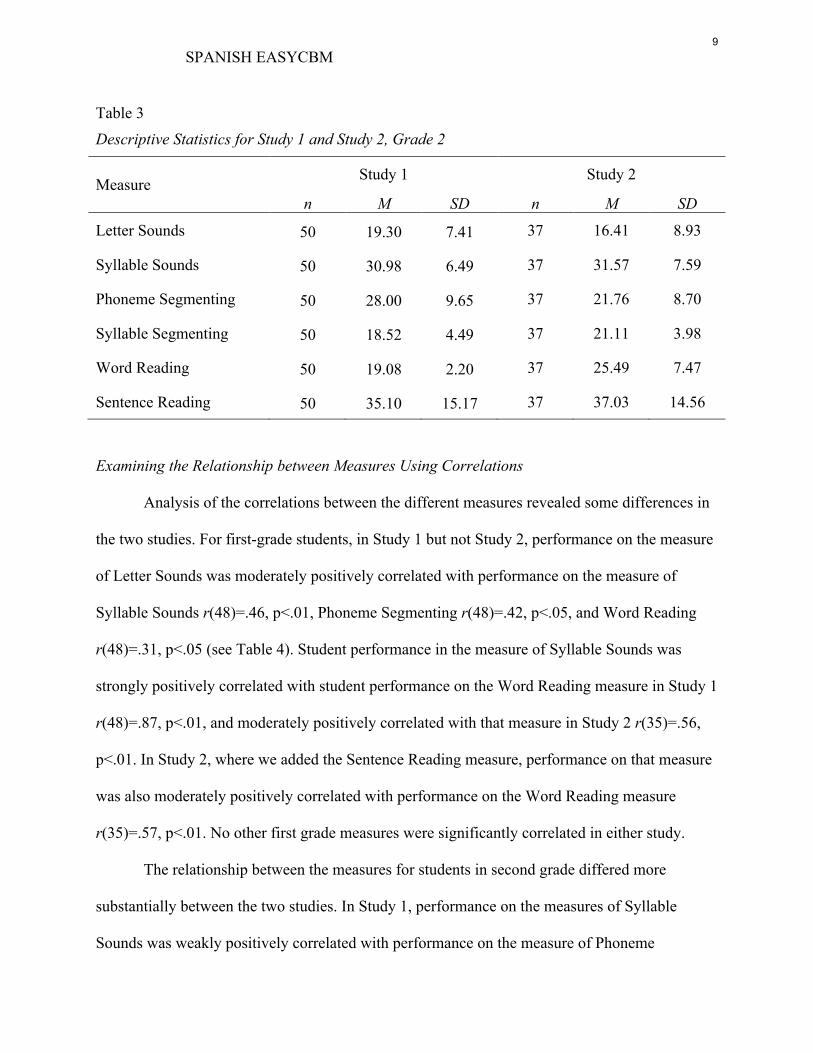
on average almost 9 more words in a 30-second timing (see Table 2). Second-grade students in
the two studies appeared more evenly matched. Students from Study 1 outperformed their grade-
level peers on the measures of Letter Sounds and Phoneme Segmenting, while students from
Study 2 outperformed their grade-level peers on all other measures (see Table 3).
Table 2 Descriptive Statistics for Study 1 and Study 2, Grade 1
Measure Study 1 Study 2
n M SD n M SD
Letter Sounds 48 14.00 7.31 35 16.06 9.40
Syllable Sounds 48 20.44 7.89 35 24.94 9.63
Phoneme Segmenting 48 22.35 11.17 35 22.29 9.23
Syllable Segmenting 48 17.31 5.93 35 19.34 4.33
Word Reading 48 14.17 5.17 35 22.94 7.97
Sentence Reading -NA- -NA- -NA- 34 24.12 11.67
8
SPANISH EASYCBM Page 12
Table 3 Descriptive Statistics for Study 1 and Study 2, Grade 2
Measure Study 1 Study 2
n M SD n M SD
Letter Sounds 50 19.30 7.41 37 16.41 8.93
Syllable Sounds 50 30.98 6.49 37 31.57 7.59
Phoneme Segmenting 50 28.00 9.65 37 21.76 8.70
Syllable Segmenting 50 18.52 4.49 37 21.11 3.98
Word Reading 50 19.08 2.20 37 25.49 7.47
Sentence Reading 50 35.10 15.17 37 37.03 14.56
Examining the Relationship between Measures Using Correlations
Analysis of the correlations between the different measures revealed some differences in
the two studies. For first-grade students, in Study 1 but not Study 2, performance on the measure
of Letter Sounds was moderately positively correlated with performance on the measure of
Syllable Sounds r(48)=.46, p<.01, Phoneme Segmenting r(48)=.42, p<.05, and Word Reading
r(48)=.31, p<.05 (see Table 4). Student performance in the measure of Syllable Sounds was
strongly positively correlated with student performance on the Word Reading measure in Study 1
r(48)=.87, p<.01, and moderately positively correlated with that measure in Study 2 r(35)=.56,
p<.01. In Study 2, where we added the Sentence Reading measure, performance on that measure
was also moderately positively correlated with performance on the Word Reading measure
r(35)=.57, p<.01. No other first grade measures were significantly correlated in either study.
The relationship between the measures for students in second grade differed more
substantially between the two studies. In Study 1, performance on the measures of Syllable
Sounds was weakly positively correlated with performance on the measure of Phoneme
9

SPANISH EASYCBM Page 13
Segmenting r(50)=.38, p<.01; moderately correlated with the measure of Syllable Segmenting
r(50)=.42, p<.01; and more strongly correlated with the measure of Word Reading r(50)=.59,
p<.01 and Sentence Reading r(50)=.69, p<.01 (see Table 5). In contrast, in Study 2, the measure
of Syllable Sounds was only positively correlated with the measures of Word Reading r(37)=.67,
p<.01 and Sentence Reading r(37)=.50, p<.01, although—as in Study 1—these correlations were
moderate to strong.
Table 4 Correlations Among the Grade 1 Measures in Study 1 (n = 48) & Study 2, Grade 1(n =35 )
Letter Sounds
Syllable Sounds
Phoneme Segmenting
Syllable Segmenting Word Reading
1 2 1 2 1 2 1 2 1 2
Syllable Sounds .46** .28
Phoneme Segmenting .42** .13 .33* .01
Syllable Segmenting -.11 -.07 .05 -.04 .23 -.06
Word Reading .31* .09 .87** .56** .21 .02 .19 .22
Sentence Reading NA .06 NA .45** NA -.10 NA .11 NA .57**
*p < .05 **p < .01
10

SPANISH EASYCBM Page 14
Table 5 Correlations Among the Grade 2 Measures in Study 1 (n =50 ) & Study 2 (n = 37)
Letter Sounds
Syllable Sounds
Phoneme Segmenting
Syllable Segmenting Word Reading
1 2 1 2 1 2 1 2 1 2
Syllable Sounds .37** .40*
Phoneme Segmenting .15 .04 .38** -.05
Syllable Segmenting .08 .08 .42** .32 .45** .19
Word Reading .20 .37* .59** .67** .04 .26 .27 .39**
Sentence Reading .13 .42** .69** .50** .39** .28 .52** .30 .54** .86**
*p < .05 **p < .01
While Study 1 showed no significant relationship between performance on the measure
of Letter Sounds and Sentence Reading, Study 2 showed a moderate positive correlation between
these two measures r(37)=.42, p<.01. Similarly Study 1 showed weak to moderate correlations
between measures of Phoneme Segmenting and Syllable Segmenting, r(50)=.45, p<.01, and
Phoneme Segmenting and Sentence Reading r(50)=.39, p<.01, but Study 2 indicated no
significant correlation between performance on these measures. Finally, Study 2 indicated a
moderate positive relationship between performance on the measures of Syllable Segmenting
and Sentence Reading, r(50)=.52, p<.01, while Study 2 instead showed a moderate positive
correlation between the measure of Syllable Segmenting and the measure of Word Reading
r(37)=.39, p<.01, but not Sentence Reading.
11
SPANISH EASYCBM Page 15
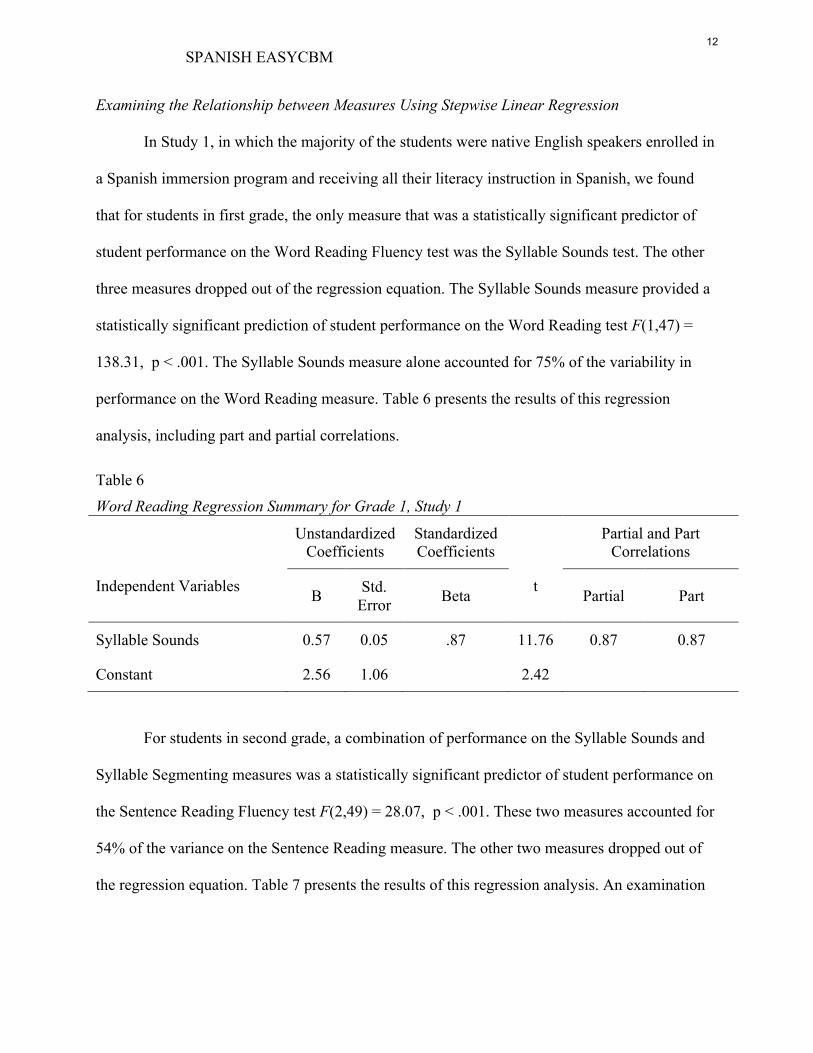
Examining the Relationship between Measures Using Stepwise Linear Regression
In Study 1, in which the majority of the students were native English speakers enrolled in
a Spanish immersion program and receiving all their literacy instruction in Spanish, we found
that for students in first grade, the only measure that was a statistically significant predictor of
student performance on the Word Reading Fluency test was the Syllable Sounds test. The other
three measures dropped out of the regression equation. The Syllable Sounds measure provided a
statistically significant prediction of student performance on the Word Reading test F(1,47) =
138.31, p < .001. The Syllable Sounds measure alone accounted for 75% of the variability in
performance on the Word Reading measure. Table 6 presents the results of this regression
analysis, including part and partial correlations.
Table 6 Word Reading Regression Summary for Grade 1, Study 1
Independent Variables
Unstandardized Coefficients
Standardized Coefficients
t
Partial and Part Correlations
B Std. Error Beta Partial Part
Syllable Sounds 0.57 0.05 .87 11.76 0.87 0.87
Constant 2.56 1.06 2.42
For students in second grade, a combination of performance on the Syllable Sounds and
Syllable Segmenting measures was a statistically significant predictor of student performance on
the Sentence Reading Fluency test F(2,49) = 28.07, p < .001. These two measures accounted for
54% of the variance on the Sentence Reading measure. The other two measures dropped out of
the regression equation. Table 7 presents the results of this regression analysis. An examination
12

SPANISH EASYCBM Page 16
of the part and partial correlations indicates that the Syllable Sounds measure accounted for
almost twice the variance that the Syllable Segmenting measure accounted for.
Table 7 Sentence Reading Regression Summary for Grade 2, Study 1
Independent Variables
Unstandardized Coefficients
Standardized Coefficients
t
Partial and Part Correlations
B Std. Error Beta Partial Part
Syllable Sounds 1.34 0.25 0.57 5.29 0.61 0.52
Syllable Segmenting 0.96 0.37 0.28 2.62 0.36 0.26
Constant -24.15 8.08 -2.99
Replication of this study with a native Spanish speaking student population returned
almost identical findings for the first-grade sample but slightly different findings for the second-
grade students. As in Study 1, for the first-grade students, performance on the measure of
Syllable Sounds was the only predictor of performance on either measure of reading fluency (see
Table 8). The Syllable Sounds measure provided a statistically significant prediction of student
performance on the Word Reading test F(1,33) = 14.95, p < .001.
Table 8 Word Reading Regression Summary for Grade 1, Study 2
Independent Variables
Unstandardized Coefficients
Standardized Coefficients
t
Partial and Part Correlations
B Std. Error Beta Partial Part
Syllable Sounds 0.46 0.11 .56 4.22 0.56 0.56
Constant 11.16 2.95 3.78
13

SPANISH EASYCBM Page 17
The Syllable Sounds measure alone accounted for 31% of the variability in performance on the
Word Reading measure.
Similar results were found when the early literacy measures were regressed onto the
Sentence Reading measure. The Syllable Sounds measure provided a statistically significant
prediction of student performance on the Sentence Reading test F(1,33) = 8.05, p < .01,
accounting for 20% of the variability in performance on the Sentence Reading measure. All other
possible predictive measures dropped out of the regression equation, indicating no statistically
significant predictive relationship to the measures of Word or Sentence Reading fluency.
Because we did not administer the Sentence Reading measure to the first-grade students in Study
1, the table includes only the result of the regression to the Word Reading measure to facilitate
cross-study comparisons.
For the second-grade sample, however, the findings differed slightly from Study 1 to
Study 2 (see Table 9). In Study 2, although performance on the Syllable Sounds measure again
emerged as the most significant predictor of performance on the Sentence Reading measure
(accounting for 25% of the variance in performance on the sentence measure), including the
Phoneme Segmenting measure in the regression equation increased the variance accounted for
substantially. Including both predictors in the equation accounted for 34% of the variance in
student performance on the Sentence Reading measure. As in Study 1, however, examination of
the part and partial correlations once more suggested the Syllable Sounds measure uniquely
accounted for almost twice the variance as the other measure.
14

SPANISH EASYCBM Page 18
Table 9 Sentence Reading Regression Summary for Grade 2, Study 2
Independent Variables
Unstandardized Coefficients
Standardized Coefficients
t
Partial and Part Correlations
B Std. Error Beta Partial Part
Syllable Sounds 0.99 0.27 0.52 3.72 0.54 0.52
Phoneme Segmenting 0.51 0.23 0.31 2.20 0.35 0.31
Constant -5.41 10.25 -0.53
The results of the initial item development studies informed our work in developing the
easyCBM Spanish literacy assessments of Syllable Segmenting, Syllable Sound Fluency, Word
Reading Fluency, and Sentence Reading Fluency. A description of an initial study of these
measures’ reliability is provided next.
Methods: Reliability Study
In this section, we describe the methods used in studying alternate form reliability of the
easyCBM Spanish measures. Data collected for this study were also used to provide additional
information about the relation between the Spanish measures.
Setting and Participants
Data for this reliability study were gathered in December of 2011 from a convenience
sample of classrooms whose teachers signed up to participate in response to a call for research
participants posted on the easyCBM website. Teachers received a gift card for $25 (Grades K
and 2) or $50 (Grade 1) for their participation, with the difference in compensation related to the
number of measures students were administered. Student participants were all Native Spanish
Speakers receiving at least some of their literacy instruction in Spanish. Students were
15

SPANISH EASYCBM Page 19
administered a series of Spanish-language assessments in one (Grades K and 2) or two days of
testing. All assessments were given by the students’ regular classroom teachers and/or
instructional assistants with whom they had been working on a regular basis. All assessments
were administered following a standardized written protocol for test administration. Students
were given one minute to complete each form of each measure. Table 10 lists the measures
administered in each grade.
Table 10
Measures Administered in the Spanish Assessment Reliability Study
Grade
Measures Administered (each X = 3 different forms administered to each student)
Syllable Segmenting Syllable Reading Word Reading Sentence Reading
Kindergarten X X
1 X X X X
2 X X
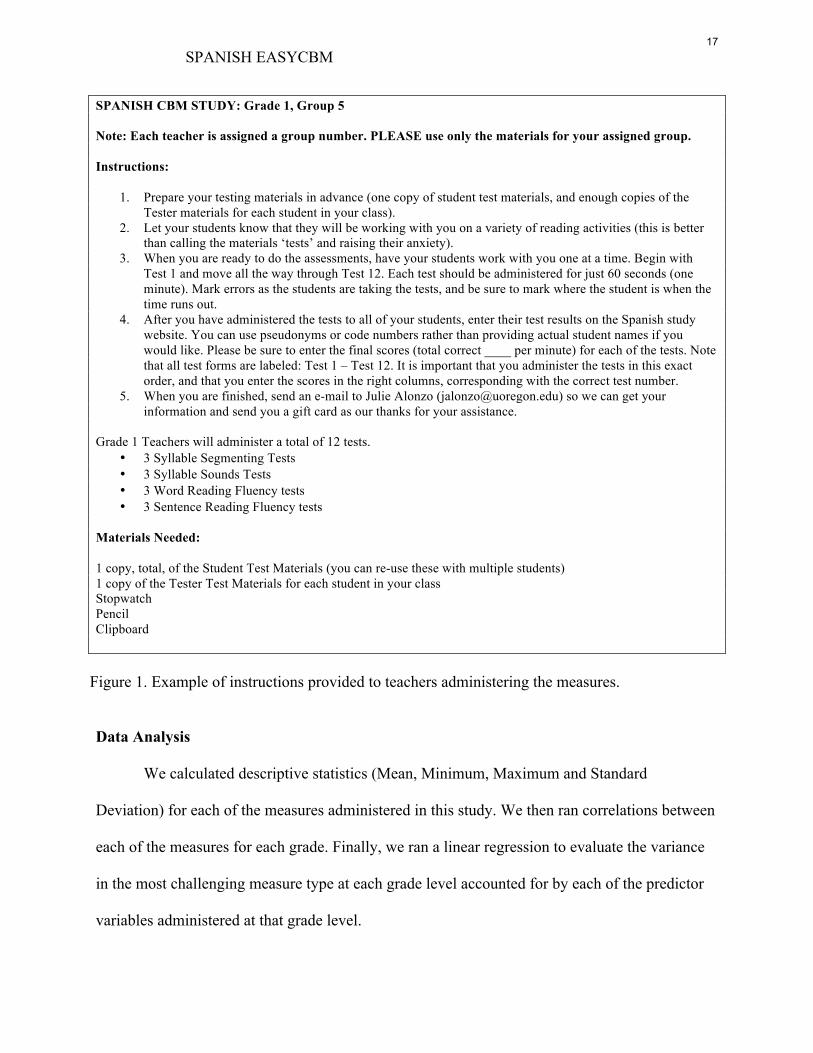
Each participating teacher was sent a packet of material containing testing materials
(standardized administration instructions, student test materials, and test administrator materials)
to use during the study (see Figure 1 for an example of one of the packets of material, for a first
grade classroom). Teachers administered the measures at times they selected, but all tests were
administered sometime during the same three-week testing window in December of 2011. Once
all their students had completed all measures, teachers logged on to a secure website where they
entered student data. No identifying information was collected on individual students or
classrooms. Once all teachers had completed the study, the data were downloaded for analysis.
16
SPANISH EASYCBM Page 20
SPANISH CBM STUDY: Grade 1, Group 5 Note: Each teacher is assigned a group number. PLEASE use only the materials for your assigned group. Instructions:
1. Prepare your testing materials in advance (one copy of student test materials, and enough copies of the Tester materials for each student in your class).
2. Let your students know that they will be working with you on a variety of reading activities (this is better than calling the materials ‘tests’ and raising their anxiety).
3. When you are ready to do the assessments, have your students work with you one at a time. Begin with Test 1 and move all the way through Test 12. Each test should be administered for just 60 seconds (one minute). Mark errors as the students are taking the tests, and be sure to mark where the student is when the time runs out.
4. After you have administered the tests to all of your students, enter their test results on the Spanish study website. You can use pseudonyms or code numbers rather than providing actual student names if you would like. Please be sure to enter the final scores (total correct ____ per minute) for each of the tests. Note that all test forms are labeled: Test 1 – Test 12. It is important that you administer the tests in this exact order, and that you enter the scores in the right columns, corresponding with the correct test number.
5. When you are finished, send an e-mail to Julie Alonzo ([email protected]) so we can get your information and send you a gift card as our thanks for your assistance.
Grade 1 Teachers will administer a total of 12 tests.
• 3 Syllable Segmenting Tests • 3 Syllable Sounds Tests • 3 Word Reading Fluency tests • 3 Sentence Reading Fluency tests
Materials Needed: 1 copy, total, of the Student Test Materials (you can re-use these with multiple students) 1 copy of the Tester Test Materials for each student in your class Stopwatch Pencil Clipboard
Figure 1. Example of instructions provided to teachers administering the measures. Data Analysis
We calculated descriptive statistics (Mean, Minimum, Maximum and Standard
Deviation) for each of the measures administered in this study. We then ran correlations between
each of the measures for each grade. Finally, we ran a linear regression to evaluate the variance
in the most challenging measure type at each grade level accounted for by each of the predictor
variables administered at that grade level.
17
SPANISH EASYCBM Page 21
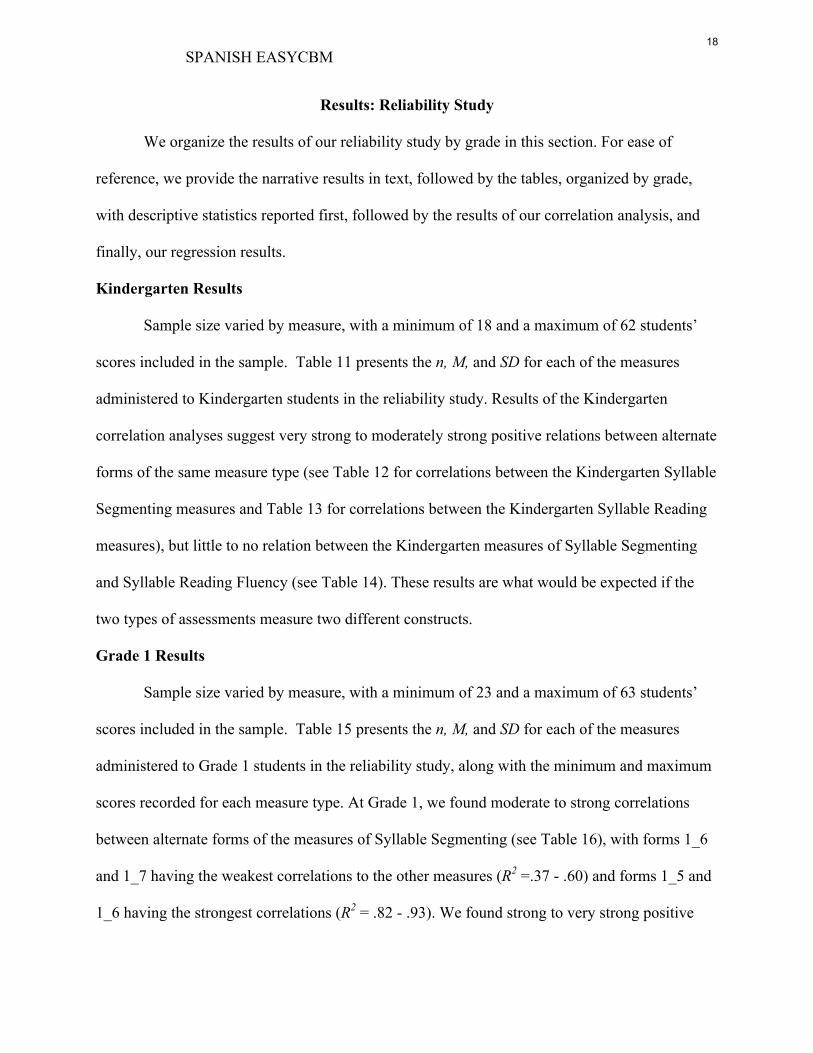
Results: Reliability Study
We organize the results of our reliability study by grade in this section. For ease of
reference, we provide the narrative results in text, followed by the tables, organized by grade,
with descriptive statistics reported first, followed by the results of our correlation analysis, and
finally, our regression results.
Kindergarten Results
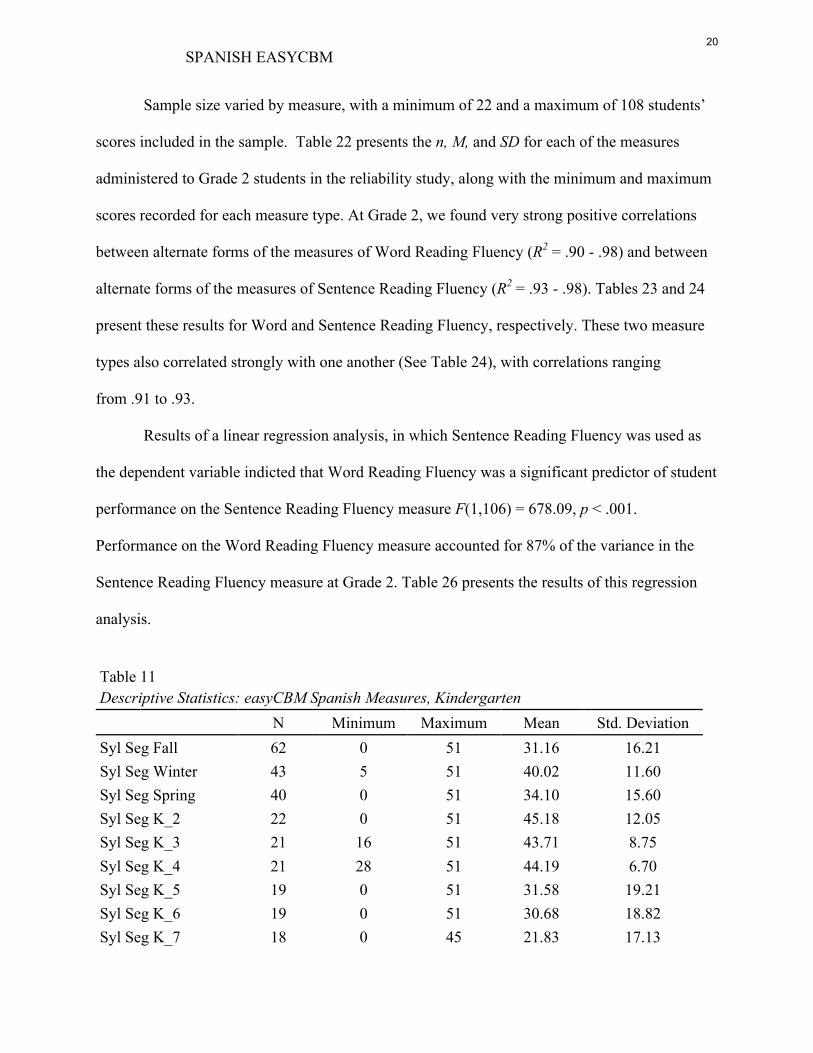
Sample size varied by measure, with a minimum of 18 and a maximum of 62 students’
scores included in the sample. Table 11 presents the n, M, and SD for each of the measures
administered to Kindergarten students in the reliability study. Results of the Kindergarten
correlation analyses suggest very strong to moderately strong positive relations between alternate
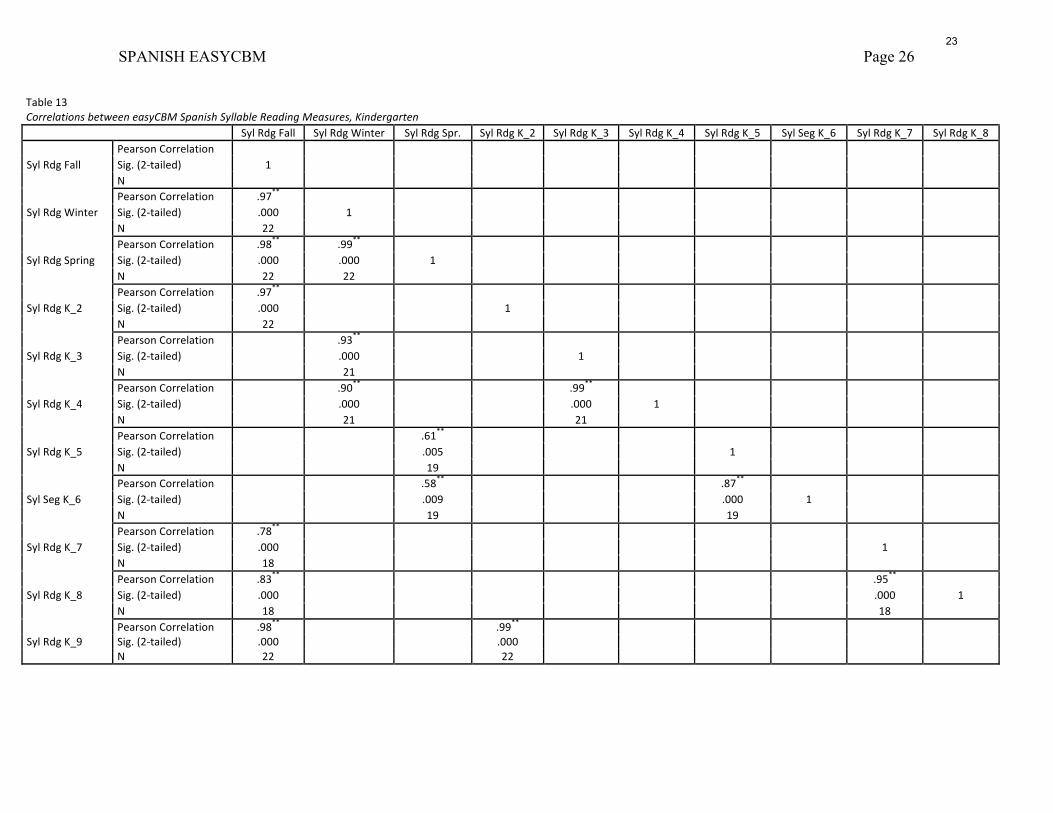
forms of the same measure type (see Table 12 for correlations between the Kindergarten Syllable
Segmenting measures and Table 13 for correlations between the Kindergarten Syllable Reading
measures), but little to no relation between the Kindergarten measures of Syllable Segmenting
and Syllable Reading Fluency (see Table 14). These results are what would be expected if the
two types of assessments measure two different constructs.
Grade 1 Results
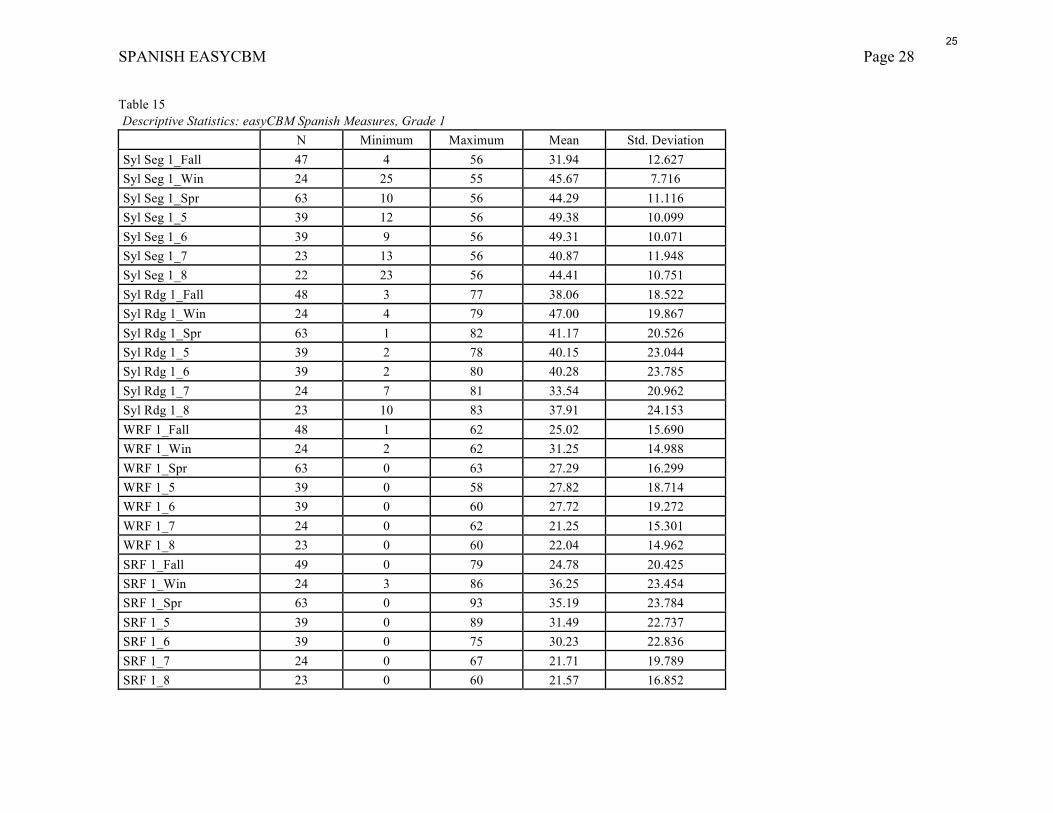
Sample size varied by measure, with a minimum of 23 and a maximum of 63 students’
scores included in the sample. Table 15 presents the n, M, and SD for each of the measures
administered to Grade 1 students in the reliability study, along with the minimum and maximum
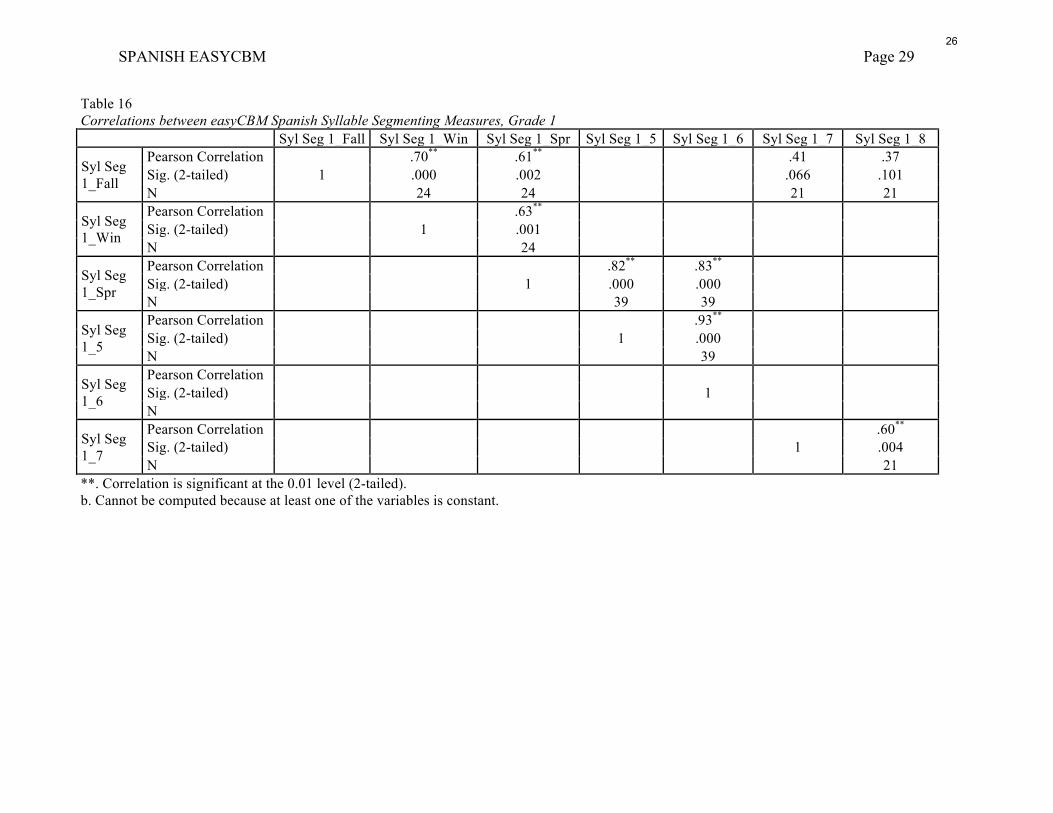
scores recorded for each measure type. At Grade 1, we found moderate to strong correlations
between alternate forms of the measures of Syllable Segmenting (see Table 16), with forms 1_6
and 1_7 having the weakest correlations to the other measures (R2 =.37 - .60) and forms 1_5 and
1_6 having the strongest correlations (R2 = .82 - .93). We found strong to very strong positive
18
SPANISH EASYCBM Page 22
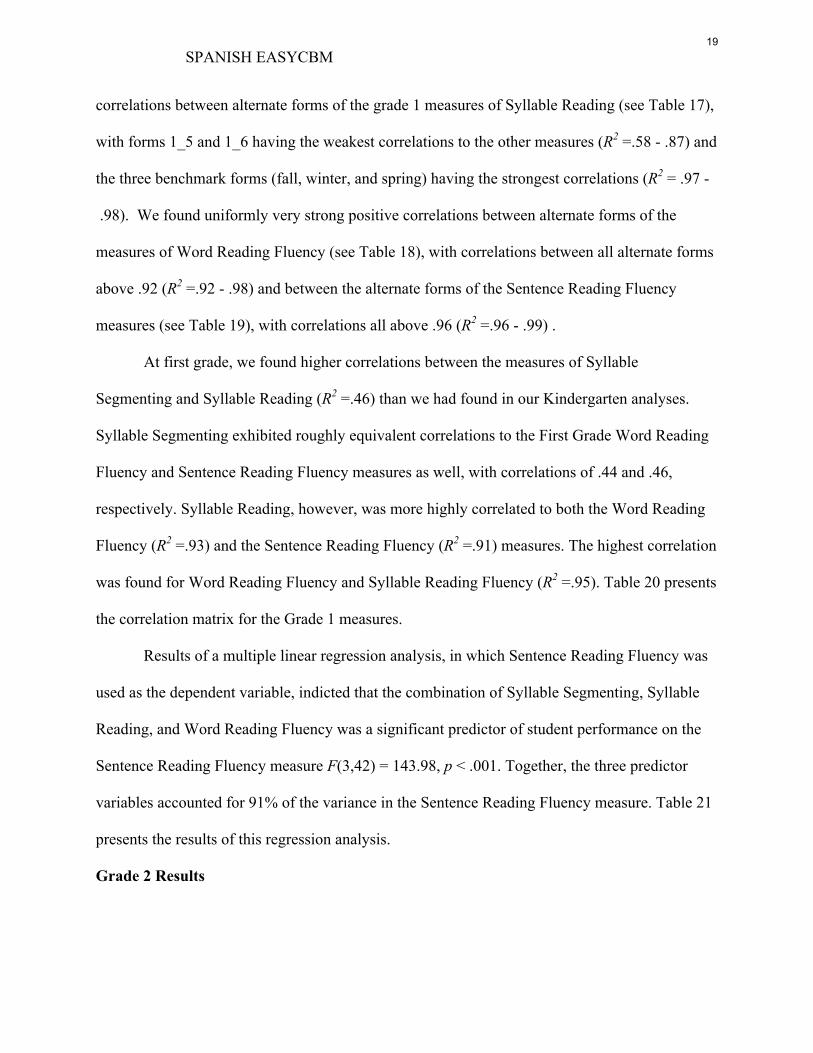
correlations between alternate forms of the grade 1 measures of Syllable Reading (see Table 17),
with forms 1_5 and 1_6 having the weakest correlations to the other measures (R2 =.58 - .87) and
the three benchmark forms (fall, winter, and spring) having the strongest correlations (R2 = .97 -
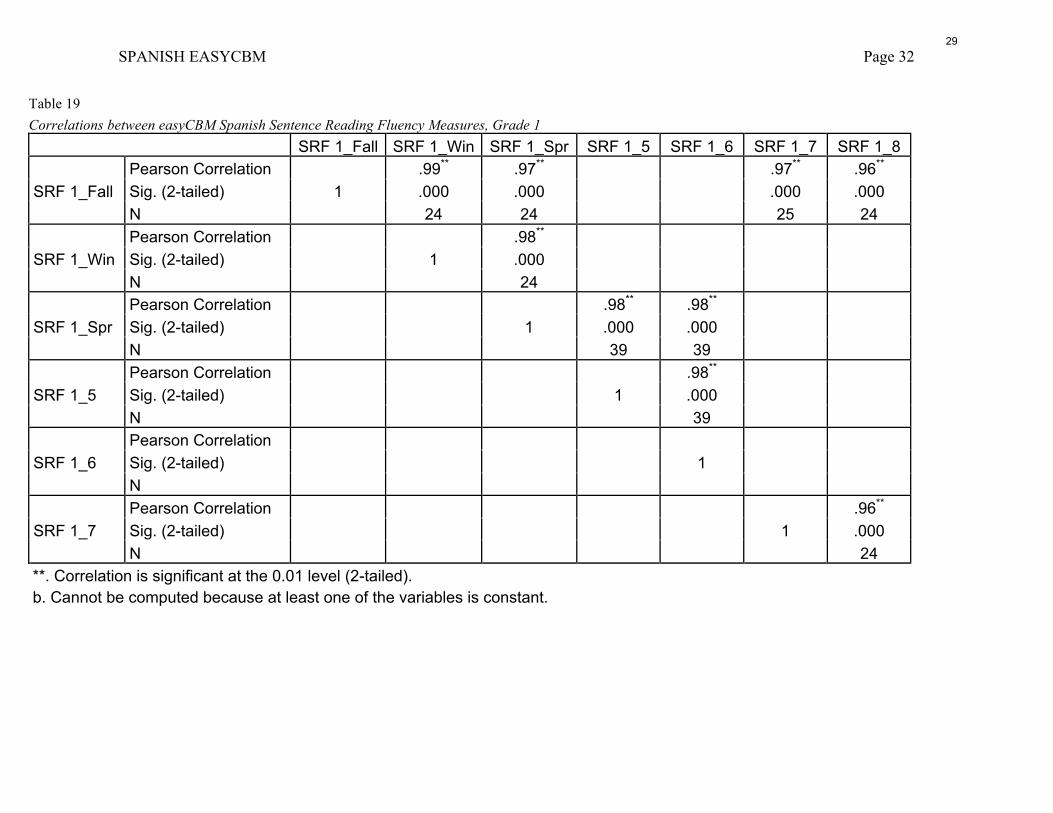
.98). We found uniformly very strong positive correlations between alternate forms of the
measures of Word Reading Fluency (see Table 18), with correlations between all alternate forms
above .92 (R2 =.92 - .98) and between the alternate forms of the Sentence Reading Fluency
measures (see Table 19), with correlations all above .96 (R2 =.96 - .99) .
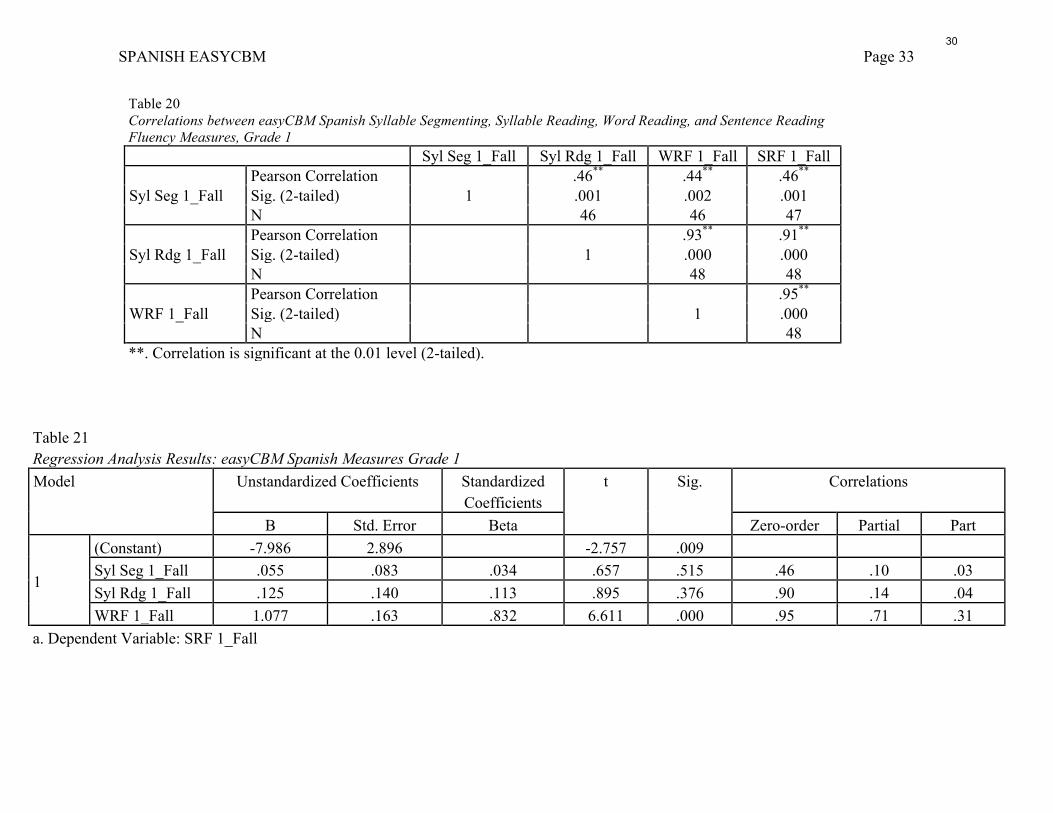
At first grade, we found higher correlations between the measures of Syllable
Segmenting and Syllable Reading (R2 =.46) than we had found in our Kindergarten analyses.
Syllable Segmenting exhibited roughly equivalent correlations to the First Grade Word Reading
Fluency and Sentence Reading Fluency measures as well, with correlations of .44 and .46,
respectively. Syllable Reading, however, was more highly correlated to both the Word Reading
Fluency (R2 =.93) and the Sentence Reading Fluency (R2 =.91) measures. The highest correlation
was found for Word Reading Fluency and Syllable Reading Fluency (R2 =.95). Table 20 presents
the correlation matrix for the Grade 1 measures.
Results of a multiple linear regression analysis, in which Sentence Reading Fluency was
used as the dependent variable, indicted that the combination of Syllable Segmenting, Syllable
Reading, and Word Reading Fluency was a significant predictor of student performance on the
Sentence Reading Fluency measure F(3,42) = 143.98, p < .001. Together, the three predictor
variables accounted for 91% of the variance in the Sentence Reading Fluency measure. Table 21
presents the results of this regression analysis.
Grade 2 Results
19
SPANISH EASYCBM Page 23
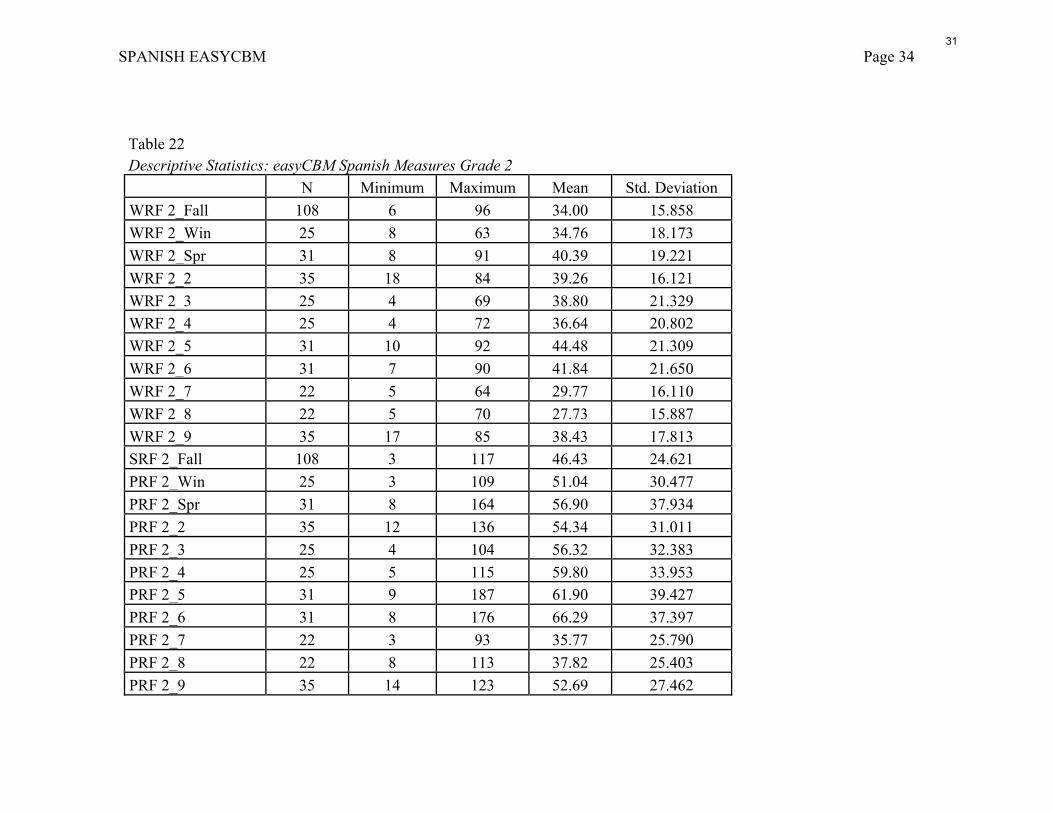
Sample size varied by measure, with a minimum of 22 and a maximum of 108 students’
scores included in the sample. Table 22 presents the n, M, and SD for each of the measures
administered to Grade 2 students in the reliability study, along with the minimum and maximum
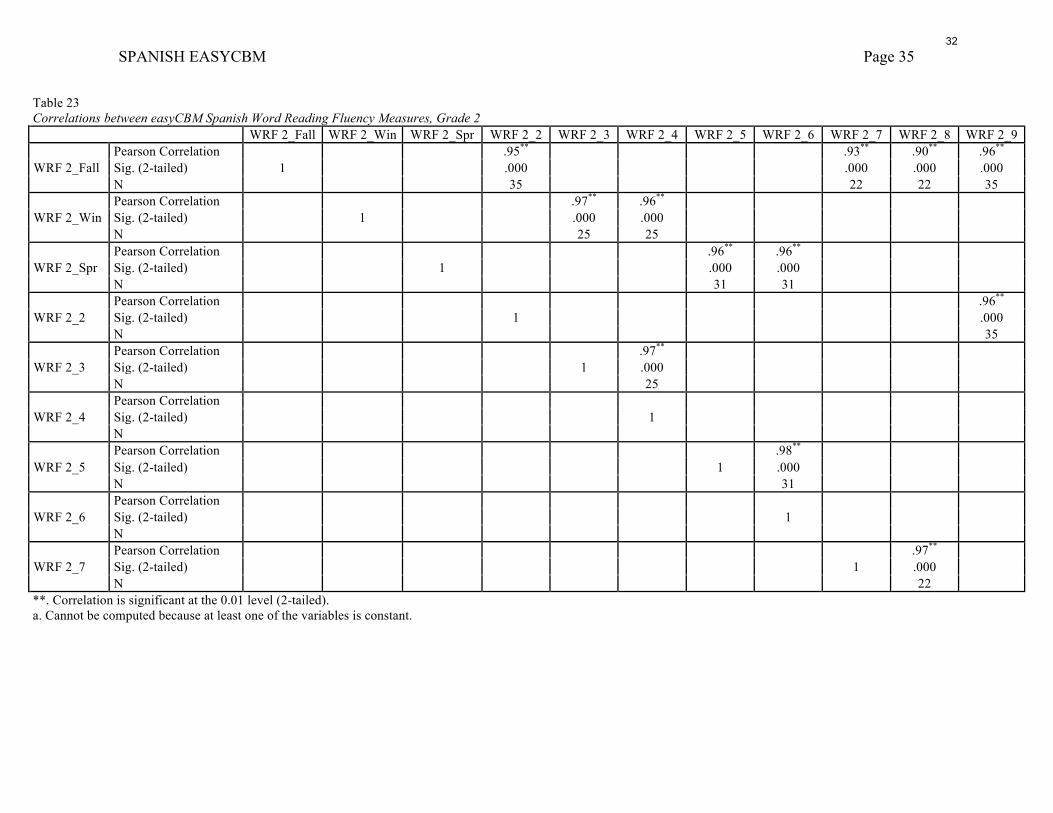
scores recorded for each measure type. At Grade 2, we found very strong positive correlations
between alternate forms of the measures of Word Reading Fluency (R2 = .90 - .98) and between
alternate forms of the measures of Sentence Reading Fluency (R2 = .93 - .98). Tables 23 and 24
present these results for Word and Sentence Reading Fluency, respectively. These two measure
types also correlated strongly with one another (See Table 24), with correlations ranging
from .91 to .93.
Results of a linear regression analysis, in which Sentence Reading Fluency was used as
the dependent variable indicted that Word Reading Fluency was a significant predictor of student
performance on the Sentence Reading Fluency measure F(1,106) = 678.09, p < .001.
Performance on the Word Reading Fluency measure accounted for 87% of the variance in the
Sentence Reading Fluency measure at Grade 2. Table 26 presents the results of this regression
analysis.
Table 11 Descriptive Statistics: easyCBM Spanish Measures, Kindergarten N Minimum Maximum Mean Std. Deviation Syl Seg Fall 62 0 51 31.16 16.21 Syl Seg Winter 43 5 51 40.02 11.60 Syl Seg Spring 40 0 51 34.10 15.60 Syl Seg K_2 22 0 51 45.18 12.05 Syl Seg K_3 21 16 51 43.71 8.75 Syl Seg K_4 21 28 51 44.19 6.70 Syl Seg K_5 19 0 51 31.58 19.21 Syl Seg K_6 19 0 51 30.68 18.82 Syl Seg K_7 18 0 45 21.83 17.13
20

SPANISH EASYCBM Page 24
Syl Seg K_8 18 0 48 19.94 17.89 Syl Seg K_9 22 0 51 42.50 12.39 Syl Rdg Fall 62 0 52 7.05 9.88 Syl Rdg Winter 43 0 66 5.70 11.83 Syl Rdg Spring 41 0 69 6.17 12.51 Syl Rdg K_2 22 0 44 5.82 10.64 Syl Rdg K_3 21 0 30 4.14 7.11 Syl Rdg K_4 21 0 30 4.29 7.48 Syl Rdg K_5 19 0 12 2.37 3.45 Syl Seg K_6 19 0 15 2.32 4.69 Syl Rdg K_7 18 0 29 7.17 7.56 Syl Rdg K_8 18 0 46 8.61 11.56 Syl Rdg K_9 22 0 48 6.05 11.45
21

SPANISH EASYCBM Page 25
Table 12 Correlations between easyCBM Spanish Syllable Segmenting Measures, Kindergarten Syl Seg Fall Syl Seg Winter Syl Seg Spring Syl Seg K_2 Syl Seg K_3 Syl Seg K_4 Syl Seg K_5 Syl Seg K_6 Syl Seg K_7 Syl Seg K_8
Syl Seg Fall Pearson Correlation
1
Sig. (2-‐tailed) N
Syl Seg Winter Pearson Correlation .91**
1
Sig. (2-‐tailed) .000 N 22
Syl Seg Spring Pearson Correlation .84** .92**
1
Sig. (2-‐tailed) .000 .000 N 22 22
Syl Seg K_2 Pearson Correlation .57**
1
Sig. (2-‐tailed) .006 N 22
Syl Seg K_3 Pearson Correlation .70**
1
Sig. (2-‐tailed) .000 N 21
Syl Seg K_4 Pearson Correlation .61** .54*
1
Sig. (2-‐tailed) .003 .011 N 21 21
Syl Seg K_5 Pearson Correlation .83**
1
Sig. (2-‐tailed) .000 N 18
Syl Seg K_6 Pearson Correlation .81** .88**
1
Sig. (2-‐tailed) .000 .000 N 18 19
Syl Seg K_7 Pearson Correlation .74**
1
Sig. (2-‐tailed) .001 N 18
Syl Seg K_8 Pearson Correlation .62** .76**
1 Sig. (2-‐tailed) .006 .000 N 18 18
Syl Seg K_9 Pearson Correlation .80** .90** Sig. (2-‐tailed) .000 .000 N 22 22
22
SPANISH EASYCBM Page 26
Table 13 Correlations between easyCBM Spanish Syllable Reading Measures, Kindergarten Syl Rdg Fall Syl Rdg Winter Syl Rdg Spr. Syl Rdg K_2 Syl Rdg K_3 Syl Rdg K_4 Syl Rdg K_5 Syl Seg K_6 Syl Rdg K_7 Syl Rdg K_8
Syl Rdg Fall Pearson Correlation
1
Sig. (2-‐tailed) N
Syl Rdg Winter Pearson Correlation .97**
1
Sig. (2-‐tailed) .000 N 22
Syl Rdg Spring Pearson Correlation .98** .99**
1
Sig. (2-‐tailed) .000 .000 N 22 22
Syl Rdg K_2 Pearson Correlation .97**
1
Sig. (2-‐tailed) .000 N 22
Syl Rdg K_3 Pearson Correlation .93**
1
Sig. (2-‐tailed) .000 N 21
Syl Rdg K_4 Pearson Correlation .90** .99**
1
Sig. (2-‐tailed) .000 .000 N 21 21
Syl Rdg K_5 Pearson Correlation .61**
1
Sig. (2-‐tailed) .005 N 19
Syl Seg K_6 Pearson Correlation .58** .87**
1
Sig. (2-‐tailed) .009 .000 N 19 19
Syl Rdg K_7 Pearson Correlation .78**
1
Sig. (2-‐tailed) .000 N 18
Syl Rdg K_8 Pearson Correlation .83** .95**
1 Sig. (2-‐tailed) .000 .000 N 18 18
Syl Rdg K_9 Pearson Correlation .98** .99** Sig. (2-‐tailed) .000 .000 N 22 22
23

SPANISH EASYCBM Page 27
Table 14 Correlations between easyCBM Spanish Syllable Segmenting and Syllable Reading Fluency, Kindergarten
Syl Rdg Fall Syl Rdg Winter Syl Rdg Spring Syl Seg Fall Syl Seg Winter Syl Seg Spring
Syl Rdg Fall
Pearson Correlation
1
.97** .98** .24 .05 .11
Sig. (2-tailed) .000 .000 .066 .842 .621
N 22 22 62 22 22
Syl Rdg Winter
Pearson Correlation
1
.99** .16 .07 .11
Sig. (2-tailed) .000 .466 .661 .623
N 22 22 43 22
Syl Rdg Spring
Pearson Correlation
1
.13 .01 .17
Sig. (2-tailed) .558 .976 .295
N 22 22 40
Syl Seg Fall
Pearson Correlation
1
.91** .84**
Sig. (2-tailed) .000 .000
N 22 22
Syl Seg Winter
Pearson Correlation
1
.92**
Sig. (2-tailed) .000
N 22
**. Correlation is significant at the 0.01 level (2-tailed).
24
SPANISH EASYCBM Page 28
Table 15 Descriptive Statistics: easyCBM Spanish Measures, Grade 1 N Minimum Maximum Mean Std. Deviation Syl Seg 1_Fall 47 4 56 31.94 12.627 Syl Seg 1_Win 24 25 55 45.67 7.716 Syl Seg 1_Spr 63 10 56 44.29 11.116 Syl Seg 1_5 39 12 56 49.38 10.099 Syl Seg 1_6 39 9 56 49.31 10.071 Syl Seg 1_7 23 13 56 40.87 11.948 Syl Seg 1_8 22 23 56 44.41 10.751 Syl Rdg 1_Fall 48 3 77 38.06 18.522 Syl Rdg 1_Win 24 4 79 47.00 19.867 Syl Rdg 1_Spr 63 1 82 41.17 20.526 Syl Rdg 1_5 39 2 78 40.15 23.044 Syl Rdg 1_6 39 2 80 40.28 23.785 Syl Rdg 1_7 24 7 81 33.54 20.962 Syl Rdg 1_8 23 10 83 37.91 24.153 WRF 1_Fall 48 1 62 25.02 15.690 WRF 1_Win 24 2 62 31.25 14.988 WRF 1_Spr 63 0 63 27.29 16.299 WRF 1_5 39 0 58 27.82 18.714 WRF 1_6 39 0 60 27.72 19.272 WRF 1_7 24 0 62 21.25 15.301 WRF 1_8 23 0 60 22.04 14.962 SRF 1_Fall 49 0 79 24.78 20.425 SRF 1_Win 24 3 86 36.25 23.454 SRF 1_Spr 63 0 93 35.19 23.784 SRF 1_5 39 0 89 31.49 22.737 SRF 1_6 39 0 75 30.23 22.836 SRF 1_7 24 0 67 21.71 19.789 SRF 1_8 23 0 60 21.57 16.852
25
SPANISH EASYCBM Page 29
Table 16 Correlations between easyCBM Spanish Syllable Segmenting Measures, Grade 1 Syl Seg 1_Fall Syl Seg 1_Win Syl Seg 1_Spr Syl Seg 1_5 Syl Seg 1_6 Syl Seg 1_7 Syl Seg 1_8
Syl Seg 1_Fall
Pearson Correlation 1
.70** .61** .41 .37 Sig. (2-tailed) .000 .002 .066 .101 N 24 24 21 21
Syl Seg 1_Win
Pearson Correlation 1
.63** Sig. (2-tailed) .001 N 24
Syl Seg 1_Spr
Pearson Correlation 1
.82** .83** Sig. (2-tailed) .000 .000 N 39 39
Syl Seg 1_5
Pearson Correlation 1
.93** Sig. (2-tailed) .000 N 39
Syl Seg 1_6
Pearson Correlation 1
Sig. (2-tailed) N
Syl Seg 1_7
Pearson Correlation 1
.60** Sig. (2-tailed) .004 N 21
**. Correlation is significant at the 0.01 level (2-tailed). b. Cannot be computed because at least one of the variables is constant.
26

SPANISH EASYCBM Page 30
Table 17 Correlations between easyCBM Spanish Syllable Reading Measures, Grade 1
Syl Rdg 1_Fall Syl Rdg 1_Win Syl Rdg 1_Spr Syl Rdg 1_5 Syl Rdg 1_6 Syl Rdg 1_7 Syl Rdg 1_8
Syl Rdg 1_Fall Pearson Correlation
1 .95** .93** .87** .80**
Sig. (2-tailed) .000 .000 .000 .000 N 24 24 23 22
Syl Rdg 1_Win Pearson Correlation
1 .97**
Sig. (2-tailed) .000 N 24
Syl Rdg 1_Spr Pearson Correlation
1 .98** .96**
Sig. (2-tailed) .000 .000 N 39 39
Syl Rdg 1_5 Pearson Correlation
1 .97**
Sig. (2-tailed) .000 N 39
Syl Rdg 1_6 Pearson Correlation
1
Sig. (2-tailed) N
Syl Rdg 1_7 Pearson Correlation
1 .90**
Sig. (2-tailed) .000 N 23
**. Correlation is significant at the 0.01 level (2-tailed). b. Cannot be computed because at least one of the variables is constant.
27

SPANISH EASYCBM Page 31
Table 18 Correlations between easyCBM Spanish Word Reading Fluency Measures, Grade 1 WRF 1_Fall WRF 1_Win WRF 1_Spr WRF 1_5 WRF 1_6 WRF 1_7 WRF 1_8
WRF 1_Fall Pearson Correlation
1 .97** .96** .94** .92**
Sig. (2-tailed) .000 .000 .000 .000 N 24 24 23 22
WRF 1_Win Pearson Correlation
1 .96**
Sig. (2-tailed) .000 N 24
WRF 1_Spr Pearson Correlation
1 .97** .96**
Sig. (2-tailed) .000 .000 N 39 39
WRF 1_5 Pearson Correlation
1 .98**
Sig. (2-tailed) .000 N 39
WRF 1_6 Pearson Correlation
1
Sig. (2-tailed) N
WRF 1_7 Pearson Correlation
1 .97**
Sig. (2-tailed) .000 N 23
**. Correlation is significant at the 0.01 level (2-tailed). b. Cannot be computed because at least one of the variables is constant.
28
SPANISH EASYCBM Page 32
Table 19 Correlations between easyCBM Spanish Sentence Reading Fluency Measures, Grade 1 SRF 1_Fall SRF 1_Win SRF 1_Spr SRF 1_5 SRF 1_6 SRF 1_7 SRF 1_8
SRF 1_Fall Pearson Correlation
1 .99** .97** .97** .96**
Sig. (2-tailed) .000 .000 .000 .000 N 24 24 25 24
SRF 1_Win Pearson Correlation
1 .98**
Sig. (2-tailed) .000 N 24
SRF 1_Spr Pearson Correlation
1 .98** .98**
Sig. (2-tailed) .000 .000 N 39 39
SRF 1_5 Pearson Correlation
1 .98**
Sig. (2-tailed) .000 N 39
SRF 1_6 Pearson Correlation
1
Sig. (2-tailed) N
SRF 1_7 Pearson Correlation
1 .96**
Sig. (2-tailed) .000 N 24
**. Correlation is significant at the 0.01 level (2-tailed). b. Cannot be computed because at least one of the variables is constant.
29
SPANISH EASYCBM Page 33
Table 20 Correlations between easyCBM Spanish Syllable Segmenting, Syllable Reading, Word Reading, and Sentence Reading Fluency Measures, Grade 1 Syl Seg 1_Fall Syl Rdg 1_Fall WRF 1_Fall SRF 1_Fall
Syl Seg 1_Fall Pearson Correlation
1 .46** .44** .46**
Sig. (2-tailed) .001 .002 .001 N 46 46 47
Syl Rdg 1_Fall Pearson Correlation
1 .93** .91**
Sig. (2-tailed) .000 .000 N 48 48
WRF 1_Fall Pearson Correlation
1 .95**
Sig. (2-tailed) .000 N 48
**. Correlation is significant at the 0.01 level (2-tailed).
Table 21 Regression Analysis Results: easyCBM Spanish Measures Grade 1 Model Unstandardized Coefficients Standardized
Coefficients t Sig. Correlations
B Std. Error Beta Zero-order Partial Part
1
(Constant) -7.986 2.896 -2.757 .009 Syl Seg 1_Fall .055 .083 .034 .657 .515 .46 .10 .03 Syl Rdg 1_Fall .125 .140 .113 .895 .376 .90 .14 .04 WRF 1_Fall 1.077 .163 .832 6.611 .000 .95 .71 .31
a. Dependent Variable: SRF 1_Fall
30
SPANISH EASYCBM Page 34
Table 22 Descriptive Statistics: easyCBM Spanish Measures Grade 2 N Minimum Maximum Mean Std. Deviation WRF 2_Fall 108 6 96 34.00 15.858 WRF 2_Win 25 8 63 34.76 18.173 WRF 2_Spr 31 8 91 40.39 19.221 WRF 2_2 35 18 84 39.26 16.121 WRF 2_3 25 4 69 38.80 21.329 WRF 2_4 25 4 72 36.64 20.802 WRF 2_5 31 10 92 44.48 21.309 WRF 2_6 31 7 90 41.84 21.650 WRF 2_7 22 5 64 29.77 16.110 WRF 2_8 22 5 70 27.73 15.887 WRF 2_9 35 17 85 38.43 17.813 SRF 2_Fall 108 3 117 46.43 24.621 PRF 2_Win 25 3 109 51.04 30.477 PRF 2_Spr 31 8 164 56.90 37.934 PRF 2_2 35 12 136 54.34 31.011 PRF 2_3 25 4 104 56.32 32.383 PRF 2_4 25 5 115 59.80 33.953 PRF 2_5 31 9 187 61.90 39.427 PRF 2_6 31 8 176 66.29 37.397 PRF 2_7 22 3 93 35.77 25.790 PRF 2_8 22 8 113 37.82 25.403 PRF 2_9 35 14 123 52.69 27.462
31
SPANISH EASYCBM Page 35
Table 23 Correlations between easyCBM Spanish Word Reading Fluency Measures, Grade 2 WRF 2_Fall WRF 2_Win WRF 2_Spr WRF 2_2 WRF 2_3 WRF 2_4 WRF 2_5 WRF 2_6 WRF 2_7 WRF 2_8 WRF 2_9
WRF 2_Fall Pearson Correlation
1 .95** .93** .90** .96**
Sig. (2-tailed) .000 .000 .000 .000 N 35 22 22 35
WRF 2_Win Pearson Correlation
1 .97** .96**
Sig. (2-tailed) .000 .000 N 25 25
WRF 2_Spr Pearson Correlation
1 .96** .96**
Sig. (2-tailed) .000 .000 N 31 31
WRF 2_2 Pearson Correlation
1 .96**
Sig. (2-tailed) .000 N 35
WRF 2_3 Pearson Correlation
1 .97**
Sig. (2-tailed) .000 N 25
WRF 2_4 Pearson Correlation
1
Sig. (2-tailed) N
WRF 2_5 Pearson Correlation
1 .98**
Sig. (2-tailed) .000 N 31
WRF 2_6 Pearson Correlation
1
Sig. (2-tailed) N
WRF 2_7 Pearson Correlation
1 .97**
Sig. (2-tailed) .000 N 22
**. Correlation is significant at the 0.01 level (2-tailed). a. Cannot be computed because at least one of the variables is constant.
32

SPANISH EASYCBM Page 36
Table 24 Correlations between easyCBM Spanish Sentence Reading Fluency Measures, Grade 2 SRF 2_Fall SRF 2_Win SRF 2_Spr SRF 2_2 SRF 2_3 SRF 2_4 SRF 2_5 SRF 2_6 SRF 2_7 SRF 2_8 SRF 2_9
SRF 2_Fall Pearson Correlation
1 .97** .96** .93** .98**
Sig. (2-‐tailed) .000 .000 .000 .000 N 35 22 22 35
SRF 2_Win Pearson Correlation
1 .97** .98**
Sig. (2-‐tailed) .000 .000 N 25 25
SRF 2_Spr Pearson Correlation
1 .97** .95**
Sig. (2-‐tailed) .000 .000 N 31 31
SRF 2_2 Pearson Correlation
1 .97**
Sig. (2-‐tailed) .000 N 35
SRF 2_3 Pearson Correlation
1 .98**
Sig. (2-‐tailed) .000 N 25
SRF 2_4 Pearson Correlation
1
Sig. (2-‐tailed) N
SRF 2_5 Pearson Correlation
1 .98**
Sig. (2-‐tailed) .000 N 31
SRF 2_6 Pearson Correlation
1
Sig. (2-‐tailed) N
SRF 2_7 Pearson Correlation
1 .93**
Sig. (2-‐tailed) .000 N 22
**. Correlation is significant at the 0.01 level (2-‐tailed). a. Cannot be computed because at least one of the variables is constant.
33

SPANISH EASYCBM Page 37
Table 25 Correlations between easyCBM Spanish Word Reading Fluency & Sentence Reading Fluency Measures, Gr 2
SRF 2_Fall SRF 2_Win SRF 2_Spr
WRF 2_Fall Pearson Correlation .93** Sig. (2-tailed) .000 N 108
WRF 2_Win Pearson Correlation .91** Sig. (2-tailed) .000 N 25
WRF 2_Spr Pearson Correlation .93** Sig. (2-tailed) .000 N 31
Table 26 Regression Analysis: easyCBM Spanish Measures, Grade 2 Model Unstandardized Coefficients Standardized
Coefficients t Sig.
B Std. Error Beta
1 (Constant) -2.664 2.078 -1.282 .203 WRF 2_Fall 1.444 .055 .930 26.040 .000
a. Dependent Variable: SRF 2_Fall
34
SPANISH EASYCBM Page 38
Discussion
In developing assessments for students receiving literacy instruction in Spanish, we must
consider the unique properties of the Spanish language. Early literacy assessments developed for
use with students receiving instruction in English may not be valid for use with students
receiving instruction in Spanish (Alvarez, Carreiras, & Perea, 2004). As schools become more
focused on using assessment data to guide their instructional decision-making, selecting
appropriate measures is paramount. Our findings may help provide insight into this important
area of research.
The findings of this study consistently suggest that the Syllable Sounds test might be a
good initial measure to use to track the progress of first grade students receiving literacy
instruction in Spanish. In our initial study, we found that first and second grade students’
performance on the Syllable Sounds Assessment correlated with their performance on the Word
Reading Assessment. This result was found for students receiving literacy instruction in Spanish
whether they spoke English as a first language or Spanish as a first language. Furthermore, the
Syllable Reading Assessment was found to be a strong predictor of performance on the Word
and Sentence Reading Assessments for both grade levels and native language groupings. These
findings suggest that the Syllable Reading Assessment may be the most useful measure for
assessing early reading skills in students receiving literacy instruction in Spanish.
The Syllable Segmenting Assessment was also found to be an indicator of reading ability
for some groups of students. For second grade students in our initial study who spoke Spanish as
a native language, the Syllable Segmenting Assessment was correlated with scores on the Word
Reading Assessment. Similarly, for second grade students who spoke English as a first language,
35
SPANISH EASYCBM Page 39
a combination of the Syllable Reading and Syllable Segmenting Assessments was the best
predictor of performance on the Sentence Reading Assessment. These findings suggest that the
Syllable Segmenting Assessment may be useful as an early reading measure for second grade
students. The usefulness of this measure should be researched further.
The fact that these syllable-level measures were the most consistent predictors of
performance on the reading measures used in this study suggests that syllable knowledge may be
an important pre-reading skill for students learning to read in Spanish. These findings support
teachers’ statements that the syllable is the basis of Spanish literacy instruction. Several teachers
surveyed by Gonzalez, Alonzo and Tindal (2007) reported that Spanish literacy instruction
emphasizes the syllable, rather than the phoneme and that Spanish literacy assessment should
parallel instruction. The data from this study support the idea that syllable-level measures are
more representative of the instructional methods that are used in Spanish literacy programs.
In general, measures assessing smaller units of language, specifically the Letter Sounds
Assessment and the Phoneme Segmenting Assessment, did not correlate as strongly with
measures of reading fluency as the corresponding syllable-level measures. However, the study
yielded some evidence that these assessments predict reading skills for students receiving
literacy instruction in Spanish. For first-grade students for whom English was a first language, a
correlation was found between the Letter Sounds Assessment and the Word Reading Assessment.
Additionally, a correlation was found between the Phoneme Segmenting Assessment and the
Sentence Reading Assessment. Because these students were native English speakers, these
correlations may be related to these students’ exposure to English in the home. Students’
performance on these assessments may have been influenced by their exposure to English letter
sounds when learning to speak English.
36
SPANISH EASYCBM Page 40
However, some findings suggest that an understanding of phonemes is related to reading
fluency in students for whom Spanish is the first language. For second-grade students for whom
Spanish is the first language, performance on the Letter Sounds Assessment correlated with
performance on the Sentence Reading Assessment. Additionally, we found that when predicting
sentence reading fluency in second grade students for whom Spanish is the first language, a
combination of the Syllable Sounds and the Phoneme Segmenting Assessments is a more useful
predictor of reading fluency than the Syllable Sounds Assessment alone. Thus, for older students
who speak Spanish as a first language, awareness of letter sounds and phonemes may have some
relation to literacy development. These data support initial findings that phonological awareness
may be an important early literacy skill in Spanish (Durgunoglu, Nagy & Hancin-Bhatt, 1993;
Laefstadt & Gerber, 2005). However, further research is needed to determine whether this
relationship between smaller units of language and reading fluency appears consistently.
Although some of the findings suggest that the Letter Sounds and Phoneme Segmenting
Assessments predict reading fluency in students receiving literacy instruction in Spanish, the
evidence for the usefulness of these assessments is not as strong as for the syllable level
assessments. Particularly, the Syllable Reading Assessment consistently shows up as the
strongest predictor of reading fluency for both age and language groups. Thus, the results of
these studies suggest that knowledge of the syllable may be the most important factor in
predicting Spanish literacy development.
Limitations
As with all research, our study has limitations that may limit the generalizability of our
findings. First, the number of participants in both Study 1 and Study 2 was fairly small. In
addition, participants were not randomly selected for participation in the study. Instead, we
37
SPANISH EASYCBM Page 41
worked with convenience samples from two schools within the same state. At each school, we
worked with only four teachers: two from first grade; two from second grade. Thus, it is possible
that our results are confounded by the similarity of the instructional program students received
within each school. Thus, it is possible that characteristics of our sample would not generalize to
the larger population of students receiving literacy instruction in Spanish.
In addition, our findings might be an artifact of the measurement instruments we used to
assess students’ knowledge of Letter Sounds, Syllable Sounds, Phoneme Segmenting, Syllable
Segmenting, and oral reading. We did not include any externally-developed assessments in our
study, and this is a limitation that should be considered when weighing our findings. Finally,
because we were interested in the relationship between early literacy skills and reading in
Spanish, we limited our sample to first and second-grade students. It is possible we would have
obtained different results had we included students in kindergarten or in upper grades.
Conclusion
Our findings differ from studies of English literacy acquisition, in which phonological
awareness is typically found to be a critical component of literacy development (Hogan, Catts &
Little, 2005; Share, Jorm & McClean, as cited in Ehri, 2001; Stahl & Murray, 1994). This study
provides evidence that literacy assessment in Spanish cannot be approached identically to
literacy assessment in English. The development of useful and appropriate literacy assessments
for Spanish literacy programs requires research on the specific linguistic properties of the
language and how these characteristics influence literacy instruction. Future research should
focus on broadening our understanding of Spanish literacy development so that assessments can
be developed that are representative of the Spanish literacy acquisition process and thus, allow
students to accurately demonstrate their reading skills.
38
SPANISH EASYCBM Page 42
Given the emphasis on using data to guide instructional decision-making in schools today,
it is important that assessment developers take the unique characteristics of the languages
students are learning into consideration as they build assessments. We used the results of our
initial studies to inform the development of alternate forms of two measure types at the
Kindergarten level (Syllable Segmenting and Syllable Reading ), four measure types at the first-
grade level (Syllable Segmenting , Syllable Reading , Word Reading , and Sentence Reading )
and two measures at the second-grade level (Word Reading and Sentence Reading ). Our follow-
up study provided evidence of the reliability of alternate forms of these measures, as well as
additional evidence of the relation between the different measures.
Specifically, the results of our reliability study confirmed that Syllable Segmenting,
Syllable Reading, and Word Reading Fluency are all significant predictors of Sentence Reading
Fluency, with Word Reading Fluency accounting for the largest amount of unique variance in the
regression equation. This finding lends support to the use of the Syllable Segmenting and
Syllable Reading measures for students in Kindergarten and the inclusion of all four measure
types at Grade 1, where student literacy in Spanish might be expected to vary tremendously,
depending on experience with Spanish literacy in the prior year of schooling as well as in the
home environment. By the time students reach Grade 2, particularly given the transparency and
regularity of the Spanish language, the measures of Word and Sentence Reading fluency appear
to be most appropriate.
39

SPANISH EASYCBM Page 43
References
Alvarez, C. J., Carreiras, M. & Perea, M. (2004). Are syllables phonological units in visual word
recognition? Language and Cognitive Processes, 19, 427-452.
Carreiras, M. & Perea, M. (2004). Naming pseudowords in Spanish: Effects of syllable
frequency. Brain and Language, 90, 393-400.
Crawford, J. (1998). Ten common fallacies about bilingual education. U.S., District of Columbia.
Defior, S., Cary, L., Martos, F. (2002). Differences in reading acquisition in two shallow
orthographies: Portuguese and Spanish. Applied Psycholinguistics, 23, 135-148.
Durgunoglu, A. Y., Nagy, W. E., & Hancin-Bhatt, B. J. (1993). Cross-language transfer of
phonological awareness. Journal of Educational Psychology, 85, 453-65.
Ehri, L. C. (2001). Systematic phonics instruction helps students learn to read: Evidence from the
National Reading Panel’s meta-analysis. Reading Research Quarterly, 36, 250-287.
Gonzalez, M., Alonzo, J., & Tindal, G. (2007). The development of Spanish literacy assessments.
(Technical Report # 48), Behavioral Research and Teaching, Eugene, OR.
Hogan, T. P., Catts, H. W., & Little, T. D. (2005). The relationship between phonological
awareness and reading: Implications for the assessment of phonological awareness.
Language, Speech, and hearing Services in Schools, 36, 285-293.
Jimenez Gonzalez, J. E. & Garcia, C. R. H. (1995). Effects of word linguistic properties on
phonological awareness in Spanish children. Journal of Educational Psychology, 87, 193-
201.
Laefstadt, J. M. & Gerber, M. M. (2005). Crossover of phonological processing skills: A study of
Spanish-speaking students in two instructional settings. Remedial and Special Education, 26,
226-235.
40
SPANISH EASYCBM Page 44
National Center for Education Statistics. (2002.) Public School Questionnaire, 1999-2000.
Washington D.C.: U.S. Department of Education. Retrieved November 3, 2006 from
http://www.nces.ed.gov/pubs2001/2001022.pdf
Stahl, S. A. & Murray, B. A. (1994). Defining phonological awareness and its relationship to
early reading. Journal of Educational Psychology, 86, 221-234.
Wagner, R. K., Torgesen, J. K., Rashotte, C. A., Hecht, S. A., Barker, T. A., Burgess, S. R.,
Donahue, J. & Garon, T. (1997). Changing relations between phonological processing
abilities and word-level reading as children develop from beginning to skilled readers: A 5-
year longitudinal study. Developmental Psychology, 33, 468-479.
Woolfolk, A. (2004). Culture and community. In P. A. Smith (Ed.), Educational Psychology
(153-193). Boston: Pearson A and B.
41