the development of high power, pulsed fiber laser … · the development of high power, pulsed...
TRANSCRIPT

UNIVERSITY OF SOUTHAMPTON
THE DEVELOPMENT OF HIGH POWER, PULSED FIBER LASER
SYSTEMS AND THEIR APPLICATIONS
by Jonathan Hugh Vaughan Price
A thesis submitted for the degree of
DOCTOR OF PHILOSOPHY
OPTOELECTRONICS RESEARCH CENTRE
FACULTY OF ENGINEERING AND APPLIED SCIENCE
DEPARTMENT OF ELECTRONICS AND COMPUTER SCIENCE
JULY 2003
University of Southampton ABSTRACT
FACULTY OF ENGINEERING AND APPLIED SCIENCE OPTOELECTRONICS RESEARCH CENTRE
Doctor of Philosophy
THE DEVELOPMENT OF HIGH POWER, PULSED FIBER LASER SYSTEMS AND THEIR APPLICATIONS
by Jonathan Hugh Vaughan Price
Rare-earth doped silica fibers have been used for many years to create continuous-wave lasers, and Er-doped fiber amplifiers are now widely used in telecommunications. In addition, cladding pumped fiber allows the efficient conversion of multimode radiation from high power, low cost, broad-stripe semiconductor laser diodes into the single-mode emission of fiber lasers. With its broad gain bandwidth and high optical conversion efficiency, Yb-doped silica fiber represents an attractive medium for the generation and amplification of high energy ultrashort optical pulses. However, these potential advantages of Yb-doped silica fiber as a gain and nonlinear medium for mode-locked lasers and ultrashort pulse amplifiers have been less well studied, and it was not until 1999 that significant research interest first appeared in Yb-fiber chirp pulse amplifier (CPA) systems. This thesis describes the development of the first practical and stable, femtosecond, Yb-fiber oscillator, and of an Yb-fiber amplifier based CPA system (pulses ~10 µJ, <500 fs). Novel aspects of the system include the use of a high extinction ratio Electro-Optic modulator for pulse selection, and the development of a compact chirped-fiber-Bragg-grating (CFBG) pulse stretcher that provides both 2nd and 3rd order chirp compensation. Recently published theoretical results have demonstrated that the asymptotic solution for ultrashort pulses in a high gain fiber amplifier is a linearly chirped pulse, which can therefore be recompressed with a standard grating compressor. This thesis reports the first experimental comparison of nonlinear pulse evolution towards the asymptotic form using a cascaded amplifier system. The ‘direct amplification’ system was constructed by removing the CPA stretcher grating, which also enabled the use of a less dispersive and more compact compressor. Further system development should lead to the generation of ultrashort pulses at high average power levels and >100 kHz repetition rates. Holey fiber (HF) is a recently developed technology that uses rings of air holes around a solid core to confine the optical field by average-index effects. Fibers are highly suitable for applications using nonlinear optics because of the tightly confined mode and long interaction lengths. The increased mode confinement possible using HF means that small-core, high air-fill fraction HF are an attractive nonlinear medium. Furthermore, the high index contrast in such fibers can create a strong (anomalous) waveguide contribution to the dispersion, and such HFs can have anomalous dispersion at wavelengths <1.3 µm, where conventional fiber has normal dispersion. Therefore HFs can support solitons in new wavelength bands. This thesis reports the first demonstration of linear dispersion compensation, soliton transmission, and visible continuum generation seeded by a 1.06 µm Yb-fiber source. In addition, an experimental study is reported that used HF seeded from a Ti:Sapphire laser to generate continuum in distinct transverse spatial modes of a HF. Numerical simulations suggested that the observed enhancement in UV generation from a higher order mode could be due to differences in the dispersion profiles of the fundamental and higher order transverse modes. Finally, the development of a novel source of <200 fs pulses, continuously tuneable in wavelength from 1.06-1.33 µm, based on the soliton self-frequency-shift principle, is described. The source was constructed from a diode-pumped Yb-doped HF amplifier, and the Yb-fiber oscillator described above. The diode pump power controlled the output wavelength.

Acknowledgements I would like to thank my supervisor, Professor David Richardson for his constant guidance, encouragement and patience. There are many other people who have helped with and encouraged my studies; they are too numerous to list, but I am grateful to them all. In addition, I would like to thank those who have directly helped with the work presented in this thesis. I acknowledge the contribution of all my co-workers for the laser and amplifier development. In particular, I thank Dr Laurent Lefort, Dr Johan Nilsson, Dr Andrew Malinowski and Andy Piper. I am grateful for the contribution of Dr Morten Ibsen in fabricating the chirped fiber Bragg gratings. I thank Dr Chris Barty, who shared his experience designing CPA compressors. I thank Dr Neil Broderick and Anna Peacock for numerical modelling of parabolic pulses, and for useful explanations about both parabolic pulses and solitons. Thanks are also due to Walter Belardi, and Dr Tanya Monro, who designed and fabricated the passive holey fiber used for the work in this thesis, and to Kentaro Furusawa, who fabricated the Yb-doped holey fiber and who helped with many of the holey fiber experiments. I thank Joanne Baggett for her assistance with recording the images from supercontinuum generation in subsidiary cores of a holey fiber. I thank Dr Andy Clarkson for his helpful comments, and I thank Professor David Hanna for encouraging the work using Yb-doped holey fiber as a wavelength tuneable source. I am also grateful to Dr Rüdiger Paschotta of ETH Zurich for enabling me to use his numerical modelling program ‘ProPulse’. I thank Professor Jeremy Baumberg for making available his group’s femtosecond Ti:Sapphire laser laboratory for the UV supercontinuum experiments presented in this thesis. I also thank Caterina Netti, Steve Coyle and the other members of Professor Baumberg’s group for their help in enabling me to work effectively with the laser system. I thank the other members of Professor Richardson’s group with whom I have had the pleasure of discussing ideas, borrowing equipment and who generally helped things along: Periklis Petropoulos, Peh-Chong Teh, JuHan Lee, Ron Haaksman, Hermann Offerhaus, Anoma McCoy, Ami Ljungström, Benn Thomsen, Zul Yusoff. I also thank those with whom I have shared an office in Room 4107. I thank Simon Butler for machining several mounts for my experiments and for general advice about making the mechanical aspects of our experiments work, and I thank Chris Nash for his help with preparing figures for presentations. I thank David Oliver, and Arthur Longhurst for their cheerful help with computer troubles. I thank Professor Rob Eason, Eve Smith and Joyce Aburrow for being so energetic in their support of the ORC PhD students. I acknowledge the support of an EPSRC studentship, and project funding from a commercial sponsor. I would like to thank my family for their support throughout my studies.
ii

iii
List of Contents Abstract............................................................................................................................. i
Acknowledgements .........................................................................................................ii
List of abbreviations ......................................................................................................vi
Chapter 1 Introduction..................................................................................... 1 References.................................................................................................. 8
Chapter 2 Nonlinear fiber optics ................................................................... 10 2.1 Introduction.............................................................................................. 10 2.2 Nonlinear effects in optical fibers ............................................................ 10
2.2.1 Pulse propagation in optical fiber ................................................ 11 2.2.2 Linear propagation and dispersion............................................... 13 2.2.3 Nonlinear polarisation effects...................................................... 16 2.2.4 Coupling between different pulses .............................................. 17 2.2.5 Stimulated Raman Scattering....................................................... 20 2.2.6 Numerical solution of the nonlinear Schrödinger equation ......... 24
2.3 Ytterbium doped silica fiber .................................................................... 25 2.3.1 Ytterbium fiber spectroscopy....................................................... 25 2.3.2 Overview of numerical model ..................................................... 27 2.3.3 Calculating the inversion in a short fiber section......................... 29 2.3.4 Calculating the optimum amplifier length ................................... 30
2.4 Holey fiber technology............................................................................. 32 2.4.1 Fabrication of holey fibers........................................................... 34 2.4.2 Dispersion properties of holey fiber ............................................ 35 2.4.3 Nonlinearity of holey fiber .......................................................... 36 References................................................................................................ 37
Chapter 3 Yb fiber based pulse sources........................................................ 39 3.1 Introduction.............................................................................................. 39 3.2 Summary of related research.................................................................... 39
3.2.1 High energy CPA systems ........................................................... 40 3.2.2 High average power systems ....................................................... 43
3.3 Remaining technological challenges........................................................ 44 3.4 Overview of CPA and direct amplification system.................................. 46
3.4.1 Background.................................................................................. 46 3.4.2 Detailed system configuration ..................................................... 47 References................................................................................................ 50
Chapter 4 Mode locked fiber laser ................................................................ 52 4.1 Introduction.............................................................................................. 52 4.2 Mode-locked fiber laser operating principles........................................... 53 4.3 Description of the cavity .......................................................................... 54 4.4 Characteristics of the Yb doped fiber....................................................... 56 4.5 Characteristics of the WDM and birefringence of cavity fiber ................ 57 4.6 Characteristics of the SESAM ................................................................. 58 4.7 Laser performance.................................................................................... 59 4.8 Conclusion ............................................................................................... 63
References................................................................................................ 65 Chapter 5 CPA Stretcher and compressor ................................................... 67
5.1 Introduction.............................................................................................. 67 5.2 Effect of uncompensated third order dispersion ...................................... 68 5.3 Bulk grating compressor .......................................................................... 69
iv
5.3.1 Overall layout .............................................................................. 70 5.3.2 Details of design and performance .............................................. 71
5.4 CFBG stretcher ........................................................................................ 74 5.4.1 Performance of first generation CFBG........................................ 75 5.4.2 Performance of second generation CFBG ................................... 77 5.4.3 Further considerations ................................................................. 79
5.5 Conclusion ............................................................................................... 80 References................................................................................................ 82
Chapter 6 Fiber Amplifier Cascade .............................................................. 83 6.1 Introduction.............................................................................................. 83 6.2 Pulse selection and amplifier gating ........................................................ 85 6.3 Core pumped pre-amplifiers .................................................................... 85
6.3.1 Initial performance....................................................................... 85 6.3.2 Increased gain using mid-amplifier pump injection .................... 86 6.3.3 Increased gain using small core fiber .......................................... 88
6.4 Cladding pumped amplifiers .................................................................... 88 6.5 GTWave pre-amplifier ............................................................................. 89 6.6 Power amplifier........................................................................................ 90
6.6.1 Fiber nonlinearity constraints ...................................................... 90 6.6.2 Energy storage constraints ........................................................... 91 6.6.3 Fiber design ................................................................................. 91 6.6.4 Experimental setup and results .................................................... 93 References................................................................................................ 94
Chapter 7 Overall CPA System Performance.............................................. 95 7.1 Introduction.............................................................................................. 95 7.2 Configuration of pre-amplifiers ............................................................... 95 7.3 Configuration of pulse-stretcher .............................................................. 96 7.4 Experimental results................................................................................. 97 7.5 Extending the system capabilities ............................................................ 99 7.6 Conclusion ............................................................................................. 101
References.............................................................................................. 103 Chapter 8 Direct Pulse Amplification ......................................................... 104
8.1 Introduction............................................................................................ 104 8.2 Experimental setup................................................................................. 106 8.3 Numerical model.................................................................................... 108 8.4 Results and discussion ........................................................................... 110
8.4.1 Spectral data after each section of the system ........................... 111 8.4.2 Phase characteristics after final amplifier .................................. 112 8.4.3 SHG autocorrelation measurements of compressed pulses ....... 114 8.4.4 Comparison to asymptotic analytic solution.............................. 115
8.5 Conclusion ............................................................................................. 118 References.............................................................................................. 120
Chapter 9 Solitons in passive holey fiber .................................................... 121 9.1 Introduction............................................................................................ 121 9.2 Characteristics of the holey fiber ........................................................... 122 9.3 Linear dispersion compensation and soliton formation ......................... 123 9.4 Soliton transmission and supercontinuum generation............................ 125 9.5 Conclusion ............................................................................................. 126
References.............................................................................................. 127 Chapter 10 UV generation in a silica holey fiber ......................................... 128
10.1 Introduction............................................................................................ 128 10.2 Experimental observation of UV supercontinuum................................. 130

v
10.2.1 Characteristics of the holey fiber ............................................. 130 10.2.2 Supercontinuum generation into the UV ................................. 133 10.2.3 Enhanced UV in higher order spatial modes ........................... 134 10.2.4 Laser-induced damage to the fiber tip ..................................... 136
10.3 Comparison of experimental results with simulations ........................... 137 10.4 Supercontinuum generation in subsidiary cores .................................... 139 10.5 Conclusion ............................................................................................. 141
References.............................................................................................. 143 Chapter 11 Solitons in a holey fiber amplifier ............................................. 145
11.1 Introduction............................................................................................ 145 11.2 System operating principles and implementation .................................. 146
11.2.1 Operating principles................................................................. 147 11.2.2 System implementation ........................................................... 149 11.2.3 Characteristics of the Yb -doped holey fiber ........................... 150
11.3 Results and discussion ........................................................................... 151 11.3.1 Single colour, wavelength tuneable solitons............................ 152 11.3.2 Multi-colour solitons and continuous spectra .......................... 154 11.3.3 Temporal compression............................................................. 155
11.4 Conclusion ............................................................................................. 156 References.............................................................................................. 158
Chapter 12 Conclusions.................................................................................. 159 12.1 Introduction............................................................................................ 159 12.2 High power Yb-fiber systems ................................................................ 159
12.2.1 Yb-fiber oscillator.................................................................... 159 12.2.2 CPA System............................................................................. 160 12.2.3 Direct amplification system..................................................... 161
12.3 Nonlinear effects in holey fiber.............................................................. 162 12.3.1 Holey fiber based supercontinuum generation ........................ 162 12.3.2 Wavelength tuneable holey fiber amplifier source .................. 163 References.............................................................................................. 164
Appendix I Measuring noise characteristics of CW mode-locked lasers... 166
Appendix II SESAM selection for mode-locked Yb-fiber laser ................... 169
Appendix III List of publications...................................................................... 172

List of abbreviations
AOM Accousto-Optic Modulator AOTF Accousto-Optic Tunable Filter ASE Amplified Spontaneous Emission CFBG Chirped Fiber Bragg Grating CPA Chirped Pulse Amplification CW Continuous Wave DDL Dispersive Delay Line EDFA Erbium Doped Fiber Amplifier EOM Electro-Optic Modulator ESA Excited State Absorption FP Fabry-Perot FROG Frequency-Resolved Optical Gating FWHM Full Width at Half Maximum FWM Four Wave Mixing GDD Group Delay Dispersion GVD Group Velocity Dispersion HF Holey fiber LMA Large Mode Area MCVD Modified Chemical Vapour Deposition NA Numerical Aperture NLPE Nonlinear Polarisation Evolution OPO Optical Parametric Oscillator ORC Optoelectronics Research Centre PBS Polarising Beam Splitter PC Polarisation Controller PPLN Periodically Poled Lithium Niobate RMS Root Mean Square SBS Stimulated Brillouin Scattering SEM Scanning Electron Micrograph SHG Second Harmonic Generation SNR Signal to Noise Ratio SPM Self-Phase Modulation SRS Stimulated Raman Scattering UV Ultra-violet WDM Wavelength Division Multiplexing ZDW Zero Dispersion Wavelength
vi
emerging practical applications of ultrafast technology. The development of compact and
robust sources of high energy femtosecond pulses has therefore generated strong research
interest.
Ytterbium (Yb) doped silica fiber, with its broad gain bandwidth, high optical conversion
efficiency and large saturation fluence, represents an extremely attractive medium for both the
generation and subsequent amplification of ultrashort optical pulses [7]. Moreover, Yb-fiber
systems can be power scaled by the addition of diode-pumped amplifier stages to provide a
compact, all-fiber, high power, short-pulse system [8, 9]. My supervisor, Professor Richardson,
obtained industrial funding to develop a practical and robust, high-power short-pulse diode-
pumped Yb-doped fiber based laser and amplifier system. The system would use the CPA
technique, whereby pulses are first temporally stretched, then amplified, then finally
recompressed in order to avoid nonlinear distortion due to high peak powers within the
amplifiers. The agreed approach was to develop a passively mode-locked fiber-based oscillator
to produce ~100 fs pulses as a seed for high power fiber amplifiers. The final amplified pulses
would have energy of ~10-50 µJ, and average power of ~500 mW, with pulse duration ~500 fs.
The system would make use of the ability of the ORC to fabricate specialty chirped fiber-Bragg
gratings (CFBGs) with both 2nd and 3rd order dispersion in order to create a pulse stretcher, and
also the ability of the ORC to fabricate large-mode-area (LMA) fiber to develop the final
amplifier for the system. The development of this system formed the majority of this PhD
thesis research.
For applications requiring high average power but at high repetition rates, and hence lower
pulse energies, the use of a pulse stretcher is not required since the pulse peak powers, and
hence nonlinear effects are less significant. This enables simplified ‘direct amplification’
systems to be used, in which the pulse stretcher is omitted, and consequently a much more
compact compressor can be used. Recent theoretical research on short pulse evolution in fiber
amplifiers with normal dispersion (e.g. using Yb-doped fiber), has demonstrated that pulses
with parabolic temporal and spectral profiles and a linear chirp are the analytic asymptotic
solution to the propagation equation (modified nonlinear Schrödinger equation (NLSE) with
gain) [10]. The linear chirp allows such parabolic pulses to be recompressed using a standard
diffraction grating compressor, and 125 fs recompressed pulses have been demonstrated
experimentally in single amplifier systems at high average powers (17W, 75MHz repetition
rate, and 230 nJ pulse energy [11]). However, using a single amplifier limits the maximum
potential gain to ~35 dB, so to investigate the possibility of obtaining femtosecond pulses from
a direct amplification system but with much higher gain, a system was developed based on the
oscillator and cascaded amplifiers used for the CPA. This work is presented following the
description of the CPA research.
2

HFs are a class of microstructured fiber which have a solid core surrounded by a cladding
region that is defined by a fine array of air holes that extend along the full fiber length [12-14].
HF technology has developed rapidly in recent years and, due to their far broader range of
fabrication parameters compared to conventional fiber, HFs have been produced with dispersion
and nonlinear properties beyond those previously possible. In particular, high air-fill fraction
HF can have a much higher index contrast than is possible with conventional fiber, and if this is
combined with a small core size, the strong waveguide contribution to the dispersion can
produce an overall anomalous dispersion at wavelengths <1.3 µm, where standard fibers have
normal dispersion. Therefore HF can support temporal solitons in new wavelength bands. A
small core naturally leads to the fiber having an exceptionally high effective nonlinearity, which
is ideal for soliton generation. Moreover, as a result of the increased range of fiber properties,
new results such as visible supercontinuum generation seeded directly from mode-locked
Ti:Sapphire lasers have been demonstrated [15], and these results have led to tremendous
advances in spectroscopy and metrology. Due to the wide range of applications of such a
broadband collimated source, there has also been much interest in developing less complex, less
expensive, seed laser systems.
The ORC is one of the world-leading centers in HF fabrication and HF applications research,
and this thesis presents results showing a variety of novel applications of this technology using
small core high nonlinearity HFs fabricated at the ORC. Experiments are described which
demonstrate linear dispersion compensation (low-power), soliton formation (requiring nonlinear
interaction) and soliton transmission in anomalously dispersive HF using ~20 pJ pulses in a <2
m fiber length. The fiber lengths and power requirements are orders of magnitude smaller than
comparable experiments in standard silica fiber at telecommunications wavelengths. Further
experiments are described which used the direct amplification system (described above) to seed
HF in order to demonstrate the first all-fiber source of visible continuum generation.
Using HF with a zero dispersion wavelength (ZDW) ~800 nm, with a high-energy
Ti:Sapphire laser system as the source, the extension of supercontinuum generation in the UV to
wavelengths as short as 300 nm is reported. It was observed that the UV intensity was
enhanced when seed pulses were coupled into a higher-order transverse spatial mode of the HF.
A significant difference between the fundamental and higher order mode of the HF is the
dispersion properties of these modes; in particular the higher order mode has a shorter ZDW.
Numerical simulations are presented which suggest that the differences in dispersion profiles
could lead to increased power transfer to short wavelengths. Using the same Ti:Sapphire source
and HF, and with suitable detuning of the launch coupling into the HF, visible-supercontinuum
generation in several subsidiary cores of a HF was demonstrated for the first time.
3

Wavelength tuneable, femtosecond optical pulse sources have applications in areas as diverse
as ultrafast spectroscopy, materials processing, optoelectronics, nonlinear optics and optical
chemistry. Traditionally, femtosecond pulse sources have been based on bulk crystal materials
(most commonly Ti:sapphire). Whilst excellent performance characteristics have been
achieved, and successful commercial products and application areas have been developed, these
traditional sources offer a limited range of directly accessible wavelengths and continuous
broadband tuning ranges, particularly above 1.1 µm. In general, extending this femtosecond
technology to obtain broader tuning ranges and longer wavelengths requires the use of bulk
parametric nonlinear devices such as OPOs, Optical Parametric Generators (OPGs), or
Amplifiers (OPAs), pumped by a bulk femtosecond-laser. Such devices add to the complexity
and cost, and increase the physical size of the overall system. The discovery of the soliton-self-
frequency shift (SSFS) in optical fibers was first reported in 1985-1986 [16-18], and opened up
the exciting possibility of obtaining widely wavelength tuneable femtosecond soliton pulses
from fiber-based sources (ideally incorporating a fiber based pump laser)[19]. To obtain the
SSFS effect, the frequency shifting fiber must exhibit anomalous dispersion at both the initial
seed wavelength and across the required tuning range. Yb-doped HF has been developed [20-
22], and by using a small core and a high air fill-fraction, these active HFs can, like passive
HFs, have anomalous dispersion at 1 µm. Using such a fiber as an amplifier for seed pulses
from the Yb-fiber mode-locked oscillator (above), a source of ~200 fs pulses, tuneable in
wavelength from 1.06–1.33 µm was demonstrated. Wavelength tuning was based on the SSFS,
and with the output wavelength controlled by the pump power applied to the Yb-doped HF
amplifier.
The contents of each chapter of this thesis are summarised as follows. Chapter 2 provides a
background summary of the nonlinear fiber optics theory as necessary to understand the
research presented in the following chapters. The work in this thesis is predominantly based on
Yb-doped fiber amplifiers, and Chapter 2 therefore also provides a brief summary of the
spectroscopy of Yb-doped silica fiber, and describes the procedure used to calculate the
properties of such amplifiers. In addition, due to the rapid development of HF technology in
recent years, and considering that the ORC is one of only a handful of worldwide centres
developing such fibers, Chapter 2 concludes with a brief overview of HF technology.
The development of a high power cascaded Yb-fiber amplifier system for ultrashort pulse
generation is described in Chapters 3-8. Chapter 3 provides a review of previously reported
fiber-based CPA research and describes the principal outstanding technological challenges to be
addressed before practical systems can be developed for a wide range of applications. The
specifications and resulting overall approach adopted for the commercially sponsored
development of an Yb-fiber based CPA system is described, and an overview of the CPA
4
system is presented. A simplified ‘direct amplification’ system, operating at similar average
power but higher repetition rate, hence lower pulse energy, is also described. The direct
amplification system omits the pulse stretcher and therefore uses a more compact compressor
compared with the CPA system, but by using the cascade of amplifiers has higher gain than
previously reported direct amplification systems which have been based on a single amplifier
stage.
Chapter 4 describes the development of a highly stable Yb-fiber based, mode-locked
oscillator. The oscillator is based on the stretched-pulse principle, and incorporates a
semiconductor saturable absorber mirror (SESAM) to enable robust self-start mode-locking.
This oscillator was subsequently used for the seed in our high power systems. The operating
principles are presented, then the characterisation of each component in the cavity is described.
The characteristics of the laser output are presented, including pulse spectrum, autocorrelation,
and RF noise.
Chapter 5 reports the development of the pulse stretcher and compressor used for the Yb-fiber
CPA system. The effects of uncompensated 3rd order dispersion on the quality of the
recompressed pulses are demonstrated by numerical calculations. The design process for the
bulk grating compressor is described, and experimental measurements of the temporal response
vs. wavelength are presented. The development and characterisation of a CFBG stretcher
incorporating both 2nd and 3rd order dispersion compensation is presented. The chapter
concludes by suggesting a future CFBG design to enable shorter pulses to be produced from the
CPA system e.g. 300 fs pulses, compared to the 500 fs pulses demonstrated using the initially
developed CFBG.
Chapter 6 describes the development of the individual amplifier stages for the CPA system.
First the characteristics of the core-pumped pre-amplifiers are described. Results of numerical
modelling are reported that demonstrate the expected increase in gain that could be obtained by
using modified core-pumped pre-amplifier designs in future systems. The design and measured
operating characteristics of the final stage high-power cladding-pumped amplifier are then
described.
Chapter 7 presents the performance of the CPA system as a whole. The output pulse spectra
are presented at several pulse energies up to a maximum of 80 µJ (before temporal
recompression). Stimulated Raman Scattering (SRS) was observed to limit the maximum pulse
energy from the system. Results of numerical calculations are presented in order to demonstrate
that increasing the core size and reducing the length of the fiber used for the final amplifier
should enable pulse energies >100 µJ to be obtained. The extent of Self-phase modulation
5
(SPM) induced phase distortion for 100 µJ pulses is calculated, and the high quality of the
recompressed pulses is shown.
Chapter 8 presents measurements on ultrashort pulses produced from a direct amplification
system. The system was based on the oscillator and amplifier components developed for the
CPA system of Chapter 7, but was simplified by removing the pulse stretcher, which then
enabled a more compact compressor to be used. Pulse spectra and autocorrelation data are
shown. Second Harmonic Generation (SHG) Frequency Resolved Optical Gating (FROG)
measurements are presented, which provide the full temporal phase profile of the pulses.
Numerical simulations of the pulses from the system are presented, and are shown to be in close
agreement with the measured pulse parameters. In addition, the theoretical asymptotic
‘parabolic’ pulse solution to the modified NLSE with gain is described, and the characteristics
of the measured pulses are compared to the characteristics predicted for parabolic pulses.
Chapters 9, 10, and 11 present the research performed using small-core HF with anomalous
dispersion at wavelengths <1.3 µm. Chapter 9 describes linear dispersion compensation, and
the generation and transmission of solitons. Linear dispersion compensation was demonstrated
by launching strongly attenuated, positively chirped pulses from the oscillator of Chapter 4 into
a length of passive HF. Solitons were produced using the same arrangement except by
increasing the power launched into the HF. Further results are presented showing visible
supercontinuum generation obtained by launching pulses from the direct amplification system
of Chapter 8 into a similar HF.
Chapter 10 describes supercontinuum generation extending to 300 nm in the UV produced by
launching high energy pulses from a Ti:Sapphire laser system into a short length of small-core
HF. The UV generation was enhanced by coupling the seed pulses into a higher order
transverse mode. Results of full-vector numerical calculations of the dispersion profiles of both
the fundamental and higher order mode of the HF are presented for the first time. Results of
pulse-propagation simulations (using the calculated dispersion profiles of the fundamental and
higher order mode) are presented; the results suggest that the dispersion profile of the higher
order mode is responsible for generating increased power at shorter wavelengths. Visible
supercontinuum generation in several subsidiary cores of the fiber is demonstrated for the first
time, and suggestions are presented for the fabrication of a multi-core fiber specifically for
producing tailored supercontinuum spectra from different sized cores (different dispersion
profiles) but using a single fiber.
Chapter 11 describes the development of a source of <200 fs pulses continuously tuneable in
wavelength from 1.06-1.33 µm, based on the SSFS principle. The source is based on a diode-
pumped Yb-doped HF amplifier, seeded by pulses from the mode-locked Yb-fiber oscillator
6
described in Chapter 4. The diode pump power was demonstrated to control the output
wavelength. The calculated HF characteristics are presented, then the experimental setup is
described. Next, the wavelength tuning results are shown. Finally, results demonstrating
broadband continuum generation, and pulse compression to ~65 fs are presented.
Chapter 12 provides a summary of the work in this thesis and describes possible areas for
further research.
The thesis concludes with three appendices. Appendix I describes the method used to
measure the amplitude noise and timing jitter of a CW mode-locked laser. Appendix II
summarises the performance of the mode-locked laser described in Chapter 4, when tested with
a range of SESAMs in order to identify the optimum modulation depth and saturation fluence
for robust self-start and stable CW mode-locking. Appendix III is a list of publications arising
from my thesis work.
The work in this thesis consists primarily of the author’s own research, undertaken whilst the
author was a registered postgraduate student at the University of Southampton. Any material
from other sources is referenced accordingly.
7
References 1. D. Du, X. Liu, G. Korn, J. Squier and G. Mourou, "Laser-Induced Breakdown by
Impact Ionization in SiO2 with Pulse Widths from 7 ns to 150 fs," Applied Physics Letters 64, 3071-3073 (1994).
2. B. N. Chichkov, C. Momma, S. Nolte, F. von Alvensleben and A. Tunnermann, "Femtosecond, picosecond and nanosecond laser ablation of solids," Applied Physics A-Materials Science & Processing 63, 109-115 (1996).
3. C. B. Schaffer, A. Brodeur, J. F. Garcia and E. Mazur, "Micromachining bulk glass by use of femtosecond laser pulses with nanojoule energy," Optics Letters 26, 93-95 (2001).
4. F. Korte, S. Adams, A. Egbert, C. Fallnich and A. Ostendorf, "Sub-diffraction limited structuring of solid targets with femtosecond laser pulses," Optics Express 7, 41-49 (2000).
5. D. Strickland and G. Mourou, "Compression of Amplified Chirped Optical Pulses," Optics Communications 56, 219-221 (1985).
6. J. Squier, G. Korn, G. Mourou, G. Vaillancourt and M. Bouvier, "Amplification of Femtosecond Pulses at 10-kHz Repetition Rates in Ti-Sapphire," Optics Letters 18, 625-627 (1993).
7. V. Cautaerts, D. J. Richardson, R. Paschotta and D. C. Hanna, "Stretched pulse Yb3+ silica fiber laser," Optics Letters 22, 316-318 (1997).
8. H. M. Pask, R. J. Carman, D. C. Hanna, A. C. Tropper, C. J. Mackechnie, P. R. Barber and J. M. Dawes, "Ytterbium-Doped Silica Fiber Lasers - Versatile Sources for the 1-1.2 micron Region," IEEE Journal of Selected Topics in Quantum Electronics 1, 2-13 (1995).
9. R. Paschotta, J. Nilsson, A. C. Tropper and D. C. Hanna, "Ytterbium-doped fiber amplifiers," IEEE Journal of Quantum Electronics 33, 1049-1056 (1997).
10. M. E. Fermann, V. I. Kruglov, B. C. Thomsen, J. M. Dudley and J. D. Harvey, "Self-similar propagation and amplification of parabolic pulses in optical fibers," Physical Review Letters 84, 6010-6013 (2000).
11. J. Limpert, T. Schreiber, T. Clausnitzer, K. Zollner, H. J. Fuchs, E. B. Kley, H. Zellmer and A. Tünnermann, "High-power femtosecond Yb-doped fiber amplifier," Optics Express 10, 628-638 (2002).
12. J. C. Knight, T. A. Birks, P. St.J.Russell and D. M. Atkin, "All-silica single-mode optical fiber with photonic crystal cladding," Optics Letters 21, 1547-1549 (1996).
13. J. C. Knight, T. A. Birks, P. St.J.Russell and D. M. Atkin, "All-silica single-mode optical fiber with photonic crystal cladding: Errata," Optics Letters 22, 484-485 (1997).
14. T. M. Monro, D. J. Richardson, N. G. R. Broderick and P. J. Bennett, "Holey optical fibers: An efficient modal model," Journal of Lightwave Technology 17, 1093-1102 (1999).
15. J. K. Ranka, R. S. Windeler and A. J. Stentz, "Visible continuum generation in air-silica microstructure optical fibers with anomalous dispersion at 800 nm," Optics Letters 25, 25-27 (2000).
16. F. M. Mitschke and L. F. Mollenauer, "Discovery of the soliton self-frequency shift," Optics Letters 11, 659-661 (1986).
17. J. P. Gordon, "Theory of the soliton self-frequency shift," Optics Letters 11, 662-664 (1986).
18. E. M. Dianov, A. Y. Karasik, P. V. Mamyshev, A. M. Prokhorov, V. N. Serkin, M. F. Stel'makh and A. A. Fomichev, "Stimulated-Raman conversion of multisoliton pulses in quartz optical fibers," JETP Lett. 41, 294-297 (1985).
8

9
19. N. Nishizawa and T. Goto, "Compact system of wavelength-tunable femtosecond soliton pulse generation using optical fibers," IEEE Photonics Technology Letters 11, 325-327 (1999).
20. W. J. Wadsworth, J. C. Knight, W. H. Reeves, P. St.J.Russell and J. Arriaga, "Yb-doped photonic crystal fibre laser," Electronics Letters 36, 1452-1454 (2000).
21. K. Furusawa, T. M. Monro, J. C. Baggett, P. Petropoulos, P. W. Turner and D. J. Richardson, "A mode-locked ytterbium doped holey fiber laser," Conference on Lasers and Electro Optics (CLEO), paper CWC2, (2001).
22. K. Furusawa, T. M. Monro, P. Petropoulos and D. J. Richardson, "Modelocked laser based on ytterbium doped holey fibre," Electronics Letters 37, 560-561 (2001).

Chapter 2 Nonlinear fiber optics
2.1 Introduction
Nonlinear pulse evolution in fiber is of critical importance for the devices described in this
thesis. This chapter provides the nonlinear fiber optics background used to develop these
devices. The work in this thesis is predominantly based on Yb-doped fiber amplifiers, and this
chapter also provides a brief summary of the spectroscopy of Yb-doped silica fiber, and
describes the procedure used to calculate the properties of fiber amplifiers. Holey fibers (HFs)
were used to enable various of the nonlinear experiments described in the latter chapters of this
thesis. This chapter describes the procedure used to fabricate HF and provides a brief overview
of the extended range of dispersion and nonlinear properties that are made possible by HF
technology.
This chapter is organised as follows. In Section 2.2 a brief introduction to the main nonlinear
optical effects in optical fiber is presented. In Section 2.3 the spectroscopy of Yb and methods
for calculating the characteristics of Yb-fiber amplifiers are described. Section 2.4 provides an
overview of holey fiber technology.
2.2 Nonlinear effects in optical fibers
This section is intended to provide an overview of the relevant theory to enable a thorough
consideration of the experiments described in this thesis. Starting from Maxwell’s equations,
the principal dispersive and nonlinear effects relevant to silica fiber are discussed, and the
derivation of the basic propagation equation, called the nonlinear Schrödinger equation (NLSE),
is described.
Ultrashort pulses have broad bandwidths, so the dispersion of the propagating medium must
be considered, and such pulses can also have high peak powers, which may excite a nonlinear
response in the propagating medium. Dispersion arises due to the linear response of the bound
electrons in silica, and due to the waveguide dispersion of the fiber. The Kerr nonlinearity
causes self-phase modulation and cross-phase modulation, and is due to the elastic response (no
energy exchanged) of the bound electrons to an intense optical field. Raman and Brillouin
scattering are caused by inelastic scattering whereby energy is exchanged with the medium
through the creation or annihilation of phonons. The nonlinear and dispersive effects can be
10

beneficial, for example when the dispersion is anomalous, the dispersion and nonlinearity can
combine to support stable pulse forms (solitons) that can propagate without broadening.
However, the nonlinear effects can also be detrimental, for example with normal dispersion,
nonlinear effects can distort the pulse profile and significantly increase the minimum duration of
the pulses produced from an amplifier system. In this section, the equations describing these
effects are briefly reviewed.
This section is organised as follows. Section 2.2.1 introduces the wave equation and the
concept of induced polarisation which are essential to understanding nonlinear properties in
optical fiber. In Section 2.2.2, the effects of purely linear dispersion are described. In Section
2.2.3 an overview of nonlinear effects is presented, including the effects of self-phase
modulation (SPM). Cross-phase modulation (XPM) is described in Section 2.2.4, and
stimulated Raman and Brillouin scattering are described in Section 2.2.5. Section 2.2.6
describes the split-step Fourier method that is typically used to numerically calculate the
profiles of ultrashort pulses propagating in optical fibers.
2.2.1 Pulse propagation in optical fiber
The propagation of optical fields in optical fiber is governed by Maxwell’s equations:
tBE
∂∂
−=×∇r
r Eqn. 2.2:1
tDJH
∂∂
+=×∇r
rr Eqn. 2.2:2
ρ=⋅∇ Dr
Eqn. 2.2:3
0=⋅∇ Br
Eqn. 2.2:4
where Er
and Hr
are electric and magnetic field vectors, respectively, and Dr
and Br
are
corresponding electric and magnetic flux densities. The current density vector and the charge
density
Jr
ρ represent the sources for the electromagnetic field. In optical fiber there are no free
charges, and and 0J =r
0=ρ .
The relationship of the flux densities Dr
and Br
to the electric and magnetic fields ( Er
and
Hr
) inside the medium and can be expressed through the constitutive relations given by
PEDrrr
+= 0ε Eqn. 2.2:5
MHBrrr
+= 0µ Eqn. 2.2:6
11
where 0ε is the vacuum permittivity, 0µ is the vacuum permeability, and Mr
is the induced
magnetic polarisation. Mr
= 0 in optical fiber because silica is a nonmagnetic medium. By
taking the curl of , the above equations can be converted into the wave equation that
describes light propagation
Eqn. 2.2:1
2
2
02
2
2
1tP
tE
cE
∂∂
−∂∂
−=×∇×∇rr
rµ Eqn. 2.2:7
Eqn. 2.2:7
Eqn. 2.2:7
where ( )00/1 εµ=c is the velocity of light in vacuum.
To solve , a relation between Pr
and Er
is needed. Optical fiber has a nonlinear
response to intense electromagnetic fields due to the anharmonic motion of bound electrons
under the influence of the applied field. The induced polarisation Pr
is thus not linear in the
electric field, but is described by the more general relation
( )Lrrr
Mrrrr
+++⋅= EEEEEEP )3()2()1(0 : χχχε Eqn. 2.2:8
Eqn. 2.2:8
where , is j),3,2,1()( L=jjχ
)1(χ
th order susceptibility (tensor of rank j+1). (This relationship
assumes that the response is both instantaneous and local, and in order to correctly describe
Raman and Brillouin scattering we relax the assumption of an instantaneous response, and
consider the delayed response of the medium as described in Section 2.2.5.) The linear
susceptibility is the dominant contribution to Pr
, and its effects are included through the
refractive index n , and the attenuation coefficient α . The second-order susceptibility is
responsible for second-harmonic generation and sum-frequency generation. However, centro-
symmetric materials such as amorphous SiO
)2(χ
2 show a zero value for (neglecting surface
effects), and therefore silica fiber does not exhibit second-order nonlinear effects. The lowest
order nonlinear effects in optical fiber originate from the third-order susceptibility , which
is responsible for phenomena such as third-harmonic generation, four-wave mixing, and the
intensity dependence of the refractive index. To obtain significant third-harmonic generation or
four-wave mixing requires special efforts to achieve phase matching and these processes are not
considered further in this thesis. It is then usual to make several simplifying assumptions to
enable the solution of and . First, the nonlinear contribution to the
polarisation (
)2(χ
)3(χ
NLPr
) is assumed to be a small perturbation to the linear contribution ( LPr
) to the
total induced polarisation. We then write the total induced polarisation as NLPLPPrrr
+= , and
including only the third-order nonlinear effects governed by , we obtain: )3(χ
12

Eqn. 2.2:9 ,')',()'(),( )1(0 ∫
∞
∞−
⋅−= dttrEtttrPLrrrr
χε
Eqn. 2.2:10 .),(),(),(),,(),( 321321321)3(
0 ∫ ∫∫∞+
∞−
−−−= dtdtdttrEtrEtrEtttttttrPNLrrrrrr
Mrr
χε
These relations are valid in the electric-dipole approximation such that the response of the
medium is local. can then be simplified by using the mathematical relation
EEEErrrr
22)( −∇=∇−⋅∇∇=×∇×∇ (where ∇ 0=⋅∇=⋅ EDrr
ε and where ε represents the
dielectric constant) to give
Eqn. 2.2:7
.12
2
02
2
02
2
22
tP
tP
tE
cE NLL
∂∂
−∂
∂−=
∂∂
−∇rrr
rµµ Eqn. 2.2:11
Eqn.
2.2:11
Eqn. 2.2:11
Eqn. 2.2:11
The following sections demonstrate that by considering the waveguide geometry of an optical
fiber, and by assuming the spectral width of the pulse is much less than the central carrier
frequency (slowly varying envelope approximation), the three dimensional wave equation (
) can be reduced to a one dimensional propagation equation for the temporal profile of the
pulse envelope. The resulting equation is normally called the nonlinear Schrödinger equation
(NLSE) and it is possible to solve the equation numerically (and even analytically in the special
case of solitons) to determine the evolution of a pulse propagating in an optical fiber.
2.2.2 Linear propagation and dispersion
Starting from the nonlinear wave equation derived above ( ), this section considers
the case where the nonlinear polarisation can be neglected. The result then describes the effects
of dispersion on a pulse propagating in a fiber with a linear response. The nonlinear
polarisation will then be re-introduced in the following section using perturbation theory. With
0=NLPr
, is linear in Er
and takes the following simple form in the Fourier domain:
0~)(~ 20
2 =+∇ EkE ωε Eqn. 2.2:12
where , and due to the low loss of silica fiber 20 )2/( kin αε += ε is initially simplified to
. Far from material resonances, as is the case in silica fiber in the wavelength
range 0.5-2.0 µm relevant to the work in this thesis, the linear response of the material can be
represented by the Sellmeier equation (in contrast to a full quantum mechanical description):
)(2 ωn)(ωε =
.1)(1
22
22 ∑
= −+=
m
j j
jjBn
ωωω
ω Eqn. 2.2:13
13
In the cylindrical symmetry of a fiber, we use co-ordinates z,, φρ to write
)(exp)(exp)()(~),(~ zimiFArEz βφρωω =r (i.e. assuming initially no z -dependence of the
pulse envelope). A similar equation exists for zH~ (the other four components
φρφρ HHEE ~,~,~,~ are not independent variables and can be obtained using Maxwell’s
equations). Matching the (Bessel function) solutions for )( ρF at the core:cladding boundary,
an Eigenvalue equation is obtained that must be solved numerically to yield the propagation
constants for the various fiber modes, )(ωβnm , and hence the transverse mode profile
)( ρκ mnmF 22220 mnmn kn βκ −=, where at a given frequency. In a standard step-index fiber the
number of guided modes is determined by the normalised frequency, or V value
)(2 22clcoco nnV −⋅⋅= ρλ
πcon
co
, where and n represent core and cladding indices,
respectively, and
cl
ρ is the core radius [1]. Single mode guidance is obtained for 405.2<V .
For values of ~2.0 (typical for single-mode fibers) the field distribution of the fundamental
mode is approximately Gaussian:
V
)( ρF
2wπ=effA
~ ) , where core radius, and the
effective mode area is . For weakly guiding fibers [2], an approximate expression
for the propagation constant of the fundamental mode is obtained
from:
w 2/2(exp −ρ ≈w
( ) )()()( 2222 ωρωωωβ unc co−−= where ( )[ ] ( )
4/1)
++ 41 V−= 1 4 (ω)ω(2 V)ω(u ,
where we have expressed the normalised frequency as a function of ω .
A single mode fiber actually supports two modes that are dominantly polarised in orthogonal
directions. Due to small departures from cylindrical symmetry or small fluctuations in material
anisotropy, the mode propagation constant (effective index) becomes slightly different for the x
and polarisation modes and it can be shown that the power between the two modes is
exchanged periodically with a characteristic “beat length” [3] period:
y
( ) ( )yxyxB nnL −=− // λββπ= 2 .
Having obtained the mode-profile, we derive the basic propagation equation. We assume that
the optical field is launched on one polarisation axis and maintains its polarisation along the
fiber length, and that the spectral width ω∆ is such that 0ωω <<∆ , where 0ω is the central
frequency (slowly varying envelope approximation). The rapidly varying part of the electric
field can then be separated by writing
.].)exp(),([ˆ21),( 0 cctitrExtrE +−= ω
rrr Eqn. 2.2:14
14
where c.c. stands for complex conjugate, is the polarisation unit vector, and the amplitude x̂
),( trE ris a slowly varying function of time. Using separation of variables, we write
)(exp),(~),(),(~0β00 zizAyxF ωωω −=−
),( yxF
rEz ω in , which then gives both an
equation for (solved to obtain the propagation constant, and hence the mode-profile via
an Eigenvalue equation, as discussed above); and the following equation for the slowly varying
envelope:
Eqn. 2.2:12
( ) .0~~~2 2
02
0 =−+∂∂ A
zAi βββ Eqn. 2.2:15
We then introduce a small loss as a perturbation and write ( ) nnnnn ∆+≈∆+= 222ε , where
02kin α=∆ and write ( βωββ ∆+= )( )~ , where the small change β∆ can be evaluated using
first order perturbation theory. We use the approximation )~(2~00
20
2 ββββ −=−β to obtain:
[ .~)( ]~
0 AizA ββωβ −∆+=
∂∂ Eqn. 2.2:16
Eqn. 2.2:16To transform to the time domain, we first expand )(ωβ using a Taylor series
expansion about the carrier frequency 0ω ,
K+−+−+−+= 2036
12022
1010 )()()()( ωωβωωβωωββωβ Eqn. 2.2:17
where 0)( ωωββ == mmm Tdd , and )2,1,0( K=m . After returning to the time domain (using
the inverse Fourier transform) and using co-moving co-ordinates, T )()v/( 1ztzt g β−=−= ,
we obtain the propagation equation
.26
12 3
3
32
2
2 AT
AT
AizA αββ −
∂∂
+∂∂
−=∂∂ Eqn. 2.2:18
Eqn. 2.2:18
Eqn. 2.2:18
This one dimensional propagation equation enables us to study the effects of dispersion. In
most cases 2β is the dominant term in . The dispersion length is defined as the
length over which an initially unchirped pulse doubles its temporal width and is calculated using
( )2β20 /TLD = . For the specific case of a Gaussian pulse envelope, the effects of 32 , ββ can
be studied analytically, but for the general case, must be solved numerically.
However, even for an arbitrary initial pulse profile it can be shown that after propagating for
several dispersion lengths, the principal effect of 2nd order dispersion is a symmetric broadening
of the pulse and the creation of a linear chirp, whereas the principal effect of 3rd order dispersion
is asymmetric broadening of the pulse and the creation of a quadratic chirp.
15

The second derivative, , is called the group-velocity dispersion (GVD) at frequency )( 02 ωβ
0ω . In the normal dispersion regime 02 >β , and in the anomalous dispersion regime 02 <β .
The magnitude of 2β gives the pulse broadening per unit length of the medium and per unit
bandwidth of the pulse. Note that the GVD concept is straightforward in application only for a
homogeneous medium (e.g. a single type of fiber). The group-delay dispersion (GDD) is the
absolute time delay accumulated between components per unit frequency difference, and for a
specific length of material: GDD = material ofLength )( 02 ×ωβ . For a multi component
system, GDD is easier to consider because it can be calculated for each component, and
summed to obtain a total delay.
2.2.3 Nonlinear polarisation effects
In addition to the effects of linear dispersion described above, nonlinear polarisation effects are
an essential component of the work presented in this thesis. Essentially, the refractive index
increases slightly with increasing pulse intensity. To obtain the required quantitative solution,
we use the expression for the electric field envelope of the pulse ( ) and write
.].)exp(),([ˆ)21(),( 0 cctitrPxtrP LL +−= ωrrr
and .].)exp(),([ˆ)21(),( 0 cctitrPxtrP NLNL +−= ωrrr
.
Substituting these relations into Eqn. 2.2:10, we observe that ),( trPNLrr
has a term at a frequency
of 0ω and another term at the third-harmonic frequency of 03ω . However the latter term is
negligible unless special efforts are made at phase-matching this process and it is not considered
further. The nonlinear absorption coefficient (which defines 2-photon absorption) is also weak
in silica and is neglected. We assume (initially) an instantaneous nonlinear response of the
medium, and ),( trPNLrr
can be then expressed as follows:
Eqn. 2.2:14
,),(),( 0 trEtrP NLNLrr
εε= Eqn. 2.2:19
where NLε is the nonlinear part of the dielectric constant defined by
.),(43 2)3( trExxxxNL
rχε = Eqn. 2.2:20
Since is found to be intensity dependent because of n NLε , it is customary to introduce
InnEnnn 202
20 +==
2n
+
0n
, where in silica at wavelengths close to 1 µm, the linear refractive
index is ~1.46, and (Kerr nonlinearity coefficient) is ~3 x 10-20 m2/W, and I represents
the intensity of the signal. Writing 02
2 2kiEnn α+=∆ , and following the same overall
procedure as described for determining the effects of linear dispersion, the propagation equation
( ) for the pulse envelope is transformed to the time domain, and becomes: Eqn. 2.2:16
16
AAiATA
TAi
zA 2
3
3
32
2
2 261
2γαββ +−
∂∂
+∂∂
−=∂∂ Eqn. 2.2:21
Eqn. 2.2:21
Eqn. 2.2:21
where )(02 effcAn ωγ =
ps1≥
. This equation ( ) is the fundamental equation used to study
nonlinear pulse evolution in fibers and it is called the nonlinear Schrödinger equation (NLSE).
The NLSE has been found to be applicable to the study of nonlinear systems in many branches
of physics. Due to the assumption of instantaneous nonlinear response that was made when
deriving , it describes accurately the propagation of pulses that have durations
( FWHMτ ), that are longer than the nonlinear response time in silica. For pulses of
duration ps1≤FWHMτ , the delayed response of must usually be included, as described in
Section 2.2.5.
)3(χ
The NLSE can be used to study self-phase modulation (SPM): the nonlinear response to the
changing intensity of the pulse envelope itself induces a phase change across the pulse. To
study the effects of SPM, the dispersion is initially ignored and the NLSE may then be solved
analytically. The temporal phase of a signal pulse propagating through optical fiber due to SPM
is found to be:
λ
πφ
22 ),0(2
),(tzEnL
tLz effNL === Eqn. 2.2:22
where λ is the signal wavelength, and ( )exp(11 LLeff α )α −−=
0/1 PLNL
, where is the actual fiber
length. The nonlinear length is defined as
L
NLL γ= , where is the pulse peak power.
The nonlinear length provides a length scale over which nonlinear effects become important for
pulse evolution along the fiber. We also define , which for a given pulse duration
and peak power provides a measure of the relative importance of dispersive vs. nonlinear
effects. When dispersion is dominant, and when nonlinear effects are
dominant.
0P
>>
NLD LLN /2 =
N12 <<N 12
The time dependent phase change experienced by an optical pulse may be regarded as a
change in the instantaneous frequency, which is referred to as a frequency chirp. The SPM
induced spectral broadening is thus a consequence of the time dependence of the induced
nonlinear phase changes. At the leading edge of a bright pulse, red-shifted wavelengths are
produced, and at the trailing edge, blue-shifted wavelengths are produced. The generation of
new spectral components if coupled with normal dispersion in the fiber, will lead to increased
temporal broadening of the pulse. By contrast, in the anomalous dispersion regime pulse
compression can be achieved. With , the balance of dispersive and nonlinear effects
leads to stable pulse forms which propagate without broadening. These pulses are called
12 =N
17
fundamental solitons and they are an analytical solution to the NLSE, with pulse amplitude
profile:
( ) ( )( ) ,2/exphsec 00 DLziT/TPA = Eqn. 2.2:23
where is the pulse width (0T FWHMTT 763.10 = ). The soliton period is defined as
DLZ )(0 2/π= .
2.2.4 Coupling between different pulses
When two optical signals propagate inside a fiber they can interact with each other through the
Kerr nonlinearity ( ). Each signal experiences SPM (described above) and they also
influence each other by changing the refractive index experienced by the other signal, resulting
in a nonlinear phase change. This phenomenon is known as cross-phase modulation (XPM).
)3(χ
We first consider the nonlinear refractive index for signals with the same frequency ( 0ω ) but
travelling on orthogonal fiber axes. The electric field associated with an elliptically polarised
optical wave of central frequency 0ω can be written in the form
,..)exp(]ˆˆ[21),( 0 cctiEyExtrE yx +−+= ω
rr Eqn. 2.2:24
where and are the complex amplitudes of the orthogonal polarisation components. The
nonlinear part of the induced polarisation (again, ignoring 3
xE yE
rd harmonic components i.e.
assuming no phase-matching conditions have been applied) is then
,..)exp(]ˆˆ[21),( 0 cctiPyPxtrP yxNL +−+= ω
rr Eqn. 2.2:25
with and given by xP yP ( )∑ ∗∗∗ ++=j
ijjxyyxjijyxyxjjiyyxxi EEEEEEEEEP )3()3()3(0
23 χχχε . For
silica fibers, the three independent components of have nearly the same magnitude in
silica fibers [4], and are related by . If
are assumed to be identical, we obtain
)3(χ
)3()3()3()3(xyyxyxyxyyxxxxxx χχχχ ++=
x)3(3( and yyxxx χχχ )3( ,yxyx
) ,yy
( ) ,31
32
43 22)3(0
+
+= ∗
yyxxyxxxxxx EEEEEEP χε Eqn. 2.2:26
( ) .31
32
43 22)3(0
+
+= ∗
xxyyxyxxxxy EEEEEEP χε Eqn. 2.2:27
18
If , as would be the case in strongly birefringent fibers, the last term (cross-term) in
the above equations contributes negligibly because of the large phase mismatch. We then write
BLL >>
jjj EP εεω 0)( = where ( ) ( ) jLj
Lj
Lj
NLj
Ljj nnnnn ∆+≈∆+=+= 2
22εεε . Assuming
and writing
nnn Ly
Lx ==
{ } { })3(Re83
xxxxNL
nχε ≈2 = Re
21n
n , we obtain (neglecting nonlinear loss)
,||32|| 22
2
+=∆ yxx EEnn Eqn. 2.2:28
Eqn. 2.2:28
.||32|| 22
2
+=∆ xyy EEnn Eqn. 2.2:29
Eqn. 2.2:29The first terms in each of the above equations ( and ) account for SPM,
and the second terms are responsible for XPM. If the input light is elliptically polarised, the
XPM induced nonlinear coupling between the field components and creates nonlinear
birefringence.
xE yE
This effect of XPM between fields of the same frequency but on orthogonal polarisation axes
is particularly relevant to the operation of the fiber-based mode-locked laser described in
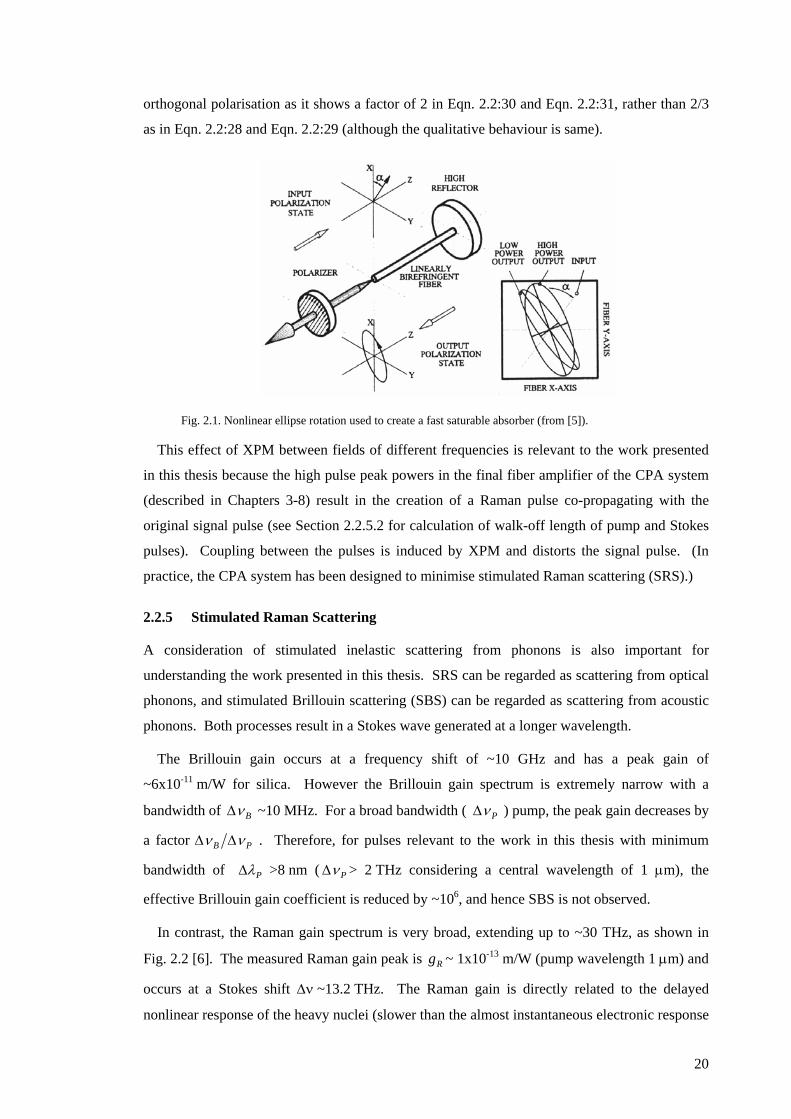
Chapter 4 of this thesis. As illustrated schematically in , the polarisation state at the
fiber output is intensity dependent [5], which can create a fast saturable absorber for mode-
locking. The input polarisation state to the fiber in the laser cavity is biased such that the
nonlinear ellipse rotation, which is greater for the most intense central part of the pulse, creates
an output polarisation state that passes through a polarisation beam splitter with lower loss than
the polarisation state of the low intensity wings of the pulse. The net result is that the pulse is
slightly shortened after each round trip inside the cavity. (The technique of nonlinear
polarisation rotation is a variant of additive-pulse mode locking in which orthogonally polarised
components play the role of two interferometer arms.)
Fig. 2.1
The XPM-induced coupling is also observed between optical waves with intensities , ,
traveling on the same polarisation axis but with different frequencies
iI jI
iω , jω , respectively. The
refractive index for each signal can then be expressed [1] as follows:
22
22 2 ji
Lii EnEnnn ⋅++= Eqn. 2.2:30
22
22 2 ij
Ljj EnEnnn ⋅++= Eqn. 2.2:31
where the linear component of the refractive index has been included due to its dependence on
the signal wavelength (dispersion). It is interesting that XPM between the two waves of
different frequencies is more effective than that between two waves of the same frequency but
19
orthogonal polarisation as it shows a factor of 2 in and , rather than 2/3
as in and (although the qualitative behaviour is same).
Eqn. 2.2:30 Eqn. 2.2:31
Eqn. 2.2:28 Eqn. 2.2:29
Fig. 2.1. Nonlinear ellipse rotation used to create a fast saturable absorber (from [5]).
This effect of XPM between fields of different frequencies is relevant to the work presented
in this thesis because the high pulse peak powers in the final fiber amplifier of the CPA system
(described in Chapters 3-8) result in the creation of a Raman pulse co-propagating with the
original signal pulse (see Section 2.2.5.2 for calculation of walk-off length of pump and Stokes
pulses). Coupling between the pulses is induced by XPM and distorts the signal pulse. (In
practice, the CPA system has been designed to minimise stimulated Raman scattering (SRS).)
2.2.5 Stimulated Raman Scattering
A consideration of stimulated inelastic scattering from phonons is also important for
understanding the work presented in this thesis. SRS can be regarded as scattering from optical
phonons, and stimulated Brillouin scattering (SBS) can be regarded as scattering from acoustic
phonons. Both processes result in a Stokes wave generated at a longer wavelength.
The Brillouin gain occurs at a frequency shift of ~10 GHz and has a peak gain of
~6x10-11 m/W for silica. However the Brillouin gain spectrum is extremely narrow with a
bandwidth of Bν∆ ~10 MHz. For a broad bandwidth ( Pν∆ ) pump, the peak gain decreases by
a factor PB νν ∆
P
∆ . Therefore, for pulses relevant to the work in this thesis with minimum
bandwidth of λ∆ >8 nm ( Pν∆ > 2 THz considering a central wavelength of 1 µm), the
effective Brillouin gain coefficient is reduced by ~106, and hence SBS is not observed.
In contrast, the Raman gain spectrum is very broad, extending up to ~30 THz, as shown in
[6]. The measured Raman gain peak is ~ 1x10Rg -13 m/W (pump wavelength 1 µm) and
occurs at a Stokes shift ∆ν ~13.2 THz. The Raman gain is directly related to the delayed
nonlinear response of the heavy nuclei (slower than the almost instantaneous electronic response
Fig. 2.2
20
which is responsible for elastic scattering) and this delayed temporal response has been
calculated from the Raman gain profile [6] as shown in (b). Fig. 2.2
Fig. 2.2
Fig. 2.2
SRS can be considered for two regimes of pump pulse bandwidth. For narrow and moderate
bandwidth pulses (e.g. <∆ Pν 0.5 THz, ps 1>FWHMτ ). The principal effect of SRS is that the
pulses can act as a pump and transfer energy to a longer wavelength Stokes signal e.g. at a
frequency offset close to the Raman gain peak (13.2 THz). The pump pulse is described by the
NLSE, but with an intensity dependent loss term to account for the energy transfer to the Stokes
pulse, and perhaps including a term to account for the influence of the Stokes pulse on the pump
pulse through XPM. In contrast, for broad bandwidth pulses (e.g. ∆ THz 4.4≈Pν ,
corresponding to a transform limited 100 fs pulse), in addition to the possible energy transfer to
an independent Stokes pulse, the long wavelength spectral components may experience
significant Raman gain pumped by the short wavelength components. This is the phenomenon
of intra-pulse SRS, and the NLSE should then be modified to include the delayed temporal
response of the medium ( (b)), as follows [1]( ) Eqn. 2.2:32
Eqn. 2.2:32
Eqn. 2.2:32
[ ] .')',()'(),(126
12
2
03
3
32
2
2 ∫+
∞−−×
∂∂
++−∂∂
+∂∂
−=∂∂ T
dTTTzATRTzAT
iiAT
AT
AizA
ωγαββ
The response function )()()1()( ThftfTR RRR +−= δ includes both instantaneous and delayed
nonlinear response of the fiber, where 18.0=Rf
∫∞+
∞−
=')'( dTThR
is the fractional contribution of the delayed
Raman response, and the experimentally determined Raman response of silica (Fig. 2.2(b)) is
used for h , normalised such that . In order to conserve photon number
also includes the so-called self-steepening term that results from including the first
derivative of the slowly varying envelope of the nonlinear polarisation,
)(TR 1
NLPr
, in Eqn. 2.2:7. The
likely significance of the delayed response of the medium can also be considered in the time
domain (see (b)), by assessing whether the pulse duration is comparable to the response
time of the medium.
21

Fig. 2.2 Raman gain spectrum and delayed time response for silica. (a) Measured Raman gain. (b) Delayed time response, , as described in above text. (From [1].) )(ThR
Fig.
2.2
(a)
2.2.5.1 Soliton self-frequency-shift
For the solitons in holey fibers described in the later part of this thesis (Chapters 9-11) the peak
powers are sufficiently low, and the fiber lengths sufficiently short, that the generation of a
strong Stokes pulse from quantum noise does not occur, and the principal effect of SRS is intra-
pulse scattering. In particular because solitons are stable against small perturbations this effect
leads to the soliton self-frequency-shift (SSFS), which causes a continuous downshift of the
soliton frequency as it propagates along the fiber (as illustrated by the results of Chapter 11).
The approximate functional dependence of the rate of frequency shifting dzfd )(∆ on the
soliton duration can be explained as follows. The Raman gain is proportional to the pump
intensity, which scales as 2τ1 for a soliton of duration τ . The Raman gain can be seen (
(a) ) to be approximately proportional to the frequency offset ν∆ (for ν∆ <<13 THz), and is
therefore proportional to τ1 . The overall Raman gain therefore depends on 3τ1 . The rate of
frequency downshift is approximately proportional to the frequency width of the pulse (~ τ1 ),
which gives an overall rate of frequency downshift dzf )d (∆ ~ 4τ1 [7]. This is a useful
approximate analytic relationship, but for detailed studies, numerical simulations are usually
performed.
2.2.5.2 Threshold power for Stokes pulse generation
For the pulses in the CPA and direct amplification systems described in the first part of this
thesis, the peak power is sufficient to create a strong SRS generated Stokes pulse from quantum
noise. The main consequence of SRS is that energy is transferred to a longer wavelength Stokes
pulse (∆νR=13.2 THz corresponding to a 45 nm wavelength shift at a wavelength of 1 µm) and
22

this presents a limit on the maximum pulse peak power that can be produced from these
systems. The initial growth of the Stokes signal can be described by
,SSSPRS IgIIg
dzdI
+= Eqn. 2.2:33
where is the amplifier gain for the Stokes signal, is the Raman gain coefficient,
are the Stokes and pump intensities. Neglecting pump depletion due to the Stokes
wave, the evolution of the pump signal follows
Sg
PI
Rg
SI and
,PPP Ig
dzdI
= Eqn. 2.2:34
where is the amplifier gain at the seed pulse wavelength. For a seed pulse intensity at the
amplifier output ( of , we obtain the solution for (Eqn. 2.2:35) which can be
substituted into Eqn. 2.2:33 to obtain a further equation for (Eqn. 2.2:36).
Pg
)Lz = )(LIP )(zI P
)(zI S
( ) ,)(exp)()( zLgLIzI PPP −−= Eqn. 2.2:35
( ) ,)(exp)( SSSPPRS IgIzLgLIg
dzdI
+−−= Eqn. 2.2:36
Assuming we then obtain the solution for ggg SP == )(zI S
( ) ,)(exp)0()( gzzLIgIzI effPRSS += Eqn. 2.2:37
where )]exp(1[)1( gzgzeff −−= . The Stokes wave can build up from quantum noise occurring
throughout the fiber length, and Smith [8] has shown that this is equivalent to injecting one
fictitious photon per mode at the fiber input. Integration over all frequencies gives:
Eqn. 2.2:38 ( .)()(exp)( ∫∞
∞−
+= ωωω dzgzLIgzP effPRS h )
The Raman threshold power ( ) is defined as the pump power at the amplifier output
which generates the same amount of Stokes power at the amplifier output. The Raman gain is
strongly peaked at frequency offset of 13.2 THz from the pump, and by assuming that the
Raman gain profile can be approximated by a strongly peaked Lorentzian gain profile, Smith [8]
has calculated to be given, to a good approximation, by
crP0
crP0
( ) .160 ≈effeffcr
R ALPg Eqn. 2.2:39
23
Due to the wavelength offset the pump and Stokes pulses travel at different group velocities,
and the walk-off length is calculated to be 1_
1_
−− −= SgPgW vvTL SPT _1_1 ββ −=
2)( βωω ×−= SPT where T is the pulse duration. For T =5 ps, which corresponds to the
pulse duration for the directly amplified pulses in Chapter 8, we have (using
THz 2.132 ×=− πωω SP ) ~2.4 m, and since the interaction between the pump and Stokes
pulses occurs over a distance of ~
WL
WL×3 [9], the walk-off of the pulses does not affect the
calculated Raman threshold for the ~4.5 m long fiber amplifiers in this thesis. (A similar
conclusion applies for the CPA system where the pulse duration is ~300 ps.) In principle, SRS
can also occur for counter-propagating pulses, but the interaction time (length) is much shorter
so that the effect is not significant.
2.2.6 Numerical solution of the nonlinear Schrödinger equation
Except in certain special cases e.g. solitons, the NLSE ( ) does not have analytic
solutions, and numerical methods are generally used to propagate an initial pulse form. A
technique commonly implemented is called the split-step Fourier method. To understand the
method, we write the propagation equation for the pulse envelope, , as ),( TzA
Eqn. 2.2:21
( ) ADNzA ˆˆ +=
∂∂ Eqn. 2.2:40
where is the nonlinear operator, and N̂ D̂ is the dispersion operator,
2
ˆ 2 αγ −= AiN Eqn. 2.2:41
.61
2ˆ
3
3
32
2
2 TTiD
∂∂
+∂∂
−= ββ Eqn. 2.2:42
Here includes only the SPM nonlinear term and a loss term, but higher order nonlinear
terms can be included as necessary. By assuming that the dispersion and nonlinearity act
approximately independently over a small propagation distance
N̂
z∆ , the split-step Fourier
method applies the two operators sequentially
Eqn. 2.2:43 .),()ˆ(exp)ˆ(exp),( TzADzNzTzzA ∆∆=∆+
Differentiation with respect to time equates to multiplication by ωi in the frequency domain,
so the dispersion operator is more easily treated in the frequency domain by using a fast Fourier
transform (FFT), before returning to the time domain using the inverse transform (IFFT) in
order to apply the nonlinear operator. This procedure is illustrated below for one propagation
step:
24
{ }( )[ ]
{ }( )[ ]
.L untilrepeat ...2)(exp)()(
)(~)(
exp)(~)(~)()(~
2
336
222
∑ =∆
∆−=
=
∆+=
=
z
ztAitAtA
AIFFTtA
zAA
TAFFTAii
αγ
ν
ωβωβνν
ν
2.3 Ytterbium doped silica fiber
Yb-doped silica fiber has been used as the gain medium for the majority of the work reported in
this thesis. This section provides a summary of the spectroscopic properties of Yb-doped silica.
The Yb spectroscopy governs the range of possible pump and signal wavelengths, and the
variation in characteristics with temperature. Results are presented in subsequent chapters of
this thesis that demonstrate how our Yb-fiber amplifiers were optimised for maximum gain.
The work was mainly done by experimental optimisation, but supported where necessary by
numerical calculations. This section therefore describes briefly the model and computational
method used to produce the numerical results.
This section is organised as follows. In Section 2.3.1, the Yb spectroscopy is briefly
described. The following three sections describe the computational method used in order to
calculate the optimum amplifier length. Section 2.3.2 provides an overview of the model.
Section 2.3.3 describes the procedure for calculating the inversion density in a fiber piece which
is sufficiently short that the inversion density does not vary along the length. Section 2.3.4
presents an algorithm that uses the inversion density from the short fiber piece to calculate the
power at the output of an amplifier of arbitrary length. Use of that result to optimise the
amplifier design (e.g. fiber length) is described.
2.3.1 Ytterbium fiber spectroscopy
This section provides a brief description of the spectroscopy of Yb-doped silica. Yb is a
member of the rare-earth (lanthanide) group of elements within the periodic table [10], all of
which have the general electronic structure 4fN5s25p65d06s2. In particular, Yb has the structure
(Xe)4f145d06s2. When inserted into a host material, e.g. silica, the outer two 6s electrons of the
Yb atom, and one of the 4f electrons are used for ionic binding, so Yb becomes triply ionized.
The spectroscopy of the Yb3+ ion is simple compared to other rare-earth ions [11]. For all
optical wavelengths, only two manifolds are relevant: the 2F7/2 ground-state manifold and the 2F5/2 excited-state manifold as shown in (a). Coulomb interactions split the 4f states into
terms, spin-orbit coupling splits each term into manifolds, and crystal-field (Stark) interaction
splits each manifold into sublevels (shown in ). Electric dipole transitions within the 4f
Fig. 2.3
Fig. 2.3
25
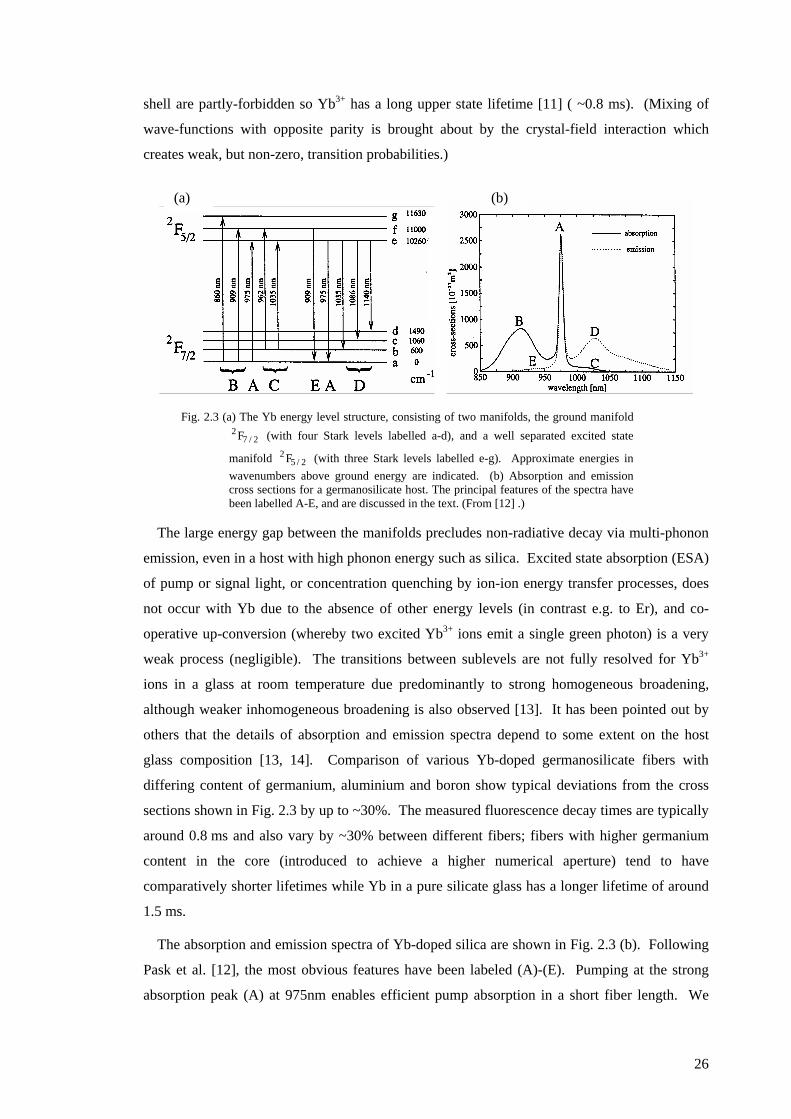
shell are partly-forbidden so Yb3+ has a long upper state lifetime [11] ( ~0.8 ms). (Mixing of
wave-functions with opposite parity is brought about by the crystal-field interaction which
creates weak, but non-zero, transition probabilities.)
Fig. 2.3 (a) The Yb energy level structure, consisting of two manifolds, the ground manifold (with four Stark levels labelled a-d), and a well separated excited state
manifold (with three Stark levels labelled e-g). Approximate energies in wavenumbers above ground energy are indicated. (b) Absorption and emission cross sections for a germanosilicate host. The principal features of the spectra have been labelled A-E, and are discussed in the text. (From [12] .)
Fig. 2.3
Fig. 2.3
2/72 F
2/52 F
(b) (a)
The large energy gap between the manifolds precludes non-radiative decay via multi-phonon
emission, even in a host with high phonon energy such as silica. Excited state absorption (ESA)
of pump or signal light, or concentration quenching by ion-ion energy transfer processes, does
not occur with Yb due to the absence of other energy levels (in contrast e.g. to Er), and co-
operative up-conversion (whereby two excited Yb3+ ions emit a single green photon) is a very
weak process (negligible). The transitions between sublevels are not fully resolved for Yb3+
ions in a glass at room temperature due predominantly to strong homogeneous broadening,
although weaker inhomogeneous broadening is also observed [13]. It has been pointed out by
others that the details of absorption and emission spectra depend to some extent on the host
glass composition [13, 14]. Comparison of various Yb-doped germanosilicate fibers with
differing content of germanium, aluminium and boron show typical deviations from the cross
sections shown in by up to ~30%. The measured fluorescence decay times are typically
around 0.8 ms and also vary by ~30% between different fibers; fibers with higher germanium
content in the core (introduced to achieve a higher numerical aperture) tend to have
comparatively shorter lifetimes while Yb in a pure silicate glass has a longer lifetime of around
1.5 ms.
The absorption and emission spectra of Yb-doped silica are shown in (b). Following
Pask et al. [12], the most obvious features have been labeled (A)-(E). Pumping at the strong
absorption peak (A) at 975nm enables efficient pump absorption in a short fiber length. We
26
note that pumping at the broader feature (B), at 915nm, has several disadvantages for
applications at 1.06 µm, because it leads to high gain at 975 nm, which can result in ASE if the
signal is weak, and the reduced absorption cross-section results in a longer absorption length for
the pump and correspondingly longer devices. The peak in the emission spectrum (D) from
1030 nm out to beyond 1100 nm corresponds to transitions from level e to levels b, c and d.
These transitions can become quasi 4-level in character at longer wavelengths due to the small
thermal populations of the Stark split lower levels. To minimise the absorption length, the
majority of the experiments in this thesis have used diode pumping at wavelengths close to the
975 nm absorption peak.
2.3.2 Overview of numerical model
This section describes a numerical model that is suitable for optimising the Yb-fiber amplifier
parameters e.g. changing the length to maximise the gain at a given wavelength. In the most
general case of unguided pump and signal beams in a bulk gain medium, calculating the power
distribution at the amplifier output is a complex problem that could require calculation of the
inversion density in individual small elements throughout the gain volume, which would have
both transverse and longitudinal variation along the signal propagation direction. Furthermore,
gain guiding or antiguiding could cause changes in the mode profile of the signal beam.
Fortunately, the small-core waveguide geometry of a fiber amplifier has the result that the
pump, signal, and ASE all propagate along the fiber with constant mode-profiles. Therefore
calculating the optimum amplifier parameters decouples to enable independent optimisation of
the transverse doping/refractive index profile (2 D) and of the fiber length (1D).
The transverse refractive index profile and Yb-doping geometry are both variable parameters
for the design of the fiber. Indeed, this freedom was used by previous researchers at the ORC
when optimising large mode area (LMA) fiber for power amplifiers and high energy Q-switched
lasers. However, optimisation of the fiber refractive index profile and Yb-doping geometry has
not formed part of the research in this thesis, and therefore further description of the necessary
calculations are not presented here. The modelling presented in this thesis was used to optimise
the fiber length and core size (hence pump/signal intensity) in order to obtain maximum gain.
A further simplification typically applied when modelling the fiber geometry is to average out
the radial variation of the inversion density of the active ions (caused by the radial variation of
the pump, signal, and ASE intensity profiles), by considering the doped region to interact with
beams of uniform “effective” intensity. The “effective” intensity calculated by the following
overlap integral ( q = Pump (P), Signal (S), ASE (A) ), which can vary from zero (no
overlap of intensity and doping profiles) to one (exact overlap):
qΓ
27

∫ ∫∫ ∫∞∞
=Γππ
φφφφφ2
0 0
2
0 0
, ),(),(),( ddrrrnddrrrnri ttqq Eqn. 2.3:1
where )(),,(),( zPzrIri qqq φφ = , and = total density of Ybtn 3+ ions. In core-pumped fiber, the
high-brightness pump has a similar mode-profile (hence overlap fraction) compared to the
signal and ASE. However, cladding-pumped fiber (also called double-clad fiber) is used for
high power applications because it enables pumping with higher power but lower brightness,
multimode laser-diodes. In cladding-pumped fiber, the pump is guided in a multimode
“inner-cladding” and only the signal and ASE are guided in the single or few-moded core.
Pump power is absorbed from the inner-cladding (passive) to the core (doped with active-ions)
along the fiber length, but the transverse pump mode-profile along the fiber can remain
approximately constant provided that asymmetries in the inner-cladding shape continually mix
the inner-cladding modes. (Double-clad fiber designs used to achieve efficient mode-mixing
are described in Chapter 6.) The calculation of overlap fractions for a double-clad fiber are
illustrated in , for both signal (core-guided) and pump (guided by inner-cladding). Fig. 2.4
Fig. 2.4. Schematic of fiber profile showing various effective overlap integrals.
Having reduced the required calculation from 3D to 1D, it is then necessary to set-up and
solve the rate equations in order to determine the population inversion in a given fiber section
. However, because these attributes result in rapid ASE build-up, both forward
and backward propagating ASE must be included in the model since the ASE power can be
comparable to the signal or pump power.
( zzz ∆+→ )
Signal overlap Γ
Fiber refractive index profile
Pump mode profile
Cladding pumping
05.0≈ΓP
S
(Hatched region)
Pump overlap Γ P
Doped region
Inner -cladding
Core
Signal mode profile
9.0≈ΓS(Hatched region)
Calculating the population inversion requires considering the spectroscopy of the Yb3+ ion,
and this is typically modelled as a two-level system. Considering Yb-as a two level system is
valid because of the simplicity of the Yb-manifolds involved in optical transitions (as described
above). This model assumes a homogeneously broadened lineshape, and homogeneous
broadening is indeed the dominant broadening mechanism in Yb-doped silica, although there is
some component of inhomogeneous broadening. The thermalisation time (establishment of
Boltzmann distribution within the upper or lower manifolds) is extremely rapid in Yb, and can
28
usually be considered to be instantaneous. Also the fiber temperature is usually considered to
be constant because Yb has a small quantum defect and a fiber amplifier has a large surface area
to volume ratio and naturally dissipates heat efficiently. Hence the emission and absorption
cross sections, which are dependent on the Boltzmann thermal population fractions within the
sublevels, are considered as constants regardless of pump and signal power levels. Considering
all of these features, the two-level model is therefore appropriate for Yb-doped silica fiber.
2.3.3 Calculating the inversion in a short fiber section
The simplifications described in the previous sections reduce the problem of calculating the
amplifier parameters (e.g. gain), to a one dimensional problem in a two-level system. However,
the tightly confined mode and long interaction length in a fiber amplifier can result in strong
gain, which results in a large variation in the population inversion density along the amplifier
length. One aspect of the model that it is not often possible to simplify is the consideration of
ASE propagation along the fiber length. The tightly confined optical mode and long interaction
length that result from the fiber geometry naturally lead to rapid ASE build-up in both forward
and backward directions. The calculation of ASE build-up is described further in Section 2.3.4
below. In this section, we consider a length of amplifier sufficiently short that the inversion can
be considered uniform, and then in the following section we describe a procedure that uses the
results obtained for this short amplifier section in order to calculate the performance of the
amplifier as a whole.
To calculate the population inversion for the short fiber section it is first necessary to select
the appropriate system of rate equations. In the CPA system, the time interval between pulses
(20 ns at 50 MHz rep. rate, increasing to 0.1 ms at 10 kHz rep. rate) is shorter than the upper
state lifetime of Yb, and the signal can be considered as quasi continuous wave (CW). The rate
equations are therefore solved by setting 021 ==dt
dNdt
dN, to obtain the population inversion.
For a signal power at wavelengthrSP rλ , the transition rate from level 1 (lower level) to
level 2 (upper level) is r
SrrSar
hAPν
σ ΓN1 where = number of ions in level 1, 1N arσ = absorption
cross section (at wavelength rλ ) and rSΓ = overlap integral for the signal, and A is the area of
the fiber core. The transition rate from level 2 to level 1 is τν
σ 22 NhAPN
r
rSer ΓSr + , where
erσ = emission cross section (at wavelength rλ ), = number of ions in level 2, and 2N τ is the
upper level lifetime.
29

Assuming an amplifier configuration with end-reflections suppressed at both ends of the
fiber, there are in general four beams propagating in the fiber, namely: the signal, the pump
(which we will assume to be co-propagating, but could also be counter-propagating), and the
forward ( ) and backward (-) propagating ASE. The ASE is normally considered to be core-
guided, and therefore to have the same overlap integral as the signal. For a broad bandwidth
signal, as is the case for ultrashort pulses considered in this thesis, it is useful to obtain the
spectral dependence of the gain. Spectral dependence is included by using the experimentally
measured wavelength dependence of the absorption and emission cross sections, and then
modelling the signal as a series of spectral slices of width
+
λ∆ with central wavelength rλ , and
signal power , where . The ASE can be modelled either approximately by
considering an effective ASE bandwidth and appropriate absorption/emission cross sections, or
by spectral slicing as suggested for the signal (but perhaps with broader slices than for the
signal). In the rate equations below, different wavelength band subscripts, r, k, are used for the
signal and ASE summation indices to allow for the possibility of different width spectral slices
being used for the computations of signal and ASE. In addition, the pump is assumed to be
forward propagating, but it would be equally possible to consider a backward propagating
pump. The rate equations are then:
rSP nr K1=
( )
( ) 2
11
1)()()()()()(
)()()()()()(
NPAh
PPAh
PAh
NPAh
PPAh
PAhdt
dN
kP
P
PPPePAkAk
k
kSkkek
rrS
r
rrSrer
kP
P
PPPaPAkAk
k
kSkkak
rsr
r
rSrrar
+
Γ++
Γ+
Γ+
Γ++
Γ+
Γ−=
∑∑
∑∑
−+
−+
τνλλσ
νλλσ
νλλσ
νλλσ
νλλσ
νλλσ
Eqn. 2.3:2
( )
( ) 2
12
1)()()()()()(
)()()()()()(
NPAh
PPAh
PAh
NPAh
PPAh
PAhdt
dN
kP
P
PPPePAkAk
k
kSkkek
rSr
r
rSrrer
kP
P
PPPaPAkAk
k
kSkkak
rSr
r
rSrrar
+
Γ++
Γ+
Γ−
Γ++
Γ+
Γ+=
∑∑
∑∑
−+
−+
τνλλσ
νλλσ
νλλσ
νλλσ
νλλσ
νλλσ
Eqn. 2.3:3
and by conservation .21 NNNt += Eqn. 2.3:4
2.3.4 Calculating the optimum amplifier length
This section describes a typical algorithm that uses the solution for the population inversion for
the short section of fiber, considered above, in order to calculate the pump, signal, and ASE at
the output of the complete amplifier.
30

We write the linear absorption (loss) coefficients of the pump, signal and ASE as Pα , Sα and
Aα respectively. The convective equations describing the spatial development of the power in
the pump, signal, and forward (+) and reverse (-) ASE beams are:
( ) ( ) ,,21 PPePaPPP
P PNNPdz
tzdP ασσ −−Γ= Eqn. 2.3:5
( ) ( ) ,
,12 SrSarerrSrS
rS PNNPdz
tzdPασσ −−Γ= Eqn. 2.3:6
( ) ( ) .2
,221
±±±
∆±−Γ= kAAkkekekakkSkAkA PhNNNPdz
tzdPαννσσσ mm Eqn. 2.3:7
Eqn. 2.3:7The second term on the right hand side in represents spontaneous emission produced
in the amplifier in the bandwidth kν∆ for both polarisation states. For an end-pumped
amplifier with co-propagating pump, boundary conditions for the pump, signal and forward
ASE are: ( ) inputPP PP _0 = , ( )s PP 0 inputs _= , ( ) ( ) ( ) estimateinitialAAA PPP _00 and,00 −−+ ==
12 NNN −
. Starting
at the fiber input ( ), it is then computationally straightforward to propagate the convective
equations stepwise along the fiber by calculating the inversion (
0=z
=∆ ) after each step.
The equations are propagated forward to calculate ( )LPS , ( )LPP ( )LPA+, and . Using these
calculated values and the boundary condition ( ) 0=− LPA (which is appropriate because the end
reflections are assumed to be suppressed), the pump, signal and ASE (-) are then propagated in
the reverse direction to to find 0=z ( )0SP , ( )0PP , and ( )0−AP . The calculated powers
obtained for each beam will be different from the input conditions because the initial estimate
for was incorrect. A standard iterative numerical technique (e.g. shooting or
relaxation) must then be applied to repeat the calculation using a revised estimate for
until a self-consistent solution is obtained that satisfies the boundary
conditions at both the input and the output of the amplifier. With this solution established, the
gain, ASE (noise) and lost pump power
( )AP 0−
( )revised0
estimateinitial _
estimate_AP −
( )LPP are then known, which gives the amplifier
performance (e.g. gain = ( ) ( )0/ SS PLP ) for the given amplifier configuration (fiber length,
pump power, and signal input power). The optimum amplifier configuration can be determined
by using the algorithm iteratively with several variations of the parameter to be varied.
From the extensive modelling and practical work that has been performed with the
established EDFA technology, the general properties of fiber amplifiers are now well
established. Forward pumping (co-propagating) provides higher inversion density at the
beginning of the amplifier, and is appropriate for small signal (high gain) applications because it
31
results in low noise operation. Forward pumping is appropriate for the low-noise pre-amplifiers
in the CPA system because of the small signal strength from the oscillator. With small input
signals, high gain is still possible because the power at the amplifier output typically does not
saturate the gain. In contrast, reverse pumping (counter-propagating) provides higher inversion
density at the end of the amplifier, which results in increased output power with the large
signals (saturated gain). However, reverse pumping can produce a significant noise fraction for
very weak input signals if care is not taken to avoid this. Reverse pumping is appropriate for
the power amplifier in the CPA system, because a strong input signal has been established by
using pre-amplifiers, and power extraction is most critical.
2.4 Holey fiber technology
Holey fibers (HFs) are a class of microstructured fiber which have a solid core surrounded by a
cladding region that is defined by a fine array of air holes that extend along the full fiber length
[15, 16]. HF technology has developed rapidly in recent years, and due to the broader range of
fabrication parameters compared to conventional fiber, HFs have been produced with dispersion
and nonlinear properties beyond those previously possible [16, 17]. As a result of the extended
range of dispersion and nonlinear properties, HFs have led to new applications in spectroscopy
[18], metrology [19], and communications [20, 21]. Several experiments reported in this thesis
demonstrate novel applications made possible due to the unique properties of HFs, and this
section provides an overview of HF technology.
This section is organised as follows. The physical structure and guidance mechanism of HF
is first described. Then Section 2.4.1 describes the HF fabrication process. Section 2.4.2
describes the range of dispersion properties possible using HFs. The nonlinear properties of HF
are briefly discussed in Section 2.4.3.
Fig. 2.5. shows an idealised HF structure. HFs are typically made of a single material,
usually pure silica, and guide light through a modified form of total internal reflection since
volume average index in the core region of the fiber is greater than that of the surrounding
microstructured cladding. The hole diameter (d) and pitch (Λ=hole to hole spacing), which are
the critical design parameters used to specify the structure of an HF, are typically on the scale of
the wavelength of light. . shows scanning electron microscope (SEM) images of various
HFs fabricated at the University of Southampton.
Fig. 2.6
32

Localised region of high refractive index forms fiber “core”.
n1
n2
d
Λ
Fig. 2.5.An idealised HF structure.
The physical differences between HFs and conventional fiber types arise from the way that
the guided mode experiences the cladding region. In a conventional fiber, this is largely
independent of wavelength to first-order. However, in a HF, the large index contrast between
glass and air and the small structure dimensions combine to make the effective cladding index a
strong function of wavelength. Short wavelengths remain tightly confined to the core, and so
the effective cladding index is only slightly lower than the core index. However, at longer
wavelengths, the mode samples more of the cladding, and so the effective index contrast is
larger.
An unusual modal property of HFs with a low air fill fraction ( ) is that such
fibers can be single-moded regardless of operating wavelength [22]. The broad bandwidth
single-mode operation of HF with a low air fill fraction ( (
4.0)/( <Λd
4.0)/ <Λd ) can be understood
qualitatively as follows. The V value (defined earlier) should be less than 2.405 for single
mode operation in fiber, which means most of standard single mode fibers produced for
telecommunications applications are multi-mode for short wavelengths. For example, SMF28
has a single mode cut-off wavelength of ~ 1.2 µm. In HF the light field at shorter wavelengths
is confined within the silica core area rather than being distributed across the air cladding as is
the case for longer wavelengths. Thus, the corresponding effective cladding index increases at
the shorter wavelengths, keeping the V value nearly constant and extending the single mode
bandwidth.
33

Fig. 2.6. SEMs of various HFs fabricated at University of Southampton: (a) small effective area silica HF, (b) high nonlinearity HF in Schott SF57 glass, (c) Yb-doped, air-clad, Large Mode Area HF for high power cladding-pumping applications, (d) Large Mode Area - HF.
(c) (d)
(b) (a)
2.4.1 Fabrication of holey fibers
HFs are typically fabricated by stacking an array of capillaries in a hexagonal configuration
around a solid rod, which defines a core. The resulting stack (preform), is then drawn down to
fiber dimensions using a conventional fiber drawing tower. By selecting the wall thickness and
tube diameter of the capillaries and by controlling the conditions under which the fiber is drawn,
a wide range of HFs with different optical properties can be produced. To fabricate an active
HF, a doped core must be used for the solid central rod when the preform is stacked. .
shows an outline of the procedure used to fabricate an active HF. This technique was used to
fabricate the Yb-doped HF for the experiments presented in Chapter 11. A rare-earth doped
core may be obtained by using an ultrasonic drill to remove the core from a conventionally
fabricated MCVD fiber preform. The well established technology used to fabricate the
conventional preform enables a low loss core rod to be obtained. HFs can be jacketed by
inserting the capillary stack into a thick walled silica tube before drawing into fiber, and the
resulting fibers can be polymer coated which gives the HF robust handling properties that are
similar to those of conventional fibers. To further extend the range of possible structures,
alternatives to the capillary stacking technique have been developed and recently the University
of Southampton demonstrated the first HF preform fabricated by extrusion of a glass with a
lower softening temperature (~600 °C for SF57 versus ~2000 °C for silica) [23].
Fig. 2.7
34

Fig. 2.7 Procedure used for active holey fiber fabrication.
~100µm
~1mm
Yb-doped (~2000ppm) conventionally fabricated preform.
Ultrasonic drill used to extract Yb-doped core (rod) from conventionally fabricated preform.
~10mm
Capillaries stacked around Yb-doped rod to make holey fiber preform.
Holey fiber preform placed in fiber drawing tower anpulled into fiber.
d
2.4.2 Dispersion properties of holey fiber
The unusual wavelength dependence of the effective refractive index in HF leads to a range of
novel dispersion properties which are relevant for applications [20]. For example, silica fibers
with a small pitch (Λ<2 µm) and large air holes ( 5.0/ >Λd ) can exhibit anomalous dispersion
down to wavelengths as low as 550 nm [17] because the exceptionally strong (anomalous)
waveguide contribution to the dispersion can dominate the (normal) material dispersion of silica
to provide fiber with overall anomalous dispersion at these short wavelengths. This has made
the generation and propagation of optical solitons in the near-IR and visible regions of the
spectrum a reality [24, 25], something not possible in conventional single mode fibers. Fig. 2.8.
shows the GVD of a HF as a function of wavelength for a range of different hole sizes when the
hole spacing is fixed [16]. We also note that small core, high air-fill fraction holey fibers are
typically polarisation maintaining because small asymmetries in the fiber geometry result in a
strong modal birefringence of the orthogonal polarisation modes. Full vector models are
therefore essential in order to properly numerically calculate the properties (dispersion, mode
area) of such fibers.
35
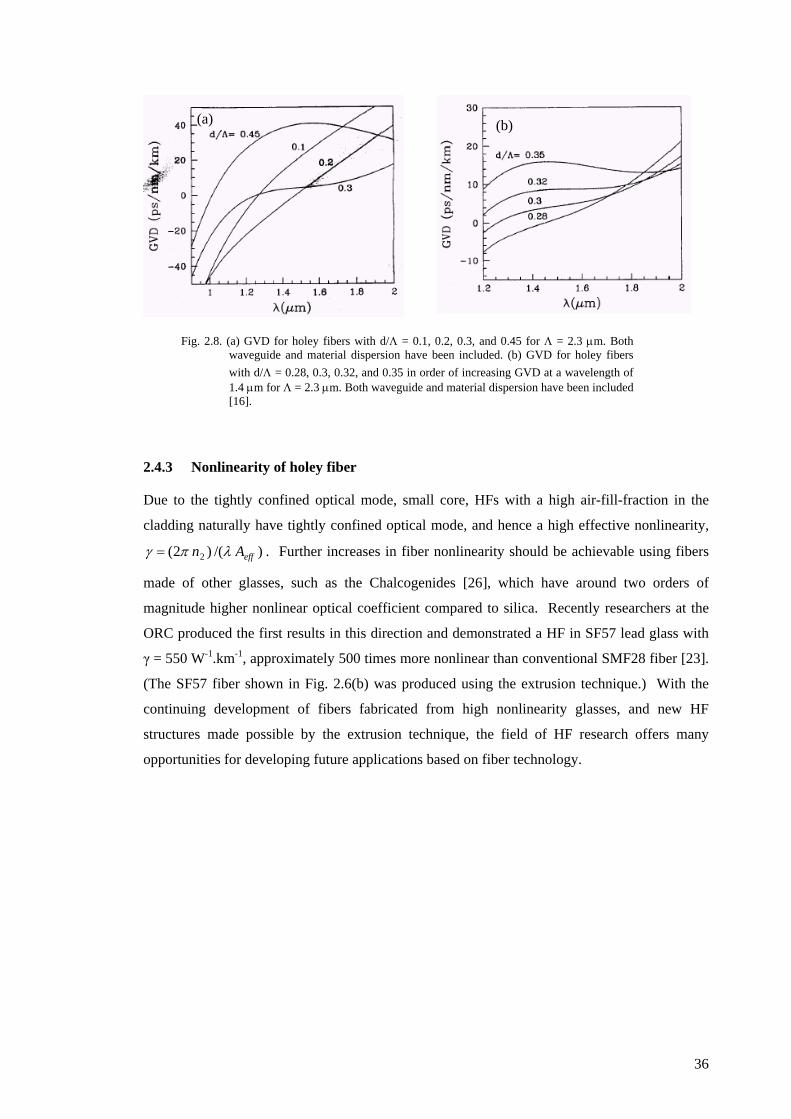
Fig. 2.8. (a) GVD for holey fibers with d/Λ = 0.1, 0.2, 0.3, and 0.45 for Λ = 2.3 µm. Both waveguide and material dispersion have been included. (b) GVD for holey fibers with d/Λ = 0.28, 0.3, 0.32, and 0.35 in order of increasing GVD at a wavelength of 1.4 µm for Λ = 2.3 µm. Both waveguide and material dispersion have been included [16].
(a) (b)
2.4.3 Nonlinearity of holey fiber
Due to the tightly confined optical mode, small core, HFs with a high air-fill-fraction in the
cladding naturally have tightly confined optical mode, and hence a high effective nonlinearity,
)/()2( 2 effAn λπγ = . Further increases in fiber nonlinearity should be achievable using fibers
made of other glasses, such as the Chalcogenides [26], which have around two orders of
magnitude higher nonlinear optical coefficient compared to silica. Recently researchers at the
ORC produced the first results in this direction and demonstrated a HF in SF57 lead glass with
γ = 550 W-1.km-1, approximately 500 times more nonlinear than conventional SMF28 fiber [23].
(The SF57 fiber shown in (b) was produced using the extrusion technique.) With the
continuing development of fibers fabricated from high nonlinearity glasses, and new HF
structures made possible by the extrusion technique, the field of HF research offers many
opportunities for developing future applications based on fiber technology.
Fig. 2.6
36
References 1. G. P. Agrawal, Nonlinear Fiber Optics, Academic Press (San Diego), 2nd (1995). 2. D. Gloge, "Weakly Guiding Fibers," Applied Optics 10, 2252-2258 (1971). 3. I. P. Kaminow, "Polarization in Optical Fibers," IEEE Journal of Quantum Electronics
17, 15-22 (1981). 4. M. A. Duguay and J. W. Hansen, "An Ultrafast Light Gate," Applied Physics Letters
15, 192-194 (1969). 5. M. E. Fermann, "Ultrashort-Pulse Sources Based on Single-Mode Rare-Earth-Doped
Fibers," Applied Physics B-Lasers and Optics 58, 197-209 (1994). 6. R. H. Stolen, J. P. Gordon, W. J. Tomlinson and H. A. Haus, "Raman Response
Function of Silica-Core Fibers," Journal of the Optical Society of America B-Optical Physics 6, 1159-1166 (1989).
7. J. P. Gordon, "Theory of the soliton self-frequency shift," Optics Letters 11, 662-664 (1986).
8. R. G. Smith, "Optical power handling capacity of low loss optical fibers as determined by stimulated Raman and Brillouin scattering," Applied Optics 11, 2489 - 2494 (1972).
9. R. H. Stolen and A. M. Johnson, "The Effect of Pulse Walkoff on Stimulated Raman-Scattering in Fibers," IEEE Journal of Quantum Electronics 22, 2154-2160 (1986).
10. O. Svelto, Principles of Lasers, Kluwer Academic / Plenum Publishers (New York), 2nd Edition (1998).
11. R. Paschotta, J. Nilsson, A. C. Tropper and D. C. Hanna, "Ytterbium-doped fiber amplifiers," IEEE Journal of Quantum Electronics 33, 1049-1056 (1997).
12. H. M. Pask, R. J. Carman, D. C. Hanna, A. C. Tropper, C. J. Mackechnie, P. R. Barber and J. M. Dawes, "Ytterbium-Doped Silica Fiber Lasers - Versatile Sources for the 1-1.2 micron Region," IEEE Journal of Selected Topics in Quantum Electronics 1, 2-13 (1995).
13. M. J. Weber, J. E. Lynch, D. H. Blackburn and D. J. Cronin, "Dependence of the Stimulated-Emission Cross-Section of Yb3+ on Host Glass Composition," IEEE Journal of Quantum Electronics 19, 1600-1608 (1983).
14. H. Takebe, T. Murata and K. Morinaga, "Compositional dependence of absorption and fluorescence of Yb in oxide glasses," Journal of the American Ceramic Society 79, 681-687 (1996).
15. J. C. Knight, T. A. Birks, P. St.J.Russell and D. M. Atkin, "All-silica single-mode optical fiber with photonic crystal cladding: Errata," Optics Letters 22, 484-485 (1997).
16. T. M. Monro, D. J. Richardson, N. G. R. Broderick and P. J. Bennett, "Holey optical fibers: An efficient modal model," Journal of Lightwave Technology 17, 1093-1102 (1999).
17. J. C. Knight, J. Arriaga, T. A. Birks, A. Ortigosa-Blanch, W. J. Wadsworth and P. St.J.Russell, "Anomalous dispersion in photonic crystal fiber," IEEE Photonics Technology Letters 12, 807-809 (2000).
18. R. Holzwarth, T. Udem, T. W. Hansch, J. C. Knight, W. J. Wadsworth and P. St.J.Russell, "Optical frequency synthesizer for precision spectroscopy," Physical Review Letters 85, 2264-2267 (2000).
19. D. J. Jones, S. A. Diddams, J. K. Ranka, A. Stentz, R. S. Windeler, J. L. Hall and S. T. Cundiff, "Carrier-envelope phase control of femtosecond mode-locked lasers and direct optical frequency synthesis," Science 288, 635-639 (2000).
37

38
20. J. H. Lee, Z. Yusoff, W. Belardi, M. Ibsen, T. M. Monro and D. J. Richardson, "Investigation of Brillouin effects in small-core holey optical fiber: lasing and scattering," Optics Letters 27, 927-929 (2002).
21. Z. Yusoff, J. H. Lee, W. Belardi, T. M. Monro, P. C. Teh and D. J. Richardson, "Raman effects in a highly nonlinear holey fiber: amplification and modulation," Optics Letters 27, 424-426 (2002).
22. T. A. Birks, J. C. Knight and P. S. Russell, "Endlessly single-mode photonic crystal fiber," Optics Letters 22, 961-963 (1997).
23. T. M. Monro, M. Kiang, J. H. Lee, K. Frampton, Z. Yusoff, R. C. Moore, J. A. Tucknott, D. W. Hewak, H. N. Rutt and D. J. Richardson, "High nonlinearity extruded single-mode holey optical fibers," Proc. Optical Fiber Communications Conference (OFC 2002), (March, 2002).
24. W. J. Wadsworth, J. C. Knight, A. Ortigosa-Blanch, J. Arriaga, E. Silvestre and P. St.J.Russell, "Soliton effects in photonic crystal fibres at 850 nm," Electronics Letters 36, 53-55 (2000).
25. J. H. Price, K. Furusawa, T. M. Monro, L. Lefort and D. J. Richardson, "A tuneable, femtosecond pulse source operating in the range 1.06-1.33 microns based on an Yb doped holey fiber amplifier," Conference on Lasers and Electro Optics (CLEO), Vol. 56 of OSA Trends in Optics and Photonics Series (Optical Society of America, Washington, D.C., 2001) paper CPD1 (2001).
26. T. M. Monro, Y. D. West, D. W. Hewak, N. G. R. Broderick and D. J. Richardson, "Chalcogenide holey fibres," Electronics Letters 36, 1998-2000 (2000).
Chapter 3 Yb fiber based pulse sources
3.1 Introduction
There are a wide variety of new and rapidly emerging applications that rely on high peak
powers and femtosecond interaction times, e.g. two-photon absorption microscopy, materials
processing, and supercontinuum generation in small core HFs. Despite the proven capabilities
of solid state laser systems, there are significant intrinsic limitations on the long-term stability,
compactness and cost of such systems, which hampers the successful implementation of the
emerging practical applications of ultrafast technology. Developing compact and robust sources
of high energy femtosecond pulses has therefore generated strong research interest, and fiber
based sources in particular, have developed rapidly during the past ten years. Optical fibers are
intrinsically robust and compact components because they are waveguides and they are suitable
for high average power applications because their geometry leads to efficient heat dissipation
[1].
This chapter presents a summary of results previously reported from fiber based systems.
The principal outstanding areas for further research are then described, followed by an overview
of the industrially-sponsored CPA system development (the detailed development work is
presented in Chapters 4 – 8).
3.2 Summary of related research
The fiber laser was first demonstrated by Elias Snitzer in 1963 using Neodymium (Nd)-doped
fiber operating at 1.06 µm. After much development, the first commercial fiber devices
appeared in the late 1980s. These lasers used single-mode diode pumping, emitted a few tens of
milliwatts, and attracted users because of their large gains and the feasibility of single mode CW
lasing for many transitions of rare-earth ions that are not readily achievable in the more-usual
crystal-laser version. The most well-known application of fiber-laser technology is in 1550 nm
Er-doped fiber amplifiers used in telecommunications.
Cladding-pumped fiber, which was first proposed in 1974, allows the efficient conversion of
multimode output radiation from high power, low cost, broad-stripe semiconductor laser diodes
into the single-mode emission of fiber lasers [2-4]. More than 110 W has been obtained from a
single mode CW Yb-fiber laser [5], and power of up to 6 kW has been demonstrated from a
39
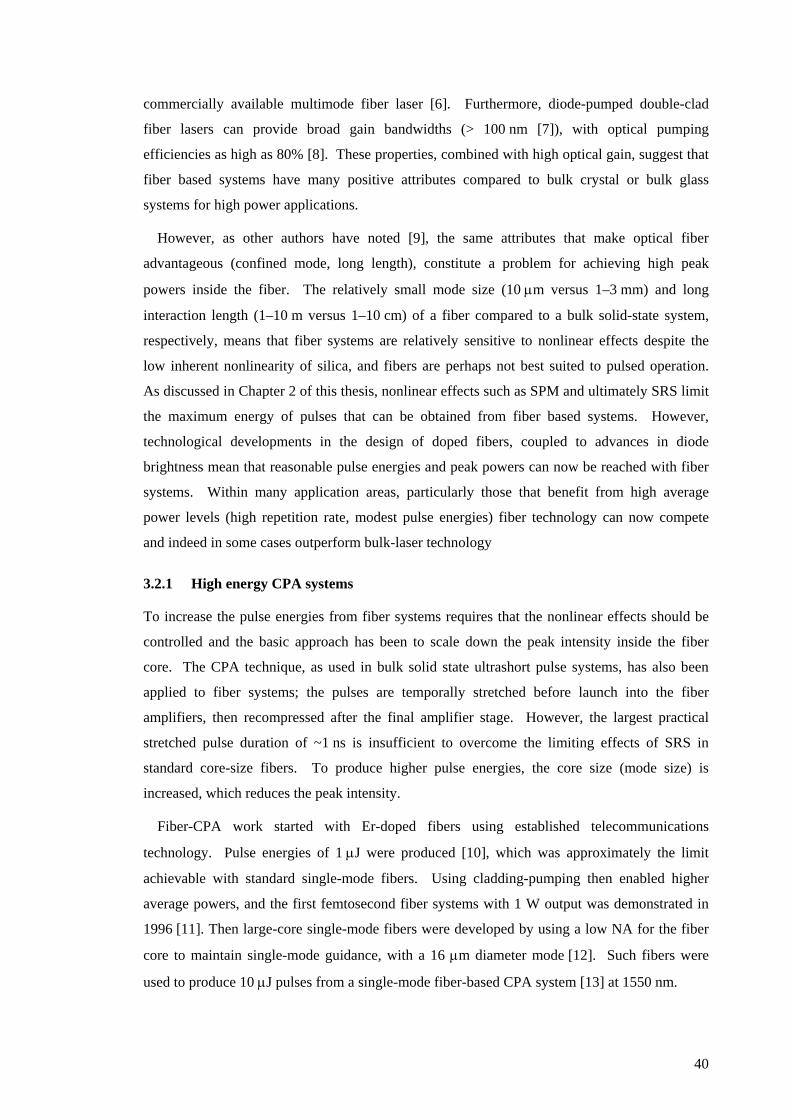
commercially available multimode fiber laser [6]. Furthermore, diode-pumped double-clad
fiber lasers can provide broad gain bandwidths (> 100 nm [7]), with optical pumping
efficiencies as high as 80% [8]. These properties, combined with high optical gain, suggest that
fiber based systems have many positive attributes compared to bulk crystal or bulk glass
systems for high power applications.
However, as other authors have noted [9], the same attributes that make optical fiber
advantageous (confined mode, long length), constitute a problem for achieving high peak
powers inside the fiber. The relatively small mode size (10 µm versus 1–3 mm) and long
interaction length (1–10 m versus 1–10 cm) of a fiber compared to a bulk solid-state system,
respectively, means that fiber systems are relatively sensitive to nonlinear effects despite the
low inherent nonlinearity of silica, and fibers are perhaps not best suited to pulsed operation.
As discussed in Chapter 2 of this thesis, nonlinear effects such as SPM and ultimately SRS limit
the maximum energy of pulses that can be obtained from fiber based systems. However,
technological developments in the design of doped fibers, coupled to advances in diode
brightness mean that reasonable pulse energies and peak powers can now be reached with fiber
systems. Within many application areas, particularly those that benefit from high average
power levels (high repetition rate, modest pulse energies) fiber technology can now compete
and indeed in some cases outperform bulk-laser technology
3.2.1 High energy CPA systems
To increase the pulse energies from fiber systems requires that the nonlinear effects should be
controlled and the basic approach has been to scale down the peak intensity inside the fiber
core. The CPA technique, as used in bulk solid state ultrashort pulse systems, has also been
applied to fiber systems; the pulses are temporally stretched before launch into the fiber
amplifiers, then recompressed after the final amplifier stage. However, the largest practical
stretched pulse duration of ~1 ns is insufficient to overcome the limiting effects of SRS in
standard core-size fibers. To produce higher pulse energies, the core size (mode size) is
increased, which reduces the peak intensity.
Fiber-CPA work started with Er-doped fibers using established telecommunications
technology. Pulse energies of 1 µJ were produced [10], which was approximately the limit
achievable with standard single-mode fibers. Using cladding-pumping then enabled higher
average powers, and the first femtosecond fiber systems with 1 W output was demonstrated in
1996 [11]. Then large-core single-mode fibers were developed by using a low NA for the fiber
core to maintain single-mode guidance, with a 16 µm diameter mode [12]. Such fibers were
used to produce 10 µJ pulses from a single-mode fiber-based CPA system [13] at 1550 nm.
40
The experimental arrangement of a typical fiber-based CPA system is shown in . In
1997 [14], the system was the first fiber-based setup to produce 100 µJ picosecond pulses. The
system is described in some detail because it demonstrates the various components that are
necessary in order to obtain high energy pulses. Due to the tightly confined mode in a fiber
amplifier, amplified spontaneous emission (ASE) build-up limits the maximum gain that is
possible from a single amplifier to ~35-40 dB. The experiment required 50–60 dB total gain for
boosting pulse energies from an initial 0.1–1 nJ to 100 µJ and therefore used an amplifier
cascade to achieve the required gain. The system comprised a femtosecond fiber oscillator, a
bulk-grating based pulse stretcher and a compressor, and three main amplifier stages (a fourth
pre-amplifier is not shown). Acousto-optic modulators (AOMs) between the amplification
stages were used as optical gates, allowing control of the pulse repetition rate down to the kHz
range required for achieving maximum pulse energies compared to the MHz repetition rate of
the mode-locked oscillator. AOM time gates also prevented cascaded ASE build-up due to the
feedback between different amplification stages (in a high repetition rate system, optical
isolators would be necessary).
Fig. 3.1
Fig. 3.1 Typical fiber based CPA setup. (System illustrated is based Er/Yb-doped 30 micron core fiber for the final amplifier. From [14]].]. )
The increase in pulse energy was enabled by using a larger core fiber. The final amplifier
was double-clad Er/Yb-fiber, with a 200 µm cladding and a 30 µm core, and 1.5 m in length.
This fiber was heavily doped in order to achieve maximum gain in a short fiber length. The
maximum pulse energy of 250 µJ (before compressor) was reached at repetition rates below
1 kHz. The average output power at high repetition rates was up to 1.2 W. After
recompression, pulse energies of up to 100 µJ were achieved, with a pulse duration of 0.7 ps.
41
The output beam had measured M2 ~1.5 and so was approximately single mode. The core was
multimode, but single mode output was obtained by using launch from a single-mode source
that was carefully aligned such that only the fundamental mode of the fiber was excited at the
input and by using a short fiber length to avoid mode-mixing.
Until this point, all fiber-based CPA development had used Er-fiber as the gain medium.
However, Yb-doped silica fiber, with its broad gain bandwidth, high optical conversion
efficiency and large saturation fluence [15, 16], represents an extremely attractive medium for
both the generation [17, 18] and subsequent amplification of ultra short optical pulses. Two
main advantages of Yb-doped over Er-doped fibers are the significantly broader amplification
bandwidth (50–100 nm compared to 10–30 nm) and significantly higher optical pumping
efficiencies (60–80% compared to 30–40%). In addition, the maximum achievable active-ion
concentrations in the Yb-doped fiber core can be significantly higher than for Er-doping, thus
enabling very high optical gain in a relatively short fiber length. In 1998, a commercial sponsor
entered into negotiation with Professor Richardson to develop an Yb-fiber based CPA system.
Professor Richardson had previously demonstrated an Yb-fiber mode-locked oscillator [17], and
the ORC was a leading research group in field of Yb-fiber fabrication and applications [15, 16].
The negotiations resulted in a contract to develop a compact, all Yb-fiber, CPA system.
Since the contract with Professor Richardson was negotiated, several other research groups
have also recognised and demonstrated the advantages of Yb-fiber for high power pulsed
applications, and this parallel work is reviewed here for completeness. Results were presented
at CLEO 2000 demonstrating 100 µJ, femtosecond pulses [19]. This Yb-fiber CPA system
produced pulses at 1050 nm using a 25 µm core fiber for the final amplifier. Due to higher
pumping efficiencies (compared to Er-fiber systems), average output powers up to 5.5 W at 1
MHz, were obtained (before recompression), and the broad amplification bandwidth provided
pulses as short as 220 fs, compared to the 500–700 fs typical from previous Er-fiber CPA
systems. (Mode-quality results were not presented.) Further progress was reported in 2001 [20]
with the demonstration of pulse energies up to 1.2 mJ at a repetition rate of 1667 Hz using an
experimental arrangement similar to that shown in , including the use of a bulk-grating
based pulse stretcher. The seed-pulse source was comprised of a stretched-pulse Er-fiber mode-
locked oscillator operating at 1550 nm, followed by a length of single mode fiber used to
frequency-shift the pulses to ~2.1 µm (using SSFS), then a chirped periodically poled Lithium
Niobate (PPLN) frequency doubling crystal to convert the wavelength to 1050 nm and finally a
Yb-fiber pre-amplifier was used to increase the seed average power to 330 mW at a 50 MHz
repetition rate. The seed pulse bandwidth was 20 nm, and the pulses were linearly chirped with
2 ps duration [21]. A 2.6 m length of double-clad fiber with 50 µm diameter core, and 350 µm
inner cladding diameter (NA~0.4) was used for the final amplifier and was pumped with a 20W
Fig. 3.1
42

diode laser array. The pump for the final amplifier was counter propagated with respect to the
signal, which reduced the effective propagation length. The measured output-beam mode
profile was M2 ~1.16. The final 1.2 mJ recompressed pulses had duration of 380 fs. The
maximum pulse energy was limited by the onset of SRS.
3.2.2 High average power systems
In contrast to the high energy pulses at low repetition rates discussed above, there has been
parallel research interest in developing fiber systems suitable for applications that require high
average powers at high repetition rates. For example, material processing speeds may be
increased; synchronously pumped OPO cavities could be made more compact at higher
repetition rates, and in spectroscopy, data acquisition rates or statistical accuracy could be aided
by higher repetition rates. A high average power CPA system with up to four amplifier stages,
and using time-gating between the amplifier stages to obtain variable repetition rates has been
demonstrated [22]. The seed oscillator was a mode-locked Nd:glass solid-state laser and
produced 1.2 nJ pulses at a repetition rate of 82 MHz. The maximum average power achieved
was ~22 W at 1 MHz (fiber core diameter = 55 µm, M2=7), and at a lower repetition rate of
32 kHz, pulse energies of 100 µJ (average power ~3.2 W) were achieved (fiber core diameter =
11 µm, M2=1.7).
However, it has also been demonstrated that much simpler system designs can produce high
average power ultrashort pulses if the required maximum pulse energy is somewhat lower. The
comparative simplicity of high average power systems is because with lower pulse energies,
they require lower total gain compared to a high energy CPA system and so use significantly
shorter stretched-pulse durations while still providing suitable management of nonlinear effects.
The fiber dispersion is an important consideration for direct amplification systems. Standard
silica fiber has normal dispersion at wavelengths appropriate for Yb-fiber systems at (1 µm),
and the action of nonlinear effects (SPM) is to further increase the pulse broadening caused by
dispersion. It has been shown that by carefully selecting a suitable combination of fiber core
diameter and fiber length, that the combined effects of SPM and GVD can produce pulses with
a linear chirp [23], which facilitates compression with a diffraction grating pair. (This effect has
been used with passive fiber for pulse compression [24].) It has been demonstrated
experimentally and numerically, and most recently analytically (asymptotic solution) [25, 26]
that pulses in a fiber amplifier (i.e. experiencing gain) can develop a parabolic temporal and
spectral profile with a highly linear chirp after sufficient propagation distance. The rate of
convergence to the asymptotic form depends on the input pulse profile in comparison with the
asymptotic pulse profile. These so-called “parabolic” pulses have been recompressed to <100 fs
durations [25], and 125 fs duration recompressed pulses have been demonstrated at an average
43
power of 17 W (75 MHz) [27]. At a wavelength of ~ 1.5 µm, standard telecommunications
fiber has anomalous dispersion, and the maximum pulse energy is then limited by soliton
formation or modulation instability. Therefore Er-fiber based systems are unsuitable for direct
amplification systems. Dispersion shifted fiber (DSF) can have normal dispersion at
wavelengths suitable for Er-doped fiber amplifiers. However, the very low dispersion value
could result in rather short pulse durations and hence low SRS threshold pulse energies. In
addition, DSF has a small core which is again unsuitable for high power applications.
The experimental arrangement for a high repetition rate direct amplification system is
simplified compared to that of a fiber based CPA system, because typically one amplifier stage
is used and the pulse stretcher is omitted. Time-gating is not required in a high repetition rate
system, so AOMs are not required before the amplifier and coupling losses are reduced.
Although a diffraction grating compressor is still required at the system output in order to
compensate for the linear chirp of the pulses, the compressor is more compact in comparison to
a CPA system due to the dramatically reduced stretched pulse duration. Overall, the direct
amplification systems can provide high average power, yet are simpler, lower loss, and more
compact, compared to CPA based systems.
3.3 Remaining technological challenges
The above review considered the impressive results so-far obtained from fiber based CPA and
direct amplification systems. However, there remain several technical challenges to be
addressed before truly compact, practical, straightforward to manufacture systems can be
produced for wide application. Yb-doped fiber appears now to be the preferred gain medium
for both high pulse energy and high average power sources. The first technical challenge is
therefore to produce a practical ultrashort seed oscillator at 1 µm. Existing oscillators are either
based on bulk Yb crystals (e.g. product from “TimeBandwidth”), which results in a cavity that
can be costly to manufacture and requires precise alignment, or (e.g. product from “IMRA”) use
complex multi-stage systems (start with Er-fiber oscillator, then use the soliton self-frequency-
shift to tune the pulses to 2.1 µm, followed by frequency doubling in PPLN to generate pulses at
1.05 µm [21]). Professor Richardson’s research started to address this challenge with the
development of an Yb-fiber oscillator in 1997 [17], but despite good performance (~65 fs
pulses), the laser was Ti:sapphire pumped, and employed a complex cavity. This thesis
describes (Chapter 4) our development of a much more practical, robust, and very stable diode-
pumped Yb-fiber oscillator. This oscillator is now commercially available through Positive
Light Inc., and initial sales have been made [18, 28, 29].
44
Another outstanding challenge is to develop compact stretcher/compressor technologies. The
conventional fiber CPA layout is to use diffraction-grating based stretchers and compressors,
which are typically large and require careful alignment. For applications which require a
frequency doubled output, chirped quasi-phase matching gratings may be appropriate [30].
Alternatively, chirped fiber Bragg gratings (CFBGs) are highly dispersive and can provide
suitable time delays in only centimetre lengths of fiber. Indeed, Neil Broderick et al. at the
ORC have demonstrated 4-ps pulses with energy of 0.9 µJ using CFBG stretcher and
compressor gratings in an all fiber CPA system based on large mode area (LMA) fiber
components [31]. The principal limit on the use of CFBGs is that due to the high peak power in
the compressor (~100 MW for 50 µJ, 500 fs recompressed pulses), the nonlinearity of the
grating fiber degrades the pulse quality. A bulk-grating based compressor is therefore required
for high energy CPA systems, but it is still possible to use a CFBG stretcher.
Both 2nd order (GDD) and 3rd order dispersion of a bulk-grating compressor are proportional
to the grating separation [32]. Therefore, using a long (~0.3 ns) stretched pulse duration that
requires large GDD, also adds large 3rd order dispersion. For recompressed pulse durations
<500 fs, uncompensated 3rd order dispersion would result in a significant pedestal on the
recompressed pulse. CFBGs incorporating both 2nd and 3rd order dispersion compensation have
not previously been reported in CPA systems at 1 µm, and the development of a CFBG pulse
stretcher with both the correct 2nd and 3rd order dispersion to compensate for the bulk-grating
compressor is presented in Chapter 5 of this thesis. The CFBG was fabricated using the
uniquely flexible CFBG writing technology developed at the ORC [33]. Using the CFBG
stretcher should provide a robust, compact, and alignment-free stretcher. As an alternative
technology, single mode fiber was also considered for the stretcher, but because fiber has the
same sign of 3rd order dispersion as the bulk grating compressor, it is unsuitable for CPA
systems producing <500 fs pulses.
In our CPA and direct amplification systems described in Chapters 3-8, we have included a
fiberised, 3 GHz bandwidth, electro-optic modulator (EOM) (phase modulator with a LiNbO3
crystal in one arm) to select single pulses from the 50 MHz pulse train from the mode-locked
oscillator. An EOM has several advantages compared to using an AOM for pulse selection.
First, an EOM can easily accommodate repetition rates above 1 GHz, whereas an AOM has a
maximum repetition rate of ~50MHz (due to the slow rise time of the acoustic wave), and it is
typically necessary to sacrifice AOM diffraction efficiency in order to achieve operation above
~20MHz. Second, our EOM has a 50 dB extinction ratio, compared to a typical extinction ratio
of ~ 30dB for an AOM. In addition, if the amplification system were reconfigured to produce
longer pulses by temporally slicing from a CW laser source, the EOM would enable <1 ns
45

pulses to be produced, compared to >20 ns pulses if an AOM were used. Moreover, the EOM
would also enable pulse generation at higher repetition rates.
While direct amplification systems are attractive for high average power applications, at the
time of writing, such systems have only been demonstrated using a single amplifier stage. This
restricts the maximum gain to <35 dB, which, depending on the pulse energy from the initial
source, could restrict the maximum output pulse energy to below that required for certain
applications. To avoid this restriction, further research using direct amplification systems, with
more than one amplification stage, would be interesting. In addition, it may be useful to use
time gating in order to introduce the flexibility of a variable repetition rate, both to suit the
requirements of possible applications, and in order to demonstrate the ultimate pulse energies
that might be possible from such systems. SRS will limit the maximum energy, but as with
CPA systems, pulse energy can be increased by enlarging the fiber core size. The results from
an investigation of a direct amplification system using cascaded amplifiers are presented in
Chapter 8 of this thesis.
3.4 Overview of CPA and direct amplification system
3.4.1 Background
The agreed target specification for our CPA system was for pulses with duration ~500 fs, energy
10-50 µJ, and average power ~500 mW (repetition rate ~ 50 kHz). When the scope of the
research was being agreed, there had been no published reports of Yb-fiber based amplifier
short pulse systems, and the target pulse peak powers were higher than those reported from
existing fiber based research (i.e. the system specification represented the state-of the art,
although results demonstrating pulse energy >1 mJ have since been reported by other
researchers using a less compact and commercially practical system). The work developing this
industrially funded system formed a large proportion of this PhD thesis and is described in
Chapters 3-7.
We note that the initial industrial contract specified a very demanding development timetable.
As a result, it was not always possible to perform as detailed a characterisation of the individual
system components as would have been desirable and on occasion, initially unpromising results
were not followed up with more extensive research efforts. Our approach was rewarded by the
rapid development of a highly-stable oscillator, which has since been commercialised, and has
also been used to seed several of the experiments reported in this thesis. In combination with
the amplifier cascade, the system has also been used to pump a femtosecond OPO.
46

3.4.2 Detailed system configuration
A schematic representation of the industrially funded CPA system is shown in Fig. 3.2. To
address the outstanding technological challenges described above, the agreed research approach
was to develop a passively mode-locked Yb-fiber-based oscillator to produce ~100 fs pulses to
be used as a seed for a fiber amplifier cascade. As with previously reported fiber systems, a
multi-stage amplifier design was necessary because ASE limits the gain from a single fiber
amplifier to ~30-35 dB [34]. The system incorporated a high extinction ratio (>50 dB) EOM for
pulse selection; and used a CFBG pulse stretcher. ASE build-up was prevented by
incorporating isolators and AOM time gating (synchronised to the arrival of each pulse)
between amplifier stages. These additional components created coupling losses (total ~20 dB).
We required ~60 dB net gain in order to obtain pulses with an energy of ~50 µJ from our
oscillator, and it was expected that a cascade of three amplifiers would be necessary to produce
the required gain, and reasonable overall noise performance. The subsequent oscillator
development (Chapter 4) resulted in a stable oscillator with output pulse energy ~50 pJ, which
confirmed that three amplifiers would be required.
The desire to obtain a robust and straightforward-to-manufacture system would suggest that
core-pumping would be the preferred approach. High-brightness pig-tailed pump diodes,
spliced directly to WDM couplers, and then to the Yb-doped fiber gain medium, would create
an integrated fiber system. However, the core-pumping approach has limited scope for power-
scaling, e.g. the maximum available power from reliable pigtailed diodes is ~350 mW, which is
below the output power required from the CPA system. Cladding pumping was therefore
necessary for the final amplifier stage and possibly for the penultimate amplifier. Cladding
pumping has the advantage of using less expensive, low brightness pump diodes. It was
decided that the best aspects of both pumping technologies could be exploited by developing a
core-pumped oscillator and at least one core-pumped pre-amplifier, followed by a
cladding-pumped power amplifier. However, selecting a suitable operating wavelength to
successfully integrate these two technologies in the quasi-three level Yb system is challenging.
Fig. 3.2. Schematic of the CPA system
Pre- amp
AOM AOM
Power-amp
Pre- amp
CFBG
Oscillator Pulse selector
47
The emission cross section of 975 nm pumped, Yb-doped silica fiber is peaked at 1030 nm
(see Chapter 2). The absorption cross section is highest at wavelengths below ~1030 nm and
decreases more rapidly than the emission cross section at longer wavelengths e.g. 1060 nm.
Therefore, high pump intensity can lead to peak gain at wavelengths close to 1030 nm, whereas
lower pump intensities result in gain at wavelengths >1070 nm. Core-pumped amplifiers result
in very high pump-intensities due to ~100% overlap fraction of pump and doped region (doping
is typically confined to the core), which tends to favour peak Yb gain at 1020-1040 nm. If
necessary, the gain can be extended to ~1050-1060 nm by using a longer fiber length because
the Yb gain at 1060 nm can be pumped by re-absorbed 1030 nm ASE. In contrast, cladding-
pumped amplifiers result in much lower pump intensities due to reduced pump overlap with the
doped-region (core). Low pump intensity creates peak Yb gain at 1070-1100 nm. In addition,
relatively long fiber lengths are needed to fully absorb the pump, and thus create an efficient
amplifier, which again favours operation at long wavelengths due to reabsorption of short
wavelength ASE. Shorter fiber lengths are not ideal because they can reduce the amplifier
efficiency. Pumping at the 976 nm Yb-absorption peak assists in obtaining the most rapid pump
absorption in short fiber lengths, and therefore pushes the gain towards shorter wavelengths. In
a pulsed system, use of the shortest possible fiber length also minimises detrimental nonlinear
interactions. The gain at 1040-1070 nm is also increased by using a lower cladding: core area
ratio (big core, small cladding) to create higher pump intensities. The difference between the
optimally efficient operating wavelengths of core-pumped and cladding-pumped amplifiers
suggested that a central wavelength of ~1050-1060 nm would enable most effective integration
of the two technologies within the CPA system. This wavelength window became the design
specification for the system, and since the system operating wavelength is determined by the
oscillator wavelength, this was an important specification for the oscillator. The final system
comprised a cascade of two core-pumped pre-amplifiers and a LMA quasi-single mode
cladding-pumped fiber for the final stage power amplifier.
Obtaining ultrashort (<500 fs) pulses at the system output required careful consideration of
the combined effects of group velocity dispersion and nonlinear processes (SPM and SRS) that
would distort the pulse due to the high peak powers at the system output. SPM can produce a
strongly nonlinear chirp such that the recompressed pulse exhibits a broad pedestal containing
much of the pulse energy. Avoiding such nonlinear broadening limits the maximum achievable
pulse energy from a fiber-based system, and in order to increase the pulse energy at which
nonlinear distortion arises, we used two techniques which reduced the peak intensity within the
amplifiers. We use the CPA technique to temporally stretch the initial pulse. The maximum
stretched pulse duration is limited by the size of the bulk-grating compressor (grating size and
grating separation). To achieve a truly compact system, our industrial sponsor specified the
48
grating size (see Chapter 5 for details), which resulted in a maximum stretched pulse duration of
~0.3 ns for our system. With the stretched-pulse duration fixed by the compressor, the
maximum achievable pulse energy is limited by the onset of SRS in the final amplifier. Using
LMA fiber for the final amplifier, decreases the peak intensity (W/cm2) and therefore increases
the maximum achievable pulse energy that can be cleanly recompressed.
The detailed development work on this CPA system has formed a major part of this PhD
thesis research, and is described in the following chapters. Chapter 4 describes the design and
realisation of the passively mode-locked, diode-pumped, Yb-fiber laser. The development of
the grating stretcher and compressor are described in Chapter 5. Next, the amplifier
development is reported in Chapter 6. The overall performance of the CPA system is described
in Chapter 7. The practical implementation of directly amplifying the pulses from the oscillator,
without temporal stretching, to create a simplified high power source (based on the amplifiers
developed for the CPA system) has also been investigated. For this direct amplification system,
multiple amplifier stages were used in order to obtain higher gain than had been reported
previously from direct amplification – all previous reports have used a single amplifier stage.
The performance of the direct amplification system (without pulse stretching) is described in
Chapter 8.
49
References 1. M. K. Davis, M. J. F. Digonnet and R. H. Pantell, "Thermal effects in doped fibers,"
Journal of Lightwave Technology 16, 1013-1023 (1998). 2. Maurer, U.S. Patent 3,808,549 (April 30, 1974). 3. J. Kafka, U.S. Patent 4,829,529 (May 9, 1989). 4. E. Snitzer, H. Po, F. Hakimi, R. Tumminelli and B. C. McCollum, "Double Clad, Offset
Core Nd Fiber Laser," Proceedings, OFS conference, New Orleans Post-deadline paper PD5 (1988).
5. V. Dominick, S. MacCormack, R. Waarts, S. Sanders, S. Bicknese, R. Dohle, E. Wolak, P. S. Yeh and E. Zucker, "110W fiber laser," Electronics Letters 35, 1158-1160 (1999).
6. IPG Photonics press release, Dec16 2002 (http://www.ipgphotonics.com). 7. J. K. Sahu, C. C. Renaud, K. Furusawa, R. Selvas, J. A. Alvarez-Chavez, D. J.
Richardson and J. Nilsson, "Jacketed air-clad cladding pumped Ytterbium-doped fibre laser with wide tuning range," Electronics Letters 37, 1116-1117 (2001).
8. L. Goldberg, J. P. Koplow and D. A. V. Kliner, "Highly efficient 4-W Yb-doped fiber amplifier pumped by a broad-stripe laser diode," Optics Letters 24, 673-675 (1999).
9. A. Galvanauskas, "Mode-scalable fiber-based chirped pulse amplification systems," IEEE Journal of Selected Topics in Quantum Electronics 7, 504-517 (2001).
10. A. Galvanauskas, M. E. Fermann, P. Blixt, J. A. Tellefsen and D. Harter, "Hybrid Diode-Laser Fiber-Amplifier Source of High-Energy Ultrashort Pulses," Optics Letters 19, 1043-1045 (1994).
11. A. Galvanauskas, M. E. Fermann, D. Harter, J. D. Minelly, G. G. Vienne and J. E. Caplen, "Broad-area diode-pumped 1 W femtosecond fiber system," Tech. Dig. Conf. Lasers and Electro-Optics, Vol. 9, Washington DC, pp. 495-496 (1996).
12. D. Taverner, D. J. Richardson, L. Dong, J. E. Caplen, K. Williams and R. V. Penty, "158 µJ pulses from a single-transverse-mode, large-mode-area Erbium-doped fiber amplifier," Optics Letters 22, 378-380 (1997).
13. D. Taverner, A. Galvanauskas, D. Harter, D. J. Richardson and L. Dong, "Generation of high-energy pulses using a large-mode-area Erbium-doped fiber amplifier," Tech. Dig. Conf. Lasers and Electro-Optics, Vol. 9, Washington DC, pp. 496-497 (1996).
14. J. D. Minelly, A. Galvanauskas, D. Harter, J. E. Caplen and L. Dong, "Cladding-pumped fiber laser/amplifier system generating 100 micro-Joule energy picosecond pulses," Tech. Dig. Conf. Lasers and Electro-Optics, Vol. 11, Washington DC pp. 475-476 (1997).
15. H. M. Pask, R. J. Carman, D. C. Hanna, A. C. Tropper, C. J. Mackechnie, P. R. Barber and J. M. Dawes, "Ytterbium-Doped Silica Fiber Lasers - Versatile Sources for the 1-1.2 micron Region," IEEE Journal of Selected Topics in Quantum Electronics 1, 2-13 (1995).
16. R. Paschotta, J. Nilsson, A. C. Tropper and D. C. Hanna, "Ytterbium-doped fiber amplifiers," IEEE Journal of Quantum Electronics 33, 1049-1056 (1997).
17. V. Cautaerts, D. J. Richardson, R. Paschotta and D. C. Hanna, "Stretched pulse Yb3+ silica fiber laser," Optics Letters 22, 316-318 (1997).
18. J. H. Price, L. Lefort, D. J. Richardson, G. J. Spuhler, R. Paschotta, U. Keller, C. Barty, A. Fry and J. Weston, "A practical, low noise, stretched pulse Yb3+-doped fiber laser," Conference on Lasers and Electro-Optics (CLEO 2001), paper CTuQ6 (2001).
50
51
19. G. C. Cho, A. Galvanauskas, M. E. Fermann, M. L. Stock and D. Harter, "100 micro-Joule and 5.5 W Yb-fiber femtosecond chriped pulse amplifier system," Tech. Dig. Conf. Lasers and Electro-Optics, Washington DC, p. 118 (2000).
20. A. Galvanauskas, Z. Sartania and M. Bischoff, "Millijoule femtosecond fiber CPA system," in Advanced Solid-State Lasers, Proceedings, vol. 50, OSA Trends in Optics and Photonics, C. Marshall, Ed. Washington, 2001, pp. 679-681.
21. M. E. Fermann, A. Galvanauskas, M. L. Stock, K. K. Wong, D. Harter and L. Goldberg, "Ultrawide tunable Er soliton fiber laser amplified in Yb-doped fiber," Optics Letters 24, 1428-1430 (1999).
22. A. Liem, D. Nickel, J. Limpert, H. Zellmer, U. Griebner, S. Unger, A. Tünnermann and G. Korn, "High average power ultra-fast fiber chirped pulse amplification system," Applied Physics B-Lasers and Optics 71, 889-891 (2000).
23. D. Anderson, M. Desaix, M. Karlsson, M. Lisak and M. L. Quirogateixeiro, "Wave-Breaking-Free Pulses in Nonlinear-Optical Fibers," Journal of the Optical Society of America B-Optical Physics 10, 1185-1190 (1993).
24. G. P. Agrawal, Nonlinear Fiber Optics, Academic Press (San Diego), 2nd (1995). 25. M. E. Fermann, V. I. Kruglov, B. C. Thomsen, J. M. Dudley and J. D. Harvey, "Self-
similar propagation and amplification of parabolic pulses in optical fibers," Physical Review Letters 84, 6010-6013 (2000).
26. K. Tamura and M. Nakazawa, "Pulse compression by nonlinear pulse evolution with reduced optical wave breaking in Erbium-doped fiber amplifiers," Optics Letters 21, 68-70 (1996).
27. J. Limpert, T. Schreiber, T. Clausnitzer, K. Zollner, H. J. Fuchs, E. B. Kley, H. Zellmer and A. Tünnermann, "High-power femtosecond Yb-doped fiber amplifier," Optics Express 10, 628-638 (2002).
28. D. J. Richardson, J. Nilsson, L. Lefort, J. H. Price, A. Malinowski and M. Ibsen, "Pulsed Light Sources," U.S. Patent Application 10/146,219 (May 13, 2002).
29. L. Lefort, J. H. Price, D. J. Richardson, G. J. Spuhler, R. Paschotta, U. Keller, A. Fry and J. Weston, "Practical Low-Noise stretched-pulse Yb-doped fiber laser," Optics Letters 27, 291-293 (2002).
30. A. Galvanauskas, D. Harter, M. A. Arbore, M. H. Chou and M. M. Fejer, "Chirped-pulse amplification circuits for fiber amplifiers, based on chirped-period quasi-phase-matching gratings," Optics Letters 23, 1695-1697 (1998).
31. N. G. R. Broderick, D. J. Richardson, D. Taverner, J. E. Caplen, L. Dong and M. Ibsen, "High-power chirped-pulse all-fiber amplification system based on large-mode-area fiber gratings," Optics Letters 24, 566-568 (1999).
32. R. L. Fork, C. H. B. Cruz, P. C. Becker and C. V. Shank, "Compression of Optical Pulses to 6 femtoseconds by Using Cubic Phase Compensation," Optics Letters 12, 483-485 (1987).
33. M. Ibsen, M. K. Durkin, M. J. Cole, M. N. Zervas and R. I. Laming, "Recent Advances in Long Dispersion Compensating Fiber Bragg Gratings.," (IEE Colloquium on Optical Fiber Gratings) IEE, London, U.K. (1999).
34. B. Desthieux, R. I. Laming and D. N. Payne, "111 kW (0.5 mJ) Pulse Amplification at 1.5-microns Using a Gated Cascade of 3 Erbium-Doped Fiber Amplifiers," Applied Physics Letters 63, 586-588 (1993).
Chapter 4 Mode locked fiber laser
4.1 Introduction
This chapter describes the development of a compact, and highly stable stretched pulse laser
operating at 1.06 µm, based on Yb-doped fiber. As described in Chapter 3, the laser was
developed as a seed laser for a CPA system for an industrial sponsor. Important criteria were
that the laser should be compact, robust, and stable, and that it should have low noise operation.
We constructed the oscillator using a Fabry-Perot cavity design, with grating based dispersive
delay line [1, 2], and SESAM to initiate self-start mode locking [3]. The oscillator uses
nonlinear polarisation rotation switching to sustain mode-locking. The oscillator has robust,
reliable self start, single pulse, mode-locked operation with no Q-switching instabilities, with a
launched pump power of ~60 mW, and delivers ~30 pJ pulses that are compressible to ~110 fs
(54 MHz repetition rate; 2.5 mW average output power). The initial development work on the
oscillator was performed jointly with Dr. Laurent Lefort, a research fellow working in Professor
Richardson’s group during the early stages of the CPA project, and his contribution is gratefully
acknowledged.
The excellent performance (robust self-start operation with minimal (<0.05%) amplitude
jitter) of our research prototype, has since enabled us to perform several nonlinear optics
experiments using this source (e.g. see Chapters 9,10). The system stability is largely
attributable to the use of a grating-stabilised, telecommunications-qualified, 976 nm diode pump
laser. Pump coupling is both conveniently and reliably achieved using a 980nm/1054nm, fused-
tapered WDM coupler.
This chapter is structured as follows. Section 4.2 provides a review of previous mode-locked
fiber laser research and describes the operating principles of our laser. Section 4.3 provides a
description of the cavity. Section 4.4 discusses the characteristics of the Yb-doped fiber.
Section 4.5 describes the passive fiber components in the cavity and Section 4.6 describes
various SESAMs that we tested. The laser performance is described in Section 4.7, and Section
4.8 presents our conclusions.
52
4.2 Mode-locked fiber laser operating principles
Ultrashort pulse generation requires either an ultrafast switch, or an environment in which such
pulses are the most stable state. Ultrafast sources in the visible are typically based on bulk
crystal gain media, e.g. Ti:Sapphire, use Kerr lens mode locking as an ultrafast nonlinear
switch. An intra-cavity aperture results in relatively high losses for the large diameter CW
beam, whereas Kerr self-focussing of the high-intensity pulses reduces the beam diameter and
decreases the loss. However, such bulk-optics-based cavities require precise alignment and are
therefore difficult and expensive to construct. Previous work at a wavelength of 1.5 µm, has
demonstrated that the anomalous dispersion of standard single mode fiber produces modulation
instability for a CW beam, and hence initiates pulse formation. Ultrashort soliton pulses can be
supported by balancing the effects of GVD and SPM. The gain medium used at this wavelength
is Er-doped fiber, and this enables the use of established technology from the
telecommunications industry. Whilst modulation instability and soliton effects can generate
ultrashort pulses, the amplification that occurs every round trip leads to a background
continuum of wavelengths being produced that can destabilise the circulating soliton. Therefore
a filter or ultrafast switch is required, and the first soliton fiber lasers used a nonlinear loop
mirror fiber (uses SPM as the nonlinearity) as a fast saturable absorber in a figure of eight
cavity geometry [4-6]. Later work used a simpler ring cavity geometry with a nonlinear
polarisation evolution (NLPE) based fast saturable absorber (uses XPM as the nonlinearity) [7-
10]. The soliton power increases with the magnitude of the dispersion, so dispersion shifted
fiber (providing low total cavity round trip dispersion) has been used to encourage self-starting
at low powers. However, the maximum energy from soliton lasers was limited to very low
pulse energies by the generation of spectral side-bands that resulted in pulse instability and
breakup into multiple solitons.
A breakthrough came when, again at 1.5 µm, the group at MIT [11-13] demonstrated that
quasi-soliton operation was possible in a cavity with lumped sections of large positive and
negative dispersion, provided that the overall round trip dispersion was close to zero. (In fact,
the shortest pulses were obtained with small net normal dispersion.) In this “stretch-pulse”
configuration, the pulses broaden because of the excess GVD in one section of the cavity,
before being recompressed in the section of the cavity with opposite sign GVD. The dispersion
managed cavity idea leads to the possibility of using bulk optics for the anomalous dispersion
section, and so it was applicable to wavelengths below 1.3 µm, where conventional fiber has
normal dispersion. A passively mode-locked stretched pulse laser based on Nd-doped fiber was
previously reported in 1993 in a Fabry-Perot cavity with prism-based dispersive delay-line
(DDL) [14]. NLPE was used as a fast saturable absorber mechanism, and a SESAM was used
53
to induce self-start mode-locking [15]. Although the laser performance in terms of pulse
duration and quality seemed very good, no data was presented on system stability and
reliability. Moreover, this system was end-pumped with two polarisation-multiplexed 150 mW
laser diodes (808 nm), or with a Kr3+ laser (to obtain the shortest pulses), so the system was still
not practical for wide application.
Yb-doped silica fiber offers the advantage of broader gain bandwidth, and in 1996 Professor
Richardson’s group demonstrated the first mode-locked Yb-doped fiber oscillator [16]. A
unidirectional cavity design was used that incorporated an optical circulator arrangement and an
intracavity prism based DDL. NLPE in the fiber acted as the fast saturable absorber. The laser
exhibited good self-starting performance and generated ~65 fs pulses. However, the cavity was
large and complex and was pumped with a Ti:sapphire laser. There have also been a number of
reports of stretched-pulse lasers operating at 1 µm using high power broad-stripe pump diodes
and cladding pumped Yb or Nd-doped fiber. Cladding pumped fiber readily allows scaling of
the pulse energies achievable from diode-pumped cavities to the nJ regime, but high power
diode-pump sources are typically not stable against wavelength drift, and are noisier when
compared to the grating stabilised, high-brightness, single-mode diodes developed over many
years for core-pumping of erbium doped fiber amplifiers. Moreover, due to the reduced overlap
of the pump and signal fields in dual clad fibers, cladding pumped fiber lasers are ordinarily
much longer in length than core-pumped fiber laser. Cladding pumped lasers are thus
inherently likely to be far less stable than cavities based on core-pumped fiber.
For the new cavity design it was decided that Yb-fiber would be used for the gain medium.
To ensure low-noise operation, a grating stabilised telecommunications grade laser diode would
be the preferred pump laser, and using a pigtailed pump diode coupled to the Yb-fiber using a
WDM coupler would create an all fiber gain-unit. A Fabry-Perot design would enable a simple
and compact cavity to be constructed, in preference to the complex ring cavity used previously
[16]. However, in Fabry-Perot cavities the standing wave pattern of the electric field creates a
refractive-index grating in the gain medium which creates uneven frequency spacing between
cavity modes. This effect increases the threshold power at which mode-beating fluctuations
build up into a stable pulse i.e. increases the threshold power for self-start mode-locking [17].
We therefore decided to try incorporating a SESAM into the cavity to enable reliable self-start
mode-locking. A bulk grating or prism based dispersive delay line (DDL) would be used to
compensate for the normal disperison introduced by the fiber.
4.3 Description of the cavity
A photograph and schematic of our laser is shown in Fig. 4.1. The cavity contains a grating-
based intracavity dispersion compensator [1, 2], ~1.0 m of high-concentration, moderately
54
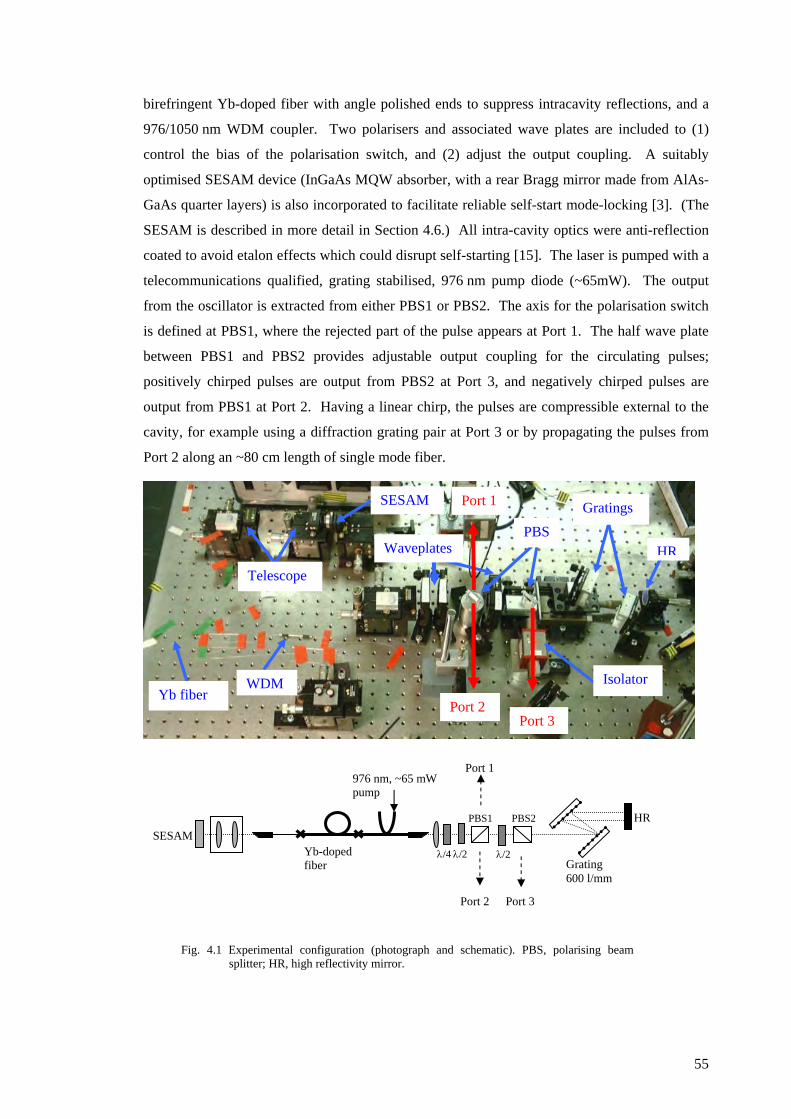
birefringent Yb-doped fiber with angle polished ends to suppress intracavity reflections, and a
976/1050 nm WDM coupler. Two polarisers and associated wave plates are included to (1)
control the bias of the polarisation switch, and (2) adjust the output coupling. A suitably
optimised SESAM device (InGaAs MQW absorber, with a rear Bragg mirror made from AlAs-
GaAs quarter layers) is also incorporated to facilitate reliable self-start mode-locking [3]. (The
SESAM is described in more detail in Section 4.6.) All intra-cavity optics were anti-reflection
coated to avoid etalon effects which could disrupt self-starting [15]. The laser is pumped with a
telecommunications qualified, grating stabilised, 976 nm pump diode (~65mW). The output
from the oscillator is extracted from either PBS1 or PBS2. The axis for the polarisation switch
is defined at PBS1, where the rejected part of the pulse appears at Port 1. The half wave plate
between PBS1 and PBS2 provides adjustable output coupling for the circulating pulses;
positively chirped pulses are output from PBS2 at Port 3, and negatively chirped pulses are
output from PBS1 at Port 2. Having a linear chirp, the pulses are compressible external to the
cavity, for example using a diffraction grating pair at Port 3 or by propagating the pulses from
Port 2 along an ~80 cm length of single mode fiber.
Fig. 4.1 Experimental configuration (photograph and schematic). PBS, polarising beam splitter; HR, high reflectivity mirror.
Waveplates
Telescope
Yb fiber
HR
Gratings
Isolator
Port 2 Port 3
Port 1
PBS
SESAM
WDM
λ/4
Grating 600 l/mm
976 nm, ~65 mW pump
λ/2 λ/2
PBS2PBS1
Yb-doped fiber
Port 1
SESAM HR
Port 2 Port 3
55
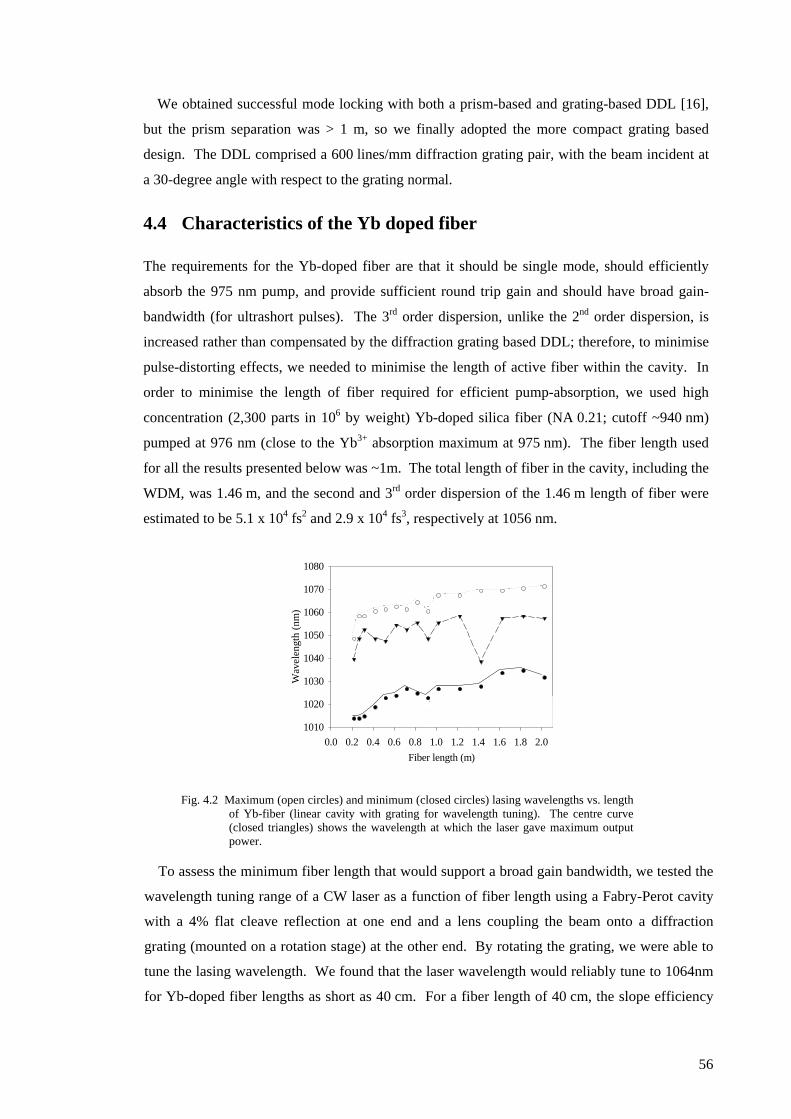
We obtained successful mode locking with both a prism-based and grating-based DDL [16],
but the prism separation was > 1 m, so we finally adopted the more compact grating based
design. The DDL comprised a 600 lines/mm diffraction grating pair, with the beam incident at
a 30-degree angle with respect to the grating normal.
4.4 Characteristics of the Yb doped fiber
The requirements for the Yb-doped fiber are that it should be single mode, should efficiently
absorb the 975 nm pump, and provide sufficient round trip gain and should have broad gain-
bandwidth (for ultrashort pulses). The 3rd order dispersion, unlike the 2nd order dispersion, is
increased rather than compensated by the diffraction grating based DDL; therefore, to minimise
pulse-distorting effects, we needed to minimise the length of active fiber within the cavity. In
order to minimise the length of fiber required for efficient pump-absorption, we used high
concentration (2,300 parts in 106 by weight) Yb-doped silica fiber (NA 0.21; cutoff ~940 nm)
pumped at 976 nm (close to the Yb3+ absorption maximum at 975 nm). The fiber length used
for all the results presented below was ~1m. The total length of fiber in the cavity, including the
WDM, was 1.46 m, and the second and 3rd order dispersion of the 1.46 m length of fiber were
estimated to be 5.1 x 10⁴ fs2 and 2.9 x 10⁴ fs3, respectively at 1056 nm.
Fig. 4.2 Maximum (open circles) and minimum (closed circles) lasing wavelengths vs. length of Yb-fiber (linear cavity with grating for wavelength tuning). The centre curve (closed triangles) shows the wavelength at which the laser gave maximum output power.
Fiber length (m)0.0 0.2 0.4 0.6 0.8 1.0 1.2 1.4 1.6 1.8 2.0
Wav
elen
gth
(nm
)
1010
1020
1030
1040
1050
1060
1070
1080
min. laser wavelengthmax. laser wavelengthwavelength for peak output power
To assess the minimum fiber length that would support a broad gain bandwidth, we tested the
wavelength tuning range of a CW laser as a function of fiber length using a Fabry-Perot cavity
with a 4% flat cleave reflection at one end and a lens coupling the beam onto a diffraction
grating (mounted on a rotation stage) at the other end. By rotating the grating, we were able to
tune the lasing wavelength. We found that the laser wavelength would reliably tune to 1064nm
for Yb-doped fiber lengths as short as 40 cm. For a fiber length of 40 cm, the slope efficiency
56
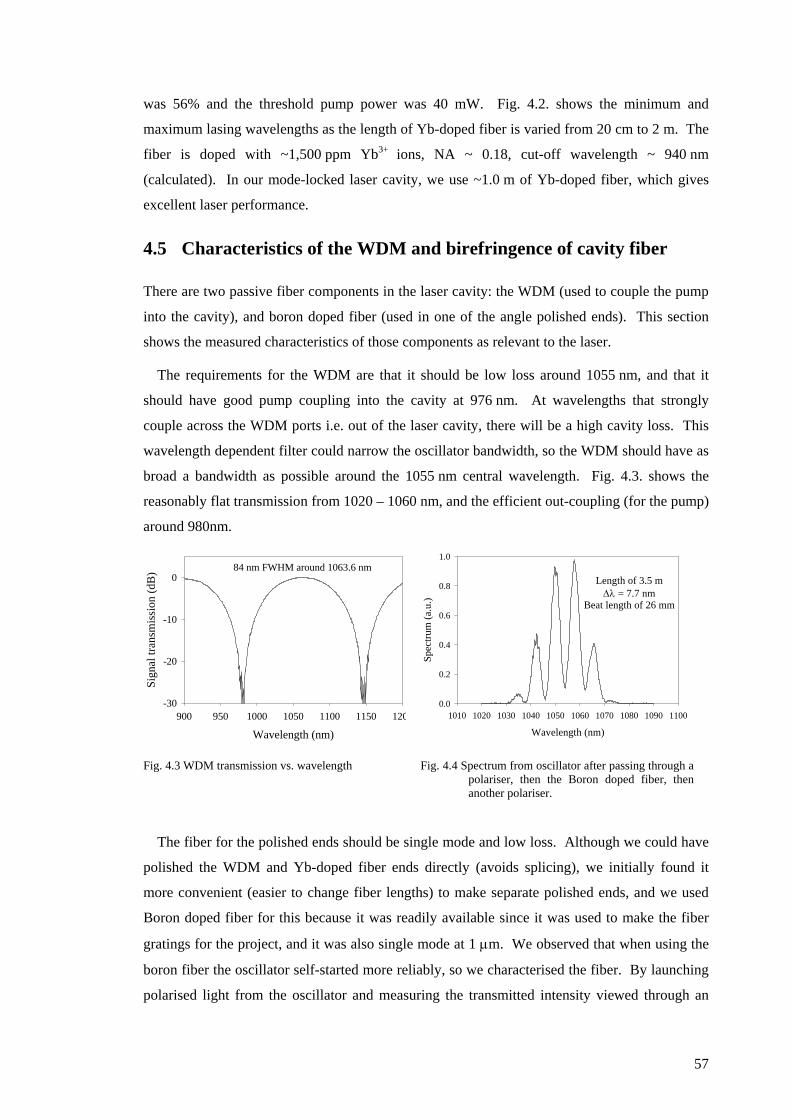
was 56% and the threshold pump power was 40 mW. Fig. 4.2. shows the minimum and
maximum lasing wavelengths as the length of Yb-doped fiber is varied from 20 cm to 2 m. The
fiber is doped with ~1,500 ppm Yb3+ ions, NA ~ 0.18, cut-off wavelength ~ 940 nm
(calculated). In our mode-locked laser cavity, we use ~1.0 m of Yb-doped fiber, which gives
excellent laser performance.
4.5 Characteristics of the WDM and birefringence of cavity fiber
There are two passive fiber components in the laser cavity: the WDM (used to couple the pump
into the cavity), and boron doped fiber (used in one of the angle polished ends). This section
shows the measured characteristics of those components as relevant to the laser.
The requirements for the WDM are that it should be low loss around 1055 nm, and that it
should have good pump coupling into the cavity at 976 nm. At wavelengths that strongly
couple across the WDM ports i.e. out of the laser cavity, there will be a high cavity loss. This
wavelength dependent filter could narrow the oscillator bandwidth, so the WDM should have as
broad a bandwidth as possible around the 1055 nm central wavelength. Fig. 4.3. shows the
reasonably flat transmission from 1020 – 1060 nm, and the efficient out-coupling (for the pump)
around 980nm.
Wavelength (nm)900 950 1000 1050 1100 1150 120
Sign
al tr
ansm
issi
on (d
B)
-30
-20
-10
084 nm FWHM around 1063.6 nm
Wavelength (nm)
1010 1020 1030 1040 1050 1060 1070 1080 1090 1100
Spec
trum
(a.u
.)
0.0
0.2
0.4
0.6
0.8
1.0
Length of 3.5 m∆λ = 7.7 nm
Beat length of 26 mm
Fig. 4.3 WDM transmission vs. wavelength
Fig. 4.4 Spectrum from oscillator after passing through a polariser, then the Boron doped fiber, then another polariser.
The fiber for the polished ends should be single mode and low loss. Although we could have
polished the WDM and Yb-doped fiber ends directly (avoids splicing), we initially found it
more convenient (easier to change fiber lengths) to make separate polished ends, and we used
Boron doped fiber for this because it was readily available since it was used to make the fiber
gratings for the project, and it was also single mode at 1 µm. We observed that when using the
boron fiber the oscillator self-started more reliably, so we characterised the fiber. By launching
polarised light from the oscillator and measuring the transmitted intensity viewed through an
57
analyser polariser, ( .) the fiber birefringence beatlength was measured to be 2.6 cm i.e.
significantly shorter than the 29.7 cm beatlength of the Yb-doped fiber (measured at a
wavelength of 1510 nm). We believe that the strong birefringence of the Boron fiber may assist
the nonlinear polarisation rotation switching since it provides more strongly defined fast and
slow axes for the orthogonal polarisation modes.
Fig. 4.4
4.6 Characteristics of the SESAM
To reduce the self-start threshold power, we incorporated a SESAM to initiate pulsed operation
[3]. The SESAM modulation depth has conflicting design requirements with regard to avoiding
Q-switching whilst providing sufficient modulation depth for our high loss cavity. The
tendency for SESAM induced Q-switched mode locking (laser output consists of mode locked
pulses underneath a Q-switched envelope) is avoided if the intracavity pulse energy exceeds a
critical value , described by following expression (derived by Professor Ursula Keller’s
group at ETH in Zurich) [18],
pE
( ) 2/1,,,, RAFAFE AeffAsatLeffLsatp ∆=
where ([ ) ]absemLsat hF σσν += 2, is the gain saturation fluence ( =νh photon energy),
is the SESAM saturation fluence, and and are the effective laser mode areas in the
gain medium and on the SESAM, respectively and
AsatF ,
LeffA , AeffA ,
R∆ is the modulation depth Therefore, the
critical energy to obtain CW-mode-locking increases with increasing modulation depth. In
contrast, we require a high modulation depth to provide a sufficient perturbation in our high loss
cavity.
It was not obvious which SESAM modulation depth would be the best for initiating robust
self start mode-locking with single pulse in the cavity. Professor Keller was therefore kind
enough to lend us a selection of eleven SESAMs with different modulation depths and recovery
times to test within our cavity. The SESAMs were of the low finesse antiresonant Fabry Perot
type (AFPSA) [3, 19] as typically used in ultrashort pulse sources (see Appendix II for a
description of the SESAM design and operation). Before deciding which SESAM to use, we
characterised the performance of the entire range of SESAMs as described in Appendix II. The
SESAM finally chosen was sample Z367. Whilst the pulse energy in the cavity is largely
controlled by the peak power necessary for the nonlinear polarisation rotation switching, the
fluence incident on the SESAM also depends on the spot size of the incident beam, which can
be optimised by using a telescope with appropriate focal length lenses. We experimented with
1:1 focusing and directly butting the fiber end to the SESAM, but obtained the most reliable Q-
58
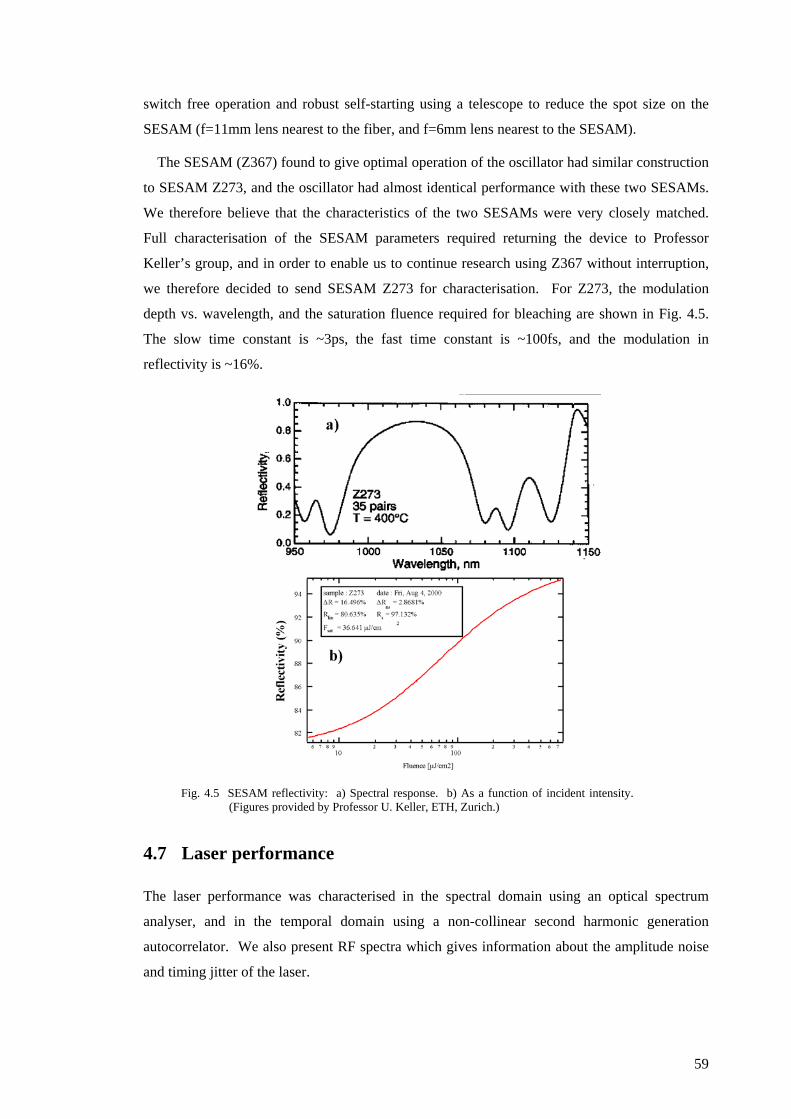
switch free operation and robust self-starting using a telescope to reduce the spot size on the
SESAM (f=11mm lens nearest to the fiber, and f=6mm lens nearest to the SESAM).
The SESAM (Z367) found to give optimal operation of the oscillator had similar construction
to SESAM Z273, and the oscillator had almost identical performance with these two SESAMs.
We therefore believe that the characteristics of the two SESAMs were very closely matched.
Full characterisation of the SESAM parameters required returning the device to Professor
Keller’s group, and in order to enable us to continue research using Z367 without interruption,
we therefore decided to send SESAM Z273 for characterisation. For Z273, the modulation
depth vs. wavelength, and the saturation fluence required for bleaching are shown in .
The slow time constant is ~3ps, the fast time constant is ~100fs, and the modulation in
reflectivity is ~16%.
Fig. 4.5
Fig. 4.5 SESAM reflectivity: a) Spectral response. b) As a function of incident intensity. (Figures provided by Professor U. Keller, ETH, Zurich.)
4.7 Laser performance
The laser performance was characterised in the spectral domain using an optical spectrum
analyser, and in the temporal domain using a non-collinear second harmonic generation
autocorrelator. We also present RF spectra which gives information about the amplitude noise
and timing jitter of the laser.
59

The dispersion of the DDL was adjusted by varying the grating separation, and we
investigated the laser performance with various grating separations. Highly stable operation
was achieved with a grating separation of 5.4 cm, corresponding to 2nd and 3rd order dispersion
(double pass) of –8.3 x 10⁴ fs2, and 1.5 x10⁵ fs3 respectively. The total 2nd and 3rd order
dispersion in the cavity, including a double pass of the 1.46 m of fiber and the DDL set with the
optimum grating separation of 5.4 cm, were estimated to be 1.9 x10⁴ fs2 and 2.1 x10⁵ fs3,
respectively at 1056 nm, which corresponds to a small, net normal group velocity dispersion,
typical for stretched-pulse cavities [12]. With suitable adjustment of the wave plates, and at
increased pump powers, the oscillator would also mode-lock with either larger grating
separation (soliton regime), or with smaller grating separation (substantial net normal
dispersion). The soliton regime was characterised by stable mode-locking, but often with
multiple pulses circulating in the cavity. With substantial net normal dispersion, mode-locked
operation was typically more difficult to initiate and was less stable. Reliable and stable, self-
start, stretched-pulse mode-locking was observed for pump powers as low as 62 mW. The
maximum average output power of the laser was 3 mW (~60 pJ pulse energy). We note that
there was almost no hysteresis for the range of pump powers below the self-start threshold for
which mode-locking could be maintained. At lower pump powers Q-switched mode-locking
and CW operation were observed.
Grating seperation (cm)4.2 4.5 4.8 5.1
τ FWH
M (f
s)
100
120
140
∆λ FW
HM
(nm
)
14
16
18
20
22
(0.57)
(0.57)
(0.57)
(0.57)(0.60)
(0.63)
(0.67)
(∆ν∆τ = 0.62)
Fig. 4.6 Variation of laser performance with net cavity dispersion. (See text for details.)
The laser has been in constant use, so we have not had the opportunity to characterise its
performance in detail with varying grating separation i.e. varying net dispersion. Instead, we
have characterised the performance of a “clone” cavity, but which uses a total fiber length of
1.15 m (WDM = 30 cm, boron fiber = 10 cm, Yb-doped fiber =75 cm), which is slightly shorter
than the 1.46 m of fiber in the original cavity. The development and characterisation of the
clone oscillator was performed jointly with Andy Piper, a graduate student in Professor
60
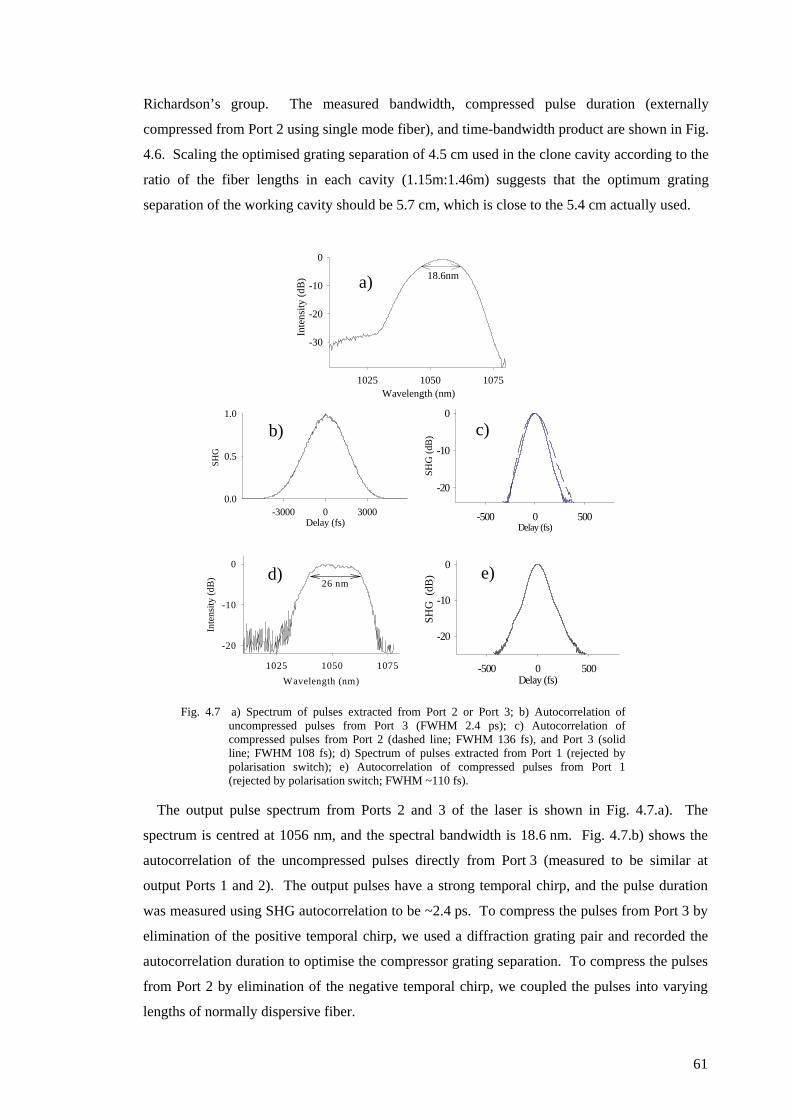
Richardson’s group. The measured bandwidth, compressed pulse duration (externally
compressed from Port 2 using single mode fiber), and time-bandwidth product are shown in
. Scaling the optimised grating separation of 4.5 cm used in the clone cavity according to the
ratio of the fiber lengths in each cavity (1.15m:1.46m) suggests that the optimum grating
separation of the working cavity should be 5.7 cm, which is close to the 5.4 cm actually used.
Fig.
4.6
Wavelength (nm)1025 1050 1075
Inte
nsity
(dB
)
-20
-10
0
26 nm
Delay (fs)-500 0 500
SHG
(dB
)
-20
-10
0
Delay (fs)-3000 0 3000
SHG
0.0
0.5
1.0
Delay (fs)-500 0 500
SHG
(dB
)
-20
-10
0
b)
d)
c)
Wavelength (nm)1025 1050 1075
Inte
nsity
(dB
)
-30
-20
-10
0
18.6nma)
e)
Wavelength (nm)1025 1050 1075
Inte
nsity
(dB
)
-20
-10
0
26 nm
Delay (fs)-500 0 500
SHG
(dB
)
-20
-10
0
Delay (fs)-3000 0 3000
SHG
0.0
0.5
1.0
Delay (fs)-500 0 500
SHG
(dB
)
-20
-10
0
b)
d)
c)
Wavelength (nm)1025 1050 1075
Inte
nsity
(dB
)
-30
-20
-10
0
18.6nma)
e)
Fig. 4.7 a) Spectrum of pulses extracted from Port 2 or Port 3; b) Autocorrelation of uncompressed pulses from Port 3 (FWHM 2.4 ps); c) Autocorrelation of compressed pulses from Port 2 (dashed line; FWHM 136 fs), and Port 3 (solid line; FWHM 108 fs); d) Spectrum of pulses extracted from Port 1 (rejected by polarisation switch); e) Autocorrelation of compressed pulses from Port 1 (rejected by polarisation switch; FWHM ~110 fs).
Fig. 4.7
The output pulse spectrum from Ports 2 and 3 of the laser is shown in Fig. 4.7.a). The
spectrum is centred at 1056 nm, and the spectral bandwidth is 18.6 nm. .b) shows the
autocorrelation of the uncompressed pulses directly from Port 3 (measured to be similar at
output Ports 1 and 2). The output pulses have a strong temporal chirp, and the pulse duration
was measured using SHG autocorrelation to be ~2.4 ps. To compress the pulses from Port 3 by
elimination of the positive temporal chirp, we used a diffraction grating pair and recorded the
autocorrelation duration to optimise the compressor grating separation. To compress the pulses
from Port 2 by elimination of the negative temporal chirp, we coupled the pulses into varying
lengths of normally dispersive fiber.
61

The dashed and solid lines in .c) show the autocorrelation of the compressed pulses
from Ports 2 and 3, respectively. The shortest pulses have an estimated FWHM of 108 fs
(assuming a Gaussian pulse shape) indicating a compression factor of order 20. The
corresponding time bandwidth product of the compressed pulses is ~0.54, typical for a
stretched-pulse laser. By comparison, the time bandwidth product for a transform-limited
Gaussian pulse is 0.44. Both the autocorrelation and spectrum are seen to be extremely clean
over the available dynamic range of the measurement equipment.
c) show the autocorrelation of the compressed pulses
from Ports 2 and 3, respectively. The shortest pulses have an estimated FWHM of 108 fs
(assuming a Gaussian pulse shape) indicating a compression factor of order 20. The
corresponding time bandwidth product of the compressed pulses is ~0.54, typical for a
stretched-pulse laser. By comparison, the time bandwidth product for a transform-limited
Gaussian pulse is 0.44. Both the autocorrelation and spectrum are seen to be extremely clean
over the available dynamic range of the measurement equipment.
Fig. 4.7
Fig.
4.7 Fig. 4.7
Fig.
4.7 Fig. 4.7
We used an external diffraction grating pair to demonstrate that the pulses rejected from
Port 1 of our laser were also compressible. The spectrum of these pulses is shown in
.d); and the compressed pulse autocorrelation is shown in .e). The spectrum is
slightly less smooth compared to the circulating pulses, but the compressed pulses are seen to be
of a similar quality (FWHM ~110 fs). Following Tamura’s earlier work [20], we may therefore
be able to eliminate other outputs in order to extract higher power (and still short) rejected
pulses at Port 1, or to reduce even further the pump power required for self-start mode-locking.
To produce higher powers, we used Port 2 of the oscillator as a seed for amplification (see
Chapters 3, 5, 7, 8), and only used Port 1 (rejected output) to trigger the pulse selector and the
time gating between amplifier stages. We also note that the grating pair passes the first-order
diffracted beam, which leaves the zero order beam available as a monitor port or as an
additional output.
Fig. 4.8 RF spectra: a): At the cavity round trip frequency highlighting the low amplitude noise of the laser. b): Seventh harmonic, used to calculate the timing jitter.
Fig. 4.8
Fig. 4.8
Fig. 4.8
Fig. 4.8 RF spectra: a): At the cavity round trip frequency highlighting the low amplitude noise of the laser. b): Seventh harmonic, used to calculate the timing jitter.
Fig. 4.8
Fig. 4.8
Fig. 4.8
Frequency (MHz)
53.6950 53.6955 53.6960 53.6965
Pow
er sp
ectru
m (d
B)
-80
-60
-40
-20
0Fundamental
a)
Frequency (MHz)
375.7 375.8 375.9 376.0 376.1
Pow
er sp
ectru
m (d
B)
-80
-60
-40
-20
07th harmonic
b)
. shows the RF spectrum at the cavity’s fundamental frequency (53.7 MHz) measured
by directing the laser output onto a low noise detector (~3 GHz bandwidth), and analysing the
pulse intensity signal [21] with an RF spectrum analyser (Marconi Instruments model no.
2382). The resolution bandwidth for the scan shown in (a) was 10Hz (span 2 kHz),
which highlights the low amplitude noise of the laser (calculated to be ~0.05%). From the
pedestal on the 7th harmonic peak ( (b), resolution bandwidth 1 kHz) we calculate the
time jitter of the pulses to be ~2ps. The method for calculating the amplitude noise and the time
62

jitter are explained in Appendix I [21]. We note that no effort has been made to stabilise the
laser against external environmental changes. However, our daily startup procedure has not
required adjustment of the intra-cavity wave plates provided that the laboratory air conditioning
maintained similar ambient temperature, and we envisage that enclosing the cavity in a
temperature controlled housing, would lead to adjustment-free operation.
If the pump power is high, then there is sufficient gain that the energy of the pulse exceeds
the threshold for breaking into multiple pulses (a common feature in soliton lasers). Fig. 4.9.
shows that the threshold launched pump power is >60 mW and that multiple pulses are observed
for launched pump powers >80 mW.
Pump power (mW)60 65 70 75 80 85
Out
put p
ulse
ene
rgy
(pJ)
10
20
30
40
50
Top (red) line = port 3
Lower (green) line = port 1
Single pulse Multi pulses
Pump power (mW)60 65 70 75 80 85
Puls
e FW
HM
(fs
)
80
90
100
110
120
130
Peak
pow
er (W
)
80
90
100
110
120
130
140Single pulse Multi pulses
b) a)
Fig. 4.9 Single and multi-pulsing regimes: a) output energy, b) pulse width and peak power.
4.8 Conclusion
In conclusion, we have developed a practical and stable stretched pulse laser operating at
1.06 µm based on Yb-doped silica fiber. The Fabry-Perot cavity incorporates a SESAM to
initiate self-start mode-locking, a diffraction grating based dispersive delay line for dispersion
compensation, and is pumped with a grating-stabilised telecommunications-qualified single-
mode laser-diode. Highly reliable and stable, stretched-pulse mode locking (employing
nonlinear polarisation evolution) could be achieved for pump powers as low as 62 mW. The
maximum average output power of the laser in this instance was 3 mW, at a repetition rate of
53.7 MHz, corresponding to ~60 pJ pulse energy. The pulses are demonstrated to have a
smooth spectrum, are compressible externally to 108 fs (assuming a Gaussian pulse profile) and
have minimal amplitude jitter (~0.05%).
The setup is based on bulk optical components and XYZ adjustment stages, but in future it
may be possible to use GRIN lenses directly butted to the fiber ends, and holey fiber instead of
bulk diffraction gratings for dispersion compensation so as to greatly simplify the cavity set-up.
We also note that the pulse width was not limited by the Yb3+ gain bandwidth, which has been
demonstrated to support at least 65fs pulses experimentally [16] and ~30 fs theoretically. We
63

did not seek to obtain shorter pulses from our cavity, but would consider that this should have
been possible with further optimisation of fiber length and overall dispersion compensation.
We believe that laser will prove useful for a wide range of future applications; indeed it has
already provided useful service in a range of projects at the ORC [22-29]. The laser has now
been commercialised by our industrial sponsor, and at least one unit is in use with a customer.
64
References 1. R. L. Fork, C. H. B. Cruz, P. C. Becker and C. V. Shank, "Compression of Optical
Pulses to 6 femtoseconds by Using Cubic Phase Compensation," Optics Letters 12, 483-485 (1987).
2. M. Hofer, M. H. Ober, F. Haberl and M. E. Fermann, "Characterization of Ultrashort Pulse Formation in Passively Mode-Locked Fiber Lasers," IEEE Journal of Quantum Electronics 28, 720-728 (1992).
3. U. Keller, K. J. Weingarten, F. X. Kartner, D. Kopf, B. Braun, I. D. Jung, R. Fluck, C. Honninger, N. Matuschek and J. A. derAu, "Semiconductor saturable absorber mirrors (SESAM's) for femtosecond to nanosecond pulse generation in solid-state lasers," IEEE Journal of Selected Topics in Quantum Electronics 2, 435-453 (1996).
4. E. Yoshida, Y. Kimura and M. Nakazawa, "Laser Diode-Pumped Femtosecond Erbium-Doped Fiber Laser with a Sub-Ring Cavity for Repetition Rate Control," Applied Physics Letters 60, 932-934 (1992).
5. D. J. Richardson, R. I. Laming, D. N. Payne, M. W. Phillips and V. J. Matsas, "320 fs Soliton Generation with Passively Mode-Locked Erbium Fiber Laser," Electronics Letters 27, 730-732 (1991).
6. I. N. Duling, "Subpicosecond All-Fiber Erbium Laser," Electronics Letters 27, 544-545 (1991).
7. K. Tamura, H. A. Haus and E. P. Ippen, "Self-Starting Additive Pulse Mode-Locked Erbium Fiber Ring Laser," Electronics Letters 28, 2226-2228 (1992).
8. D. U. Noske, N. Pandit and J. R. Taylor, "Subpicosecond Soliton Pulse Formation from Self-Mode-Locked Erbium Fiber Laser Using Intensity Dependent Polarization Rotation," Electronics Letters 28, 2185-2186 (1992).
9. V. J. Matsas, T. P. Newson, D. J. Richardson and D. N. Payne, "Self-Starting Passively Mode-Locked Fiber Ring Soliton Laser Exploiting Nonlinear Polarization Rotation," Electronics Letters 28, 1391-1393 (1992).
10. C. J. Chen, P. K. A. Wai and C. R. Menyuk, "Soliton Fiber Ring Laser," Optics Letters 17, 417-419 (1992).
11. K. Tamura, L. E. Nelson, H. A. Haus and E. P. Ippen, "Soliton Versus Nonsoliton Operation of Fiber Ring Lasers," Applied Physics Letters 64, 149-151 (1994).
12. K. Tamura, E. P. Ippen, H. A. Haus and L. E. Nelson, "77-fs Pulse Generation from a Stretched-Pulse Mode-Locked All- Fiber Ring Laser," Optics Letters 18, 1080-1082 (1993).
13. H. A. Haus, K. Tamura, L. E. Nelson and E. P. Ippen, "Stretched-Pulse Additive-Pulse Mode-Locking in Fiber Ring Lasers - Theory and Experiment," IEEE Journal of Quantum Electronics 31, 591-598 (1995).
14. M. H. Ober, M. Hofer, U. Keller and T. H. Chiu, "Self-Starting Diode-Pumped Femtosecond Nd Fiber Laser," Optics Letters 18, 1532-1534 (1993).
15. H. A. Haus and E. P. Ippen, "Self-Starting of Passively Mode-Locked Lasers," Optics Letters 16, 1331-1333 (1991).
16. V. Cautaerts, D. J. Richardson, R. Paschotta and D. C. Hanna, "Stretched pulse Yb3+ silica fiber laser," Optics Letters 22, 316-318 (1997).
17. F. Krausz and T. Brabec, "Passive-Mode Locking in Standing-Wave Laser Resonators," Optics Letters 18, 888-890 (1993).
18. C. Honninger, R. Paschotta, M. Graf, F. Morier-Genoud, G. Zhang, M. Moser, S. Biswal, J. Nees, A. Braun, G. A. Mourou, I. Johannsen, A. Giesen, W. Seeber and U. Keller, "Ultrafast ytterbium-doped bulk lasers and laser amplifiers," Applied Physics B-Lasers and Optics 69, 3-17 (1999).
65
66
19. C. Honninger, F. Morier-Genoud, M. Moser, U. Keller, L. R. Brovelli and C. Harder, "Efficient and tunable diode-pumped femtosecond Yb : glass lasers," Optics Letters 23, 126-128 (1998).
20. K. Tamura, C. R. Doerr, L. E. Nelson, H. A. Haus and E. P. Ippen, "Technique for Obtaining High-Energy Ultrashort Pulses from an Additive-Pulse Mode-Locked Erbium-Doped Fiber Ring Laser," Optics Letters 19, 46-48 (1994).
21. D. Von der linde, "Characterization of the Noise in Continuously Operating Mode- Locked Lasers," Applied Physics B-Photophysics and Laser Chemistry 39, 201-217 (1986).
22. J. H. V. Price, K. Furusawa, T. M. Monro, L. Lefort and D. J. Richardson, "Tunable, femtosecond pulse source operating in the range 1.06- 1.33 microns based on an Yb3+-doped holey fiber amplifier," Journal of the Optical Society of America B-Optical Physics 19, 1286-1294 (2002).
23. J. H. V. Price, W. Belardi, T. M. Monro, A. Malinowski, A. Piper and D. J. Richardson, "Soliton transmission and supercontinuum generation in holey fiber, using a diode pumped Ytterbium fiber source," Optics Express 10, 382-387 (2002).
24. J. H. Price, L. Lefort, D. J. Richardson, G. J. Spuhler, R. Paschotta, U. Keller, C. Barty, A. Fry and J. Weston, "A practical, low noise, stretched pulse Yb3+-doped fiber laser," Conference on Lasers and Electro-Optics (CLEO 2001), paper CTuQ6 (2001).
25. J. H. Price, K. Furusawa, T. M. Monro, C. Netti, A. Malinowski, J. J. Baumberg and D. J. Richardson, "Phase matched UV Generation in a silica holey fiber," Conference on Lasers and Electro Optics (CLEO), Vol. 73 of OSA Trends in Optics and Photonics Series (Optical Society of America, Washington, D.C., 2002) paper CTuB5 (2002).
26. J. H. Price, K. Furusawa, T. M. Monro, L. Lefort and D. J. Richardson, "A tuneable, femtosecond pulse source operating in the range 1.06-1.33 microns based on an Yb doped holey fiber amplifier," Conference on Lasers and Electro Optics (CLEO), Vol. 56 of OSA Trends in Optics and Photonics Series (Optical Society of America, Washington, D.C., 2001) paper CPD1 (2001).
27. J. H. Price, W. Belardi, L. Lefort, T. M. Monro and D. J. Richardson, "Nonlinear pulse compression, dispersion compensation, and soliton propagation in holey fiber at 1 micron," Nonlinear Guided Waves and Their Applications (NLGW 2001), paper WB1-2 (2001).
28. M. V. O'Connor, M. A. Watson, D. C. Hanna, D. P. Shepherd, L. Lefort, J. H. V. Price, A. Malinowski, J. Nilsson, N. G. Broderick and D. J. Richardson, "Fibre-laser pumped femtosecond PPLN OPO," Quantum Electronics and Photonics 15 (QEP 15), Glasgow, September 3-6, pp139, Institute of Physics, (2001).
29. L. Lefort, J. H. Price, D. J. Richardson, G. J. Spuhler, R. Paschotta, U. Keller, A. Fry and J. Weston, "Practical Low-Noise stretched-pulse Yb-doped fiber laser," Optics Letters 27, 291-293 (2002).
Chapter 5 CPA Stretcher and compressor
5.1 Introduction
An important aspect of our industrially funded CPA system, which differs from previously
published fiber CPA work, is the use of a compact bulk-grating based compressor, and a
matched chirped fiber Bragg grating stretcher. The compact compressor design results in
significant 3rd order dispersion, which must be compensated by the pulse stretcher if high
quality <500 fs final recompressed pulses are to be obtained. This chapter describes our work to
design an efficient pulse compressor, and a CFBG stretcher with matching 2nd and 3rd order
dispersion.
CPA is a technique widely used with high power solid-state laser systems in which a short,
transform-limited optical pulse is first chirped to stretch the pulse duration, then amplified to a
high energy, then recompressed to the initial duration by a device of opposite dispersion to the
pulse stretcher. This technique avoids high peak intensity in the amplifiers, and hence avoids
the limiting effects of nonlinearity (SPM, SRS, and self-focusing) thus massively extending the
peak powers that are attainable from laser systems. Since the effects of the fiber nonlinearity
depend on the peak intensity, the design criteria for the stretcher/compressor is for as long a
stretched pulse duration as possible, within the constraints created by the dimensions of the
selected pulse stretcher and compressor components.
Pulse stretching and compression are usually performed with bulk optic devices such as a
diffraction grating pair, e.g. Galvanauskas et al. demonstrated an Yb-fiber CPA that produced
380 fs pulses with energies of 1.2 mJ [1] using bulk gratings for both stretcher and compressor.
However, obtaining the required temporal stretching factors requires grating separations of the
order of 1 m, which make such systems large and cumbersome. CFBGs are highly dispersive
and can provide suitable time delays in only centimetre lengths of fiber. Indeed, Neil Broderick
et al. at the ORC have demonstrated 4 ps pulses with energy of 0.9 µJ using CFBG stretcher and
compressor gratings in an all Er-doped fiber CPA system based on LMA fiber components [2].
The principal limit on the use of CFBGs is that due to the high peak power in the compressor,
the nonlinearity of the grating fiber degrades the pulse quality. In our system, the target final
(recompressed) pulses with energy of 50 µJ and duration of 500 fs would have a peak power of
~100 MW and therefore a bulk-grating based compressor is required. However, it is still
67

possible to use a CFBG stretcher. Both GDD and 3rd order dispersion of a bulk-grating
compressor are proportional to the grating separation. Therefore, using a long (~0.3 ns)
stretched pulse duration that requires large GDD, also adds large 3rd order dispersion. For
recompressed pulse durations <500 fs, uncompensated 3rd order dispersion would result in a
significant pedestal on the recompressed pulse. CFBGs incorporating both 2nd and 3rd order
dispersion compensation have not previously been reported at 1 µm, but using the uniquely
flexible CFBG writing technology developed at the ORC [3] has enabled us to fabricate a
CFBG with both the correct 2nd and 3rd order dispersion to compensate for the bulk-grating
compressor. Using this CFBG technology should provide a robust, compact, and alignment-free
pulse stretcher for use in future systems. The development of this CFBG pulse stretcher is
presented in this chapter. Due to the flexibility of the CFBG writing process, we first optimised
the compressor design for the grating specified by our industrial sponsor, then designed the
CFBG stretcher to have the required (mirror) dispersion profile.
This chapter is organised as follows. Section 5.2 illustrates the effect of uncompensated 3rd
order dispersion on pulses with bandwidths corresponding to transform limited durations of
500 fs and 200 fs. In Section 5.3, we describe the design of the bulk grating compressor. In
Section 5.4 we describe the design and development of the CFBG stretcher. Then in Section 5.5
we present our conclusions.
5.2 Effect of uncompensated third order dispersion
As described above, the high peak powers of the recompressed pulses from the CPA system
require a bulk grating based pulse compressor, which inherently introduces 3rd order dispersion
in proportion to the 2nd order dispersion (both are proportional to the diffraction grating
separation). To illustrate the effect of uncompensated 3rd order dispersion, we have calculated
(formula from Agrawal [4]) the effects of uncompensated 3rd order dispersion on Gaussian
pulses with bandwidths of 7.5 nm and 3 nm, which correspond to transform-limited FWHM
pulse durations of 200 fs and 500 fs at a wavelength of 1 µm. We considered two values of
uncompensated 3rd order dispersion: dD/dλ x Length = 1.5 ps/nm2, and dD/dλ x Length =
0.5 ps/nm2 (i.e. one third of the value of the first case). The larger value of 3rd order dispersion
corresponds to that introduced by the grating compressor design described in Section 5.3. The
smaller value of 3rd order dispersion corresponds to the maximum that can be fabricated into a
CFBG that has both the 2nd order dispersion of the compressor, and also has sufficient spectral
window (15 nm) to support 300 fs recompressed pulses (see Section 5.4.3 for more details about
this constraint).
68
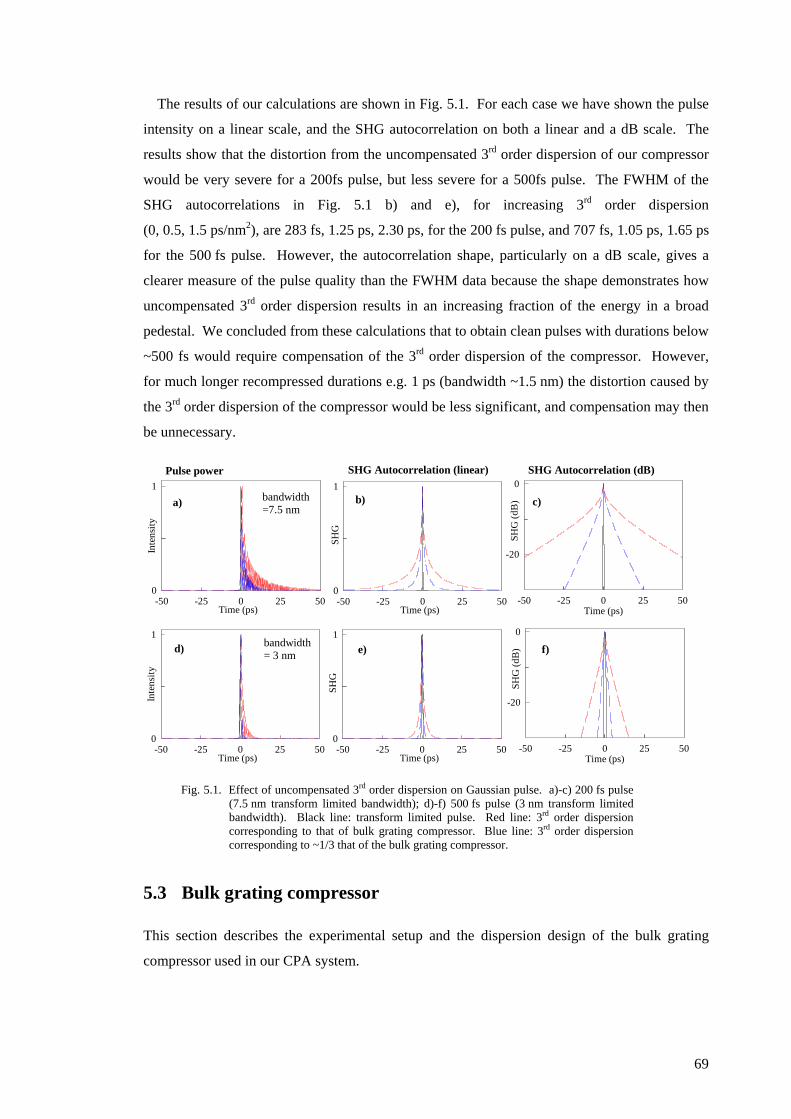
The results of our calculations are shown in Fig. 5.1. For each case we have shown the pulse
intensity on a linear scale, and the SHG autocorrelation on both a linear and a dB scale. The
results show that the distortion from the uncompensated 3rd order dispersion of our compressor
would be very severe for a 200fs pulse, but less severe for a 500fs pulse. The FWHM of the
SHG autocorrelations in Fig. 5.1 b) and e), for increasing 3rd order dispersion
(0, 0.5, 1.5 ps/nm2), are 283 fs, 1.25 ps, 2.30 ps, for the 200 fs pulse, and 707 fs, 1.05 ps, 1.65 ps
for the 500 fs pulse. However, the autocorrelation shape, particularly on a dB scale, gives a
clearer measure of the pulse quality than the FWHM data because the shape demonstrates how
uncompensated 3rd order dispersion results in an increasing fraction of the energy in a broad
pedestal. We concluded from these calculations that to obtain clean pulses with durations below
~500 fs would require compensation of the 3rd order dispersion of the compressor. However,
for much longer recompressed durations e.g. 1 ps (bandwidth ~1.5 nm) the distortion caused by
the 3rd order dispersion of the compressor would be less significant, and compensation may then
be unnecessary.
Time (ps)-50 -25 0 25 50
Inte
nsity
0
1
Time (ps)-50 -25 0 25 50
SHG
(dB
)
-20
0
Time (ps)-50 -25 0 25 50
SHG
0
1
Time (ps)-50 -25 0 25 50
SHG
0
1
Time (ps)-50 -25 0 25 50
Inte
nsity
0
1
Time (ps)-50 -25 0 25 50
SHG
(dB
)
-20
0
Pulse power SHG Autocorrelation (linear) SHG Autocorrelation (dB)
bandwidth=7.5 nm
bandwidth= 3 nm
a) b) c)
f)e)d)
Fig. 5.1. Effect of uncompensated 3rd order dispersion on Gaussian pulse. a)-c) 200 fs pulse (7.5 nm transform limited bandwidth); d)-f) 500 fs pulse (3 nm transform limited bandwidth). Black line: transform limited pulse. Red line: 3rd order dispersion corresponding to that of bulk grating compressor. Blue line: 3rd order dispersion corresponding to ~1/3 that of the bulk grating compressor.
5.3 Bulk grating compressor
This section describes the experimental setup and the dispersion design of the bulk grating
compressor used in our CPA system.
69
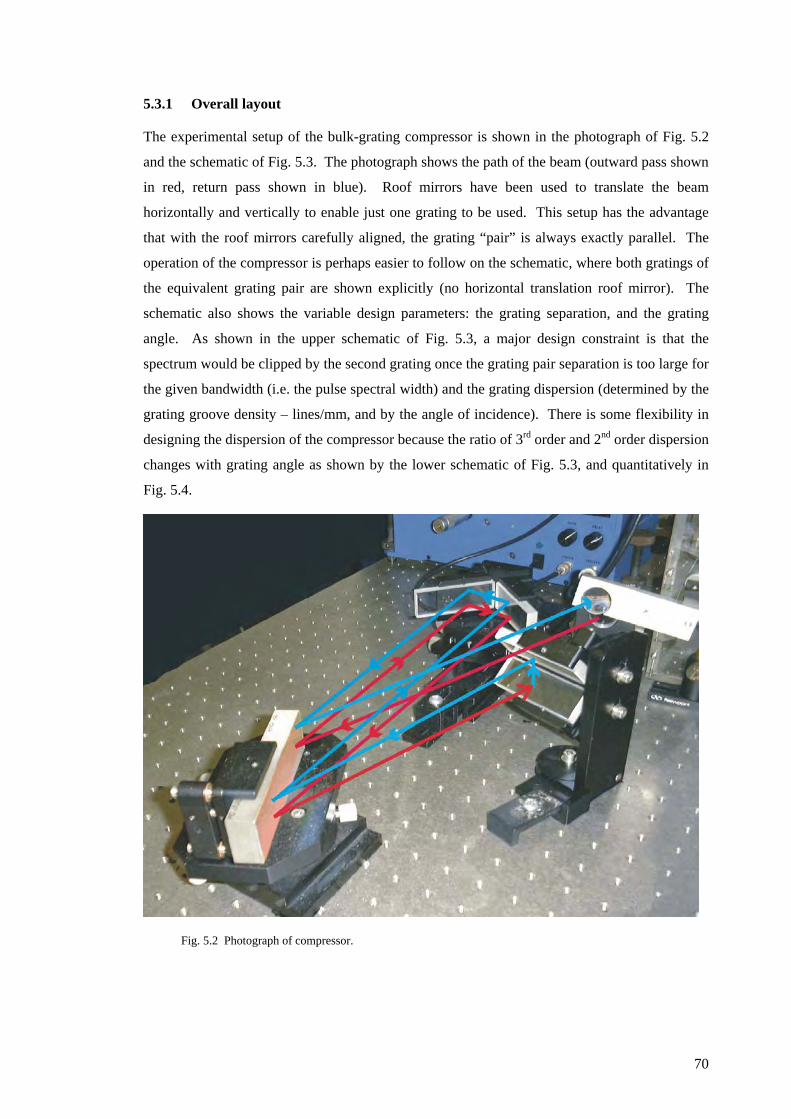
5.3.1 Overall layout
The experimental setup of the bulk-grating compressor is shown in the photograph of
and the schematic of Fig. 5.3. The photograph shows the path of the beam (outward pass shown
in red, return pass shown in blue). Roof mirrors have been used to translate the beam
horizontally and vertically to enable just one grating to be used. This setup has the advantage
that with the roof mirrors carefully aligned, the grating “pair” is always exactly parallel. The
operation of the compressor is perhaps easier to follow on the schematic, where both gratings of
the equivalent grating pair are shown explicitly (no horizontal translation roof mirror). The
schematic also shows the variable design parameters: the grating separation, and the grating
angle. As shown in the upper schematic of , a major design constraint is that the
spectrum would be clipped by the second grating once the grating pair separation is too large for
the given bandwidth (i.e. the pulse spectral width) and the grating dispersion (determined by the
grating groove density – lines/mm, and by the angle of incidence). There is some flexibility in
designing the dispersion of the compressor because the ratio of 3rd order and 2nd order dispersion
changes with grating angle as shown by the lower schematic of Fig. 5.3, and quantitatively in
.
Fig. 5.2
Fig. 5.2 Photograph of compressor.
Fig. 5.3
Fig. 5.4
70
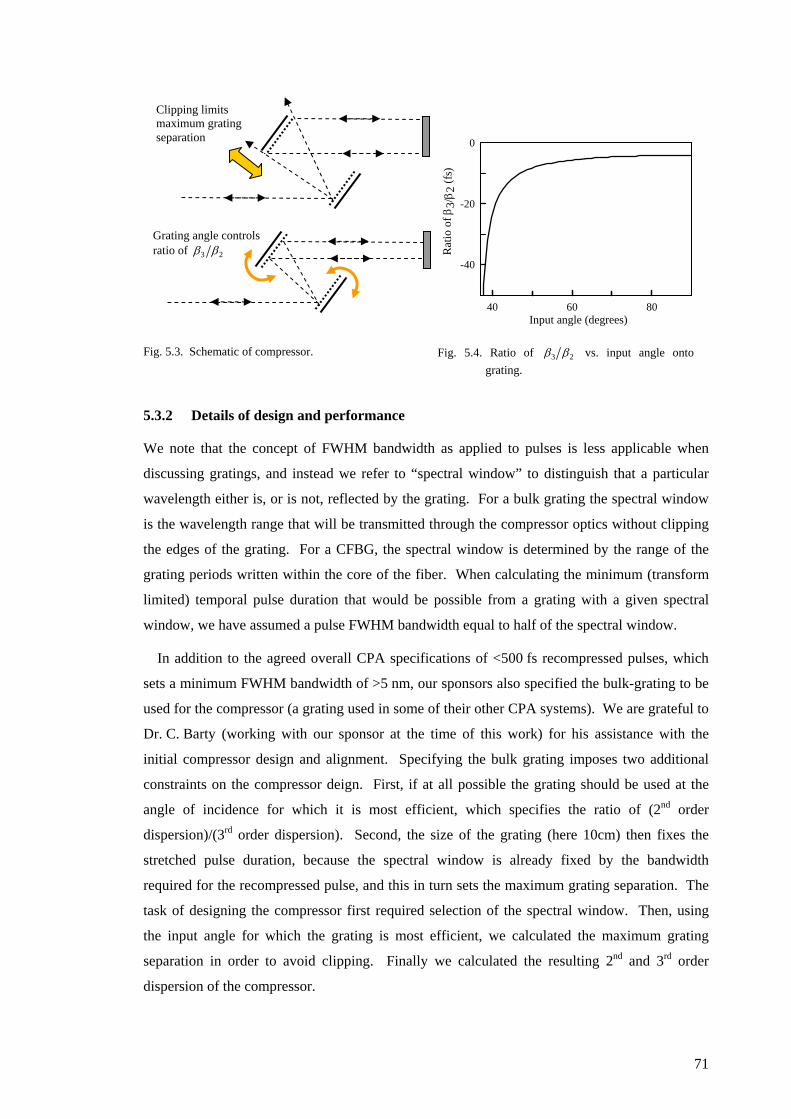
Input angle (degrees)40 60 80
Rat
io o
f β3/
β 2 (f
s)
-40
-20
0
Fig. 5.3. Schematic of compressor.
Fig. 5.4. Ratio of 23 ββ vs. input angle onto grating.
Clipping limits maximum grating separation
Grating angle controls ratio of 23 ββ
5.3.2 Details of design and performance
We note that the concept of FWHM bandwidth as applied to pulses is less applicable when
discussing gratings, and instead we refer to “spectral window” to distinguish that a particular
wavelength either is, or is not, reflected by the grating. For a bulk grating the spectral window
is the wavelength range that will be transmitted through the compressor optics without clipping
the edges of the grating. For a CFBG, the spectral window is determined by the range of the
grating periods written within the core of the fiber. When calculating the minimum (transform
limited) temporal pulse duration that would be possible from a grating with a given spectral
window, we have assumed a pulse FWHM bandwidth equal to half of the spectral window.
In addition to the agreed overall CPA specifications of <500 fs recompressed pulses, which
sets a minimum FWHM bandwidth of >5 nm, our sponsors also specified the bulk-grating to be
used for the compressor (a grating used in some of their other CPA systems). We are grateful to
Dr. C. Barty (working with our sponsor at the time of this work) for his assistance with the
initial compressor design and alignment. Specifying the bulk grating imposes two additional
constraints on the compressor deign. First, if at all possible the grating should be used at the
angle of incidence for which it is most efficient, which specifies the ratio of (2nd order
dispersion)/(3rd order dispersion). Second, the size of the grating (here 10cm) then fixes the
stretched pulse duration, because the spectral window is already fixed by the bandwidth
required for the recompressed pulse, and this in turn sets the maximum grating separation. The
task of designing the compressor first required selection of the spectral window. Then, using
the input angle for which the grating is most efficient, we calculated the maximum grating
separation in order to avoid clipping. Finally we calculated the resulting 2nd and 3rd order
dispersion of the compressor.
71
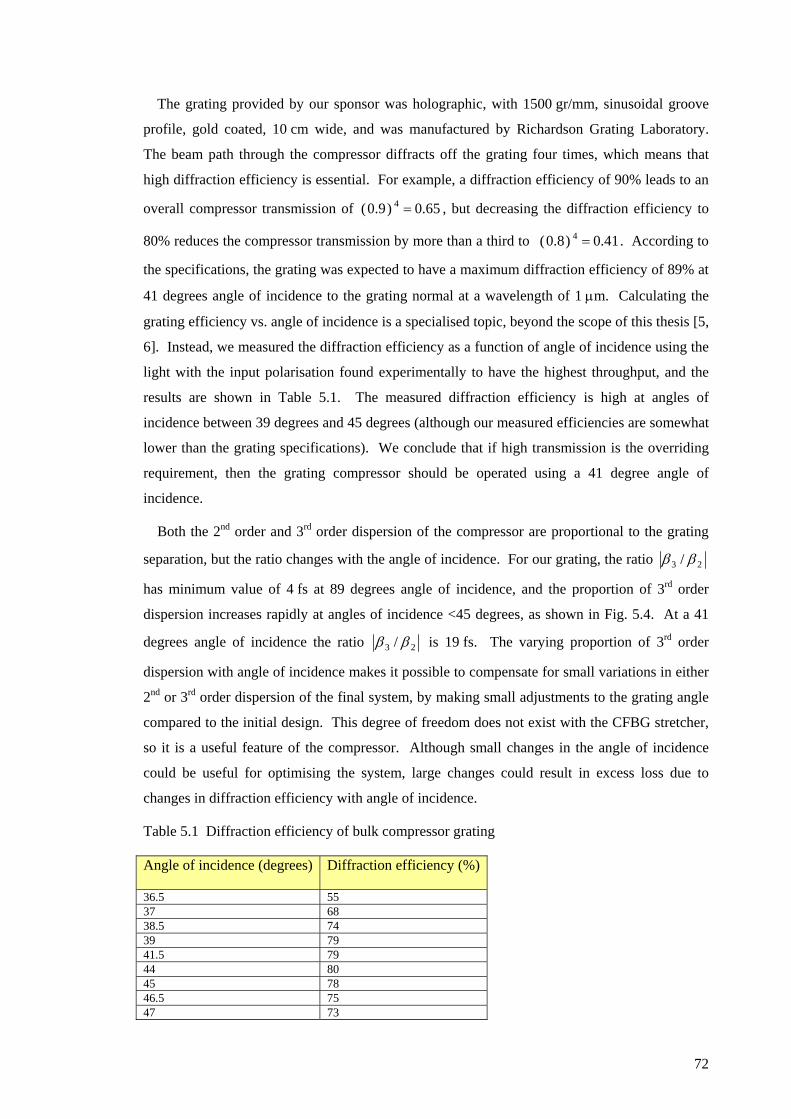
The grating provided by our sponsor was holographic, with 1500 gr/mm, sinusoidal groove
profile, gold coated, 10 cm wide, and was manufactured by Richardson Grating Laboratory.
The beam path through the compressor diffracts off the grating four times, which means that
high diffraction efficiency is essential. For example, a diffraction efficiency of 90% leads to an
overall compressor transmission of , but decreasing the diffraction efficiency to
80% reduces the compressor transmission by more than a third to ( . According to
the specifications, the grating was expected to have a maximum diffraction efficiency of 89% at
41 degrees angle of incidence to the grating normal at a wavelength of 1 µm. Calculating the
grating efficiency vs. angle of incidence is a specialised topic, beyond the scope of this thesis [5,
6]. Instead, we measured the diffraction efficiency as a function of angle of incidence using the
light with the input polarisation found experimentally to have the highest throughput, and the
results are shown in Table 5.1. The measured diffraction efficiency is high at angles of
incidence between 39 degrees and 45 degrees (although our measured efficiencies are somewhat
lower than the grating specifications). We conclude that if high transmission is the overriding
requirement, then the grating compressor should be operated using a 41 degree angle of
incidence.
65.0)9.0( 4 =
41.0)8.0 4 =
Both the 2nd order and 3rd order dispersion of the compressor are proportional to the grating
separation, but the ratio changes with the angle of incidence. For our grating, the ratio 23 / ββ
has minimum value of 4 fs at 89 degrees angle of incidence, and the proportion of 3rd order
dispersion increases rapidly at angles of incidence <45 degrees, as shown in Fig. 5.4. At a 41
degrees angle of incidence the ratio 23 / ββ is 19 fs. The varying proportion of 3rd order
dispersion with angle of incidence makes it possible to compensate for small variations in either
2nd or 3rd order dispersion of the final system, by making small adjustments to the grating angle
compared to the initial design. This degree of freedom does not exist with the CFBG stretcher,
so it is a useful feature of the compressor. Although small changes in the angle of incidence
could be useful for optimising the system, large changes could result in excess loss due to
changes in diffraction efficiency with angle of incidence.
Table 5.1 Diffraction efficiency of bulk compressor grating
Angle of incidence (degrees) Diffraction efficiency (%)
36.5 55 37 68 38.5 74 39 79 41.5 79 44 80 45 78 46.5 75 47 73
72

We designed the pulse compressor to operate at 41 degree angle of incidence in order to
achieve maximum efficiency. We selected the spectral window of 16 nm, being twice the
measured 8 nm FWHM bandwidth of the amplified pulses. We then calculated that the
maximum grating separation that keeps this 8 nm spectral window from clipping the grating to
be 40 cm. For a central wavelength of 1056 nm, the compressor dispersion parameters were
then calculated [7] to be: D x Length = 45.5 ps/nm, (GDD = -27x106 fs2/rad); and dD/dλ x
Length = 1.5 ps/nm2 ( 3β x Length = 530 x106 fs3/rad2). In calculating this dispersion, we have
also included the estimated total dispersion of the fiber amplifiers (D x Length = -0.8 ps/nm,
dD/dλ x Length = 0.001 ps/nm2), so the above values are the total system dispersion to be
compensated by the CFBG.
For this compressor design, we used a network analyser to measure the phase delay vs.
wavelength as illustrated by Fig. 5.5. The phase delay measurements were converted to time
delay measurements by noting that at the test frequency of 1 GHz, a phase delay of 2π
corresponds to a time delay of 1 ns. The measured time delay vs. wavelength is shown in
, which also shows the theoretical delay characteristic. The measured response corresponds
closely to the design characteristic.
Fig.
5.5
Fig. 5.5. Measurement setup and results showing time delay vs. wavelength for bulk-grating compressor. (AOTF=accousto-optic tuneable filter.)
Tuneable source
1 ns (carrier = 1 GHz)
∆τ=(∆φ/2π) x 1ns∆φ
Wavelength (nm)1045 1050 1055 1060
dela
y (p
s)
-400
-200
0
200
400 Measured Predicted
Delay characteristic of bulk grating compressor.
Network Analyser
Broadband ASE source
AO-TF
EOM
Photo-diode
Return signal
Driving
CFBG under test
or, bulk grating compressor
We note that single mode fiber has been used by other researchers [8] as a simple, low-loss,
alternative form of pulse stretcher. However, the 3rd order dispersion of single mode fiber has
the same sign as that of the bulk grating compressor, so a fiber stretcher causes additional pulse
distortion. Our conclusion that we should compensate for the 3rd order dispersion of the
73
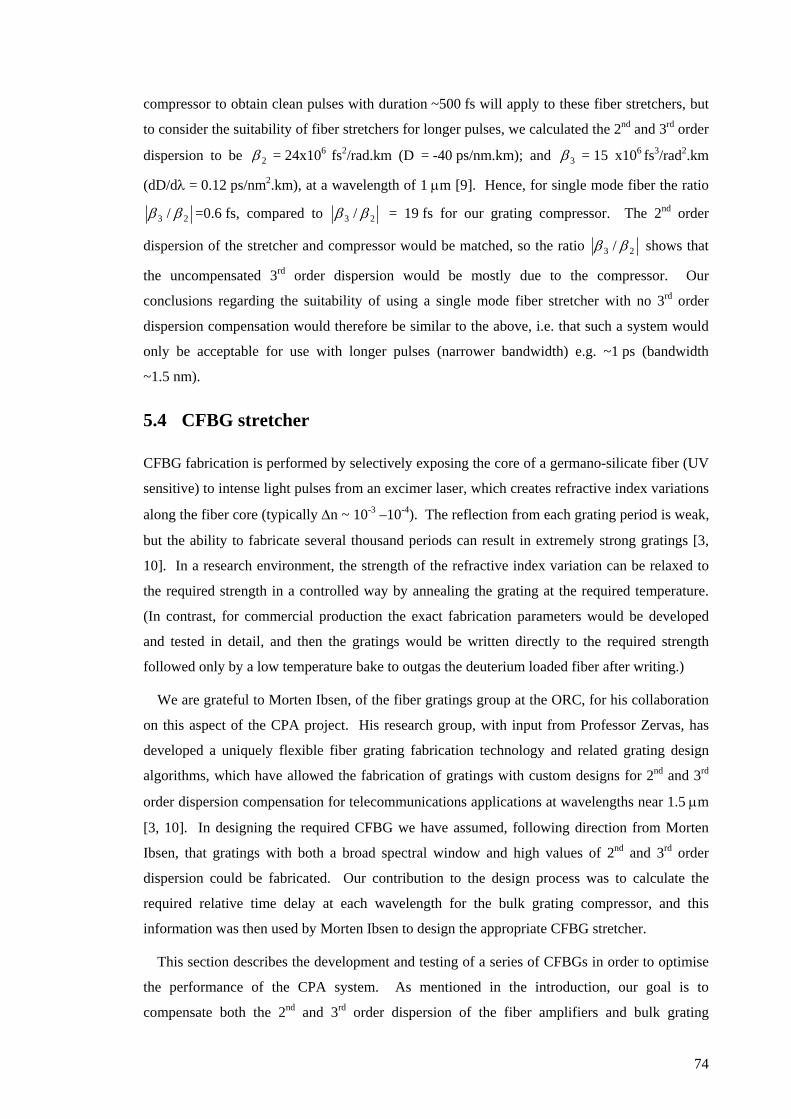
compressor to obtain clean pulses with duration ~500 fs will apply to these fiber stretchers, but
to consider the suitability of fiber stretchers for longer pulses, we calculated the 2nd and 3rd order
dispersion to be 2β = 24x106 fs2/rad.km (D = -40 ps/nm.km); and 3β = 15 x106 fs3/rad2.km
(dD/dλ = 0.12 ps/nm2.km), at a wavelength of 1 µm [9]. Hence, for single mode fiber the ratio
23 / ββ =0.6 fs, compared to 23 / ββ = 19 fs for our grating compressor. The 2nd order
dispersion of the stretcher and compressor would be matched, so the ratio 23 / ββ shows that
the uncompensated 3rd order dispersion would be mostly due to the compressor. Our
conclusions regarding the suitability of using a single mode fiber stretcher with no 3rd order
dispersion compensation would therefore be similar to the above, i.e. that such a system would
only be acceptable for use with longer pulses (narrower bandwidth) e.g. ~1 ps (bandwidth
~1.5 nm).
5.4 CFBG stretcher
CFBG fabrication is performed by selectively exposing the core of a germano-silicate fiber (UV
sensitive) to intense light pulses from an excimer laser, which creates refractive index variations
along the fiber core (typically ∆n ~ 10-3 –10-4). The reflection from each grating period is weak,
but the ability to fabricate several thousand periods can result in extremely strong gratings [3,
10]. In a research environment, the strength of the refractive index variation can be relaxed to
the required strength in a controlled way by annealing the grating at the required temperature.
(In contrast, for commercial production the exact fabrication parameters would be developed
and tested in detail, and then the gratings would be written directly to the required strength
followed only by a low temperature bake to outgas the deuterium loaded fiber after writing.)
We are grateful to Morten Ibsen, of the fiber gratings group at the ORC, for his collaboration
on this aspect of the CPA project. His research group, with input from Professor Zervas, has
developed a uniquely flexible fiber grating fabrication technology and related grating design
algorithms, which have allowed the fabrication of gratings with custom designs for 2nd and 3rd
order dispersion compensation for telecommunications applications at wavelengths near 1.5 µm
[3, 10]. In designing the required CFBG we have assumed, following direction from Morten
Ibsen, that gratings with both a broad spectral window and high values of 2nd and 3rd order
dispersion could be fabricated. Our contribution to the design process was to calculate the
required relative time delay at each wavelength for the bulk grating compressor, and this
information was then used by Morten Ibsen to design the appropriate CFBG stretcher.
This section describes the development and testing of a series of CFBGs in order to optimise
the performance of the CPA system. As mentioned in the introduction, our goal is to
compensate both the 2nd and 3rd order dispersion of the fiber amplifiers and bulk grating
74

compressor, in order to produce distortion-free compressed pulses at the system output. The
first CFBG that we tested had high losses at shorter wavelengths due to “cladding mode losses”.
The second generation of CFBG was fabricated to control the cladding mode losses by using a
reduced grating strength compared to the initial grating. The development process of this
second generation CFBG demonstrated that due to the large 3rd order dispersion relative to 2nd
order dispersion, practical constraints imposed by the writing process would limit the spectral
window of the grating to ~10 nm (corresponding pulse FWHM bandwidth ~5 nm). This limited
spectral window would limit the minimum recompressed pulse duration to ~500 fs. I therefore
developed a design for a third generation CFBG, with reduced 3rd order dispersion, and which
we expect could be fabricated with ~15 nm spectral window (i.e. matched to that of the
compressor), to enable ~300 fs recompressed pulses to be produced.
This section is organised as follows. In Section 5.4.1 we present data for the first generation
CFBG, and explain our observation of excess loss at short wavelengths. In Section 5.4.2 we
present data for the second generation CFBG, which incorporated refinements to control the
cladding mode losses and produced ~500 fs recompressed pulses. In Section 5.4.3 we propose a
design for a future CFBG that should enable us to obtain ~300 fs recompressed pulses.
5.4.1 Performance of first generation CFBG
Due to the scheduled replacement of the CFBG writing rig during summer/autumn 2000, we
decided to perform initial testing with an available CFBG with D x length = 18.5 ps/nm,
dD/dλ x length = 0.1 ps/nm2.
In a)
CFBG 50:50 coupler
Fig. 5.6. Coupling schemes for CFBG. a) 50:50 coupler; b) Optical circulator. (FR – Faraday Rotator; PBS - Polarising Beam Splitter)
Fig. 5.6
Fig. 5.6
PBS PBS b)
Out
In CFBG FR
Out Reference
To couple light onto the CFBG, we used a 50:50 fiber coupler as shown in a). The
optical circulator arrangement shown in b) is an alternative coupling scheme used in
later experiments. The optical circulator requires more components, but it introduces lower
coupling losses. Fig. 5.7 shows the reflected spectra measured from both ends of the CFBG
using pulses from the mode-locked oscillator described in Chapter 4 as the broadband source.
The spectra clearly show strong losses at shorter wavelengths when pulses are incident from the
long wavelength (red) end.
75

Red BlueRed BlueRed Blue Blue RedBlue RedBlue Red
Fig. 5.7. Measured spectral response of initial CFBG
The explanation for the difference in reflected spectra for light incident from the two ends of
the grating is that for such broad spectral window CFBGs, power at shorter wavelengths is
transferred from the core to cladding modes and is thus lost [11]. Ideally, the CFBG would
have only one scattering mechanism – when the grating wave-vector k )( oG νv
(matched to light
of frequency oν in the high refractive index core) exactly couples the wave-vectors of the
forward and backward propagating core modes
i.e. . )()()( ,, ocoreforwardocorebackwardoG kkk νννvvv
−=
However, for a given frequency, the lower index in the cladding means that the mode there
has a longer wavelength (shorter wave-vector); so the grating scattering vector, )( oGk νv
, can
also couple a forward propagating core mode of slightly higher frequency )( ννν ∆+= o (longer
wave-vector) to a short wave-vector cladding mode (at the same frequency ννν ∆+= o ),
resulting in lost power
i.e. . )()()( ,, ννννν ∆+−∆+= ocoreforwardocladbackwardoG kkkvvv
Entering the chirped grating from the low frequency (red) end (high cladding-mode loss), the
high frequency (blue) components suffer significant power transfer to cladding modes before
they reach the point in the grating where they are efficiently coupled into backward propagating
core modes, so they appear to be only weakly reflected. The problem does not occur when
entering the grating from the blue end because the blue components are reflected before entering
into the portion of the grating with the correct wave-vector for coupling the light into cladding
modes. Unfortunately, we must enter from the red end in order to match the dispersion of the
bulk-grating compressor. We concluded that it would be necessary to control the cladding
mode losses in order to obtain satisfactory performance from the CPA system. In the following
section we describe two methods tested in the second generation CFBG to control these losses.
76
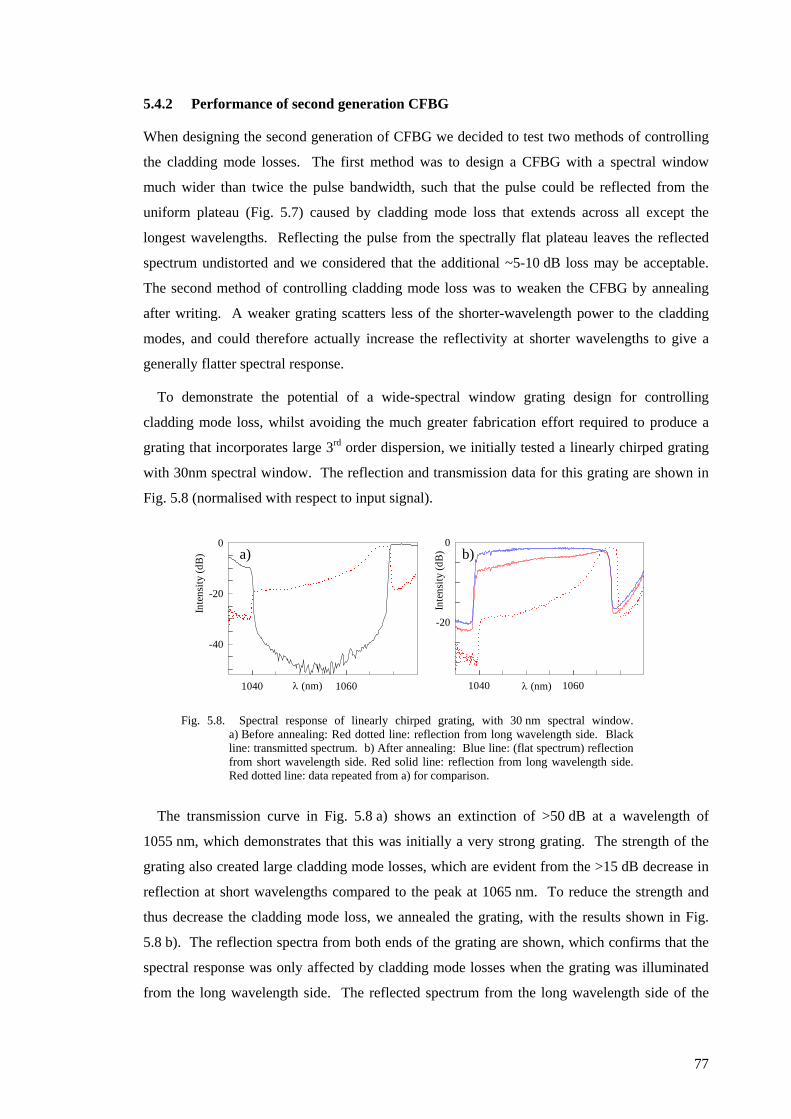
5.4.2 Performance of second generation CFBG
When designing the second generation of CFBG we decided to test two methods of controlling
the cladding mode losses. The first method was to design a CFBG with a spectral window
much wider than twice the pulse bandwidth, such that the pulse could be reflected from the
uniform plateau (Fig. 5.7) caused by cladding mode loss that extends across all except the
longest wavelengths. Reflecting the pulse from the spectrally flat plateau leaves the reflected
spectrum undistorted and we considered that the additional ~5-10 dB loss may be acceptable.
The second method of controlling cladding mode loss was to weaken the CFBG by annealing
after writing. A weaker grating scatters less of the shorter-wavelength power to the cladding
modes, and could therefore actually increase the reflectivity at shorter wavelengths to give a
generally flatter spectral response.
To demonstrate the potential of a wide-spectral window grating design for controlling
cladding mode loss, whilst avoiding the much greater fabrication effort required to produce a
grating that incorporates large 3rd order dispersion, we initially tested a linearly chirped grating
with 30nm spectral window. The reflection and transmission data for this grating are shown in
(normalised with respect to input signal). Fig. 5.8
Fig. 5.8. Spectral response of linearly chirped grating, with 30 nm spectral window. a) Before annealing: Red dotted line: reflection from long wavelength side. Black line: transmitted spectrum. b) After annealing: Blue line: (flat spectrum) reflection from short wavelength side. Red solid line: reflection from long wavelength side. Red dotted line: data repeated from a) for comparison.
Fig.
5.8
λ (nm)1040 1060
Inte
nsity
(dB
)
-40
-20
0
λ (nm)1040 1060
Inte
nsity
(dB
)
-20
0b)a)
The transmission curve in Fig. 5.8 a) shows an extinction of >50 dB at a wavelength of
1055 nm, which demonstrates that this was initially a very strong grating. The strength of the
grating also created large cladding mode losses, which are evident from the >15 dB decrease in
reflection at short wavelengths compared to the peak at 1065 nm. To reduce the strength and
thus decrease the cladding mode loss, we annealed the grating, with the results shown in
b). The reflection spectra from both ends of the grating are shown, which confirms that the
spectral response was only affected by cladding mode losses when the grating was illuminated
from the long wavelength side. The reflected spectrum from the long wavelength side of the
77

annealed grating was generally flatter compared to the spectrum from the grating prior to
annealing. The maximum reflectivity was slightly reduced, but the reflectivity at short
wavelengths was dramatically increased. The relaxation of the raised index periods that results
from annealing, reduces the average refractive index of the grating, and therefore reduces the
optical path length in the grating. The reduced optical path length causes the slight shift of the
grating spectrum to shorter wavelengths that can be seen by comparing the reflection curves
from before annealing (dotted red line) and after annealing (solid red line) in Fig. 5.8 b). From
these results we concluded that by annealing to provide optimum strength, it would be possible
to control the problems associated with cladding mode losses. Using this technique, the entire
spectral window of the CFBG is useful, and it would therefore be unnecessary to work on the
short-wavelength low-reflectivity plateau.
The next CFBG that we tested had a spectral window of 10 nm, and the full 2nd and 3rd order
dispersion required to compensate for the compressor: D x length = 45.5 ps/nm, dD/dλ x
length = 1.5 ps/nm2. For this CFBG design, we again used a network analyser to measure the
time delay vs. wavelength, as described in Section 5.3.2. The measured time-delay vs.
wavelength results and the designed delay vs. wavelength are shown in . The measured
response corresponds closely to the design characteristic.
Fig. 5.9
Wavelength (nm)1054 1056 1058 1060 1062 1064
dela
y (p
s)
-300
-200
-100
0
100
200
300
Measured Predicted
Fig. 5.9. Delay vs. wavelength for 10 nm CFBG. Both design and measured characteristics are shown.
The normalised reflection spectrum of the grating (after annealing) is shown in . We
considered that the spectral response was sufficiently uniform that the grating should permit
cleanly recompressed pulses. The calculated stretched pulse duration was ~ 45.5 ps/nm x
5 nm = 220 ps. Fig. 5.11 shows the SHG autocorrelation measurements of the compressed
pulses (i.e. after passing through both stretcher and compressor) for both the 30 nm grating and
for the 10nm grating. The autocorrelation from the 30 nm CFBG clearly shows the degradation
in pulse quality caused by uncompensated 3rd order dispersion of the compressor. By
comparison, the performance of the 10 nm CFBG is excellent, producing τFWHM = 470 fs pulses
Fig. 5.10
78
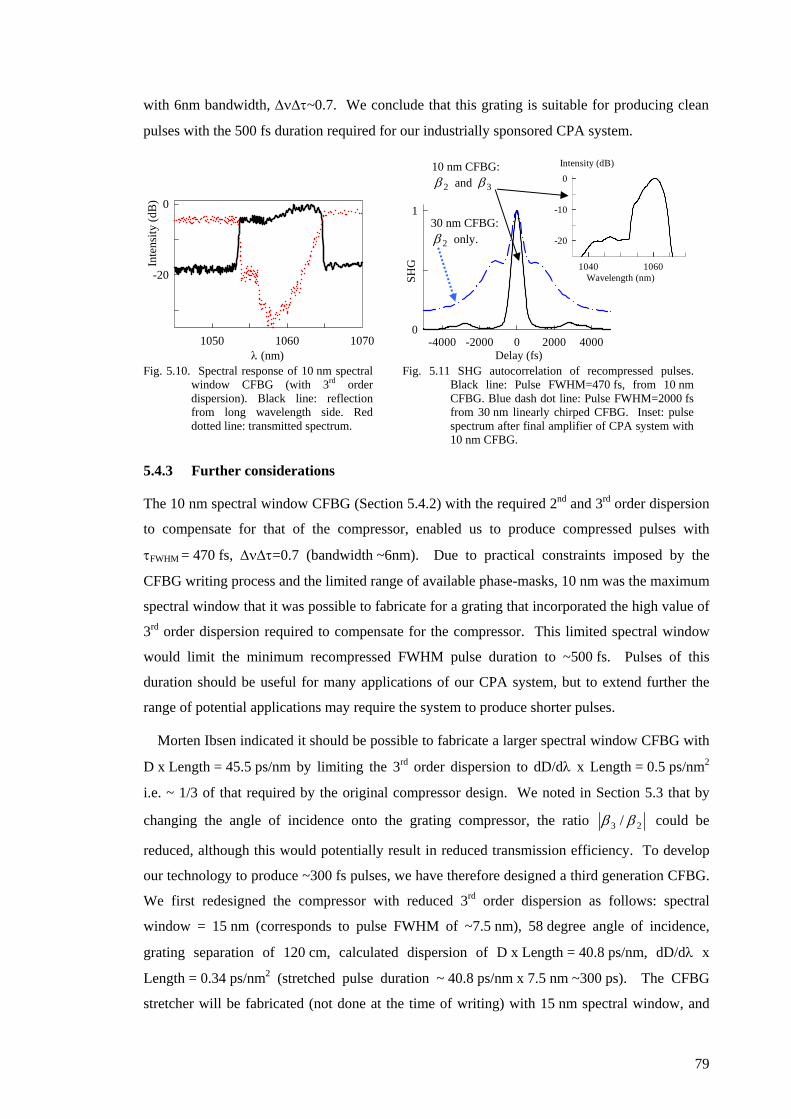
with 6nm bandwidth, ∆ν∆τ~0.7. We conclude that this grating is suitable for producing clean
pulses with the 500 fs duration required for our industrially sponsored CPA system.
λ (nm)1050 1060 1070
Inte
nsity
(dB
)
-20
0
Fig. 5.10. Spectral response of 10 nm spectral
window CFBG (with 3rd order dispersion). Black line: reflection from long wavelength side. Red dotted line: transmitted spectrum.
Fig. 5.11 SHG autocorrelation of recompressed pulses. Black line: Pulse FWHM=470 fs, from 10 nm CFBG. Blue dash dot line: Pulse FWHM=2000 fs from 30 nm linearly chirped CFBG. Inset: pulse spectrum after final amplifier of CPA system with 10 nm CFBG.
Delay (fs)-4000 -2000 0 2000 4000
SHG
0
1
Wavelength (nm)1040 1060
Intensity (dB)
-20
-10
010 nm CFBG:
2β and 3β
30 nm CFBG: 2β only.
5.4.3 Further considerations
The 10 nm spectral window CFBG (Section 5.4.2) with the required 2nd and 3rd order dispersion
to compensate for that of the compressor, enabled us to produce compressed pulses with
τFWHM = 470 fs, ∆ν∆τ=0.7 (bandwidth ~6nm). Due to practical constraints imposed by the
CFBG writing process and the limited range of available phase-masks, 10 nm was the maximum
spectral window that it was possible to fabricate for a grating that incorporated the high value of
3rd order dispersion required to compensate for the compressor. This limited spectral window
would limit the minimum recompressed FWHM pulse duration to ~500 fs. Pulses of this
duration should be useful for many applications of our CPA system, but to extend further the
range of potential applications may require the system to produce shorter pulses.
Morten Ibsen indicated it should be possible to fabricate a larger spectral window CFBG with
D x Length = 45.5 ps/nm by limiting the 3rd order dispersion to dD/dλ x Length = 0.5 ps/nm2
i.e. ~ 1/3 of that required by the original compressor design. We noted in Section 5.3 that by
changing the angle of incidence onto the grating compressor, the ratio 23 / ββ could be
reduced, although this would potentially result in reduced transmission efficiency. To develop
our technology to produce ~300 fs pulses, we have therefore designed a third generation CFBG.
We first redesigned the compressor with reduced 3rd order dispersion as follows: spectral
window = 15 nm (corresponds to pulse FWHM of ~7.5 nm), 58 degree angle of incidence,
grating separation of 120 cm, calculated dispersion of D x Length = 40.8 ps/nm, dD/dλ x
Length = 0.34 ps/nm2 (stretched pulse duration ~ 40.8 ps/nm x 7.5 nm ~300 ps). The CFBG
stretcher will be fabricated (not done at the time of writing) with 15 nm spectral window, and
79

dispersion to compensate for that of the redesigned compressor, and should enable us to obtain
high quality pulses with duration of ~300 fs.
We noted in Section 5.3 that the diffraction efficiency of our grating reduces significantly at
angles of incidence above 47 degrees (see ). However, this reduced diffraction
efficiency may not prove to be a limitation because as we move towards higher average powers
from the CPA system it will be necessary to switch to a more efficient compressor grating with
a reflective dielectric coating (e.g. >95% efficiency), or to use the emerging technology of silica
transmission gratings that have been designed to handle >100W average power from a CPA
system [8]. When selecting a new compressor grating, it may be possible to obtain efficient
diffraction at the angle of incidence required to match the 23 / ββ ratio of the third generation
design CFBG. We therefore consider that the proposed design of CFBG stretcher and
compressor is a valuable development, as it should enable us to demonstrate significantly
shorter ( ~300 fs) recompressed pulses from the system.
Table 5.1
5.5 Conclusion
In conclusion, we designed and implemented a bulk grating compressor that transmitted a
spectral window of 16 nm, had grating separation of 40 cm, operated at 41 degree angle of
incidence, and produced 2nd and 3rd order dispersion of D x Length = 45.5 ps/nm, ( 2β x Length
= -27x106 fs2/rad); and dD/dλ x Length = 1.5 ps/nm2 ( 3β x Length= 530 x106 fs3/rad2). Our
calculations indicated that 3rd order dispersion compensation would be necessary in order to
obtain high quality recompressed pulses with τFWHM <500 fs, and this was confirmed
experimentally by the large pedestal on the SHG autocorrelation observed when we used a
linearly chirped CFBG stretcher. Our initial CFBG tests showed highly uneven spectral
reflectivity caused by cladding mode losses when light was incident from the long wavelength
side of the grating. By optimising the strength of the grating (by annealing the CFBG after
writing) we have now largely controlled this problem. We then designed and implemented a
CFBG stretcher with 10nm spectral window and the correct 2nd and 3rd order dispersion to
compensate for the parameters of this bulk grating compressor. The grating had a well
controlled spectral response and the measured SHG autocorrelation showed that we obtained
high quality recompressed pulses with τFWHM = 470 fs (∆ν∆τ~0.7). The stretched pulse duration
from this grating was calculated to be ~220 ps. The combination of bulk grating compressor
and 10 nm CFBG stretcher should satisfy the requirements of our industrial sponsor.
To develop the CFBG technology to produce τFWHM ~300 fs pulses, we have re-designed the
pulse compressor to reduce the 3rd order dispersion relative to the 2nd order dispersion (D x
Length = 40.8 ps/nm, dD/dλ x Length = 0.34 ps/nm2), which should enable the fabrication of a
80
CFBG with spectral window >15 nm and with both 2nd and 3rd order dispersion to compensate
for the compressor. The calculated stretched pulse duration from this CFBG is ~300 ps. The
redesigned compressor will not operate at the most efficient angle of incidence for our bulk
grating, but we note that to develop the compressor for use at high average power may require
replacement of our gold-coated diffraction grating with a very high efficiency dielectric grating,
and it may be possible to select the replacement grating to have high efficiency at the required
angle of incidence. We consider that the proposed design of CFBG stretcher and bulk grating
compressor should enable ~300 fs recompressed pulses and is therefore a valuable development.
81
82
References 1. A. Galvanauskas, Z. Sartania and M. Bischoff, "Millijoule femtosecond fiber CPA
system," in Advanced Solid-State Lasers, Proceedings, vol. 50, OSA Trends in Optics and Photonics, C. Marshall, Ed. Washington, 2001, pp. 679-681.
2. N. G. R. Broderick, D. J. Richardson, D. Taverner, J. E. Caplen, L. Dong and M. Ibsen, "High-power chirped-pulse all-fiber amplification system based on large-mode-area fiber gratings," Optics Letters 24, 566-568 (1999).
3. M. Ibsen, M. K. Durkin, M. J. Cole, M. N. Zervas and R. I. Laming, "Recent Advances in Long Dispersion Compensating Fiber Bragg Gratings.," (IEE Colloquium on Optical Fiber Gratings) IEE, London, U.K. (1999).
4. G. P. Agrawal, Nonlinear Fiber Optics, Academic Press (San Diego), 2nd (1995). 5. M. C. Hutley, Diffraction Gratings, Academic Press (London), (1982). 6. C. Palmer, Diffraction Grating Handbook, Richardson Grating Laboratory (Rochester),
4th Edition (2000). 7. R. L. Fork, C. H. B. Cruz, P. C. Becker and C. V. Shank, "Compression of Optical
Pulses to 6 femtoseconds by Using Cubic Phase Compensation," Optics Letters 12, 483-485 (1987).
8. J. Limpert, T. Schreiber, T. Clausnitzer, K. Zollner, H. J. Fuchs, E. B. Kley, H. Zellmer and A. Tünnermann, "High-power femtosecond Yb-doped fiber amplifier," Optics Express 10, 628-638 (2002).
9. D. Gloge, "Weakly Guiding Fibers," Applied Optics 10, 2252-2258 (1971). 10. M. Ibsen, M. K. Durkin, M. N. Zervas, A. B. Grudinin and R. I. Laming, "Custom
design of long chirped Bragg gratings: Application to gain-flattening filter with incorporated dispersion compensation," IEEE Photonics Technology Letters 12, 498-500 (2000).
11. T. Erdogan, "Fiber Grating Spectra," Journal of Lightwave Technology 15, 1277 - 1294 (1997).
Chapter 6 Fiber Amplifier Cascade
6.1 Introduction
In this chapter, we describe the design and characterisation of the Yb-fiber amplifiers used in
the CPA and direct amplification systems described in Chapter 3. We also describe the
components use to suppress ASE build-up between the amplifier stages because these
components are common to both systems.
A detailed schematic of the complete CPA system is shown in Fig. 6.1. The system design
follows common practice by decreasing the pulse repetition rate to reduce gain saturation effects
and hence achieve higher pulse energies. The multi-stage amplifier system was necessary
because ASE limits the gain from a fiber amplifier to ~35 dB [1], but we required ~60 dB gain
in order to obtain pulses with E>10 µJ from our (highly stable) low power oscillator with pulse
energy ~ 60 pJ. If unchecked, ASE would build up along the amplifier cascade and saturate the
gain of the amplifiers we therefore used isolators and time gating (synchronised to the arrival of
each pulse) to avoid cascaded ASE. The necessary additional components created coupling
losses that totaled ~20 dB, including: 4 dB insertion loss of our pulse selector, 3 dB coupling
loss between each amplifier, and 10 dB coupling loss from the CFBG pulse stretcher. We
therefore required a cascade of three amplifiers to produce the necessary gain.
As described in Chapter 3, the goal of creating a robust and straightforward-to-manufacture
system suggested that using core-pumped amplifiers would be the preferred approach.
However, core-pumped amplifiers have limited scope for power-scaling, e.g. the maximum
available power from single-mode pump diodes is ~350 mW, and therefore cladding-pumping
was necessary for the final amplifier stage in order to obtain the required high output power.
We decided that the best aspects of both pumping technologies could be exploited by
developing two core-pumped pre-amplifiers, followed by a cladding-pumped power amplifier.
83

This chapter is organised as follows. We first describe the components used for pulse
selection and ASE suppression in Section 6.2. Next, we present our work to optimise the
amplifiers. Section 6.3 describes the development of the core-pumped pre-amplifiers. Section
6.4 describes the concept of cladding-pumped amplifiers. Section 6.5 describes a ‘GTWave’
cladding-pumped pre-amplifier. (‘GTWave’ is a cladding pumping scheme patented and
marketed by Southampton Photonics Inc. (SPI)) Section 6.6 describes LMA power amplifier
that was cladding-pumped using a conventional end-pumping configuration. The performance
of the CPA system as a whole is presented in the following chapter (Chapter 7), and the
performance of the direct amplification system is presented in Chapter 8.
Fig. 6.1. Detailed schematic of complete CPA system. (FR = Faraday rotator. MOPA = diode pump laser, FC/PC = fiber connector type.)
Oscillator EOMFC/PC FC/PC
λ/2
Bragg grating
50/50coupler
Preamplifier 1
MOPA
AOM λ/2
λ/4
AOMλ/2
λ/4MOPA
Preamplifier 2
Pumplaser
LMA amplifier
λ/2
Diffraction gratingcompressor
PC
OR
FRIN
OUT
Oscillator EOMFC/PC FC/PC
λ/2
Bragg grating
50/50coupler
Preamplifier 1
MOPAMOPA
AOM λ/2
λ/4
AOM λ/2
λ/4
AOMλ/2
λ/4
AOMλ/2
λ/4MOPAMOPA
Preamplifier 2
Pumplaser
LMA amplifier
λ/2
Diffraction gratingcompressor
PC
OR
FRIN
OUT
FRFRIN
OUT
-5dB-3dB-10dB
-3dB
-6dB
-3dB
+25dB
+27dB
+30dB
50 pJ
Gain: 82dBLoss: -24dBTotal: 58 dB
Photo- diode
Delay generator Trigger in Trigger out
Signal
Signal 1
Delay generator
Trigger in Signal 2
84

6.2 Pulse selection and amplifier gating
For pulse selection, we used a high extinction ratio (>50 dB) EOM. Using this device, the
repetition rate could, in principle, be reduced to any sub harmonic value of the oscillator. In
practice the lowest repetition rate used in our CPA system was limited to ~10 kHz by the
requirement to saturate the final amplifier.
ASE build-up along the amplifier chain can be a significant problem at low repetition rates.
To suppress this, both an isolator and an AOM were inserted between each amplifier. The
AOMs were aligned such that the first order diffracted beam was launched into the following
amplifier stage and were then activated for a only short time window to allow the pulses
through but to block the ASE background. The AOMs (supplied by AA Sa., model number AA
ST110_1.06) are made from TeO2 (acoustic velocity 4200 m/s) with specified rise time of
160 ns/mm. With a beam diameter ~1.5 mm, the experimentally determined optimum time
window (to just avoid clipping of the transmitted pulse) was found to be 320 ns. The electronic
timing control system was comprised of a trigger and delay/pulse generators controlling the
EOM (HP 8131A), and the AOMs (Stanford Research Systems DG 535). For the trigger, we
used a fast photodiode at the output port of the oscillator that is not used for seeding the system.
The electronic timing control system is shown schematically in . Polarisation
controllers were used to ensure maximum throughput from the isolators.
Fig. 6.1
6.3 Core pumped pre-amplifiers
The peak power in the pre-amplifiers is not high so, when using the CPA technique,
nonlinearity management is not a concern. To achieve stable, low-noise operation, we used
core pumping via a 980:1060 nm WDM in a forward pumped configuration. The measured
wavelength coupling characteristics of the WDM are shown in Chapter 4. We used standard
single-mode Yb-fiber for the gain medium (identical to that used in the oscillator). This section
is organised as follows. Section 6.3.1 describes the performance of the initial configuration of
the pre-amplifiers. Sections 6.3.2 and 6.3.3 describe design refinements that enable increased
gain to be obtained.
6.3.1 Initial performance
The initial configuration of the pre-amplifiers is shown in Fig. 6.2. Angled ends were used to
suppress unwanted Fresnel end-reflections. The length of the Yb-fiber was selected such that
the ASE spectrum was approximately flat and centered across the wavelength band of the signal
as shown in . Fig. 6.3
85

Wavelength (nm)1000 1020 1040 1060 1080 1100
Spec
trum
(dB
)
-40
-30
-20
-10
0Forward directionBackward direction
Fig. 6.2 Pre-amplifier: initial configuration
Fig. 6.2
Fig. 6.3 Measured pre-amplifier ASE
975 nm, ~220 mW pump
4 m Yb fiber
WDM OUTIN
The gain of the pre-amplifiers was characterised using a Nd:YLF seed laser (1047 nm), with a
signal-generator-driven AOM to control the input duty cycle. The input and output pulses were
measured using a photodiode, and calibrated neutral density filters were inserted at the amplifier
output to match the photodiode voltage to that at the input. The launch efficiency into the
WDM was measured before splicing on the Yb-fiber. For the pre-amplifier of , the
measured small-signal gain was ~25 dB, and the saturated output power was ≥ 50 mW, as
shown in Fig. 6.4. The gain was adequate for our requirements, but would limit future power
increases in the system, so we have also considered design improvements, described below, that
should enable increased gain to be obtained.
Input power (mW)0.1 1 10
Gai
n (d
B)
5
10
15
20
Input power (mW)0 10 20
Out
put p
ower
(mW
)
20
40
60
Fig. 6.4 Gain and output power characteristics of first pre-amplifier.
6.3.2 Increased gain using mid-amplifier pump injection
In this section, we describe a technique for obtaining increased gain from a core-pumped Yb-
doped fiber amplifier by recycling lost short-wavelength ASE. This technique was first applied
to Er-doped fiber amplifiers, but to our knowledge, has not been used previously in Yb-doped
fiber amplifiers.
86
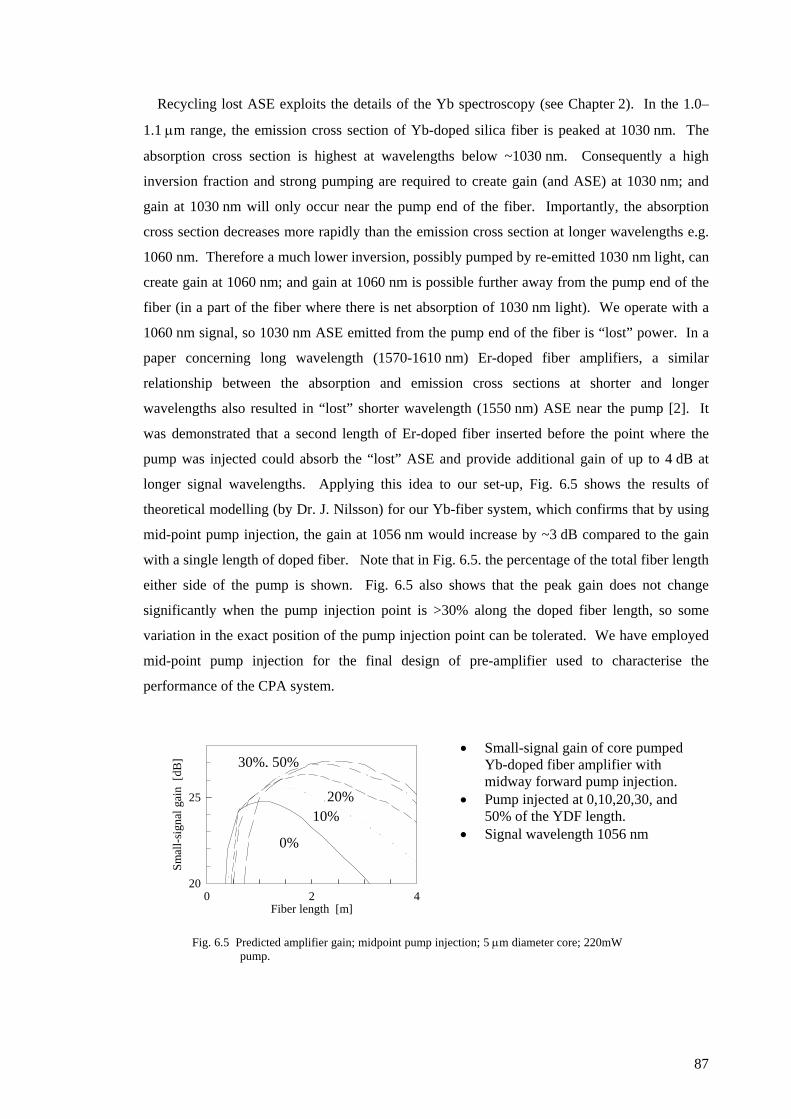
Recycling lost ASE exploits the details of the Yb spectroscopy (see Chapter 2). In the 1.0–
1.1 µm range, the emission cross section of Yb-doped silica fiber is peaked at 1030 nm. The
absorption cross section is highest at wavelengths below ~1030 nm. Consequently a high
inversion fraction and strong pumping are required to create gain (and ASE) at 1030 nm; and
gain at 1030 nm will only occur near the pump end of the fiber. Importantly, the absorption
cross section decreases more rapidly than the emission cross section at longer wavelengths e.g.
1060 nm. Therefore a much lower inversion, possibly pumped by re-emitted 1030 nm light, can
create gain at 1060 nm; and gain at 1060 nm is possible further away from the pump end of the
fiber (in a part of the fiber where there is net absorption of 1030 nm light). We operate with a
1060 nm signal, so 1030 nm ASE emitted from the pump end of the fiber is “lost” power. In a
paper concerning long wavelength (1570-1610 nm) Er-doped fiber amplifiers, a similar
relationship between the absorption and emission cross sections at shorter and longer
wavelengths also resulted in “lost” shorter wavelength (1550 nm) ASE near the pump [2]. It
was demonstrated that a second length of Er-doped fiber inserted before the point where the
pump was injected could absorb the “lost” ASE and provide additional gain of up to 4 dB at
longer signal wavelengths. Applying this idea to our set-up, shows the results of
theoretical modelling (by Dr. J. Nilsson) for our Yb-fiber system, which confirms that by using
mid-point pump injection, the gain at 1056 nm would increase by ~3 dB compared to the gain
with a single length of doped fiber. Note that in . the percentage of the total fiber length
either side of the pump is shown. Fig. 6.5 also shows that the peak gain does not change
significantly when the pump injection point is >30% along the doped fiber length, so some
variation in the exact position of the pump injection point can be tolerated. We have employed
mid-point pump injection for the final design of pre-amplifier used to characterise the
performance of the CPA system.
Fig. 6.5
Fig. 6.5
• Small-signal gain of core pumped Yb-doped fiber amplifier with midway forward pump injection.
• Pump injected at 0,10,20,30, and 50% of the YDF length.
• Signal wavelength 1056 nm
Fig. 6.5 Predicted amplifier gain; midpoint pump injection; 5 µm diameter core; 220mW pump.
Fiber length [m]0 2
Smal
l-sig
nal g
ain
[dB
]
20
25
30%, 50%
0%
20%10%
4
87
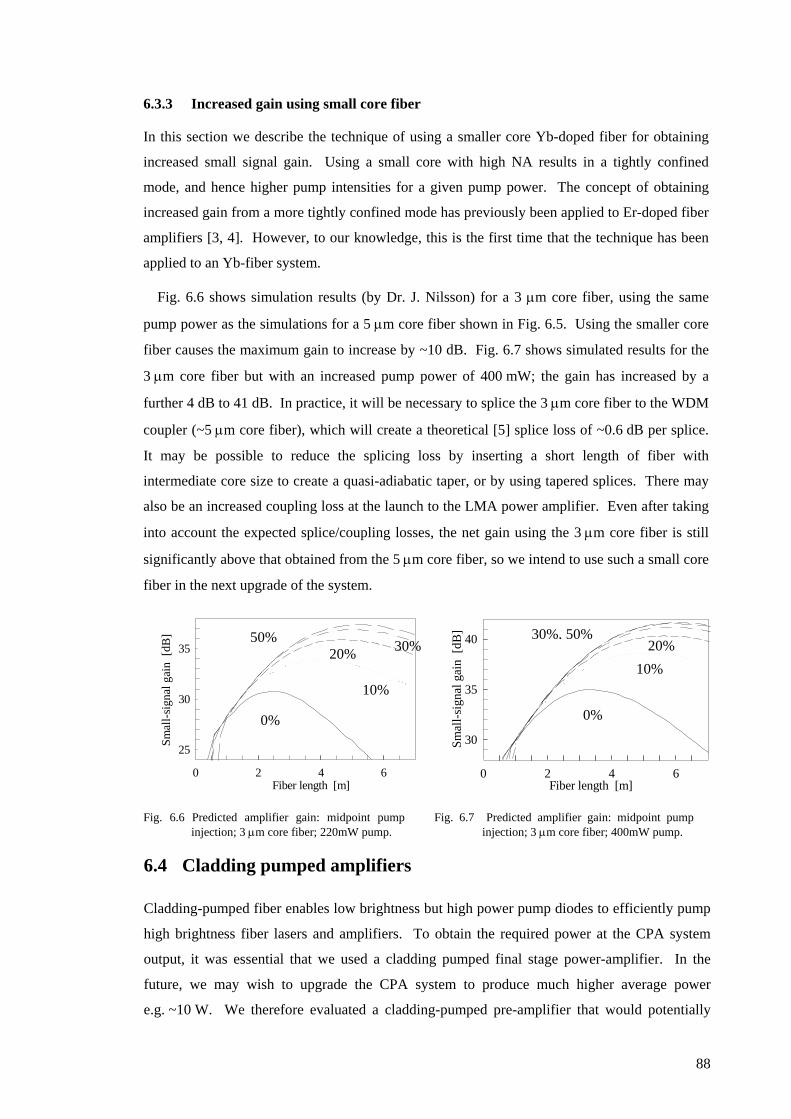
6.3.3 Increased gain using small core fiber
In this section we describe the technique of using a smaller core Yb-doped fiber for obtaining
increased small signal gain. Using a small core with high NA results in a tightly confined
mode, and hence higher pump intensities for a given pump power. The concept of obtaining
increased gain from a more tightly confined mode has previously been applied to Er-doped fiber
amplifiers [3, 4]. However, to our knowledge, this is the first time that the technique has been
applied to an Yb-fiber system.
Fig. 6.6
Fig. 6.6 Predicted amplifier gain: midpoint pump injection; 3 µm core fiber; 220mW pump.
Fig. 6.7 Predicted amplifier gain: midpoint pump injection; 3 µm core fiber; 400mW pump.
shows simulation results (by Dr. J. Nilsson) for a 3 µm core fiber, using the same
pump power as the simulations for a 5 µm core fiber shown in . Using the smaller core
fiber causes the maximum gain to increase by ~10 dB. Fig. 6.7 shows simulated results for the
3 µm core fiber but with an increased pump power of 400 mW; the gain has increased by a
further 4 dB to 41 dB. In practice, it will be necessary to splice the 3 µm core fiber to the WDM
coupler (~5 µm core fiber), which will create a theoretical [5] splice loss of ~0.6 dB per splice.
It may be possible to reduce the splicing loss by inserting a short length of fiber with
intermediate core size to create a quasi-adiabatic taper, or by using tapered splices. There may
also be an increased coupling loss at the launch to the LMA power amplifier. Even after taking
into account the expected splice/coupling losses, the net gain using the 3 µm core fiber is still
significantly above that obtained from the 5 µm core fiber, so we intend to use such a small core
fiber in the next upgrade of the system.
Fig. 6.5
Fiber length [m]0 2 4 6
Smal
l-sig
nal g
ain
[dB
]
25
30
35
0%
10%
50% 30% 20%
Fiber length [m]0 2 4 6
Smal
l-sig
nal g
ain
[dB
]
30
35
40 30%, 50%
0%
20%10%
6.4 Cladding pumped amplifiers
Cladding-pumped fiber enables low brightness but high power pump diodes to efficiently pump
high brightness fiber lasers and amplifiers. To obtain the required power at the CPA system
output, it was essential that we used a cladding pumped final stage power-amplifier. In the
future, we may wish to upgrade the CPA system to produce much higher average power
e.g. ~10 W. We therefore evaluated a cladding-pumped pre-amplifier that would potentially
88

provide sufficient input power to saturate the final amplifier even when producing such a high
average output power. Section 6.5 describes the evaluation of a cladding-pumped pre-amplifier,
and Section 6.6 describes the design and performance of the cladding-pumped final stage
power-amplifier.
6.5 GTWave pre-amplifier
This section describes the charactersitics of a cladding pumped pre-amplifier that could produce
much higher average power compared to a core-pumped pre-amplifier. The usual arrangement
for launching the pump into the fiber inner cladding is to use a lens pair and dichroic mirror, and
is shown in , and this technique was used for the LMA power-amplifier. However, this
arrangement is bulky, and requires precise alignment. An ingenious alternative developed by
Dr. Anatoly Grudinin and Paul Turner (ORC/SPI: European patent application number
W0067350) called GTWave fiber, is shown schematically in . A fiber with a doped core
is held in contact with a pure silica dummy fiber, encased together in a low refractive index
outer clad. The fiber pigtailed pump diode is spliced directly to the dummy fiber, from which
the power transfers across to the doped fiber and into the Yb-doped core.
Fig. 6.11
Fig. 6.8
Total launched pump power (W)1.6 1.8 2.0 2.2 2.4
Gai
n (d
B)
26
28
30
Fig. 6.8 Schematic of GTWave fiber: a) cross section view (Yb-doping confined to active fiber core (shaded)), b) side view.
Fig. 6.9. Gain characteristics of GTWave amplifier. Maximum output power = 200 mW. Bi-directional pumping with maximum pump power from each end of ~1.2W.
a)
b)
Yb-doped fiber Pure silica “Dummy” fiber
Low refractive index coating
We measured the small signal gain of a GTWave amplifier using pump power >2 W, and
using an AOM gated Nd:YLF seed (1047 nm). We obtained ~31 dB small signal gain from an
amplifier with ~2.5 m doped fiber length as shown in Fig. 6.9. However the amplifier we tested
was an early prototype and the pump to signal optical efficiency was only ~10%, due to pump
leakage from the dummy fiber and incomplete absorption. GTWave amplifiers using Er-doped
89
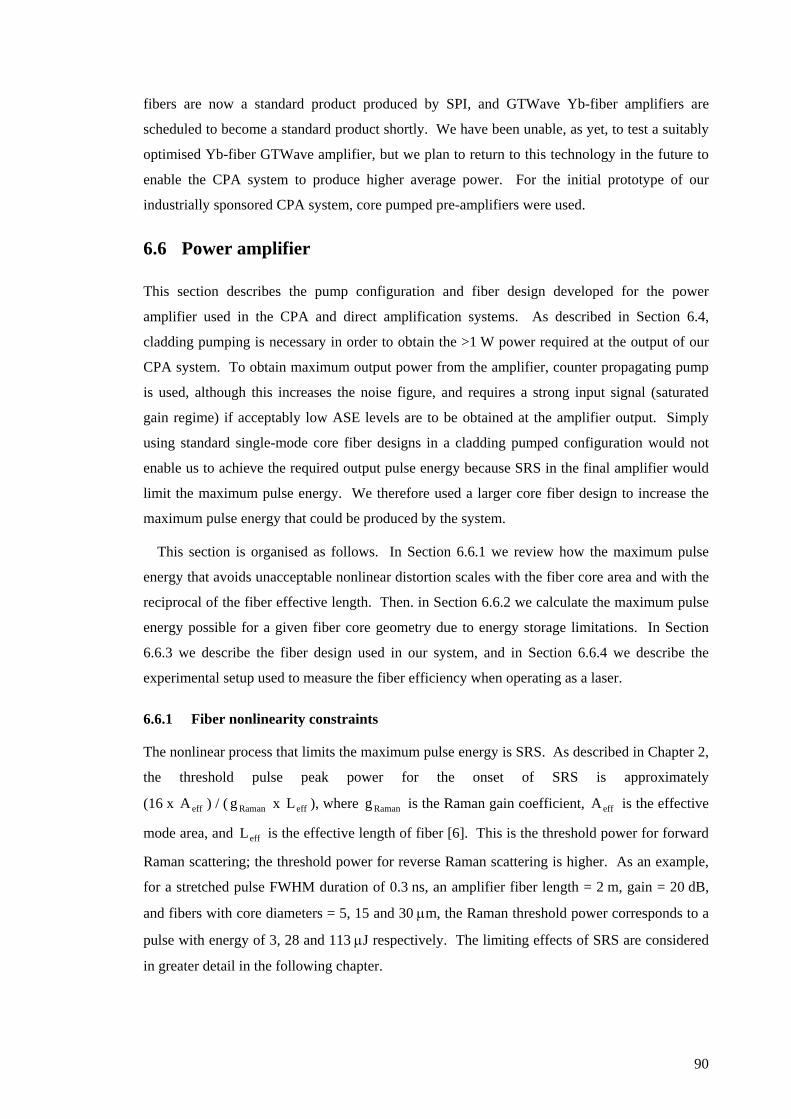
fibers are now a standard product produced by SPI, and GTWave Yb-fiber amplifiers are
scheduled to become a standard product shortly. We have been unable, as yet, to test a suitably
optimised Yb-fiber GTWave amplifier, but we plan to return to this technology in the future to
enable the CPA system to produce higher average power. For the initial prototype of our
industrially sponsored CPA system, core pumped pre-amplifiers were used.
6.6 Power amplifier
This section describes the pump configuration and fiber design developed for the power
amplifier used in the CPA and direct amplification systems. As described in Section 6.4,
cladding pumping is necessary in order to obtain the >1 W power required at the output of our
CPA system. To obtain maximum output power from the amplifier, counter propagating pump
is used, although this increases the noise figure, and requires a strong input signal (saturated
gain regime) if acceptably low ASE levels are to be obtained at the amplifier output. Simply
using standard single-mode core fiber designs in a cladding pumped configuration would not
enable us to achieve the required output pulse energy because SRS in the final amplifier would
limit the maximum pulse energy. We therefore used a larger core fiber design to increase the
maximum pulse energy that could be produced by the system.
This section is organised as follows. In Section 6.6.1 we review how the maximum pulse
energy that avoids unacceptable nonlinear distortion scales with the fiber core area and with the
reciprocal of the fiber effective length. Then. in Section 6.6.2 we calculate the maximum pulse
energy possible for a given fiber core geometry due to energy storage limitations. In Section
6.6.3 we describe the fiber design used in our system, and in Section 6.6.4 we describe the
experimental setup used to measure the fiber efficiency when operating as a laser.
6.6.1 Fiber nonlinearity constraints
The nonlinear process that limits the maximum pulse energy is SRS. As described in Chapter 2,
the threshold pulse peak power for the onset of SRS is approximately
(16 x ) / ( g x ), where is the Raman gain coefficient, is the effective
mode area, and is the effective length of fiber [6]. This is the threshold power for forward
Raman scattering; the threshold power for reverse Raman scattering is higher. As an example,
for a stretched pulse FWHM duration of 0.3 ns, an amplifier fiber length = 2 m, gain = 20 dB,
and fibers with core diameters = 5, 15 and 30 µm, the Raman threshold power corresponds to a
pulse with energy of 3, 28 and 113 µJ respectively. The limiting effects of SRS are considered
in greater detail in the following chapter.
effA Raman
effL
effL Ramang effA
90

Even below the threshold for SRS, nonlinear pulse phase distortion arises due to SPM, and
this can increase the duration of the recompressed pulse and decrease the peak to pedestal
contrast ratio [7]. Although in a CPA system the phase-distortion introduced by SPM can, in
principle, be pre-compensated by purely linear devices [8], e.g. a spatial light modulator [9], we
would prefer to avoid this complexity by preventing excessive SPM induced pulse distortion
from occurring. Using large core fibers decreases the intensity and hence increases the pulse
energy threshold for unacceptable SPM induced distortion. In our system we used LMA fiber
for the final amplifier with a 15 µm core diameter.
6.6.2 Energy storage constraints
As an estimate of the maximum extractable energy, we consider the maximum energy
Q-switched pulse that can be obtained from a given fiber. As a direct result of the high gain and
tightly confined optical mode, rapid energy loss in the form of ASE limits the Q-switched pulse
energy from conventional single-mode Er and Yb-doped fibers to ~ 10 µJ [10] and 100 µJ [11]
respectively. The extractable pulse energy is influenced by the spectroscopic properties of the
dopant, the available pump power, and the fiber geometry, and a good estimate for the
maximum energy obtainable from a fiber is Emax~10 x saturation energy. The saturation energy
is calculated as Esat= ))((Ah sasess Γ+σσν , where sνh is the signal photon energy, is the
doped area, Γ is the signal overlap with the active dopant, and
A
s esσ and asσ are the signal
emission and absorption cross sections [12]. For fibers that have the active dopant confined
within the core, that Esat is then approximately proportional to the signal mode area [11], and by
using large core Yb-doped fibers, single-mode Q-switched pulses with >5 mJ have been
produced [12]. We conclude that whereas the extractable energy from a conventional single-
mode fiber would probably prove problematic for our target of 10-50 µJ, this limitation would
be avoided by using LMA fiber.
6.6.3 Fiber design
As described above, to overcome the constraints imposed by energy storage and nonlinear pulse
distortion, we used a large mode design for the fiber core and this section provides details of the
core design. Earlier work using large core multimode fiber amplifiers demonstrated increased
pulse energy and increased threshold for nonlinear distortion, although without necessarily
maintaining M2 = 1 beam quality [1]. More recently, Fermann et al. at IMRA used large core
multimode fibers to obtain increased pulse energies, whilst attempting to maintain single-mode
beam quality by exciting only the fundamental mode at the fiber input [13]. However, the mode
quality obtained this multi-mode fiber approach is perhaps less inherently robust against
91
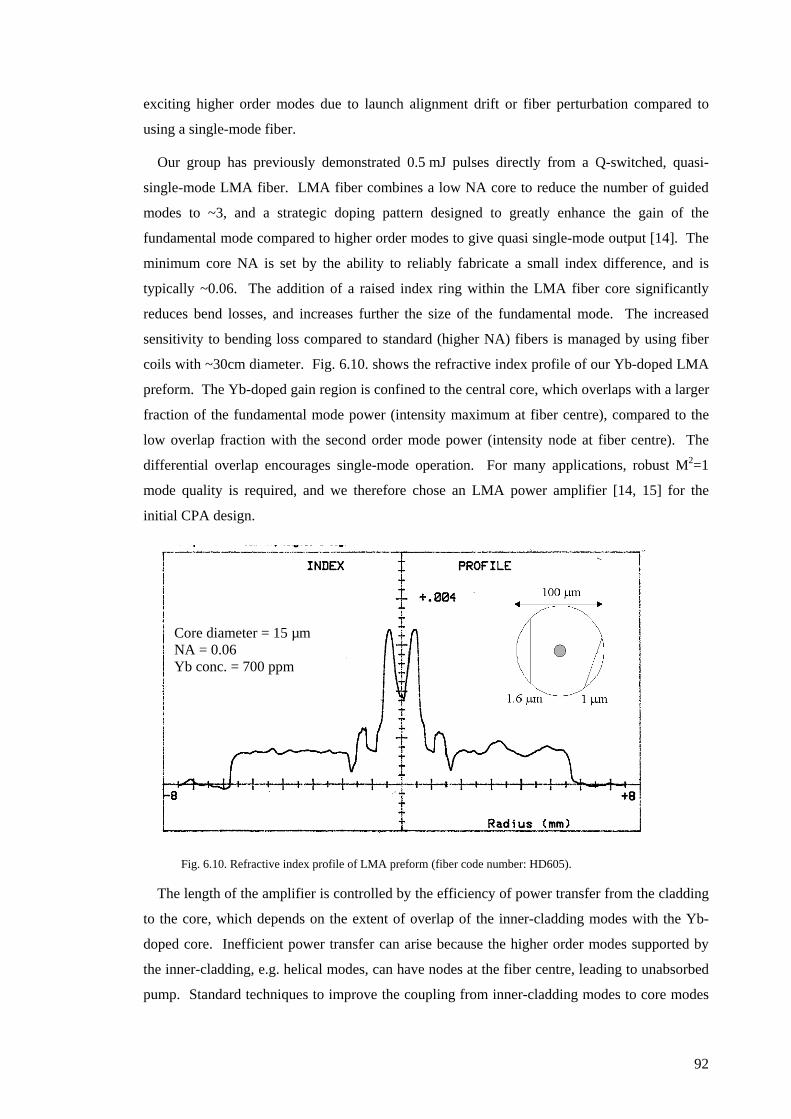
exciting higher order modes due to launch alignment drift or fiber perturbation compared to
using a single-mode fiber.
Our group has previously demonstrated 0.5 mJ pulses directly from a Q-switched, quasi-
single-mode LMA fiber. LMA fiber combines a low NA core to reduce the number of guided
modes to ~3, and a strategic doping pattern designed to greatly enhance the gain of the
fundamental mode compared to higher order modes to give quasi single-mode output [14]. The
minimum core NA is set by the ability to reliably fabricate a small index difference, and is
typically ~0.06. The addition of a raised index ring within the LMA fiber core significantly
reduces bend losses, and increases further the size of the fundamental mode. The increased
sensitivity to bending loss compared to standard (higher NA) fibers is managed by using fiber
coils with ~30cm diameter. . shows the refractive index profile of our Yb-doped LMA
preform. The Yb-doped gain region is confined to the central core, which overlaps with a larger
fraction of the fundamental mode power (intensity maximum at fiber centre), compared to the
low overlap fraction with the second order mode power (intensity node at fiber centre). The
differential overlap encourages single-mode operation. For many applications, robust M2=1
mode quality is required, and we therefore chose an LMA power amplifier [14, 15] for the
initial CPA design.
Fig. 6.10
Fig. 6.10. Refractive index profile of LMA preform (fiber code number: HD605).
Core diameter = 15 µm NA = 0.06 Yb conc. = 700 ppm
The length of the amplifier is controlled by the efficiency of power transfer from the cladding
to the core, which depends on the extent of overlap of the inner-cladding modes with the Yb-
doped core. Inefficient power transfer can arise because the higher order modes supported by
the inner-cladding, e.g. helical modes, can have nodes at the fiber centre, leading to unabsorbed
pump. Standard techniques to improve the coupling from inner-cladding modes to core modes
92
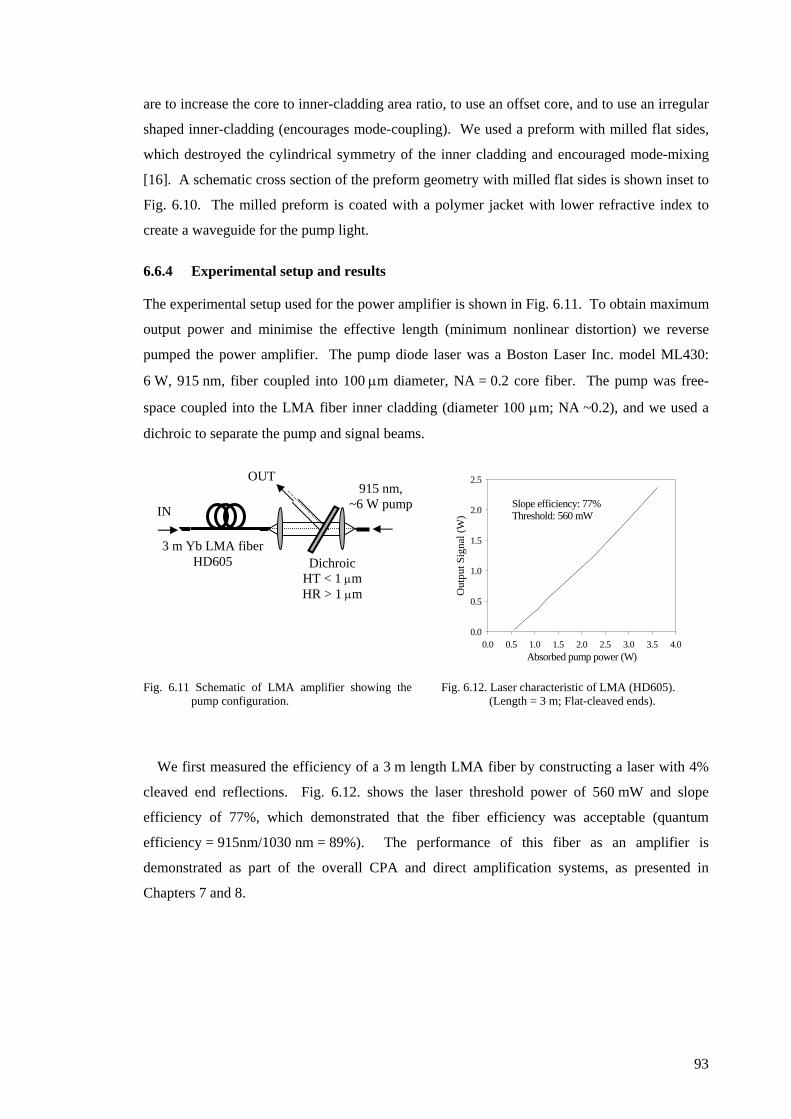
are to increase the core to inner-cladding area ratio, to use an offset core, and to use an irregular
shaped inner-cladding (encourages mode-coupling). We used a preform with milled flat sides,
which destroyed the cylindrical symmetry of the inner cladding and encouraged mode-mixing
[16]. A schematic cross section of the preform geometry with milled flat sides is shown inset to
. The milled preform is coated with a polymer jacket with lower refractive index to
create a waveguide for the pump light.
Fig. 6.10
6.6.4 Experimental setup and results
The experimental setup used for the power amplifier is shown in . To obtain maximum
output power and minimise the effective length (minimum nonlinear distortion) we reverse
pumped the power amplifier. The pump diode laser was a Boston Laser Inc. model ML430:
6 W, 915 nm, fiber coupled into 100 µm diameter, NA = 0.2 core fiber. The pump was free-
space coupled into the LMA fiber inner cladding (diameter 100 µm; NA ~0.2), and we used a
dichroic to separate the pump and signal beams.
Fig. 6.11
Absorbed pump power (W)0.0 0.5 1.0 1.5 2.0 2.5 3.0 3.5 4.0
Out
put S
igna
l (W
)
0.0
0.5
1.0
1.5
2.0
2.5
Slope efficiency: 77%Threshold: 560 mW
Fig. 6.11 Schematic of LMA amplifier showing the pump configuration.
Fig. 6.12. Laser characteristic of LMA (HD605).
Fig. 6.12
(Length = 3 m; Flat-cleaved ends).
Dichroic HT < 1 µm HR > 1 µm
IN
OUT
3 m Yb LMA fiber HD605
915 nm, ~6 W pump
We first measured the efficiency of a 3 m length LMA fiber by constructing a laser with 4%
cleaved end reflections. . shows the laser threshold power of 560 mW and slope
efficiency of 77%, which demonstrated that the fiber efficiency was acceptable (quantum
efficiency = 915nm/1030 nm = 89%). The performance of this fiber as an amplifier is
demonstrated as part of the overall CPA and direct amplification systems, as presented in
Chapters 7 and 8.
93
94
References 1. B. Desthieux, R. I. Laming and D. N. Payne, "111 kW (0.5 mJ) Pulse Amplification at
1.5-microns Using a Gated Cascade of 3 Erbium-Doped Fiber Amplifiers," Applied Physics Letters 63, 586-588 (1993).
2. J. H. Lee, U. C. Ryu, S. J. Ahn and N. K. Park, "Enhancement of power conversion efficiency for an L-band EDFA with a secondary pumping effect in the unpumped EDF section," IEEE Photonics Technology Letters 11, 42-44 (1999).
3. C. R. Giles and E. Desurvire, "Modeling Erbium-Doped Fiber Amplifiers," Journal of Lightwave Technology 9, 271-283 (1991).
4. B. Pedersen, A. Bjarklev, J. H. Povlsen, K. Dybdal and C. C. Larsen, "The Design of Erbium-Doped Fiber Amplifiers," Journal of Lightwave Technology 9, 1105-1112 (1991).
5. P. K. Cheo, Fiber Optics and Optoelectronics, Prentice Hall 2nd (1990). 6. R. G. Smith, "Optical power handling capacity of low loss optical fibers as determined
by stimulated Raman and Brillouin scattering," Applied Optics 11, 2489 - 2494 (1972). 7. Y. H. Chuang, D. D. Meyerhofer, S. Augst, H. Chen, J. Peatross and S. Uchida,
"Suppression of the Pedestal in a Chirped-Pulse-Amplification Laser," Journal of the Optical Society of America B-Optical Physics 8, 1226-1235 (1991).
8. A. Galvanauskas, "Mode-scalable fiber-based chirped pulse amplification systems," IEEE Journal of Selected Topics in Quantum Electronics 7, 504-517 (2001).
9. F. G. Omenetto, A. J. Taylor, M. D. Moores and D. H. Reitze, "Adaptive control of femtosecond pulse propagation in optical fibers," Optics Letters 26, 938-940 (2001).
10. H. L. Offerhaus, N. G. Broderick, D. J. Richardson, R. Sammut, J. Caplen and L. Dong, "High-energy single-transverse-mode Q-switched fiber laser based on a multimode large-mode-area erbium-doped fiber," Optics Letters 23, 1683-1685 (1998).
11. C. C. Renaud, H. L. Offerhaus, J. A. Alvarez-Chavez, J. Nilsson, W. A. Clarkson, P. W. Turner, D. J. Richardson and A. B. Grudinin, "Characteristics of Q-switched cladding-pumped ytterbium-doped fiber lasers with different high-energy fiber designs," IEEE Journal of Quantum Electronics 37, 199-206 (2001).
12. C. C. Renaud, J. A. Alvarez-Chavez, J. K. Sahu and J. Nilsson, "7.7 mJ pulses from a large core Yb-doped Cladding pumped Q-switched fibre laser," Conference on Lasers and Electro Optics (CLEO), Vol. 56 of OSA Trends in Optics and Photonics Series (Optical Society of America, Washington, D.C., 2001) paper CTuQ5 (2001).
13. M. E. Fermann, A. Galvanauskas, M. L. Stock, K. K. Wong, D. Harter and L. Goldberg, "Ultrawide tunable Er soliton fiber laser amplified in Yb-doped fiber," Optics Letters 24, 1428-1430 (1999).
14. N. G. R. Broderick, H. L. Offerhaus, D. J. Richardson and R. A. Sammut, "Power scaling in passively mode-locked large-mode area fiber lasers," IEEE Photonics Technology Letters 10, 1718-1720 (1998).
15. N. G. R. Broderick, H. L. Offerhaus, D. J. Richardson, R. A. Sammut, J. Caplen and L. Dong, "Large mode area fibers for high power applications," Optical Fiber Technology 5, 185-196 (1999).
16. H. Zellmer, A. Tünnermann, H. Welling and V. Reichel, Optical Amplifiers and their Applications, OSA Trends in Optics and Photonics Series 16, 137 (1997).
Chapter 7 Overall CPA System Performance
7.1 Introduction
In this chapter, we describe the performance of the complete CPA system developed for our
industrial sponsors. The overall design of the system was described in Chapter 3, and the
characteristics of the individual components were described in Chapters 4, 5, and 6. This
chapter is structured as follows. We first describe the pre-amplifier configuration in Section
7.2, and the design of pulse stretcher in Section 7.3. In Section 7.4 we present results showing
characteristics of the final output pulses from the system at repetition rates from the maximum
of 54 MHz, and as low as 10 kHz (the minimum repetition rate for good signal to ASE ratio).
Pulses generated with energy ~10 µJ have been cleanly recompressed to ~500 fs. Section 7.5
presents calculations which show that by slightly reducing the length, and increasing the core
diameter of the the fiber for the final amplifier, it should be possible to reduce the effects of
SRS and SPM sufficiently to enable the system to produce pulses with energy ~100 µJ. Section
7.6 presents our conclusions.
7.2 Configuration of pre-amplifiers
The core-pumped design of the pre-amplifiers was described in Chapter 6, and gain and ouptut
power characteristics were presented for core-pumped pre-amplifiers in an end-pumped
configuration. It was also shown in Chapter 6, that by using mid-point pump injection in
preference to end-pumping, it should be possible to obtain increased gain. When characterising
the CPA performance for our industrial sponsors, we first converted the pre-amplifiers to this
configuration as shown in . The two pre-amplifiers have almost identical construction,
differing mainly due to different wavelength pump sources. We assessed the appropriate length
of Yb-doped fiber by tuning the ASE spectrum. The total fiber lengths are similar to the end
pumped pre-amplifiers for which the gain charactersistics were presented in Chapter 6.
Fig. 7.1
95

Pream plifier 1 setup
- Sm all signal gain: 25 dB @ 1056 nm- Saturation output power: 50 m W
966 nm, ~150 mW pump
0.5 m Yb+3
fiber3 m Yb+3
Fiber HD406
IN OUT
W DM
966 nm, ~150 mW pump
0.5 m Yb+3
fiber3 m Yb+3
Fiber HD406
IN OUT
W DM
Pream plifier 2 setup
- Sm all signal gain: 27 dB @ 1056 nm- Saturation output pow er: 110 mW
975 nm, ~220 mW pump
1.2 m Y b+3
fiber2.5 m Yb+3
Fiber HD406
IN OUT
W DM
975 nm, ~220 mW pump
1.2 m Y b+3
fiber2.5 m Yb+3
Fiber HD406
IN OUT
W DM
Fig. 7.1 Schematic of preamplifiers as used for complete CPA characterisation.
7.3 Configuration of pulse-stretcher
The targeted stretched pulse duration for the final CFBG stretcher design described in Chapter 5
was 300 ps. Due to delays in obtaining our CFBG pulse stretcher, we performed initial tests on
our amplifier system using ~500 m of single mode fiber as a pulse stretcher. Using a 20 GHz
photodiode and sampling oscilloscope, we measured the stretched pulse FWHM to be 322 ps as
shown in Fig. 7.2. The measured duration is very close to the 300 ps that should be obtained
from the CFBG, and therefore the CPA pulse energy results that we obtain using the fiber
stretcher are therefore a valuable guide to the expected performance of the final system using a
CFBG pulse stretcher. Using single mode fiber as the pulse stretcher has the advantage of
transmitting the full bandwidth of the pulses, and because the fiber stretcher is spliced directly
to the pre-amplifier without requiring a circulator, it results in comparatively low-losses. The
disadvantage of using a fiber-stretcher is that it has the same sign of 3rd order dispersion as the
bulk grating compressor, and the accumulated 3rd order dispersion results in a “ringing”
structure on the trailing edge of the re-compressed pulse (see Chapter 5).
Time (ps)-1000 -500 0 500 1000
Inte
nsity
(Arb
. uni
ts)
0.00
0.02
0.04
0.06
0.08
0.10
0.12
0.14
Pulse FWHM322 ps
Fig. 7.2 Duration of stretched pulse after ~500 m of single mode fiber.
96

7.4 Experimental results
This section shows the performance of the CPA system as a whole. Beam quality (M2)
measurements were performed on the final amplified pulses using a “Modemaster” supplied by
Coherent. The measured beam quality was M2 = 1.3 (fiber core diameter of 19 µm, and outer
diameter of 100 µm). We have since found that the mode quality at the amplifier output is
strongly influenced by the signal launch at the fiber input. The fraction of the power in the
higher order mode could be observed directly using an autocorrelation measurement because
pulses in the fundamental and higher order modes propagated at different velocities along the
LMA fiber and therefore separated temporally, and which enabled us to see satellite pulses on
the autocorrelation measurements of the recompressed pulses. We observed that the intensity of
the satellite pulses was strongly influenced by the signal launch into the LMA. We would
therefore expect that quasi single-mode operation would be obtainable from this 19 µm core
diameter LMA fiber by optimising the signal launch.
The average output power and pulse energy vs. repetition rate for a constant pump power of
3.5 W (>2.0 W launched) are shown in . Fig. 7.3
Fig. 7.3. System output power and pulse energies after the LMA amplifier.
Repetition rate (kHz)10 100 1000 10000 100000
Puls
e En
ergy
( µJ)
0
20
40
60
80
100
Ave
rage
pow
er (W
)
1.0
1.2
1.4
1.6
1.8
The corresponding output spectra are shown in . At high repetition rates the signal
spectrum is clean and >10 dB above the ASE, as shown by (a) and (b). However, ASE
at ~1030 nm started to become more prominent at a repetition rate of 100 kHz as shown in
(c). Raman scattering is evident at the highest pulse energies (lowest repetition rates) and
has transferred a significant fraction of the energy to a broad longer-wavelength band as shown
by Fig. 7.4 (c) and (d). From these spectral measurements we concluded that when considered
as a practical limitation on the acceptable performance of the system, the SRS threshold pulse
energy for our 15 µm core LMA is above 16 µJ but not as high as 76 µJ.
Fig. 7.4
Fig. 7.4
Fig.
7.4
97
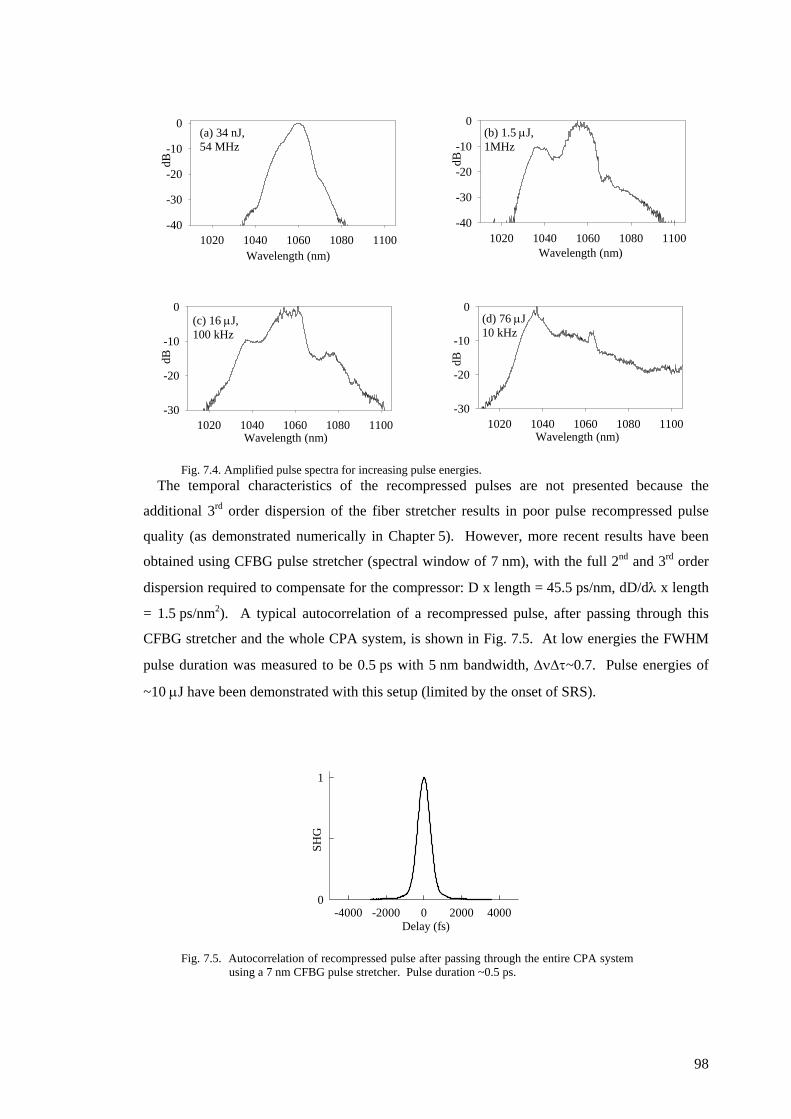
Wavelength (nm)1020 1040 1060 1080 1100
dB
-40
-30
-20
-10
0(a) 34 nJ, 54 MHz
Wavelength (nm)1020 1040 1060 1080 1100
dB
-40
-30
-20
-10
0(b) 1.5 µJ, 1MHz
Wavelength (nm)1020 1040 1060 1080 1100
dB
-30
-20
-10
0
Wavelength (nm)1020 1040 1060 1080 1100
dB
-30
-20
-10
0(d) 76 µJ 10 kHz
(c) 16 µJ, 100 kHz
Fig. 7.4. Amplified pulse spectra for increasing pulse energies. The temporal characteristics of the recompressed pulses are not presented because the
additional 3rd order dispersion of the fiber stretcher results in poor pulse recompressed pulse
quality (as demonstrated numerically in Chapter 5). However, more recent results have been
obtained using CFBG pulse stretcher (spectral window of 7 nm), with the full 2nd and 3rd order
dispersion required to compensate for the compressor: D x length = 45.5 ps/nm, dD/dλ x length
= 1.5 ps/nm2). A typical autocorrelation of a recompressed pulse, after passing through this
CFBG stretcher and the whole CPA system, is shown in . At low energies the FWHM
pulse duration was measured to be 0.5 ps with 5 nm bandwidth, ∆ν∆τ~0.7. Pulse energies of
~10 µJ have been demonstrated with this setup (limited by the onset of SRS).
Fig. 7.5
Delay (fs)-4000 -2000 0 2000 4000
SHG
0
1
Fig. 7.5. Autocorrelation of recompressed pulse after passing through the entire CPA system using a 7 nm CFBG pulse stretcher. Pulse duration ~0.5 ps.
98

7.5 Extending the system capabilities
As described in Chapter 3, the target pulse energy for our industrial sponsors is 10-50 µJ, at a
repetition rate of 10 kHz (average power 0.5 W). The grating compressor has a transmission
loss of ~3 dB, so the target pulse energy immediately after the LMA amplifier is 20-100 µJ.
The maximum pulse energy demonstrated with this system configuration of section 7.4 was
limited by SRS to ~50 µJ, and in this section we present calculations showing that increasing
the core diameter of the LMA fiber should enable 100 µJ pulses to be produced. Having
established the required system parameters to avoid SRS, we then show numerical simulation
results used to consider the possible effects of SPM on the quality of the re-compressed pulses.
We first compare the energy for which SRS was observed experimentally to be unacceptable
with the calculated SRS threshold energy. Considering the system configuration with the
characteristics described above, (measured pulse duration 0.32 ns, 2 m long amplifier fiber,
15 µm core diameter, and 20 dB gain), the calculated SRS threshold energy is ~30 µJ. The 2 m
fiber length used in this calculation corresponds to longer physical length of fiber because
reverse pumping significantly reduces the effective length of the fiber. The calculated SRS
threshold energy is approximately equal to the measured (>16 µJ) threshold energy that was
estimated from the data in Section 7.4 to correspond to the limit for acceptable spectral
distortion.
We used a 915nm pump in our initial setup due to short-term diode availability. However,
the strongest absorption peak of Yb-doped fiber is at 975 nm (four times stronger absorption
compared to 915 nm), so we would like to pump at 975 nm to minimise the fiber length needed
to absorb the pump. Switching to a 975 nm source should enable us to use a shorter final
amplifier in order to achieve pulse energies at least double those presented in . For
example, using an estimated final fiber length of L~1.5 m, and a 0.3 ns stretched pulse duration,
with amplifier gain=20 dB, would result in an increased pulse energy threshold for SRS of
38 µJ for a 15 µm diameter core (compared to the L=2 m configuration SRS threshold of 30µJ).
Increasing the core diameter to 29 µm would further increase the SRS threshold pulse energy to
100 µJ for an amplifier with gain =15 dB, and to 131 µJ for an amplifier with gain=20 dB.
Fig. 7.4
To estimate the effects of SPM on the quality of the re-compressed pulse, we performed
numerical modelling. In performing this modelling, I am grateful to Dr. Rüdiger Paschotta for
allowing me to use "ProPulse", which is a numerical modelling package he has written for
simulating pulse propagation in fibers, lasers, and OPO cavities. One difficulty of modelling
stretched (i.e. chirped) pulses is that the number of grid points is proportional to the product of
(Time Range x Frequency Range), so increases with the chirp. As explained in Chapter 2, the
99

nonlinear phase-shift due to SPM is proportional to the peak power, so the pulse energy and
duration can be scaled provided that the original peak power is preserved. To reduce the grid
size, a shorter pulse with 1/60 of the original duration, i.e. FWHM = 5 ps, was considered but
without changing the 8 nm bandwidth (bandwidth = half of the final CFBG spectral window).
The input pulse was a linearly chirped, and has the same peak power as for the 100 µJ, 0.3 ns
stretched pulse. The relative importance of SPM and GVD will be slightly different for the
shorter pulse, but as the fiber length is short, and the 5 ps pulse is still highly chirped (∆ν∆τ~ 25
times transform limit), the results from the modelling should provide a good indication of the
behaviour of the longer pulse. A second simplification is to model propagation in passive fiber
(no gain) by scaling the length of passive fiber to equal Leff of the amplifier fiber (Leff calculated
assuming constant gain per unit length). We believe that this length scaling should provide a
good indication of the results that would be obtained for a longer fiber which has gain. The
simulation parameters were Lamplifier = 1.5 m, G=15 dB (Leff = 0.42 m), core diameter = 29 µm,
fiber dispersion: D= - 40 ps/(nm.km) throughout. The re-compression was performed by
applying a linear chirp (optimised to maximise the peak power), so the higher-order pulse phase
distortion caused by SPM remains. Table 7.1 shows the parameters of the re-compressed pulse
for the various pulse energies that were simulated.
Table 7.1. Pulse parameters used for numerical simulations in . Fig. 7.6
Fig. 7.6
E (µJ) for 0.3 ns chirped pulse
E (µJ) equivalent for 5 ps chirped pulse
FWHM (fs) of 5ps pulse after propagation and recompression
Peak power (kW)
Pulse quality: (∆ν∆τ)/(0.44), where ∆τ is the RMS width (not FWHM)
Dispersion applied by compressor (ps2)
0.01 1.667x10⁻⁴ 205 0.732 1.05 -0.379 10 0.1667 239 570 2.19 -0.341 50 0.8333 206 2580 12.2 -0.189 100 1.667 151 6170 24 -0.120
shows the predicted shapes of the re-compressed pulses. The peak powers have been
normalised to facilitate comparison of the pulse shapes. Fig. 7.6(a) shows the power of re-
compressed pulses on a linear scale; and Fig. 7.6(b) shows the power of re-compressed pulses
measured in dB. With power plotted on a linear scale, the duration of the compressed pulse
does not appear to change drastically as the energy increases, but the higher energy pulses have
distinct side lobes, which contain an increasing fraction of the pulse energy. Fig. 7.6 (b) shows
the pulse on a dB scale, and more clearly demonstrates that for the highest energy pulse, there is
a substantial fraction of the pulse energy in the pedestal, and that the peak:pedestal contrast ratio
has decreased. The decrease in contrast could be detrimental for some applications which
require a short interaction time, because the pedestal would arrive well before the peak, and due
to the reduced contrast ratio, might have sufficient power to excite the relevant nonlinear
process, which would effectively prolong the interaction.
100

Pulse power (dB)
Time (ps)-4 -2 0 2 4
Inte
nsity
(dB
)
-40
-20
010 nJ 10 µJ 50 µJ100 µJ
b)
Time (ps)-0.5 0.0 0.5
Inte
nsity
(lin
.)
0.0
0.5
1.010 nJ10 µJ50 µJ100 µJ
a)
Pulse power (linear)
Fig. 7.6. Simulation results showing distortion due to SPM in final amplifier for pulses with 8 nm bandwidth, after recompression by applying a linear chirp. The pulse energy numbers refer to a 0.3 ns duration stretched pulse. (See Table 7.1 for details of pulse parameters.)
From the results of this numerical modelling, we conclude that the effects of SPM induced
distortion do not prevent the formation of ~300 fs recompressed pulses, with high peak powers,
but that a substantial fraction of the energy starts to be retained in a broad pedestal, which may
reduce the range of applications for which the pulses are well suited. Extending the pulse
energies to higher levels will require larger core fiber for the final amplifier. The minimum core
NA that can reliably be fabricated (also, from a practical standpoint, the minimum core NA that
has acceptably low bend losses) is ~0.06. For quasi-single mode fiber (V<3) this limits the core
diameter to ~15 µm at a wavelength of 1 µm. However, depending on the length of the
amplifier, the diameter of the inner cladding, the doping profile (gain guiding), and on the
launch conditions at the input, it may be possible to use low NA multimode fibers (V~5-15) and
still obtain M2 < 1.2 output mode quality, as demonstrated in previously reported systems that
produced output pulses with energy above 1.2 mJ [1].
7.6 Conclusion
In conclusion, we have developed a CPA system that produces pulses with energy of ~50 µJ
immediately after the final amplifier. The maximum pulse energy was limited by the onset of
SRS in the final amplifier. The system comprised a mode-locked fiber laser, a pulse selector, a
pulse stretcher and compressor, and a cascade of three amplifiers separated by isolators and
synchronously time-gated AOMs. Details of all components have been described in previous
Chapters. We have described how by using a final amplifier with reduced length of 1.5 m
(using 975 nm pump instead of 915 nm pump), and with 29 µm diameter core (15 µm core used
initially), it should be possible to obtain 100 µJ pulses from our system assuming gain in the
final amplifier of 15 dB, with the energy increasing to 131 µJ assuming 20 dB gain. We have
performed numerical modelling with this revised final amplifier design, which demonstrated
101

that the nonlinear pulse distortion due to SPM should not result in unacceptable degradation of
the quality of the recompressed 100 µJ pulses.
102

103
References 1. A. Galvanauskas, Z. Sartania and M. Bischoff, "Millijoule femtosecond fiber CPA
system," Advanced Solid-State Lasers, Proceedings, (2001).

Chapter 8 Direct Pulse Amplification
8.1 Introduction
This chapter describes our measurements of ultrashort pulses directly launched into a cascade of
Yb-fiber amplifiers without the use of a pulse stretcher. The threshold pulse energy for
unacceptable SRS scales in proportion to the stretched pulse duration [1], and therefore CPA
system can provide high pulse energies. However, when the highest pulse energies are
unnecessary but the application still requires high average power, the direct amplification setup
is highly-suitable since it is simpler (does not require a pulse stretcher and highly-dispersive
compressor). The established high performance levels from diode-pumped Yb-doped fiber
mean that systems producing such directly amplified pulses are of immediate practical interest.
Diode-pumped direct amplification systems based on a single amplifier stage have been
demonstrated to be capable of producing ultrashort pulses at average powers of >17 W [2].
However, using a single amplifier stage limits the total gain to ~30-40 dB, which restricts the
range of possible applications and sources. For example, the mode-locked Yb-fiber laser
described in Chapter 4 is an extremely attractive source, having robust self-start characteristics,
and low amplitude noise, but the pulse energy is low (~10 pJ). Use of a single amplifier would
thus limit the output pulse energy to around 10 nJ, which is insufficient for many applications.
The experiments reported in this chapter demonstrate that multiple cascaded amplifiers can be
used to produce pulses with higher pulse energies than single amplifier systems. Pulses have
been characterised using SHG FROG in order to directly determine the full chirp profile across
the pulse. High quality pulses with energy ~150 nJ and compressed duration ~300 fs have been
produced, and such pulses have been used to demonstrate an all fiber pumped femtosecond
OPO [3].
Due to the increased pulse peak powers, the directly amplified pulses undergo some degree of
nonlinear evolution (SPM) within the amplifiers, and we have studied the effects of this
nonlinear evolution on the recompressed pulses. Low energy pulses undergo mostly linear
evolution due to the fiber dispersion, and develop a linear chirp which can be compensated
using a grating pair at the system output. At the highest pulse energies the pulses develop a
parabolic profile, which has recently been described theoretically as an asymptotic solution to
the nonlinear Schrödinger equation with constant gain [4]. The theory predicts that parabolic
pulses also have a linear chirp, although with different slope compared to the pulses that have
104

evolved linearly, and so parabolic pulses can also be recompressed to short durations using a
grating compressor. The effects of SPM on the quality of the recompressed pulses from the
CPA system (Chapter 7) were considered by numerical modelling. The modelling showed that
the initial effect of SPM was to reduce the peak:pedestal contrast ratio of the recompressed
pulses. The parabolic pulse solution suggests that by undergoing increased nonlinear evolution
in the presence of continuous gain, that the chirp across the entire pulse could again become
linear (although with a steeper slope) which would result in high peak:pedestal contrast ratio for
the recompressed pulses. This makes parabolic pulses particularly interesting for applications
where this contrast ratio is important.
The ideal theoretical model of unlimited, spectrally flat, gain bandwidth, and unlimited
amplifier length (asymptotic solution) is not realised in a practical system. Finite gain
bandwidth will distort the pulse if the nonlinear spectral broadening (due to SPM) creates a
pulse bandwidth greater than the amplifier bandwidth. Finite amplifier length will prevent the
formation of parabolic pulses if the nonlinear evolution of the pulse has not progressed
sufficiently to create a linear chirp across the entire pulse by the end of the amplifier fiber.
These constraints have not interrupted parabolic pulse formation in previous experimental
reports, which have considered only the evolution of initially unchirped pulses in a single
amplifier stage. This chapter reports our results from a system with three amplifiers, which
demonstrated how the practical constraints were managed in order to obtain higher energy
pulses that could be cleanly recompressed. The two main features of the system that disrupt the
steady pulse evolution are that each amplifier in the chain has different parameters such as gain,
dispersion and effective nonlinearity (determined by the effective area of the fiber mode); and
that in order to prevent cascaded ASE from saturating the gain, it is necessary to optically
isolate individual amplifier stages [5], which also introduces lumped losses between each
amplifier within the chain (as high as 4.5 dB in our case). To improve our understanding of the
pulse evolution towards the asymptotic parabolic shape, we compared the pulse parameters to
those predicted by the asymptotic solution and also performed numerical modelling using the
experimentally measured amplifier settings. Our numerical predictions of the temporal and
spectral widths of the pulses and of the corresponding pulse chirp, were in close agreement with
our experimental measurements. Having obtained a good understanding of the system, the next
goal will be to use the numerical model to determine the most appropriate setup to obtain
directly amplified parabolic pulses with energies up to the SRS threshold energy.
This chapter is structured as follows. In Section 8.2 we describe the experimental setup. In
Section 8.3 we outline the numerical model that was implemented to simulate our results. In
Section 8.4 we describe our experimental results and compare those results with the results of
105
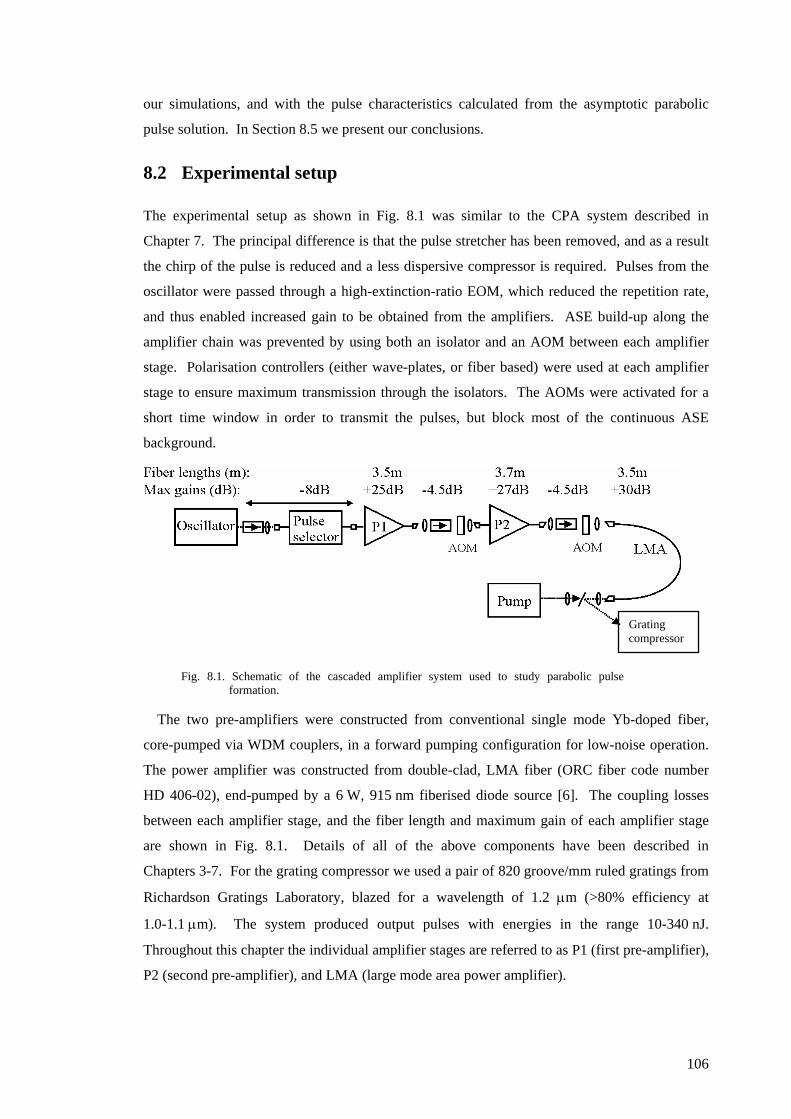
our simulations, and with the pulse characteristics calculated from the asymptotic parabolic
pulse solution. In Section 8.5 we present our conclusions.
8.2 Experimental setup
The experimental setup as shown in Fig. 8.1 was similar to the CPA system described in
Chapter 7. The principal difference is that the pulse stretcher has been removed, and as a result
the chirp of the pulse is reduced and a less dispersive compressor is required. Pulses from the
oscillator were passed through a high-extinction-ratio EOM, which reduced the repetition rate,
and thus enabled increased gain to be obtained from the amplifiers. ASE build-up along the
amplifier chain was prevented by using both an isolator and an AOM between each amplifier
stage. Polarisation controllers (either wave-plates, or fiber based) were used at each amplifier
stage to ensure maximum transmission through the isolators. The AOMs were activated for a
short time window in order to transmit the pulses, but block most of the continuous ASE
background.
Grating compressor
Fig. 8.1. Schematic of the cascaded amplifier system used to study parabolic pulse formation.
The two pre-amplifiers were constructed from conventional single mode Yb-doped fiber,
core-pumped via WDM couplers, in a forward pumping configuration for low-noise operation.
The power amplifier was constructed from double-clad, LMA fiber (ORC fiber code number
HD 406-02), end-pumped by a 6 W, 915 nm fiberised diode source [6]. The coupling losses
between each amplifier stage, and the fiber length and maximum gain of each amplifier stage
are shown in Fig. 8.1. Details of all of the above components have been described in
Chapters 3-7. For the grating compressor we used a pair of 820 groove/mm ruled gratings from
Richardson Gratings Laboratory, blazed for a wavelength of 1.2 µm (>80% efficiency at
1.0-1.1 µm). The system produced output pulses with energies in the range 10-340 nJ.
Throughout this chapter the individual amplifier stages are referred to as P1 (first pre-amplifier),
P2 (second pre-amplifier), and LMA (large mode area power amplifier).
106

The pulses were characterised both temporally and spectrally as they propagated through the
amplifier cascade. The characteristics of the pulses from the oscillator are described in
Chapter 4. The pulse FWHM duration at the output from the oscillator was 2.5 ps, with a
bandwidth (FWHM) of 18.6 nm, with a positive linear chirp. Due to the normal GVD of the
amplifier fiber, the pulses broadened temporally at each amplifier stage, and reached a duration
of ~8 ps after the final amplifier. The pulses were then recompressed by propagation through a
diffraction grating pair which has anomalous dispersion. The spectral evolution of the pulses
was controlled both by the nonlinear action of SPM, which acted to broaden the spectrum, and
by gain-filtering due to the finite gain bandwidth of the amplifiers, and which ultimately limits
the pulse bandwidth. We measured the pulse spectrum after every amplifier stage using an
optical spectrum analyser. Using a ‘Modemaster’ supplied by Coherent Inc., we measured the
beam quality at the output of the LMA to be M2~1.2. The pulses were also characterised
directly after the LMA amplifier using SHG FROG. In addition, non-collinear SHG
autocorrelation measurements were recorded for the recompressed pulses (after the grating
compressor).
We characterised the system with five different gain (dB) settings to determine which
proportion of gain in the various amplifier stages would produce high energy pulses that could
be cleanly recompressed. Increased gain was obtained by changing the duty cycle using the
EOM. A 20% duty cycle was obtained by using a 200 ns window with a 1 ms period (allows 10
pulses in every 50 to pass through the system). A 5% duty cycle was obtained by passing a
single pulse in every twenty (window= 20 ns, period = 370 ns). The gain was calculated by
comparing the average input and output powers from each amplifier stage. The gain settings,
labelled I-V, are shown in Table 8.1 in order of increasing final pulse energy together with the
associated pulse energies at the system output. Reference is made to these labels throughout the
results section of this chapter. The gain in P1 was high for all settings. Setting I produced low
energy pulses and had low gain in both P2 and LMA. Settings II and IV had relatively even
gain in both P2 and LMA; the absolute gain was higher for IV than II, which led to increased
energy pulses at the system output. Settings III and V had low gain in P2 and high gain in
LMA; setting V had higher absolute gain and produced higher energy pulses. The proportion of
total gain in the smaller core (high effective nonlinearity) P2, compared to the gain in the larger
core (lower effective nonlinearity) LMA, was observed to have a strong influence on the shape
of the chirp of the final pulses.
107

Table 8.1 Gain distribution in amplifier chain.
Gain (dB) Duty Average Pulse
P1 P2 LMA Cycle (%) Power (W) Energy (nJ)
I 17.0 9.5 11.5 100 0.60 11.2 II 20.4 11.3 12.6 20 0.52 48 III 22.6 4.3 22.2 5 0.39 146 IV 22.6 12.5 14.8 5 0.48 177 V 22.6 4.3 25.8 5 0.90 334
The system performance for each of these gain settings is presented in Section 8.4. However,
before discussing these results we first briefly describe the numerical model that we used to
simulate our system.
8.3 Numerical model
As described in Chapter 2, we use a modified nonlinear Schrödinger equation (NLSE) in order
to model the system. We used a Lorentzian gain profile as shown in the equations below, and
included both 2nd and 3rd order dispersion, lumped fiber losses between the individual
amplifiers, and the Kerr effect [7],
,)2(exp),(~)(
2
261
22
3
3
32
2
2
∫∞+
∞−−−
+−∂∂
+∂∂
−=∂∂
ννπννχ
γαββ
dTizAi
AAiAT
AT
AizA
D
Eqn. 8.3:1
where ( )( ) .21
2)(
2
2
TTizg
D νππχ
+−
= Eqn. 8.3:2
Eqn. 8.3:2
The amplifiers themselves were modelled with uniform gain per unit length, and a Lorentzian
gain profile(see ), where T is the oscillator relaxation time for the Lorentzian gain,
selected to give the appropriate bandwidth. The modified NLSE was solved using the standard
split-step Fourier method with an appropriate change in fiber and gain parameters for each
amplifier stage. We are grateful for the assistance of Neil Broderick, who performed the
numerical simulations. The dispersion parameters used for all amplifiers were:
2
3β =25 x 10-3 ps2/m (D= -50 ps/nm/km), 3β =2.5 x 10⁻⁵ ps3/m. The effective nonlinearity
( ) ( )effAn λπγ 22= was calculated with =2.35 x 10²n -20 m2/W and using the effective mode
area for each amplifier as follows: = 15 µmeffA 2 for both P1 and P2, and = 250 µmeffA 2 for the
LMA.
For the simulations, the input pulse shape to amplifier P1 was a positive-linearly chirped
Gaussian pulse with duration (FWHM) of 2.5 ps, and a bandwidth (FWHM) of 13.6 nm. This
pulse duration was that measured at the output of the oscillator. The pulse bandwidth (hence
108
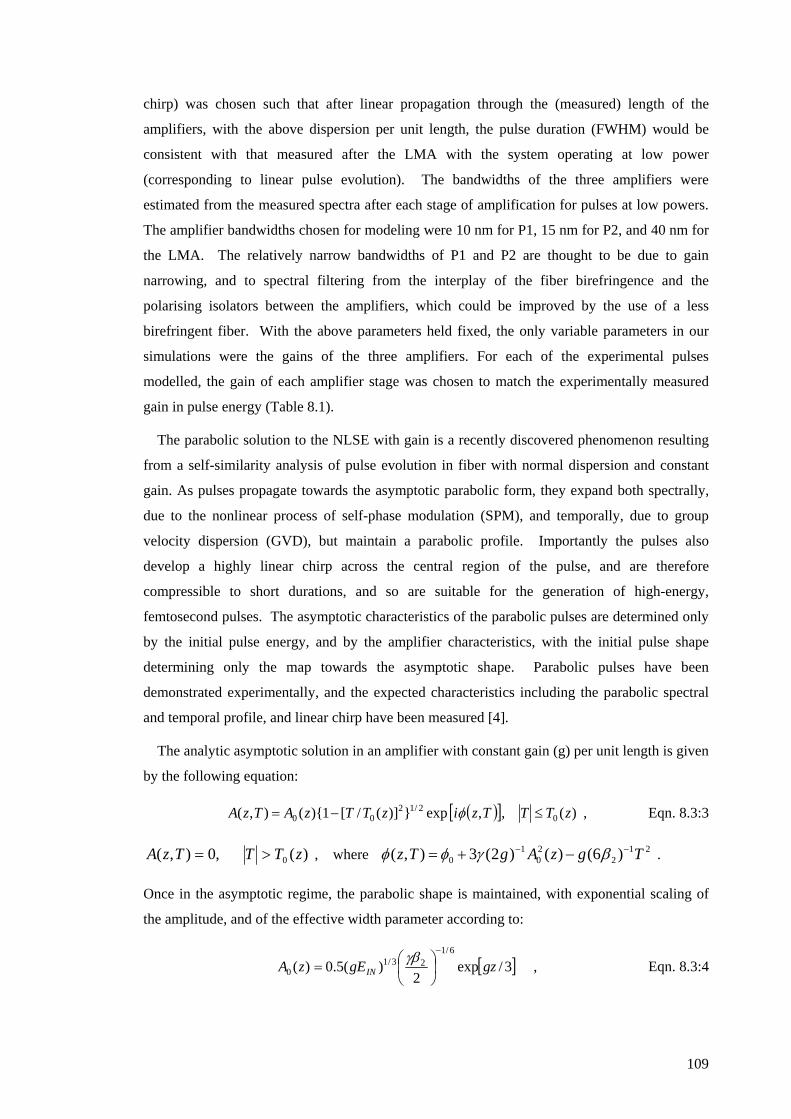
chirp) was chosen such that after linear propagation through the (measured) length of the
amplifiers, with the above dispersion per unit length, the pulse duration (FWHM) would be
consistent with that measured after the LMA with the system operating at low power
(corresponding to linear pulse evolution). The bandwidths of the three amplifiers were
estimated from the measured spectra after each stage of amplification for pulses at low powers.
The amplifier bandwidths chosen for modeling were 10 nm for P1, 15 nm for P2, and 40 nm for
the LMA. The relatively narrow bandwidths of P1 and P2 are thought to be due to gain
narrowing, and to spectral filtering from the interplay of the fiber birefringence and the
polarising isolators between the amplifiers, which could be improved by the use of a less
birefringent fiber. With the above parameters held fixed, the only variable parameters in our
simulations were the gains of the three amplifiers. For each of the experimental pulses
modelled, the gain of each amplifier stage was chosen to match the experimentally measured
gain in pulse energy ( ). Table 8.1
The parabolic solution to the NLSE with gain is a recently discovered phenomenon resulting
from a self-similarity analysis of pulse evolution in fiber with normal dispersion and constant
gain. As pulses propagate towards the asymptotic parabolic form, they expand both spectrally,
due to the nonlinear process of self-phase modulation (SPM), and temporally, due to group
velocity dispersion (GVD), but maintain a parabolic profile. Importantly the pulses also
develop a highly linear chirp across the central region of the pulse, and are therefore
compressible to short durations, and so are suitable for the generation of high-energy,
femtosecond pulses. The asymptotic characteristics of the parabolic pulses are determined only
by the initial pulse energy, and by the amplifier characteristics, with the initial pulse shape
determining only the map towards the asymptotic shape. Parabolic pulses have been
demonstrated experimentally, and the expected characteristics including the parabolic spectral
and temporal profile, and linear chirp have been measured [4].
The analytic asymptotic solution in an amplifier with constant gain (g) per unit length is given
by the following equation:
( )[ ] ,)(,,exp})](/[1){(),( 02/12
00 zTTTzizTTzATzA ≤−= φ Eqn. 8.3:3
)(,0),( 0 zTTTzA >= , where . 212
20
10 )6()()2(3),( TgzAgTz −− −+= βγφφ
Once in the asymptotic regime, the parabolic shape is maintained, with exponential scaling of
the amplitude, and of the effective width parameter according to:
[ ] ,3/exp2
)(5.0)(6/1
23/10 gzgEzA IN
−
=γβ Eqn. 8.3:4
109
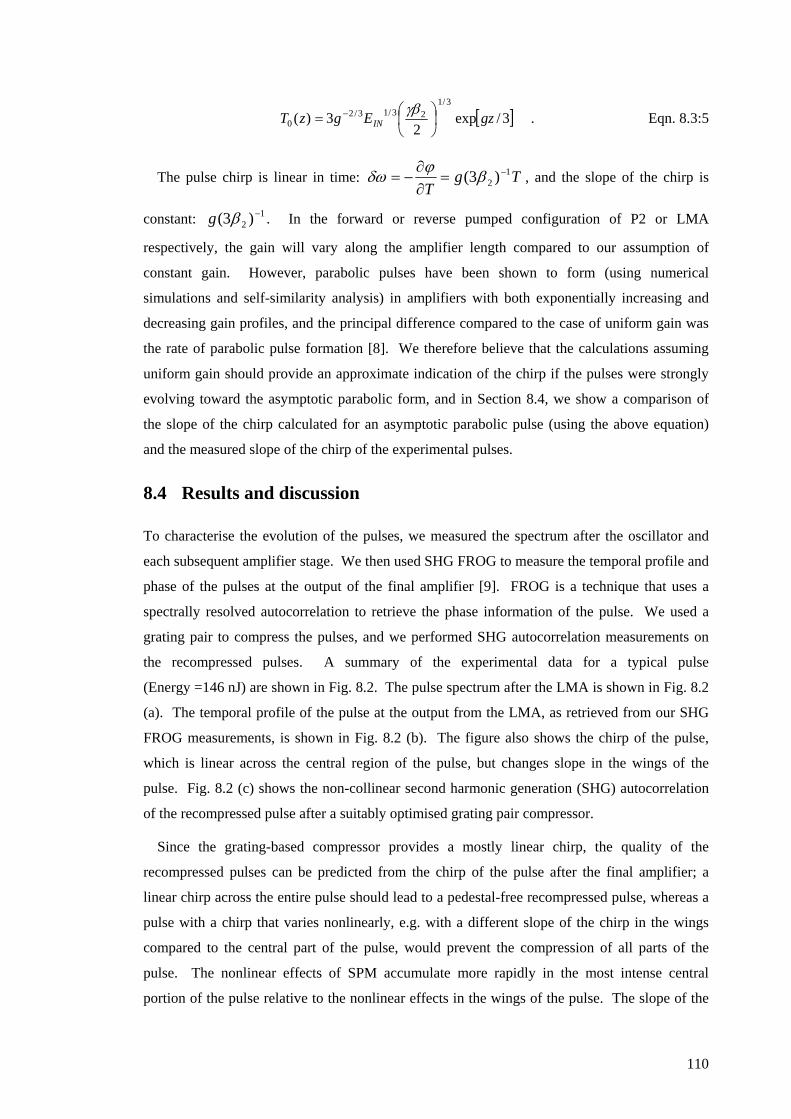
[ ] .3/exp2
3)(3/1
23/13/20 gzEgzT IN
= − γβ Eqn. 8.3:5
The pulse chirp is linear in time: TgT
12 )3( −=
∂∂
−= βϕδω , and the slope of the chirp is
constant: . In the forward or reverse pumped configuration of P2 or LMA
respectively, the gain will vary along the amplifier length compared to our assumption of
constant gain. However, parabolic pulses have been shown to form (using numerical
simulations and self-similarity analysis) in amplifiers with both exponentially increasing and
decreasing gain profiles, and the principal difference compared to the case of uniform gain was
the rate of parabolic pulse formation [8]. We therefore believe that the calculations assuming
uniform gain should provide an approximate indication of the chirp if the pulses were strongly
evolving toward the asymptotic parabolic form, and in Section 8.4, we show a comparison of
the slope of the chirp calculated for an asymptotic parabolic pulse (using the above equation)
and the measured slope of the chirp of the experimental pulses.
12 )3( −βg
8.4 Results and discussion
To characterise the evolution of the pulses, we measured the spectrum after the oscillator and
each subsequent amplifier stage. We then used SHG FROG to measure the temporal profile and
phase of the pulses at the output of the final amplifier [9]. FROG is a technique that uses a
spectrally resolved autocorrelation to retrieve the phase information of the pulse. We used a
grating pair to compress the pulses, and we performed SHG autocorrelation measurements on
the recompressed pulses. A summary of the experimental data for a typical pulse
(Energy =146 nJ) are shown in . The pulse spectrum after the LMA is shown in
(a). The temporal profile of the pulse at the output from the LMA, as retrieved from our SHG
FROG measurements, is shown in (b). The figure also shows the chirp of the pulse,
which is linear across the central region of the pulse, but changes slope in the wings of the
pulse. (c) shows the non-collinear second harmonic generation (SHG) autocorrelation
of the recompressed pulse after a suitably optimised grating pair compressor.
Fig. 8.2 Fig. 8.2
Fig. 8.2
Fig. 8.2
Since the grating-based compressor provides a mostly linear chirp, the quality of the
recompressed pulses can be predicted from the chirp of the pulse after the final amplifier; a
linear chirp across the entire pulse should lead to a pedestal-free recompressed pulse, whereas a
pulse with a chirp that varies nonlinearly, e.g. with a different slope of the chirp in the wings
compared to the central part of the pulse, would prevent the compression of all parts of the
pulse. The nonlinear effects of SPM accumulate more rapidly in the most intense central
portion of the pulse relative to the nonlinear effects in the wings of the pulse. The slope of the
110
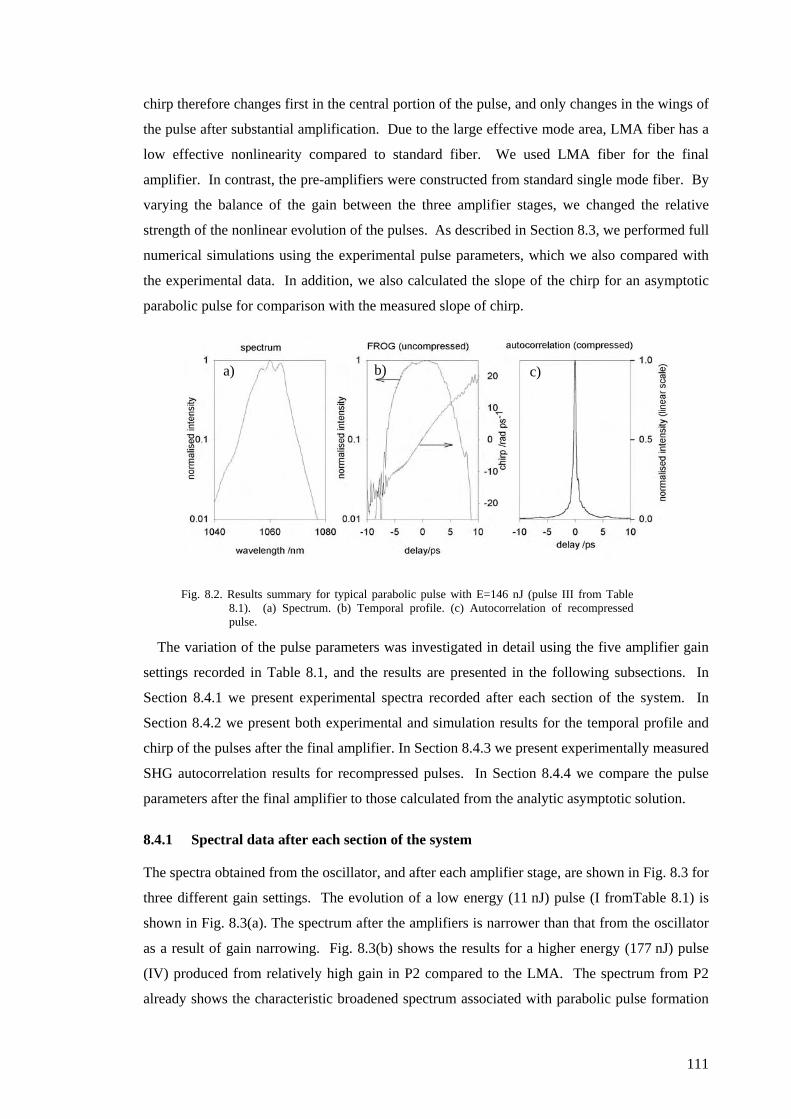
chirp therefore changes first in the central portion of the pulse, and only changes in the wings of
the pulse after substantial amplification. Due to the large effective mode area, LMA fiber has a
low effective nonlinearity compared to standard fiber. We used LMA fiber for the final
amplifier. In contrast, the pre-amplifiers were constructed from standard single mode fiber. By
varying the balance of the gain between the three amplifier stages, we changed the relative
strength of the nonlinear evolution of the pulses. As described in Section 8.3, we performed full
numerical simulations using the experimental pulse parameters, which we also compared with
the experimental data. In addition, we also calculated the slope of the chirp for an asymptotic
parabolic pulse for comparison with the measured slope of chirp.
Fig. 8.2. Results summary for typical parabolic pulse with E=146 nJ (pulse III from Table
8.1). (a) Spectrum. (b) Temporal profile. (c) Autocorrelation of recompressed pulse.
b) c)a)
The variation of the pulse parameters was investigated in detail using the five amplifier gain
settings recorded in , and the results are presented in the following subsections. In
Section 8.4.1 we present experimental spectra recorded after each section of the system. In
Section 8.4.2 we present both experimental and simulation results for the temporal profile and
chirp of the pulses after the final amplifier. In Section 8.4.3 we present experimentally measured
SHG autocorrelation results for recompressed pulses. In Section 8.4.4 we compare the pulse
parameters after the final amplifier to those calculated from the analytic asymptotic solution.
Table 8.1
Table 8.1
8.4.1 Spectral data after each section of the system
The spectra obtained from the oscillator, and after each amplifier stage, are shown in Fig. 8.3 for
three different gain settings. The evolution of a low energy (11 nJ) pulse (I from ) is
shown in Fig. 8.3(a). The spectrum after the amplifiers is narrower than that from the oscillator
as a result of gain narrowing. Fig. 8.3(b) shows the results for a higher energy (177 nJ) pulse
(IV) produced from relatively high gain in P2 compared to the LMA. The spectrum from P2
already shows the characteristic broadened spectrum associated with parabolic pulse formation
111
with peaks at the longest and shortest wavelengths ("batman" shape) [10]. The nonlinear
evolution has continued in the LMA resulting in further broadening. (c) shows the
highest energy (334 nJ) pulse (V) that was studied. This pulse was produced from relatively
weak amplification in P2 and strong amplification in the LMA. The "batman" shape does not
emerge until after the LMA. The shoulder in the LMA spectra at ~1040 nm which appears
~15 dB lower than the peak, as seen in (b) and (c) is due to cascaded ASE because of the
reduced pulse repetition rate used to obtain such high energy pulses. ASE is less prominent in
(a) because the low energy pulse was produced using a high repetition rate, so the
amplifier gain was saturated by the signal.
Fig. 8.3
Fig. 8.3
Fig. 8.3
Fig. 8.3. Evolution of the pulse spectrum as it passes through the amplifier chain for; a) pulse I (11nJ), b) pulse IV (177nJ), c) pulse V (334nJ).
8.4.2 Phase characteristics after final amplifier
We investigated the properties of the pulses emerging from the LMA using SHG FROG. The
FROG fitting errors [9] that we achieved ranged from 0.006 to 0.02, so represent a good fit to
the data. Fig. 8.4 shows the pulse shape and chirp of (a) 11nJ pulse (I), (b) 146nJ pulse (III),
and (c) 334 nJ pulse (V), as reconstructed from FROG data (solid) and from our numerical
simulations (dotted). All of the essential temporal and spectral features in the pulses are present
in the numerical simulations. The chirp is seen to be linear across the central region of the
pulse, as is characteristic of parabolic evolution. Note that both the numerical simulations and
112

experimental results show that the slope of the chirp is different in the wings of the pulses as
compared to the central region.
At low energies the slope of the chirp tends to 2 rad.ps-2, due to the linear dispersion,
determined by the total length of fiber in the system. For higher pulse energies the slope of the
chirp in the central region of the pulse increases, but remains linear, as expected for parabolic
evolution. Although not shown in this figure, we note that the slope of the chirp is higher for
pulses where the amplification was strong in P2 than for pulses where the main amplification
took place in the LMA. This is due to more prominent nonlinear effects in P2 due to the smaller
core size (compared to LMA). The results from the numerical simulations are again in close
agreement with the experimental data.
Fig. 8.4. The measured retrieved FROG data (solid) and numerical simulations (dotted) of pulse shape and chirp. a) pulse I (11 nJ), b) pulse III (146 nJ), and c) pulse V (334 nJ).
Fig. 8.5 shows plots of (a) the spectral width, (b) the temporal width, and (c) the slope of the
chirp at the centre of the final pulses, as a function of pulse energy, as obtained from both
FROG measurements (circles) and our numerical simulations (diamonds). The parameters
displayed were chosen because they characterised the nonlinear evolution of the pulses and in a
linear system they would not depend on the amplifier gain. It can be seen from Fig. 8.5 that
there are two distinct regimes of pulse formation. The first regime is characterised by pulses II
and IV (open circles) which, for a given pulse energy, have relatively broad spectral widths,
broad temporal widths, and a high slope of the chirp; and the second regime is characterised by
113

pulses III and V (filled circles), which have relatively narrow spectral widths, narrow temporal
widths and a low slope of the chirp. The most striking difference between these two regimes is
in the spectral width of the pulses. These regimes can be clearly identified in both the numerical
and experimental results. The first regime corresponds to approximately equal gain in P2 and
LMA such that the nonlinear pulse formation occurs predominantly within P2. The second
regime is when most of the gain is in the LMA such that the nonlinear pulse formation is
predominantly within the LMA. In the first regime, the pulses see large nonlinear effects due to
the high gain in P2. In the second regime, the peak powers are smaller in the preamplifiers (due
to the smaller gain), and hence the nonlinear effects are less pronounced.
Fig. 8.5. Plots of a) spectral width, b) temporal width and c) slope of chirp (at the centre of the pulse) against pulse energy. The circles represent measured values, and the diamonds are calculated from the results of our simulations. Open circles: strong gain in P2; Filled circles: gain predominantly in LMA.
V
IV
III II I
8.4.3 SHG autocorrelation measurements of compressed pulses
The pulses from the LMA were passed through a grating pair, which compensated the linear
chirp. The grating separation was optimised experimentally for each pulse (I-V) in order to
minimise the FWHM of the autocorrelation peak. Fig. 8.6 shows SHG autocorrelations of the
compressed pulses. Autocorrelation FWHM widths were in the region of 440-490 fs, indicating
compressed pulse widths of ~300 fs (assuming Gaussian profile). Fig. 8.6(a) shows how the
autocorrelations vary with pulse energy in the regime where the gain is mainly in the LMA. At
114

the highest energies the autocorrelations have broad wings, though the width of the central peak
changes little. Fig. 8.6(b) shows the autocorrelations of two pulses of similar energy, but
representing the two different regimes of amplification. It can be seen that the 177 nJ pulse
(IV), which was strongly amplified in P2, has more structure in the wings and a much lower
fraction of its energy in the central peak compared to the pulse strongly amplified in the LMA
(III), which is consistent with the more nonlinear chirp measured for the uncompressed pulse.
The small features visible in several of the autocorrelations at ±6 ps are believed to be due to
cross correlations between the fundamental and a higher spatial mode propagating at a different
velocity in the slightly multimoded LMA.
delay (ps)-10 -5 0 5 10
norm
alise
d in
tens
ity
0
1
11nJ146nJ334nJ
delay (ps)-10 -5 0 5 10
146nJ177nJ
a) b)
Fig. 8.6. SHG autocorrelation traces of pulses after compensation of the linear chirp using a grating pair. a) Pulses of various energies (I, III, V) where gain is predominantly in LMA, b) pulses of similar energy with gain predominantly in LMA (III solid) and with strong gain in P2 (IV dotted).
8.4.4 Comparison to asymptotic analytic solution
Here we compare the slope of the chirp and the duration of the measured pulses with those
predicted by the analytic asymptotic parabolic solution ( ). This comparison provides
an indication of the extent to which the pulses have evolved towards the parabolic form.
Eqn. 8.3:3
We have calculated the slope of the chirp ( )3( 2βg ) that would be expected for a parabolic
pulse after P2 and LMA, using 2β = 25 x 10-3 ps2m-1, and the measured gain from Table 8.2 for
each of the pulses I-V (assuming constant gain per unit length). The results are shown in
together with the measured value of the slope of the chirp after the LMA from Fig. 8.5c).
We measured the slope of chirp only after the LMA, but we have calculated the predicted value
for the slope of chirp after both P2 and after the LMA because of the possibility that a parabolic
pulse, having formed in the relatively high nonlinearity, smaller core of P2, may subsequently
evolve linearly in the larger core LMA. Comparing the results for measured slope of the chirp
with those of the calculated value expected for the asymptotic parabolic pulse form, shows that
the two values are different. The results in suggest that although the pulses from the
Table
8.2
Table 8.2
115
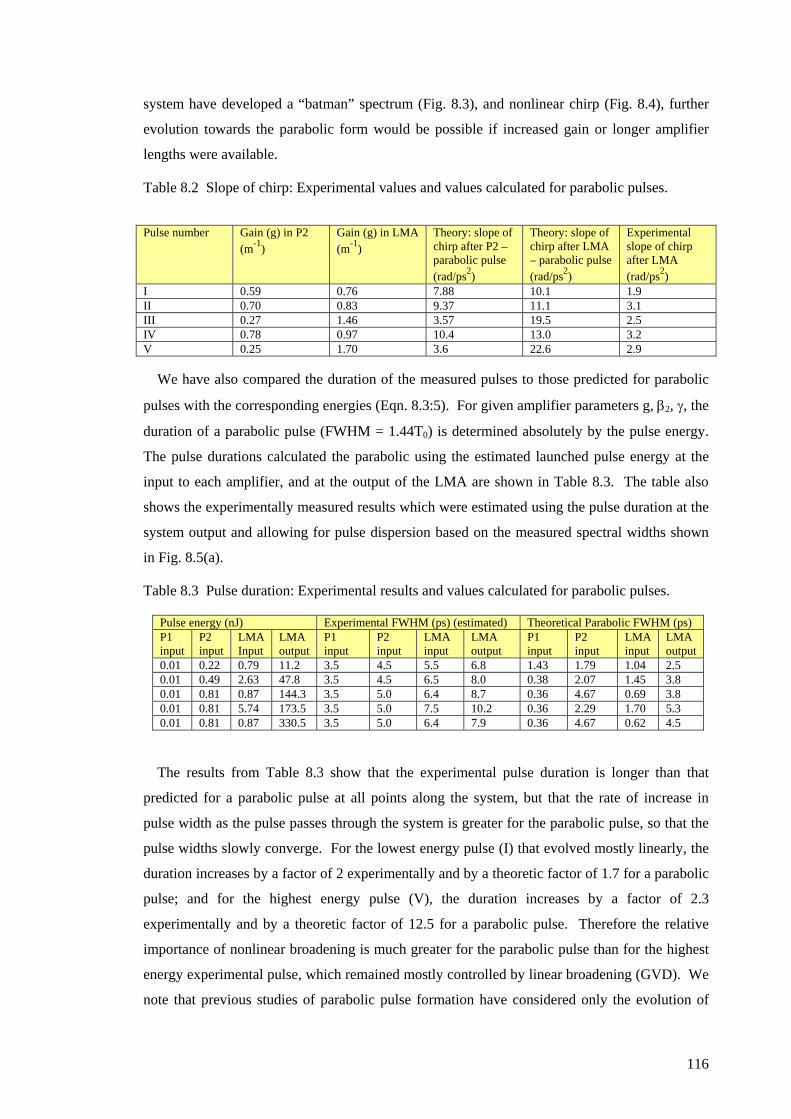
system have developed a “batman” spectrum ( ), and nonlinear chirp ( ), further
evolution towards the parabolic form would be possible if increased gain or longer amplifier
lengths were available.
Fig. 8.3 Fig. 8.4
Table 8.2 Slope of chirp: Experimental values and values calculated for parabolic pulses.
Pulse number Gain (g) in P2 (m-1)
Gain (g) in LMA (m-1)
Theory: slope of chirp after P2 – parabolic pulse (rad/ps2)
Theory: slope of chirp after LMA – parabolic pulse (rad/ps2)
Experimental slope of chirp after LMA (rad/ps2)
I 0.59 0.76 7.88 10.1 1.9 II 0.70 0.83 9.37 11.1 3.1 III 0.27 1.46 3.57 19.5 2.5 IV 0.78 0.97 10.4 13.0 3.2 V 0.25 1.70 3.6 22.6 2.9
We have also compared the duration of the measured pulses to those predicted for parabolic
pulses with the corresponding energies ( ). For given amplifier parameters g, β2, γ, the
duration of a parabolic pulse (FWHM = 1.44T0) is determined absolutely by the pulse energy.
The pulse durations calculated the parabolic using the estimated launched pulse energy at the
input to each amplifier, and at the output of the LMA are shown in Table 8.3. The table also
shows the experimentally measured results which were estimated using the pulse duration at the
system output and allowing for pulse dispersion based on the measured spectral widths shown
in (a).
Eqn. 8.3:5
Fig. 8.5
Table 8.3 Pulse duration: Experimental results and values calculated for parabolic pulses.
Pulse energy (nJ) Experimental FWHM (ps) (estimated) Theoretical Parabolic FWHM (ps) P1 input
P2 input
LMA Input
LMA output
P1 input
P2 input
LMA input
LMA output
P1 input
P2 input
LMA input
LMA output
0.01 0.22 0.79 11.2 3.5 4.5 5.5 6.8 1.43 1.79 1.04 2.5 0.01 0.49 2.63 47.8 3.5 4.5 6.5 8.0 0.38 2.07 1.45 3.8 0.01 0.81 0.87 144.3 3.5 5.0 6.4 8.7 0.36 4.67 0.69 3.8 0.01 0.81 5.74 173.5 3.5 5.0 7.5 10.2 0.36 2.29 1.70 5.3 0.01 0.81 0.87 330.5 3.5 5.0 6.4 7.9 0.36 4.67 0.62 4.5
The results from Table 8.3 show that the experimental pulse duration is longer than that
predicted for a parabolic pulse at all points along the system, but that the rate of increase in
pulse width as the pulse passes through the system is greater for the parabolic pulse, so that the
pulse widths slowly converge. For the lowest energy pulse (I) that evolved mostly linearly, the
duration increases by a factor of 2 experimentally and by a theoretic factor of 1.7 for a parabolic
pulse; and for the highest energy pulse (V), the duration increases by a factor of 2.3
experimentally and by a theoretic factor of 12.5 for a parabolic pulse. Therefore the relative
importance of nonlinear broadening is much greater for the parabolic pulse than for the highest
energy experimental pulse, which remained mostly controlled by linear broadening (GVD). We
note that previous studies of parabolic pulse formation have considered only the evolution of
116
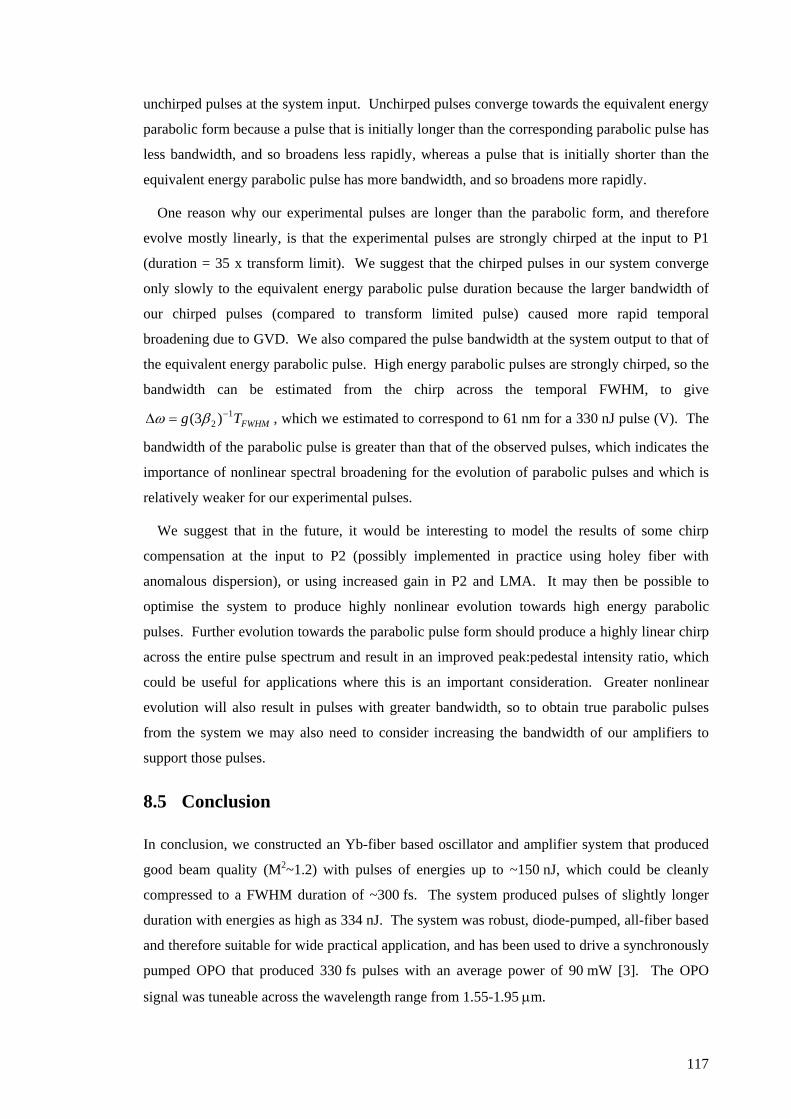
unchirped pulses at the system input. Unchirped pulses converge towards the equivalent energy
parabolic form because a pulse that is initially longer than the corresponding parabolic pulse has
less bandwidth, and so broadens less rapidly, whereas a pulse that is initially shorter than the
equivalent energy parabolic pulse has more bandwidth, and so broadens more rapidly.
One reason why our experimental pulses are longer than the parabolic form, and therefore
evolve mostly linearly, is that the experimental pulses are strongly chirped at the input to P1
(duration = 35 x transform limit). We suggest that the chirped pulses in our system converge
only slowly to the equivalent energy parabolic pulse duration because the larger bandwidth of
our chirped pulses (compared to transform limited pulse) caused more rapid temporal
broadening due to GVD. We also compared the pulse bandwidth at the system output to that of
the equivalent energy parabolic pulse. High energy parabolic pulses are strongly chirped, so the
bandwidth can be estimated from the chirp across the temporal FWHM, to give
, which we estimated to correspond to 61 nm for a 330 nJ pulse (V). The
bandwidth of the parabolic pulse is greater than that of the observed pulses, which indicates the
importance of nonlinear spectral broadening for the evolution of parabolic pulses and which is
relatively weaker for our experimental pulses.
FWHMTg 12 )3( −=∆ βω
We suggest that in the future, it would be interesting to model the results of some chirp
compensation at the input to P2 (possibly implemented in practice using holey fiber with
anomalous dispersion), or using increased gain in P2 and LMA. It may then be possible to
optimise the system to produce highly nonlinear evolution towards high energy parabolic
pulses. Further evolution towards the parabolic pulse form should produce a highly linear chirp
across the entire pulse spectrum and result in an improved peak:pedestal intensity ratio, which
could be useful for applications where this is an important consideration. Greater nonlinear
evolution will also result in pulses with greater bandwidth, so to obtain true parabolic pulses
from the system we may also need to consider increasing the bandwidth of our amplifiers to
support those pulses.
8.5 Conclusion
In conclusion, we constructed an Yb-fiber based oscillator and amplifier system that produced
good beam quality (M2~1.2) with pulses of energies up to ~150 nJ, which could be cleanly
compressed to a FWHM duration of ~300 fs. The system produced pulses of slightly longer
duration with energies as high as 334 nJ. The system was robust, diode-pumped, all-fiber based
and therefore suitable for wide practical application, and has been used to drive a synchronously
pumped OPO that produced 330 fs pulses with an average power of 90 mW [3]. The OPO
signal was tuneable across the wavelength range from 1.55-1.95 µm.
117
We have performed a detailed characterisation of the pulses from the system using SHG
FROG, and have devised a numerical model based on the modified NLSE with gain that
produced simulated pulse parameters in close agreement with the observed values. We have
also compared the evolution of the pulses to the theoretically predicted asymptotic solution,
which is a pulse with parabolic spectral and temporal shape and linear chirp. This is the first
time, to our knowledge, that the evolution of directly amplified pulses has been studied in a
multi-stage amplifier cascade. We determined that for the experimental pulses, although SPM
was clearly evident, there was scope for further nonlinear evolution towards the parabolic form.
We envisage that with our improved understanding of the direct amplification process it
should be possible to increase the power levels achieved whilst still producing high quality
recompressed pulses. We propose to use our numerical model to investigate the capability of
our system to produce higher energy pulses with an evolution that has progressed further
towards the asymptotic parabolic profile, and which we expect could enable <200 fs pulses with
>>500 nJ energy to be produced. As discussed in relation to the CPA system (Chapter 7), SRS
will ultimately limit the maximum energy that can be obtained. For example, the SRS threshold
energy would be ~0.4 µJ for 8 ps pulses with a 15 µm diameter core amplifier with L=3.5 m,
and total gain of 20 dB. For the same pulse parameters and amplifier gain, the SRS threshold
energy would increase to ~3 µJ for a core diameter of 30 µm, and L=2 m. We propose to use
the modelling to determine the most appropriate configuration for obtaining cleanly
recompressed pulses with energy approaching this SRS threshold, and then to conduct these
experiments.
Finally, as a practical point to be considered for future experiments, we briefly note our
observation of damage to the output facet of the LMA when running with high-energy parabolic
pulses. After a period of operating the system at ~300 mW average power (measured at the
output of the LMA), we observed that the output mode quality would deteriorate strongly from
the initial gaussian mode profile (M2~1.1). Examination of the end of the fiber under the
microscope revealed damage to the fiber facet and the adjacent ~1 cm of the fiber. This
observation of facet damage is consistent with observations by others and attributed to
breakdown at the silica/air interface due to the high pulse fluence [11]. We considered that our
observations were most often observed with this parabolic pulse system, rather than with the
CPA system (Chapter 7), because the stochastic nature of the damage process means that a long
run-time (this system was used to pump a femtosecond optical parametric oscillator [3]) resulted
in increased incidence of failure. A solution to this facet damage may have to be applied in the
future, and a standard technique is to splice a short length of “dummy” fiber (no core) to the end
of the fiber. The diverging beam, with half angle = sin-1 (NA/ncore), is expanded to just less than
the dummy-fiber diameter (by cleaving the dummy-fiber to the appropriate length). The fluence
118

of the expanded beam is thus reduced below the damage threshold of the silica/air interface, and
facet damage is prevented [11].
119
120
References 1. R. G. Smith, "Optical power handling capacity of low loss optical fibers as determined
by stimulated Raman and Brillouin scattering," Applied Optics 11, 2489 - 2494 (1972). 2. J. Limpert, T. Schreiber, T. Clausnitzer, K. Zollner, H. J. Fuchs, E. B. Kley, H. Zellmer
and A. Tünnermann, "High-power femtosecond Yb-doped fiber amplifier," Optics Express 10, 628-638 (2002).
3. M. V. O'Connor, M. A. Watson, D. P. Shepherd, D. C. Hanna, J. H. V. Price, A. Malinowski, J. Nilsson, N. G. R. Broderick and D. J. Richardson, "Synchronously pumped optical parametric oscillator driven by a femtosecond mode-locked fiber laser," Optics Letters 27, 1052-1054 (2002).
4. M. E. Fermann, V. I. Kruglov, B. C. Thomsen, J. M. Dudley and J. D. Harvey, "Self-similar propagation and amplification of parabolic pulses in optical fibers," Physical Review Letters 84, 6010-6013 (2000).
5. B. Desthieux, R. I. Laming and D. N. Payne, "111 kW (0.5 mJ) Pulse Amplification at 1.5-microns Using a Gated Cascade of 3 Erbium-Doped Fiber Amplifiers," Applied Physics Letters 63, 586-588 (1993).
6. N. G. R. Broderick, H. L. Offerhaus, D. J. Richardson and R. A. Sammut, "Power scaling in passively mode-locked large-mode area fiber lasers," IEEE Photonics Technology Letters 10, 1718-1720 (1998).
7. G. P. Agrawal, Nonlinear Fiber Optics, Academic Press (San Diego), 2nd (1995). 8. V. I. Kruglov, A. C. Peacock, J. M. Dudley and J. D. Harvey, "Self-similar propagation
of high-power parabolic pulses in optical fiber amplifiers," Optics Letters 25, 1753-1755 (2000).
9. R. Trebino, K. W. DeLong, D. N. Fittinghoff, J. N. Sweetser, M. A. Krumbugel, B. A. Richman and D. J. Kane, "Measuring ultrashort laser pulses in the time-frequency domain using frequency-resolved optical gating," Review of Scientific Instruments 68, 3277-3295 (1997).
10. V. I. Kruglov, A. C. Peacock, J. D. Harvey and J. M. Dudley, "Self-similar propagation of parabolic pulses in normal- dispersion fiber amplifiers," Journal of the Optical Society of America B-Optical Physics 19, 461-469 (2002).
11. C. C. Renaud, J. A. Alvarez-Chavez, J. K. Sahu and J. Nilsson, "7.7 mJ pulses from a large core Yb-doped Cladding pumped Q-switched fibre laser," Conference on Lasers and Electro Optics (CLEO), Vol. 56 of OSA Trends in Optics and Photonics Series (Optical Society of America, Washington, D.C., 2001) paper CTuQ5 (2001).
Chapter 9 Solitons in passive holey fiber
9.1 Introduction
This chapter describes our demonstration of linear dispersion compensation, soliton pulse
formation, soliton compression, and ultra-broad supercontinuum generation in a HF that has
anomalous dispersion for wavelengths above 800 nm. The HF was seeded with ultrashort
pulses from the diode-pumped, Yb-doped fiber oscillator described in Chapter 4, operating with
either one or a pair of amplifiers in a direct amplification configuration, as described in
Chapter 8. When it was initially published, the work was the first direct demonstration of linear
dispersion compensation in an anomalously dispersive HF at wavelengths below 1.3 µm [1, 2].
Soliton propagation in HF had previously been demonstrated over 3 soliton periods, seeded with
a Ti:Sapphire laser at ~820 nm [3]. Our report of soliton propagation over 475 soliton periods
therefore represented an advance over previous work, and demonstrated the potential for HF
based ultrashort pulse transmission for practical applications requiring a wavelength below
1.3 µm e.g. ultrafast spectroscopy. Our work was novel because of the new seed wavelength
provided by our Yb-fiber oscillator. The results show the compatibility of the rapidly
developing HF technology with our practical Yb-doped fiber source for a wide range of
potential applications.
The use of soliton effects such as nonlinear pulse compression, propagation, and the soliton
self-frequency shift (SSFS) in optical fiber have been exploited in a variety of sources operating
at wavelengths above 1.3 µm, most commonly using lasers based on Er-doped fiber which
operate around 1550 nm [4]. However it has not been possible to exploit soliton effects within
sources operating in the visible and near infrared regions of the spectrum, since conventional
single mode fibers display normal dispersion at wavelengths below 1.3 µm. HF technology, has
now enabled the design and fabrication of fibers with anomalous dispersion at wavelengths as
short as 500 nm [5], and HFs have been shown to be capable of supporting soliton propagation
over a distance of ~3 soliton periods when seeded from a Ti:Sapphire laser operating at 800nm
[3]. Whilst the bulk Ti:Sapphire systems used to seed the initial demonstrations of soliton and
supercontinuum effects in HF are suitable for research, they are far from ideal if one wishes to
develop practical sources based on HF technology. The results presented in this chapter
demonstrate that the Yb-doped fiber system reported in the first part of this thesis is capable of
121
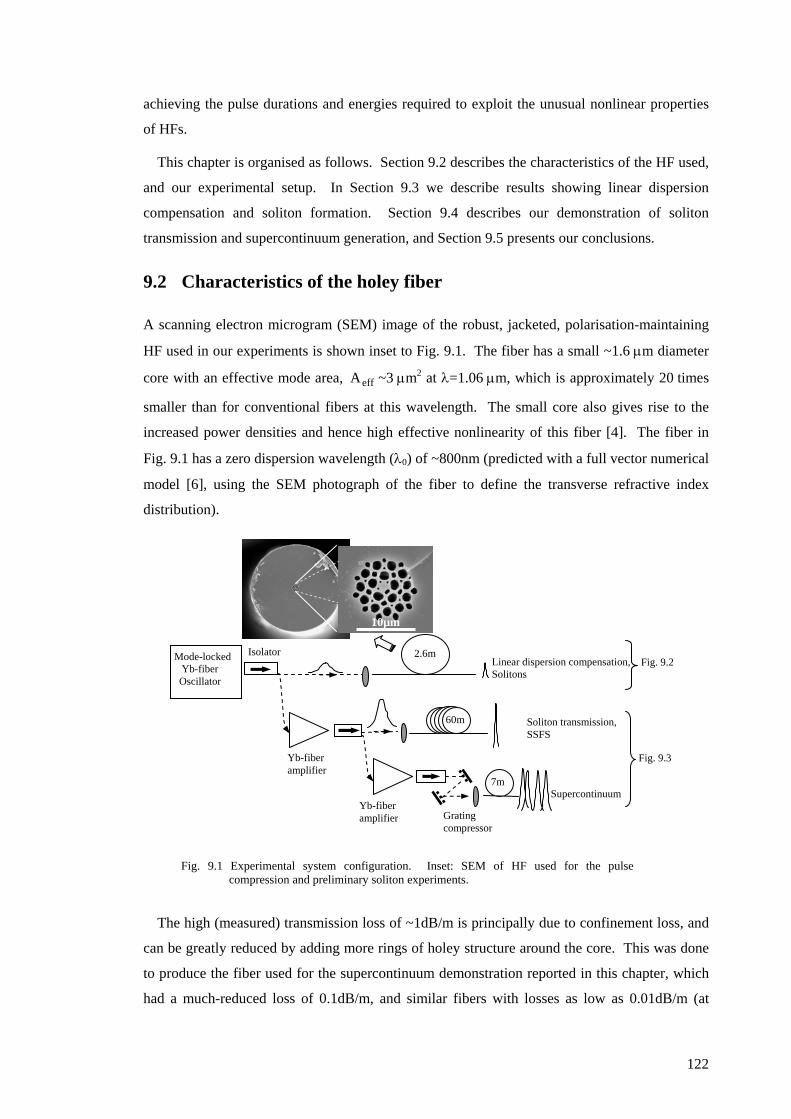
achieving the pulse durations and energies required to exploit the unusual nonlinear properties
of HFs.
This chapter is organised as follows. Section 9.2 describes the characteristics of the HF used,
and our experimental setup. In Section 9.3 we describe results showing linear dispersion
compensation and soliton formation. Section 9.4 describes our demonstration of soliton
transmission and supercontinuum generation, and Section 9.5 presents our conclusions.
9.2 Characteristics of the holey fiber
A scanning electron microgram (SEM) image of the robust, jacketed, polarisation-maintaining
HF used in our experiments is shown inset to Fig. 9.1. The fiber has a small ~1.6 µm diameter
core with an effective mode area, ~3 µmeffA 2 at λ=1.06 µm, which is approximately 20 times
smaller than for conventional fibers at this wavelength. The small core also gives rise to the
increased power densities and hence high effective nonlinearity of this fiber [4]. The fiber in
has a zero dispersion wavelength (λ0) of ~800nm (predicted with a full vector numerical
model [6], using the SEM photograph of the fiber to define the transverse refractive index
distribution).
Fig. 9.1
Fig. 9.1 Experimental system configuration. Inset: SEM of HF used for the pulse compression and preliminary soliton experiments.
Mode-locked Yb-fiber Oscillator
Isolator
10µm
7m
60m
Yb-fiber amplifier
2.6m
Supercontinuum
Soliton transmission, SSFS
Linear dispersion compensation, Solitons
Grating compressor
Yb-fiber amplifier
Fig. 9.3
Fig. 9.2
The high (measured) transmission loss of ~1dB/m is principally due to confinement loss, and
can be greatly reduced by adding more rings of holey structure around the core. This was done
to produce the fiber used for the supercontinuum demonstration reported in this chapter, which
had a much-reduced loss of 0.1dB/m, and similar fibers with losses as low as 0.01dB/m (at
122
1550 nm) have been reported [7]. The fiber is rigorously single mode at wavelengths above
1µm, but will support higher order modes at shorter wavelengths. However, the confinement
losses increase rapidly at shorter wavelengths, attenuating these higher order modes, so the fiber
is effectively single mode down into the visible regions of the spectrum. The fiber is highly
suitable for polarisation maintaining applications, having a birefringence length of just 1.15 mm
at 1.06 µm wavelength (polarisation extinction ~21dB between fiber axes). This high
birefringence arises from the combination of core asymmetry, high refractive index contrast and
small-scale structure.
9.3 Linear dispersion compensation and soliton formation
The mode-locked seed laser and launch arrangement are shown in . We used the
Yb-doped, stretched pulse fiber laser described in Chapter 4 as our master oscillator [8]. For
supercontinuum generation we amplified the pulses in diode-pumped Yb-doped fiber amplifiers.
The laser output is exceptionally stable (amplitude noise ~0.05%) and therefore represents a
very attractive and practical seed for Raman-soliton experiments, which are naturally highly
sensitive to amplitude noise.
Fig. 9.1
Fig. 9.2
Fig. 9.2
Fig. 9.2
. shows the results obtained by launching the ~2.4 ps duration positively chirped
Gaussian pulses directly from the laser into a length of the HF and recording the non-collinear
SHG autocorrelations and optical spectra of the transmitted pulses. We used a half wave plate
at the launch to match the pulse polarisation to a principal axis of the highly birefringent fiber.
Without taking this precaution, components of the pulses launched on to the orthogonal fiber
axes were observed to walk-off temporally due to the difference in dispersion between the axes,
complicating the interpretation of the experiments. We present data for two launched pulse
energies: 1 pJ, for which the propagation is close to linear over the propagation lengths
considered, and 20 pJ, for which significant nonlinear effects become apparent. Starting with a
fiber length of ~2.6 m (estimated transmission loss ~2dB) we gradually cut back the fiber length
to record the evolution of the pulses as a function of propagation distance.
.a) shows a plot of the pulse FWHM vs. fiber length for pulses in both the linear (1 pJ)
and nonlinear (20 pJ) regime. As expected for linear compression of an initially chirped pulse,
the 1 pJ pulses are seen to initially compress, reach a minimum duration after ~1.2 m, and then
to broaden again. The linearity of the compression process is confirmed by the inset spectrum
.b) in which only a modest spectral broadening is observed at the point of maximum
linear pulse compression. Compression by a factor of ~14 to a minimum duration of 170 fs is
observed, with some higher order phase distortion remaining when compared with the minimum
duration of 108 fs obtained when we compressed the pulses with a grating pair. Fitting the data
123

of .a) we estimate the dispersion of the fiber to be ~150 ps/(nm.km) [4]. We believe that
this is the first direct demonstration of linear dispersion compensation in a HF with anomalous
dispersion at wavelengths below 1.3 µm [4].
Fig. 9.2
Fiber length (cm)50 100 150 200 250
Puls
e FW
HM
(fs)
0
500
1000
1500
2000
2500
3000
~20 pJ pulse energy~1pJ pulse energy
a)
Fig. 2b)
Fig. 2c)
Fig. 2d)
Delay (fs)-2000 0 2000
c)
FWHM = 60 fs
Wavelength (nm)1025 1075
-30
-20
-10
0
Delay (fs)-2000 0 2000
d)
FWHM = 115 fs
Wavelength (nm)1025 1075
-30
-20
-10
0
Delay (fs)-2000 0 2000
SHG
inte
nsity
0.0
0.5
1.0 b)
FWHM = 170 fs
UncompressedFWHM = 2.4 ps
Wavelength (nm)1025 1075
-30
-20
-10
0dB Transmitted
Seed
Fig. 9.2 Results obtained launching pulses directly from the laser into 2.2 m length of HF. a) Plot of transmitted pulse FWHM vs. fiber length. b)-d) Autocorrelation and inset spectra of pulses transmitted through HF: b) linear regime (1pJ pulses), fiber length = 1.15 m c) non-linear regime (20pJ pulses), fiber length = 0.92 m , d) non-linear regime, Raman scattering, fiber length = 2.02m.
Fig. 9.2
Fig. 9.2 Fig. 9.2
Fig.
9.2
In the non-linear regime (20 pJ pulses), .a) indicates soliton propagation with minimal
temporal pulse broadening after transmission through ~2.6 m of fiber, which corresponds
to ~ 20 soliton periods (as defined by the minimum compressed pulse width and the above
estimated HF dispersion). The shortest compressed pulses have a duration of 60 fs (see
autocorrelation shown in .c). The symmetric spectrum inset to .c), after
propagation through 0.92 m of fiber, indicates the effects of SPM, whereas the spectrum in
.d), after propagation through 2.02 m of fiber, shows a distinct peak at 1.075 µm, which is
evidence of the SSFS effect. The low pulse energies (20 pJ, 200 W typical peak power) and
~1 m length of this fiber required to form solitons [1, 3, 9], are at least an order of magnitude
lower than those previously required for similar experiments in conventional fiber at 1.55 µm
[4], which makes these nonlinear effects readily accessible for practical applications.
124

9.4 Soliton transmission and supercontinuum generation
To achieve higher pulse energies we amplified the laser pulses using direct amplification in
diode-pumped Yb-doped fiber amplifiers. The experimental setup is shown schematically in
. The SEM of the small core, anomalously dispersive HF used for the higher pulse
energy experiments is shown in Fig. 9.3.a). Although not identical to the fiber used in the
earlier experiments, the fiber in .a) has very similar construction (core diameter, air fill
fraction), and experimentally measured parameters ( 0eff ,A λ ) compared to the previous fiber.
We believe the processes of linear and non-linear pulse compression are acting similarly in both
experiments. The key difference is that by incorporating more rings of holes, the fiber shown in
.a) has much lower confinement losses (~0.1dB/m).
Fig. 9.1
Fig. 9.3
Fig. 9.3
Delay (ps)-15 -10 -5 0 5 10 15
SHG
Inte
nsity
0
1SeedFWHM = 6 ps
TransmittedFWHM = 400 fs
b)
Wavelength (nm)1050 1100 1150
Inte
nsity
(dB
)
-40
0 Transmitted pulse
Seed6ps, 100pJ
c)
a)
Wavelength (nm)400 800 1200 1600
Inte
nsity
(dB
)
-40
0d)
Seed pulse(~350fs, 7.5nJ)
Fig. 9.3 Results obtained using amplified pulses. a) SEM of the HF used for amplified pulse experiments. b) Autocorrelation of 70 pJ pulses; at the input (positively chirped, FWHM 6ps), and after transmission through 60m of fiber (FWHM ~400fs). c) Spectra of input pulses (FWHM 6ps, 100pJ) and wavelength shifted (SSFS) pulses after transmission through 60m of fiber. d) Broadband continuum obtained by launching 20kW peak power pulses (FWHM~350fs, 7.5nJ) into 7m fiber length. The chirp of the input pulses was removed using a diffraction grating compressor.
Fig. 9.3
Fig. 9.3
Launching the uncompressed amplified pulses (strong positive chirp, FWHM~6ps) directly
into a 60 m length of the HF shown in .a), we observed dramatic temporal pulse
compression and evidence of SSFS wavelength tuning. For low launched pulse energies (below
~10 pJ), we observed that the transmitted spectrum was undistorted but the pulses were
temporally broadened (beyond the ~50 ps measurement capability of our autocorrelator) due to
the excess anomalous dispersion of the fiber. However, on increasing the launched pulse energy
above ~20 pJ, the FWHM of the transmitted pulses reduced to below 1 ps, and for launched
pulse energies around ~70 pJ, the output pulse FWHM remained constant at ~400 fs. .b)
shows the SHG autocorrelation of the 400 fs transmitted pulses (solitons), and of the 6ps
125
launched pulses. This demonstration of soliton transmission through 60 m of fiber corresponds
to ~475 soliton periods, which we believe is the longest transmission distance recorded for
solitons at this wavelength. The spectrum shown in .c) clearly demonstrates single
colour Raman solitons, which were tuneable with increasing launched pulse energy out to a
maximum wavelength of ~1.12 µm. This complements the work on SSFS in an active Yb-
doped HF described in Chapter 11 of this thesis, where we achieved a much broader tuning
range 1.06-1.33 µm [10].
Fig. 9.3
Fig. 9.3
Finally, we increased the peak power of the launched pulses to a maximum of ~20 kW
(350 fs FWHM, E~7.5 nJ) by adding a higher power cladding pumped Yb-doped fiber
amplifier, a modulator to reduce the pulse repetition rate, and a diffraction grating compressor to
remove the chirp. The output of the HF became a spectacular blue/white colour and the ultra-
broad supercontinuum spectrum in .d) shows the enormous broadening into the visible
region, especially compared to previous supercontinuum demonstrations from all fiber systems
[11]. As the pulse energy was increased, the spectrum first formed a broad continuum across
the infrared spectrum, and only at the highest powers did the spectrum move into the visible
range. The HF length was 7 m, but we note that visible blue light was seen towards the launch
end of the fiber indicating that a substantially shorter fiber length could have been used. Using
an oscilloscope and detector with ~2 GHz bandwidth, the input pulses were observed to be jitter
free with FWHM duration of 0.5 ns (true pulse width of ~6 ps), whereas the transmitted pulses
were smeared across a 2 ns (FWHM) time window with significant jitter, which we interpreted
as break-up into multiple pulses.
9.5 Conclusion
In conclusion, we have directly demonstrated, for the first time to our knowledge, linear
dispersion compensation in a HF with anomalous dispersion at wavelengths less than 1.3 µm.
At only 1 mW average powers (peak power ~200W), the fiber supports both soliton
compression, and pulse propagation without temporal broadening, and using pulses with higher
peak powers, we generated supercontinuum spectra spanning from below 400 nm to above
1750 nm. All experiments were seeded using our diode-pumped Yb-doped fiber source.
126
127
References 1. J. H. Price, W. Belardi, L. Lefort, T. M. Monro and D. J. Richardson, "Nonlinear pulse
compression, dispersion compensation, and soliton propagation in holey fiber at 1 micron," Nonlinear Guided Waves and Their Applications (NLGW 2001), paper WB1-2 (2001).
2. J. H. V. Price, W. Belardi, T. M. Monro, A. Malinowski, A. Piper and D. J. Richardson, "Soliton transmission and supercontinuum generation in holey fiber, using a diode pumped Ytterbium fiber source," Optics Express 10, 382-387 (2002).
3. W. J. Wadsworth, J. C. Knight, A. Ortigosa-Blanch, J. Arriaga, E. Silvestre and P. St.J.Russell, "Soliton effects in photonic crystal fibres at 850 nm," Electronics Letters 36, 53-55 (2000).
4. G. P. Agrawal, Nonlinear Fiber Optics, Academic Press (San Diego), 2nd (1995). 5. J. C. Knight, J. Arriaga, T. A. Birks, A. Ortigosa-Blanch, W. J. Wadsworth and P.
St.J.Russell, "Anomalous dispersion in photonic crystal fiber," IEEE Photonics Technology Letters 12, 807-809 (2000).
6. T. M. Monro, D. J. Richardson, N. G. R. Broderick and P. J. Bennett, "Holey optical fibers: An efficient modal model," Journal of Lightwave Technology 17, 1093-1102 (1999).
7. K. Suzuki, H. Kubota, S. Kawanishi, M. Tanaka and M. Fujita, "Optical properties of a low-loss polarization-maintaining photonic crystal fiber," Optics Express 9, 676-680 (2001).
8. L. Lefort, J. H. Price, D. J. Richardson, G. J. Spuhler, R. Paschotta, U. Keller, A. Fry and J. Weston, "Practical Low-Noise stretched-pulse Yb-doped fiber laser," Optics Letters 27, 291-293 (2002).
9. J. K. Ranka, R. S. Windeler and A. J. Stentz, "Visible continuum generation in air-silica microstructure optical fibers with anomalous dispersion at 800 nm," Optics Letters 25, 25-27 (2000).
10. J. H. Price, K. Furusawa, T. M. Monro, L. Lefort and D. J. Richardson, "A tuneable, femtosecond pulse source operating in the range 1.06-1.33 microns based on an Yb doped holey fiber amplifier," Conference on Lasers and Electro Optics (CLEO), Vol. 56 of OSA Trends in Optics and Photonics Series (Optical Society of America, Washington, D.C., 2001) paper CPD1 (2001).
11. M. E. Fermann, M. L. Stock, D. Harter, T. A. Birks, W. J. Wadsworth, P. St.J.Russell and J. Fujimoto, "Wavelength-tunable soliton generation in the 1400-1600 nm region using an Yb fiber laser," Conference on Advanced Solid State Lasers (ASSL), Technical Digest, Paper TuI2-1, (2001).
Chapter 10 UV generation in a silica holey fiber
10.1 Introduction
This chapter describes our demonstration of supercontinuum generation extending to 300 nm in
the UV from a pure silica holey fiber. The broad spectrum was obtained by launching ultra-
short pulses (~150 fs, 10 nJ at 820 nm) from an amplified Ti:sapphire laser. The extension of
HF based supercontinuum generation into the UV should prove to be of immediate application
in spectroscopy. By slightly detuning the launch conditions we excited a higher order spatial
mode which produced a narrower supercontinuum, but with enhanced conversion efficiency at a
series of blue/UV peaks around 360 nm. We present numerical simulations, which suggest that
differences in the dispersion profiles between the modes are an important factor in explaining
this enhancement. In a related experiment, using the same laser source and fiber, we
demonstrated visible supercontinuum from several subsidiary cores, with distinct colours in
each core. The subsidiary cores were excited by appropriate input coupling. Fabrication of a
fiber with a range of core sizes (dispersion profiles) for tailored supercontinuum generation can
therefore be envisaged for practical applications [1].
Microstructured “holey” fibers have a unique range of optical properties [2, 3] and have
enabled new applications in spectroscopy [4], metrology [5] and communications [6, 7].
Although the field of supercontinuum research using conventional fibers has been active for
many years at wavelengths near 1.5 µm for telecommunications applications [8], the unique
properties of HFs have enabled the demonstration of visible supercontinuum in HF pumped
directly with Ti:sapphire oscillators [9]. This demonstration encouraged tremendous new
research interest to both explain the origin of this remarkable spectral broadening [10, 11] and to
develop further applications [12]. Visible supercontinuum spectra have previously been
reported spanning 390-1600 nm using microstructured HF [9, 10], and 375-1500 nm [13] using
tapered standard fiber. However, there is strong interest in extending the achievable bandwidths
still further, particularly towards the ultraviolet (UV) regions of the spectrum [14, 15] for use in
spectroscopy.
The dispersion profile of a HF has been shown to strongly influence the spectral shape of the
supercontinuum produced [11]. We present, for the first time to our knowledge, full vector
calculations based on the SEM of an actual fiber structure, of the dispersion characteristics of
128
the higher order spatial modes that were observed to produce enhanced UV generation. Our
calculations show that the zero dispersion wavelength (λ0) is close to the pump wavelength for
the fundamental mode for our fiber, but at significantly shorter wavelengths for the higher order
modes. We have used these dispersion profiles to perform numerical simulations of the
continuum spectra in the fundamental and higher order modes, and which are in reasonable
agreement with the measured spectra. Our observation that pumping close to λ0 creates a broad
flat spectrum, whereas pumping above λ0 creates both red-shifted and blue-shifted spectral
bands, is consistent with the investigations of other authors into the continuum spectra from the
fundamental spatial mode made using fibers with different core sizes, and hence dispersion
profiles [11].
Finally, using the same fiber and laser source, we demonstrated that by varying the input
coupling appropriately, visible supercontinuum from several subsidiary cores could be
produced. The colours of the supercontinuum spectra differed for each subsidiary core, which
we consider was due to differences between the dispersion profiles of each core and also to
differences between the input coupling efficiencies. This initial demonstration of
supercontinuum generation in a multi-core fiber shows the potential for designing a fiber with
an array of cores with different dimensions (dispersion profiles) and that could be selectively
excited for tailored spectral generation from a single fiber structure.
The choice of fiber material is important for efficient UV generation in order to avoid
unacceptable absorption (attenuation). High UV transmission losses affect standard silica based
fibers, which are used to fabricate tapers for supercontinuum generation, because the ions
typically incorporated in the fiber core in order to obtain the required transverse refractive index
profile result in strong absorption in the UV (e.g. germanium doped silica has ~10,000 dB/km
stronger absorption [16] at 250 nm compared to pure (undoped) silica). We expect that the
comparatively low material loss of the single material pure silica HF as used in the experiments
presented here should make such fibers strong candidates for efficient fiber-based UV
supercontinuum sources.
This chapter is organised as follows. In Section 10.2 we describe the details of the
experiment, and the properties of the HF. In Section 10.3, we describe our numerical
simulations and compare the results to our experimentally measured spectra. In Section 10.4 we
report our observations of supercontinuum generation in several subsidiary cores of the fiber,
and in Section 10.5 we draw our conclusions.
129

10.2 Experimental observation of UV supercontinuum
Supercontinuum generation was produced by coupling high energy ultrashort pulses into a short
length of HF. A schematic of our experimental setup is shown in . The
supercontinuum generation at visible and near infrared wavelengths was recorded using a fiber-
coupled optical spectrum analyser, whereas a UV optimised spectrometer and cooled CCD were
used for wavelengths extending to below 300 nm. The spectral data presented in this chapter
were produced using a pump wavelength λpump=820 nm. Coupling into the fundamental mode,
which has λ0 close to λpump, produced a yellow coloured supercontinuum, but by coupling into a
higher order mode, we produced a dramatic change in the colour of the supercontinuum to
bright blue-white, and we recorded UV spectra for the two-lobed mode showing power
transferred to a series of peaks around 360 nm. By pumping at a shorter wavelength, we
produced a wider variety of colours in higher order modes, as shown in .
Fig. 10.1
Fig. 10.1. Experimental configuration for characterising supercontinuum extending into the UV.
Fig. 10.4
ND filter
Color filter
Spectrometer
HF (~25cm)
Mirror
Ti:sapphire laser 820nm, 150fs, 40nJ, 250kHz, 200kW (peak), 10mW (Av.)
UV CCD
λ/2 ND filter
Spectrum analyser
This section is structured as follows. Section 10.2.1 describes the characteristics of the HF.
Section 10.2.2 presents the results showing UV generation to wavelengths as short as 300 nm in
the UV. Section 10.2.3 shows the results obtained by coupling into higher order spatial modes
(enhanced conversion efficiency into UV peaks). Section 10.2.4 is a brief report of our
observations of laser induced damage to the fiber input facet.
10.2.1 Characteristics of the holey fiber
A SEM image of our robust, jacketed, polarisation-maintaining HF is shown inset to Fig. 10.1.
The fiber has a ~1.6 µm diameter core, and a large air fill fraction in the cladding and this
combination results in a highly confined mode with ~ 2.5 µmeffA 2. The fiber is rigorously
single mode at wavelengths above 1 µm, but supports higher order modes at shorter
wavelengths.
130

As mentioned in the introduction, we observed supercontinuum generation in higher order
spatial modes, which was accompanied by enhanced spectral conversion in strong UV peaks.
To further understand this process, we have calculated the mode area and dispersion properties
of the fundamental and next lowest order fiber modes as shown in . The calculated
dispersion profiles (Fig. 10.2(b)) show that the two polarisation modes (quasi-linearly polarised)
associated with each transverse mode are not degenerate because the asymmetry of the fiber
profile leads to mode splitting. (By comparison, these pairs of quasi-linearly polarised modes
would remain degenerate for a fiber with an idealised hexagonal hole configuration [17].) It is
therefore crucial to use a full vectorial method to calculate the properties of this small-core
fiber, and we used a full vectorial implementation of the orthogonal function method [18],
incorporating both odd and even functions to describe the modal fields and HF profile. The
material dispersion of silica is incorporated in the calculations directly via use of the Sellmeier
equation.
Fig. 10.2
Fig. 10.2
Fig. 10.2
Fig. 10.2
Fig. 10.2
Fig. 10.2
Fig. 10.2
The numerically predicted intensity profiles of the two-lobed spatial modes, and near field
photographs of continuum generation in each mode are shown in (a) and (d). A 100x
microscope objective was used to image the fiber output onto a screen. The predicted intensity
profiles match the observed mode shapes well, including details of the asymmetries in each
direction. The dispersion predictions for the two-lobed modes and for the fundamental mode
are presented in (b). The three pairs of different dispersion profiles (hence different λ0)
create distinctive supercontinuum spectral shaping. The zero dispersion wavelengths are:
λ0 = 795 nm, 838 nm (polarisation dependent) for the fundamental mode; λ0 = 611 nm, 629 nm
(polarisation dependent) for the mode of (a); and λ0 = 671 nm, 694 nm (polarisation
dependent) for the mode of Fig. 10.2(d). The injection wavelength used in our experiments
λpump= 820 nm) is shown in (b). The calculated effective mode area ( ) of the
fundamental mode is shown in (c). We also calculated of all six modes to be:
2.32 µm
effA
effA2, 2.43 µm2 for the two principal polarisation axes of the fundamental mode; 2.01 µm2,
2.05 µm2 for the mode of Fig. 2(a); and 2.34 µm2, 2.38 µm2 for the mode of (d) (all
calculated at a wavelength of 675 nm, which is close to the centre of the observed
supercontinuum spectra).
131

Fig. 10.2. (a),(d) Numerically predicted intensity profiles (1dB contour spacing) and corresponding near-field photographs (produced by imaging the fiber end using a 100x microscope objective) for two-lobed spatial modes. (b) Calculated dispersion for fundamental and two-lobed spatial modes. (c) Calculated for the fundamental spatial mode. (Similar for two-lobed modes.) The solid and dashed curves are for the two principal polarisation axes of the highly birefringent fiber.
effA
λ (µm) 0.6 0.8 1.0 1.2 1.4
Aef
f (µm
2 )
2.0
2.5
3.0
3.5 (c)
λ (µm)0.4 0.8 1.2
D (
ps/n
m.k
m)
-400
-200
0
200
Fundamental-mode
pump at 820nm
(b) (a) (d)
The measured loss of the fiber (fundamental mode) is ~40dB/km at a wavelength of 1.55 µm
[6]. However single material HFs with losses as low as 0.58dB/km at λ= 1.55 µm have been
fabricated [19], and therefore excess loss should not be a constraint on the performance of future
practical devices based on this technology. Calculations based on the multipole method [19]
indicate that confinement loss provides a significant contribution toward the total measured loss
in this fiber, but that it should be possible to reduce the confinement loss for this fiber to well
below 0.1 dB/km simply by adding more rings of air holes. The higher order modes extend
further into the cladding and it is therefore anticipated that the higher order modes would
experience very large confinement loss, and so would not be observable in long fiber lengths.
This effect was observed experimentally because for the mode of Fig. 10.2(a), which has λ0 and
furthest from those of the fundamental mode, we could much more easily observe
transmitted power through a 15 cm fiber length compared to a 25 cm fiber length, whereas we
observed the mode of Fig. 10.2(d) through a longer length of fiber without difficulty.
effA
132

10.2.2 Supercontinuum generation into the UV
In this section we describe our experimental setup and the special precautions used to make
measurements in the UV. The experimental arrangement is shown in . High energy,
ultrashort (~150fs FWHM) pulses at a wavelength of 820 nm from a mode-locked Ti:sapphire
laser system (TEM00 mode, average power~10 mW, repetition rate =250 kHz) were launched
into a ~25 cm length of HF using a 40x microscope objective. By maximising the coupling
efficiency, we launched ~25% of the incident power (launched energy ~10 nJ, peak power
~50 kW). The supercontinuum at the fiber output was recorded at visible and near infrared
wavelengths using a fiber-coupled optical spectrum analyser (ANDO AQ6315B), and using a
UV optimised spectrometer (appropriately blazed diffraction grating; UV enhanced CCD
detector) for wavelengths at least as short as 300 nm. We used UV fused silica (UVFS) lenses
to couple light into the spectrometer in order to avoid the poor transmission of standard BK7
glass lenses at short wavelengths.
Fig. 10.1
Fig. 10.3
Fig. 10.3
Fig. 10.3
Fig. 10.3
(a) shows the observed supercontinuum extending from <300 nm to >1600 nm and
combines the data from the optical spectrum analyser and spectrometer. We have considered
the wavelength variation of the spectrometer efficiency, calculated from the efficiency curves of
each spectrometer element shown in (b). The overall spectrometer efficiency was
found to be approximately uniform from ~250 nm to 800 nm, so we have not adjusted the UV
spectra of (a),(d) for instrument variation. The spectrometer slit width was held
constant to minimise variations in spatial mode filtering. Scatter from higher order diffraction
of the pump (820nm) and longer wavelengths was removed using a UG1 coloured filter from
Schott Glass, which blocks most wavelengths >600 nm. Fig. 10.3(c) shows the overall
efficiency of the spectrometer with and without the filter. The differences between the filtered
and unfiltered spectra should comprise: (i) weak attenuation at the measured UV wavelength,
and (ii) strong attenuation of longer wavelengths, which removes potential false counts caused
by 2nd order diffraction. (d) shows the UV spectra with and without the coloured
filters. The differences between the filtered and unfiltered spectra match the absorption of the
coloured filter at the UV wavelength, so we concluded that scatter from higher order diffraction
of long wavelengths was not distorting the unfiltered spectrum. The measurements therefore
confirm that the supercontinuum spectrum extends down to at least 300 nm in the UV.
For the supercontinuum produced in the fundamental mode of our fiber (λ0 close to λpump), we
interpret our observation of UV generation to 300 nm, which represents a more extreme
broadening towards the UV than typically reported [9, 11], to result from differences between
the precise form of the dispersion profile of our fiber compared to the fibers studied by other
authors, and perhaps also from our detailed observations using a spectrometer with enhanced
sensitivity in the UV.
133

Fig. 10.3. (a) Broadband supercontinuum spectrum extending from 300nm (UV) to 1600nm (IR). (b) Calculated efficiency of the UV optimised spectrometer. The spectrometer mirror efficiency (not shown) is 92% across the spectral range considered, and is included in the overall efficiency. (c) Transmission characteristics of the coloured filter used to eliminate unwanted long-wavelength scatter. (d) UV spectra from 300nm to 500nm recorded with and without coloured filter.
λ (nm)300 400 500
Intensity
10
100
1000
10000
with UG1 filter
without filter
λ (nm)200 300 400 500 600 700 800
Effic
ienc
y
0.0
0.2
0.4
0.6
UG1 filter
Overall efficiency(Spectrometer + filter)
Spectrometer efficiency
λ (nm)300 700 1100 1500
Intensity (dB)
-40
-20
0
Optical Spectrum Analyser
UV Spectrometer
λ (nm)
200 300 400 500 600 700 800
Effic
ienc
y
0.0
0.2
0.4
0.6
0.8
1.0
Overall spectrometer efficiency
UVFS lens
CCDGrating (TE, TM)
(a) (b)
(c) (d)
10.2.3 Enhanced UV in higher order spatial modes
Despite the wide interest in supercontinuum research, there have been few previous reports of
supercontinuum in higher order spatial modes [14, 20, 21]. Due to the large index difference
between core and cladding modes of small core, high air fill fraction HFs, the effective index of
the fundamental mode, which is mostly confined within the core, is substantially greater than for
higher order modes, which extend into the holey cladding. It is therefore comparatively difficult
to couple to higher order modes of these HFs, and the perturbations which couple modes in
standard fibers (small variations of core diameter resulting from fabrication, and bending of the
fiber) are comparatively less effective at mode-mixing. However, illustrates that by
slightly detuning the pump launch from that for optimal launch efficiency, we obtained strong
coupling into higher order spatial modes accompanied by a visually stunning change in the
colour of the fiber output from pale yellow ( (b)(ii)) to bright white ( (b)(iii)),
which led us to investigate the supercontinuum spectrum into the UV.
Fig. 10.4
Fig. 10.4 Fig. 10.4
Fig.
10.4
Fig. 10.4
Using a pump wavelength of ~820 nm produced only the fundamental mode of
(b)(ii), or the two-lobed mode oriented as shown in Fig. 10.4(b)(i),(iii). We observed that
the mode-colour of (b)(iii) was associated with the strongest UV generation. Using an
OPA system to provide a pump wavelength of ~675 nm (similar pulse energy and duration
134

compared to 820 nm pulses), we observed a wider range of colours produced in higher-order
modes and with lobes in either orthogonal orientation as shown in Fig. 10.4(b) (iv)-(vi) . The
relative ease of generating supercontinuum in higher order modes when λpump = 675 nm
(compared to λpump = 820 nm) could be because the pump wavelength is then closer to λ0 of the
higher order modes, although we have not identified the exact mechanism.
Mirror Screen (photograph)
~25cm holey fiber
a)
Fig. 10.4. (a) Experimental setup for detuning the launch into the HF. (b) Far-field photographs of the colours produced in higher order spatial modes. (i)-(iii) λpump = 820 nm; (iv)-(vi) λpump = 675 nm. The orientations of the modes correspond to those of the near field images in Fig. 10.2.
Fig. 10.4
Fig. 10.4
(vi)(v)
(iii)
(iv)
(ii) b) (i)
The average power transmitted in the higher order modes was typically ~1 mW, compared to
~2 mW in the fundamental mode. The reduction in transmitted power is due to lower launch
efficiency (off-axis launch) and to somewhat higher transmission losses in this higher order
mode, but high energy pulses (up to 5 nJ) could still be launched into this higher order mode.
The orientation of the two-lobed mode was predominantly that shown in (b)(iii), which
corresponds to the mode of (d). Fig. 10.2
Coupling into the two-lobed mode of .(b)(iii) resulted in an enhancement of the
power at wavelengths close to 360 nm, and a narrowing of the supercontinuum. (top)
shows the results from coupling into the two lobed spatial mode (shown inset).
(lower) shows the results from coupling into the fundamental mode (shown inset). The
spectrum from the two lobed mode, (a)(top), was narrower when compared to the
spectrum from the fundamental mode, (a)(lower), but retained strong spectral
conversion to <450 nm wavelengths. Enhanced UV generation at a series of peaks near
~360 nm is demonstrated in (b) from the two-lobed mode (top plot), but the peaks are
Fig. 10.5
Fig. 10.5
Fig. 10.5
Fig. 10.5
Fig. 10.5
135
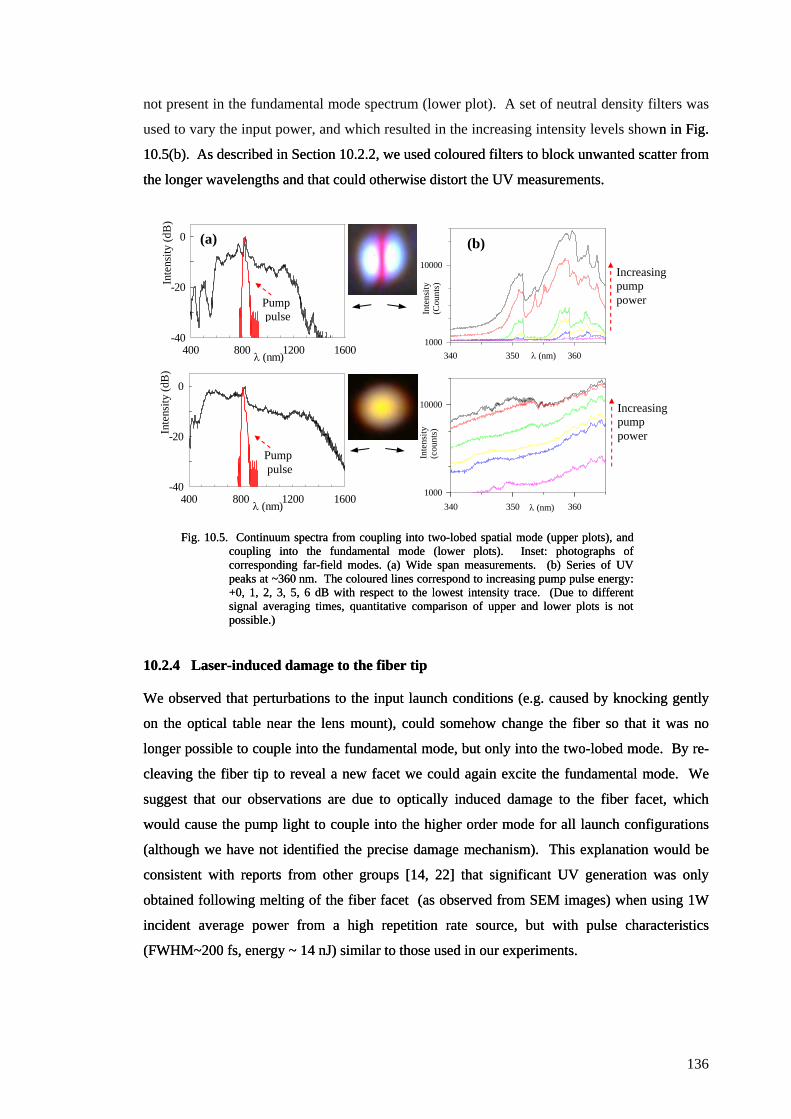
not present in the fundamental mode spectrum (lower plot). A set of neutral density filters was
used to vary the input power, and which resulted in the increasing intensity levels shown in
(b). As described in Section 10.2.2, we used coloured filters to block unwanted scatter from
the longer wavelengths and that could otherwise distort the UV measurements.
n in
(b). As described in Section 10.2.2, we used coloured filters to block unwanted scatter from
the longer wavelengths and that could otherwise distort the UV measurements.
Fig.
10.5
Fig. 10.5. Continuum spectra from coupling into two-lobed spatial mode (upper plots), and coupling into the fundamental mode (lower plots). Inset: photographs of corresponding far-field modes. (a) Wide span measurements. (b) Series of UV peaks at ~360 nm. The coloured lines correspond to increasing pump pulse energy: +0, 1, 2, 3, 5, 6 dB with respect to the lowest intensity trace. (Due to different signal averaging times, quantitative comparison of upper and lower plots is not possible.)
λ (nm)400 800 1200 1600
Inte
nsity
(dB
)
-40
-20
0
λ (nm)400 800 1200 1600
Inte
nsity
(dB
)
-40
-20
0
λ (nm)340 350 360
Inte
nsity
(C
ount
s)
1000
10000
λ (nm)340 350 360
Inte
nsity
(c
ount
s)
1000
10000
Pump pulse
Pump pulse
(b)
Increasing pump power
Increasing pump power
(a)
10.2.4 Laser-induced damage to the fiber tip 10.2.4 Laser-induced damage to the fiber tip
We observed that perturbations to the input launch conditions (e.g. caused by knocking gently
on the optical table near the lens mount), could somehow change the fiber so that it was no
longer possible to couple into the fundamental mode, but only into the two-lobed mode. By re-
cleaving the fiber tip to reveal a new facet we could again excite the fundamental mode. We
suggest that our observations are due to optically induced damage to the fiber facet, which
would cause the pump light to couple into the higher order mode for all launch configurations
(although we have not identified the precise damage mechanism). This explanation would be
consistent with reports from other groups [14, 22] that significant UV generation was only
obtained following melting of the fiber facet (as observed from SEM images) when using 1W
incident average power from a high repetition rate source, but with pulse characteristics
(FWHM~200 fs, energy ~ 14 nJ) similar to those used in our experiments.
136
10.3 Comparison of experimental results with simulations
In this section, we compare the results of our numerical modelling to the experimentally
measured spectra. We performed the modelling to provide insight into the mechanisms giving
rise to the enhanced UV generation in the higher order spatial mode. When considering which
parameters to include in the model, we first noted that in order to excite the higher order modes
it was necessary to detune the launch with respect to that used for optimum coupling into the
fundamental mode. In addition, the fibers used in our experiments were quite short (25 cm), so
strong coupling between modes subsequent to launch would be unlikely. We therefore
considered that coupling into the two-lobed mode occurred solely at launch and not by mode-
mixing from the fundamental mode after launch. This suggested that the properties
(nonlinearity, dispersion) of the two-lobed mode alone could be responsible for the spectral
shaping, rather than a more complex inter-modal process. As described in Section 10.2.1, the
effective mode areas of the fundamental and two-lobed mode are very similar, implying similar
effective nonlinearities for these modes. However, the dispersion properties are dramatically
different; in particular, the two-lobed mode has λ0~690 nm compared to λ0~810 nm for the
fundamental mode. The shorter λ0 of the higher order mode would cause phase-matching to
transfer energy further towards the UV, and would explain the general observation of enhanced
UV generation.
To support our suggestion that the difference between the supercontinuum produced in
different spatial modes is principally due to differences between the dispersion profiles of those
modes, we performed numerical simulations based on the dispersion profiles for both the
fundamental mode and for the two-lobed mode shown in (d). Our numerical model
(ignoring fiber losses) uses the modified NLSE with gain, as described in Chapter 2, and shown
below.
Fig. 10.2
[ ] ∫∑+
∞−≥
−×
∂∂
+=∂∂
−∂∂ t
k
k
k
kk
dtttzAtRtzAt
iitA
kii
zA ')',()'(),(1
!2
02 ωγβ
where is the electric field envelope, are the dispersion coefficients at the center
frequency
),( tzAA =
0
kβ
ω , )(02 effcAn ωγ = is the nonlinear refractive index, and is the effective area
of the fiber. The equation has been used by other authors for the numerical study of
supercontinuum generation [23, 24]. To solve the propagation equation, we used a standard
split-step Fourier algorithm treating dispersion in the frequency domain and the nonlinearity in
the time domain, apart from the temporal derivative for the self-steepening effect, which is
evaluated using Fourier transforms. In performing this modelling, I am grateful to Dr. Rüdiger
effA
137

Paschotta for allowing me to use "ProPulse", which is a numerical modelling package he has
written for simulating pulse propagation.
We used the dispersion and A data from Section 10.2.1, and chose parameters for our
launched pulses that would correspond to the experimentally observed average transmitted
power from the fiber (E ~10 nJ, in the fundamental mode, E ~5 nJ, in the two-lobed mode; λ
eff
pump
= 820 nm, FWHM ~150 fs for both modes). We also performed simulations for pulses with half
of these energies and the results were qualitatively similar, with only slight variations in the
bandwidth. Our simulation results show the expected spectral fine structuring [23] and we have
applied a rolling average to smooth the data, which is then approximately comparable to the
time averaged experimental measurements. We present simulation results for one of the
principal polarisation axes, but the results were qualitatively similar for the other axis. We note
that there are further refinements that can be made to the above NLSE to include effects such as
loss along the fiber length, ultraviolet and infrared absorption bands, polarisation coupling, and
the wavelength dependence of the effective mode area. However, the simulations show
reasonable qualitative agreement with the experimental spectra.
Fig. 10.6. Experimental (black) and theoretically modelled (red) supercontinuum spectra. (a) fundamental mode; (b) two-lobed mode (Fig. 10.2(d)).
Fig. 10.6
λ (µm)0.4 0.8 1.2 1.6
Intensity (dB)
-40
-20
0
λ (µm)0.4 0.8 1.2 1.6
Intensity (dB)
-40
-20
0(a) (b)
The results of our simulations (red) and the experimental data (black) are shown in
for both the fundamental and the two-lobed modes. The simulation and experimental spectra
show reasonable agreement: the simulation results for the fundamental mode show a broad, flat
spectrum with approximate agreement to the experimentally observed bandwidth; and the
simulation results for the higher order mode show a narrower spectrum, but with significant
power at blue wavelengths. Given the complexity of the phenomenon of supercontinuum in
higher order modes, and the approximations made in our simulations, exact agreement between
simulations and experimental observations could not be expected. However, the main features
observed in our simulation results are consistent with our experimental spectra. Our simulation
results are also consistent with both experimental and theoretical results from other groups that
138
have used fibers with different λ0 in relation to the pump wavelength, but always in the
fundamental spatial mode: i.e. pumping near λ0 produced a broad, flat spectrum, and pumping
on the anomalous dispersion side of λ0 produced discrete red-shifted and blue-shifted bands
[11].
Fig. 10.6
Fig. 10.6
(b) shows that the principal difference between the simulation and experimental
spectrum for the higher order mode is that the simulation shows a lower intensity near λ0
(690nm). We suspect that the higher intensity observed experimentally is likely to arise due to a
non-ideal launch into the higher order mode resulting in residual excitation of the fundamental
mode, as shown by the photographs of and . Similarly, for the spectrum of
the fundamental mode shown in (a), a small fraction of the launch power coupled into
the higher order mode could be responsible for the shoulder in the experimentally observed
spectrum at ~450nm that is not present in the simulation result (the simulations predict a peak in
the higher order mode spectrum at approximately that wavelength). The simulations predict
strong pump depletion such that there is no peak remaining at the pump wavelength. This is
consistent with the simulations of other authors [10, 20], and we suspect that the experimentally
observed peak at the pump wavelength is due to a small fraction of the incident power guided
by lossy cladding modes and observed because the fiber length is short. Overall, we believe that
the simulation results provide support for our suggestion that the difference in general form of
the supercontinuum spectra is principally due to the differences between dispersion profiles of
the fundamental and two-lobed modes.
Fig. 10.4 Fig. 10.5
Fig. 10.5
10.4 Supercontinuum generation in subsidiary cores
In this section we describe our observations from a related experiment that produced
supercontinuum in several subsidiary cores of the fiber. Examples of multiple core HFs that
have previously been reported include a dual core HF [25], and a HF containing several cores of
different dimensions [26]. However, this is the first time, to our knowledge, that
supercontinuum generation in secondary cores of a HF has been demonstrated. In the fiber used
here, the “subsidiary” cores arise where imperfections in the structure have created relatively
thicker regions of silica. In the future, it would be straightforward to envisage the systematic
fabrication of multiple cores using additional solid cores in the capillary stacking process. The
experimental arrangement was similar to that used for continuum generation in the higher order
modes of the principal core ( (a).), using the same pump pulses and HF, but with more
extreme detuning of the launch.
Fig. 10.7(a) shows a typical far-field mode shape produced by continuum generation in a
subsidiary core, observed as scattered light from a white card a few centimetres from the fiber
139
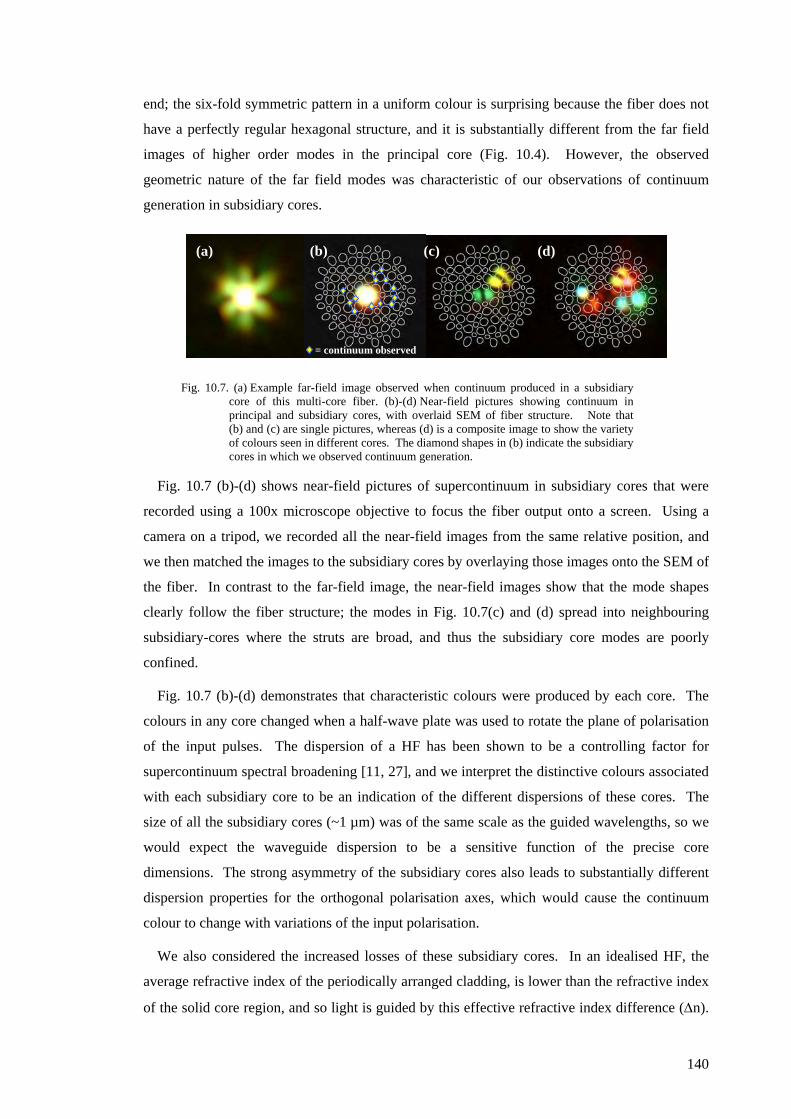
end; the six-fold symmetric pattern in a uniform colour is surprising because the fiber does not
have a perfectly regular hexagonal structure, and it is substantially different from the far field
images of higher order modes in the principal core ( ). However, the observed
geometric nature of the far field modes was characteristic of our observations of continuum
generation in subsidiary cores.
Fig. 10.4
Fig. 10.7. (a) Example far-field image observed when continuum produced in a subsidiary core of this multi-core fiber. (b)-(d) Near-field pictures showing continuum in principal and subsidiary cores, with overlaid SEM of fiber structure. Note that (b) and (c) are single pictures, whereas (d) is a composite image to show the variety of colours seen in different cores. The diamond shapes in (b) indicate the subsidiary cores in which we observed continuum generation.
Fig. 10.7
Fig. 10.7
Fig. 10.7
(d) (c) (b) (a)
= continuum observed
(b)-(d) shows near-field pictures of supercontinuum in subsidiary cores that were
recorded using a 100x microscope objective to focus the fiber output onto a screen. Using a
camera on a tripod, we recorded all the near-field images from the same relative position, and
we then matched the images to the subsidiary cores by overlaying those images onto the SEM of
the fiber. In contrast to the far-field image, the near-field images show that the mode shapes
clearly follow the fiber structure; the modes in (c) and (d) spread into neighbouring
subsidiary-cores where the struts are broad, and thus the subsidiary core modes are poorly
confined.
(b)-(d) demonstrates that characteristic colours were produced by each core. The
colours in any core changed when a half-wave plate was used to rotate the plane of polarisation
of the input pulses. The dispersion of a HF has been shown to be a controlling factor for
supercontinuum spectral broadening [11, 27], and we interpret the distinctive colours associated
with each subsidiary core to be an indication of the different dispersions of these cores. The
size of all the subsidiary cores (~1 µm) was of the same scale as the guided wavelengths, so we
would expect the waveguide dispersion to be a sensitive function of the precise core
dimensions. The strong asymmetry of the subsidiary cores also leads to substantially different
dispersion properties for the orthogonal polarisation axes, which would cause the continuum
colour to change with variations of the input polarisation.
We also considered the increased losses of these subsidiary cores. In an idealised HF, the
average refractive index of the periodically arranged cladding, is lower than the refractive index
of the solid core region, and so light is guided by this effective refractive index difference (∆n).
140

As explained in Section 10.2.1, reducing the confinement losses for small core HFs (to the few
dB/km) requires a sufficient diameter of holey (microstructured) cladding around each core
(number of rings of holes) [19]. It has previously been empirically determined that in order to
confine light of wavelength λ, all fine silica struts surrounding a subsidiary core must be longer
than λ2~ and narrower than λ2.1~ [26]. The supporting struts in our fiber were short and
wide compared to the wavelength of the guided light, and the confinement losses of the
subsidiary cores were therefore high. The confinement losses were evident experimentally
because the fiber glowed much more brightly (unguided light) when continuum was produced in
subsidiary cores compared to when continuum was produced in the main core. Furthermore, we
only observed the supercontinuum in subsidiary cores using a short fiber length (15 cm as
opposed to a 25 cm length for our other measurements). The average power transmitted through
the fiber in subsidiary cores was ~0.5 mW compared to ~2.5 mW in the central core, due to a
combination of the increased confinement losses and the reduced launch efficiency. However,
we suggest that it should be possible to dramatically reduce excess losses by choosing an
appropriately designed fiber structure.
Overall, we believe that this initial observation if supercontinuum generation in several
subsidiary cores of a HF demonstrates the potential for fabrication of a fiber with several cores
of different dimensions for tailored continuum generation from a single fiber.
10.5 Conclusion
In conclusion, we have demonstrated supercontinuum generation from 300 nm in the UV to
above 1600 nm in the IR from a pure-silica HF. Care was taken to consider the efficiency of
our UV enhanced spectrometer across the blue/UV spectral range, and we used coloured glass
filters to block unwanted scatter from longer wavelengths. By coupling into a two-lobed spatial
mode, we measured substantially enhanced UV generation in a series of blue/UV peaks at
wavelengths near 360 nm. Since the fiber lengths used in our experiment were quite short
(~15 cm), and because it was necessary to detune the launch in order to couple into the two-
lobed mode, we believe that coupling into the two-lobed mode occurred at launch, and not by
mode-mixing from the fundamental mode subsequent to launch. The enhanced UV generated
would then result from differences in the dispersion profiles of the fundamental and higher order
two-lobed modes. To enhance our understanding of this process, we used a full vector model
based on the SEM of the fiber structure to calculate the dispersion profiles for the fundamental
mode and for the two orthogonally oriented two-lobed modes, and performed numerical
simulations of supercontinuum spectra produced by these dispersion profiles. The simulation
and experimental results are in reasonable qualitative agreement, which provides support for our
141

suggestion that the enhanced UV generation is due in large part to the differences in the
dispersion profiles of the distinct spatial modes.
We have also demonstrated visible supercontinuum with distinct colours produced in several
subsidiary cores of our multi-core fiber. We interpret the different colours produced by each
subsidiary core to result from variations in the dispersion profiles of the cores (and from the
reduced launch efficiency).
We believe that the extension of HF based supercontinuum generation into the UV will prove
to be of immediate practical application in spectroscopy. Following the results presented here,
we could envisage the design of a fiber with optimised dispersion characteristics for enhanced
UV generation. Power scaling to generate substantial UV intensity should be possible by using
a higher repetition rate system compared to the 250 kHz source used in these experiments; and
any such work would ideally consider new pump wavelengths in order to exploit more practical
sources for supercontinuum generation based on diode-pumped Yb-doped fiber amplifiers [28].
Following our demonstration of supercontinuum in several subsidiary cores, it is now possible
to consider the fabrication a fiber specifically designed with a selection of multiple cores with
different dimensions to enable several tailored supercontinuum spectra to be generated from a
single HF.
142
References 1. J. H. Price, T. M. Monro, K. Furusawa, W. Belardi, J. C. Baggett, S. J. Coyle, C. Netti,
J. J. Baumberg, R. Paschotta and D. J. Richardson, "UV generation in a pure silica holey fiber," Applied Physics B-Lasers and Optics 77, 291-298 (2003).
2. T. M. Monro, D. J. Richardson, N. G. R. Broderick and P. J. Bennett, "Holey optical fibers: An efficient modal model," Journal of Lightwave Technology 17, 1093-1102 (1999).
3. J. C. Knight, J. Arriaga, T. A. Birks, A. Ortigosa-Blanch, W. J. Wadsworth and P. St.J.Russell, "Anomalous dispersion in photonic crystal fiber," IEEE Photonics Technology Letters 12, 807-809 (2000).
4. R. Holzwarth, T. Udem, T. W. Hansch, J. C. Knight, W. J. Wadsworth and P. St.J.Russell, "Optical frequency synthesizer for precision spectroscopy," Physical Review Letters 85, 2264-2267 (2000).
5. D. J. Jones, S. A. Diddams, J. K. Ranka, A. Stentz, R. S. Windeler, J. L. Hall and S. T. Cundiff, "Carrier-envelope phase control of femtosecond mode-locked lasers and direct optical frequency synthesis," Science 288, 635-639 (2000).
6. J. H. Lee, Z. Yusoff, W. Belardi, M. Ibsen, T. M. Monro and D. J. Richardson, "Investigation of Brillouin effects in small-core holey optical fiber: lasing and scattering," Optics Letters 27, 927-929 (2002).
7. Z. Yusoff, J. H. Lee, W. Belardi, T. M. Monro, P. C. Teh and D. J. Richardson, "Raman effects in a highly nonlinear holey fiber: amplification and modulation," Optics Letters 27, 424-426 (2002).
8. H. Takara, T. Ohara, K. Mori, K. Sato, E. Yamada, Y. Inoue, T. Shibata, M. Abe, T. Morioka and K. I. Sato, "More than 1000 channel optical frequency chain generation from single supercontinuum source with 12.5 GHz channel spacing," Electronics Letters 36, 2089-2090 (2000).
9. J. K. Ranka, R. S. Windeler and A. J. Stentz, "Visible continuum generation in air-silica microstructure optical fibers with anomalous dispersion at 800 nm," Optics Letters 25, 25-27 (2000).
10. A. V. Husakou and J. Herrmann, "Supercontinuum generation of higher-order solitons by fission in photonic crystal fibers," Physical Review Letters 87, 203901 (2001).
11. J. Herrmann, U. Griebner, N. Zhavoronkov, A. Husakou, D. Nickel, J. C. Knight, W. J. Wadsworth, P. St.J.Russell and G. Korn, "Experimental evidence for supercontinuum generation by fission of higher-order solitons in photonic fibers," Physical Review Letters 88, 173901 (2002).
12. P. Petropoulos, T. M. Monro, W. Belardi, K. Furusawa, J. H. Lee and D. J. Richardson, "2R-regenerative all-optical switch based on a highly nonlinear holey fiber," Optics Letters 26, 1233-1235 (2001).
13. T. A. Birks, W. J. Wadsworth and P. St.J.Russell, "Supercontinuum generation in tapered fibers," Optics Letters 25, 1415-1417 (2000).
14. A. Efimov, F. G. Omenetto, A. J. Taylor, J. C. Knight, W. J. Wadsworth and P. St.J.Russell, "Generation of UV Light from Microstructured Fibers Pumped with Femtosecond 800nm Oscillator," Conference on Lasers and Electro Optics, Optical Society of America, Washington D.C., (May 19-24, 2002).
15. J. H. Price, K. Furusawa, T. M. Monro, C. Netti, A. Malinowski, J. J. Baumberg and D. J. Richardson, "Phase matched UV Generation in a silica holey fiber," Conference on Lasers and Electro Optics (CLEO), Vol. 73 of OSA Trends in Optics and Photonics Series (Optical Society of America, Washington, D.C., 2002) paper CTuB5 (2002).
16. J. S. Sanghera and I. D. Aggarwal, Infrared Fiber Optics, CRC Press (1998), (Fig. 2.18)
143
144
17. M. J. Steel, T. P. White, C. M. de Sterke, R. C. McPhedran and L. C. Botten, "Symmetry and degeneracy in microstructured optical fibers," Optics Letters 26, 488-490 (2001).
18. T. M. Monro, N. G. Broderick and D. J. Richardson, "Exploring the Optical Properties of Holey Fibers," in Nanoscale Linear and Nonlinear Optics: International School on Quantum Electronics, Erice, Sicily, July 2000, M. Bertolotti, C. M. Bowden and C. Silbilia, Eds. Melville, NY, 2000, pp. 123-128.
19. V. Finazzi, T. M. Monro and D. J. Richardson, "Confinement loss in highly nonlinear holey optical fibers," Optical Fiber Communications Conference, (March 17-22, 2002).
20. J. M. Dudley, L. Provino, N. Grossard, H. Maillotte, R. S. Windeler, B. J. Eggleton and S. Coen, "Supercontinuum generation in air-silica microstructured fibers with nanosecond and femtosecond pulse pumping," Journal of the Optical Society of America B-Optical Physics 19, 765-771 (2002).
21. F. G. Omenetto, A. J. Taylor, M. D. Moores, J. Arriaga, J. C. Knight, W. J. Wadsworth and P. St.J.Russell, "Simultaneous generation of spectrally distinct third harmonics in a photonic crystal fiber," Optics Letters 26, 1158-1160 (2001).
22. A. Efimov, A. J. Taylor, F. G. Omenetto, J. C. Knight, W. J. Wadsworth and P. St.J.Russell, "Nonlinear generation of very high-order UV modes in microstructured fibers," Optics Express 11, 910-918 (2003).
23. J. M. Dudley and S. Coen, "Coherence properties of supercontinuum spectra generated in photonic crystal and tapered optical fibers," Optics Letters 27, 1180-1182 (2002).
24. G. Genty, M. Lehtonen, H. Ludvigsen, J. Broeng and M. Kaivola, "Spectral broadening of femtosecond pulses into continuum radiation in microstructured fibers," Optics Express 10, 1083-1098 (2002).
25. B. J. Mangan, J. C. Knight, T. A. Birks, P. St.J.Russell and A. H. Greenaway, "Experimental study of dual-core photonic crystal fibre," Electronics Letters 36, 1358-1359 (2000).
26. J. C. Baggett, T. M. Monro, W. Belardi, K. Furusawa and D. J. Richardson, "Assorted core air-clad fibre," Electronics Letters 36, 2065-6 (2000).
27. A. L. Gaeta, "Supercontinuum generation in microstructured fibers," Conference on Lasers and Electro Optics, (May 6-11, 2001).
28. J. H. V. Price, W. Belardi, T. M. Monro, A. Malinowski, A. Piper and D. J. Richardson, "Soliton transmission and supercontinuum generation in holey fiber, using a diode pumped Ytterbium fiber source," Optics Express 10, 382-387 (2002).
Chapter 11 Solitons in a holey fiber amplifier
11.1 Introduction
This chapter describes our demonstration of soliton pulse formation, amplification and soliton-
self-frequency-shifting in an anomalously dispersive, Yb-doped HF amplifier seeded with
pulses from our mode-locked Yb-doped, fiber oscillator described in Chapter 4. The system
provides a highly practical, all diode-pumped, continuously tuneable, femtosecond pulse source
operational in the important and difficult to access wavelength range from 1.06 - 1.33 µm [1, 2].
In other experiments multi-pulse, multi-coloured, soliton formation was observed with
wavelength shifted pulsed output to beyond 1.58 µm. Supercontinuum generation and nonlinear
pulse compression to durations of 65 fs were also obtained using other configurations.
Wavelength tuneable femtosecond optical pulse sources have a wide variety of applications,
including ultrafast spectroscopy, and optical chemistry. Traditionally, femtosecond pulse
sources have been based on bulk crystal materials, and extending this technology to obtain
broad tuning ranges has required the use of bulk parametric nonlinear devices such as OPOs.
The discovery of the soliton-self-frequency shift (SSFS) in optical fibers was first reported in
1985-1986 [3-5], and opened up the exciting possibility of obtaining widely wavelength
tuneable femtosecond soliton pulses from fiber-based sources (ideally incorporating a fiber
based pump laser) [6].
To obtain the SSFS effect, the frequency shifting fiber must exhibit anomalous dispersion at
both the initial seed wavelength and across the required tuning range. The recent demonstration
that small core HFs [7] (or less practically, it is possible to use tapered standard fibers with
similarly small core dimensions [8]),can have anomalous dispersion at wavelengths shorter than
1.3 µm, where conventional silica fibers have normal disperison, has therefore extended the
possible SSFS wavelength tuning range. The work presented in this chapter demonstrates
wavelength tuning from 1.06-1.33 µm based on the SSFS technique.
This chapter is structured as follows. Section 11.2 describes the physical operating principles
of the system, gives details of how the system was implemented, and the properties of the HF.
In Section 11.3 we describe and discuss the results of our experiment, and in Section 11.4 we
draw our conclusions.
145
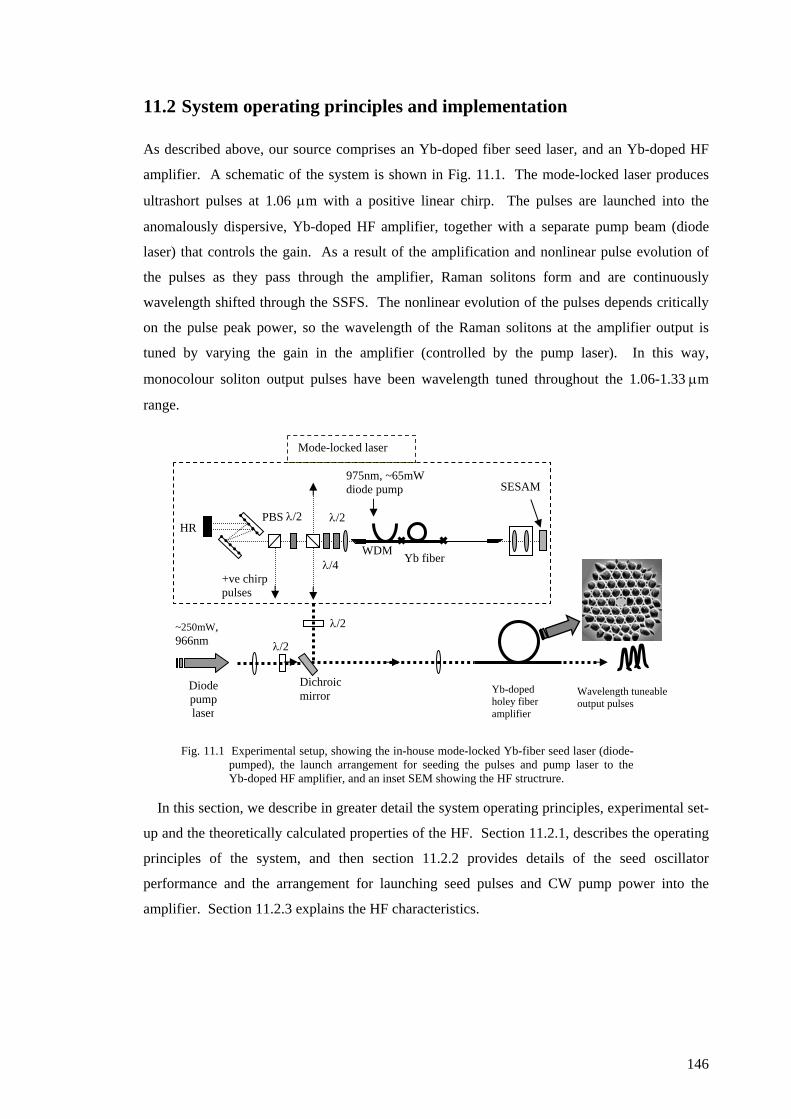
11.2 System operating principles and implementation
As described above, our source comprises an Yb-doped fiber seed laser, and an Yb-doped HF
amplifier. A schematic of the system is shown in Fig. 11.1. The mode-locked laser produces
ultrashort pulses at 1.06 µm with a positive linear chirp. The pulses are launched into the
anomalously dispersive, Yb-doped HF amplifier, together with a separate pump beam (diode
laser) that controls the gain. As a result of the amplification and nonlinear pulse evolution of
the pulses as they pass through the amplifier, Raman solitons form and are continuously
wavelength shifted through the SSFS. The nonlinear evolution of the pulses depends critically
on the pulse peak power, so the wavelength of the Raman solitons at the amplifier output is
tuned by varying the gain in the amplifier (controlled by the pump laser). In this way,
monocolour soliton output pulses have been wavelength tuned throughout the 1.06-1.33 µm
range.
Fig. 11.1 Experimental setup, showing the in-house mode-locked Yb-fiber seed laser (diode-pumped), the launch arrangement for seeding the pulses and pump laser to the Yb-doped HF amplifier, and an inset SEM showing the HF structrure.
+ve chirp pulses
Yb fiber
975nm, ~65mW diode pump
HR
λ/4
λ/2
WDM
PBS λ/2
SESAM
Mode-locked laser
~250mW, 966nm
λ/2
Diode pump laser
Dichroic mirror
λ/2
Wavelength tuneable output pulses
Yb-doped holey fiber amplifier
In this section, we describe in greater detail the system operating principles, experimental set-
up and the theoretically calculated properties of the HF. Section 11.2.1, describes the operating
principles of the system, and then section 11.2.2 provides details of the seed oscillator
performance and the arrangement for launching seed pulses and CW pump power into the
amplifier. Section 11.2.3 explains the HF characteristics.
146
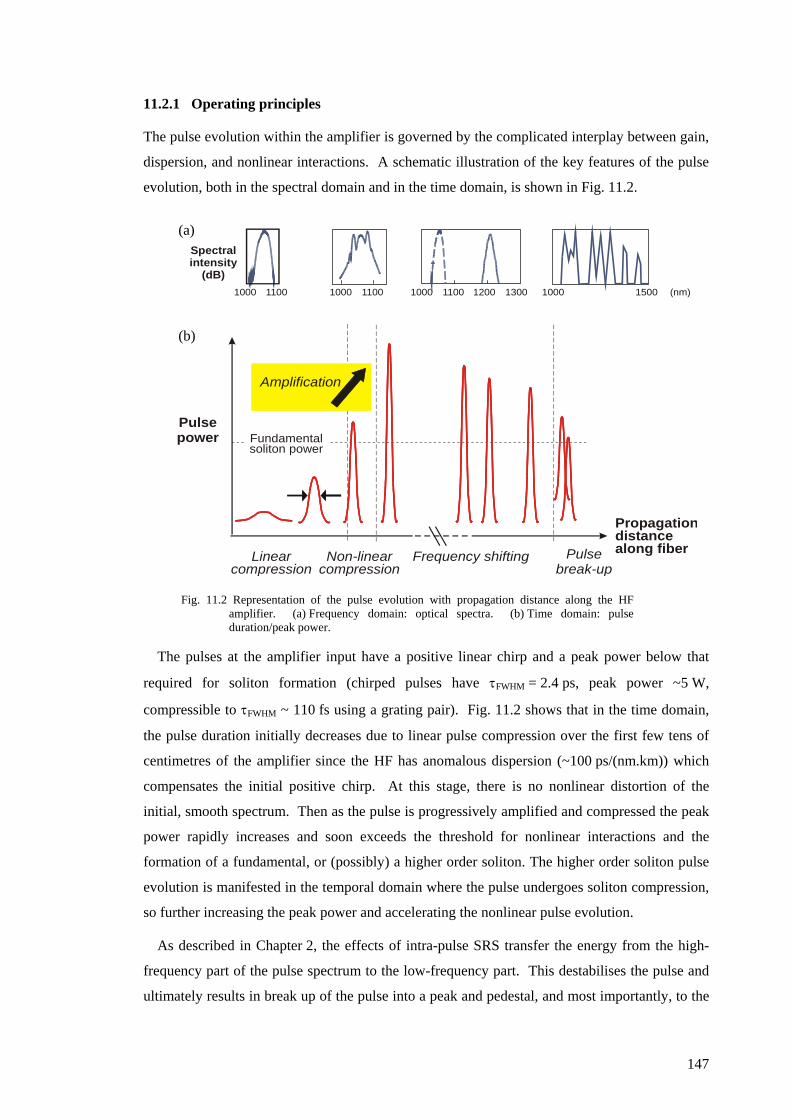
11.2.1 Operating principles
The pulse evolution within the amplifier is governed by the complicated interplay between gain,
dispersion, and nonlinear interactions. A schematic illustration of the key features of the pulse
evolution, both in the spectral domain and in the time domain, is shown in . Fig. 11.2
Fig. 11.2 Representation of the pulse evolution with propagation distance along the HF amplifier. (a) Frequency domain: optical spectra. (b) Time domain: pulse duration/peak power.
1000 1000 1000 1200 10001100 1100 1100 1300 1500 (nm)
Propagationdistance along fiber
Pulsepower Fundamental
soliton power
Linear compression
Non-linear compression
Amplification
Pulsebreak-up
Spectralintensity
(dB)
Frequency shifting
(b)
(a)
The pulses at the amplifier input have a positive linear chirp and a peak power below that
required for soliton formation (chirped pulses have τFWHM = 2.4 ps, peak power ~5 W,
compressible to τFWHM ~ 110 fs using a grating pair). Fig. 11.2 shows that in the time domain,
the pulse duration initially decreases due to linear pulse compression over the first few tens of
centimetres of the amplifier since the HF has anomalous dispersion (~100 ps/(nm.km)) which
compensates the initial positive chirp. At this stage, there is no nonlinear distortion of the
initial, smooth spectrum. Then as the pulse is progressively amplified and compressed the peak
power rapidly increases and soon exceeds the threshold for nonlinear interactions and the
formation of a fundamental, or (possibly) a higher order soliton. The higher order soliton pulse
evolution is manifested in the temporal domain where the pulse undergoes soliton compression,
so further increasing the peak power and accelerating the nonlinear pulse evolution.
As described in Chapter 2, the effects of intra-pulse SRS transfer the energy from the high-
frequency part of the pulse spectrum to the low-frequency part. This destabilises the pulse and
ultimately results in break up of the pulse into a peak and pedestal, and most importantly, to the
147
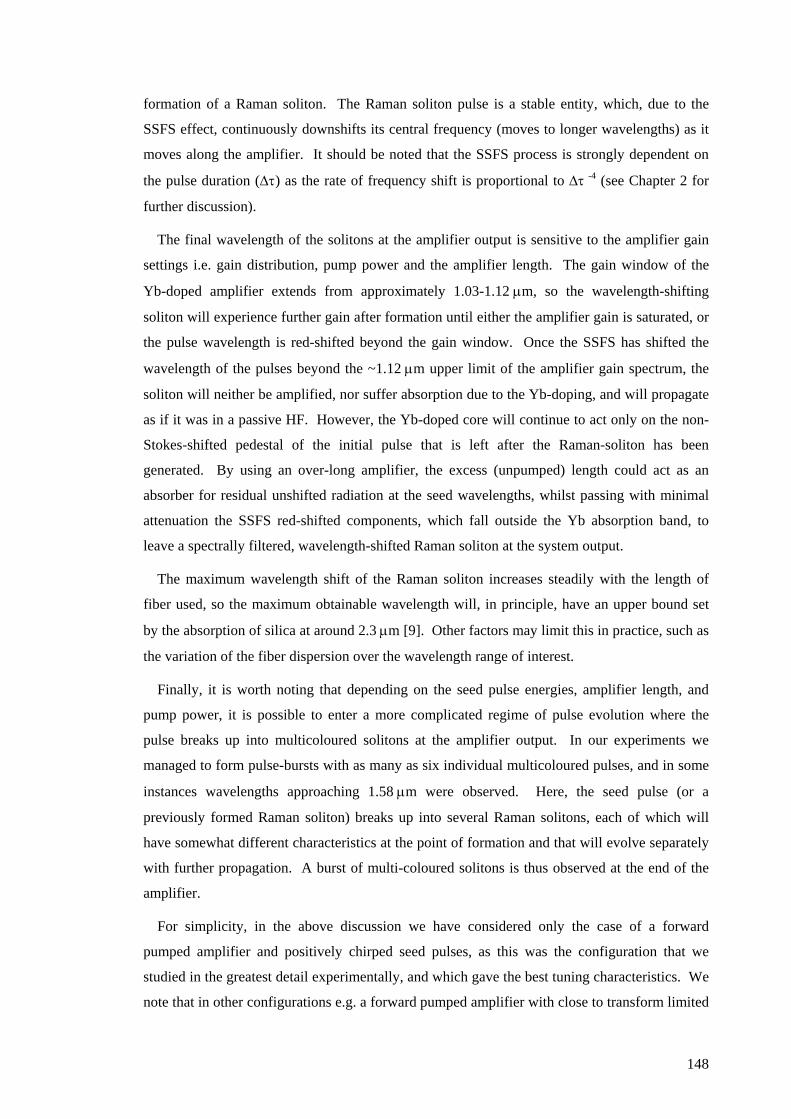
formation of a Raman soliton. The Raman soliton pulse is a stable entity, which, due to the
SSFS effect, continuously downshifts its central frequency (moves to longer wavelengths) as it
moves along the amplifier. It should be noted that the SSFS process is strongly dependent on
the pulse duration (∆τ) as the rate of frequency shift is proportional to ∆τ -4 (see Chapter 2 for
further discussion).
The final wavelength of the solitons at the amplifier output is sensitive to the amplifier gain
settings i.e. gain distribution, pump power and the amplifier length. The gain window of the
Yb-doped amplifier extends from approximately 1.03-1.12 µm, so the wavelength-shifting
soliton will experience further gain after formation until either the amplifier gain is saturated, or
the pulse wavelength is red-shifted beyond the gain window. Once the SSFS has shifted the
wavelength of the pulses beyond the ~1.12 µm upper limit of the amplifier gain spectrum, the
soliton will neither be amplified, nor suffer absorption due to the Yb-doping, and will propagate
as if it was in a passive HF. However, the Yb-doped core will continue to act only on the non-
Stokes-shifted pedestal of the initial pulse that is left after the Raman-soliton has been
generated. By using an over-long amplifier, the excess (unpumped) length could act as an
absorber for residual unshifted radiation at the seed wavelengths, whilst passing with minimal
attenuation the SSFS red-shifted components, which fall outside the Yb absorption band, to
leave a spectrally filtered, wavelength-shifted Raman soliton at the system output.
The maximum wavelength shift of the Raman soliton increases steadily with the length of
fiber used, so the maximum obtainable wavelength will, in principle, have an upper bound set
by the absorption of silica at around 2.3 µm [9]. Other factors may limit this in practice, such as
the variation of the fiber dispersion over the wavelength range of interest.
Finally, it is worth noting that depending on the seed pulse energies, amplifier length, and
pump power, it is possible to enter a more complicated regime of pulse evolution where the
pulse breaks up into multicoloured solitons at the amplifier output. In our experiments we
managed to form pulse-bursts with as many as six individual multicoloured pulses, and in some
instances wavelengths approaching 1.58 µm were observed. Here, the seed pulse (or a
previously formed Raman soliton) breaks up into several Raman solitons, each of which will
have somewhat different characteristics at the point of formation and that will evolve separately
with further propagation. A burst of multi-coloured solitons is thus observed at the end of the
amplifier.
For simplicity, in the above discussion we have considered only the case of a forward
pumped amplifier and positively chirped seed pulses, as this was the configuration that we
studied in the greatest detail experimentally, and which gave the best tuning characteristics. We
note that in other configurations e.g. a forward pumped amplifier with close to transform limited
148

seed pulses, the general features of the pulse formation processes would not change
dramatically.
While the description given above is purely qualitative, it should be noted that detailed
models have been applied numerically to describe Raman soliton formation in fiber amplifiers.
For example, an approach based on a modified NLSE, which incorporated terms to describe a
gain medium with a Lorentzian line shape and allowing for the effects of gain saturation along
the amplifier length has been reported previously [10]. This model treats the stimulated Raman
scattering using an optically driven molecular vibration model. The model was used to simulate
the amplification of ~500fs pulses in an Er-doped fiber amplifier and good quantitative
agreement between the experimental and theoretical data was obtained. Others have performed
simulations of the propagation of pulses having a width approximately equal to the inverse
bandwidth of the amplifier, and suggest that the Maxwell-Bloch equations are necessary if an
accurate quantitative analysis of the system is required [11]. These theoretical approaches, with
the inclusion of appropriate gain spectrum as a function of amplifier length, could readily be
adapted to model our experiments in HF, although we have not done this at the time of writing,
and we expect to return to this in the future
11.2.2 System implementation
Our experimental set up is shown in . The two principal components are a mode-
locked seed laser emitting ultrashort pulses at 1.06 µm, and an anomalously dispersive Yb-
doped HF amplifier. The characteristics of our diode-pumped Yb-doped fiber oscillator are
presented in Chapter 4.
Fig. 11.1
The positively chirped pulses from our oscillator were launched into a length of Yb-doped HF
amplifier, which for the majority of experiments undertaken was co-directionally pumped using
a 966 nm diode based MOPA (maximum output power of ~250 mW). We achieved
approximately 20% coupling efficiency into the HF for both the seed pulses and the pump
radiation, giving a maximum launched pulse energy of ~10 pJ, and up to 50 mW of launched
pump. We used a half wave plate to match the laser output polarisation to a principal axis of the
highly birefringent Yb-doped HF. We note that our results were insensitive to the orientation of
the 966 nm diode pump polarisation relative to the fiber polarisation axes. The pulses emerging
from the output end of the amplifier were characterised in the frequency domain using an
optical spectrum analyser, and in the time domain using a non-collinear, second harmonic
intensity autocorrelator with ~10 fs resolution. For our experiments the HF amplifier had a
length between 1.7 m and 9 m.
149
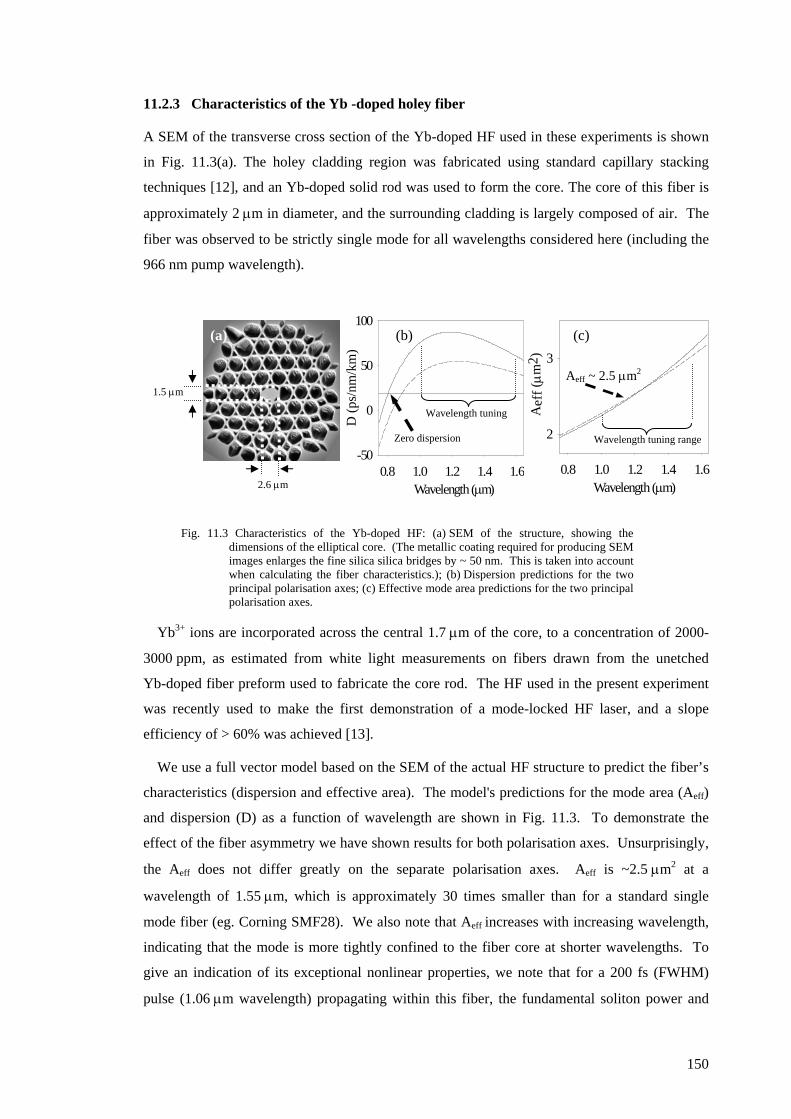
11.2.3 Characteristics of the Yb -doped holey fiber
A SEM of the transverse cross section of the Yb-doped HF used in these experiments is shown
in Fig. 11.3(a). The holey cladding region was fabricated using standard capillary stacking
techniques [12], and an Yb-doped solid rod was used to form the core. The core of this fiber is
approximately 2 µm in diameter, and the surrounding cladding is largely composed of air. The
fiber was observed to be strictly single mode for all wavelengths considered here (including the
966 nm pump wavelength).
Wavelength (µm)0.8 1.0 1.2 1.4 1.6
D (p
s/nm
/km
)
-50
0
50
100
Zero dispersion
Wavelength tuning
1.5 µm
2.6 µm Wavelength (µm) 0.8 1.0 1.2 1.4 1.6
Aef
f (µm
2 )
2
3
(a) (b) (c)
Wavelength tuning range
Aeff ~ 2.5 µm2
Fig. 11.3 Characteristics of the Yb-doped HF: (a) SEM of the structure, showing the dimensions of the elliptical core. (The metallic coating required for producing SEM images enlarges the fine silica silica bridges by ~ 50 nm. This is taken into account when calculating the fiber characteristics.); (b) Dispersion predictions for the two principal polarisation axes; (c) Effective mode area predictions for the two principal polarisation axes.
Fig. 11.3
Yb3+ ions are incorporated across the central 1.7 µm of the core, to a concentration of 2000-
3000 ppm, as estimated from white light measurements on fibers drawn from the unetched
Yb-doped fiber preform used to fabricate the core rod. The HF used in the present experiment
was recently used to make the first demonstration of a mode-locked HF laser, and a slope
efficiency of > 60% was achieved [13].
We use a full vector model based on the SEM of the actual HF structure to predict the fiber’s
characteristics (dispersion and effective area). The model's predictions for the mode area (Aeff)
and dispersion (D) as a function of wavelength are shown in . To demonstrate the
effect of the fiber asymmetry we have shown results for both polarisation axes. Unsurprisingly,
the Aeff does not differ greatly on the separate polarisation axes. Aeff is ~2.5 µm2 at a
wavelength of 1.55 µm, which is approximately 30 times smaller than for a standard single
mode fiber (eg. Corning SMF28). We also note that Aeff increases with increasing wavelength,
indicating that the mode is more tightly confined to the fiber core at shorter wavelengths. To
give an indication of its exceptional nonlinear properties, we note that for a 200 fs (FWHM)
pulse (1.06 µm wavelength) propagating within this fiber, the fundamental soliton power and
150

soliton period are approximately 50W and 60cm, respectively. As mentioned previously, these
values are significantly lower than the comparable values for experiments performed by other
authors in standard fiber (λ~1.5 µm). The dispersion properties of the two axes are markedly
different, which indicates that the dispersion is much more sensitive to the hole arrangement
compared to Aeff. The zero dispersion wavelengths for the separate polarisation axes are at
770 nm and 830 nm respectively, and at a wavelength of 1.06 µm the dispersion on the two axes
differs by ~35 ps/(nm.km). The relatively flat dispersion curves, particularly in the 1.0-1.3 µm
wavelength range combined with the high effective nonlinearity of the fiber, facilitate good
wavelength tuning through the SSFS effect.
As a consequence of the combination of core asymmetry, high refractive index contrast and
the small scale of the structure, this fiber is extremely birefringent (strongly polarisation
maintaining). In Fig. 11.4 we plot the transmission characteristics of polarised broadband light
at 1540 nm through crossed polarisers and 1.2 m of the fiber. From a measurement of the
spectral period of the transmission we estimate a birefringent beat length of just 0.3 mm at
1.54 µm. This agrees well with our prediction of 0.27 mm from the model described in
Chapter 9. As far as we are aware this is one of the shortest beat-lengths ever obtained for an
optical fiber.
Fig. 11.4 Transmission spectrum (after a polarisation beam splitter) showing the high birefringence of this elliptical core HF (1.2m length).
11.3 Results and discussion
The output characteristics of our system were of three distinct types. Perhaps the most useful
from a practical perspective is the single colour, wavelength tuneable soliton regime. Here, we
obtained high quality pulses at a distinct wavelength tuneable from 1.06 – 1.33 µm, with the
wavelength controlled by varying the pump power of the amplifier. We could also obtain more
complex spectral output, which we characterised as multi-colour solitons and also broadband
151

continuous spectra. These spectra were observed when we used seed pulses with ~25% higher
energy (the oscillator has a variable output coupling) compared to the single colour soliton
regime, and (generally) at the highest pump powers. Finally, by using as shorter length
amplifier and reducing the chirp of the seed pulses, we could avoid the pulse break-up and
wavelength shifting effects and observe temporal compression of the seed pulses. We describe
each regime of operation in greater detail below.
11.3.1 Single colour, wavelength tuneable solitons
We found that forward pumping an approximately 4 m length of HF amplifier was the optimal
configuration for producing single colour, wavelength tuneable solitons. In particular, we used
a 4.7 m length of amplifier fiber, and measured the output spectra and autocorrelations of the
pulses emerging from the amplifier as a function of pump power. In Fig. 11.5 (a) we show the
superposed spectra of the pulse emerging from the amplifier as the incident pump power
delivered to the amplifier is increased. As can be seen in Fig. 11.5(a) a single, spectrally distinct
Raman soliton of ~20 nm bandwidth is generated at the system output for pump powers above
the minimum threshold power required to obtain appreciable SSFS effects (>50 mW incident
pump power). As the pump power is increased, the final wavelength of the pulses progressively
increases. Residual radiation at the original seed wavelength of ~1056 nm remains in each
instance. The dependence of the final pulse wavelength on the amplifier pump power is shown
in Fig. 11.5 (b). The final central wavelength of the pulses is seen to vary in an almost linear
fashion with the level of incident pump power.
Fig. 11.5 Tuneable single colour solitons: (a) Superimposed spectra of the solitons shifted to progressively longer wavelengths (1.06–1.33 µm); (b) Plot of the soliton wavelength vs. amplifier (incident) pump power.
Wavelength (µm)1.0 1.1 1.2 1.3
Inte
nsity
(dB
)
-40
-30
-20
-10
0
Incident pump power (mW)60 80 100 120 140 160 180 200
Solit
on W
avel
engt
h ( µ
m)
1.1
1.2
1.3(a) (b)
We attribute the increase in soliton wavelength with pump power to the fact that at higher
pump powers the resultant change in gain distribution causes the Raman solitons to form earlier
within the amplifier, thereby leaving them a greater length of fiber within which to walk-off to
longer wavelengths through SSFS.
152
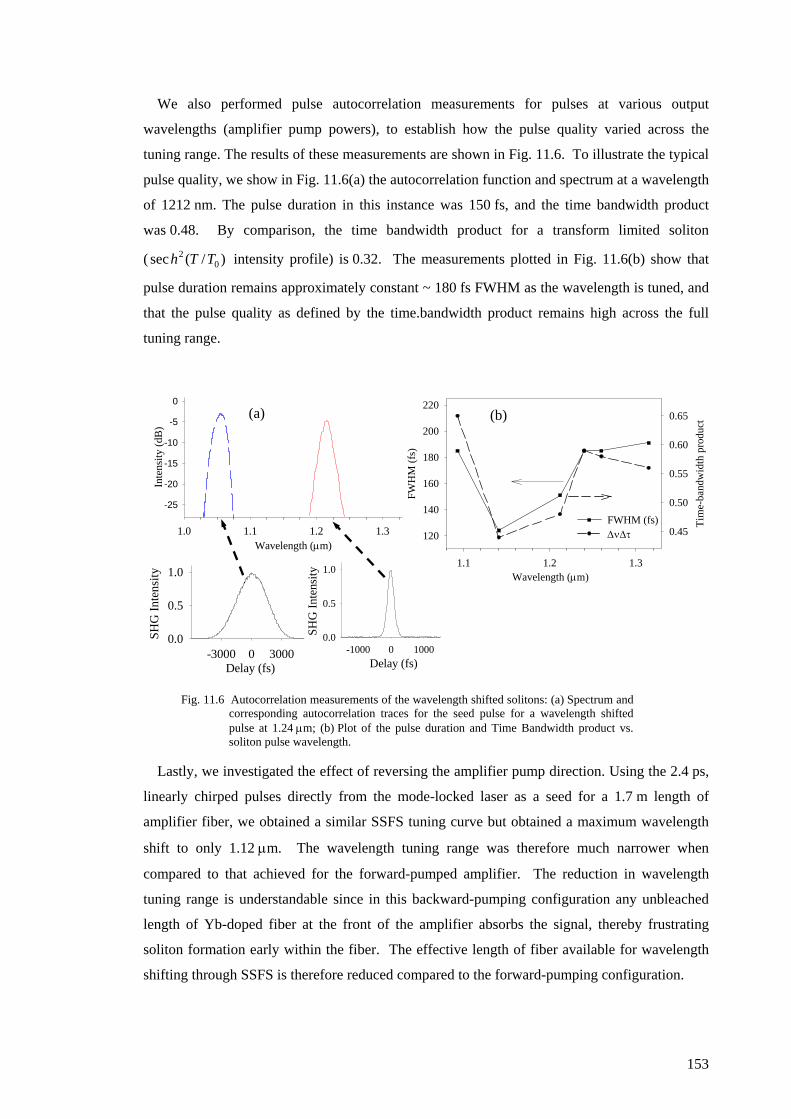
We also performed pulse autocorrelation measurements for pulses at various output
wavelengths (amplifier pump powers), to establish how the pulse quality varied across the
tuning range. The results of these measurements are shown in Fig. 11.6. To illustrate the typical
pulse quality, we show in (a) the autocorrelation function and spectrum at a wavelength
of 1212 nm. The pulse duration in this instance was 150 fs, and the time bandwidth product
was 0.48. By comparison, the time bandwidth product for a transform limited soliton
( sec intensity profile) is 0.32. The measurements plotted in (b) show that
pulse duration remains approximately constant ~ 180 fs FWHM as the wavelength is tuned, and
that the pulse quality as defined by the time.bandwidth product remains high across the full
tuning range.
)/( 02 TTh
Fig. 11.6
Fig. 11.6
Fig. 11.6 Autocorrelation measurements of the wavelength shifted solitons: (a) Spectrum and corresponding autocorrelation traces for the seed pulse for a wavelength shifted pulse at 1.24 µm; (b) Plot of the pulse duration and Time Bandwidth product vs. soliton pulse wavelength.
Delay (fs)-3000 0 3000
SHG
Inte
nsity
0.0
0.5
1.0
Delay (fs)-1000 0 1000
SHG
Inte
nsity
0.0
0.5
1.0
Wavelength (µm)1.0 1.1 1.2 1.3
Inte
nsity
(dB
)
-25
-20
-15
-10
-5
0
Wavelength (µm)1.1 1.2 1.3
FWH
M (f
s)
120
140
160
180
200
220
Tim
e-ba
ndw
idth
pro
duct
0.45
0.50
0.55
0.60
0.65
FWHM (fs)∆ν∆τ
(b) (a)
Lastly, we investigated the effect of reversing the amplifier pump direction. Using the 2.4 ps,
linearly chirped pulses directly from the mode-locked laser as a seed for a 1.7 m length of
amplifier fiber, we obtained a similar SSFS tuning curve but obtained a maximum wavelength
shift to only 1.12 µm. The wavelength tuning range was therefore much narrower when
compared to that achieved for the forward-pumped amplifier. The reduction in wavelength
tuning range is understandable since in this backward-pumping configuration any unbleached
length of Yb-doped fiber at the front of the amplifier absorbs the signal, thereby frustrating
soliton formation early within the fiber. The effective length of fiber available for wavelength
shifting through SSFS is therefore reduced compared to the forward-pumping configuration.
153
Note that due to the practical difficulties of working with such small core fibers, compounded
by the issue of pulse break up and wavelength shift within the amplifier, it was not possible for
us to quantify the precise gain experienced by a given pulse for a given pump power and
amplifier configuration. All that we are really able to say is that the maximum overall single
pass gain through the system was greater than approximately 17 dB. This estimate considers the
amplifier setup used in the experiments i.e. a flat cleaved facet at the input (to maximise the
launched signal), which would provide 4% feedback; and an angle cleaved (reducing feedback
to <1%) at the exit end of the amplifier. In every amplifier configuration we were able to
increase the pump power sufficiently in order to obtain laser operation (at some wavelength
within the Yb bandwidth) from the system, so for the end-reflections as stated above, this
indicates at least 17 dB gain.
11.3.2 Multi-colour solitons and continuous spectra
It did not prove possible for us to extend the single pulse tuning range beyond 1.33 µm. Instead,
when we maximised the output power of our seed oscillator, to increase the launched pulse
energy to ~12 pJ (compared to ~9 pJ for the single-colour soliton experiments) we observed the
generation of multicolor pulses (separated in wavelength and time) which increased in number
as we increased the pump power, as shown in . Fig. 11.7
Fig. 11.8
Using a longer (9m) length of amplifier fiber, and operating at the highest pump powers, we
observed more complex spectra, including increased numbers of multi-colour solitons, and a
broadband continuous (time-averaged) optical spectrum - similar to that achieved in
supercontinuum generation experiments in passive HF [7]. Fig. 11.8(a) shows that for the most
complex multi-colour soliton spectra, a far greater maximum wavelength shift up to 1.58 µm
could be seen (measuring the peak with the maximum red-shift). A typical example of a
broadband continuous spectrum, is shown in (b) with wavelengths extending from
1.03 µm to 1.62 µm. This broad spectrum could be useful for applications such as optical
coherence tomography. At present this mode of operation is not fully understood.
154

11.3.3 Temporal compression
We also investigated the conditions required to produce temporal compression of the input
pulses (through multi-soliton effects) as a function of amplifier pump power. By changing both
the chirp of the input pulses, and the length of amplifier fiber we investigated the optimum
conditions for pulse compression. The chirp of the input pulses was optimised by extracting
negatively chirped pulses from the oscillator (previously we had selected the output port for
positively chirped pulses), and transforming these pulses to have a small positive chirp by
propagation through a length of standard fiber. Cutback measurements were performed to
obtain pulses of the desired duration and hence chirp. In a similar fashion we optimised the
amplifier length with respect to the minimum pulse duration at the amplifier output by
measuring the output pulse duration in a series of cutback measurements on the amplifier fiber.
By launching the optimally chirped pulses (~0.02 ps/nm) pulses into a 2.8 m long HF amplifier,
we obtained compressed pulses down to 67 fs FWHM. The autocorrelation and spectrum of the
compressed pulses is shown in (a), (b) respectively. Although we expect the soliton Fig. 11.9
Fig. 11.7 Multicolour solitons showing (a)–(c) increasingly complex spectra as the amplifier pump power is increased.
Fig. 11.8 (a) Typical example of complex multi-coloured soliton spectra, extending out to λ~1.58 µm. (b) Broadband continuous spectrum extending out to λ~1.62 µm.
Wavelength (µm)1.0 1.2 1.4 1.6
Inte
nsity
(dB
)
-40
-30
-20
-10
0
Wavelength (µm)1.0 1.2 1.4 1.6
Inte
nsity
0.0
0.5
1.0(a)
(b)
Wavelength (µm)1.0 1.2 1.4 1.6
Inte
nsity
(dB
)
-20
-10
0Wavelength (µm)
1.0 1.2 1.4 1.6
Inte
nsity
(dB
)
-20
-10
0Wavelength (µm)
1.0 1.2 1.4 1.6
Inte
nsity
(dB
)
-20
-10
0(a)
(b)
(c)
155
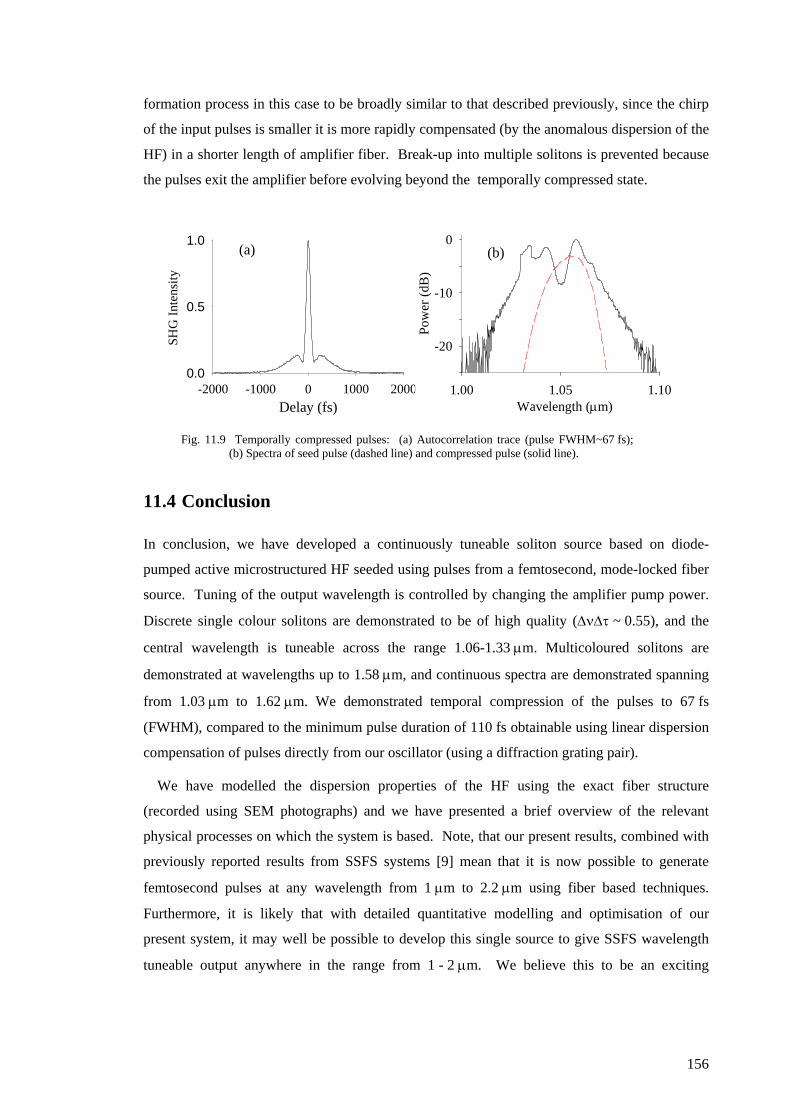
formation process in this case to be broadly similar to that described previously, since the chirp
of the input pulses is smaller it is more rapidly compensated (by the anomalous dispersion of the
HF) in a shorter length of amplifier fiber. Break-up into multiple solitons is prevented because
the pulses exit the amplifier before evolving beyond the temporally compressed state.
Fig. 11.9 Temporally compressed pulses: (a) Autocorrelation trace (pulse FWHM~67 fs); (b) Spectra of seed pulse (dashed line) and compressed pulse (solid line).
Delay (fs)-2000 -1000 0 1000 2000
SHG
Inte
nsity
0.0
0.5
1.0
Wavelength (µm)1.00 1.05 1.10
Pow
er (d
B)
-20
-10
0(b)(a)
11.4 Conclusion
In conclusion, we have developed a continuously tuneable soliton source based on diode-
pumped active microstructured HF seeded using pulses from a femtosecond, mode-locked fiber
source. Tuning of the output wavelength is controlled by changing the amplifier pump power.
Discrete single colour solitons are demonstrated to be of high quality (∆ν∆τ ~ 0.55), and the
central wavelength is tuneable across the range 1.06-1.33 µm. Multicoloured solitons are
demonstrated at wavelengths up to 1.58 µm, and continuous spectra are demonstrated spanning
from 1.03 µm to 1.62 µm. We demonstrated temporal compression of the pulses to 67 fs
(FWHM), compared to the minimum pulse duration of 110 fs obtainable using linear dispersion
compensation of pulses directly from our oscillator (using a diffraction grating pair).
We have modelled the dispersion properties of the HF using the exact fiber structure
(recorded using SEM photographs) and we have presented a brief overview of the relevant
physical processes on which the system is based. Note, that our present results, combined with
previously reported results from SSFS systems [9] mean that it is now possible to generate
femtosecond pulses at any wavelength from 1 µm to 2.2 µm using fiber based techniques.
Furthermore, it is likely that with detailed quantitative modelling and optimisation of our
present system, it may well be possible to develop this single source to give SSFS wavelength
tuneable output anywhere in the range from 1 - 2 µm. We believe this to be an exciting
156

development of fiber technology, providing a device with potential for widespread practical
applications.
157
158
References 1. J. H. V. Price, K. Furusawa, T. M. Monro, L. Lefort and D. J. Richardson, "Tunable,
femtosecond pulse source operating in the range 1.06- 1.33 microns based on an Yb3+-doped holey fiber amplifier," Journal of the Optical Society of America B-Optical Physics 19, 1286-1294 (2002).
2. J. H. Price, K. Furusawa, T. M. Monro, L. Lefort and D. J. Richardson, "A tuneable, femtosecond pulse source operating in the range 1.06-1.33 microns based on an Yb doped holey fiber amplifier," Conference on Lasers and Electro Optics (CLEO), Vol. 56 of OSA Trends in Optics and Photonics Series (Optical Society of America, Washington, D.C., 2001) paper CPD1 (2001).
3. F. M. Mitschke and L. F. Mollenauer, "Discovery of the soliton self-frequency shift," Optics Letters 11, 659-661 (1986).
4. J. P. Gordon, "Theory of the soliton self-frequency shift," Optics Letters 11, 662-664 (1986).
5. E. M. Dianov, A. Y. Karasik, P. V. Mamyshev, A. M. Prokhorov, V. N. Serkin, M. F. Stel'makh and A. A. Fomichev, "Stimulated-Raman conversion of multisoliton pulses in quartz optical fibers," JETP Lett. 41, 294-297 (1985).
6. N. Nishizawa and T. Goto, "Compact system of wavelength-tunable femtosecond soliton pulse generation using optical fibers," IEEE Photonics Technology Letters 11, 325-327 (1999).
7. J. K. Ranka, R. S. Windeler and A. J. Stentz, "Visible continuum generation in air-silica microstructure optical fibers with anomalous dispersion at 800 nm," Optics Letters 25, 25-27 (2000).
8. T. A. Birks, W. J. Wadsworth and P. St.J.Russell, "Supercontinuum generation in tapered fibers," Optics Letters 25, 1415-1417 (2000).
9. M. E. Fermann, A. Galvanauskas, M. L. Stock, K. K. Wong, D. Harter and L. Goldberg, "Ultrawide tunable Er soliton fiber laser amplified in Yb-doped fiber," Optics Letters 24, 1428-1430 (1999).
10. D. J. Richardson, V. V. Afanasjev, A. B. Grudinin and D. N. Payne, "Amplification of Femtosecond Pulses in a Passive, All-Fiber Soliton Source," Optics Letters 17, 1596-1598 (1992).
11. J. T. Manassah and B. Gross, "Propagation of Femtosecond Pulses in a Fiber Amplifier," Optics Communications 10031 122, 71-82 (1995).
12. P. J. Bennett, T. M. Monro and D. J. Richardson, "Toward practical holey fiber technology: fabrication, splicing, modeling, and characterization," Optics Letters 24, 1203-1205 (1999).
13. K. Furusawa, T. M. Monro, P. Petropoulos and D. J. Richardson, "Modelocked laser based on ytterbium doped holey fibre," Electronics Letters 37, 560-561 (2001).
Chapter 12 Conclusions
12.1 Introduction
The work presented in this thesis lies in two distinct research areas. First, the development of
an Yb-fiber based CPA system was described in Chapters 3-7, and the characteristics of a direct
amplification system (based on shared components from the CPA system) were described in
Chapter 8. In the second part of this thesis, investigations of nonlinear effects in small core
holey fibers were described in Chapters 9-11. In this chapter, each topic is briefly summarised
and suggestions for potential future research are considered.
12.2 High power Yb-fiber systems
12.2.1 Yb-fiber oscillator
The oscillator development for our industrially sponsored contract has been completed. The
oscillator is stable (<0.05% amplitude jitter), self starting, and represents a suitable source for a
range of applications [1, 2]. The sponsoring company has already sold a clone of the prototype
oscillator (standard mounts on a breadboard). It is now for the sponsoring company to develop
suitable packaging in order to create a successful product for a broader market. The oscillator
incorporated a telecommunications grade, grating-stabilised pump diode with pigtailed output,
which was spliced directly to at WDM coupler and then to the Yb-doped fiber to create a robust,
all-fiber gain block. The cavity used a simple Fabry-Perot design to enable straightforward
manufacturing, and incorporated a SESAM in order to obtain robust self-start mode-locking.
Whilst we are fully satisfied that the oscillator meets the requirements of our sponsor, there
are several possible improvements we may wish to implement. Andy Piper (co-worker) and I
have recently developed an environmentally stable version of the oscillator that incorporated
Faraday rotators at both ends of the fiber gain section. The Faraday rotators cause the
polarisation of the pulses to be rotated by 90 degrees when traveling in opposite directions along
the fiber, so any linear polarisation changes in the cavity caused by twisting the fiber or thermal
fluctuations should average to zero over a round trip [3]. With the Faraday rotators included in
the cavity, mode-locking is maintained while the fiber is disturbed, and also over a wide
temperature range.
159
In future, timing jitter may be reduced by putting the oscillator in a housing, and perhaps by
using a more rigid end-mirror mount. We would also like to move towards an all fiber cavity by
replacing the bulk grating pair with a length of anomalously dispersive HF, and by replacing the
PBS with a fiber polariser (indeed, first results in this direction have been reported by other
groups [4, 5]). We may also experiment with using a 90:10 fiber coupler for the output.
Moving to an all-fiber-pigtailed cavity should lead to timing jitter limited only by thermal
effects and quantum noise, as has been demonstrated from recent investigations into the
ultimate stability limits of Er-fiber ring lasers by researchers in the metrology community [6].
To increase the range of potential applications for the oscillator, it would also be useful to
investigate the possibility of exploiting the potential Yb-bandwidth (>50 nm) to generate shorter
(e.g. <50 fs) pulses, for example by including a prism-based DDL for reduced 3rd order
dispersion. Further research could consider cavities based on cladding-pumped Yb-fiber to
achieve much higher average powers and pulse energies. In addition, the parabolic pulse
concept could enable ‘similariton’ lasers to produce high power, large bandwidth pulses for
very high performance future Yb-fiber lasers.
12.2.2 CPA System
This thesis described the development of a CPA system that produced ~16 µJ pulses at a
repetition rate of 100 kHz (average power 1.6 W), and with pulses that could be recompressed
to ~500 fs (see Chapter 7). The maximum pulse energy was limited by the onset of SRS.
Numerical predictions were presented, which demonstrated that by using a fiber for the final
amplifier with a larger core diameter (29 µm) and shorter length (1.5 m), the system should be
capable of generating 100 µJ pulses that could be recompressed to <500 fs duration. Such
pulses should prove useful for a wide range of practical applications. The CPA included a
CFBG stretcher incorporating both the 2nd and 3rd order dispersion to compensate the chirp of
the bulk-grating compressor. The CFBG stretcher research included the development of a
procedure for annealing the grating after writing in order to control the cladding-mode losses.
We also designed a future-generation compressor-stretcher combination, that would reduce the
3rd order dispersion to enable a broader bandwidth CFBG to be used. The proposed design
should be suitable for generating <300 fs recompressed pulses.
To further enhance the system capabilities, perhaps it would be useful to perform further
modelling (using the methods described in Chapter 2) in order to optimise the gain and noise
figure of the amplifiers. It is not yet clear whether such work would be most appropriately
performed by researchers at the ORC, or by our industrial sponsor as they fully develop the
CPA system into a commercial product.
160
Since the start of the CPA system development work presented in this thesis, other groups [7]
have demonstrated Yb-fiber CPA systems producing 1.2 mJ pulses (repetition rate 1.7 kHz)
with 380 fs duration, and M2=1.16, using a 50 µm core (length = 2.6 m) fiber for the final
amplifier. The maximum pulse energy was limited by the onset of SRS, so obtaining higher
energy pulses will require use of larger core fiber. It therefore appears that significant further
increases in pulse energy may not be practical if high beam quality is to be maintained. Fibers
are, however, well suited to high average power operation, and perhaps the most interesting
avenue for future research is to maintain the pulse energy at ~100 µJ but to exploit the ever-
increasing power and reducing cost of pump laser diodes to develop a much higher average
power CPA system operating at a higher repetition rate e.g. 100 µJ at 1 MHz implies 100 W
average power. Yb-fiber technology is advantageous in this area because Yb has a low quantum
defect, and fiber has a favourable geometry for heat dissipation. These advantages have been
fully exploited for CW operation where industrial research has led to a commercial Yb-fiber
laser with an average power of 6 kW [8].
The extreme fields possible by focussing diffraction limited 100 µJ, <200 fs pulses, would
have power density ~1016 W/cm2, which could enable future application in new areas including
femtosecond high harmonic generation extending into the UV and x-ray spectral regions. Fiber
pumped, ultrashort pulse, x-ray sources could be envisaged for the rapidly developing science of
single molecule biological imaging.
12.2.3 Direct amplification system
The direct amplification system described in Chapter 8 of this thesis produced pulses with
energy of 330 nJ at an average power 0.9 W. The pulses were recompressed to a duration of
~300 fs. The system was robust and stable, and these attributes were demonstrated by using the
system to pump a femtosecond OPO [9]. The still unique, to our knowledge, aspect of the
direct amplification system as presented in this thesis, is that the system used a cascade of
amplifiers. Much higher total gain should therefore be possible compared to the single stage
amplifier systems demonstrated by other authors [10, 11]. By using initially chirped pulses
from the oscillator combined with low gain in the smaller core pre-amplifiers, the system was
operated so as to avoid excessive SPM distortion to the pulses (i.e. mostly linear evolution
under influence of GVD). The limiting effects of SRS were not observed.
Theoretical work reported by other groups suggests that through an appropriate combination
of gain, SPM and GVD and after sufficient propagation distance, the nonlinear effects can
generate pulses with a parabolic temporal and spectral profile and which have linear chirp.
Therefore these parabolic pulses can be recompressed to sub-picosecond durations despite the
significant influence of nonlinear effects [11]. Parabolic pulses have been demonstrated
161
experimentally at high average powers (17 W at 75 MHz repetition rate) in single stage
amplifier systems [10].
As suggested above in relation to the possible further CPA development, the increasing
availability of affordable, and very high power pump laser diodes suggests that it would be
interesting to investigate multi-stage direct amplification systems producing >100 W average
power, and with pulse energies ultimately limited by the onset of SRS. (The maximum pulse
energy limit set by the onset of SRS increases in proportion to the pulse duration, and therefore
we would expect that the maximum energy of pulses from a direct amplification system would
be approximately two orders of magnitude smaller compared to those from a high average
power CPA system.) Dr. Andrew Malinowski (co-worker) has recently performed initial
experiments at such high average power levels using our Yb-fiber oscillator and a cascade of
two Yb-fiber amplifiers. Pulse energies of ~500 nJ pulses were demonstrated at an average
power of 25 W (repetition rate 50 MHz), with recompressed pulse duration ~250 fs.
A robust high-repetition rate fiber-based source of high peak power pulses could be envisaged
for high speed microstructuring of materials, and would enable dramatic improvements in
processing times for industrial processing applications. Frequency doubling/quadrupling of the
pulses into the visible/UV would be interesting for ultrafast chemical and biological studies, and
for ultra-fast imaging.
12.3 Nonlinear effects in holey fiber
12.3.1 Holey fiber based supercontinuum generation
The work presented in Chapter 10 of this thesis demonstrated supercontinuum generation
extending to wavelengths below 300 nm in the UV from a small core HF. Enhanced UV
generation was obtained by launching the seed pulses into a higher order transverse mode.
Numerical simulations suggested that differences in the dispersion profiles between the
fundamental and higher order mode could explain the enhanced UV generation. We note that in
recent work, Efimov et al. [12] have demonstrated UV generation in a high-order mode of a
microstructured fiber, extending to 260nm in the UV.
As with previous demonstrations of HF based supercontinuum generation [13], our high
energy ultrashort seed pulses were generated from a Ti:Sapphire laser system. There appears to
be an opportunity to develop practical sources of HF based supercontinuum generation, since
collimated (bright) sources of broadband radiation, and the ability of HF to be a waveguide for
such supercontinuum could be useful for a wide range of applications that use spectroscopic
techniques. The demonstration of supercontinuum generation from a HF pumped by a fiber
162

based direct amplification system, as presented in Chapter 9, is one step towards such a practical
source.
It has been shown that supercontinuum generation using ~100 fs pulses occurs through the
mechanism of soliton fission, which results in a low degree of temporal coherence of the
continuum [14]. Recent research has concentrated on reducing the amplitude noise of the
supercontinuum by using input pulses with much shorter pulse durations (e.g. <30 fs pulses
from Ti:Sapphire lasers), and shorter lengths of HF [15, 16] The primary mechanism of spectral
broadening is then SPM and four-wave-mixing, and this short pulse / short fiber approach
therefore leads to an increases the temporal coherence of the continuum. (The threshold energy
for forming a higher order soliton increases for shorter pulses, and soliton fission is therefore
avoided.) Further practical development of highly coherent, low noise supercontinuum appears
to be dependent on the commercial development of lower cost ultra-short pulse sources. Fiber
technology is an attractive alternative to bulk crystal devices, offering a route to power scaling
of the average output power.
12.3.2 Wavelength tuneable holey fiber amplifier source
The work presented in Chapter 11 of this thesis demonstrated a novel source of ultrashort
pulses, continuously wavelength tuneable from 1.06-1.33 µm. The pulse durations
were <250 fs and the pulse energies were ~50pJ (average power ~3mW). The system was
based on the SSFS in an Yb-doped HF amplifier that was seeded from our Yb-fiber oscillator.
Sources of wavelength tuneable ultra-short pulses are useful for many applications, and systems
based on the SSFS and have potential for practical devices because they use low cost
components, and do not require external pulse compressors. Following interest in our HF
amplifier system from a commercial enterprise, a patent application has been submitted based
on the results presented in this thesis [17-19]. Further numerical and practical work (exploiting
latest developments in HF fabrication expertise) would be appropriate to extend the tuning
range of the system to the silica water absorption peak at 2.1 µm, and to increase the output
pulse energy. Future research could include extending the range of accessible wavelengths by
frequency doubling into the visible region of the spectrum.
163
References 1. D. J. Richardson, J. Nilsson, L. Lefort, J. H. Price, A. Malinowski and M. Ibsen,
"Pulsed Light Sources," U.S. Patent Application 10/146,219 (May 13, 2002). 2. J. H. Price, L. Lefort, D. J. Richardson, G. J. Spuhler, R. Paschotta, U. Keller, C. Barty,
A. Fry and J. Weston, "A practical, low noise, stretched pulse Yb3+-doped fiber laser," Conference on Lasers and Electro-Optics (CLEO 2001), paper CTuQ6 (2001).
3. M. E. Fermann, L. M. Yang, M. L. Stock and M. J. Andrejco, "Environmentally Stable Kerr-Type Mode-Locked Erbium Fiber Laser Producing 360-fs Pulses," Optics Letters 19, 43-45 (1994).
4. H. Lim, F. O. Ilday and F. W. Wise, "Generation of 2-nJ pulses from a femtosecond ytterbium fiber laser," Optics Letters 28, 660-662 (2003).
5. A. V. Avdokhin, S. V. Popov and J. R. Taylor, "Totally fiber integrated, figure-of-eight, femtosecond source at 1065 nm," Optics Express 11, 265-269 (2003).
6. H. Hundertmark, C. Fallnich, N. Haverkamp, J. Stenger and H. R. Telle, "Sub-fs pulse-to-pulse jitter from a 60 MHz repetition rate all-fiber passively mode-locked Erbium laser," OSA Annual Meeting, OSA, (28 September - 3 October, 2002).
7. A. Galvanauskas, Z. Sartania and M. Bischoff, "Millijoule femtosecond fiber CPA system," Advanced Solid-State Lasers, Proceedings, (2001).
8. IPG Photonics press release, Dec16 2002 (http://www.ipgphotonics.com). 9. M. V. O'Connor, M. A. Watson, D. P. Shepherd, D. C. Hanna, J. H. V. Price, A.
Malinowski, J. Nilsson, N. G. R. Broderick and D. J. Richardson, "Synchronously pumped optical parametric oscillator driven by a femtosecond mode-locked fiber laser," Optics Letters 27, 1052-1054 (2002).
10. J. Limpert, T. Schreiber, T. Clausnitzer, K. Zollner, H. J. Fuchs, E. B. Kley, H. Zellmer and A. Tünnermann, "High-power femtosecond Yb-doped fiber amplifier," Optics Express 10, 628-638 (2002).
11. M. E. Fermann, V. I. Kruglov, B. C. Thomsen, J. M. Dudley and J. D. Harvey, "Self-similar propagation and amplification of parabolic pulses in optical fibers," Physical Review Letters 84, 6010-6013 (2000).
12. A. Efimov, A. J. Taylor, F. G. Omenetto, J. C. Knight, W. J. Wadsworth and P. St.J.Russell, "Nonlinear generation of very high-order UV modes in microstructured fibers," Optics Express 11, 910-918 (2003).
13. J. K. Ranka, R. S. Windeler and A. J. Stentz, "Visible continuum generation in air-silica microstructure optical fibers with anomalous dispersion at 800 nm," Optics Letters 25, 25-27 (2000).
14. J. Herrmann, U. Griebner, N. Zhavoronkov, A. Husakou, D. Nickel, J. C. Knight, W. J. Wadsworth, P. St.J.Russell and G. Korn, "Experimental evidence for supercontinuum generation by fission of higher-order solitons in photonic fibers," Physical Review Letters 88, 173901 (2002).
15. J. M. Dudley and S. Coen, "Coherence properties of supercontinuum spectra generated in photonic crystal and tapered optical fibers," Optics Letters 27, 1180-1182 (2002).
16. K. L. Corwin, N. R. Newbury, J. M. Dudley, S. Coen, S. A. Diddams, K. Weber and R. S. Windeler, "Fundamental noise limitations to supercontinuum generation in microstructure fiber," Physical Review Letters 90, art. no.-113904 (2003).
17. D. J. Richardson, T. M. Monro, J. H. Price and K. Furusawa, "Sources of, and Methods for Generating, Optical Pulses," U.S. Patent Application 10/120,965 (February 05, 2002).
164
165
18. D. J. Richardson, T. M. Monro, J. H. Price and K. Furusawa, "Sources of, and Methods for Generating, Optical Pulses," U.K. Patent Application GB 0109082.8 (April 11, 2001).
19. J. H. V. Price, K. Furusawa, T. M. Monro, L. Lefort and D. J. Richardson, "Tunable, femtosecond pulse source operating in the range 1.06- 1.33 microns based on an Yb3+-doped holey fiber amplifier," Journal of the Optical Society of America B-Optical Physics 19, 1286-1294 (2002).
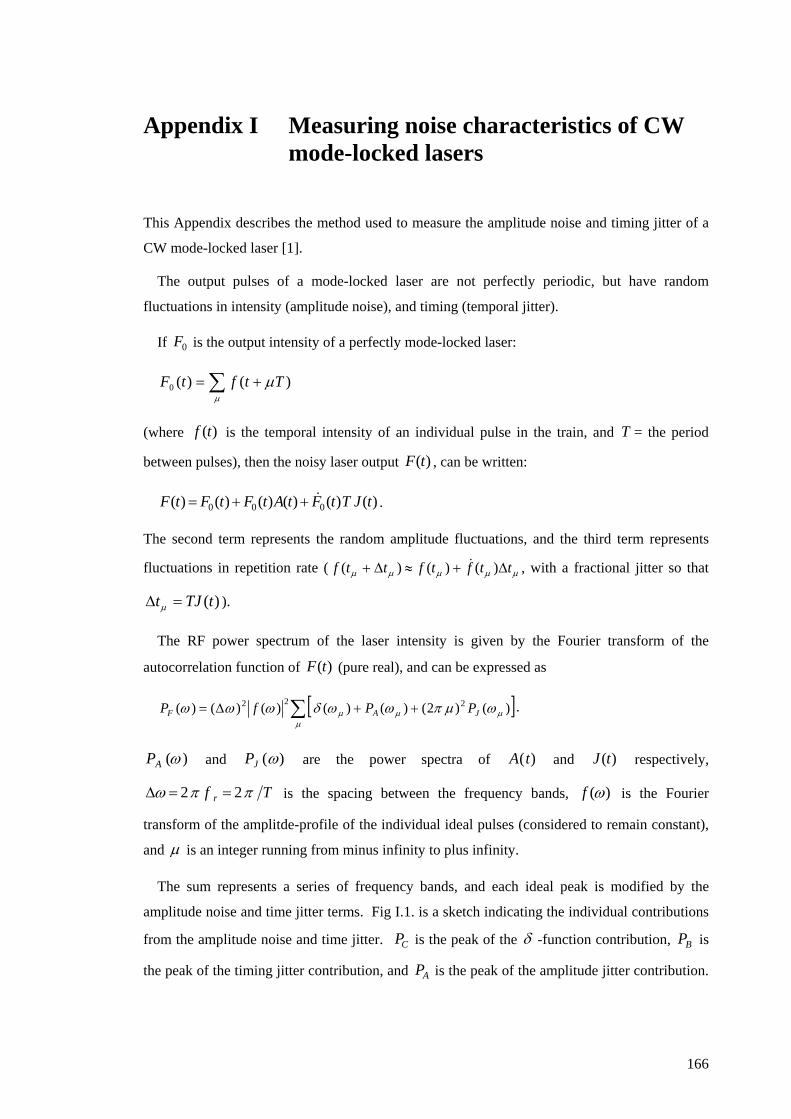
Appendix I Measuring noise characteristics of CW mode-locked lasers
This Appendix describes the method used to measure the amplitude noise and timing jitter of a
CW mode-locked laser [1].
The output pulses of a mode-locked laser are not perfectly periodic, but have random
fluctuations in intensity (amplitude noise), and timing (temporal jitter).
If is the output intensity of a perfectly mode-locked laser: 0F
∑ +=µ
µ )()(0 TtftF
(where is the temporal intensity of an individual pulse in the train, and )(tf T = the period
between pulses), then the noisy laser output , can be written: )(tF
)()()()()()( 000 tJTtFtAtFtFtF &++= .
The second term represents the random amplitude fluctuations, and the third term represents
fluctuations in repetition rate ( , with a fractional jitter so that
).
µµµµµ ttftfttf ∆+≈∆+ )()()( &
)(tTJt =∆ µ
The RF power spectrum of the laser intensity is given by the Fourier transform of the
autocorrelation function of (pure real), and can be expressed as )(tF
[ ]∑ ++∆=µ
µµµ ωµπωωδωωω )()2()()()()()( 222JAF PPfP .
)(ωAP and )(ωJP are the power spectra of and respectively, )(tA )(tJ
Tf r ππω 2=2=∆ is the spacing between the frequency bands, )(ωf is the Fourier
transform of the amplitde-profile of the individual ideal pulses (considered to remain constant),
and µ is an integer running from minus infinity to plus infinity.
The sum represents a series of frequency bands, and each ideal peak is modified by the
amplitude noise and time jitter terms. Fig I.1. is a sketch indicating the individual contributions
from the amplitude noise and time jitter. is the peak of the CP δ -function contribution, is
the peak of the timing jitter contribution, and is the peak of the amplitude jitter contribution.
BP
AP
166
As the jitter term is proportional to , this contribution increases for higher harmonics, so we
can distinguish the two noise contributions.
2µ
] 21
Fig. I.1. Noise bands around the nth harmonic of a mode-locked laser, indicating amplitude fluctuations and temporal jitter . )( AP )( BP
ωn
Power spectral density
PB
PC
PA
Frequency
The RMS intensity fluctuations (deviation E∆ of pulse energy E ) and temporal jitter
(deviation ∆ from the pulse repetition time t T ) can be determined as:
( ) ( ) ωω dPEE A∫+∞
∞−
=∆ 2 , and
( ) ( ) ωω dPTt J∫+∞
∞−
=∆ 2 .
The integrals can be approximated as the product of the frequency width (FWHM) and the
maximum power of the nth harmonic peak:
( ) ( )nPfdP ωπωω ∆≈∫+∞
∞−
2 .
We then obtain the following formula for the amplitude jitter ( resf∆ = selected resolution
bandwidth of spectrum analyser):
( )[ . 0 resAnCA ffPPEE ∆∆=∆ =
As we do not see any pedestal on the fundamental peak, we estimate an upper bound on the
amplitude noise by taking ∆ = 395 Hz = width at base of peak, and = -80dB = 10Jf CA PP / -8,
giving EE∆ = 0.04% as stated in Chapter 4.
167
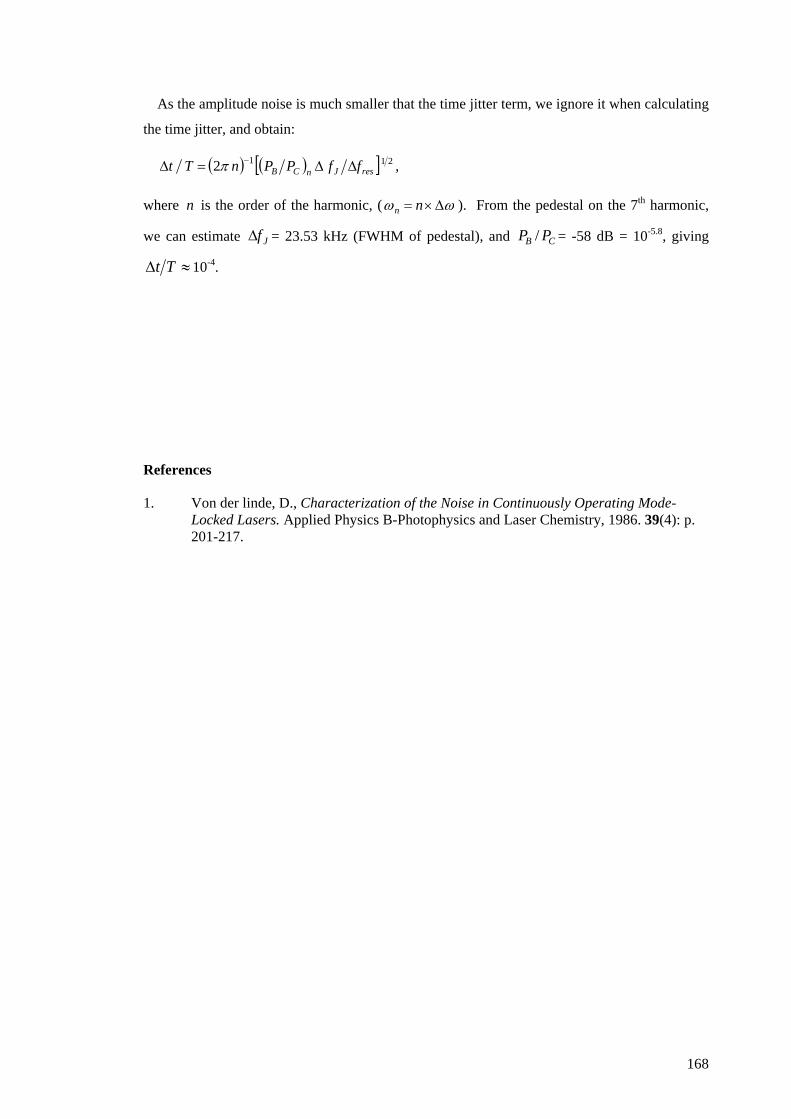
As the amplitude noise is much smaller that the time jitter term, we ignore it when calculating
the time jitter, and obtain:
( ) ( )[ ] 2112 resJnCB ffPPnTt ∆∆=∆ −π ,
where is the order of the harmonic, (n ωω ∆×= nn ). From the pedestal on the 7th harmonic,
we can estimate = 23.53 kHz (FWHM of pedestal), and = -58 dB = 10Jf∆ CB PP / -5.8, giving
Tt∆ ≈10-4.
References
1. Von der linde, D., Characterization of the Noise in Continuously Operating Mode- Locked Lasers. Applied Physics B-Photophysics and Laser Chemistry, 1986. 39(4): p. 201-217.
168

Appendix II SESAM selection for mode-locked Yb-fiber laser
As explained in Chapter 4, we included a SESAM in the laser cavity in order to obtain reliable
self-start mode-locking. Professor U. Keller of ETH Zurich was kind enough to lend us a
selection of 11 SESAMs with different modulation depths and recovery time constants, and
before finally deciding which SESAM to use, we characterised the performance of the laser
with the entire range of SESAMs. There are three different families of SESAMS, the
performance of the laser with each SESAM is described in this appendix.
The SESAMs tested were of the low-finesse Antiresonant Fabry-Perot Saturable Absorber
(A-FPSA) type, illustrated schematically in Fig. AII.1 [1]. Constructing the FPSA to operate at
antiresonance makes the device broadband, and hence suitable for use in ultrafast lasers.
Bandgap engineering and modern semiconductor growth technology have allowed for accurate
control of the device parameters such as absorption wavelength, saturation energy, and recovery
time. The reflectivity spectrum is determined by the number of layers in the bottom mirror
(typically ~35 for our SESAMs), and by the dimension of the Fabry-Perot cavity. Low finesse
A-FPSA devices use the air-InGaAs interface as the top-mirror (~30% reflection), which avoids
post-growth processing. The absorber recovery time is controlled by growth temperature; a
lower growth temperature produces a faster recovery time. The semiconductor used is III-V
(InGaAs), and electron trapping is to point defects created by the excess group V atoms [1].
Fig. AII.1.Schematic of A-FPSA structure. The bottom mirror is a Bragg mirror formed by pairs of AlAs-AlGaAs (or AlAs-GaAs) quarter-wave layers. (From [1].)
When investigating the laser performance with the various SESAMs, we also varied the
grating separation to control the net cavity dispersion. With excess negative dispersion, we
observed soliton mode-locking, where the pulses were sustained because of a balance between
GVD and SPM, and excess energy transferred to the low intensity wings of the pulse was
removed by nonlinear polarisation rotation switching after each cavity round trip. With
approximately nil net cavity dispersion, the cavity operated in stretch-pulse configuration
(pulses again maintained by nonlinear polarisation rotation switching). The pulses produced in
169
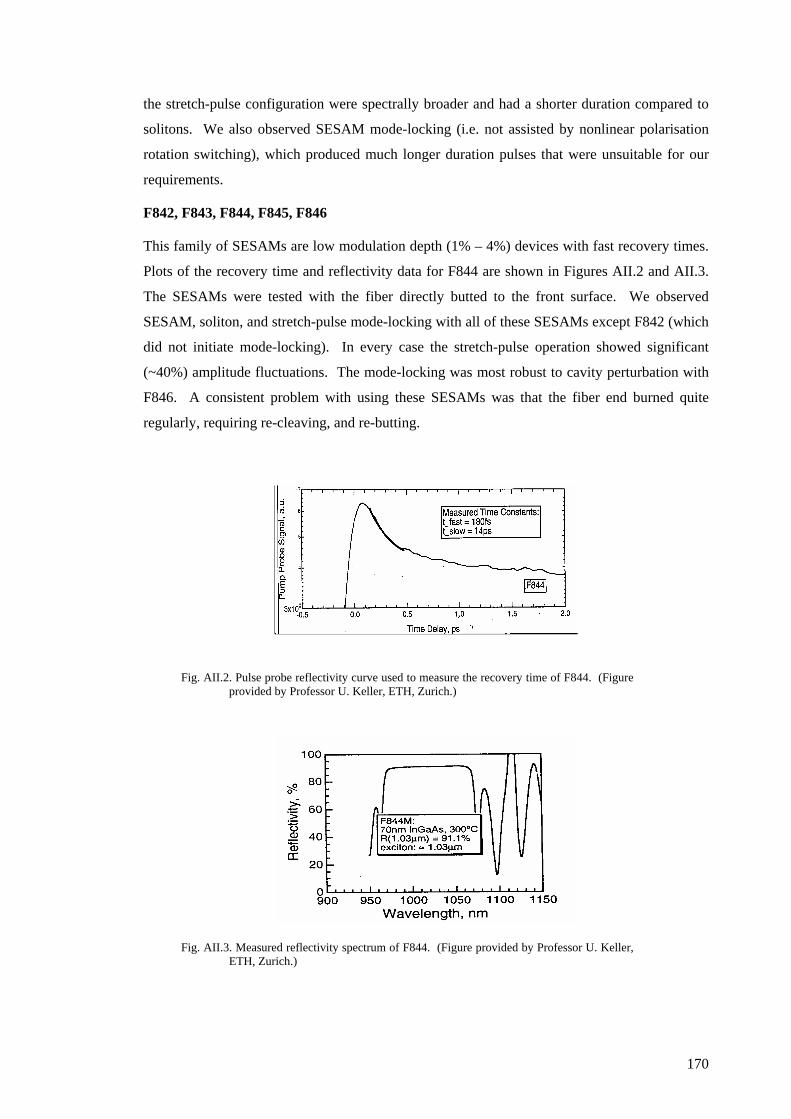
the stretch-pulse configuration were spectrally broader and had a shorter duration compared to
solitons. We also observed SESAM mode-locking (i.e. not assisted by nonlinear polarisation
rotation switching), which produced much longer duration pulses that were unsuitable for our
requirements.
F842, F843, F844, F845, F846
This family of SESAMs are low modulation depth (1% – 4%) devices with fast recovery times.
Plots of the recovery time and reflectivity data for F844 are shown in Figures AII.2 and AII.3.
The SESAMs were tested with the fiber directly butted to the front surface. We observed
SESAM, soliton, and stretch-pulse mode-locking with all of these SESAMs except F842 (which
did not initiate mode-locking). In every case the stretch-pulse operation showed significant
(~40%) amplitude fluctuations. The mode-locking was most robust to cavity perturbation with
F846. A consistent problem with using these SESAMs was that the fiber end burned quite
regularly, requiring re-cleaving, and re-butting.
Fig. AII.2. Pulse probe reflectivity curve used to measure the recovery time of F844. (Figure provided by Professor U. Keller, ETH, Zurich.)
Fig. AII.3. Measured reflectivity spectrum of F844. (Figure provided by Professor U. Keller, ETH, Zurich.)
170
171
Z273, Z274, Z276 and Z365, Z367, Z384
These two families are both of a similar construction. They are high modulation depth (10% -
17%) devices with slow recovery time of ~3 ps and fast recovery time of ~100 fs. (A plot of the
reflectivity of Z273 is shown in Chapter 4.) All were tested initially with matched focal length
lens pair coupling. SESAMs Z274, Z365, and Z384 did not initiate stretch-pulse mode-locking,
and were not investigated further. SESAMs Z273, Z276, and Z367 did initiate single pulse
stretch-pulse mode-locking, but because the operation with Z276 was not as robust and required
higher pump power for self-start, we chose only to investigate further the SESAMs Z273 and
Z367.
Final operation of Z367, Z273
We found that excellent single pulse stretch-pulse mode-locked self-start operation was
obtained with both of these SESAMs. We focussed the beam more tightly onto the SESAMs by
using lenses with focal lengths of 11.0 mm nearest to the fiber and 6.24 mm nearest to the
SESAM. The pulses at the cavity output were compressed by an external grating pair, to
produce pulses as short as 108 fs (assuming a Gaussian profile).
Although we did not make detailed measurements, our qualitative opinion was that the
operation with Z367 was slightly more robust, had a shorter self-start time, and produced a
smoother spectrum at the ‘rejected’ output port of the laser compared to operation with Z273.
Z367 was used in the optimised and fully characterised laser.
References
1. U. Keller, K. J. Weingarten, F. X. Kartner, D. Kopf, B. Braun, I. D. Jung, R. Fluck, C. Honninger, N. Matuschek and J. A. derAu, "Semiconductor saturable absorber mirrors (SESAM's) for femtosecond to nanosecond pulse generation in solid-state lasers," IEEE Journal of Selected Topics in Quantum Electronics 2, 435-453 (1996).
Appendix III List of publications
Journal publications
1. J. H. V. Price, W. Belardi, T. M. Monro, A. Malinowski, A. Piper and D. J. Richardson, "Soliton transmission and supercontinuum generation in holey fiber, using a diode pumped Ytterbium fiber source," Optics Express 10, 382-387 (2002).
2. L. Lefort, J. H. Price, D. J. Richardson, G. J. Spuhler, R. Paschotta, U. Keller, A. Fry and J. Weston, "Practical Low-Noise stretched-pulse Yb3+ -doped fiber laser," Optics Letters 27, 1-3 (2002).
3. J. H. V. Price, K. Furusawa, T. M. Monro, L. Lefort and D. J. Richardson, "Tunable, femtosecond pulse source operating in the range 1.06- 1.33 µm based on an Yb3+-doped holey fiber amplifier," Journal of the Optical Society of America B-Optical Physics 19, 1286-1294 (2002).
4. M. V. O'Connor, M. A. Watson, D. P. Shepherd, D. C. Hanna, J. H. V. Price, A. Malinowski, J. Nilsson, N. G. R. Broderick and D. J. Richardson, "Synchronously pumped optical parametric oscillator driven by a femtosecond mode-locked fiber laser," Optics Letters 27, 1052-1054 (2002).
5. K. Furusawa, A. Malinowski, J. H. V. Price, T. M. Monro, J. K. Sahu, J. Nilsson and D. J. Richardson, "Cladding pumped Ytterbium-doped fiber laser with holey inner and outer cladding," Optics Express 9, 714-720 (2001).
6. J. H. Price, T. M. Monro, K. Furusawa, W. Belardi, J. C. Baggett, S. J. Coyle, C. Netti, J. J. Baumberg, R. Paschotta and D. J. Richardson, "UV generation in a pure silica holey fiber," Applied Physics B-Lasers and Optics 77, 291-298 (2003).
Conference publications
7. INVITED J. H. Price, W. Belardi, L. Lefort, T. M. Monro and D. J. Richardson, "Nonlinear pulse compression, dispersion compensation, and soliton propagation in holey fiber at 1 micron," Nonlinear Guided Waves and Their Applications (NLGW 2001), paper WB1-2 (2001).
8. POST DEADLINE J. H. Price, K. Furusawa, T. M. Monro, L. Lefort and D. J. Richardson, "A tuneable, femtosecond pulse source operating in the range 1.06-1.33 microns based on an Yb-doped holey fiber amplifier," Conference on Lasers and Electro Optics (CLEO), Vol. 56 of OSA Trends in Optics and Photonics Series (Optical Society of America, Washington, D.C., 2001) paper CPD1 (2001).
9. INVITED J. H. Price, K. Furusawa, T. M. Monro, A. Malinowski, J. K. Sahu, J. Nilsson and D. J. Richardson, "Ultrashort pulse laser and amplifier systems based on Yb-doped holey fiber," OSA Annual Meeting, 2002, OSA (28 September - 3 October 2002)
10. J. H. Price, K. Furusawa, T. M. Monro, C. Netti, A. Malinowski, J. J. Baumberg and D. J. Richardson, "Phase matched UV Generation in a silica holey fiber," Conference on Lasers and Electro Optics (CLEO), Vol. 73 of OSA Trends in Optics and Photonics Series (Optical Society of America, Washington, D.C., 2002) paper CTuB5 (2002).
11. J. H. Price, L. Lefort, D. J. Richardson, G. J. Spuhler, R. Paschotta, U. Keller, C. Barty, A. Fry and J. Weston, "A practical, low noise, stretched pulse Yb3+ doped fiber laser," Conference on Lasers and Electro-Optics (CLEO 2001), paper CTuQ6 (2001).
172

12. W. Belardi, T. M. Monro, J. H. Lee, Z. Yusoff, J. H. Price, A. Malinowski, A. Piper and D. J. Richardson, "Silica holey fibres: fabrication and nonlinear effects," Photon, 2002, (2002)
13. W. Belardi, T. M. Monro, J. H. Price, J. H. Lee, P. Petropoulos and D. J. Richardson, "Fabrication and applications of highly nonlinear silica holey fibres," QEP 15, 2002, (3-6 September 2002)
14. K. Furusawa, A. Malinowski, J. H. Price, T. M. Monro, J. K. Sahu, J. Nilsson and D. J. Richardson, "A highly efficient all-glass double clad Ytterbium doped holey fiber laser," Conference on Lasers and Electro-optics (CLEO), 2002, OSA (2002)
15. K. Furusawa, J. H. Price, T. M. Monro, P. Petropoulos and D. J. Richardson, "Development and applications of Ytterbium doped highly-nonlinear holey optical fibres," International Workshop on Nonlinear Photonic Crystals -, 2001, (25-26 October 2001)
16. K. Furusawa, J. H. Price, T. M. Monro, P. Petropoulos and D. J. Richardson, "A small core Yb-doped holey fiber laser and amplifier," IoP Meeting 'In-fibre Bragg gratings and special fibres', Photonex, 2002, (2001)
17. INVITED T. M. Monro, J. C. Baggett, W. Belardi, K. Furusawa, J. H. V. Price and D. J. Richardson, "Holey fibres: Properties, applications and future directions," in Icton 2001: 3rd International Conference on Transparent Optical Networks, Conference Proceedings. New York, 2001, pp. 88-91.
18. M. V. O'Connor, M. A. Watson, D. C. Hanna, D. P. Shepherd, L. Lefort, J. H. V. Price, A. Malinowski, J. Nilsson, N. G. Broderick and D. J. Richardson, "Fibre-laser pumped femtosecond PPLN OPO," Quantum Electronics and Photonics 15 (QEP 15), 2001, Institute of Physics
19. M. V. O'Connor, M. A. Watson, D. C. Hanna, D. P. Shepherd, L. Lefort, J. H. V. Price, A. Malinowski, J. Nilsson, N. G. R. Broderick and D. J. Richardson, "Fibre-laser-pumped femtosecond PPLN optical parametric oscillator," Leos 2001: 14th Annual Meeting of the IEEE Lasers & Electro- Optics Society, Vols 1 and 2, Proceedings, 2001, IEEE
20. INVITED D. J. Richardson, W. Belardi, K. Furusawa, J. H. Price, A. Malinowski and T. M. Monro, "Holey fibers: fundamentals and applications," Conference on Lasers and Electro-optics, 2002, OSA (2002)
21. INVITED D. J. Richardson, B. H. Lee, Z. Yusoff, W. Belardi, K. Furusawa, J. H. Price, M. Kiang, K. Frampton, D. W. Hewak, J. A. Tucknott, R. C. Moore, H. N. Rutt and T. M. Monro, "Holey fibers for nonlinear fiber devices," Optical Amplifiers and Their Applications (OAA), 2002, (14 -17 July 2002)
22. INVITED D. J. Richardson, J. Nilsson, J. H. Price, J. A. Alvarez-Chavez and C. C. Renaud, "Pulsed fibre laser and amplifier systems," CLEO Europe - EQEC, 2002, (18-22 July 2002)
Workshops and Symposiums
23. Rank Prize Funds: Mini-Symposium on Broadband Optical Amplifiers (18-21 June, 2001), Grasmere, UK
24. Optical Soliton Workshop (22-24 March, 2001), School of Optics CREOL, Orlando, USA
173

Chapter 1 Introduction
This PhD thesis presents research aimed at broadening the technology base available for
practical fiber based sources of ultrashort pulses. The first part of this thesis reports the
development of a high-power, short pulse source based on Yb-doped fiber components. The
second part of this thesis reports research on the use of Holey Fiber (HF) for ultrashort pulse
applications including broadband continuum generation, and to generate wavelength tuneable
~200 fs pulses. Much of the HF based research used the short pulse source, described in the
first part of this thesis, for the seed pulses.
There are a wide variety of applications that rely on nonlinear interactions with materials, for
example two-photon absorption, nonlinear frequency generation in Optical Parametric
Oscillators (OPOs) and supercontinuum generation in nonlinear small core fibers. For these
nonlinear applications, the powers must be sufficient to excite the relevant nonlinear process,
and obtaining sufficient power is generally only possible using pulsed sources. Recently, basic
investigations on laser–matter interaction [1, 2] have shown that ultra-short (mode-locked) laser
sources are advantageous in comparison to nano-second sources (Q-switched) for machining
various solid materials with high precision [3]. This is because ultrashort pulses can ablate the
material before heat has time to diffuse away from the exposed region, resulting in improved
resolution and reduced collateral damage (e.g. melting, or micro-cracking). Given sufficiently
high beam quality and amplitude stability, it is also possible to detect (2-photon microscopy)
and ablate (material processing) features of a dimension less than the wavelength, by arranging
that only in the centre of the focal volume is the intensity high enough to excite the required
nonlinear processes [4]. Meeting the requirements for a wide variety of existing and emerging
applications therefore requires pulses with: (i) sub-picosecond duration, (ii) megawatt peak
power (µJ pulse energy), (iii) M2 ~1 beam quality, and (iv) low amplitude noise.
Regenerative amplifiers using the chirped pulse amplification (CPA) technique [5] have
generally been applied to realise the above parameters with repetition rates of up to 10 kHz [6].
However, ultrashort-pulse bulk crystal solid-state lasers are typically very complex systems,
with a large number of components inside a long free-space optical cavity. The performance of
such bulk crystal lasers is critically dependent on the thermal and modal conditions in the gain
medium. Therefore, there are significant intrinsic limitations on the long-term stability and
compactness of such laser systems, which hampers the successful implementation of the
1

174
Patent Applications
25. D. J. Richardson, J. Nilsson, L. Lefort, J. H. V. Price, A. Malinowski and M. Ibsen, "Pulsed Light Sources" UK patent application number 0203798.4 filed on 18/02/02, US patent application number 10/146,219 filed on 13/05/02.
26. D. J. Richardson, T. M. Monro, J. H. Price and K. Furusawa, "Sources of, and methods for generating, optical pulses", US patent application number 10/120,965 filed on 10/04/02.
Publications from Masters Degree Research
27. J. H. V. Price, "X-ray Study of the Smectic Layer Stability of a Mechanically Vibrated Liquid Crystal Film," Masters Thesis, Cornell University (2000).
28. Y. Li, S. G. Lemay, J. H. Price, K. Cicak, K. O'Neill, K. Ringland, K. D. Finkelstein, J. D. Brock and R. E. Thorne, "Imaging field-dependent structure in charge-density waves by X- ray diffraction topography," Journal de Physique IV 9, 151-152 (1999).
29. Y. Li, S. G. Lemay, J. H. Price, K. Cicak, K. O'Neill, K. Ringland, K. D. Finkelstein, J. D. Brock and R. E. Thorne, "Imaging shear in sliding charge-density waves by X-ray diffraction topography," Physical Review Letters 83, 3514-3517 (1999).
30. Y. Li, D. Y. Noh, J. H. Price, K. L. Ringland, J. D. Brock, S. G. Lemay, K. Cicak, R. E. Thorne and M. Sutton, "Observation of dynamic coupling between the Q(1) and Q(2) charge-density waves in NbSe3 - art. no. 041103," Physical Review B 63, 041103 (2001).