the development of the marital ... · scale dealing with the effect of “understanding of...
TRANSCRIPT

Educational Sciences: Theory & Practice - 13(1) • Winter • 97-117 ©2013 Educational Consultancy and Research Center
www.edam.com.tr/estp
AbstractIn this study, the process of developing the Marital Satisfaction Scale (MSS) aiming to support studies in the field of marital satisfaction and to obtain information about couples in a short time through psychological counseling is discussed. The scale including 101 yes-no items aiming to re-veal couples’ opinions about their marriages was designed in parallel with similar scales developed abroad for similar purposes. The scale is comprised of two parts. The first part contains 92 items related to the sub-dimensions of the marital satisfaction. On the other hand, the second part of the scale dealing with the effect of “understanding of parenting” on the marital satisfaction includes 9 items to be responded by individuals with children. In the process of developing the scale, 341 people were given the whole scale and 270 people who have children were given the second part of the scale to carry out the statistical calculations. As a result of the item total, item remaining and discriminant analysis of the scale, the results were found to be significant at the level of p .001. Through Cronbach α, Spearman Brown and Guttman Split-Half techniques, reliability values bet-ween r=.93 and .97 were found. The reliability values of the part of the scale administered to people with children about “understanding of parenting” was found to be between r=.81 and .86. The factor analysis revealed that the first sub-dimension of the scale assesses the “marital harmony” which is comprised of the “relationship happiness”, “conflict” and “closeness” sub-scales. Other sub-dimensions are “anger”, “communication with the spouse’s family “, “economic understanding”, and “understanding of parenting”.
Key WordsMarital Satisfaction, Marital Relationship, Married Couples, Marital Satisfaction Scale.
Azize Nilgün CANELa Marmara University
Being one of the building blocks of all the societies, the institution of marriage has been the most im-portant institution in our country for centuries. Alt-hough Turkey has a lower level of divorce rate than in Europe and America, the statistical data indica-tes that the divorce rate in our country is increasing rapidly (Prime Ministry General Directorate of Family and Social Research, 2008; Yıldırım, 2004). The family maintains itself through the marriage institution. Besides, the family is based on the inte-raction and the communication between the coup-les. Marriage is one of the most important forms of communication providing satisfaction to the adults.
A healthy family environment primarily requires couples to trust each other, to equip themselves
* The reliability and the validity study of this research study has been taken from the PhD dissertation entitled “Problem Solving in Family, Marital Satisfaction and Testing a Sample Group Work” supervised by Prof. Betül Aydın.
a Azize Nilgün CANEL, Ph.D., is currently an assis-tant professor at the Department of Educational Sciences, Guidance and Psychological Counse-ling. Her research interests include marriage and family counseling, family life education and creativity and counseling. Correspondence: Assist. Prof. Azize Nilgün CANEL, Marmara Uni-versity, Atatürk Faculty of Education, Department of Guidance and Psychological Counseling, Istan-bul/Turkey. E-mail: [email protected] Phone: +90 216 345 4705/236.
The Development of the Marital Satisfaction Scale (MSS)*
E D U C A T I O N A L S C I E N C E S : T H E O R Y & P R A C T I C E
98
with love and respect, to develop problem solving skills, and to maintain healthy communication with each other. The quality of the relationship bet-ween couples plays a decisive role in inter-family communication and relationship. The emotional and behavioral problems of the couples affect not only their marital satisfaction but also their life sa-tisfaction; therefore, these problems can easily be reflected in the family environment, which reduces the quality of life. The relationship between couples is regarded as harmonies when the couples perce-ive their marriage life as happy, when the marital satisfaction is high and the level of conflict and problem is low (Blum & Mehrabian, 1999; Harway, 2005; Wenzel & Harvey, 2001; Yılmaz, 2001).
The marital satisfaction is shaped by the perceived quality of the interaction between couples. The level of happiness with the relationship between couples, their feelings about their own marriages, their perspectives and perceptions about marriages in general determine the level of marital satisfacti-on (Harway, 2005; Holman, 2002; Nichols, 2005). Moreover, couples with a high level of mutual ma-rital satisfaction have lower stress level, higher level of life happiness and a higher level of endurance to cope with adverse living conditions (Bradbury, Fincham, & Beach, 2000; Holman, 2002).
The research studies carried out by different scien-tists from different schools have attracted attention especially since 1990s. In recent years, there have been many studies conducted to reveal the basic components of the concept of marital satisfacti-on. The importance attached to the marital satis-faction has been increasing as it has been realized that the concept of marital satisfaction is a rather important factor in terms of the mental health of both the individual and the family. Moreover, it has been claimed that the increase in the number of couples with high marital satisfaction and har-monies relationship socially means that the society is becoming a more healthy society (Bradbury et al., 2000; Chapin, Chapin, & Sattler, 2001; Harway, 2005, Holman, 2002). Basically, marital satisfaction is related to the couples’ dissatisfaction with their marriages, the stress factor in their relationship, their communication with each other, spending time together, disputes in financial matters and their role orientation (Snyder, 1997). However, the concept of marital satisfaction is not stable and has the feature of a bell curve because marital satisfac-tion may tend to decrease over time while it may increase in later years. It is observed that different dimensions of the marital satisfaction increase in
later years of the marriage (Bradbury et al., 2000; Karney & Bradbury, 1995; Karney & Crown, 2007; Orbuch, 1996). The changes in the quality and the quantity of the relationship are the primary factors reducing the level of marital satisfaction and har-ming the proper functioning of the relationship. For example, couples with marriage problems have more frequent conflicts in their relationship. The tension arising from the differences of opinions between couples can easily influence other dimen-sions of the relationship (Leggett, Roberts-Pittman, Byczek, & Morse, 2012; Noller & Feeney, 2002). Couples with lower levels of marital satisfaction exhibit more negative attitudes towards each other. The disharmonious behavioral patterns of the co-uples also raise the negative attitudes they exhibit during the resolution of the conflicts with each ot-her, which negatively affects their marital satisfacti-on (Bradbury et al.; Leggett et al.; Noller & Feeney).
Marital satisfaction is a complex process; however, theoretical and empirical studies proved that the interactional patterns between couples play the key role in marital satisfaction. Positive behaviors ha-ving a direct impact on the marital satisfaction can be listed as follows: Mutual acceptance, the appro-val of the spouse’s movements and the negotiation of ideas. On the other hand, the most apparent negative behaviors reducing marital satisfaction are blaming, criticism, and pressure (Feeney, 2002; Holman, 2002; Karney & Crown, 2007). From the perspective of both men and women, the most common problems related to marriage are money, communication, sexuality, and family. It is known that these problems become worse as changes oc-cur in the family life cycle. The main factors consi-dered by many researchers to be influential in the level of couples’ marital satisfaction can be grou-ped under the following headings (Bradbury et al., 2000; Chapin et al., 2000; Feeney, 2002; Fitzpatrick, 1988; Snyder, 1997):
1. Love and emotional bond in the marriage,
2. The degree of communication style applied in problem solving,
3. The presence of conflict resolution skills in the marriage,
4. Marital violence,
5. Spending time together,
6. Disputes arising from property matters,
7. Sexual dissatisfaction,
8. Meeting the expectations of gender roles and role expectations in the marriage,

CANEL / The Development of the Marital Satisfaction Scale (MSS)
99
9. The elements couples bring their current relati-onship under the influence of their original upb-ringing,
10. Problems that arise from the children and are reflected to the marriage.
Investigating the research studies about marital sa-tisfaction in the last decade, Bradbury et al. (2000) pointed out that the results of the studies focus specifically on three main issues: (1) cognitive pro-cesses, mutual interaction, physiology, behavioral patterns affecting the marriage and “interpersonal processes” including factors like social support and the presence of violent behavior, (2) micro factors that have an influence on the marriage (e.g. the presence of children, life crises, life cycle transiti-ons) and “macro factors” (e.g. economic factors, satisfaction with the partner) and (3) the scope and measurement of satisfaction in the marriage.
Being the primary expectation of most couples, marital satisfaction is how couples feel about them-selves and their spouses about their marriages in a subjective, situational and relatively constant manner. According to the research, rather than demographic and personal variables, couples ge-nerally take their daily interaction with each other into consideration in the evaluation of their mar-riages. The best way to obtain information about couples’ marital satisfaction is the use of structured scales that can be answered individually to evalu-ate different dimensions of the marital satisfacti-on (Fincham & Bradbury, 1987; Snyder, Cozzi, & Mangrum, 2002; Snyder, 1979).
The measurement of satisfaction in marriage star-ted with Terman’s first study published in 1938 (Synder, 1979). In studies dealing with the marital satisfaction of the couples, the level of marital sa-tisfaction is usually measured on the basis of hap-piness, general satisfaction levels, marital relations and their evaluation of their spouses. In addition, marital satisfaction can be assessed by means of variables like marital adjustment and quality. One of the most commonly used methods to assess fa-mily and couple functions are the use of scales and inventory. It has been realized that the use of the marital satisfaction inventory is increasing rapidly, especially in clinical settings and marital therapies. By means of rating items in scales and surveys, co-uples can give information about their relationship. These instruments are administered in the form of pen and paper tests in which couples mark the most appropriate ratings that best suit the given situations (Fowers & Olson, 1993; Segrin, 2004; Snyder et al., 2002).
As a result of the research studies about marria-ges, many scales were developed abroad in order to assess marital satisfaction and these scales were used in different studies. Among the scales most commonly used abroad are Locke-Wallas Marital Adjustment Test (MAT), Spanier’s Dyadic Adjust-ment Scale (DAS), Snyder’s Marital Satisfaction Inventory (MSI), Roach, Frazier and Bowden’s Marital Satisfaction Scale (MSS), Norton’s Quality Marriage Index (QMI), Schumms’s Kansas Marital Satisfaction Scale (KMSS), Olson, Fournier and Druckman’s ENRICH: Enriching and Nurturing Relationship Issues, Communication and Happi-ness-Marital Satisfaction Scale, Hudson’s Index of Marital Satisfaction (IMS), Hendrick’s Relations-hip Assessment Scale (RAS) (Carrano, Cleveland, Tinkew, & Moore, 2003; Corcoran & Fischer, 2000; Locke & Wallace, 1959; Roach, Frazier, & Bowden, 1981; Snyder, 1997; Spanier, 1976; Tzeng, 1993; Yıl-maz, 2001).
The current research study has the main aim to support studies related to marital satisfaction in our country by developing a practical scale which can identify marital satisfaction levels of married couples and reveal couple’s problems in a short time. In addition to providing information about marital satisfaction as a whole, the scale can provi-de information about its sub-dimensions.
Method
The Process of Developing the Items in the Scale
The process of developing the items in the scale has two steps. The process is explained in detail below:
Step I: For the development of the items in the scale to assess marital satisfaction, the literature pertaining to marital satisfaction is firstly reviewed in a detailed way. During the reviewing process, all the information focusing on different components of marital satisfaction are taken into account. Then, the scales developed for this purpose are investi-gated and the related literature is reviewed. The sub-dimensions of the scales developed abroad are explored and the lacking dimensions that sho-uld also exist in the cultural context of Turkey are identified. Therefore, a form containing 214 items which are considered to have the potential to as-sess the main principles of marital satisfaction was developed.
Step II: Then, the items in the scale were looked into by five experts in the field who have been in-volved in the process of developing scales and who

E D U C A T I O N A L S C I E N C E S : T H E O R Y & P R A C T I C E
100
have a good command of the literature regarding family and marriage. Experts were provided with a 5 point Likert-type rating scale (1: this item is de-finitely not suitable, 5: definitely suitable) so that they could indicate their opinions about whether the items overlap with the relevant components of marital satisfaction that they are intended to assess; in other words, whether the items were in line with the factors of the scale was investigated. The experts were informed that they could make changes in the items of the scale when necessary. In the process of analyzing the data obtained from the experts via evaluation forms, the criteria requ-iring an item average total of ᾱ= 4.50 and above and a standard deviation of 0.70 and below in or-der to decide whether the items are placed in the right factors. In addition, the items considered to be problematic by the experts were changed in line with the recommendations made by them. After all these operations, 26 items were excluded from the scale and 12 items were changed considering experts’ recommendations. It was decided that the scale should have 188 items. Starting from the item 167 and ending with the item 188, the items were responded by only married couples with children so as to reveal the influence of having a child on their marital satisfaction. In the scale, 30% of the items were written as reverse statements in order to eliminate the tendency to answer in one way. In line with the scales developed abroad, the items in the scale were designed as statements with two options (Yes-No) so that participants could respond clearly to the items aiming to reveal the level of their marital satisfaction (Snyder, 1997). In the instruction given at the beginning of the scale, the participants were asked to respond to the items by considering their own marriage ex-periences as well as their marital relationship and to mark “right” if the item is right or partly right or “wrong” if the item is wrong or wrong most of the time.
Study Group
Study Group 1: The group where the scale was applied in the process of its development: Taking the lack of responses to some items and to the de-mographic information in the scale into account, some forms were excluded from the analysis. On the other hand, the responses of 611 participants at various stages of the life cycle and at different ages as well as socio-economic and cultural levels were considered valid. Among these participants, 341 participants were administered the whole test
so as to analyze the statistical operations of the first part, whereas 270 married couples with children were given the scale separately for the analysis of the second part of the scale aiming to assess the influence of having a child on the marital satisfac-tion of the couples. The age range of the first gro-up including 341 participants was between 21 and 63. The average age of the participants was 36,93 (SD: 8.36). The duration range of the participants’ marriage was between 1 and 38 years. The average duration of their marriages is 14.67 (SD: 8,35). The marriage age range of 341 participants participa-ting in the first part of the research was between 15 and 42. The average of their marriage age is 24.57 (SD: 4,25). 66,0% (N=232) of the participants were female while 32,0% (N=109) of the participants were male.
On the other hand, the age range of the second group including 270 married couples with child-ren was between 20 and 65. The average age of the participants was 38,70 (SD: 7,70) and the duration range of the participants’ marriage was between 1 and 38. The average duration of their marriages is between 2 and 40 years. The average duration of their marriages is 14.60 (SD: 8,17). The marriage age range of 270 participants participating in the second part of this research study was between 15 and 40. The average of their marriage age is 24.31 (SD: 4,34). In the second group, 66,6% (N=177) of the participants were female while the remaining 34,4% (N=93) were male. Taking the number of children of the participants into account, it can be stated that married couples with two children make up the majority of the participants (47%) while couples with only one child make up 39,3% (N=106) and couples with three children cons-titute 10,4% (N=28) of the participants. Finally, couples with more than three children make up 3,3% (N=9) of the respondents participating in this study.
Study Group 2: The group where the reliability and validity studies were carried out: In order to decide whether the scale is valid, other scales of a similar nature have been used. These scales are Problem Solving Inventory (PSI) (n=123) and Coping with Stress Scale (CSS) (n=123). The corre-lation of these scales with the Marital Satisfaction Scale used for the study is investigated. Also, in or-der to determine test-retest reliability of the scale, the scale was applied twice in two-week intervals (n=40).

CANEL / The Development of the Marital Satisfaction Scale (MSS)
101
Data Collection Instruments
The following information is related to two scales used to determine the criteria validity of the MSS:
Problem Solving Inventory (PSI): This inventory is the form of a self-assessment scale including 35 items aiming to reveal the self-perception of the individual in terms of problem solution. Deve-loped by P.P. Heppner and C.H. Petersen in 1982 (Heppner & Petersen, 1982), the inventory has a Cronbach’s alpha internal consistency coefficient of .90 for the whole scale and the coefficient value of the sub-scales range from .72 to .85. The scale was adapted to Turkish by Hepner, Şahin, and Şahin in 1993 (Savaşır & Şahin, 1997). In this adaptation, the Cronbach›s alpha coefficient was found to be .88. It has six sub-scales as hasty approach, thinking approach, avoidant approach, evaluative approach, self-confident approach, and planned approach. Another feature of the scale is that it is in the form of a Likert-type scale whose items can be ranked between 1 and 6. In order to identify the relations-hip between this scale and the Marital Satisfaction Scale, data were collected from 123 married indi-viduals
Coping with Stress Scale (CSS): This scale focu-sing on the ways to cope with stress was developed by Şahin and Durak (1995) who were inspired by Lazarus and Folkman’s (1984) “Ways of Coping Inventory”. Containing 30 items dealing with dif-ferent stress situations, the scale is a four-point Likert-type scale. The results of the scale found as a result of the factor analysis done with the use of three different samples showed that the ways of coping with stress can be divided into two as prob-lem-oriented (active) and emotion-oriented (passi-ve). These two categories have five sub-dimensions: optimistic approach, searching social support, despe-rate approach, submissive and self-confident app-roach. The following ranges of Cronbach’s alpha reliability coefficient for the sub-scales were found as a result of three separate studies done to test the reliability of the Coping with Stress Scale: Optimis-tic approach (0,68-0,49), desperate approach (0,64-0,73,), self-confident approach (0,62 and 0,80), submissive approach (0,47 and 0,72), searching social support (0,47 and 0,45).
The scale has been used in various research studies since it was made available for research purposes in our country (Oflaz, 1995; Şahin & Durak, 1995). In order to identify the relationship between the Coping with Stress Scale and the MSS, data were collected from 123 married individuals.
Data Analysis
After the data collection phase of the study, the scales applied for the study were scored. All the data were codified in the computer and the sta-tistical analysis was done by means of SPSS 13.0, a statistical package program. For the reliability of the scale, Varimax Rotation Vertical Technique and the explanatory factor analysis were applied. The relationship between the items of the scale and the scale as a whole was investigated by applying the Pearson product-moment correlation coefficient. On the other hand, for the validity of the scale, the relationship of the Problem Solving Inventory and the Coping with Stress Scale with the Marital Satis-faction Scale was explored by applying the Pearson product-moment correlation coefficient (Ercan & Kan, 2004; Hovardalıoğlu & Sezgin, 1998; Özçelik, 1998). So as to reveal the discriminant validity of the items, the independent samples t-test was used so that the researcher could reveal whether there was a significant difference between the item and total scores of the groups specified considering the low and high percentages compared to the to-tal score (27% high and 27% low). The maximum internal consistency of the scale scores was found through Cronbach α and the minimum internal consistency was found via the Guttman technique. Finally, the Pearson Product-moment Correlation Coefficient was used to reveal the test retest reli-ability of the scale by focusing on the relationship between two applications of the scale.
Results
The Factor Analysis of the Marital Satisfaction Scale
The form aiming to reveal married couple’s marital satisfaction levels was administered to 611 people. Among these participants, 341 participants were administered the whole test to carry out the sta-tistical calculations about the first part of the test. On the other hand, 270 married participants who have children were administered the test separa-tely so as to do the statistical analysis of the second part of the test assessing the influence of having a child and the effect of the problems arising from child-rearing on the marital satisfaction level of the participants. Kaiser-Meyer-Olkin (KMO) coeffici-ent was calculated before the factor analysis of the scale so as to decide whether the data is suitable for factor analysis, and the Bartlett’s Test of Sphericity was used to investigate whether the data is distribu-ted on a multivariate normal basis. While the value

E D U C A T I O N A L S C I E N C E S : T H E O R Y & P R A C T I C E
102
found in the Kaiser gets more perfect as it gets clo-ser to 1, it is not acceptable if it is under .50. Kaiser value is regarded as perfect if it is around .90, very good if it is around .80, mediocre if it is around .70 and .60 (Büyüköztürk, 2005). KMO value of the study group to which the scale was administered was found to be .91 (p<.001) and it was found to be .80 (p<.001) as for the part dealing with “unders-tanding of parenting”. The chi-square value in the Bartlett Test result was found to be x2=21157,563 (p<.001) and the value was x2=1589,565 (p<.001) for the part of the test about “understanding of parenting”. According to these results, it would be true to state that the selected sample group is sui-table for factor analysis.
After it was found that there was an appropriate distribution, the factor analysis procedures were initiated. First, the Principal Component Analy-sis was applied in order to determine the factor structure of the scale and the Varimax Rotated Component Matrix analysis was used to identify whether the items of the scale are separated into independent factors (sub-dimensions). The Kaiser Normalization Procedure was also applied to ease the interpretation of the identified factors. The fol-lowing table illustrates the total variance values of the factor analysis done by means of the Varimax Rotated technique.
Table 1. Eigenvalue and Total Variance Values Depending on the Results of the Factor Analysis By means of the Varimax Rotated Technique
EigenvaluePercentage of the Variance
Total Percentage
Factor I 20,711 22,512 22,512Factor II 7,452 8,1 30,612Factor III 5,889 6,401 37,013Factor IV 3,165 3,441 40,453
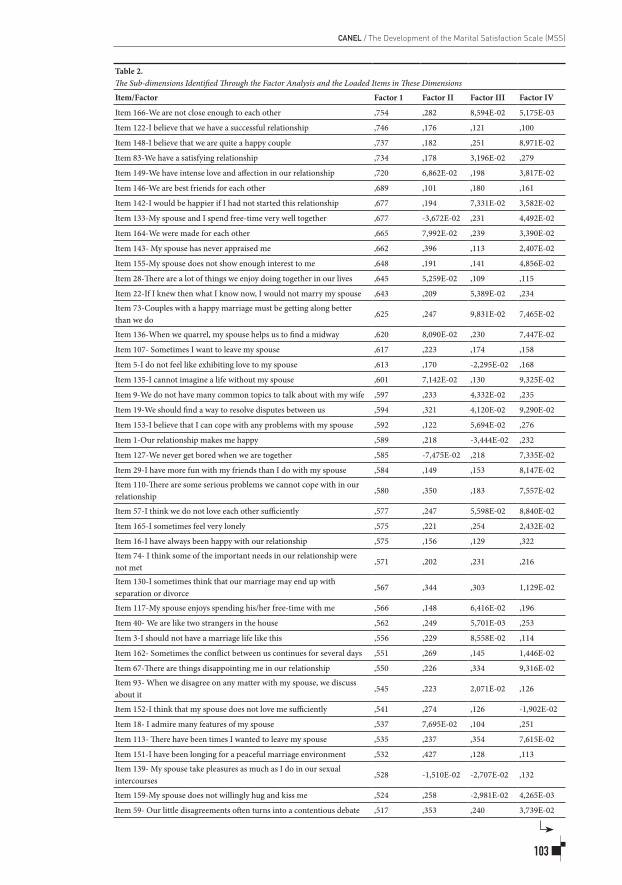
As can be realized, a total number of four factors were identified as a result of the factor analysis. These factors make up 40,453% of the total vari-ance. The amounts of variance justified by each factor are as follows: Factor 1 (20,711%), Factor 2 (7,452%), Factor 3 (5,889%) and Factor 4 (3,165%). The factor load values above .30 made up the base for the factor analysis (Büyüköztürk, 2005). Below is the table showing the sub-dimensions identified through the factor analysis and the loaded items in these dimensions.
As can be seen in the Table, the first factor consists
of 62 items, the second factor contains 14 items, the third factor has 11 items and the forth factor has 5 items. Considering the content of items in the first sub-dimension, it can be understood that the items cover the concept of marital harmony that is related to marital satisfaction. Marital harmony depends on the proper functioning of the relations-hip and the success of it. Besides, marital harmony is connected to issues like marital satisfaction and happiness in marriage. Concepts in the first factor, such as happiness, satisfaction, harmony, conflict, balancing tension and closeness to the spouse are directly related to marital harmony which is an important feature of marital satisfaction (Locke & Wallace, 1959; Orden & Bradburn, 1990; Yılmaz, 2001). Therefore, the factor analysis was applied to the first factor again so as to justify the strong association of 62 items in the same factor and to re-duce the question load in the first factor. The total variance values of the first factor done by means of the Varimax Rotated technique are presented in the following table.
Table 3. Eigenvalue and Total Variance Values Depending on the Results of the Factor Analysis Done for the First Sub-dimension By means of the Varimax Rotated Technique
EigenvaluePercentage of the Variance
Total Percentage
Factor I 12,469 20,111 20,111Factor II 7,655 12,347 32,459Factor III 7,511 12,115 44,574
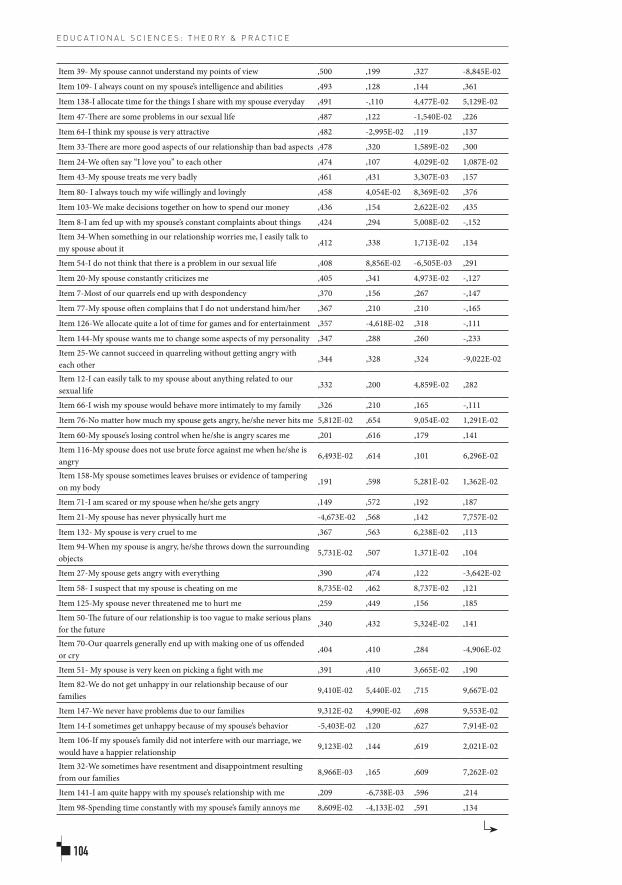
As can be realized from the table, as a result of the new factor analysis done to fully separate the first factor, three additional sub-dimensions were identified. These three new factors justify 44,574% of the total variance of the first factor. In the first sub-dimension of these three dimensions found as a result of the new factor analysis done for the first factor, there are 34 items (1, 3, 5, 9, 12, 16, 19, 22, 28, 29, 33, 34, 40, 43, 47, 54, 57, 73, 74, 80, 83, 93, 110,117, 122, 139, 142, 143, 151, 152, 153, 155, 159, 166). In the second sub-dimension, there are 14 items (7, 8, 20, 25, 39, 59, 66, 67, 77, 113, 130, 144, 162, 165) and there are 14 items (18, 24, 64, 109, 126, 127, 133, 135, 136, 138, 146, 148, 149, 164) in the third sub-dimension.
The total factor obtained through the factor analy-sis of the part of the MSS dealing with “understan-ding of parenting” is presented in the following table.
CANEL / The Development of the Marital Satisfaction Scale (MSS)
103
Table 2. The Sub-dimensions Identified Through the Factor Analysis and the Loaded Items in These Dimensions
Item/Factor Factor 1 Factor II Factor III Factor IV
Item 166-We are not close enough to each other ,754 ,282 8,594E-02 5,175E-03
Item 122-I believe that we have a successful relationship ,746 ,176 ,121 ,100
Item 148-I believe that we are quite a happy couple ,737 ,182 ,251 8,971E-02
Item 83-We have a satisfying relationship ,734 ,178 3,196E-02 ,279
Item 149-We have intense love and affection in our relationship ,720 6,862E-02 ,198 3,817E-02
Item 146-We are best friends for each other ,689 ,101 ,180 ,161
Item 142-I would be happier if I had not started this relationship ,677 ,194 7,331E-02 3,582E-02
Item 133-My spouse and I spend free-time very well together ,677 -3,672E-02 ,231 4,492E-02
Item 164-We were made for each other ,665 7,992E-02 ,239 3,390E-02
Item 143- My spouse has never appraised me ,662 ,396 ,113 2,407E-02
Item 155-My spouse does not show enough interest to me ,648 ,191 ,141 4,856E-02
Item 28-There are a lot of things we enjoy doing together in our lives ,645 5,259E-02 ,109 ,115
Item 22-If I knew then what I know now, I would not marry my spouse ,643 ,209 5,389E-02 ,234
Item 73-Couples with a happy marriage must be getting along better than we do
,625 ,247 9,831E-02 7,465E-02
Item 136-When we quarrel, my spouse helps us to find a midway ,620 8,090E-02 ,230 7,447E-02
Item 107- Sometimes I want to leave my spouse ,617 ,223 ,174 ,158
Item 5-I do not feel like exhibiting love to my spouse ,613 ,170 -2,295E-02 ,168
Item 135-I cannot imagine a life without my spouse ,601 7,142E-02 ,130 9,325E-02
Item 9-We do not have many common topics to talk about with my wife ,597 ,233 4,332E-02 ,235
Item 19-We should find a way to resolve disputes between us ,594 ,321 4,120E-02 9,290E-02
Item 153-I believe that I can cope with any problems with my spouse ,592 ,122 5,694E-02 ,276
Item 1-Our relationship makes me happy ,589 ,218 -3,444E-02 ,232
Item 127-We never get bored when we are together ,585 -7,475E-02 ,218 7,335E-02
Item 29-I have more fun with my friends than I do with my spouse ,584 ,149 ,153 8,147E-02
Item 110-There are some serious problems we cannot cope with in our relationship
,580 ,350 ,183 7,557E-02
Item 57-I think we do not love each other sufficiently ,577 ,247 5,598E-02 8,840E-02
Item 165-I sometimes feel very lonely ,575 ,221 ,254 2,432E-02
Item 16-I have always been happy with our relationship ,575 ,156 ,129 ,322
Item 74- I think some of the important needs in our relationship were not met
,571 ,202 ,231 ,216
Item 130-I sometimes think that our marriage may end up with separation or divorce
,567 ,344 ,303 1,129E-02
Item 117-My spouse enjoys spending his/her free-time with me ,566 ,148 6,416E-02 ,196
Item 40- We are like two strangers in the house ,562 ,249 5,701E-03 ,253
Item 3-I should not have a marriage life like this ,556 ,229 8,558E-02 ,114
Item 162- Sometimes the conflict between us continues for several days ,551 ,269 ,145 1,446E-02
Item 67-There are things disappointing me in our relationship ,550 ,226 ,334 9,316E-02
Item 93- When we disagree on any matter with my spouse, we discuss about it
,545 ,223 2,071E-02 ,126
Item 152-I think that my spouse does not love me sufficiently ,541 ,274 ,126 -1,902E-02
Item 18- I admire many features of my spouse ,537 7,695E-02 ,104 ,251
Item 113- There have been times I wanted to leave my spouse ,535 ,237 ,354 7,615E-02
Item 151-I have been longing for a peaceful marriage environment ,532 ,427 ,128 ,113
Item 139- My spouse take pleasures as much as I do in our sexual intercourses
,528 -1,510E-02 -2,707E-02 ,132
Item 159-My spouse does not willingly hug and kiss me ,524 ,258 -2,981E-02 4,265E-03
Item 59- Our little disagreements often turns into a contentious debate ,517 ,353 ,240 3,739E-02
E D U C A T I O N A L S C I E N C E S : T H E O R Y & P R A C T I C E
104
Item 39- My spouse cannot understand my points of view ,500 ,199 ,327 -8,845E-02
Item 109- I always count on my spouse’s intelligence and abilities ,493 ,128 ,144 ,361
Item 138-I allocate time for the things I share with my spouse everyday ,491 -,110 4,477E-02 5,129E-02
Item 47-There are some problems in our sexual life ,487 ,122 -1,540E-02 ,226
Item 64-I think my spouse is very attractive ,482 -2,995E-02 ,119 ,137
Item 33-There are more good aspects of our relationship than bad aspects ,478 ,320 1,589E-02 ,300
Item 24-We often say “I love you” to each other ,474 ,107 4,029E-02 1,087E-02
Item 43-My spouse treats me very badly ,461 ,431 3,307E-03 ,157
Item 80- I always touch my wife willingly and lovingly ,458 4,054E-02 8,369E-02 ,376
Item 103-We make decisions together on how to spend our money ,436 ,154 2,622E-02 ,435
Item 8-I am fed up with my spouse’s constant complaints about things ,424 ,294 5,008E-02 -,152
Item 34-When something in our relationship worries me, I easily talk to my spouse about it
,412 ,338 1,713E-02 ,134
Item 54-I do not think that there is a problem in our sexual life ,408 8,856E-02 -6,505E-03 ,291
Item 20-My spouse constantly criticizes me ,405 ,341 4,973E-02 -,127
Item 7-Most of our quarrels end up with despondency ,370 ,156 ,267 -,147
Item 77-My spouse often complains that I do not understand him/her ,367 ,210 ,210 -,165
Item 126-We allocate quite a lot of time for games and for entertainment ,357 -4,618E-02 ,318 -,111
Item 144-My spouse wants me to change some aspects of my personality ,347 ,288 ,260 -,233
Item 25-We cannot succeed in quarreling without getting angry with each other
,344 ,328 ,324 -9,022E-02
Item 12-I can easily talk to my spouse about anything related to our sexual life
,332 ,200 4,859E-02 ,282
Item 66-I wish my spouse would behave more intimately to my family ,326 ,210 ,165 -,111
Item 76-No matter how much my spouse gets angry, he/she never hits me 5,812E-02 ,654 9,054E-02 1,291E-02
Item 60-My spouse’s losing control when he/she is angry scares me ,201 ,616 ,179 ,141
Item 116-My spouse does not use brute force against me when he/she is angry
6,493E-02 ,614 ,101 6,296E-02
Item 158-My spouse sometimes leaves bruises or evidence of tampering on my body
,191 ,598 5,281E-02 1,362E-02
Item 71-I am scared or my spouse when he/she gets angry ,149 ,572 ,192 ,187
Item 21-My spouse has never physically hurt me -4,673E-02 ,568 ,142 7,757E-02
Item 132- My spouse is very cruel to me ,367 ,563 6,238E-02 ,113
Item 94-When my spouse is angry, he/she throws down the surrounding objects
5,731E-02 ,507 1,371E-02 ,104
Item 27-My spouse gets angry with everything ,390 ,474 ,122 -3,642E-02
Item 58- I suspect that my spouse is cheating on me 8,735E-02 ,462 8,737E-02 ,121
Item 125-My spouse never threatened me to hurt me ,259 ,449 ,156 ,185
Item 50-The future of our relationship is too vague to make serious plans for the future
,340 ,432 5,324E-02 ,141
Item 70-Our quarrels generally end up with making one of us offended or cry
,404 ,410 ,284 -4,906E-02
Item 51- My spouse is very keen on picking a fight with me ,391 ,410 3,665E-02 ,190
Item 82-We do not get unhappy in our relationship because of our families
9,410E-02 5,440E-02 ,715 9,667E-02
Item 147-We never have problems due to our families 9,312E-02 4,990E-02 ,698 9,553E-02
Item 14-I sometimes get unhappy because of my spouse’s behavior -5,403E-02 ,120 ,627 7,914E-02
Item 106-If my spouse’s family did not interfere with our marriage, we would have a happier relationship
9,123E-02 ,144 ,619 2,021E-02
Item 32-We sometimes have resentment and disappointment resulting from our families
8,966E-03 ,165 ,609 7,262E-02
Item 141-I am quite happy with my spouse’s relationship with me ,209 -6,738E-03 ,596 ,214
Item 98-Spending time constantly with my spouse’s family annoys me 8,609E-02 -4,133E-02 ,591 ,134

CANEL / The Development of the Marital Satisfaction Scale (MSS)
105
Table 4. Eigenvalue and Total Variance Values of the “Understanding of parenting” part of the MSS Depending on the Results of the Factor Analysis Done By means of the Varimax Rotated Technique
EigenvaluePercentage of the Variance
Total Percentage
Factor 1 4,352 48,35 48,35
As a result of the factor analysis of the “understan-ding of parenting” part of the MSS, items with a fac-tor load below 30 were excluded from the scale. A total factor was obtained on the basis of the rema-inder items. This factor justifies 48.35% of the total variance. The amount of the variance justified by the factor is 4,352%. As there was only one factor, the rotated total of the factor load was not necessary.
Table 5. Items in the “Understanding of Parenting” Part Identified as a Result of the Factor AnalysisItem 169-My spouse is a wonderful mother/father.
,777 5,600E-02
Item 181- My spouse does not show enough interest to children.
,768 2,149E-02
Item 167- We are in perfect harmony with each other in terms up raising our children.
,744 ,160
Item 182-We set rules about children together.
,732 ,102
Item 172-My spouse does not spend enough time with children.
,698 6,286E-02
Item 180-We have equal responsibility in raising our children.
,658 3,592E-02
Item 186-We usually agree on the manners we should teach our children.
,628 ,279
Item 175-My spouse generally expects me to take care of the children.
,513 ,115
Item 188- We do not experience conflicts in topics related to children.
,505 ,390
As a result of these operations, the scale had 101 items. The dimensions emerging at the end of the investigation of the items under each factor were given names. Therefore, the first dimension was called as “marital harmony” considering the defini-tion of this concept and the items that are generally connected to the concept of “marital harmony”. The first sub-scale under the first scale was called as the “relationship happiness”. The happiness in the relationship between spouses is a reflection of their marital harmony. The feeling of satisfaction with the marriage covers concepts like the spouses’ general feelings about marriage, their getting along well with each other, love, the amount of love, se-xual intercourse and the consensus with the spouse (Yılmaz, 2001). Under this sub-dimension, items deal with the general satisfaction of the spouses with the marriage, their confidence in the future of the relationship and their harmony of the spouses with each other. On the other hand, the second sub-scale of the first factor is called as “conflict”. Under this dimension, items about the intensity and the amount of the verbal conflicts, the presence of the problem-solving communication patterns between spouses, whether the spouses accept each other, the general disagreement and the lack of problem-sol-ving skills are included. The third sub-scale of the first factor is referred to as “closeness”. In this scale, items pertaining to the presence of the following concepts in the relationship are included: mutual love in the relationship, care, sympathy with the spouse, the pleasure of spending time together with the spouse and admiration for the spouse. Also, the issues related to whether a friendly communication can be promoted in the relationship and whether there is a common interest in the marriage are re-vealed through the items in this scale.
The second dimension of the test is referred to as “anger”. With its items, this scale aims to reveal ca-ses of violence in the relationship, the physical or emotional violence and abuse as well as the emo-tional anger that spouses exhibit to each other. The
Item 129- My spouse is very much under the influence of his/her family ,136 ,137 ,568 -7,711E-02
Item 90-I have difficulty in sticking to some of the traditions and customs of my spouse’s family
1,943E-02 ,141 ,463 8,298E-02
Item 121-My spouse cannot stand hearing criticism about his/her family ,223 ,126 ,463 -1,380E-02
Item 56-I think that I may get divorced because of my spouse’s family ,163 6,022E-02 ,451 4,293E-02
Item 62-I completely trust my spouse about money ,181 6,327E-02 7,810E-02 ,665
Item 11-My spouse manages our budget very well ,113 4,260E-02 5,656E-02 ,653
Item 36- I trust my spouse about everything ,326 ,150 ,203 ,525
Item 96-My spouse never gives up spending more money than we earn ,163 ,251 7,473E-02 ,470
Item 134-I got fed up with my spouse’s credit card debts 4,662E-02 ,176 ,194 ,395

E D U C A T I O N A L S C I E N C E S : T H E O R Y & P R A C T I C E
106
third dimension of the scale is called as “commu-nication with the spouse’s family”. This dimension includes items aiming to reveal the disagreements and disputes arising from the spouse’s family and its negative influences on the marital relationship. The fourth dimension of the scale is called as “eco-nomic understanding”. This dimension contains items related to the disputes arising from financial issues, concerns about family budget, the distrust in the spouse in terms of financial issues and the disputes stemming from all these issues. The fifth dimension of the test is called as “understanding of parenting”. This dimension that is only respon-ded to by married couples with children includes items aiming to investigate disputes with the spo-use in terms of child-rearing, whether the spouse is taking enough responsibilities to raise children, whether he/she has quality communication with children, disagreement with the spouse in terms of discipline methods and the reflections of all these issues on the marriage. The sub-scales emerging throughout the statistical operations overlap with the sub-dimensions of the concept of marital satis-faction as reviewed in the literature (Bradbury et al., 2000; Carrano et al., 2003; Chapin et al., 2001; Corcoran & Fischer, 2000; Locke & Wallace, 1959; Roach et al., 1981; Snyder, 1997; Spanier, 1976; Tzeng, 1993; Yılmaz, 2001). As a result, the scale was called as the “Marital Satisfaction Scale” as it consists of an item structure dealing with the featu-res of marital satisfaction in line with the relevant literature.
As the scale aims to reveal the negative perspectives of the individual about the marital satisfaction, the high score obtained from the scale is an indicati-on of marital dissatisfaction. Conversely, the low scores obtained from the scale shows the presence of the marital satisfaction. The positively worded answers are assessed as 1 point while the positi-vely worded statements are scored as 0. During the scoring of the scale, in addition to the scores ob-tained from the scale as a whole, separate scoring was done for each sub-scale. Therefore, the sub-dimensions with the highest score show the obvi-ous problem areas of the individual about his/her marital relationship. The total score obtained from the scale, on the other hand, gives information abo-ut the individual’s general marital satisfaction level.
Item Analysis
So as to determine how representative a group of items are in the assessment of the structure it intended to assess, the corrected item-total corre-
lation can be applied for each item in this group. The item-total, remainder item and item discri-mination are values giving information about the reliability and the validity of the items in the scale. The item-total shows the relationship between the total scores obtained from the test and each of the items in the test. The remainder item shows the relationship between each of the items in the test and the result found by subtracting the item from the sum. The item-total and the remainder item coefficients should not be below .25 and they are expected to be statistically significant at the level of p<0.05 (Balcı, 1997; Tekin, 1993; Tekindal, 1997; Tezbaşaran, 1996). In this research study, the Point Biserial Correlation technique was applied in the calculation of the item-total because a two vari-ables (1-0) scoring system was used. On the other hand, discrimination refers to the scores obtained through the independent samples t-test compari-son of high and low quarters (27%) of the scores obtained by the participants in the study. Whether the answers to an item cause a difference between low and high groups shows the power of discrimi-nation of the item (Tezbaşaran). The independent samples t-test was used to determine whether the-re is a significant relationship between item scores and total scores of high and low groups. The values of the item-total correlation of the MSS are presen-ted in the following table:
Table 6. Item-total The Item-Total Correlation of the MSS as a Whole and the Results of Discrimination Analysis
Item NoItem-total
Remainder Item
Item discrimination
r p r p sd t p
Item 001 ,598 p<0.01 ,9698 p<0.01 182 6,636 P<0.01Item 003 ,599 p<0.01 ,9698 p<0.01 182 11,077 P<0.01Item 005 ,584 p<0.01 ,9698 p<0.01 182 7,304 P<0.01Item 007 ,441 p<0.01 ,9701 p<0.01 182 10,974 P<0.01Item 008 ,461 p<0.01 ,9700 p<0.01 182 8,6 P<0.01Item 009 ,640 p<0.01 ,9697 p<0.01 182 10,408 P<0.01Item 011 ,276 p<0.01 ,9704 p<0.01 182 3,873 P<0.01Item 012 ,435 p<0.01 ,9700 p<0.01 182 6,921 P<0.01Item 014 ,252 p<0.01 ,9705 p<0.01 182 5,762 P<0.01Item 016 ,641 p<0.01 ,9697 p<0.01 182 13,381 P<0.01Item 018 ,567 p<0.01 ,9698 p<0.01 182 11,627 P<0.01Item 019 ,643 p<0.01 ,9697 p<0.01 182 11,631 P<0.01Item 020 ,466 p<0.01 ,9700 p<0.01 182 7,816 P<0.01Item 021 ,268 p<0.01 ,9703 p<0.01 182 4,615 P<0.01Item 022 ,667 p<0.01 ,9696 p<0.01 182 12,459 P<0.01Item 024 ,462 p<0.01 ,9700 p<0.01 182 12,168 P<0.01Item 025 ,520 p<0.01 ,9699 p<0.01 182 13,216 P<0.01Item 027 ,546 p<0.01 ,9699 p<0.01 182 10,211 P<0.01Item 028 ,610 p<0.01 ,9697 p<0.01 182 10,211 P<0.01

CANEL / The Development of the Marital Satisfaction Scale (MSS)
107
Item 029 ,605 p<0.01 ,9697 p<0.01 182 11,088 P<0.01Item 032 ,314 p<0.01 ,9704 p<0.01 182 7,335 P<0.01Item 033 ,580 p<0.01 ,9698 p<0.01 182 7,649 P<0.01Item 034 ,513 p<0.01 ,9699 p<0.01 182 8,183 P<0.01Item 036 ,508 p<0.01 ,9699 p<0.01 182 7,503 P<0.01Item 039 ,593 p<0.01 ,9698 p<0.01 182 18,263 P<0.01Item 040 ,604 p<0.01 ,9698 p<0.01 182 7,475 P<0.01Item 043 ,574 p<0.01 ,9699 p<0.01 182 5,936 P<0.01Item 047 ,494 p<0.01 ,9699 p<0.01 182 7,687 P<0.01Item 050 ,492 p<0.01 ,9700 p<0.01 182 5,914 P<0.01Item 051 ,532 p<0.01 ,9699 p<0.01 182 6,099 P<0.01Item 054 ,435 p<0.01 ,9701 p<0.01 182 6,607 P<0.01Item 056 ,320 p<0.01 ,9702 p<0.01 182 5,448 P<0.01Item 057 ,603 p<0.01 ,9698 p<0.01 182 9,767 P<0.01Item 058 ,613 p<0.01 ,9702 p<0.01 182 3,044 P<0.05Item 059 ,655 p<0.01 ,9697 p<0.01 182 13,714 P<0.01Item 060 ,513 p<0.01 ,9699 p<0.01 182 9,964 P<0.01Item 062 ,328 p<0.01 ,9702 p<0.01 182 5,241 P<0.01Item 064 ,462 p<0.01 ,9700 p<0.01 182 11,727 P<0.01Item 066 ,397 p<0.01 ,9702 p<0.01 182 8,832 P<0.01Item 067 ,676 p<0.01 ,9696 p<0.01 182 21,143 P<0.01Item 070 ,588 p<0.01 ,9698 p<0.01 182 12,876 P<0.01Item 071 ,464 p<0.01 ,9700 p<0.01 182 7,094 P<0.01Item 073 ,656 p<0.01 ,9696 p<0.01 182 12,672 P<0.01Item 074 ,669 p<0.01 ,9696 p<0.01 182 15,035 P<0.01Item 076 ,353 p<0.01 ,9702 p<0.01 182 4,861 P<0.01Item 077 ,438 p<0.01 ,9701 p<0.01 182 11,088 P<0.01Item 080 ,498 p<0.01 ,9699 p<0.01 182 6,833 P<0.01Item 082 ,380 p<0.01 ,9702 p<0.01 182 8,929 P<0.01Item 083 ,732 p<0.01 ,9696 p<0.01 182 11,898 P<0.01Item 090 ,257 p<0.01 ,9703 p<0.01 182 5,307 P<0.01Item 093 ,567 p<0.01 ,9698 p<0.01 182 9,166 P<0.01Item 094 ,291 p<0.01 ,9702 p<0.01 182 4,632 P<0.01Item 096 ,359 p<0.01 ,9701 p<0.01 182 5,091 P<0.01Item 098 ,291 p<0.01 ,9703 p<0.01 182 5,805 P<0.01Item 106 ,353 p<0.01 ,9702 p<0.01 182 8,367 P<0.01Item 109 ,581 p<0.01 ,9698 p<0.01 182 9,071 P<0.01Item 110 ,687 p<0.01 ,9696 p<0.01 182 15,617 P<0.01Item 113 ,666 p<0.01 ,9696 p<0.01 182 17,11 P<0.01Item 116 ,355 p<0.01 ,9701 p<0.01 182 5,448 P<0.01Item 117 ,588 p<0.01 ,9698 p<0.01 182 9,767 P<0.01Item 121 ,403 p<0.01 ,9702 p<0.01 182 8,652 P<0.01Item 122 ,736 p<0.01 ,9696 p<0.01 182 12,174 P<0.01Item 125 ,486 p<0.01 ,9700 p<0.01 182 7,475 P<0.01Item 126 ,385 p<0.01 ,9702 p<0.01 182 8,928 P<0.01Item 127 ,548 p<0.01 ,9699 p<0.01 182 12,231 P<0.01Item 129 ,351 p<0.01 ,9702 p<0.01 182 7,286 P<0.01Item 130 ,703 p<0.01 ,9696 p<0.01 182 17,54 P<0.01Item 132 ,566 p<0.01 ,9699 p<0.01 182 6,762 P<0.01Item 133 ,636 p<0.01 ,9697 p<0.01 182 17,491 P<0.01Item 134 ,260 p<0.01 ,9703 p<0.01 182 3,925 P<0.01Item 135 ,583 p<0.01 ,9698 p<0.01 182 12,074 P<0.01Item 136 ,640 p<0.01 ,9697 p<0.01 182 18,374 P<0.01Item 138 ,396 p<0.01 ,9702 p<0.01 182 6,994 P<0.01
Item 139 ,447 p<0.01 ,9700 p<0.01 182 6,8 P<0.01Item 141 ,426 p<0.01 ,9701 p<0.01 182 8,929 P<0.01Item 142 ,653 p<0.01 ,9697 p<0.01 182 12,174 P<0.01Item 143 ,734 p<0.01 ,9695 p<0.01 182 12,256 P<0.01Item 144 ,456 p<0.01 ,9701 p<0.01 182 10,276 P<0.01Item 146 ,698 p<0.01 ,9696 p<0.01 182 13,714 P<0.01Item 147 ,372 p<0.01 ,9702 p<0.01 182 9,247 P<0.01Item 148 ,777 p<0.01 ,9694 p<0.01 182 24,631 P<0.01Item 149 ,688 p<0.01 ,9696 p<0.01 182 15,836 P<0.01Item 151 ,665 p<0.01 ,9696 p<0.01 182 12,508 P<0.01Item 152 ,587 p<0.01 ,9698 p<0.01 182 9,334 P<0.01Item 153 ,607 p<0.01 ,9698 p<0.01 182 8,936 P<0.01Item 155 ,658 p<0.01 ,9697 p<0.01 182 11,696 P<0.01Item 158 ,413 p<0.01 ,9701 p<0.01 182 4,377 P<0.01Item 159 ,520 p<0.01 ,9699 p<0.01 182 6,762 P<0.01Item 162 ,610 p<0.01 ,9697 p<0.01 182 12,856 P<0.01Item 164 ,672 p<0.01 ,9696 p<0.01 182 23,246 P<0.01Item 165 ,657 p<0.01 ,9696 p<0.01 182 18,083 P<0.01Item 166 ,755 p<0.01 ,9695 p<0.01 182 16,057 P<0.01
As a result of the item analysis, it was realized that the item-total test correlations of the scales range from .25 to .77 and the t-values determined on the basis of the differences of the item scores of the 27% upper and lower groups were found to be between 3,04 (p<0.05) and 24.63 (p<.001). Significant re-sults were obtained at the expected level.
The following table presents the item-total correla-tions and discriminant analysis of the second part of the test responded to only by married couples with children.
Table 7. The Item-total Correlations and Discriminant Analysis of the “Understanding of Parenting” Part of the MSS
Item No
Item TotalItem Remaining
Item Discrimination
r p r p sd t p
Item 167
,758 P<0.01 ,6702 p<0.01 144 20,145 P<0.01
Item 169
,766 P<0.01 ,6779 p<0.01 144 16,685 P<0.01
Item 172
,699 P<0.01 ,5872 p<0.01 144 15,401 P<0.01
Item 175
,597 P<0.01 ,4364 p<0.01 144 24,187 P<0.01
Item 180
,653 P<0.01 ,5429 p<0.01 144 9,605 P<0.01
Item 181
,746 P<0.01 ,6427 p<0.01 144 10,757 P<0.01
Item 182
,728 P<0.01 ,6314 p<0.01 144 12,919 P<0.01
Item 186
,669 P<0.01 ,5849 p<0.01 144 9,605 P<0.01
Item 188
,609 P<0.01 ,5282 p<0.01 144 14,832 P<0.01
***p<.001.

E D U C A T I O N A L S C I E N C E S : T H E O R Y & P R A C T I C E
108
As a result of the item analysis, it was realized that the item-total test correlations of the scales range .59 to .76. The t values determined on the basis of the differences of the item scores of the 27% upper and lower groups were found to be between 9,60 (p<0.01) and 24.18 (p<.001). Significant results were obtained at the expected level.
The first sub-dimension of the Marital Satisfaction Scale including 62 items were responded by 341 in-dividuals and the average of the arithmetic means of their scores is 16,48 while the standard deviation is 15,81. The arithmetic means of the first sub-scale (relationship happiness) of the first sub-dimension of the scale including 24 items is 6,63 and the standard deviation is 8,63. The second sub-scale (conflict) of the first sub-dimension including 14 items has an arithmetic means of 4,85 and a stan-dard deviation of 4,14. The third sub-scale (close-ness) of the first sub-dimension includes 14 items and has a arithmetic means of 4,99 and a standard deviation of 4,37. Containing 14 items, the second sub-dimension (anger) of the scale has an arithme-tic means of 2,03 and a standard deviation of 2,87. The third sub-dimension (communication with the spouse’s family) consisting of 11 items has an arith-metic means of 3,63 and a standard deviation of 3,06. Including five items, the forth sub-dimension (economic understanding) has an arithmetic me-ans of 1,00 and a standard deviation of 1,37. Fi-nally, the fifth sub-dimension (understanding of parenting) containing 9 items has an arithmetic means of 2,60 and a standard deviation of 2,74.
In addition, as a result of the Pearson Product Mo-
ment Correlation Analysis applied to reveal whet-her there is a significant relationship among the sub-dimensions of the MSS, it was realized that the relationship among all the dimensions were positi-ve and statistically meaningful. The relevant table showing the results of the analysis is below.
Validity of the Scale
In order to reveal the criterion validity of the sca-le, the correlation between the Problem Solving Inventory (PSI) and the Coping with Stress Scale (CSS) was investigated and the results of the corre-lation study are presented in the table below.
As can be realized from the table, the total scores of the MSS were found to be in a reverse and sig-nificant relationship with the first sub-dimension (hasty approach) and the third sub-dimension (avoidant approach) of the Problem Solving In-ventory (PSI). Similarly, there is also a reversely significant relation at the level of p<0.01 between the first factor of the MSS (marital harmony), the -1 sub-scale (relationship happiness) of the first factor of the MSS, the -2 sub-scale (conflict) of the first factor, the third factor (communication with the spouse’s family) of the MSS and the PSI’s first sub-dimension (hasty approach), its third sub-dimension (avoidant approach). Also, it was fo-und that the third sub-scale (closeness) of the first factor of the MSS are reversely and significantly related at the level of p<0.01 to the first (hasty approach) and the third sub-dimension (avoidant approach) of the PSI. The relationship between the third sub-scale of the first factor of the MSS and
Table 8. Correlative Relationships among MSS’s Sub-dimensions
Sub-dimension of the MSS
MSS1 (Marital harmony)
MSS1-1 (Relationship happiness)
EDÖ1-2 (Conflict)
EDÖ1-3 (Closeness)
EDÖ2 (Anger)
EDÖ3 (Communication with the spouse’s family )
EDÖ4 (Economic Understanding)
MSS1 (Marital Harmony)
,962 ,870 ,893 ,655 ,403 ,434
MSS1-1 (Relationship Happiness)
,756 ,789 ,636 ,342 ,440
MSS1-2 (Conflict) ,707 ,647 ,446 ,345MSS1-3 (Closeness) ,500 ,359 ,376MSS2 (Anger) ,361 ,360MSS3 (Communication with the spouse’s family)
,232
EDÖ4 (Economic Understanding)N=341 ; p<0.01

CANEL / The Development of the Marital Satisfaction Scale (MSS)
109
the fifth sub-dimension (self-confident) approach of the PSI were found to be linear at the level of p<0.05. The second factor of the MSS (anger) is reversely and significantly related to the PSI’s total score at the level of p<0.05. Also, a reversely signi-ficant relationship was found at the level of p<0.01 between the PSI’s first sub-dimension (hasty app-roach) and the third sub-dimension (avoidant app-roach). On the other hand, a reversely significant relationship at the level of p<0.01 was found betwe-en the fifth factor (parenting approach) of the MSS and the third sub-dimension (avoidant approach)
of the PSI. A linear significant relationship at the level of p<0.05 was found between the fifth factor of the MSS and the forth sub-dimension (evalua-tive approach) was found. However, a significant relationship could not be found between the MSS’s forth factor (economic understanding) and any of the sub-dimensions of the PSI.
For the criterion validity of the scale, the Pearson’s correlation analysis between the MSS and the CSS was calculated and the results are presented in the following table:
Table 9. The Results of the Pearson Correlation Analysis between PSI and the CSS
PSITotal
PSI 1.Sub-dimension
PSI 2. Sub-dimension
PSI 3. Sub-dimension
PSI 4. Sub-dimension
PSI 5. Sub-dimension
PSI 6. Sub-dimension
MSS Total -,106 -,285** ,137 -,327** ,061 -,120 ,121
MSS 1.Factor-,078 -,289** ,150 -,310** ,083 ,159 ,132
MSS 1. Factor 1.Sub-scale
-,102 -,281** ,146 -,305** ,038 ,113 ,118
MSS 1. Factor 2.Sub-scale
-,057 -,270** ,140 -,296** ,102 ,166 ,095
MSS 1. Factor 3.Sub-scale
-,026 -,261** ,144 -,273** ,144 ,216* ,121
MSS 2. Factor -,178* -,241** ,027 -,243** -,044 -,005 ,048
MSS 3. Factor ,-151 -,244** ,084 -,286** -,003 ,003 ,088
MSS 4. Factor-,108 -,116 ,024 -,072 -,106 ,005 -,066
MSS 5. Factor -,041 -,168 ,157 -,370** ,137** ,101 ,143
n: 123 ; *p<0.05 ; **p<0.01 Note: The high scores obtained from the MSS correspond to low marital satisfaction while the high scores obtained from the PSI correspond to a low level of problem solving ability
Table 10. The Results of the Pearson’s Correlation Analysis between the MSS and the CSS
CSS1.Factor
CSS2. Factor
CSS3. Factor
CSS4. Factor
CSS5. Factor
MSS Total -,357** -,013 ,385** ,435** -,432**MSS 1. Factor -,345** -,036 ,367** ,450** -,406**MSS 1. Factor 1. Sub-scale -,305** -,055 ,325** ,468** -,373**MSS 1. Factor 2. Sub-Scale -,345** -,039 ,373** ,363** -,367**MSS 1. Factor 3. Sub-Scale -,348** ,013 ,365** ,403** -,417**MSS 2. Factor -,246** -,043 ,364** ,372** -,339**MSS 3. Factor -,332** ,078 ,339** ,314** -,473**MSS 4. Factor -,228* -,061 ,057 ,194* -,158MSS 5. Factor -,292** ,077 ,357** ,257** -,360**n: 123 ; *: p<0.05 ; **:p<0.01Note: The high scores obtained from the MSS correspond to low marital satisfaction while the high scores obtained from the CSS correspond to a high level of stress-coping skill

E D U C A T I O N A L S C I E N C E S : T H E O R Y & P R A C T I C E
110
As can be realized from the table above, there is a reverse significant relationship at the level of p<0.01 between all the sub-dimensions of the factors ex-cept for the fourth factor of MSS and the CSS’s first sub-dimension (optimistic approach) and the fifth sub-dimension (self-confident approach). There is also a linear significant relationship at the level of p<0.01 between the factors of the MSS and the third sub-dimension (desperate approach) as well as the forth sub-dimension (submissive approach) of the CSS. A reverse significant relationship at the level of p<0.05 was found between the MSS’s forth factor (economic understanding) and the CSS’s first sub-dimension (optimistic approach) while the relationship between the same factor of the MSS and the forth sub-dimension of the CSS (sub-missive approach) was found to be linearly signifi-cant at the level of p<0.05. However, no significant relationship was found between any of the factors of the MSS and the second sub-dimension (searc-hing social support) of the CSS.
Reliability of the Scale
In this research study, the reliability of the Marital Satisfaction Scale was investigated by means of the calculation of internal consistency coefficients of the sub-dimensions of the scale as well as the test-retest techniques. The internal consistency of the MSS was calculated for the scale as a whole and for each sub-scale separately. The results of the internal consistency of the scale were generally found to be very high, which can be considered as an important indicator of the reliability of the scale. The results were found to be significant at the level of p<.001.
Table 11. Internal Consistency Values of the Marital Satisfaction ScaleFactor Names: Cronbach αThe general sum of the test .97The general sum of the first factor: “marital harmony”
.97
The first sub-dimension of the first factor: “relationship happiness”
.95
The second sub-dimension of the first factor: “conflict”
.88
The third sub-dimension of the first factor: “closeness”
.90
The second factor: “anger” .85The third factor: “communication with the spouse’s family”
.84
The forth factor: “economic understanding” .73The fifth factor: “understanding of parenting” .86
The following table presents the internal consis-tency coefficients of the test as a whole:
Table 12. The Internal Consistency Coefficients of the MSS as a Whole
NInternal consistency coefficient
p
Cronbach a 341 .9702 p<0.01
Spearman Brown 341 .9409 p<0.01
Guttman 341 .9394 p<0.01
As can be realized from the table, the maximum internal consistency of the test was found through the Cronbach α technique (.97). The minimum internal consistency, on the other hand, was cal-culated by means of the Guttman technique (.93). The fact that the internal consistency of this test was above .90 shows that the test was perfectly re-liable. The alpha coefficient of the first half of the two halves appearing in the process of calculating the Guttman and Spearman values was found to be .93 and the alpha coefficient of the second group was .94. Therefore, it would be true to state that the MSS had a perfect reliability level. The internal consistency coefficients of the “understanding of parenting” part of the scale responded only mar-ried couples with children were presented in the following table:
Table 13.The internal consistency coefficients of the “understanding of parenting” part of MSS
NThe internal consistency coefficient
p
Cronbach a 270 .8605 P<0.01
Spearman Brown
270 .8253 P<0.01
Guttman 270 .8101 P<0.01
As can be realized from the table, the maximum internal consistency of the test was calculated through the Cronbach α technique (.86). The mini-mum internal consistency, on the other hand, was found by means of the Guttman technique (.81). The internal consistency of the second part of the scale dealing with “understanding of parenting” responded only by married couples with children was found to be between .86 and .81. The alpha coefficient of the first half of the two halves appea-ring in the process of calculating the Guttman and Spearman values was found to be .83 and the alpha coefficient of the second group was .66. In this re-

CANEL / The Development of the Marital Satisfaction Scale (MSS)
111
gard, the second part of the test can be regarded as reliable enough.
Another important point in terms of reliability is the test-retest reliability of the scale. The following table illustrates the results of the test-retest reliabi-lity of the test.
The results of the Pearson Product Moment Cor-relation Analysis done to determine the Test-retest reliability is as follows:
Table 15. The Results of the Pearson Product Moment Correlation Analysis Done to Determine the Test-retest Reliability
GROUP N r p
Pair 1 O1 & S1 40 0,986 0,000
Pair 2 O2 & S2 40 0,992 0,000
Pair 3 O3 & S3 40 0,961 0,000
Pair 4 O4 & S4 40 0,972 0,000
Pair 5 O5 & S5 40 0,984 0,000
Pair 6 O6 & S6 40 0,979 0,000
Pair 7 O7 & S7 40 0,971 0,000
Pair 8 O8 & S8 40 0,910 0,000
Pair 9 O9 & S9 40 0,989 0,000
p<.05
As can be realized from the tables, the form was administered to the group (N=40) twice in 15-day intervals in order to determine the test-retest reli-ability of the scale. For that reason, the dependent samples t-test and Pearson product moment cor-relation analysis were applied. As a result of the dependent samples t-test, no statistically signifi-cant differences between the means of two of the applications were found for each item (p>.05). On the other hand, the Pearson Product Moment Cor-relation Analysis revealed a statistically significant relationship (p<.05) in each item between two of the applications at different times.
Discussion
In this study, the main objective was to develop a scale assessing couples’ marital satisfaction and to investigate the reliability and validity of the Marital Satisfaction Scale developed for this purpose.
In order to identify the factor structure of the scale, the factor analysis was applied and five factors were identified. The first four factors of the scale justi-fied 40,453% of the total variance. The part of the scale dealing with the ideas of the married couples regarding the influence of children on their marri-
Table 14. The Results of the Paired Samples T-test Done for the Test-retest Reliability
Group x n SS Shx
t sd p
Pair 1 O1 21,55 40 22,9915 3,635288 -1,012 39 0,317
S1 22,2 40 24,2690 3,837267 39
Pair 2 O2 5,2 40 8,35801 1,321518 -0,947 39 0,349
S2 5,35 40 8,33451 1,317802 39
Pair 3 O3 4,675 40 3,99607 0,631834 -1,220 39 0,229
S3 4,9 40 4,21718 0,666795 39
Pair 4 O4 3,1 40 4,23538 0,669673 -1,069 39 0,291
S4 3,275 40 4,42016 0,698889 39
Pair 5 O5 12,975 40 15,8008 2,49833 -1,321 39 0,194
S5 13,575 40 16,4393 2,599282 39
Pair 6 O6 2,525 40 3,13775 0,496123 -0,442 39 0,660
S6 2,575 40 3,39598 0,536952 39
Pair 7 O7 3,825 40 2,96896 0,469434 -0,442 39 0,660
S7 3,875 40 2,97155 0,469844 39
Pair 8 O8 0,85 40 1,31168 0,207395 0,572 39 0,570
S8 0,8 40 1,30482 0,206311 39
Pair 9 O9 1,375 40 2,64756 0,418617 0,000 39 1,000
S9 1,375 40 2,53880 0,40142 39
p>.05

E D U C A T I O N A L S C I E N C E S : T H E O R Y & P R A C T I C E
112
ages was assessed separately and was found to be explanatory of the 48.35% of the total variance. The variance justified by the factor was 4,352%. During the scoring of the scale, in addition to the total sco-re obtained from the scale, scoring is done sepa-rately for each sub-dimension. Therefore, the sub-dimensions with the highest scores reveal the most distinctive problem areas in the relationship of the individual. On the other hand, the total score ob-tained from the scale gives information about the general marital satisfaction level of the individual.
The first factor of the scale shows the individual’s “marital harmony”. The amount of the variance justified by the factor is 20,71%. The total score of the “marital harmony” factor is a sub-dimension indicating the individual’s satisfaction with his/her relationship and harmony with his/her spouse. It is scored on the basis of the “relationship hap-piness”, “conflict” and “closeness” sub-dimensions. Concepts in the first factor, such as happiness, sa-tisfaction, harmony, conflict, closeness to the spo-use and balancing the tensions are all related to the marital harmony that has a direct influence on marital satisfaction (Locke & Wallace, 1959; Or-den & Bradburn, 1990; Yılmaz, 2001). These three sub-scales justifies 44,57% of the total variance of the first factor. The “relationship happiness” sub-scale explains 12,46% of the total variance of the first factor and assesses individual’s content with his/her spouse and the relationship, the satisfac-tion with the relationship, the mutual interacti-on with the spouse and the satisfaction with the sexual relationship in the marriage. The concept of the marital harmony refers to the satisfaction and the happiness in the marriage as a result of the harmonious togetherness of the couples (Erbek, Beştepe, Akar, Eradamlar, & Alpkan, 2005). Con-sidering the relevant literature, it could be stated that the harmony between couples is comprised of five separate parts: Happiness with the spouses, interaction, conflicts, problems and the tendency to divorce (Yılmaz, 2001). This finding confers with the “marital harmony” sub-scale of the scale. Thus, it can be stated that the “conflict” sub-scale justifying 7,65% of the total variance of the first factor assesses issues like problems and quarrels in the relationship, problem-solving communi-cation, disputes with the spouse, deficiencies in getting the mutual feelings across, thoughts of separation and divorce in the relationship. Anot-her factor in the literature considered to be closely related to the marital harmony is the closeness to the spouse that is very important in marriages (Spanier, 1976). The “closeness” sub-scale justif-
ying 7,511% of the total variance of the first factor is a scale providing information about the amo-unt of love between couples. The items reveal the marital dissatisfaction arising from the amount of love and understanding between couples, emoti-onal friendship and understanding in the relati-onship, friendship between the couples and the lack of shared time and activities. These sub-scales are parallel with other scales relevant to marital satisfaction in the literature. For instance, similar to the sub-scales of this study, Dyadic Adjustment Scale (DAS) which is one of the most commonly used scales developed by Spanier in 1976 also inc-ludes sub-dimensions like the agreement between the couples, couple satisfaction, expressions of support and love (Graham, Liu, & Jeziorski, 2006; Spanier). Another example showing the paralle-lism between the dimensions of the current sca-le and other scales is the Locke-Wallace Marital Adjustment Test (LWMAT) which is another very commonly used scale developed by Locke-Wallace in 1959. This scale containing sub-scales focusing on the happiness with the couple togetherness, partner disagreements and conflicts, how leisure time is spent by the couples and closeness to the spouse is compatible with the sub-scales dealing with the “marital harmony” in the Marital Satis-faction Scale (Locke & Wallace, 1959).
The second factor of the scale is the “anger” sub-dimension. The amount of variance justified by the factor is 7,45%. This factor shows the presence of severe conflicts and physical violence by the spo-use. It assesses the dimensions of physical violence like being physically offended by the spouse and being shoved by the spouse. Many longitudinal studies carried out in recent years have proved that the hostile behaviors against the spouse play a key role in harming the marriages (Roberts, 2000). Ac-cording to the results of different research studies, the increasing level of marital dissatisfaction is sig-nificantly related to the increasing frequency of the violence cases (Bradbury et al., 2000; Bray, 1995; Byrne & Arias, 1997; Stith, Green, Smith, & Ward, 2008). Also, one of the most important reasons of depression and divorce is considered to be the vi-olent behavior in marriages. Like other reviewed scales containing sub-dimensions, items and ques-tions dealing with the presence of violence in the marriage, the Marital Satisfaction Scale includes items about violence in the marriage that is tho-ught to be one of the reasons of marriage dissatis-faction (Corcoran & Fischer, 2000; Sierra, Monge, Santos-Iglesias, Bermudez, & Salinas, 2011).

CANEL / The Development of the Marital Satisfaction Scale (MSS)
113
The third factor of the scale, “communication with the spouse’s family” is a sub-dimension unique to the local context of the Turkish culture and it jus-tifies 5,88% of the total variance. This part of the scale focuses on the major problems of the marri-ages in our country stemming from the members of the spouse’s family (e.g., mother-in-law, father-in-law, relatives). The uneasiness and the quarrels stemming from the influence of the spouse’s family on the couple’s relationship are related to the ma-rital dissatisfaction. According to the data relea-sed by the Prime Ministry General Directorate of Family and Social Research in 2006, 15,6% of the women and 13,4% of the men think that the reason of divorce is the husband’s not getting along with his wife’s family. Similarly, 13,8% of the women and 12% of the men hold the idea that wife’s not getting along with her husband’s family is a reason for di-vorce. According to the results of the relevant stu-dies carried out in Asian countries, the most pres-sing problem of married women in Asian countries like China, Tiwan, Japan, Korea, Malesia, and India is the power conflicts with their mother-in-laws. This fact also applies to immigrant Muslims living in non-Muslim countries. Therefore, this factor is viewed as a factor decreasing the level of marital satisfaction (Al-Johar, 2005; Huang, 2005).
The forth factor of the scale is “economic unders-tanding” assessing the reflections of the problems arising from financial matters on the marriages, and it justifies 3,16% of the total variance. With this part of the scale, the disagreement between co-uple in terms of monetary issues, the lack of trust in the spouse as for financial matters and the prob-lems in the management of the family budget are assessed. Parallel to the poverty in the family, the interfamily roles and relationships change and the harmony between couples deteriorate; moreover, poverty might even result in divorce (Günindi-Ersöz, 2003). Kerkmann, Lee, Lown, and Allgood (2000) found that the way money is managed in the family, the perception about whether or not the spouse can manage the family budget well, whether the family is in financial difficulty and the scope of this financial difficulty are all closely related to the couple’s marital satisfaction. Moreover, stu-dies conducted in recent years have revealed that the growing economic crises negatively affect the relationship between couples (Atwood, 2012). The items in the Marital Satisfaction Scale show paral-lelism with other scales in that these items cover problems arising from the financial relationship between the couples (Snyder, 1997; Tzeng, 1993).
The fifth factor of the scale responded only by co-uples with children is “understanding of parenting” that assesses the reflections of difficulties stem-ming from child-rearing problems on the marital relationship. The amount of the variance justified by the factor is 4,352%. This part of the scale cover issues, such as the conflicts with the spouse about child-rearing, non-compliance between couples in terms of child care and discipline, the unequal share of the responsibility for the upbringing of the children, the evaluation of the spouse as a father or a mother and the interest or the indifference of the spouse to the children. According to the research carried out by Chapin et al. (2001), the conflict bet-ween couples in terms of child-rearing is the conf-lict creating the highest level of stress in marriages. Besides, it is considered to be the most influential reason of marital problems. In the first years of the marriage, couple’s marital harmony decreases when they raise their children and during the children’s adolescence years (Orbuch, 1996). Similar to the current scale, Snyder’s scale called as the Marital Satisfaction Inventory includes a dimension dea-ling with the conflicts between couples in terms of child-rearing (Snyder, 1997). Furthermore, Olson, Fournier and Druckman’s ENRICH Children and Marriage Scale developed in 1985 contains items similar to the part of the current scale pertaining to the “understanding of parenting” and the items in the relevant part of the scale aims to reveal conflicts between couples about child care and upbringing (Tzeng, 1993).
Taking the above factors into consideration, it wo-uld be true to state that they are in parallel with other scales found in the literature dealing with marital satisfaction. The MSS used in this study has sub-dimensions similar to one of the most com-monly used scales called as Marital Satisfaction In-ventory-Revised (MSI) developed in 1981 and revi-sed in 1997 by Synder. Among 13 sub-dimensions in this test, the following factors can be considered to be compatible with the MSS in general: general stress, effective communication, problem-solving communication, aggression, spending time toget-her with the spouse, disputes about financial mat-ters, the problems arising from the families of the spouse, the dissatisfaction with the children and the disagreement on child-rearing practices. Also, the Marital Satisfaction Scale developed by Ro-ach, Frazier and Bowden in 1981 includes factors like communication with the spouse, expectations from the marriage, satisfaction with the sexual in-tercourse and the confidence in the spouse, which are also included in the current Scale (Roach et

E D U C A T I O N A L S C I E N C E S : T H E O R Y & P R A C T I C E
114
al., 1981). In addition, the Comprehensive Marital Satisfaction Scale (CMSS) developed by Blum and Mehrabian in 1999 assesses marital satisfaction in general and contains items that are similar to the MSS developed for this study. Furthermore, the ENRICH Marital Satisfaction (EMS) Scale includes the following sub-dimensions that are similar to the current scale: communication, conflict resolu-tion, economic management, children and marria-ge (Fowers & Olson, 1993).
Results and Recommendations
As a result of the analysis, it would be fair to state that the Marital Satisfaction Scale (MSS) is a reliab-le and valid assessment tool that can be used to gat-her information about the couples in a short time in psychological, family, and couple counseling environments. It would also be true to claim that the scale includes not only sub-dimensions which are also available in scales and inventories aiming to assess marital satisfaction in foreign countries but also items aiming to assess marital problems unique to the local context of our country. For further studies, it could be recommended that the reliability and validity of the scale should be in-vestigated an important target audience in our co-untry; namely for couples who have children with disabilities.

Kuram ve Uygulamada Eğitim Bilimleri • Educational Sciences: Theory & Practice - 13(1) • Kış/Winter • 115-117 ©2013 Eğitim Danışmanlığı ve Araştırmaları İletişim Hizmetleri Tic. Ltd. Şti.
www.edam.com.tr/kuyeb
Evlilik Doyum Ölçeği’nin (EDÖ) Geliştirilmesi*
Öz
Bu çalışmada, ülkemizde evlilik doyumu ile ilgili çalışmaları desteklemek ve psikolojik danış-ma ortamlarında çiftler hakkında kısa sürede bilgi edinmeyi sağlamak amacıyla geliştirilmiş olan Evlilik Doyum Ölçeği’nin (EDÖ) geliştirilme çalışmasına yer verilmiştir. Ölçek, bireylerin evlilik doyumu konusundaki fikirlerini net bir şekilde ortaya koyabilmek amacıyla, bu konuda yurt dışında geliştirilmiş olan benzer ölçeklere uygun olarak iki seçenekli (Evet-Hayır) olarak tasarlanmış 101 maddeden oluşmaktadır. İki bölümden oluşan ölçekte ilk bölüm evlilik doyu-munun alt boyutlarına ait 92 soru maddesini içermektedir. “Ebeveynlik anlayışı”nın evlilik do-yumuna etkisi ile ilgili ikinci bölüm, sadece çocuk sahibi olan bireylerin devam etmesine uygun 9 maddeden oluşmaktadır. Ölçeğin geliştirilme aşamasında 341 kişiye testin tümü uygulanmış, ikinci bölümüne ait istatistik işlemler içinde, tümü çocuk sahibi 270 kişiye test ayrıca uygulan-mıştır. Ölçeğin madde toplam, madde kalan, ayırt edicilik analizlerinde sonuçlar p .001 düzeyinde manidar elde edilmiştir. Cronbach α, Spearman Brown ve Guttman Split-Half tekniklerinden r=.93 ile .97 arası güvenirlik değerleri elde edilmiştir. Testin sadece çocuk sahibi evli bireylere uygulan-mış olan “ebeveynlik anlayışı” ile ilgili bölümünün güvenirlik değerleri ise, r=.81 ile .86 arasındadır. Faktör analizleri sonucunda ölçeğin birinci alt boyutu “ilişki mutluluğu”, “çatışma” ve “yakınlık” alt ölçeklerinden oluşan “evlilik uyumu” niteliğini ölçmektedir. Diğer alt boyutlar ise, “öfke”, “eşin ailesiyle iletişim”, “ekonomik anlayış” ve “ebeveynlik anlayışı”dır.
Anahtar Kelimeler
Evlilik Doyumu, Evlilik İlişkisi, Evli Çiftler, Evlilik Doyum Ölçeği.
Azize Nilgün CANELa Marmara Üniversitesi
* Bu araştırmanın geçerlik güvenirlik çalışması, danışmanlığını Prof. Dr. Betül Aydın’ın yaptığı, “Ailede Prob-lem Çözme, Evlilik Doyumu Ve Örnek Bir Grup Çalışmasının Sınanması” adlı doktora tezinden alınmıştır.
a Dr. Azize Nilgün CANEL rehberlik ve psikolojik danışmanlık alanında yardımcı doçenttir. Çalışma alanla-rı arasında evlilik ve aile danışmanlığı, aile yaşam eğitimleri ve yaratcılık ve psikolojik danışmanlık yer almaktadır. İletişim: Yrd. Doç. Dr. Azize Nilgün CANEL, Marmara Üniversitesi, Atatürk Eğitim Fakültesi, Rehberlik ve Psikolojik Danişmanlik Ana Bilim Dalı, Istanbul/Türkiye. E-Posta: [email protected] Tel: +90 216 345 4705/236.

K U R A M V E U Y G U L A M A D A E Ğ İ T İ M B İ L İ M L E R İ
116
References
Al-Johar, D. (2005). Muslim marriages in America: Reflecting new identities. Muslim World, 95 (4), 557-574.
Atwood, J. D. (2012). Couples and money: The last taboo. The American Journal of Family Therapy, 40, 1–19.
Balcı, A. (1997). Sosyal bilimlerde araştırma: Yöntem, teknik ve ilkeler. Ankara: TDFO Yayıncılık Ltd.
Blum, J. S., & Mehrabian, A. (1999). Personality and tempera-ment correlates of marital satisfaction. Journal of Personality, 67, 93-125.
Bradbury, T. N., Fincham, F. D., & Beach, S. R. H. (2000). Re-search on the nature and determinants of marital satisfaction: A decade in review. Journal of Marriage and the Family, 62 (4), 964-980.
Bray, J. H. (1995). Family assessment: Current issues in evaluat-ing families. Family Relations, 44, 469-477.
Büyüköztürk, S. (2005). Sosyal bilimler için veri analizi el kitabı. Ankara: Pegema Yayincilik.
Byrne, C. A., & Arias, I. (1997). Marital satisfaction and marital violence: Moderating effects of attributional processes. Journal of Family Psychology, 11(2), 188-195.
Carrano, J., Cleveland, K., Tinkew, J. B., & Moore, K. A. (2003). Conceptualizing and measuring “healty marriages” for empirical research and evaluation studies: A compendium of measures-part II. Washington, DC: Task One, Child Trends, Inc.
Chapin, L. R., Chapin, T. J., & Sattler, L. G. (2001). The relation-ship of conflict resolution styles and certain marital satisfac-tion factors to marital distress. Family Journal, 9 (3), 259-265.
Corcoran, K., & Fischer, J. (2000). Measures for clinical practice: A sourcebook (v.1). New York, NY: The Free Press.
Erbek, E., Beştepe, E., Akar, H., Eradamlar, N., & Alpkan, R. L. (2005). Evlilik uyumu. Düşünen Adam, 18 (1), 39-47.
Ercan, İ., & Kan, İ. (2004). Ölçeklerde geçerlik ve güvenirlik. Uludağ Üniversitesi Tıp Fakültesi Dergisi, 30 (3) 211-216.
Feeney, J. A. (2002). Attachment, marital interaction and rela-tionship satisfaction: A diary study. Personal Relationships, 9 (1), 39-55.
Fincham, F. D., & Bradbury, T. N. (1987) The assessment of marital quality: A reevaluation. Journal of Marriage and the Family, 49, 797-809.
Fitzpatrick, M. A. (1988). Marital interaction: what do we know?” between husbands and wives: Communication in mar-riage. Beverly Hills, CA: Sage.
Fowers, B. J., & Olson, D. H. (1993). ENRICH marital satisfac-tion scale: A brief research and clinical tool. Journal of Family Psychology, 7 (2), 176-185.
Graham, J. M., Liu, Y. J., & Jeziorski, J. L. (2006). The Dyadic Adjustment Scale: A reliability generalization meta-analysis. Journal of Marriage and Family, 68 (3), 701-717.
Günindi-Ersöz, A. (2003). Dünya konferansları belgeler-inde aile ve yoksulluk: Saptamalar ve öneriler. Aile ve Toplum, Başbakanlık Aile Araştırma Kurumu Başkanlığı Dergisi, 5 (2), 71-80.
Harway, M. (2005). Handbook of couples therapy. NJ: Wiley, Hoboken.
Heppner, P. P., & Petersen, C. H. (1982). The development and implications of a personel Problem Solving Inventory. Journal of Counseling Psychology, 29, 66-75.
Holman, T. B. (2002). Premarital prediction of marital quality or breakup: Research, theory, and practice. MA: Kluwer Aca-demic Publishers, Hingham.
Hovardalıoğlu, S., & Sezgin, N. (1998). Eğitimde ve psikolo-jide ölçme standartları. Ankara: Türk Psikologlar Derneği Yayınları.
Huang, W. J. (2005). An Asian perspective on relationship and marriage education. Family Process, 44 (2), 161-174.
Karney, B. R., & Bradbury, T. N. (1995). The longitudinal course of marital quality and stability: A review of theory, method and research. Psychological Bulletin, 118 (1), 3-34.
Karney, B. R., & Crown, J. S. (2007). Families under stress: An assessment of data, theory, and research on marriage and divorce in the military. Santa Monica, CA: RAND Corporation.
Kerkmann, B. C., Lee, T. R., Lown, J. M., & Allgood, S. M. (2000). Financial management, financial problems and mari-tal satisfaction among recently married university students. Financial Counseling and Planning, 11 (2), 55-64.
Lazarus, R. S., & Folkman, S. (1984). Stress, appraisal and cop-ing. New York: Springer.
Leggett, D. G., Roberts-Pittman, B., Byczek, S., & Morse, D. T. (2012) Cooperation, conflict and marital satisfaction: Bridging theory, research, and practice. The Journal of Individual Psydi-ology, 68 (2), 182-199.
Locke, H. J., & Wallace, K. M. (1959). Short marital adjustment and prediction tests: Their reliability and validity. Marriage and Family Living, 21, 251-255.
Nichols, W. (2005). The first years of marital commitment. In M. Harway (Ed.), Handbook of couples therapy (pp. 35-36). NJ: John Wiley & Sons, Incorporated, Hoboken.
Noller, P., & Feeney, J. A. (2002). Understanding marriage: De-velopments in the study of couple interaction. West Nyack, NY: Cambridge University Press.
Oflaz, F. (1995). Psikiyatrik hastaların eşlerinin psikososyal güçlükleri ve stresle baş etme yollarının incelenmesi. Unpublished master’s thesis, GATA Sağlık Bilimleri Enstitüsü, Ankara.
Orbuch, T. (1996). Marital quality over the life course. Social Psychology Quarterly, 59 (2), 162-171.
Orden, S. R., & Bradburn, N. M. (1990). Dimensions of mar-riage happiness. The American Journal of Sociology, 38, 715-734.
Özçelik, D. (1998). Ölçme ve değerlendirme. Ankara: ÖSYM Yayınları.
Prime Ministry General Directorate of Family and Social Research. (2006). 2006 Aile Yapısı Araştırması. Retrieved July 28, 2012 from http://www.aile.gov.tr/tr/?Sayfa=Detay&Id=2006122862127.
Prime Ministry General Directorate of Family and Social Research. (2008). Boşanmanın nedenlerinin araştırılması. Retrieved July 27, 2012 from http://www.athgm.gov.tr/up-load/mce/eskisite/files/kutuphane_56_Bosanma_Nedenleri_Arastirmasi.pdf

CANEL / Evlilik Doyum Ölçeği’nin (EDÖ) Geliştirilmesi
117
Roach, A. J., Frazier, L. P., & Bowden, S. R. (1981). The Marital Satisfaction Scale: Development of a measure for intervention research. Journal of Marriage & Family, 43 (3), 537, 546.
Roberts, L. (2000). Fire and ice in marital communication: Hostile and distancing behaviors as predictors of marital dis-tress. Journal of Marriage and the Family, 62, 693-707.
Şahin, N. H., & Durak, A. (1995). Üniversite öğrencileri için bir stresle başa çıkma tarzı ölçeği. Türk Psikoloji Dergisi, 10 (34), 56-73.
Savaşır, I., & Şahin, N. (1997). Bilişsel davranışçı terapilerde değerlendirme: Sık kullanılan ölçekler. Ankara: Türk Psikologlar Derneği Yayınları.
Segrin, C. (2004). Family communication. Mahwah, NJ: Law-rence Erlbaum Associates, Incorporated.
Sierra, J. C., Monge, F. S., Santos-Iglesias, P., Bermudez, M. P., & Salinas, J. M. (2011). Validation of a reduced Spanish version of the Index of Spouse Abuse. International Journal of Clinical Health & Psychology, ll (2), 363-383.
Snyder, D. K. (1979). Multidimensional assessment of marital satisfaction. Journal of Marriage and Family, 41 (4), 813-823.
Snyder, D. K. (1997). Marital Satisfaction Inventory revised (MSI-R) manual. Los Angeles: Western Psychological Services.
Snyder, D. K., Cozzi, J. J., & Mangrum, L. F. (2002). Conceptual issues in assessing couples and families. In H. A. Liddle, D. A. Santisteban, R. F. Levant, & J. H. Bray (Eds.), Family psychol-ogy: Science-based interventions (pp. 69-87). Washington, DC: American Psychological Association.
Spanier, G. B. (1976). Measuring Dyadic Adjustment: New scales for assessing the quality of marriage and similar dyads. Journal of Marriage and Family, 38 (1), 15-28.
Stith, S. M., Green, N. M, Smith, D. B., & Ward, D. B. (2008). Marital satisfaction and marital discord as risk markers for ıntimate partner violence: A meta-analytic review. Journal of Family Violence, 1 (23), 149–160.
Tekin, H. (1993). Eğitimde ölçme ve değerlendirme. Ankara: Yargı Yayınları.
Tekindal, S. (1997). Ölçme değerlendirmeye ilişkin tutum aracı geliştirme. Amasya: Cem Ofset.
Tezbaşaran, A. (1996). Likert tipi ölçek geliştirme kılavuzu. An-kara: Türk Psikologlar Derneği Yayınları.
Tzeng, O. C. S. (1993). Measurement of love and intimate rela-tions. Westport, CT: Greenwood Publishing Group, Inc.
Wenzel, A., & Harvey, J. H. (2001). Maintaining and enhanc-ing close relationships: Linking theory with practice. In J. H. Harvey, & A. Wenzel (Ed.), Clinician’s guide to maintaining and enhancing close relationships (pp. 1-10). Mahwah, NJ: Lawrence Erlbaum Associates.
Yıldırım, N. (2004). Türkiye’de boşanma sebepleri. Bilig/Türk Dünyası Sosyal Bilimler Dergisi, 28, 59-81.
Yılmaz, A. (2001). Eşler arasındaki uyum, kuramsal yaklaşımlar ve görgül çalışmalar. Aile ve Toplum, Başbakanlık Aile Araştırma Kurumu Başkanlığı Dergisi, 4 (1), 49-58.