the development ofan enterprise input output model and …14/13+14-6.pdf · the development ofan...
TRANSCRIPT

Journal ofApplied Input-Output Analysis, Vol. 13 & 14, 2008
The development ofan enterprise input output model and its application toindustrial environmental management
By
Mitsutaka MATSUMOTO* and Jun FUJIMOTO"
Abstract
In this paper, we present an enterprise input-output (EIO) model and apply it to an industrial environmental management. We present two versions of the model: a "micro EIOmodel" describing production within an enterprise, and a "macro EIO model" describingproduction across a broader range, such as in a nation. We discuss that the C02 emissionscalculated using the models provide a metrics for companies to assess environmental management within the companies. We applied the model to a group of companies in the Japanese electronics industrial sector. We discuss the implications of the model results on the
corporate environmental management.
1 Introduction
Climate change is a major global concern that requires a multifaceted solution. Effective responses to the climate change problem need to be adopted by corporations because a substantial proportion of global C02 emissions is produced by the industrialsector, and environmental impact assessment of product manufacturing processes aretherefore necessary for improving the energy efficiency of this sector. In addition, theincreased energy used by information and communication technology (ICT) products isbecoming a concern (Huber and Mills, 1999; Kawamoto et al., 2002; METI, 2008;Plepys, 2000). In 2006, 230 million of personal computers (PCs) were sold worldwide.As we review in Section 2.2, energy consumption by ICT products is estimated to be 2-8% of the total electricity used in developed countries (Huber and Mills, 1999;Kawamoto et al., 2002; METI, 2008). Energy consumption by the ICT sector occursduring manufacturing process, as well when the products are used. We focus on energyflow during the manufacturing process of ICT products using the framework of theinput-output model (IO model). The IO has been traditionally used to analyze mone-
Center for Service Research, National Institute of Advanced Industrial Science and Technology
(AIST), Japan.
Postal address: 1-1-1 Umezono, Tsukuba, Ibaraki 305-8568, Japan
E-mail address: [email protected]
*Research Center for Advanced Science & Technology, The University of Tokyo
Postal address: 4-6-1 Komaba, Meguro, Tokyo 153-8904, Japan

124 Journal of Applied Input-Output Analysis, Vol. 13 & 14, 2008
tary flow in nations or regions (Leontief, 1936; Isard and Kuenne, 1953; Miller, 1957).The model has also been applied to energy flow analyses within nations (Leontief etal., 1970; Wyckoff and Roof, 1994).
The IO model described here is intended for application to the corporate level andis therefore referred to as an enterprise input-output model (EIO model), several applications of which have been described previously (Albino et al., 2003; Albino et al.,2008; Grubbstrom et al., 2000; Lin and Polenske, 1998; Marangoni et al., 2004; Polenske 1997; Polenske and McMichael, 2002). Lin and Polenske, for example, applied themodel to corporate environmental management (Lin and Polenske, 1998). They discussed that we can quantify the waste disposal costs, identify factors that influencewaste generation, and evaluate alternative options to comply with regulations, using themodel. In this paper, we focus on corporate environmental management for C02 abatement and discuss the application of the EIO model to provide a metrics for the management. We define two versions of C02 emissions of in-company sectors: the "directC02 emissions" representing the emissions in the sector, and the "sales-based C02emissions" representing the emissions in the company to produce the products that aresold externally from the sector. We discuss the usage of the sales-based C02 emissionsfor corporate environmental management.
One major obstacle to effective corporate environmental management is that theorganizational structure of a company changes frequently. WTien the organizationalstructure changes, for example, a manufacturing process of an in-company sector moveto other sector, if other conditions are same, C02 emissions in the sector from which a
process moves out will decrease, and the emissions in the sector to which the processcomes in will increase. In such cases, C02 emissions of the sectors before and after the
move can not be simply compared. It makes companies difficult to set C02 abatementgoal to in-company sectors and to evaluate the effectiveness of environmental management of sectors. An effective metrics to evaluate environmental management is required. In this paper, we discuss that the sales-based C02 emissions can be a metrics.
Manufacturing processes are moved not only within a company but also to outsidethe company. It is called outsourcing. We formulate the "macro EIO model" which describes productions in a broader range than in a company, such as in a nation. In themodel, an enterprise is embedded explicitly in the range. We discuss that the sales-based C02 emissions calculated using a macro EIO model provide a metrics in cases inwhich a process is outsourced outside the company. An analogy is that, in internationalclimate change politics, an effective metrics for national C02 emissions is required. Theemissions of a country can seemingly decrease when energy intensive industries aretransferred to abroad.
We applied the models to a group of electronics companies in Japan. The groupconsists of several tens of companies and has totally several ten thousands of employees. We divided the group into 10 in-company (in-group) sectors and built the EIO table for the group. Using the EIO table, we calculated the direct and sales-based CO2emissions of the in-company sectors. We also built the macro EIO table for the groupby integrating the (micro) EIO table with the Japanese national IO table. We calculatedthe sales-based CO2 emissions using the table and analyzed the breakdowns. We present the results and discuss the implications.
The present paper is organized as follows: Section 2 outlines the previous studies

The development of an enterprise input output model and its application to industrial environmental management 125
on EIO models and introduces the studies on the impact of ICT on energy consumption. In Section 3, formulation of the EIO model is presented. We formulate two versions ofthe model, with the former used as the IO model for individual companies andthe latter for companies that are explicitly linked to a national IO model. In Section 4,we apply the models to the analysis of energy flow within companies. We present themathematical formulation of the sales-based C02 emissions. In Section 5, we presentthe findings obtained using actual data. We applied the model and methods to a groupof Japanese electronics companies and discuss the implication of the model results oncorporate environmental management. Finally, our conclusions are presented in Section6 and recommends future research.
2.1 Enterprise input-output model
Input-output analysis (IO analysis) is an analytical framework for economics originallydeveloped by Leontief (Leontief, 1936). The model provides a consistent method forascertaining the flows from suppliers to users within a nation. In addition to the national level, considerable IO activities occur at a variety of levels; whether it is for agroup of nations, a county, or a metropolitan area. Regional IO models deal with a single region or with two or more regions and their interconnections. Examples of the earliest attempts of quantifying single-region IO tables can be found in (Isard and Kuenne,1953; Miller, 1957).
Researchers in countries, such as Belgium, Italy and China, have developed enterprise input-output (EIO) models (Albino et al., 2003; Albino et al., 2008; Grubbstromet al., 2000; Lin and Polenske, 1998; Marangoni et al., 2004; Polenske 1997; Polenskeand McMichael, 2002). The basic units of the EIO model are typically products andbranches within a company, which are in many cases treated in the same way as thesectors in national IO tables. EIO models were proposed to support corporate management accounting system and were used for a variety of analytical tasks in the firm.Their applications to corporate environmental management were also proposed. In particular, Lin and Polenske built a specific IO model for a steel plant, and presented themethods to investigate the energy intensity of the plant (Lin and Polenske, 1998).Polenske and McMichael built an IO model for a cokemaking plant and assessed theeconomic and energy requirements of using alternative cokemaking technologies(Polenske and McMichael, 2002). Using a similar approach, Albino et al. have formulated models that analyze logistics flows in industrial clusters (Albino et al, 2008). Inthis paper, we apply the EIO model to support corporate environmental management toabate the C02 emissions in companies. C02 emission abatement is a pressing issue forcompanies today. Also, we apply the methods to a group of Japanese electronics companies. EIO models have not been applied to recent ICT product manufacturing companies nor were they used in Japanese companies.
2.2 Environmental impacts of ICT
Increased energy use by ICT products is a concern (Huber and Mills, 1999;Kawamoto et al., 2002; METI, 2008; Plepys, 2000). In 2006, 230 millions of PCs, and1 billion of cellular phones were sold in the world. In addition, the number of servers

126 Journal of Applied Input-Output Analysis, Vol. 13 & 14, 2008
and wireless base-stations that support both internet and telecommunication systemsalso increased. According to previous studies, ICT products consume 3 to 8% of all theelectricity in U.S. (Huber and Mills, 1999; Kawamoto et al., 2002; METI, 2008). In Japan also, IT-related energy consumption has been rapidly increasing. According to theJapan Ministry of Economy, Trade and Industry (METI), 50 TWh of electricity wasused in 2006 to run all the servers and PCs in the country (METI, 2008). That represents about 5 percent of all electricity use nationwide. METI estimated that ICT products consume over 20% of electricity in 2025 (METI, 2008).
It is important to remember that energy consumption occurs during the manufacturing process of the product, as well as when the product is used. WTiile the findingsof life cycle assessment (LCA) studies are different1, the energy use in manufacturingprocesses of products is not negligible. The approaches for assessing energy use duringthe manufacturing phase are categorized as two types: process-analysis assessments andnational-IO-based assessments. For the former type, energy use in the manufacturingprocesses is assessed in detail, while for the latter type, national IO tables are used toestimate the total energy multipliers that describe energy per unit of consumption forproducing commodities. WTiile process-analysis-based assessments are generally moreaccurate, it is difficult to obtain all the necessary data for the analysis. Conversely, IO-based-assessments use data that can be accessed with relative ease; however, the accu
racy is lower. To optimize the potential associated with both approaches, a hybridmethod is frequently used (Bullard et al., 1978; Joshi, 2001). In this method, theprocess-analysis- based assessment methodology is used for the data is available, andthe IO-based assessment methodology is applied for the remaining instances when thedata is not available.
The EIO model could further complement such an assessment as the EIO modeluses data that is more readily available (company accounting data) compared to thedata that is required for process-analysis-based assessments. In addition, the EIO modeluses data that is more specific to the targeted manufacturing process than the data usedfor national-IO-based assessment.
3 Enterprise input-output table
The IO tables have been formulated for a variety of levels, ranging from nations, togroups of nations, regions within nations, cities, etc. Enterprise input-output (EIO) tables are IO tables that apply to a company or a group companies2, and which describe
Energy use in manufacturing phase has been analyzed in LCA studies. However, the assessed resultsare divisive. Tekawa et al., for example, reported that the ratio of energy use in manufacturing phaseand usage phase is 2:8 in the case of desktop PC (Tekawa et al., 1997). Williams reported the ratio is8:2. Thedifference largely comes from the estimate for energy consumption in semi-conductor material manufacturing process (Williams, 2003). The process is placed in chemical industry sector in national IO table and not in electronics industry sector.Although the focus of EIO model is "a company", it could be "a group of companies".
The development of an enterprise input output model and its application to industrial environmental management 127
the flow of commodities within a company. We represent this flow using monetaryunits because the national IO tables usually use monetary units and we incorporate EIOtables with the national IO tables.
We formulate two versions of EIO tables: one is what we refer to as a "micro EIO
table", and the other is a "macro EIO table". A micro EIO table is analogous to a national IO table. It contains the IO data for a specific company. A macro EIO table isanalogous to a multi-regional IO table. It represents IO data for a nation and is comprised of both company and national data from which the company data is excluded.Such a table is formulated by integrating a micro EIO table and a national IO table.
3.1 Micro EIO table
Micro EIO tables are analogous to national or single-region IO tables. We divide acompany into sectors and products manufactured by each intra-company (in-companyhereinafter) sector are regarded as distinct products. It is a general assumption in IO tables.
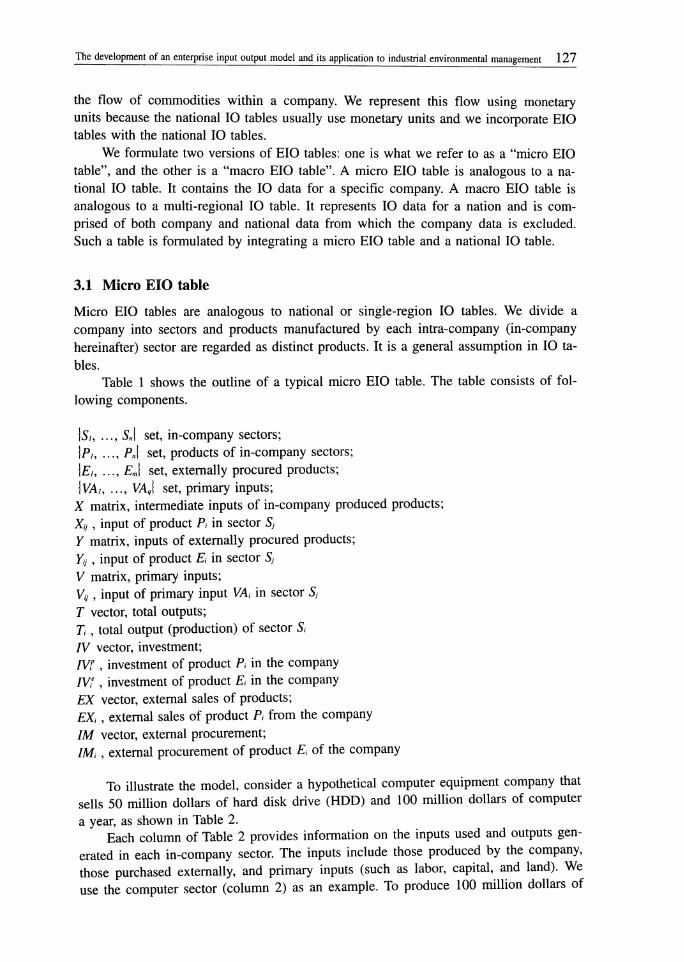
Table 1 shows the outline of a typical micro EIO table. The table consists of following components.
\Si, ..., Sn\ set, in-company sectors;\P,, ..., Pn\ set, products of in-company sectors;\Ei, ..., Em\ set, externally procured products;\VAi, ..., VAq\ set, primary inputs;
X matrix, intermediate inputs of in-company produced products;Xy, input of product P, in sector SjY matrix, inputs of externally procured products;Yy, input of product Et in sector 5,V matrix, primary inputs;Vy , input of primary input VAi in sector SjT vector, total outputs;T , total output (production) of sector S,IV vector, investment;
IV! , investment of product P, in the companyIV- , investment of product £, in the companyEX vector, external sales of products;EXi, external sales of product P, from the companyIM vector, external procurement;IMi, external procurement of product £, of the company
To illustrate the model, consider a hypothetical computer equipment company thatsells 50 million dollars of hard disk drive (HDD) and 100 million dollars of computera year, as shown in Table 2.
Each column of Table 2 provides information on the inputs used and outputs generated in each in-company sector. The inputs include those produced by the company,those purchased externally, and primary inputs (such as labor, capital, and land). Weuse the computer sector (column 2) as an example. To produce 100 million dollars of

128 Journal of Applied Input-Output Analysis, Vol. 13 & 14, 2008
computers, the sector used 50 million dollars of HDD, 10 million dollars of parts and20 million dollars of energy, and required 10 million dollars of capital and 10 milliondollars of labor wages. Consumption of 20 million dollars of energy produced 40 thousand tons of C02.
When each element in a column of Table 2 is divided by the total output of thesector, we obtain the input or technical coefficients matrix. Each coefficient shows theamount of input required for each unit of output.
Mathematically, the input coefficients are obtained as
ay = XylTi
ay=Yy/Ti. (1)
Each row in the table describes the use of a commodity or input. For example, thefirst row (Hard Disk row) of Table 2 shows that 100 million dollars of HDD were produced by the corporation, of which 50 million dollars were used in the production ofcomputers and the remaining 50 million dollars were sold to external customers. Theforth row (Energy row) indicates the energy-use pattern in the company: 30 milliondollars used for HDD producing and 20 million dollars in the computer producing operations. The total energy input was 50 million dollars a year.
The row of the input-output table, therefore, provides a statistical account of input-output flows in the corporation. These flows must be balanced, as follows:
Xi, + Xi2 +...+ Xin + IV? + EXi = Ti
Yu + Yi2 +...+ Yin + IVt - IMi = 0
Table 1: Structure of micro enterprise input-output tables
Products of
In-
CompanySectors
External
Procure
ment
PrimaryInputs
Pi
P2
Pj
Pn
Ei
E2
Em
VA,
VAq
Total
Output
In-Company Sectors
Si S2
Xu X12
X21 X22
X31 X.u
Yu Yn
Y21 Y22
Ym,2
Vu Vt2
Vq,i Vq.2
Ti T2
Xijn
X2M
X3.„
Yu
Yu
Vu
Vq,n
Invest-ment
IV!
m
m
m
/K
External
sales
EXi
EX2
EXj
EXn
External
procurement
0
0
0
0
-IMi
-IM2
-IMm
(2)
Total
Output
Ti
T2
T3

The development of an enterprise input output model and itsapplication to industrial environmental management 129
Table 2: Micro enterprise input-output table: hypothetical hard disk drive(HDD) and computer company
(unit: million dollars)
HDD
Sector
Computer
Sector
Invest- External
ment Sales
Procure
mentOutput
HDD
Computer
0
0
50
0
0 50
0 100
0
0
100
100
Parts
Energy
(C02)
50
30
(60K ton)
10
20
(40K ton)
0 0
0 0
-60
-50
0
0
Capital
Labor
10 10
1010
Output 100 100
In matrix notation, it is expressed as follows:
AT + F -M = T
Or,
T = (I -AY\F - M)
where,
Ti
All
an
•• al 0 •
- al 0 ;• 0
• 0
T = T„
0
,A = al\ '
a\\ '
•• al 0 •
•• a\n 0 •
• 0
•• 0
0 aem\ ' •* amn 0 *•• 0
F =
(3)
(4)
/Vf + EX^ 0
m + ex. 0
m + ex„ ,M = 0
/Vf /M,
iv: Mm
(5)
The formula (4) clarifies the relationship between total outputs (T,, T2, ...) and final demands (/Vf + EX,, /Vf + EXi, ...)•
3.2 Macro EIO table
Macro EIO tables are analogous to multi-regional IO tables which deal with two ormore regions and their interconnections' and are formulated by integrating a micro EIOtable and a national IO table. The boundary associated with a macro EIO table is sameas that of national IO table in that it covers an entire nation. In an EIO table, the company and the rest of the nation are explicitly distinguished. Table 3 outlines the structure ofa macro EIO table. In Table 3, the column "Company" under "Intermediate Demand" is identical to the data in the micro EIO table compiled for the company. The
3 Multi-regional IO tables were proposed by Isard in 1951.

130 Journal of Applied Input-Output Analysis, Vol. 13 & 14, 2008
Table 3: Structure of macro enterprise input-output tables
Intermediate Demand Final Demand
ImportTotal
OutputCompany
Nation
(besides the
company)
Nation Export
Investment +
Consumption
CompanyIn-company
product flow
Domestic
sales (1)
Domestic
sales (2)
Foreignsales
Nation
(besides the company)
Procurement
for production(National IO) (National IO) (National IO)
Primary
Inputs
Total
Output
row "Company" in Table 3 contains more information than the data shown in the micro EIO table. The cells "Domestic sales (1)", "Domestic sales (2)" and "Foreignsales" in Table 3 specify which sectors the company sells its products to, but these arenot specified in the micro EIO. The cells in the "National IO" column in Table 3 arepopulated with values derived from the data of the national IO table.
The mathematical expressions for the macro EIO tables are the same as those employed for micro EIO tables. The matrix A has more columns and rows because it alsocontains the columns and rows that correspond to the sectors and products of "Nation".Similarly, vectors T, M and F have more elements. The elements of F are the sum ofthe values for the columns of "Company", "Nation" and "Export" under "Final Demand" in Table 3.
4 Enterprise input-output analyses
4.1 Micro EIO analysis
4.1.1 Direct C02 emissions and sales-based C02 emissions
We define two types of C02 emissions in in-company sectors: direct C02 emissions andsales-based C02 emissions. Both emissions can be calculated using an EIO table. Wediscuss the application of the analysis to corporate environmental management.
One of the difficulties in corporate environmental management is that the organizational structure of a company changes frequently. When the organizational structurechanges, the C02 emissions of the in-company sectors before and after the change cannot be simply compared. This makes it difficult for companies to set C02 abatementgoals for in-company sectors and to evaluate the effectiveness of environmental management of the sectors by comparing the emission amounts at different times. In otherwords, an effective metrics for comparison or evaluation is needed. We define the sales-based C02 emissions and insist that they can be used as a metrics.
The sales-based C02 emissions of an in-company sector are defined as: the

The development of anenterprise input output model and its application to industrial environmental management 131
amount of C02 emissions induced by energy use in the company to produce productsthat are sold externally from the sector. Figure 1 illustrates the company of Table 2.Suppose that the company emits 100 thousand ton of C02 a year and that the directC02 emission of hard disk drive (HDD) sector and computer sector are 60 thousandtons and 40 thousand tons, respectively. Table 2 and Figure 1 show that a half of HDDproduced in HDD sector is for external sales and that another half is used by the computer sector as intermediate input. We regard that a half of the direct C02 emissions inHDD sector are the sales-based C02 emissions of computer sector. Consequently, thesales-based C02 emissions of HDD sector are 30 thousand tons and those for computer
sector are 70 (= 40+60/2) thousand tons.Figure 2 shows an example of organizational restructuring from Figure 1. For sim
plicity, suppose that the company has two HDD manufacturing factories, and that one
Figure 1: Illustration of the direct and sales-based C02 emissions
External sales
Output
Direct CO:emissions
Input
Sales-basedC02 emissions
HDD
Sector
External sales
ComputerSector
OBEXES'
Figure 2: An example oforganizational restructuring (from Figure 1)
External sales
As%kszi-S ' 1 #-'••-,• •'-•••••'•
External sales
Comforter
Output
Direct CO,emissions
Input
HDD
Sector
Sales-based '^ZZZZCO,emissions 5M^t>
ComputerSector
*7ftKt^F~

132 Journal of Applied Input-Output Analysis, Vol. 13 & 14, 2008
factory (factory A) manufactures HDD for external sales and the other factory (factoryB) manufactures HDD for computer sector. While in Figure 1, both factories belong toHDD sector, as the result of organizational restructuring, in Figure 2, factory B belongsto computer sector. As the result of the restructuring, while the direct C02 emissions ofthe sectors change (in Figure 1, 60 thousand ton and 40 thousand ton for HDD andcomputer sectors, respectively; in Figure 2, 30 thousand ton and 70 thousand ton forHDD and computer sectors, respectively), the sales-based C02 emissions do not change(both in Figure 1 and 2, 30 thousand ton for HDD sector and 70 thousand ton forcomputer sector).
It indicates that the sales-based C02 emissions can be used as a metrics to com
pare the C02 impacts of the in-company sectors at different times and, accordingly, toevaluate the environmental management of the sectors. The mathematical formulationof the sales-based C02 emissions and a numerical example are presented in next sections.
4.1.2 Mathematical formulation of sales-based C02 emissions
Sales-based C02 emissions can be calculated using micro EIO tables. In addition to thedefinitions in (3) in 3.1, we define T, F' and e as follows:
r =
r, o ••
0 r2 ••
0 o ••
0 o ••
0 o ••
0 0 ... 0
0 0 ... 0
T„ 0 ... 0
0 0 ... 0
0 0
,Fl =
F, 0
0 F2
0 0
0 0
0 0
0 0 •
0 0 •
• 0
• 0
Fo 0 •
0 0 •
• 0
• 0
0 0 • • 0
e = (ex e2 ••• en +m)
(6)
where et is the C02 coefficient of the / th commodity (goods), which is nonzero for energy goods such as oil, and represents the C02 emissions associated with the unit inputof the energy goods (ton-C02 per dollar).
The direct C02 emissions of in-company sectors can be calculated using the expression
eAT (7)
while the sales-based C02 emissions of in-company sectors are calculated using
eiJ-AVF1 (8)
The sales-based C02 emissions of a sector are comprised of the direct emissionsin the sector and indirect emissions in other sectors. In Figure 1, for example, the sales-based C02 emissions of the computer sector (70 thousand ton) are comprised of thedirect emissions in the sector (40 thousand ton) and indirect emissions (30 thousandton) which were directly made in HDD sector. The direct C02 emissions in sales-basedC02 emissions (intersection of the direct C02 and the sales-based C02) can be calcu-

The development of an enterprise input output model and its application to industrial environmental management 133
lated using
eAF1(9)
4.1.3 Numerical exampleWe present the numerical examples of EIO analysis for the example company of Figure 1 (Table 2) and Figure 2. The EIO matrix and vectors for the company of Figure 1(Table 2) are as follows.
A =
0 0.5 0 0" ' 50 " ' 0 " "100"0 0 0 0
0.3 0.2 0 0,F =
100
0,M =
0
50,7- =
100
0
0.5 0.1 0 0. 0 .60 0
(10)
We assume that the third row in the table represents energy goods such as oil andthat its C02 coefficient is 2 (thousand ton-C02 per million dollar). The other productsdo not emit C02 directly and their C02 coefficients are 0. Accordingly, vector e is:
e = (0 0 2 0)
From the description in (7), we can obtain the following
AT' =
0
0
30
50
50
0
20
10
(I-AT' =
(7-A)-'F' =
50 50 0 0
0 100 0 0
15 35 0 0
25 35 0 0
1 0.5 0 0
0 1 0 0
0.3 0.35 1 0
0.5 0.35 0 1
From these, we obtain
eAF = (60 40 0 0), e(I - A)-]F' = (30 70 0 0),and eAF' = (30 40 0 0)
(id
(12)
(13)
Direct C02 emissions of the sectors are 60 and 40 thousand tons, respectively, andthe sales-based C02 emissions are 30 and 70 thousand tons, respectively. The directC02 in the sales-based CO2 emissions are 30 and 40 thousand tons, respectively.
Next, we calculate the CO2 emissions for the company of Figure 2 — an organizational restructuring was made from Figure 1. The EIO matrix and vectors are
A =
0 000" ' 50 " "0 " ' 50 "0 0 0 0
0.3 0.35 0 0,F =
100
0,M =
0
50,T =
100
0
0.5 0.35 0 0. 0 60. 0 JThe calculation results are:
(14)

134 Journal ofApplied Input-Output Analysis, Vol. 13 & 14, 2008
Mr = (30 70 0 0),e(/-A)-'F' = (30 70 0 0),and eAF1 = (30 70 0 0) (15)While the direct C02 emissions changed as the result of the restructuring, the sales
-based C02 emissions did not change. Production of HDD for external sales induced30 thousand ton of C02 emissions to the company (sales-based C02) and production ofcomputers induced 70 thousand ton of the C02 emissions to the company.
4.2 Macro Enterprise Input-Output Analysis
4.2.1 Macro EIO analysisThe macro EIO table describes the productions in wider range such as in a nation, andin the model, a company (micro EIO table) is embedded explicitly in the range. Usingthe macro EIO, not only the C02 emissions within the company but also the emissionsin their upstream industries outside the company are analyzed. For example, if a computer manufacturing company procures parts from other company (upstream company),the C02 emissions to produce the parts are counted. We call the sales-based C02 emissions including the emissions in upstream industries as "the macro sales-based C02emissions". In analysis, we use formula (6) using the macro EIO values instead of micro EIO values.
We propose two applications of the macro sales-based C02 emissions to corporateenvironmental management. One application is, again, to use as a metrics. Suppose thata company outsources a process to other company. By outsourcing a process, the C02emissions in the company also decrease. However, as the macro sales-based C02 emissions include both the emissions within a company and those in upstream companies,the C02 impacts before and after the outsourcing can be compared by using the macrosales-based C02 emissions. If the C02 efficiency for the process in the company is better than that in outside the company, the macro sales-based C02 emissions will increase(the metrics gets worse).
Another application is analysis of the ratio of C02 emissions for product manufacturing. By calculating the macro sales-based C02 emissions, and the direct and sales-based C02 emissions using the micro EIO model, we can compare: 1) the direct C02emissions in in-company sector which sells the products, 2) C02 emissions in other in-company sectors to produce the products, and 3) C02 emissions outside the company(in upstream company). From the analysis, implications for an effective corporate environmental management are available. For example, if the direct C02 emissions in the in-company sectors are relatively large, energy efficiency improvement in the sector issubstantial. Or, if the C02 emissions in upstream company are relatively large, greenprocurement is effective to abate C02 impacts.
4.2.2 Mathematical formulation
The macro sales-based C02 emissions of in-company sectors are calculated using following expression.
ed-BYF1 (16)
where B is the input coefficient matrix for the macro EIO table, and e, F and F1 are

The development of an enterprise input output model and its application to industrial environmental management 135
the same as in the micro EIO analysis (e is the C02 coefficient vector, F is the external sales vector).
The C02 emission ratio is analyzed by comparing, 1) the macro sales-base C02emissions which are calculated by the above formula, 2) the C02 emissions within thecompany total which are calculated by formula (8), and 3) the C02 emissions withinthe in-company sectors which are calculated by formula (9).
4.2.3 Numerical ExampleTable 4 presents an example macro EIO table for the company ofFigure 1.
We apply the formula (6) using the following matrix and vectors:
B =
0 0.5 0 0.01 0.005 " r 500 0 0 0.01 0.005 100
0 0 0 0 0 ,F = 0
0.3 0.2 0.3 0.05 0.25 0
0.5 0.1 0.5 0.14 0.45 0
,e = (00200) (17)
We obtain the macro sales-based C02 emissions of the in-company sectors as fol-lows.
e(I - BT'F1 = (60.8 117.2 0 0 0) (18)
In the macro EIO table (Table 4), we assumed that the C02 efficiencies in the in-company HDD sector and the external HDD sector are identical. Suppose that the company outsources the production of HDD which are used in computer sector to an external HDD company, the coefficient matrix becomes as follows.
Table 4: Example of macro EIO table
(unit: million dollars)
Intermediate Input Final Demand
Im
port
Total
Out
put
Ext
ernal
Sales
Company Nation Nation
HDDComp
uterHDD
En
ergyOther Invest
Consu
mption
Exp
ort
Company
HDD 0 50 0 10 10 0 30 0 0 100 50
Comp
uter0 0 0 10 10 0 80 0 0 100 100
Nation
HDD 0 0 0 0 0 0 200 0 0 200
En
ergy30 20 60 50 500 0 400 0 0 1000
Other 50 10 100 140 900 0 900 0 0 2000
Primary Inputs 20 20 40 790 580
Total Output 100 100 200 1000 2000

136 Journal of Applied Input-Output Analysis, Vol. 13 & 14, 2008
Table 5: Energy flow analysis using macro EIO
(unit: thousand ton)
Before outsourcing After outsourcing
HDD Computer HDD Computer
Macro sales-based C02 emissions
(thousand ton)60.8 117.2 60.8 117.2
C02 in the sector 30 40 30 40
C02 in other in-company sector 0 30 0 0
C02 in outside the company 30.8 47.2 30.8 77.2
Direct C02 emissions 60 40 30 40
B'=
0 0 0 0.01 0.005
0 0 0 0.01 0.005
0 0.5 0 0 0
0.3 0.2 0.3 0.05 0.25
0.5 0.1 0.5 0.14 0.45
(19)
The macro sales-based C02 emissions obtained are same as those before the outsourcing.
We calculated the C02 emissions in in-company sectors and in company total in Section 4.1.3. The ratio of the C02 emissions of the company of Table 5 is summarized inTable 6.
4.2.4 Application to Life CycleAssessment (LCA)The idea ofmacro sales-based C02 emissions has a common with life cycle assessment(LCA) and with carbon footprints. They differ in the boundaries for assessments. LCAcounts the environmental (C02) impacts in production, distribution, usage, and end-of-life phases of products. Carbon footprint generally counts the C02 impacts until thepoint ofconsumer's receiving products (production and distribution phases). The macrosales-based C02 emissions count the C02 impacts until the point of products' going outthe company. Accordingly, the macro sales-based CO, emissions consists a part ofLCAand carbon footprints. In LCA studies, C02 impacts are investigated by process analysis, and when process analysis data is not available, data is supplemented by nationalIO-based IO analysis (Bullard et al., 1978; Joshi, 2001). As an EIO model containscompany-specific energy flow data, the EIO analysis provides an easy and more precise C02 impact assessment method.
5 EIO model applied to group of Japanese electronics companies
5.1 EIO Table
5.1.1 EIO Table Construction
We applied the model to a group of Japanese electronics companies. The group in-

The development of an enterprise input output model and its application to industrial environmental management 137
eluded thirty companies with a total of fifty thousands of employees. The companiesproduce electronic devices, information and communication technology (ICT) hardwareand ICT services. Using corporate accounting data for fiscal year (FY) 2001, we generated an EIO table for the group. The total sales of the group in the year were 25.5 billion U.S. dollars (2.55 trillion Japanese Yen).
The accounting data records documented the data on: 1) the products and expenses that each division procured from inside and outside the group (the productswere categorized into approximately two thousand categories), 2) the products andrevenues that each division sold to inside and outside the group, and 3) each division'sexpenses on wages, facility depreciation, and land rents.
We defined the table components that we specified in section 3.1 as follows.0 In-company sectors {Si}: The group includes 20 business divisions operating during
FY 2001. The divisions correspond to 10 sectors represented in the Japanese national IO table (categorization of the divisions was more refined than that of thenational IO table). We reclassified the business divisions to be consistent with the
10 sectors. The 10 in-company sectors represent three electronic device productionsectors: 1) semiconductor devices, 2) electronic devices, and 3) display devices;four ICT hardware sectors: 4) computers, 5) radio communication equipment, 6)wired communication equipment, and 7) computer accessory equipment; and threeICT service sectors: 8) information service, 9) telecommunication service, and 10)
software service. In addition, the companies all have headquarters-divisions andthe monetary flows within these divisions are considerable. In the table, instead ofdefining each of the divisions as an independent in-company sector, the divisions'monetary flows were allocated to the 10 in-company sectors in proportional to division sales.
e Products {Pi}: We defined the products that are produced in sector S, as Pi. Using thisdefinition for P„ by-products do not appear in the table. Different divisions withinthe group rarely sell identical products. Consequently, a one-to-one correspondence between sector and product does not cause problems.
° Externally procured products {£,}: Using the accounting data, products procuredfrom outside the group were categorized into approximately two thousand categories. We aggregated the categories and aligned them with those in the Japanese national IO table (the national table has approximately 500 products in total). Theproducts procured by the group from external sources FY 2001 were categorizedinto 63 product types.
• Intermediate inputs of in-company produced products {X}: Accounting records document trades within the group. Based on the records, we can determine the internalinputs {Xy}.
• Inputs of externally procured products {Yy} and external procurements {Mi}: Accounting data records document external procurements. The inputs of externallyprocured products {Yy} and {/M,} were set based on the accounting records.
• Investment {TVi}: The accounting data records did not contain data for large invest-
4 In real world scenarios, energy use for such construction of new plants should also be considered incorporate energy analyses.

138 Journal ofApplied Input-Output Analysis, Vol. 13 & 14, 2008
ments such as expenses for new plant construction. Therefore, in the table, we setthe values for IV? and IV? as zero4
• External sales {EXy} and total outputs {Ti}: The accounting data records documentexternal sales of products for each sectors (EXy). By adding the amount of tradewithin the group (Xy) to the external sales amount, we determine the total sectoroutput (Ti).
• Primary inputs {VAy}: The accounting data records document labor wages, facilitydepreciation, and land rents for the companies. We set the amounts as VAy.
• C02 coefficient vector e : For fossil fuel (oil and gas) use and electricity, we apply anon-zero C02 coefficient vector e. Although electricity is technically not a C02emitting commodity (because C02 is directly emitted by the electricity generationindustry and not by the companies that use the electricity), as most companies determine their C02 emissions based on their fossil fuel consumption and electricityuse, we treated electricity as a direct C02 emitting commodity. We set the C02 coefficient for oil, gas, and electricity in FY 2001 as 10.4, 2.9 and 3.5 kg-C02 perdollar, respectively, based on the C02 intensities of the energies and the prices inthe year.
5.1.2 EIO Table Overview
Table 6 shows the micro EIO table for the group.The total external sales of the group were 25.5 billion U.S. dollars. The three
large sectors in terms of external sales were: 1) radio communication equipment sector(23% of the group total), 2) computer sector (23% of the group total), and 3) semiconductor device sector (18% of the group total).
The total output of the group was amounted to 42.7 billion dollars. The total output is equivalent to the sum of external sales and intra-group sales. The ratio of external sales to intra-group sales was 3:2 (25.5 and 17.2 billion dollars, respectively),which indicates 40% of the group output was used within group (40% was intermediate commodities in the group).
The total output is also equivalent to the sum of intra-group procurement (= intra-group sales), external procurement, and the value added. The share of the three itemswas 40:32:28. The external procurement and the value added were 13.5 and 12.0 billion dollars, respectively.
The C02 emissions of the group were calculated as 502 thousand ton-C02. The direct C02 emissions of the sectors calculated with formula (7) are shown in the table. Inthe group, the semiconductor device sector was the most energy consuming sector. Thesector emitted over 60% of the group total C02 emissions.
5.2 Micro EIO analysis
Based on the micro EIO analysis framework described in Section 4.1, we calculatedthe sales-based C02 emissions for the 10 in-company sectors. We calculated the directand sales-based C02 emissions for the 10 in-company sectors. As shown in Figure 1,the sectors whose sales-based C02 emissions are greater than direct C02 emissions aredownstream sectors in terms of C02 flows (the "computer" sector in the example), andvice versa. If the differences between the two emissions total is large, the interdepend-
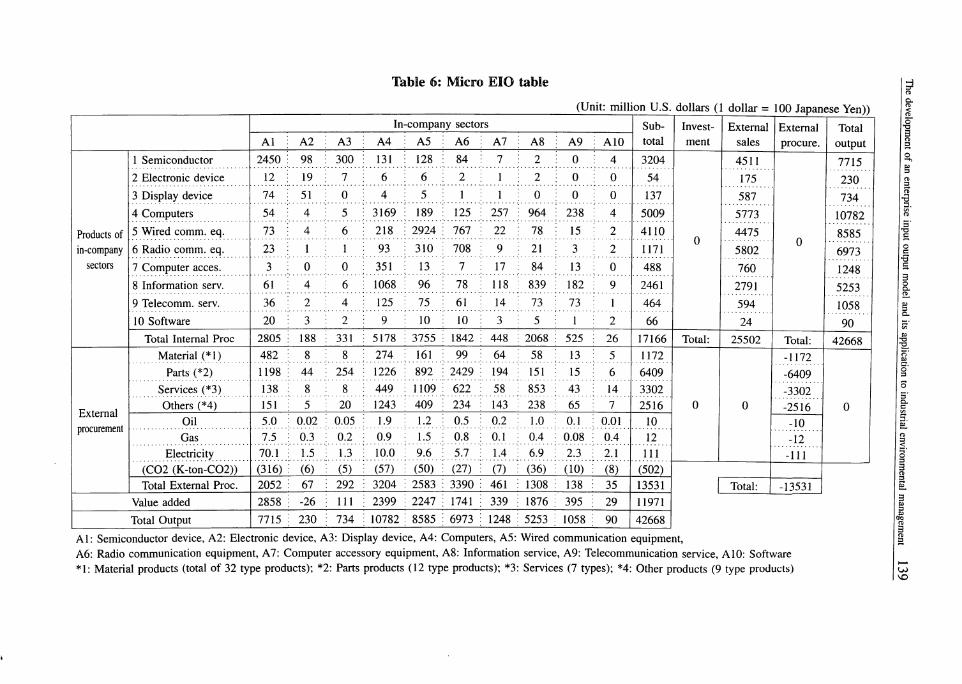
Table 6: Micro EIO table
(Unit: million U.S. dollars (1 dollar = 100 Japanese Yen))In-•company sectors Sub
total
Invest
ment
External
sales
External
procure.
Total
outputAl A2 A3 A4 A5 A6 A7 A8 A9 A10
Products of
in-company
sectors
1 Semiconductor 2450 98 300 131 128 84 7 2 0 4 3204
0
4511
0
7715
2302 Electronic device 12 19 7 6 6 2 1 2 0 0 54 175
3 Display device 74 51 0 4 5 1 1 0 0 0 137 587 734
4 Computers
5 Wired comm. eq.
54
73
4
4
5
6
3169
218
189
2924
125
767
257
22
964
78
238
15
4
2
5009
4110
5773 10782
4475 8585
6 Radio comm. eq.
7 Computer acces.
23
3
1
0
1
0
93
351
310
13
708
7
9
17
21
84
3
13
2
0
1171
488
5802 6973
760 1248
8 Information serv. 61 4 6 1068 96 78 118 839 182 9 2461 2791 5253
9 Telecomm. serv. 36 2 4 125 75 61 14 73 73 1 464 594 1058
10 Software 20 3 2 9 10 10 3 5 1 2 66 24 90
Total Internal Proc Total: 25502 Total: 42668
External
procurement
Material (*i)
Parts (*2)
482
1198
8
44
8
254
274
1226
161
892
99
2429
64
194
58
151
13
15
5
6
1172
6409
0 0
-1172
0
-6409
Services (*3) 138 8 8 449 1109 622 58 853 43 14 3302 -3302
Others (*4) -2516
Oil 5.0 0.02 0.05 1.9 1.2 0.5 0.2 1.0 0.1 0.01 10 -10
Gas 7.5 0.3 0.2 0.9 1.5 0.8 0.1 0.4 0.08 0.4 12 -12
Electricity 70.1 1.5 1.3 10.0 9.6 5.7 1.4 6.9 2.3 2.1 111 -111
(C02 (K-ton-C02)) (316) (6) (5) (57) (50) (27) (7) (36) (10) (8) (502)
Total External Proc. 2052 67 292 3204 2583 3390 461 1308 138 35 13531 Total: -13531
Value added 2858 -26 111 2399 2247 1741 339 1876 395 : 29 11971
Total Output
Al: Semiconductor device, A2: Electronic device, A3: Display device, A4: Computers, A5: Wired communication equipment,A6: Radio communication equipment, A7: Computer accessory equipment, A8: Information service, A9: Telecommunication service, A10: Software*1: Material products (total of 32 type products); *2: Parts products (12 type products); *3: Services (7 types); *4: Other products (9 type products) u>
VO

140 Journal ofApplied Input-Output Analysis, Vol. 13 & 14, 2008
Figure 3: Sales-based C02 emissions, direct C02 emissions, and external sales often sectors (% in group total);
The numbers are the ratio of the sales-based C02 to the direct C02 emissions(sales-based C02 emissions / direct C02 emissions)
Semiconductor
Device .;sectors 1
Electronic device
Display device
Computers
Hardware -N'Wired comm. eq.
sectors Radio comm. eq.
Computer acces.
Information srv.
Software <sectors
Telecom, srv.
Software
h****** **<*M ' ' ' ' Tl 10.9
JE3 3.7
m 2.0
1.6
1
(Sales-based CO
J & 1?
2/Direct CO2><>
f^ki'si^i >--U
iifSr*~+x?*~> •^^rrsjs-y'^i ^P 1.2H
1.0
b
f**V-&K«*'«3 . >• -t
111
0.9H Sales-based C02
D Direct C02
• External sales
pJS^SsfesdL.
&0.9
P °'3p J \7
10 20 30 40
(% in group total)
50 60 70
encies among in-company sectors is greater.Figure 3 shows the sales-based C02 emissions, the direct C02 emissions, and the
external sales, for each of the 10 sectors. The amounts are presented as the shares (%)in the group. The numbers in Figure 3 show the ratio of the sales-based COs emissionsto direct C02 emissions of the sectors.
In the group, the sectors — electronic device, display device, and the four hardware sectors were in the downstream. The interdependencies of the electronic device,display device and software service sectors to other sectors were high. In the case ofelectronic device and display device sectors, they used devices produced in the semiconductor device sector. In such cases, the two sectors might be better to support abating C02 emissions at the semiconductor sector (the upstream sector) rather than tomake efforts to abate direct C02 emissions in the own sector, in order to abate the totalC02 emissions in the group.
As we discussed in Section 4.1, the sales-based C02 emissions can be used as a
metrics to set up intra-company environmental management goals or to evaluate the in-company sectors' environmental management performance. Even if organizational restructuring is undertaken within the group, the C02 impacts of in-company sectors, orthose of their externally sold products, can be compared using the metrics for beforeand after the reorganization.
5.3 Macro EIO analysis
We generated a macro EIO table for the group by integrating the micro EIO table with
http://www.stat.go.jp/english/data/io/index.htm

The development of an enterprise input output model and its application to industrial environmental management 141
Device
sectors
Hardware
sectors
Software
sectors
Figure 4: Breakdown of the macro sales-based C02 emissions
Semiconductor
Electronic device
Display device
Computers
Wired comm. eq.
Radio comm. eq.
Computer acces.
Information srv.
Telecom, srv.
Software
H C02 in the sector
11 C02 in other in-company sectorsD CQ2 outside the group
00%
the Japanese national IO table5. The group represented approximately 0.3% of the national economy based on total output.
We calculated the macro sales-based C02 emissions of the in-company sectors.The macro sales-based C02 emissions of an in-company sector are the amount of C02emissions caused by production of products or services that are sold externally fromthe sector (see Section 4.2 and Table 4). We analyzed the ratio of emissions within thesector itself, for other in-company sectors, and for companies outside the group.
Figure 4 shows the ratio results for the sectors. In the device sectors, the C02emissions generated within the sectors made up a relatively large share (more than30% in semiconductor device sector). In contrast, for hardware sectors, around 90% of
the sales-based C02 were attributed to outside the group. Similarly, around 80% of thesales-based C02 emissions from the software sectors were attributed to the productionof the externally procured products.
The results have implications for corporate environmental management. To abateC02 impacts from sector products in semiconductor device sector, for example, effortsto further improve the energy efficiency within the sector are important ("C02 in thesector" was large). For electronic device sector, energy efficiency improvement in upstream sector (semiconductor device sector) is important ("C02 in other in-companysectors" was large). In hardware and software sectors, C02 abatement in upstream companies outside the group or procurement of less-C02 intensive products (green procurements) would be more effective in reducing C02 impacts ("C02 outside the group" waslarge).
6 Conclusions and future work
In the present study, we formulated micro EIO and macro EIO models. We proposed

142 Journal ofApplied Input-Output Analysis, Vol. 13 & 14, 2008
the calculation of sales-based C02 emissions for in-company sectors (products) usingthe models. The emissions contributions can be used as metrics for evaluating in-company sectors' environmental management even if organizational restructuring occurs within the company. In addition, the breakdown of the C02 impacts of the in-company sectors —the ratios of C02 caused by production within the sector, by production in other upstream in-company sectors, and by production outside the company— are analyzed using the methods. EIO models could improve the accuracies of product life cycle assessments (LCAs). In previous LCAs, national IO tables have beenused when process C02 analysis data for a company is not available. Using EIO tablesinstead of national IO tables enables analyses that are more accurate because EIO tables contain company-specific data.
In the current study, we applied the EIO models to a group of electronics companies in Japan. EIO models have not previously been applied to electronics companies,not to Japanese companies. We described the outline of the EIO table and presentedthe results of the sales-based C02 emissions calculation. The analysis revealed C02flows within the group and interdependencies among the in-company sectors in termsof C02 emissions. However, the EIO table could only be generated for one fiscal yearin the current study. In the future, we will apply our model to generate tables for different years. Changes in the prices of electronics products could affect the input coefficient values. A comparison of years would insure the stability of input coefficients.
We also analyzed the (macro) sales-based C02 emissions of the in-company sectors (Figure 4) by source. The group procured materials and parts from other companies, while the main processes of the group were device processing and product assembly. Therefore, a large amount of C02 emissions was generated by upstream production. To abate the group's C02 impacts, cooperation with such companies is necessary.
Environmentally sustainable manufacturing industries require various levels of pollution control measures, associated with product design, manufacturing, corporate management, governmental policy, and international policy. To plan for and evaluate control measures, a framework for consistently modeling the various levels is needed; theEIO model provides a framework for modeling monetary/material/C02 flow at both thein-company sector and national levels. In the current study, we applied the model toC02 flow analyses. However, the model could also be applied to material flow analyses. In electronics industries, for example, material flow analyses are gaining more attentions as legislative efforts restrict chemical and hazardous substances. Our goal is toextend the applicability of the EIO model and to develop a more integrated frameworkfor supporting corporate environmental management.
References
Huber, P, Mills, PM. (1999), "Dig more coal-the PCs are coming". Forbes.Kawamoto, K, Koomey, J, Nordman, B, Brown, R, Piette, M, Ting, M, Meier, A. (2002),
"Electricity used by office equipment and network equipment in the U.S.". Energy -The International Journal, Vol. 27, No. 3: pp. 255~69.
METI (The Ministry of Economy, Trade and Industry, Japan), (2008), Green IT initiativesAvailable from: <http://www.meti.go.Jp/press//20071207005/03_G_IT_ini.pdf> (in Japanese); [accessed 08.05.01]

The development of an enterprise input output model and its application to industrial environmental management 143
Plepys, A. (2000), "The grey side of ICT", Environmental Impact Assessment Review Vol22, pp. 509-523.
Leontief, W. (1936), "Quantitative input-output relations in the economic system of theUnited States", Review ofEconomics and Statistics; Vol. 18, pp. 105-25.
Isard, W, Kuenne RE. (1953), "The impact of steel upon the greater New York-Philadelphiaindustrial region", Review ofEconomics and Statistics, Vol. 35, pp. 289-301.
Miller, RE. (1957), "The impact of the aluminum industry on the pacific northwest: a regional input-output analysis", Review ofEconomics and Statistics, Vol. 39, pp. 200-209.
Leontief, W, Ford, D. (1970), "Environmental repercussions and the economic structure: Aninput-output approach", Review of Economics and Statistics, Vol. 52, pp. 262-71.
Wyckoff, AW, Roop, JM. (1994), "The embodiment of carbon in imports of manufacturedproducts - implications for international agreements on greenhouse gas emissions", Energy Policy, Vol. 22, pp. 187-94.
Albino, V, Dietzenbacher, E, Kuhtz, S. (2003), "Analyzing material and energy flows in anindustrial district using an enterprise input-output model", Economic Systems Research,Vol. 15, pp. 457-80.
Albino, V, Kuhtz, S, Petruzzelli, A. (2008), "Analysing logistics flows in industrial clustersusing an enterprise input-output model", Interdisciplinary Information Sciences, Vol. 15:pp. 457-80.
Grubbstrom, R, Tang, O. (2000), "An overview of input-output analysis applied to production-inventory systems", Economic Systems Research, Vol. 12, No. 1, pp. 3~25.
Lin, X, Polenske, KR. (1998), "Input-output modelling of production processes for businessmanagement", Structural Change and Economic Dynamics, Vol. 9, No. 205-26.
Marangoni, G., Colombo, G., Fezzi, G. (2004), "Modelling intra-group relationships", Economic Systems Research, Vol. 16, pp. 85-106.
Polenske, K. R., (1997), "Linked System of Enterprise, Regional, National Input-Output Accounts for Policy Analysis", in: Chatterji, M., Regional Science: perspectives for thefuture, Macmillan, London.
Polenske, KR, McMichael, FC. (2002), "A Chinese cokemaking process-flow model for energy and environmental analyses", Energy Policy, Vol. 30, pp. 865-883.
Bullard, CW, Penner, PS, Pilati, DA. (1978), "Net energy analysis. Handbook for combiningprocess and input-output analysis", Resources and Energy, Vol. 1, pp. 267-313.
Joshi, S. (2001), "Product environmental life cycle assessment using input-output techniques", Journal of Industrial Ecology, Vol. 3, pp. 95-120.
Tekawa M, Miyamoto S, Inaba A. (1997), "Life cycle assessment: an approach to environmentally friendly PCs", Proceedings of the 1997 IEEE International Symposium onElectronics and the Environment, pp. 124-30.
Williams E. (2003), "Environmental impacts in the production of personal computers", In:Kuehr R, Williams E, eds. Computers and the Environment: Understanding and Managing their impacts. Kluwer Academic Publishers.