the dominant factors affecting employee’s performance a
TRANSCRIPT

_____________________________________________________________________________________________________ *Corresponding author: Email: [email protected];
Asian Journal of Advanced Research and Reports
14(4): 19-30, 2020; Article no.AJARR.61959 ISSN: 2582-3248
The Dominant Factors Affecting Employee’s Performance a Case Study at PT Bintai Kindenko
Engineering Indonesia
Ade Saputra1, Kholil2* and Toto Hardiyanto3
1Graduate School of Sahid University, Jakarta, Indonesia.
2Faculty of Engineering, Sahid University, Jakarta, Indonesia.
3Post Graduate School of Sahid University, Jakarta, Indonesia.
Authors’ contributions
This work was carried out in collaboration among all authors. Author AS designed the study,
performed the statistical analysis, wrote the protocol and wrote the first draft of the manuscript. Author Kholil managed the analyses of the study. Author TH managed the literature searches. All authors
read and approved the final manuscript.
Article Information
DOI: 10.9734/AJARR/2020/v14i430340 Editor(s):
(1) Dr. Fagbadebo Omololu Michael, Durban University of Technology, South Africa. Reviewers:
(1) Parveen Ahmed Alam, Aliah University, India. (2) Mamta Hegde, Amity Global Business School, India.
Complete Peer review History: http://www.sdiarticle4.com/review-history/61959
Received 29 August 2020 Accepted 05 November 2020
Published 27 November 2020
ABSTRACT
The general situation of national domestic business is not encouraging. More specifically, the number of Construction Service Companies engaged in the Mechanical, Electrical and Plumbing (MEP) field in Indonesia is increasing. In order to make all companies compete competitively, companies need effective human resources (HR) on MEP project on the meaning of effective HR is that have Knowledge, Skills and Attitude. One of the ways companies can achieve improved workforce performance is by applying disciplinary attitudes in accordance with applicable regulations. And must be supported by having a competent workforce. Leaders as managers in a project must be able to create a comfortable working atmosphere and conditions for their staff to have good performance. Leadership factors may effect the success or failure of an agency. The purpose of this research is to identify the dominant factors that affect labor performance in the MEP project conducted at PT Bintai Kindenko Engineering Indonesia. Data analysis with help of smartPLS 3.0 software. The results are that the discipline and leadership hasn't an affecting on
Original Research Article

Saputra et al.; AJARR, 14(4): 19-30, 2020; Article no.AJARR.61959
20
workforce performance improvement, competency variables have an affecting on workforce performance improvement. And together the variables of discipline, competence, and leadership have an affecting on workforce performance improvement. The most affecting factor is the competency variable, with an affecting coefficient of 0.627 on performance.
Keywords: Competence; discipline; human resources; leadership; MEP; performance.
1. INTRODUCTION The general situation of national domestic business is not encouraging. More specifically, the number of construction companies engaged in the Mechanical, Electrical, and Plumbing (MEP) field in Indonesia is increasing. Therefore, the MEP companies must be more competitive and supported by qualified human resources in the sense of having Knowledge, Skill and Attitude. There are 3 main criteria for success in the MEP project ; namely on time, on cost and on quality.
According to [1], human resources have a big role in determining the success or failure of an organization and also have a big contribution to achieve the organization’s goals. People is the main resources of organization, so the top management are required to have astrategy, policy and work program which appropriate with human resource's ability to operate work tools to achieve the goals [2].
One of the ways to realize the company's goals that have been set is to apply work discipline, in accordance with applicable regulations. This is also proven by [3] that the discipline factor has a significant effect on the workforce performance of company. It must be supported by the competence of all workforce. Acccording to a research conducted [4] stated that the competency factor has an influence on workforce performance. In addition, the leader as the driving force in a project must be able to create a comfortable atmosphere and should know the condition his employees to have a good performance, while [5] and Roeleejanto et al. [4] stated the leadership and commitment are the two important factor that determine company’s performance. PT Bintai Kindenko Engineering Indonesia, is a company engaged in MEP and already have lot of experience handling MEP projects since 2012. Currently the project handled is the distribution of electrical power plan which included design planning of the mechanical, electrical and
plumbing systems. Key success factor of this project depends on the discipline and compliance of workers with the established regulations. So, this research was carried out under the title “The Dominant Factors Affecting Employee Performance in MEP Projects (Case Study at Pt Bintai Kindenko Engineering Indonesia)”
2. LITERATURE REVIEW Performance is the work achieved by a person in carrying out the tasks assigned to him based on skills, experience, seriousness and time [6], while according to [7] define performance as basically what is done and not done by employees, or “job performance is formally defined as the value of the set of employee behaviors that contribute, either positivly or negativly, to organizational goal accomplishment” [8]
The performance of an employee can be assessed from various aspects, including knowledge about work, leadership initiatives, work quality, cooperation, decision making, creativity, reliability, planning, communication, intelligence, problem solving, delegation, attitude, effort, motivation, and organization [9,10,11]. According to [12] there are three groups of variables that affect individual performance, namely individual variables, psychology, and organizational variables.
There are many aspects that affect a person's performance, one of which is motivation, education and regulation. while for the institution the leader is a very dominant factor in performance, [13]. Leadership behavior is an important factor in achieving performance [14]. The definition performance according to [15] is the result of work in quality and quantity achieved by an employee in carrying out his duties in accordance with the responsibilities assigned to him. Rivai et al. [16] define performance as real behavior that is displayed by everyone as work performance produced by employees according

Saputra et al.; AJARR, 14(4): 19-30, 2020; Article no.AJARR.61959
21
to their role in the company, employee’s performance is something that is very important in the company's efforts to achieve its goals. Colquitt et al. [10] stated, "job performance is formally defined as the value of the set of employee behaviors that contribute, either positively or negatively, to organizational goal accomplishment". Generally performance is a set of values that contribute positively or negatively to employee’s behavior for achieving organizational goals. Performance is a commitment that must be fulfilled as stipulated in the contract [11]. Individual performance greatly determines organizational performance, whether or not the company's performance is very dependent on individual performance. A similar opinion was conveyed by Winarno and Perdana [12] who stated that the high performance of individual human resources will have an impact on high organizational performance. Because there is a strong relationship between individual performance and organizational performance.
According to Darsono and Siswandoko discipline is an behavior of obedience of rules, norms, obedience based on a high awareness of responsibility that given to him, it is not because of scared or forced, the discipline should based of the ability to carry out responsibilities, readiness and accept the sanctions if there is a problem, dedication is willing to sacrifice to achieve the goals [2]. Meanwhile, M. Harlie stated that work discipline essentially raises awareness for workers to carry out their job, where the formation does not arise automatically, must be formed through formal and non- formal education, and motivation should exists in each employee developed properly. [13], menwhile Handoko views discipline as a management activity to carry out organizational standards [14].
According to Kandula [15], defining competence is a personal characteristic that underlies behavior and individual performance in producing an effective performance or situation. These competencies include initiative, influence, teamwork, innovation and strategic thinking. Winarno and Perdana [12] defined competence as individual characteristics that can be
measured and determined to demonstrate behavior and work performance in a person. While [17] competence is a set of knowledge, skills, behaviors, lived, and controlled by a teacher or lecturer in carry out professional duties. There are several variables that predominantly affect employee performance, namely motivation, job satisfaction, commitment, and competence [17,18]. Leadership have a significant role to safety performance, it’s includes influencing process in determining organizational goals, motivating follower behavior to achieve the goals, influencing to improve the group and its culture [19]. In addition, it also influences the interpretation of the events of its followers, organizing, and activities to achieve the goal of maintaining relationships, group work, obtaining support and cooperation from people outside the group or organization [20,21,22]. 3. METHODS
The data analysis used is Structural Equation Modeling (SEM) with Partial Least Square (PLS), this approach to find predictive linear relationships between variables [23]. PLS analysis is preceded by data quality testing, including validity and reliability tests [24]. PLS can be a powerful method because it does not require many demands for measurement scale, sample size, and residual distribution [25]. SEM-PLS analysis includes several steps, namely testing the outer model, testing the construct validity, testing the construct reliability, and testing the inner model [23]. There are two main steps to evaluate PLS results: measurement evaluation model and structural model evaluation, [23,24]. The dependent variable in this study is performance, the perception of the work results or work performance of employees that are assessed based on the quantity and quality aspects of work, timeliness, attendance, supervision and conservation attitudes. While the independent variables are discipline, competence, leadership. Data collection through questionare which designed Likert scale to 88 male respondents and 17 famale respondents. The research frame work as shown below (Fig. 1) and research model Fig. 2.

Saputra et al.; AJARR, 14(4): 19-30, 2020
22
Fig. 1. Research framework
Fig. 2. Research model
30, 2020; Article no.AJARR.61959
Saputra et al.; AJARR, 14(4): 19-30, 2020; Article no.AJARR.61959
23
4. RESULTS AND DISCUSSION
4.1 Analysis of Factors Affecting Performance with Smart PLS3
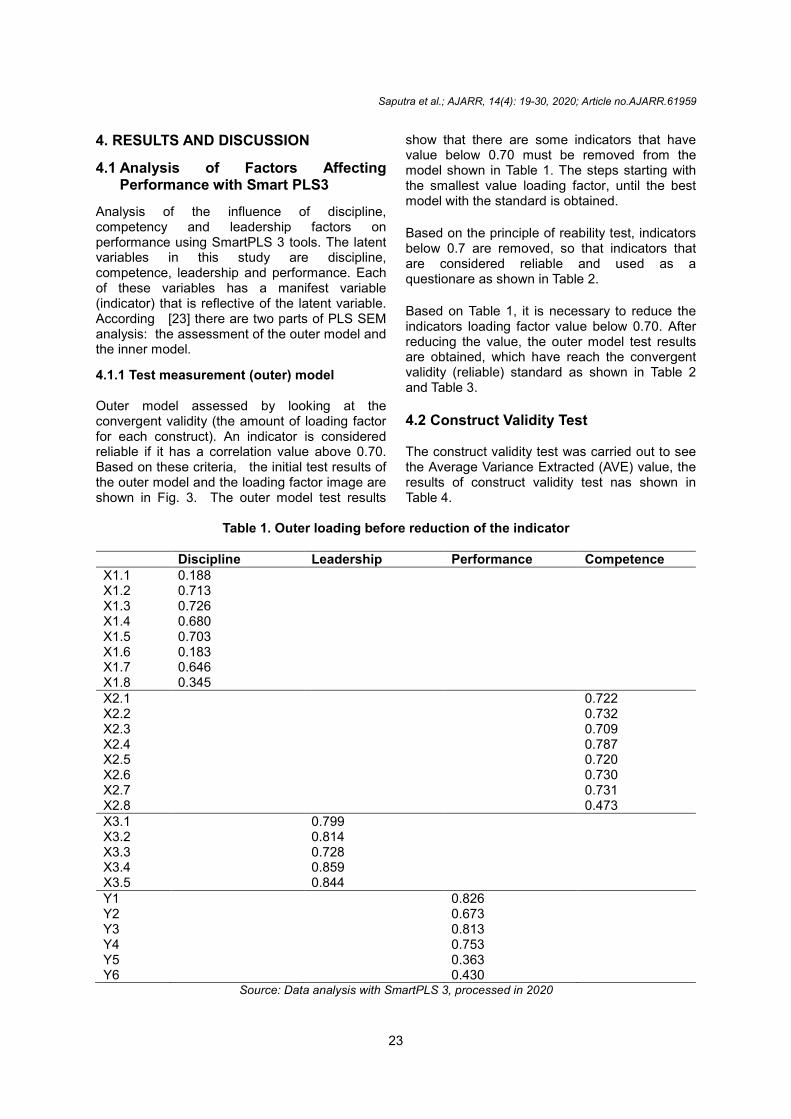
Analysis of the influence of discipline, competency and leadership factors on performance using SmartPLS 3 tools. The latent variables in this study are discipline, competence, leadership and performance. Each of these variables has a manifest variable (indicator) that is reflective of the latent variable. According [23] there are two parts of PLS SEM analysis: the assessment of the outer model and the inner model.
4.1.1 Test measurement (outer) model Outer model assessed by looking at the convergent validity (the amount of loading factor for each construct). An indicator is considered reliable if it has a correlation value above 0.70. Based on these criteria, the initial test results of the outer model and the loading factor image are shown in Fig. 3. The outer model test results
show that there are some indicators that have value below 0.70 must be removed from the model shown in Table 1. The steps starting with the smallest value loading factor, until the best model with the standard is obtained.
Based on the principle of reability test, indicators below 0.7 are removed, so that indicators that are considered reliable and used as a questionare as shown in Table 2. Based on Table 1, it is necessary to reduce the indicators loading factor value below 0.70. After reducing the value, the outer model test results are obtained, which have reach the convergent validity (reliable) standard as shown in Table 2 and Table 3.
4.2 Construct Validity Test
The construct validity test was carried out to see the Average Variance Extracted (AVE) value, the results of construct validity test nas shown in Table 4.
Table 1. Outer loading before reduction of the indicator
Discipline Leadership Performance Competence
X1.1 0.188
X1.2 0.713
X1.3 0.726
X1.4 0.680
X1.5 0.703
X1.6 0.183
X1.7 0.646
X1.8 0.345
X2.1
0.722 X2.2
0.732
X2.3
0.709 X2.4
0.787
X2.5
0.720 X2.6
0.730
X2.7
0.731 X2.8
0.473
X3.1
0.799
X3.2
0.814
X3.3
0.728
X3.4
0.859
X3.5
0.844
Y1
0.826
Y2
0.673
Y3
0.813
Y4
0.753
Y5
0.363
Y6
0.430
Source: Data analysis with SmartPLS 3, processed in 2020

Fig. 3. Initial
Table 2. Outer
Discipline
X1.2 0.727
X1.3 0.712
X1.4 0.726
X1.5 0.769
X2.1
X2.2
X2.3
X2.4
X2.5
X2.6
X2.7
X3.1
X3.2
X3.3
X3.4
X3.5
Y1
Y2
Y3
Y4
Source: Data analysis with SmartPLS 3, processed in 2020
Saputra et al.; AJARR, 14(4): 19-30, 2020
24
3. Initial outer model before subtraction indicator
Outer loading test results after reducing the indicator
Leadership Performance
0.800
0.806
0.727
0.868
0.840
0.829
0.682
0.832
0.740
Source: Data analysis with SmartPLS 3, processed in 2020
30, 2020; Article no.AJARR.61959
test results after reducing the indicator
Competence
0.743
0.753
0.721
0.803
0.707
0.752
0.706

Saputra et al.; AJARR, 14(4): 19-30, 2020; Article no.AJARR.61959
25
Table 3. The results of the cross loading test after reducing the indicator
Discipline Leadership Performance Competence
X1.2 0.727 0.449 0.032 -0.084
X1.3 0.712 0.426 0.023 -0,080
X1.4 0.726 0.361 -0.176 -0,219
X1.5 0.769 0.522 -0.026 -0,115
X2.1 -0.093 0.172 0.388 0.743
X2.2 -0.179 0.099 0.431 0.753
X2.3 -0.164 0.116 0.405 0.721
X2.4 -0.169 0.092 0.560 0.803
X2.5 0.085 0.205 0.377 0.707
X2.6 -0.166 0.028 0.482 0.752
X2.7 -0.119 -0.049 0.485 0.706
X3.1 0.590 0.800 -0.001 0.054
X3.2 0.372 0.806 0.173 0.230
X3.3 0.356 0.727 0.093 0.118
X3.4 0.596 0.868 -0.058 0.062
X3.5 0.463 0.840 0.209 0.073
Y1 -0.012 0.184 0.829 0.481
Y2 -0.079 -0.083 0.682 0.266
Y3 -0.091 0.025 0.832 0.637
Y4 0.031 0.133 0.740 0.413 Source: Data analysis with SmartPLS 3, processed in 2020
Table 4. AVE test results
Indicator Average Variance
Extracted (AVE)
Discipline 0.538
Leadership 0.655
Performance 0.511
Competence 0.550 Source: Data analysis with SmartPLS 3, processed in
2020
The test results are said to be valid / good if the AVE of each value more than 0.50. Based on the results of the tests, it can be seen that the result of AVE has a value more than 0.50, this indicates all of indicators are valid / good.
4.3 Construct Reliability Test The construct reliability test conducted by the two criteria : composite reliability and ronbach's alpha. The construct, it is reliable if the composite reliability and Cronbach's alpha value is above 0.70, and not reliable below 7.0 [21].
Based on the results of the composite reliability and Cronbach's alpha test for each construct, it has a value more than 0.70, can be reliable as shown in Table 5.
4.4 Structural Model Test (Inner Model) This test is done by looking at the R-Square value which is a goodness-fit test. This stage to analyze the level estimation of discipline variable, competency and leadership on the performance variables. The results can be seen in a model shown in Fig. 4.
Table 5. Composite reliability and cronbach's
alpha test results
Indicator Cronbach's
Alpha Composite Reliability
Discipline 0.716 0.823
Leadership 0.869 0.905
Performance 0.766 0.833
Competence 0.864 0.895 Source: Data analysis with SmartPLS 3, processed in
2020

Fig. 4. Analysis of the initial model using the
Based on the results of this analysis, it can be explained that the value R-Squarediscipline, competence, and leadership is able to affect performance by 37.5% and the remaining 72.5% is explained by other variables outside of this research. While discipline and leadership affect competence by 10.7%, the remaining 89.7% is explained by other variables not examined in this study and discipline affects the leadership variable by 36.5%, the remaining 63.5% is explained by other variables not examined in this research. 4.4.1 Hypothesis testing Hypothesis testing is carried out based results of the inner model (structural model) test which includes the R Square outputcoefficient and t-statistics. To see whether a
Table 6. The results of the
No. Variable
1 Discipline -> Performance2 Leadership -> Performance3 Competence -> Performance4 Discipline -> Leadership
Competence -> PerformanceSource: Data analysis with SmartPLS 3, processed in 2020
Saputra et al.; AJARR, 14(4): 19-30, 2020
26
4. Analysis of the initial model using the PLS algorithm techniqueR
2 = 0.375
Based on the results of this analysis, it can be Square in Fig. 4 on
discipline, competence, and leadership is able to affect performance by 37.5% and the remaining 72.5% is explained by other variables outside of this research. While discipline and leadership affect competence by 10.7%, the remaining
ed by other variables not examined in this study and discipline affects the leadership variable by 36.5%, the remaining 63.5% is explained by other variables not
Hypothesis testing is carried out based on the (structural model) test
R Square output, parameter . To see whether a
hypothesis can be accepted or not, by looking at the significance value between contracts, statistics, and p-values. This hypothesis testing is done with SmartPLS (Partial Least Squaresoftware. The results of PLS as shown This hypothesis testing is done to answer the research equation, using technique. Bootstrapping technique is a random sample data recalculation technique to obtain statistics and p value with path The rules of thumb used in this study are statistics> 1.96 (T table with a significant of 5% or 0.05. If the t-statisticsit has a significant effect and a value t-statistics <1.96, it has an insignificant effect. For the results this hypothesis can be seen in Fig. 5, Path Coefficientsbootstrapping technique shown in Table
Table 6. The results of the path coefficients test with the bootstrapping
Original Sample (O)
Standard Deviation (STDEV)
t-statisticss (O / STDEV)
> Performance 0.08 0.13 0.612> Performance -0.036 0.145 0.249
> Performance 0.627 0.067 9,305> Leadership ->
> Performance 0.134 0.053 2,517
Source: Data analysis with SmartPLS 3, processed in 2020
30, 2020; Article no.AJARR.61959
technique
hypothesis can be accepted or not, by looking at the significance value between contracts, t-
. This hypothesis testing is Partial Least Square) 3.0
The results of PLS as shown in Fig. 5.
This hypothesis testing is done to answer the , using bootstrapping
technique is a random sample data recalculation technique to obtain t-
and p value with path coefficients test. used in this study are t-
1.96 (T table with a significant p value statistics value> 1.96 then
it has a significant effect and in otherwise if it has <1.96, it has an insignificant
this hypothesis can be Path Coefficients test with the
technique shown in Table 6.
ping technique
statisticss (O / STDEV)
P values
0.612 0.541 0.249 0.804 9,305 0.000 2,517 0.012
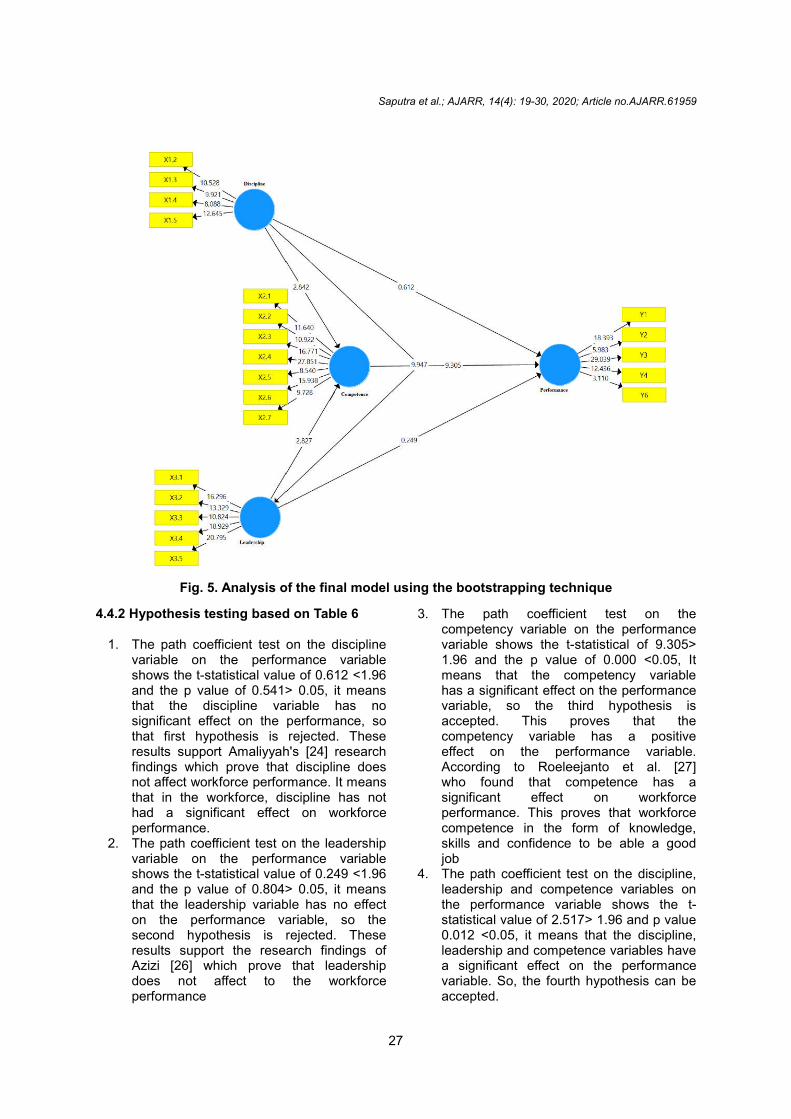
Fig. 5. Analysis of the final model using the
4.4.2 Hypothesis testing based on Table 6
1. The path coefficient test on the discipline variable on the performance variable shows the t-statistical value of 0.612 <1.96 and the p value of 0.541> 0.05,that the discipline variable has no significant effect on the performancethat first hypothesis is rejected. These results support Amaliyyah's findings which prove that discipnot affect workforce performance.that in the workforce, discipline has not had a significant effect on workforce performance.
2. The path coefficient test on the leadership variable on the performance variable shows the t-statistical value of 0.249 <1.96 and the p value of 0.804> 0.05, that the leadership variable has no effect on the performance variable, so the second hypothesis is rejected. These results support the research findings of Azizi [26] which prove that leadershdoes not affect to the performance
Saputra et al.; AJARR, 14(4): 19-30, 2020
27
Analysis of the final model using the bootstrapping technique
based on Table 6
test on the discipline variable on the performance variable
value of 0.612 <1.96 of 0.541> 0.05, it means
that the discipline variable has no significant effect on the performance, so that first hypothesis is rejected. These results support Amaliyyah's [24] research findings which prove that discipline does not affect workforce performance. It means that in the workforce, discipline has not had a significant effect on workforce
test on the leadership variable on the performance variable
value of 0.249 <1.96 of 0.804> 0.05, it means
that the leadership variable has no effect on the performance variable, so the second hypothesis is rejected. These results support the research findings of
which prove that leadership to the workforce
3. The path coefficientcompetency variable on the performance variable shows the t-1.96 and the p valuemeans that the competency variable has a significant effect on the performance variable, so the third hypothesis is accepted. This proves that the competency variable has a positive effect on the performance variable. According to Roeleejanto et al. who found that competence has a significant effect on workforce performance. This proves that workforce competence in the form of knowledge, skills and confidence to be able job
4. The path coefficient test on the discipline, leadership and competence variables othe performance variable shows the statistical value of 2.517> 1.96 and 0.012 <0.05, it means that the discipline, leadership and competence variablesa significant effect on the performance variable. So, the fourth hypothesis can be accepted.
30, 2020; Article no.AJARR.61959
technique
coefficient test on the competency variable on the performance
-statistical of 9.305> p value of 0.000 <0.05, It
means that the competency variable has a significant effect on the performance variable, so the third hypothesis is accepted. This proves that the competency variable has a positive effect on the performance variable.
Roeleejanto et al. [27] t competence has a
significant effect on workforce performance. This proves that workforce competence in the form of knowledge, skills and confidence to be able a good
test on the discipline, leadership and competence variables on the performance variable shows the t-
value of 2.517> 1.96 and p value means that the discipline,
leadership and competence variables have a significant effect on the performance
fourth hypothesis can be

Fig. 6. Variables that have a significant effect on performanceDescription: DSP: Dicipline; CPT: Competency; LDS: Leadership and; FPM: Performanvce
Based on the results of hypothesis, it is known that the workforce with the dominant influence variable on performance is the competency variable, because the competence has the greatest influence coefficient value of 0.627 on performance compared to othernamely discipline to performance of 0.080 and leadership to performance of -0.036.
Based on hypothesis testing, the variables that have a significant effect on performance can be described as shown in Fig. 6. 5. CONCLUSION Discipline and leadership variables significant effect on performance. But the competency variable has a significant effect on the performance of the workforce of the MEP project. But collectively competence, and leadership variabsignificant effect on the employeesof PT. Bintai Kinendo Engineering Indonesia. This mean that competence is variable which affect to performanceincreasing employee's competence is a key factor in improving performance COMPETING INTERESTS Authors have declared that no competing interests exist.
Saputra et al.; AJARR, 14(4): 19-30, 2020
28
Variables that have a significant effect on performance
Description: DSP: Dicipline; CPT: Competency; LDS: Leadership and; FPM: Performanvce
Based on the results of hypothesis, it is known that the workforce with the dominant influence variable on performance is the competency variable, because the competence has the greatest influence coefficient value of 0.627 on performance compared to other variables, namely discipline to performance of 0.080 and
0.036.
Based on hypothesis testing, the variables that have a significant effect on performance can be
Discipline and leadership variables are not significant effect on performance. But the competency variable has a significant effect on the performance of the workforce of the MEP
But collectively the discipline, competence, and leadership variables have a significant effect on the employees performance of PT. Bintai Kinendo Engineering Indonesia. This mean that competence is the dominant
performance. Thus increasing employee's competence is a key
Authors have declared that no competing
REFERENCES 1. Sudarmanto. Merancang Manajemen SDM
berbasis Kompetensi. Journal Kebijakan dan Administrasi Publik. 16.
2. Darsono Dan Tjatjuk, SiswandokoManajemen Sumber Daya Manusia Abad 21, Nusantara Consulting, Jakarta;2011.
3. Muchlis B. Analisis factorMempengaruhi Kinerja Pegawai Pusat Pengembangan Tenaga Kependidikan Kementrian Pendidikan dan kebudayaan.[Tesis]. Universitas Islam Hidayatullah; 2013.
4. Roeleejanto C, Brasit N, Payangan OR, Pahlevi C. Effects of leadership, competency, and work discipline on the application of total quality management and employees’ performance for the accreditation status achievement ofgovernment hospitals in Jakarta, Indonesia. Scientific Research Journal.2015;3(11):14-24.
5. Khasanah N, Kholil, Sugiarto. Analysis of the effect of leadership to safety climate, safety culture and safety performance. Asian Journal of Advanced Research andReports. 2019;4(2):1-12.
6. Hasibuan M. Manajemen Sumber Daya Manusia, edisi revisi dan cetakan
30, 2020; Article no.AJARR.61959
Variables that have a significant effect on performance Description: DSP: Dicipline; CPT: Competency; LDS: Leadership and; FPM: Performanvce
Sudarmanto. Merancang Manajemen SDM berbasis Kompetensi. Journal Kebijakan dan Administrasi Publik. 2005;9(1):1-
Darsono Dan Tjatjuk, Siswandoko. Manajemen Sumber Daya Manusia Abad 21, Nusantara Consulting, Jakarta;
Muchlis B. Analisis factor-faktor yang Mempengaruhi Kinerja Pegawai Pusat Pengembangan Tenaga Kependidikan Kementrian Pendidikan dan kebudayaan.
Universitas Islam Negeri Syarif
Roeleejanto C, Brasit N, Payangan OR, Pahlevi C. Effects of leadership, competency, and work discipline on the application of total quality management and employees’ performance for the accreditation status achievement of government hospitals in Jakarta, Indonesia. Scientific Research Journal.
Khasanah N, Kholil, Sugiarto. Analysis of the effect of leadership to safety climate, safety culture and safety performance. Asian Journal of Advanced Research and
12. Hasibuan M. Manajemen Sumber Daya Manusia, edisi revisi dan cetakan

Saputra et al.; AJARR, 14(4): 19-30, 2020; Article no.AJARR.61959
29
kedelapan, PT Bumi Aksara, Jakarta; 2006.
7. Mathis RL, Jackson JH. Manajemen Sumber Daya Manusia. Jakarta (ID) Salemba Empat; 2006.
8. Colquitt JA, Lepine JA, Michael J. Wesson. Organizational Behaviour (3rd ed.). New York: McGRAW-Hill; 2013.
9. Rivai, Veithzal dan Ella Jauvani Sagala. Manajemen Sumber Daya Manusia Untuk Perusahaan. PT Raja Grafindo, Jakarta; 2010.
10. Gomes FC. Manajemen Sumber Daya Manusia. Bandung: Remaja Rosdakarya; 2003.
11. Dessler G. Manajemen Sumber Daya Manusia. Edisi Terjemahan. Jaka(ID): PT. Prenhallindo; 2000.
12. Gibson JL, Ivancevich JM, Donnelly JH. 2008. Organisasi, Perilaku, Struktur, dan Proses. Jakarta (ID): Binapura Aksara Publisher.
13. Cravello HE. The role of leadership safety performance and results. Welden dissertation and Doctoral Studies Collection. Welden University Scholar Work; 2011.
14. Trmal SA. U.S Ahmad Bustaman, Z.A. Mohamed. The effect of transformational leadership in achieving high performance workforce that exceeds organisational expectation: A study from a global and islamic perspective. Global Business Management Research: An International Journal. 2015;7(2):88-94.
15. Mangkunegara, Anwar Prabu. Manajemen Sumber Daya Manusia Perusahaan. Rosda, Bandung; 2011.
16. Rivai, Vethzal, Basri. Peformance Appraisal: Sistem yang tepat untuk Menilai Kinerja dan meningkatkan daya saing perusahaan. Jakarta (ID):Rajawali Pers; 2008.
17. Musfah Jejen. Peningkatan Kompetensi Guru: Melalui Pelatihan dan Sumber Belajar Teori dan Praktik. Kencana, Jakarta; 2011.
18. Sultana A, Irum S, Ahmed K, Mehmood N. Impact of training on employee performance: A study of telecommunication sector in Pakista. Journal of Contemporary Research in Business. 2012;4(6):646- 661.
19. Winarno A, Perdana Y. The effecs of competence and motivation on employee performance at PT Pos Indonesia Bandung Cilaki Head Office. Proceedings
of Int'l Conference on Business and Marketing & Information System Management (BMISM’15) Paris; 2015.
20. Harlie M. Pengaruh Disiplin Kerja, Motivasi dan Pengembangan Karier terhadap Kinerja Pegawai Negeri Sipil Pada Pemerintah Kabupaten Tabalong di Tanjung Kalimantan Selatan, Jurnal Manajemen dan Akuntansi. 2010;11(2): 860-868.
21. Kandula R. Srinivas. Competency based human resource management: A compelette text with case studies on competency mapping, modelling, assessing and applying. Gtae Corporation. Bangalore, Delhi; 2013.
22. Murgianto, Sulasmi S, Suhermin. The effects of commitment, competence, work satisfaction on motivation, and performance of employees at integrated service office of East Java. International Journalof Advanced Research. 2016;3: 378-396.
23. Arifin HM. The influence of competence, motivation, and organization culture to high school teacher job satisfaction and performance Published by Canadian Center of Science and Education. 2015;8(1):38-45.
24. Kurniawan JS, Kholil, Sugiarto S. The effect of implementation of Occupational Health and Safety Management System and Safety leadership to safety performance. International Journal of Pubblic Health and Safety. 2019;4:172.
25. Ghozali I. Structural equation modeling, metode alternatif dengan partia lleast square (PLS), Edisi 4. Semarang (ID): Badan Penerbit Universitas Diponegoro, Semarang; 2014.
26. Sarstedt M, Ringle CM, Hair J. Partial least square structural equation model. Springer International Publishing. Germany; 2017.
27. Monecke A, Leisch F. SEM PLS: Structural equation modeling using partial least square. Journal of Statistic Software; 2012.
28. Azizi H. 2019. Pengaruh Gaya Kepemimpinan Terhadap Kinerja Pegawai Badan Pusat Statistik di Kalimantan Barat dengan Work Engagement Sebagai Variabel Mediasi. Jurnal Mahasiswa
Magister Manajemen. 2019;7(1). 29. Roeleejanto C, Brasit N, Payangan OR,
Pahlevi C. Effects of leadership,

Saputra et al.; AJARR, 14(4): 19-30, 2020; Article no.AJARR.61959
30
competency, and work discipline on the application of total quality management and employees’ performance for the accreditation status achievement of
government hospitals in Jakarta, Indonesia. Scientific Research Journal. 2015;3(11):14-24.
© 2020 Saputra et al.; This is an Open Access article distributed under the terms of the Creative Commons Attribution License (http://creativecommons.org/licenses/by/4.0), which permits unrestricted use, distribution, and reproduction in any medium, provided the original work is properly cited.
Peer-review history: The peer review history for this paper can be accessed here:
http://www.sdiarticle4.com/review-history/61959