the ‘double market’ approach in venture capital mar… · the ‘double market’ approach in...
TRANSCRIPT
1
The ‘Double Market’ Approach in Venture Capital
and Private Equity Activity: The Case of Europe1
Marina Balboa
Financial Economics Department University of Alicante [email protected]
José Martí Financial Economics Department
University Complutense of Madrid [email protected]
ABSTRACT
This paper aims to contribute to the understanding of the factors that determine fundraising and
investment in the private equity market in Europe. These are analysed separately, since the lags
faced in this activity determine the existence of two separate markets. As a result, private equity
institutions deal with different agents, namely investors (fundraising) and firms (investment),
whose link with the market is affected by different determinants. The results show that liquidity
and the size of the local market are the main factors determining fundraising whereas liquidity
and research and development expenditure determine investments in early stage firms.
KEYWORDS: equilibrium, fundraising, investment, private equity, venture capital. JEL Classification: G24, G32.
_____________________________________________________________________________
1 This paper is part of the output of the EU VII Framework Programme 'Financing Entrepreneurial Ventures in Europe: Impact on innovation, employment growth, and competitiveness - VICO' (Contract 217485).
2
1. INTRODUCTION
Venture Capital and Private equity (VC/PE, henceforth) activity has shown a dramatic increase
over the past decades. There is growing evidence of its impact on economic activity in different
ways, particularly in innovation (Hellmann and Puri, 2000; Kortum and Lerner, 2000; Tykvova,
2000; Engel and Keilbach, 2002), management professionalisation (Davila, Foster and Gupta,
2003) and employment (Belke, Fehn and Foster, 2003; Alemany and Marti, 2005).
VC/PE institutions act as financial intermediaries that reduce the information asymmetry between
investors and entrepreneurs (Chan, 1983). Nevertheless, VC/PE activity is very different from
that of other financial intermediaries, where there is an automated allocation process of the
money committed by investors into the final assets in which their money is going to be placed
(i.e. mutual funds). In contrast with other financial markets, the role of the intermediary, namely
the VC/PE institution, cannot be erased because of the existence of important lags in the process
of raising funds and, more specifically, in the allocation of those funds to unlisted firms. As a
result, the equilibrium in VC/PE markets largely depends on the matching between fundraising
and investment figures. The evidence has shown a high variability of fundraising and investment
figures over time (Gompers and Lerner, 1998; 2001; 2002; Balboa and Martí, 2006), stressing the
need for further research on the determinants of VC/PE activity.
The main objective of this paper is to present a theoretical model that sheds light on the main
drivers of VC/PE activity, namely, fundraising and investment. In order to do so, this paper
separately analyses supply and demand in two submarkets, discussing the relevant variables for
each agent in each submarket. The first one considers the interaction between investors (supply)
and VC/PE organisations (demand), in which fundraising represents the equilibrium between
both parties. The second one analyses VC/PE organizations (supply) and entrepreneurs (demand)
and determines the level of investment that represents the equilibrium between both sides of the
3
market. This is a novel approach in the literature, since to our knowledge, the VC/PE market has
not been theoretically analysed as being composed of two submarkets, where fundraising and
investment figures would represent the equilibrium reached in each one.
This paper contributes to the literature in two ways. First, it provides a novel theoretical model to
determine the level of fundraising and investment as the equilibrium result of two submarkets.
This idea allows us to represent the particularities of the VC/PE market, which are caused by the
lags in the fundraising and investment processes. Second, the determinants are analysed on the
largest multi- country sample ever collected using homogeneous data, with results that are in line
with partial approaches found in previous literature. The results show the importance of industry-
specific liquidity measures, such as initial public offerings (IPO, hereafter) and trade sales, in
both sides of the market, and research and development (R&D) expenditures, in the investment
side of the market. Also, the results show that the determinants of investments are different
according to the stage of development of the firm in which the investment is done.
The rest of the paper is organised as follows. In the second section the determinants of VC/PE
activity in the literature are revised and the ‘double market’ approach is developed to understand
equilibrium in VC/PE markets. The third section includes a description of the data and the
methodology applied. In the fourth there is an analysis of the results obtained and the fifth
presents the conclusions and discusses the implications of the results.
2 LITERATURE REVIEW AND THEORETICAL BASE
2.1 The determinants of VC/PE activity
New and recently-formed companies face many difficulties in accessing financial resources. This
is an old problem highlighted as the ‘equity gap’ by the Macmillan Committee (1931). VC is one
4
of the solutions to reduce the gap in the case of innovative small firms, with an increasing activity
in the United States (US) after World War II, which grew substantially after the change of the
‘prudent man’ rule implemented in the Employee Retirement Income Security Act (ERISA) in
1979. Its use was exported to Europe extensively in the early eighties. But soon the statistics
compiled by the European Private Equity and Venture Capital Association (EVCA) showed that
an increasing share of the invested money was allocated to larger and more mature firms. As a
result a new concept, namely PE, emerged as a better way to explain the investment activity
carried out in Europe. The purpose is still to help cover the equity gap, which is larger in Europe,
thus giving rise to the need of alternative sources, such as PE, to supply liquidity to unlisted firms
at different stages of development.
Since the seminal works by Bygrave and Timmons (1985) and Bygrave and Shulman (1988),
which are based on a limited number of observations, some papers have contributed to the
understanding of the drivers of VC/PE markets. Although the first empirical papers on this issue
focused on the US market, there is recent literature that provides evidence on the European
markets. Regarding the US evidence, Gompers and Lerner (1998) study the determinants of VC
fundraising from two perspectives, the industry aggregates and the commitments to individual
funds. Regarding the former they find that only gross domestic product (GDP) growth is
significant in all specifications, whereas ERISA regulation, interest rate and capital gains taxation
are significant only in some specifications. They also find that, in addition to the impact of
macroeconomic and environment-related variables, such as interest rates, and stock market
returns, reputation and performance are important drivers of fundraising at the fund level. The
importance of reputation at the fund level is also noted in Balboa and Marti (2007).
Jagwani (2000) notes, also for the US market, that the factors that influence VC activity usually
do so via their influence on the expected profit. Using data from 1978 to 1995, he finds that the
total amount of commitments made by the VC industry in a given year depends on the capital
5
gains tax rate and the interest rates. He also states that the national R&D spending contributes to
fundraising in the VC industry.
Messica and Agmon (2007) focus on the US VC industry over the period from 1980 to 2006.
Although they do not analyse the empirical determinants of the supply and demand, they do
analyse the shifts in supply and demand that have occurred during this period and state that the
demand for and the supply of high-risk capital behave in a different way from the classic analysis
of demand and supply. As a result, according to these authors, the VC market is determined by
the supply side, due to the entrance of pension funds in the VC industry.
Regarding the evidence in the European markets, Manigart and Beuselinck (2001) focus only on
the supply of VC by governments. They use data from the 10 European countries with most VC
activity during the period from 1989 to 1999. Their results show that governments leave the
initiative to the private sector and only intervene in cases when the private sector is deficient.
There is also some evidence of a direct government intervention in the VC industry when there is
a bad economic climate, such as a decrease in GDP growth, the interest rates and the number of
IPOs. However, contrary to expectations, they also find that high levels of seed and start-up
investment lead to a higher supply of government VC funds.
The study of the role of VC by governments in the European context is also analysed by McGlue
(2002). He points out that not all small companies will be better off with equity, so that VC is not
the most appropriate form of finance for all small businesses. He adds that even improving the
supply side of VC is just one side of the equation, since an appropriate framework should also
exist on the demand side to support the growth of companies. Finally, he states that the most
significant role the public sector can play in developing the informal VC is through the sensitive
issues of tax policy.
6
Schertler (2003) discusses the determinants affecting VC demand and supply and estimates a
reduced form combining both equations. The results according to the narrow definition of VC,
defined as early stage investments, show that stock market capitalisation, human capital
endowments and the rigidity of labour markets have an impact on these investments. The model
proposed, however, does not yield interpretable results in the case of a broader definition of VC,
which also includes expansion and late stage investments.
From a multi-country perspective, Jeng and Wells (2000) address the issue of the determinants of
venture funding on a panel of 15 countries, including the US market. They introduce two models
to represent supply and demand of venture activity as a function of returns, IPOs, accounting
standards, GDP growth and market capitalisation growth. The equation representing the demand
also includes a variable measuring labour market rigidities. They then solve for the equilibrium
quantity considering both equations. Their estimation is performed across countries, which
implies that the number of observations shrinks to the number of countries, and within countries.
Regarding the former, the results show that IPOs and accounting standards significantly affect the
total amounts invested in almost all specifications whereas labour market rigidity exerts a
negative effect on early stage investments. Regarding the latter, the results show that the IPO
activity is also significant. The results are similar when the endogenous variable is the amount of
new funds raised.
The separation of the VC/PE market is not evident in the literature. Just a few papers specifically
concentrate on one side of the market, such as Gompers and Lerner (1998). Others implicitly
cover only one side, by working with data either related to fundraising or, more frequently, to the
investment activity. Jeng and Wells (2000) and Schertler (2003) rely on aggregate investment
data of an unbalanced panel of several developed countries. Likewise, Romain and Van
Pottelsberghe (2003) describe a model to determine the level of VC activity, but their data refer
only to investments, thus omitting the fundraising side. Therefore, to our knowledge, there is no
7
previous evidence on the analysis of two submarkets in the VC/PE activity, each one composed
of its own supply and demand.
2.2 Theoretical model about the VC/PE market
VC/PE organisations act as financial intermediaries who reduce the information asymmetry
between entrepreneurs/firms seeking funding and potential investors. For that purpose, they set
up funds and allocate the resources to selected companies. The allocation process requires the
connection between the supply of funds by investors and the demand for funds by firms.
Gompers and Lerner (2002) explain the equilibrium of the VC market in aggregate terms. The
supply of funds depends on the desire of investors to pledge funds to VC - the higher the return,
the more inclined investors will be. The demand depends on the number of firms looking for VC
- the higher the return required by investors, the fewer the number of companies able to meet that
requirement.
There are some particular issues in this market, however, that could affect the self-regulation
process between supply and demand. As regards fundraising, it takes on average 12 to 18 months
to raise a new fund. Turning to the investment side, since each investment requires from three to
six months to be completed (Sahlman, 1990; Fried and Hisrich, 1994), it usually requires between
three to four years to allocate the commitments of a VC/PE fund. Gompers and Lerner (2002)
indirectly highlight this problem when they describe that, when there is a shock in demand, the
short term supply curve is perfectly inelastic, since it can not respond quickly to that change.
Rigidity of supply is also mentioned by Balboa and Martí (2006), as they found evidence of
fundraising overreaction produced by changes in demand. In their study they ponder the changes
in demand in the process of growth of the European VC/PE markets, at the peak of the New
Economy.
8
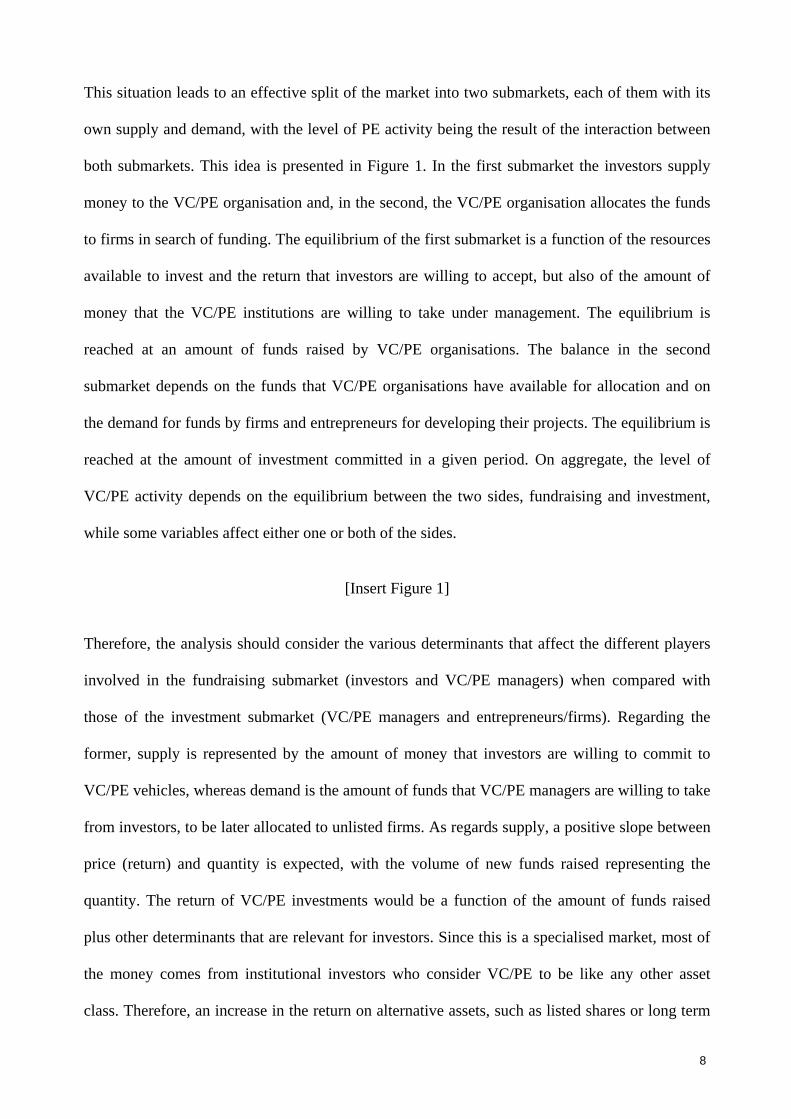
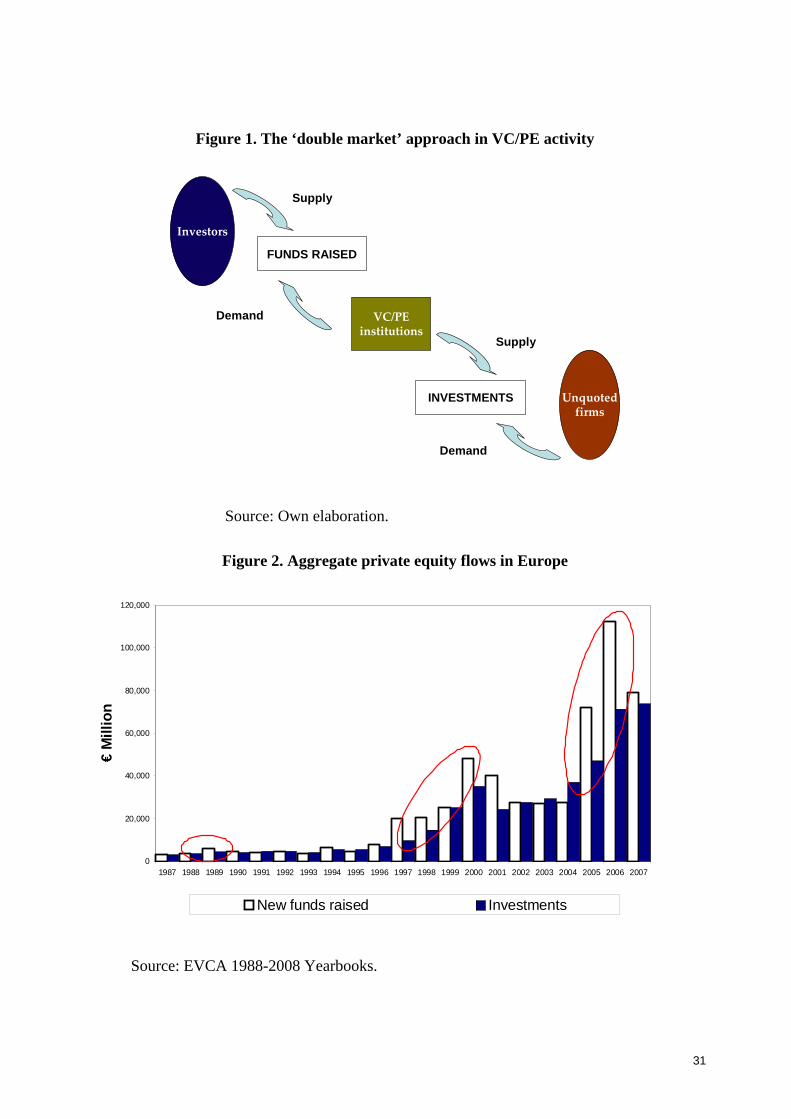
This situation leads to an effective split of the market into two submarkets, each of them with its
own supply and demand, with the level of PE activity being the result of the interaction between
both submarkets. This idea is presented in Figure 1. In the first submarket the investors supply
money to the VC/PE organisation and, in the second, the VC/PE organisation allocates the funds
to firms in search of funding. The equilibrium of the first submarket is a function of the resources
available to invest and the return that investors are willing to accept, but also of the amount of
money that the VC/PE institutions are willing to take under management. The equilibrium is
reached at an amount of funds raised by VC/PE organisations. The balance in the second
submarket depends on the funds that VC/PE organisations have available for allocation and on
the demand for funds by firms and entrepreneurs for developing their projects. The equilibrium is
reached at the amount of investment committed in a given period. On aggregate, the level of
VC/PE activity depends on the equilibrium between the two sides, fundraising and investment,
while some variables affect either one or both of the sides.
[Insert Figure 1]
Therefore, the analysis should consider the various determinants that affect the different players
involved in the fundraising submarket (investors and VC/PE managers) when compared with
those of the investment submarket (VC/PE managers and entrepreneurs/firms). Regarding the
former, supply is represented by the amount of money that investors are willing to commit to
VC/PE vehicles, whereas demand is the amount of funds that VC/PE managers are willing to take
from investors, to be later allocated to unlisted firms. As regards supply, a positive slope between
price (return) and quantity is expected, with the volume of new funds raised representing the
quantity. The return of VC/PE investments would be a function of the amount of funds raised
plus other determinants that are relevant for investors. Since this is a specialised market, most of
the money comes from institutional investors who consider VC/PE to be like any other asset
class. Therefore, an increase in the return on alternative assets, such as listed shares or long term
9
bonds, could have a negative impact on VC/PE activity. Supply could then be represented
through the following model:
S S S S S S0 1 2 3VC / PE return = b + b FR + b IR + b SMR (1)
where
o SVC / PE return : Return expected by investors from VC/PE funds.
o FRS: Volume of funds that investors are willing to commit to VC/PE
funds.
o IR: Long term interest rates.
o SMR: Stock market return.
The coefficient of FRS would be positive, since suppliers are willing to increase the quantity if the
price increases, whereas the coefficients or IR and SMR would be negatively correlated with the
amount committed to VC/PE and, subsequently, with VC/PE returns.
Regarding demand, we would expect a negative relationship between return and quantity, since
VC/PE managers would be less willing to launch more VC/PE funds if the returns expected by
investors are too high to be met. Other determinants should be considered as well, such as the
GDP growth, which should positively affect the expected returns on VC/PE funds. Similarly,
since VC/PE funds invest in unlisted firms, any reference to the liquidity in the market and/or the
industry should be important as well. In this respect, market capitalisation could be viewed as a
proxy of the degree of development of the capital markets, which is a condition, highlighted by
Black and Gilson (1998), to the development of the VC/PE markets. The larger the size of capital
markets the easier it is for VC/PE managers to exit their investments and return the proceeds to
investors. In addition to this general reference of liquidity, sector-specific variables representing
liquidity should be considered as well. The IPO activity has been extensively used in the
literature, but any other sector-related reference of successful exits, such as trade sales or
10
secondary buyouts in the case of Europe, could also be a useful proxy. As a result, demand could
be modelled as follows:
D D D D D D D0 1 2 3 4VC / PE return = b + b FR + b MCAP + b EXITS + b GDPg (2)
where
o DPE return : Return that VC/PE managers expect to earn on the VC/PE funds they
launch.
o FRD: Volume of funds that VC/PE managers are willing to raise.
o MCAP: Stock market capitalisation.
o EXITS: Volume of divestments by means of successful ways.
o GDPg: Real GDP growth.
In equilibrium both curves would intercept, determining the amount of new funds raised at a
given expected VC/PE return, where S DVC / PE return = VC / PE return . Therefore,
GDPgbEXITSbMCAPbFRbbSMRbIRbFRbb DDDDDSSSS432103210 (3)
and in equilibrium FRFRFR DS , thus allowing us to solve for the amount of funds raised:
FR.
GDPgbEXITSbMCAPbSMRbIRbbbFRbb DDDSSSDDS432320011 )()( (4)
GDPgbb
bEXITS
bb
bMCAP
bb
bSMR
bb
bIR
bb
b
bb
bbFR
DS
D
DS
D
DS
D
DS
S
DS
S
DS
SD
)()()()()()(
)(
11
4
11
3
11
2
11
3
11
2
11
00
(5)
Since 011 DS bb , due to the expected negative sign of fundraising in the demand curve, the
signs of the resulting coefficients would remain unchanged. Therefore, to estimate the amount of
funds raised in equilibrium, the model would stand as:
11
GDPgbEXITSbMCAPbSMRbIRbbFR 543210 (6)
All the coefficients in equation (6) are expected to be positive, since the ones related to IR and
SMR would change their signs from equation (1) to equation (6).
In the same vein, the second submarket would relate VC/PE managers with entrepreneurs/firms
seeking finance. On the supply side we would consider the relation between the returns that
VC/PE managers may get from their investments and the amount invested. In this case, the larger
the expected returns, the larger the amount VC/PE managers are willing to commit, with the rest
of the determinants being the ones shown in equation (2). The supply would be represented as:
S S S S S S S0 1 2 3 4INV return = a + a INV + a MCAP + a EXITS + a GDPg (7)
where
o SINV return : Return that VC/PE managers are expected to earn on their VC/PE
investments.
o SINV : Volume of funds that VC/PE managers are willing to commit to investee
firms.
The coefficients of market capitalisation, exits and GDP growth should be positive. The higher
the market capitalisation, the higher the chances of taking the investee firm public, thus having
access to both additional funding for further growth and a market reference to cash-out the
shareholding at market prices. Also, the higher the volume of successful divestments (such as
IPOs), the higher the expected returns on investments, since this would represent the most
profitable ways of exit. Finally, the higher the growth of GDP, the higher the expected returns on
investments.
As regards demand, there would be an inverse relationship between price (returns) and quantity
since the larger the return, the smaller the number of investments that would be able to match that
12
return. But this relationship should also take into consideration other factors that may affect firm
performance and/or the return from the investee firm, such as interest rates, market capitalisation,
successful divestments, GDP growth, R&D expenditures, taxes and labour market rigidities.
D D D D D D D0 1 2 3 4
D D D D5 6 7 8
INV return = a + a INV + a IR + a MCAP + a EXITS +
+ a GDPg + a RD + a TAX + a LAB (8)
where
o DINV return : Expected return from investments on portfolio firms.
o DINV : Volume of funds demanded by entrepreneurs/ firms.
o RD: R&D expenditures.
o TAX: Taxes that affect the net income of shareholders (corporation tax).
o LAB: Labour market rigidities.
The expected signs of the coefficients of the additional variables considered in this equation
would be as follows. Interest rates, labour market rigidities and taxes should have a negative
impact on returns. Higher interest rates would imply lower returns for the entrepreneur due to the
lower earnings after interest and taxes reported. Labour market rigidities limit the chances of
firms rapidly adapting to the changing market conditions, thus lowering the expected long term
return on investments. In the case of taxes, the higher the taxes paid, the lower the after tax
earnings of investee firms and the lower the expected return on VC/PE investments. Nevertheless,
regarding buyout investments, since those require high volumes of debt, an increase in corporate
taxes would imply larger tax credits for the firm. Finally, R&D spending should have a positive
impact, since the higher this value, the higher the expected returns on investments via future
profitable investments.
As in the case of fundraising, in equilibrium both curves would intercept, determining the amount
of investments closed at a given expected investment return, where S DINV return = INV return .
Then, equalling equations (7) and (8):
13
GDPgaEXITSaMCAPaINVaa SSSSSS43210
LABaTAXaRDaGDPgaEXITSaMCAPaIRaINVaa DDDDDDDDDD876543210
(9)
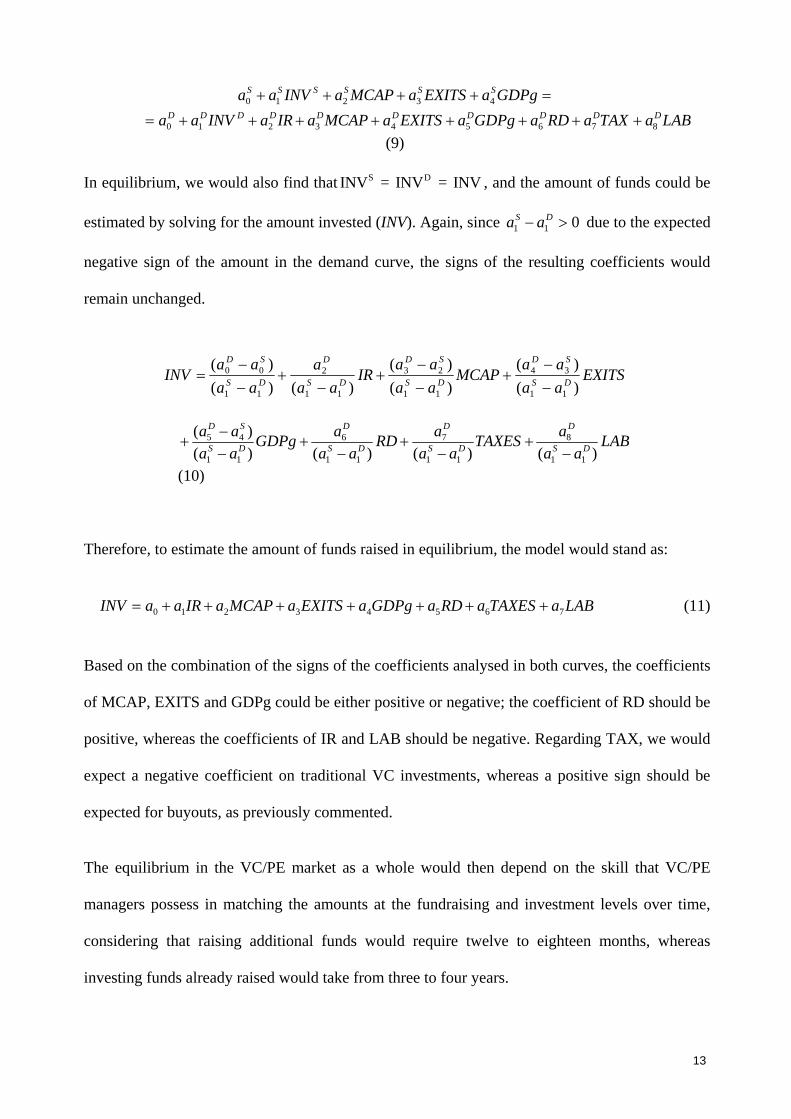
In equilibrium, we would also find that S DINV = INV = INV , and the amount of funds could be
estimated by solving for the amount invested (INV). Again, since 011 DS aa due to the expected
negative sign of the amount in the demand curve, the signs of the resulting coefficients would
remain unchanged.
EXITSaa
aaMCAP
aa
aaIR
aa
a
aa
aaINV
DS
SD
DS
SD
DS
D
DS
SD
)(
)(
)(
)(
)()(
)(
11
34
11
23
11
2
11
00
LABaa
aTAXES
aa
aRD
aa
aGDPg
aa
aaDS
D
DS
D
DS
D
DS
SD
)()()()(
)(
11
8
11
7
11
6
11
45
(10)
Therefore, to estimate the amount of funds raised in equilibrium, the model would stand as:
LABaTAXESaRDaGDPgaEXITSaMCAPaIRaaINV 76543210 (11)
Based on the combination of the signs of the coefficients analysed in both curves, the coefficients
of MCAP, EXITS and GDPg could be either positive or negative; the coefficient of RD should be
positive, whereas the coefficients of IR and LAB should be negative. Regarding TAX, we would
expect a negative coefficient on traditional VC investments, whereas a positive sign should be
expected for buyouts, as previously commented.
The equilibrium in the VC/PE market as a whole would then depend on the skill that VC/PE
managers possess in matching the amounts at the fundraising and investment levels over time,
considering that raising additional funds would require twelve to eighteen months, whereas
investing funds already raised would take from three to four years.
14
3 DATA AND METHODOLOGY
3.1 Data
The sample analysed covers the period from 1987 to 2007, and the countries included are 19
European Union countries plus Iceland, Norway and Switzerland. For each country and year the
data relative to the VC/PE activity refer to the annual volume of funds raised, the annual volume
of investments and the annual volume of total divestments. Data on investments are split by stage
of development of the investee firm, whereas divestments are broken down by type of
divestment, including IPOs, trade sales, secondary buyouts, write-offs and other means. The
source of data is the EVCA yearbooks and the corresponding reports from national VC
Associations. Regarding the macroeconomic and other institutional variables, which are
described in the following subsections, the sources of data are Eurostat, OECD, as well as
domestic stock markets.
3.2 Methodology and models
Since the analysis is based on an unbalanced panel of 22 countries, the panel data methodology is
employed. In order to estimate the models proposed, all figures are divided by the country’s GDP
for the corresponding year, so as to reduce the huge differences found in absolute values among
countries, as in Jeng and Wells (2000).2
Regarding the fundraising side, the endogenous variable in equation (6) is the amount of new
funds raised per year and country, divided by the country’s GDP in that year. All the coefficients
of the different independent variables are expected to have a positive sign. The independent
variables are defined as follows:
2 These authors divide all figures, however, by the average GDP over the whole period considered in their analysis.
15
o Interest rates (IR): 10-year government bond yields, taken from the secondary market.
Source: Eurostat.
o Stock market return
(SMR):
Yearly change in the local All Share Price Index, except for
Romania and the UK, where we included the change in the BET-C
Index and the FT100, respectively. Source: OECD, except for
Romania (BVB) and the UK (LSE).
o Market capitalisation
(MCAP):
Market capitalisation of the local market, divided by the country’s
GDP. Source: Eurostat, except for local markets belonging to
OMX and Euronext.
o Successful Divestments
(EXITS):
Amounts divested at cost per year and country through trade sale,
IPO and secondary buyouts, divided by the country’s GDP. Source:
EVCA.
o GDP growth (GDPg): Yearly change in gross domestic product in constant terms. Source:
Eurostat.
o Tax legal index3
(EVCA INDEX):
Index that reports the assessment of a country’s tax and legal
environment as more or less favourable to VC/PE activity. The
most favourable value is 1 and the least favourable is 3. Source:
EVCA.
Although the tax and legal index is not included originally in the model, it is added in the
empirical estimation to control for institutional variables that are different among countries and
that may affect the fundraising activity in the countries analysed.
3 Since this index was computed in 2001 for the first time, the values considered for this variable for the years before 2001 are those of the year 2001. From 2002 on, we take the corresponding value published by EVCA.
16
Regarding the investment side, and to empirically test equation (11), the dependent variable refers
to the total amount invested, divided by the country’s GDP in the same year. In addition to the
independent variables IR, MCAP, EXITS and GDPg, which are described above, the model also
includes R&D, taxes and labour market rigidities. Two measures on R&D are included in order to
try to capture the different effect they may have on the dependent variable. Regarding labour
market rigidities, two different measures are also included. On the one hand, unemployment rates
indicate how rigid the labour market is and reveal unwillingness of firms to hire stable workers
who would be expensive to sack when there is a downturn in the economy. Similarly, regarding
job tenure, when the number of years that a person has been working in the same place is high,
the reluctance to change job is reflecting a high protection of workers. The longer a worker stays
in the same firm, the more expensive it would be for the firm to sack him and the less likely that
worker would be fired. As a result, job tenure reflects labour market rigidity, which is a barrier
for entrepreneurs/firms deciding about their growth projects.
These latter variables would be measured as follows:
o R&D expenditure (RD): Gross domestic expenditure on R&D divided by the country’s
GDP. Source: OECD.
o R&D expenditure financed
by industry (RD_ind):
Share of gross domestic expenditure on R&D financed by
industry, divided by the country’s GDP. Source: OECD.
o Corporate tax (TAX): Measure of the central and sub-central (statutory) corporate
income tax rate, which is composed of the adjusted central
government rate plus the sub-central rate. Source: OECD,
except for Iceland (KPMG).
o Unemployment rate (UR): Harmonised unemployment rates per year. Source: OECD,
except Romania (Eurostat).
17
o Average job tenure
(JOB_TEN):
Average percentage of workers over the whole period that
have been in their current or main job or with their current
employer over 10 years. Source: OECD.
Due to the aggregate nature of the total amount invested in Europe and to the fact that the
determinants on investment might vary according to the stage of development of the firm,
including early stage, expansion and buyouts in the same regression could lead to misleading
results. Therefore, the regression on investments is also run considering as dependent variable: 1)
VC investments, defined as early stage plus expansion, and 2) buyout investments. The
anticipated signs of some variables, such as IR, MCAP, GDPg, UR and JOB_TEN are expected
to remain unchanged, since these variables refer to the environment and do not vary across firms
in the same country, whereas RD, RD_ind and TAX might change when investments are split by
stage of development. In the case of the variable EXITS, and although it varies across firms, the
literature has already given evidence of the significant positive impact of successful investments
in VC but also in PE investments, so no significant differences are expected to be found
according to the stage of development of the firm. Regarding the variable TAX, although it does
not change across firms in the same country, differences may be encountered since there are
larger tax credits on buyout investments.
3.3 Descriptive statistics.
In previous sections there has been evidence of the existence of sharp movements of fundraising
and investment figures over time as well as the short term imbalances between those two
variables in some years. Figure 2 shows the volume of funds raised and invested over the sample
period along with these stylized facts, which highlight, as previously mentioned, the need for a
greater understanding of the main drivers of VC/PE activity.
18
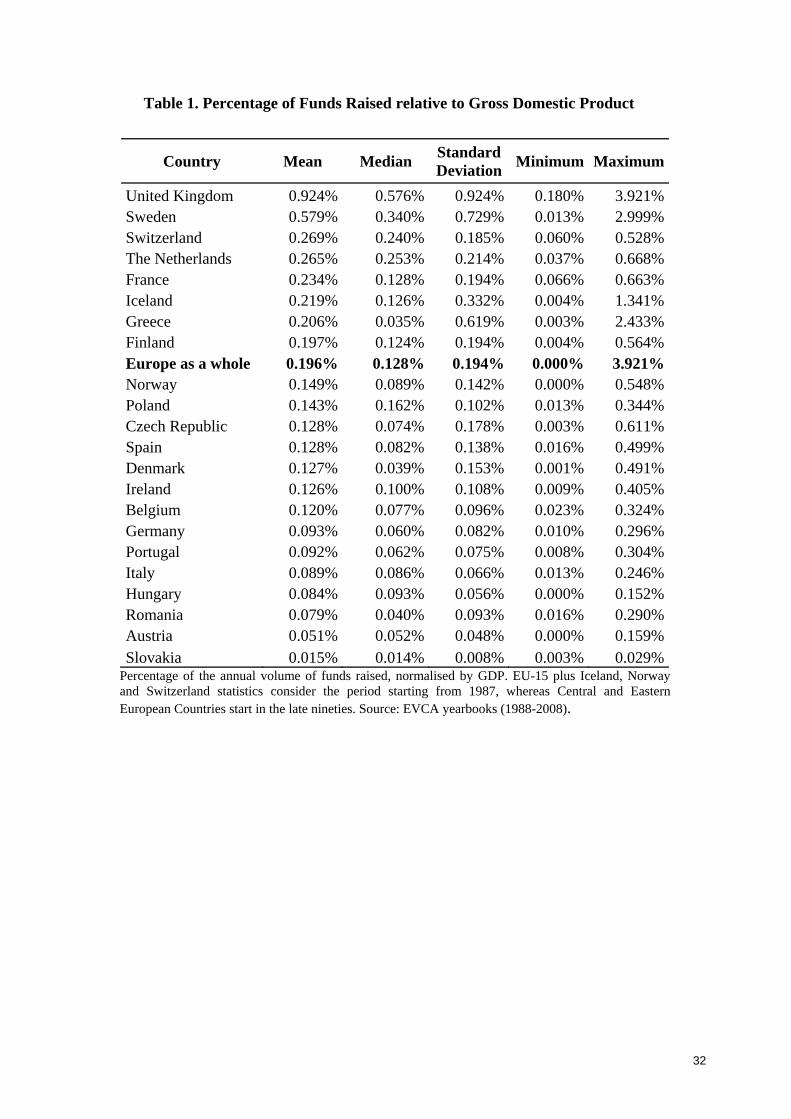
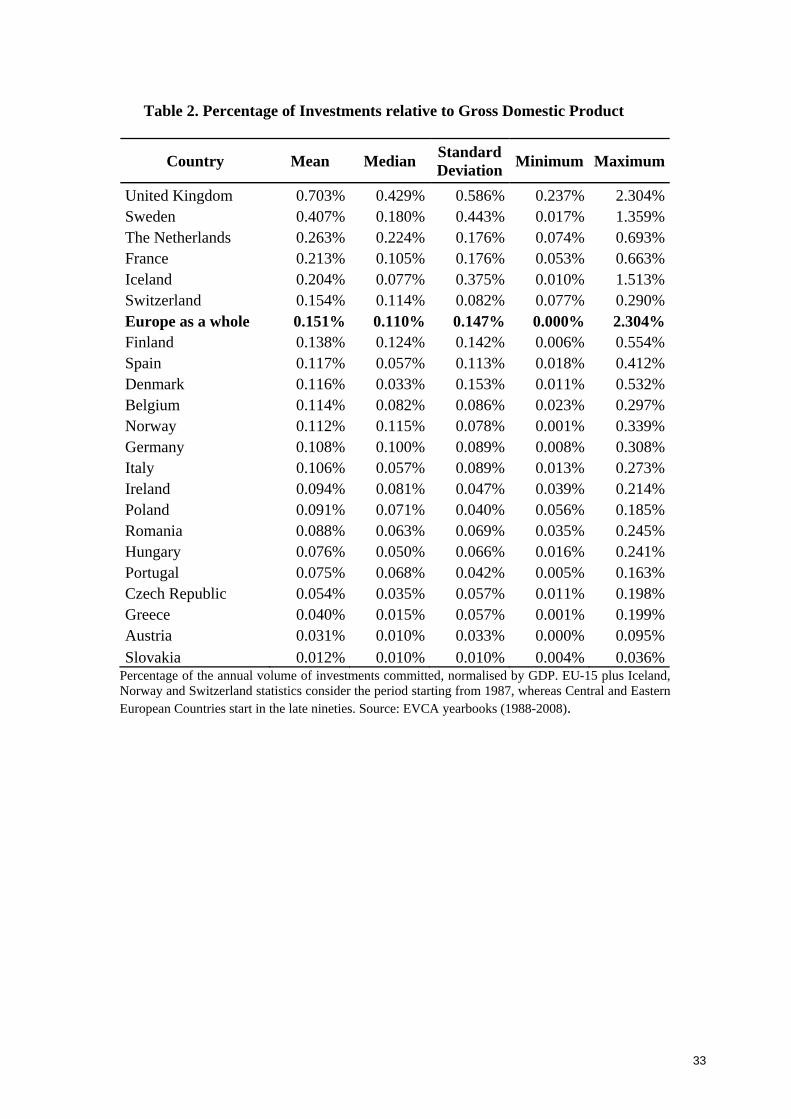
For each country, Tables 1 and 2 show some descriptive statistics (mean, median, standard
deviation, minimum and maximum) of the volume of VC/PE funds raised and the amount
invested, respectively, normalised by GDP. As can be observed, the highest percentage of funds
raised and volume invested are, by far, those of Sweden and the United Kingdom. It is important
to highlight the large difference between the minimum and maximum percentages in all
countries, reflecting the growth of the industry but also the volatility of the values over time.
The growth of fundraising, investment and divestment figures over time, normalised by GDP, is
shown in Table 3. Except for a few years, the VC/PE activity has registered positive growth in
terms of these three variables. The fundraising activity experienced a higher growth in 2005 and
2007. In the case of investments, 1990 and 2007 are the years with the highest growth in activity.
Regarding divestments, 1991 and 2005 record the highest growth.
Table 4 shows the main references of the variables related to the macroeconomic and financial
environment regarding the first submarket. This includes the variables interest rates, stock market
return, market capitalisation, successful divestments, GDP growth and the EVCA INDEX. The
average interest rate has varied from 8.502% for Portugal to 3.934% for Switzerland, with an
atopic value of 18.463% for Romania. The average return of the stock market for the period
analysed has always been, for all countries except Italy, higher than the average interest rate, as
should be expected. The average market capitalisation represents, in relation to the GDP, less
than 1%, except for Switzerland and the United Kingdom, with the mean value for Europe as a
whole being 0.591%. The country with the highest average percentage of divestments carried out
in successful ways, in relation to the GDP, is the United Kingdom, with a value of 0.223%, with
Slovakia being the country recording the lowest value at the 0.001% level. The average value for
Europe is estimated at 0.044%. The average growth of GDP has varied from 0.748% for Italy to
7.327% for Romania during the period analysed. Finally, the average EVCA INDEX, which takes
19
values from 1 to 3, records a maximum value of 2.400 for Austria, and a minimum value of 1.247
for the United Kingdom. The average value for Europe is 2.014.
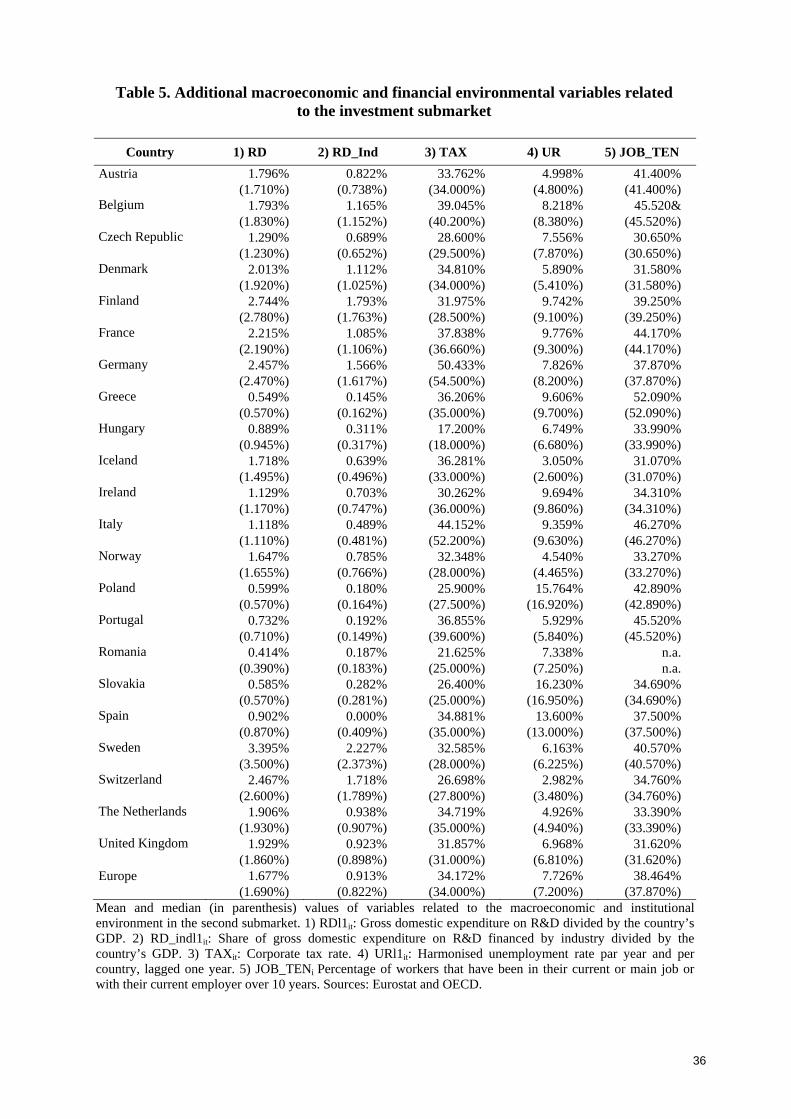
Regarding the macroeconomic and financial environmental variables that affect the second
VC/PE submarket, Table 5 shows the mean and median values (in parenthesis) of the additional
variables, apart from those mentioned in the previous table, that affect the demand side of this
market. These variables include total R&D expenditures, industry-financed R&D expenditures,
corporate tax rates, unemployment rates and average job tenure. The average value of the R&D
spending for Europe as a whole is 1.677%, reaching a maximum of 2.744% for Finland and a
minimum of 0.414% for Romania. The average value of the industrial R&D spending, which
represents a fraction of the total R&D spending, is 0.913% for Europe. The average corporate tax
has been similar for almost all the countries analysed, with the highest differences being those of
Germany and Italy, which register the highest values, and Hungary, which records the minimum
values. Finally, and regarding the variables that capture market labour rigidities, the average
unemployment rate for Europe has been 7.726% during the period analysed, with atypical high
values for Poland, Slovakia and Spain. The average percentage of people with more than 10 years
in the same firm has been 38.464% Europe during the period analysed.
Finally, Table 6 shows the correlations among the variables included in the empirical analysis,
which are related to the macroeconomic and financial environment. The correlations are not very
high, except for the variable representing industry-financed R&D expenditures, which is highly
correlated with total R&D expenditures, as expected, and also with market capitalisation. The
former correlation does not allow us to include total R&D and industry-financed R&D in the
same regressions, so they will be run considering one variable at a time. Regarding the second
correlation, no concerns were found when including both variables in the same regressions.
20
4. RESULTS
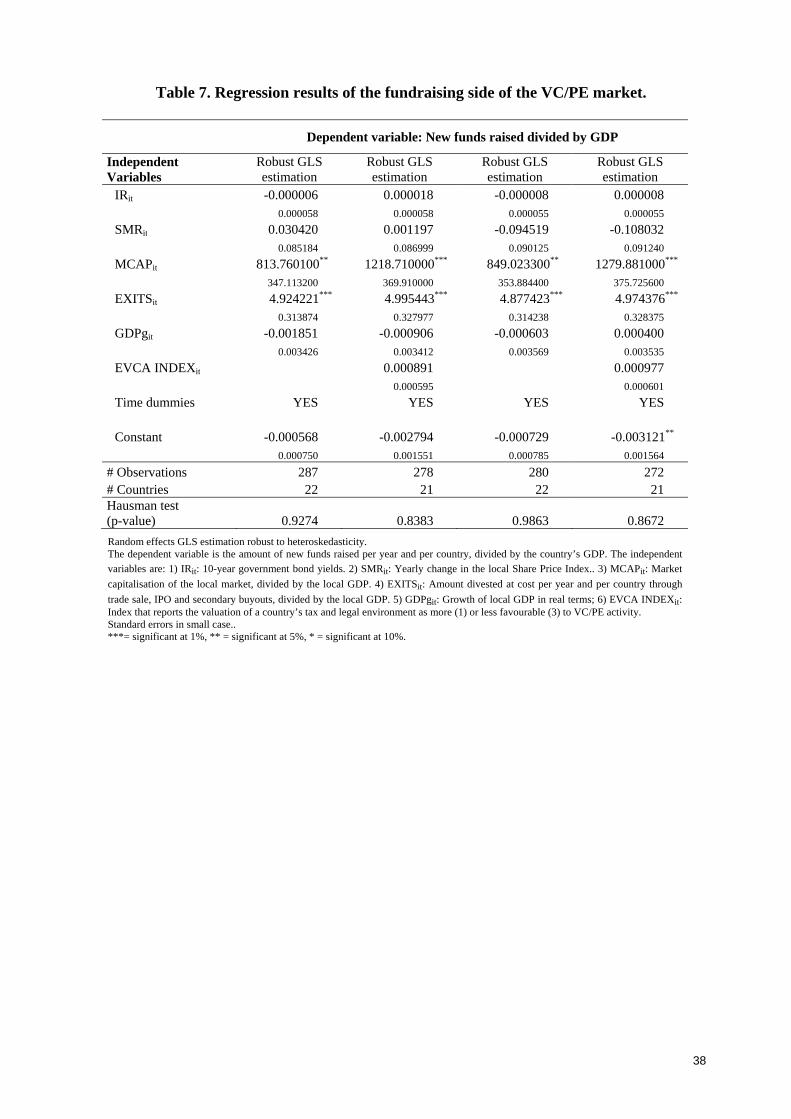
The results regarding the equilibrium in the first VC/PE submarket are presented in Table 7. The
dependent variable represents the volume of funds raised, normalised by GDP. Regarding the
variables that represent the return of other asset classes that are an alternative to VC/PE, the
results show that both the interest rates and the stock market returns are not significant. That is,
the volume of funds raised for the VC/PE activity is not significantly dependent on the return
obtained on alternative assets. This result would be in the line of the existence of non correlation
between VC/PE and other alternative asset classes, thus providing empirical evidence for this
idea. This is one of the reasons for the interest of institutional investors in allocating part of their
portfolio in VC/PE. Regarding the two variables that may proxy liquidity, which are the stock
market capitalisation and the successful divestments carried out, the results show that the
coefficients of both variables are positive and significant. The stock market capitalisation may be
taken as the level of development of the financial economy in a country, so that the more
developed the financial market is, the more funds are raised for VC/PE. As already said, this
variable can also be considered as a measure of liquidity of the markets, so that more funds would
be raised as the market becomes more liquid. The liquidity that is specific to the VC/PE activity
may be captured by the variable successful divestments. It accounts for divestments carried out
through IPOs, secondary buyouts and trade sales, which are considered the best ways to exit an
investment. The fact that the money is returning to investors by means of a successful way that is
valuable for them, positively affects the volume of funds raised. Finally, neither the GDP growth
nor the EVCA INDEX has a significant impact on the volume of funds raised. All the regressions
include time year dummies to capture the cyclicality that is typical in the VC/PE markets. The
regressions that include the EVCA INDEX include data only on 21 countries, since data for this
variable in the case of Iceland are missing. The Hausman (1978) test indicates that the random
effects approach is the adequate one, so a robust generalised least square estimation is performed.
21
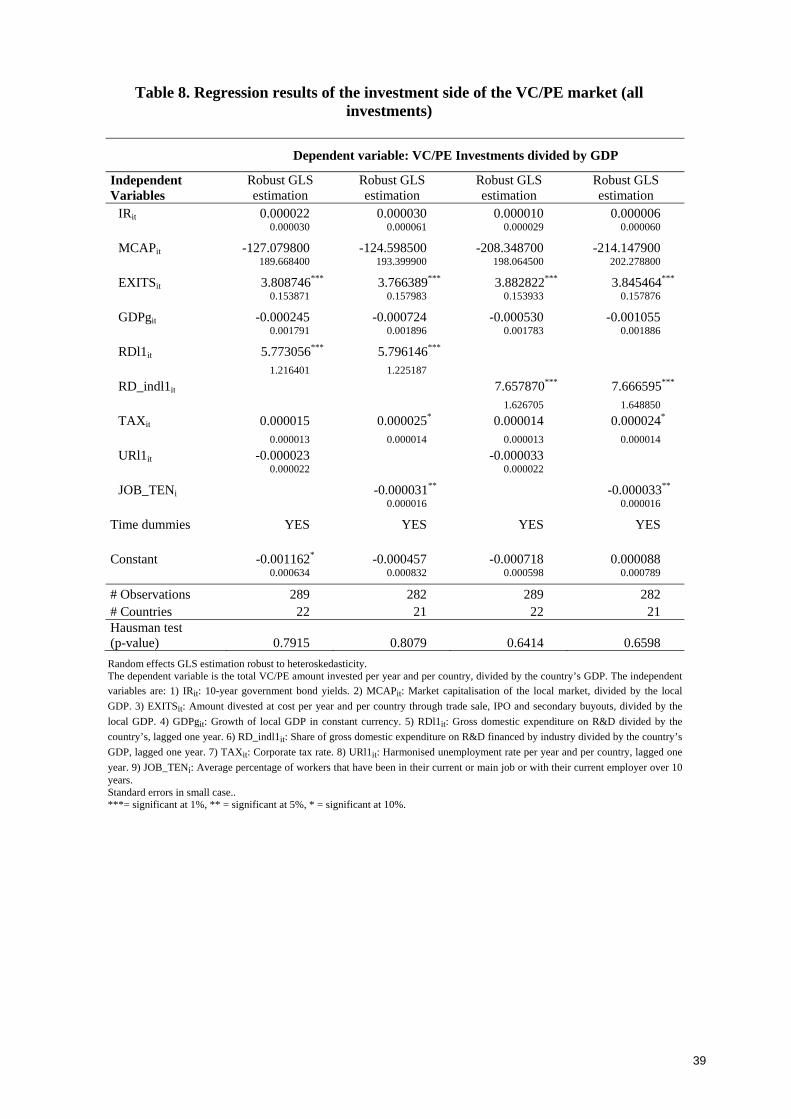
Table 8 shows the results for the second VC/PE submarket, where the dependent variable is the
volume of investments normalised by GDP. The regressions considering all investments are
performed using a generalised least square estimation, since the Hausman (1978) test suggests the
existence of random effects. . It should be noted that the variables RD and RD_ind are lagged one
year in the regression, since the effect of the amounts spend on R&D is not immediate. Also, the
variable UR is lagged one year to capture the rigidity of the labour market at the beginning of the
period analysed4. The results show that the coefficient of one of the variables related to liquidity,
namely successful divestments, is positive and significant. This means that liquidity is important,
not only on the fundraising side but also on the investment side of the market, so that both
investors and VC/PE companies are more willing to provide funds and invest in VC/PE when the
liquidity specific to this activity increases by means of successful divestments. As expected, the
coefficients of the variables related to R&D spending are also positive and significant. This
means that when there is an increase in the amount of money devoted to R&D activities, more
VC/PE money is invested the following year to bring to the market the anticipated results
deriving from these activities. Although we can not test the causality issue due to the lack of data,
the fact that R&D spending affects the volume of investments carried out is in line with
Geronikolaou and Papachristou (2008), who find that innovation seems to create a demand for
VC and not VC a supply of innovation. In the same vein, the lag considered in the regression
could also mitigate potential endogeneity concerns. One of the two coefficients of the variables
related to rigidities in the labour market is negative and significant, which is consistent with the
predictions. The coefficients related to interest rates, market capitalisation and GDP growth are
not significant. It is also important to remark that time dummies capture the main shocks in the
industry, such as the peaks of the internet bubble and the buyout market.
4 The variable JOB_TEN is a time invariant variable, so the effect of lagging it one year would only imply missing data.
22
Finally, the coefficient of the variable Corporate Tax is positive and significant in some
specifications, albeit only at a 10 per cent level. This is contrary to what was expected in VC
investments, since an increase in the taxes paid by investee firms would reduce their after tax
income, thus increasing the barriers to becoming an entrepreneur and reducing the expected
return on VC/PE investments. Nevertheless, regarding buyout investments, which are highly
levered, an increase in corporate taxes would also increase the tax credits. Bearing in mind this
latter finding and considering that the drivers of the VC/PE investments that are important may be
different according to the stage of development of the firms, the investment regression was run
again by splitting the total amount invested in VC investments, comprising early stage plus
expansion investments, and buyouts. The regression results are shown, respectively, in Tables 9
and 10.
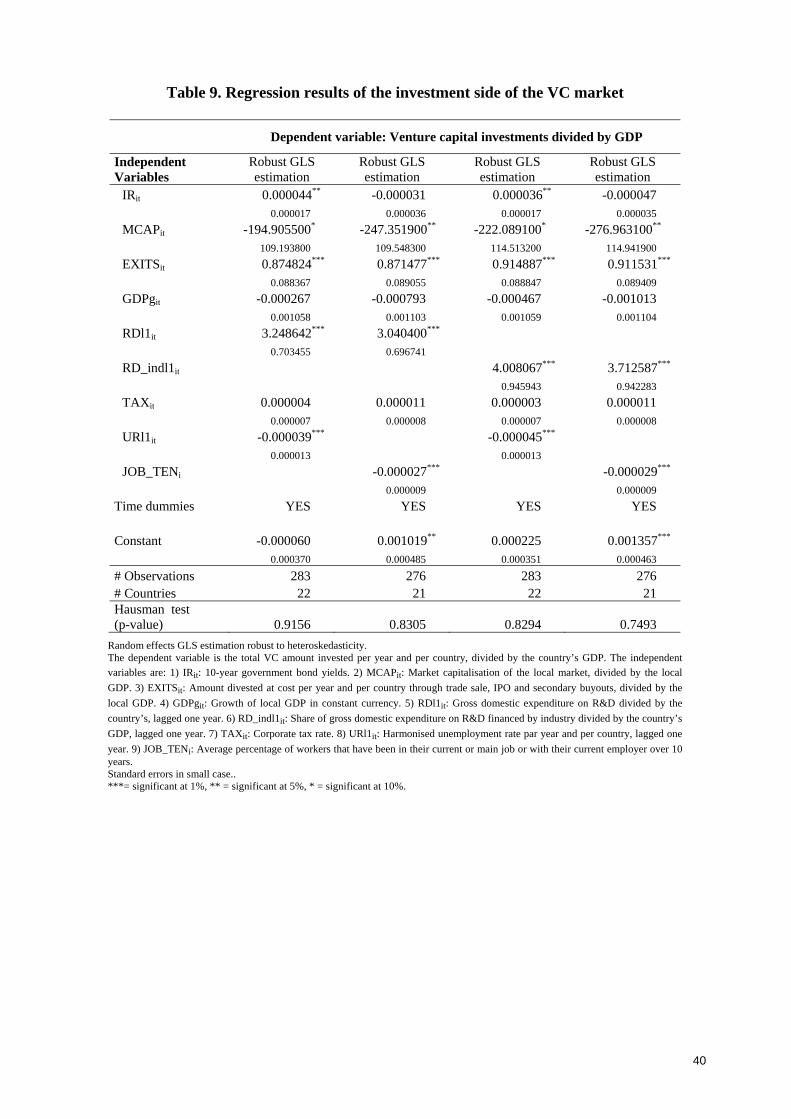
The results including early and expansion stage investments are presented in Table 9. As in the
case of all investments, the coefficient regarding GDP growth is not significant. The coefficients
of the variables successful divestments and R&D spending are positive and significant, as before.
Regarding the variables aimed at capturing labour market rigidities, the coefficients of both
variables are negative and highly significant. But the greatest changes arise in market
capitalisation and interest rates. According to the model, the coefficient related to market
capitalisation could either be positive or negative. As it stands for VC investments, the negative
sign of the coefficient may be reflecting that when there is enough liquidity in the capital markets
the need to access to VC funding may fall. Regarding interest rates, a negative sign of the
coefficient was expected due to the effect on the after tax earnings of investee firms. The only
explanation for this positive effect is that VC investments may become more attractive as an
alternative to the use of debt when the interest rates rise. As in the previous cases, the Hausman
(1978) test indicates that the appropriate methodology is the generalised least square estimation.
23
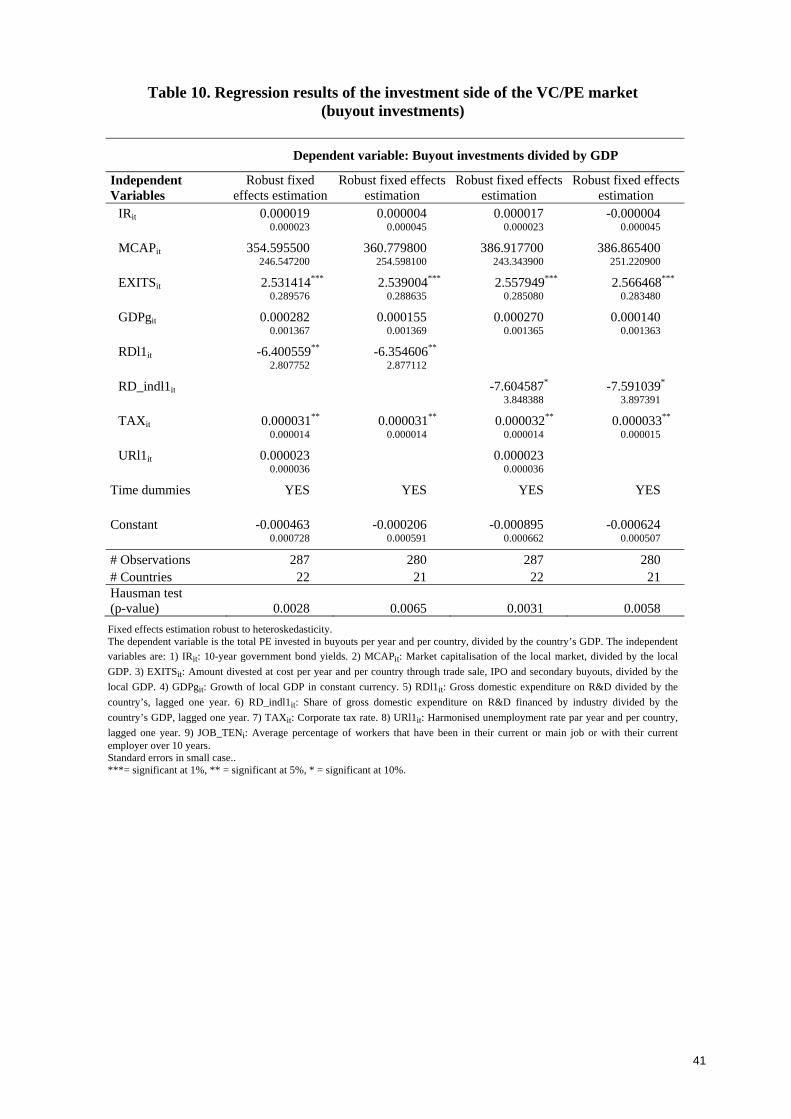
Finally, the results regarding buyout investments are presented in Table 10. In this case, the
results of the Hausman (1978) test recommend the fixed effects methodology as the most suitable
one. Therefore, the variables that do not change over time but only across countries are dropped
from the estimation, as is the case for the job tenure variable. The results for this subgroup of
investments are rather similar to the ones presented in the case of the total amount invested.
However, there is one striking result regarding the R&D spending, the coefficient of which now
becomes negative and significant. Nevertheless, this result could be explained by the fact that
targets in buyout acquisitions are usually mature firms belonging to low-technology industries.
Finally, the coefficient of the corporate tax variable now becomes positive and significant in all
specifications, as expected in buyout investments due to the larger tax credits on those levered
acquisitions. The results in the previous two tables confirm that the determinants of the volume of
investments are slightly different according to the stage of development of the investee firm and
that it is necessary to separate them in the analysis of the investment side of the VC/PE market.
5 CONCLUSIONS AND DISCUSSION
The determinants of the level of VC/PE activity have received scant interest in the literature. One
of the reasons for this is the limited information available, with only one observation per year in
most cases, or the unobservable nature of some of the variables. But another reason may be the
lack of a well-established theoretical base able to explain the determinants of the VC/PE market
as a whole. The main theoretical and empirical contributions focus either on analysing the
determinants of fundraising (Gompers and Lerner, 1998) or the determinants of investment
activity (Jeng and Wells, 2000; Schertler, 2003; Romain and Van Pottelsberge, 2004; among
others).
This paper builds on Gompers and Lerner (2002), who describe the inelasticity of short term
supply of funds to VC/PE firms when there is a shock in demand. Based on this we argue that the
24
lags in the fundraising process (12-18 months) and in the allocation of investments (3-4 years)
lead to an effective split of the market into two parts, with VC/PE managers playing the role as
agents demanding funds, on the fundraising side of the market, and, later, as suppliers of funds to
unlisted firms, on the investment side of the market.
The model proposed in this paper aims to analyse supply and demand in both submarkets
separately, with the amount of funds raised being the equilibrium reached between investors and
VC/PE managers at a given return. Similarly, the volume of investments committed would
represent the equilibrium between VC/PE managers and entrepreneurs/firms. The interaction
between supply and demand on the fundraising side leads to the definition of new funds raised as
a function of the returns of alternative assets, market capitalisation, industry-specific liquidity
measures and GDP growth. Regarding the investment side, the determinants of the volume
invested are interest rates, market capitalisation, industry-specific liquidity measures, GDP
growth, R&D expenditures, corporate taxes and labour market rigidities.
The model is tested on a sample of 22 European countries over the period 1987-2007. As regards
fundraising, references of liquidity have a significant effect, whereas the return of alternative
asset classes is not significantly related to new funds raised. On the investment side, the results
also highlight the importance of industry-specific liquidity references, such as IPO, trade sales
and secondary buyouts. Nevertheless, the remaining determinants seem to be affected by the mix
of investment in firms at different stages. When VC investments are considered, the coefficients
of R&D expenditures are positive and significant, whereas unemployment rates and the average
job tenure in the country exert a negative effect, as expected. Regarding buyouts, a negative
relationship between R&D spending and investments is found, since levered acquisitions focus on
mature industries. Additionally, a positive one is found between corporate taxes and investments,
due to the important tax credits of debt in these firms.

25
This paper contributes to the literature in several ways. Regarding theory, a ‘double market’
approach is presented, introducing an explanation of the determinants of supply and demand in
both submarkets. The model is tested using the largest multi-country sample ever collected with
homogeneous data, with results that fit in with the model and are in line with previous empirical
work in the literature. One further contribution that has implications for practitioners is the
limited correlation between VC/PE and other asset classes, which is frequently presented by
VC/PE managers as a reason for including VC/PE in the portfolios of institutional investors.
The limitations of this research have to do with the inability to access data on fundraising that is
broken down between VC and buyouts in order to test whether the determinants are different in
both markets. Regarding the model, more variables related to the entrepreneurial environment
could also be added, but this again could only be made possible as more data are available.
Regarding the implications for policy makers, the importance of liquidity should be highlighted,
since this risky activity is based on illiquid long-term investments. Well developed markets make
it easier for VC/PE organizations to raise funds that would then be allocated to unlisted firms to
fill the equity gap. Nevertheless, the need to create NASDAQ-type markets in the past has led to
serious failures. Before ‘creating’ any market, measures should be taken to increase the amount
of shares from unlisted firms in the hands of private individuals. Special schemes to incentivise
this investment focus are required well in advance of the creation of any market. Also, evidence
of the positive impact that R&D expenditures exert on the volume of VC investments in the
following year is found. Thus, policy makers should create schemes that help to increase R&D
expenditures, because the amounts committed by VC institutions should increase in the short run.
Finally, policies aimed at developing the VC/PE market would in turn attract foreign investors,
since Schertler and Tykvova (2006) show that PE investors consider mature PE markets as a
potential source of partnership, rather than rivalry, which facilities cross border PE flows.
26
There are at least three issues pending for further research. First, a dynamic version of the model
might help to give a better explanation of the determinants of this activity. However, this could
only become possible with more data available to use a sufficient number of instruments. Second,
there should also be an extension of the model to analyse equilibrium at the fund level, in order to
test whether differences in the main drivers of funds also exist according to the stage of
development of the firm. Finally, it is important to study the linkage between fundraising and
investment over time so as to reduce the imbalances recorded in the past, which sometimes lead
to a shortage of funds in the market while at other times there is a surplus of money that
determines rapid price increases.
27
REFERENCES
Alemany, L., Martí, J., 2005. Unbiased Estimation of Economic Impact of Venture Capital
Backed Firms. European Finance Association (EFA) 2005 Conference.
Balboa, M., Martí, J., 2006. Overreaction in Venture Capital and Private Equity Markets:
Evidence from European Markets before the Burst of the Bubble, in: P. Barnes (Ed.),
Economic Perspectives on Innovation and Invention, Hauppauge NY: Nova Science
Publishers, 1-22.
Balboa, M., Martí, J., 2007. Factors that Determine the Reputation of Private Equity Managers in
Developing Markets. Journal of Business Venturing 22, 4, 453-480.
Belke, A., Fehn, R., Foster, N., 2003. Does Venture Capital Investment Spur Employment
Growth?. CESifo Working Paper 930, Munich.
Black, B.S., Gilson, R.J., 1998. Venture Capital and the Structure of Capital Markets. Banks
versus Stock Markets. Journal of Financial Economics 47, 243-277.
Bygrave, W.D., Shulman, J., 1988. Capital Gains Tax: Bain or Boon, in: Kirchhoff, B.A. et al.,
(Eds.), Frontiers of Entrepreneurship Research, Wellesley, MA: Babson College, 324-338.
Bygrave, W.D., Timmons, J.A., 1985. An Empirical Model for the Flows of Venture Capital, in:
Hornaday, J.A. et al., (Eds.), Frontiers of Entrepreneurial Research, Wellesley, MA:
Babson College, 105-125.
Chan, Y.S., 1983., On the Positive Role of Financial Intermediation in Allocation of Venture
Capital in a Market with Imperfect Information. Journal of Finance 38, 5, 1543-1568.

28
Davila, A., Foster, G., Gupta, M., 2003. Venture Capital Financing and the Growth of Start-up
Firms. Journal of Business Venturing 18, 6, 689-708.
Engel, D., Keilbach, M., 2002. Firm Level Implications of Early Stage Venture Capital
Investment: an Empirical Investigation. Discussion Paper 02-82, Mannheim, ZEW.
Fried, V.H., Hisrich, R.D., 1994. Towards a Model of Venture Capital Investment Decision
Making. Financial Management 23, 3, 28-37.
Geronikolaou, G., Papachristou, G.A., 2008. Venture Capital and Innovation in Europe.
http://ssrn.com/abstract=1309186.
Gompers, P.A., Lerner, J., 1998, What Drives Venture Capital Fundraising?. Brookings Papers on
Economic Activity. Microeconomics 1998, 149–204.
Gompers, P.A., Lerner J. 2001. The Venture Capital Revolution. Journal of Economic
Perspectives 15, 2, 145-168.
Gompers, P.A., Lerner J., 2002. Short-Term America Revisited? Boom and bust in the Venture
Capital Industry and the impact on innovation, in: NBER Books (Eds.), Innovation Policy
and the Economy, Cambridge, Massachussetts, The MIT Press, 1-28.
Hausman, J., 1978. Specification Tests in Econometrics. Econometrica 46, 6, 1251-1271.
Hellmann, T., Puri, M., 2000. The Interaction between Product Market and Financing Strategy:
the Role of Venture Capital. Review of Financial Studies 13, 4, 959-984.
Jagwani, J., 2000. Supply and Demand of Venture Capital in the US. The Park Place Economist
8, 90-98.
29
Jeng, L.A., Wells, P.C., 2000. The Determinants of Venture Capital Funding: Evidence across
Countries. Journal of Corporate Finance 6, 241-289.
Kortum, S., Lerner, J., 2000. Assessing the Contribution of Venture Capital to Innovation. The
Rand Journal of Economics 31, 4, 674-692.
Macmillan Committee, 1931. The Report of the Committee on Finance and Industry: the
Macmillan Report. London: Her Majesty’s Stationery Office, HMSO.
Manigart, S., Beuselinck, C., 2001. Supply of Venture Capital by European Governments.
Universiteit Gent, Working Paper 111.
McGlue, D., 2002. The Funding of Venture Capital in Europe: Issues for Public Policy. Venture
Capital 4, 1, 45-58.
Messica, A., Agmon, T., 2007. Empirical Evidence on a Supply-driven Venture Capital Market in
the USA. International Journal of Entrepreneurship 1, 2, 207-219.
Poterba, J.M., 1989. Venture Capital and Capital Gains Taxation. Working paper 2832,
Cambridge, Massachusetts: National Bureau of Economic Research, NBER.
Romain, A., Van Pottelsberghe, B., 2004. The Determinants of Venture Capital: Additional
Evidence. Working Paper 19, Frankfurt: Deutche Bundesbank.
Sahlman, W.A., 1990. The Structure and Governance of Venture Capital Organizations. Journal
of Financial Economics 27, 2, 473-521.
Schertler, A., 2003. Driving Forces of Venture Capital Investments in Europe: A Dynamic Panel
Data Analysis. Working paper 03-27, Kiel: Kiel Institute for World Economics.

30
Schertler, A., Tykvova, T., 2006. Rivals or Partners? Evidence from Europe’s International
Private Equity Deals. Discussion paper 06-91, Mannheim, ZEW.
Tykvova, T., 2000. Venture Capital in Germany and its impact on innovation. European Financial
Management Association (EFMA) 2000 Conference.
31
Figure 1. The ‘double market’ approach in VC/PE activity
Investors
VC/PEinstitutions
FUNDS RAISED
Supply
Demand
Unquotedfirms
INVESTMENTS
Supply
Demand
Source: Own elaboration.
Figure 2. Aggregate private equity flows in Europe
0
20,000
40,000
60,000
80,000
100,000
120,000
1987 1988 1989 1990 1991 1992 1993 1994 1995 1996 1997 1998 1999 2000 2001 2002 2003 2004 2005 2006 2007
€ M
illio
n
New funds raised Investments
Source: EVCA 1988-2008 Yearbooks.
32
Table 1. Percentage of Funds Raised relative to Gross Domestic Product
Country Mean Median Standard Deviation
Minimum Maximum
United Kingdom 0.924% 0.576% 0.924% 0.180% 3.921%Sweden 0.579% 0.340% 0.729% 0.013% 2.999%Switzerland 0.269% 0.240% 0.185% 0.060% 0.528%The Netherlands 0.265% 0.253% 0.214% 0.037% 0.668%France 0.234% 0.128% 0.194% 0.066% 0.663%Iceland 0.219% 0.126% 0.332% 0.004% 1.341%Greece 0.206% 0.035% 0.619% 0.003% 2.433%Finland 0.197% 0.124% 0.194% 0.004% 0.564%Europe as a whole 0.196% 0.128% 0.194% 0.000% 3.921%Norway 0.149% 0.089% 0.142% 0.000% 0.548%Poland 0.143% 0.162% 0.102% 0.013% 0.344%Czech Republic 0.128% 0.074% 0.178% 0.003% 0.611%Spain 0.128% 0.082% 0.138% 0.016% 0.499%Denmark 0.127% 0.039% 0.153% 0.001% 0.491%Ireland 0.126% 0.100% 0.108% 0.009% 0.405%Belgium 0.120% 0.077% 0.096% 0.023% 0.324%Germany 0.093% 0.060% 0.082% 0.010% 0.296%Portugal 0.092% 0.062% 0.075% 0.008% 0.304%Italy 0.089% 0.086% 0.066% 0.013% 0.246%Hungary 0.084% 0.093% 0.056% 0.000% 0.152%Romania 0.079% 0.040% 0.093% 0.016% 0.290%Austria 0.051% 0.052% 0.048% 0.000% 0.159%Slovakia 0.015% 0.014% 0.008% 0.003% 0.029%
Percentage of the annual volume of funds raised, normalised by GDP. EU-15 plus Iceland, Norway and Switzerland statistics consider the period starting from 1987, whereas Central and Eastern European Countries start in the late nineties. Source: EVCA yearbooks (1988-2008).
33
Table 2. Percentage of Investments relative to Gross Domestic Product
Country Mean Median Standard Deviation
Minimum Maximum
United Kingdom 0.703% 0.429% 0.586% 0.237% 2.304%Sweden 0.407% 0.180% 0.443% 0.017% 1.359%The Netherlands 0.263% 0.224% 0.176% 0.074% 0.693%France 0.213% 0.105% 0.176% 0.053% 0.663%Iceland 0.204% 0.077% 0.375% 0.010% 1.513%Switzerland 0.154% 0.114% 0.082% 0.077% 0.290%Europe as a whole 0.151% 0.110% 0.147% 0.000% 2.304%Finland 0.138% 0.124% 0.142% 0.006% 0.554%Spain 0.117% 0.057% 0.113% 0.018% 0.412%Denmark 0.116% 0.033% 0.153% 0.011% 0.532%Belgium 0.114% 0.082% 0.086% 0.023% 0.297%Norway 0.112% 0.115% 0.078% 0.001% 0.339%Germany 0.108% 0.100% 0.089% 0.008% 0.308%Italy 0.106% 0.057% 0.089% 0.013% 0.273%Ireland 0.094% 0.081% 0.047% 0.039% 0.214%Poland 0.091% 0.071% 0.040% 0.056% 0.185%Romania 0.088% 0.063% 0.069% 0.035% 0.245%Hungary 0.076% 0.050% 0.066% 0.016% 0.241%Portugal 0.075% 0.068% 0.042% 0.005% 0.163%Czech Republic 0.054% 0.035% 0.057% 0.011% 0.198%Greece 0.040% 0.015% 0.057% 0.001% 0.199%Austria 0.031% 0.010% 0.033% 0.000% 0.095%Slovakia 0.012% 0.010% 0.010% 0.004% 0.036%
Percentage of the annual volume of investments committed, normalised by GDP. EU-15 plus Iceland, Norway and Switzerland statistics consider the period starting from 1987, whereas Central and Eastern European Countries start in the late nineties. Source: EVCA yearbooks (1988-2008).

34
Table 3. Growth of Private Equity activity relative to Gross Domestic Product
Year Fundraising Investments Divestments
Mean Standard Deviation
Mean Standard Deviation
Mean Standard Deviation
1988 42.950% 99.806% 9.383% 41.751% 120.049% 176.273%1989 61.093% 247.267% 49.714% 167.992% -15.556% 63.177%1990 34.438% 153.494% 392.864% 1333.152% 135.718% 327.234%1991 8.444% 71.394% 10.484% 70.335% 140.234% 294.894%1992 6.471% 70.264% 53.678% 253.963% 66.936% 208.674%1993 80.090% 176.318% -0.013% 57.307% 54.446% 121.265%1994 110.209% 205.296% 53.027% 91.434% -6.412% 66.788%1995 126.103% 526.966% -2.459% 40.049% 69.669% 241.149%1996 117.588% 313.549% 36.468% 103.907% 54.113% 187.682%1997 238.752% 463.822% 98.595% 194.894% 35.905% 62.501%1998 184.048% 362.496% 48.125% 84.070% 97.148% 192.713%1999 44.776% 77.100% 88.370% 110.764% 126.946% 251.059%2000 103.482% 124.838% 95.539% 141.598% 25.024% 77.662%2001 21.418% 212.865% -3.054% 103.588% 48.450% 133.572%2002 -12.547% 53.439% -15.063% 41.301% 13.093% 93.095%2003 14.141% 86.453% 19.196% 67.161% 38.078% 104.106%2004 87.020% 233.923% 9.067% 54.212% 36.338% 88.799%2005 245.765% 691.780% 22.509% 50.492% 185.969% 396.736%2006 138.678% 332.390% 35.054% 89.720% -5.956% 42.901%2007 361.442% 859.719% 239.386% 617.645% 68.842% 133.046%
Growth of the annual volume of funds raised, investments and divestments, normalised by GDP. Source: EVCA yearbooks (1988-2008).

35
Table 4. Macroeconomic and financial environmental variables related to the fundraising submarket
Country 1) IR 2) SMR 3) MCAP 4) EXITS 5) GDPg 6) EVCA INDEX
Austria 5.882% 14.491% 0.201% 0.010% 2.682% 2.400 (5.680%) (12.060%) (0.147%) (0.002%) (3.000%) (2.530) Belgium 6.296% 9.127% 0.538% 0.037% 2.907% 2.000 (5.750%) (7.625%) (0.459%) (0.019%) (2.772%) (2.140) Czech Republic 5.100% 18.994% 0.321% 0.015% 7.327% 2.181 (4.820%) (20.030%) (0.246%) (0.015%) (7.416%) (2.120) Denmark 6.766% 12.700% 0.485% 0.009% 2.454% 2.359 (6.250%) (13.485%) (0.399%) (0.003%) (2.396%) (2.480) Finland 7.184% 16.275% 0.906% 0.034% 1.730% 2.196 (5.720%) (8.110%) (0.751%) (0.028%) (4.101%) (2.250) France 6.301% 9.226% 0.545% 0.086% 2.274% 1.945 (5.580%) (12.195%) (0.434%) (0.076%) (2.571%) (2.090) Germany 5.724% 8.024% 0.326% 0.025% 2.684% 2.366 (5.640%) (13.760%) (0.243%) (0.017%) (2.810%) (2.410) Greece 6.378% 15.010% 0.481% 0.006% 1.480% 1.849 (5.210%) (10.565%) (0.494%) (0.003%) (3.648%) (1.960) Hungary 7.663% 17.893% 0.259% 0.029% 3.371% 1.852 (7.120%) (15.820%) (0.256%) (0.026%) (4.004%) (1.860) Iceland 5.511% 19.123% 0.005% 0.024% 2.511% n.a. (5.300%) (22.120%) (0.005%) (0.019%) (2.295%) n.a. Ireland 6.694% 13.403% 0.606% 0.018% 6.814% 1.529 (6.290%) (16.810%) (0.599%) (0.012%) (6.094%) (1.580) Italy 8.111% 7.838% 0.317% 0.036% 0.748% 1.930 (6.860%) (10.545%) (0.300%) (0.025%) (1.817%) (1.960) Norway 7.009% 17.521% 0.378% 0.032% 4.529% 2.044 (6.310%) (21.490%) (0.341%) (0.023%) (3.938%) (2.040) Poland 7.557% 18.636% 0.234% 0.029% 4.403% 2.110 (6.920%) (22.600%) (0.170%) (0.024%) (7.141%) (2.130) Portugal 8.502% 11.171% 0.290% 0.022% 3.819% 2.176 (6.360%) (11.310%) (0.274%) (0.018%) (2.410%) (2.320) Romania 18.463% 42.964% 0.113% 0.022% 3.136% 2.335 (17.730%) (37.380%) (0.099%) (0.023%) (3.355%) (2.350) Slovakia 8.326% 19.964% 0.128% 0.001% 5.537% 2.402 (5.965%) (14.130%) (0.106%) (0.000%) (6.623%) (2.490) Spain 8.007% 15.725% 0.539% 0.024% 3.194% 2.051 (6.400%) (11.770%) (0.525%) (0.012%) (4.331%) (2.170) Sweden 7.316% 13.758% 0.911% 0.102% 1.237% 2.085 (5.995%) (20.530%) (0.868%) (0.048%) (2.868%) (2.090) Switzerland 3.934% 10.220% 1.710% 0.032% 1.442% 1.925 (3.380%) (12.740%) (1.850%) (0.021%) (1.228%) (1.950) The Netherlands 5.791% 9.758% 0.971% 0.075% 3.295% 1.759 (5.580%) (14.115%) (0.918%) (0.062%) (3.276%) (1.790) U. Kingdom 7.073% 7.956% 1.260% 0.223% 3.396% 1.247 (7.130%) (12.625% (1.200% (0.170% (2.945%) (1.200) Europe 6.922% 13.400% 0.591% 0.044% 3.039% 2.014 (5.750%) (13.860% (0.422%) (0.021%) (3.049%) (2.090)
Mean and median (in parenthesis) values of variables related to the macroeconomic and institutional environment in the first submarket. 1) IRit: 10-year government bond yields. 2) SMRit: Yearly change in the local Share Price Index.. 3) MCAPit: Market capitalisation of the local market, divided by the local GDP. 4) EXITSit: Amount divested at cost per year and per country through trade sale, IPO and secondary buyouts, divided by the local GDP. 5) GDPgit: Growth of local GDP in constant currency; 6) EVCA INDEXit: Index that reports the valuation of a country’s tax and legal environment as more (1) or less favourable (3) to VC/PE activity. Sources: Eurostat, OECD and EVCA.
36
Table 5. Additional macroeconomic and financial environmental variables related to the investment submarket
Country 1) RD 2) RD_Ind 3) TAX 4) UR 5) JOB_TEN
Austria 1.796% 0.822% 33.762% 4.998% 41.400% (1.710%) (0.738%) (34.000%) (4.800%) (41.400%) Belgium 1.793% 1.165% 39.045% 8.218% 45.520& (1.830%) (1.152%) (40.200%) (8.380%) (45.520%) Czech Republic 1.290% 0.689% 28.600% 7.556% 30.650% (1.230%) (0.652%) (29.500%) (7.870%) (30.650%) Denmark 2.013% 1.112% 34.810% 5.890% 31.580% (1.920%) (1.025%) (34.000%) (5.410%) (31.580%) Finland 2.744% 1.793% 31.975% 9.742% 39.250% (2.780%) (1.763%) (28.500%) (9.100%) (39.250%) France 2.215% 1.085% 37.838% 9.776% 44.170% (2.190%) (1.106%) (36.660%) (9.300%) (44.170%) Germany 2.457% 1.566% 50.433% 7.826% 37.870% (2.470%) (1.617%) (54.500%) (8.200%) (37.870%) Greece 0.549% 0.145% 36.206% 9.606% 52.090% (0.570%) (0.162%) (35.000%) (9.700%) (52.090%) Hungary 0.889% 0.311% 17.200% 6.749% 33.990% (0.945%) (0.317%) (18.000%) (6.680%) (33.990%) Iceland 1.718% 0.639% 36.281% 3.050% 31.070% (1.495%) (0.496%) (33.000%) (2.600%) (31.070%) Ireland 1.129% 0.703% 30.262% 9.694% 34.310% (1.170%) (0.747%) (36.000%) (9.860%) (34.310%) Italy 1.118% 0.489% 44.152% 9.359% 46.270% (1.110%) (0.481%) (52.200%) (9.630%) (46.270%) Norway 1.647% 0.785% 32.348% 4.540% 33.270% (1.655%) (0.766%) (28.000%) (4.465%) (33.270%) Poland 0.599% 0.180% 25.900% 15.764% 42.890% (0.570%) (0.164%) (27.500%) (16.920%) (42.890%) Portugal 0.732% 0.192% 36.855% 5.929% 45.520% (0.710%) (0.149%) (39.600%) (5.840%) (45.520%) Romania 0.414% 0.187% 21.625% 7.338% n.a. (0.390%) (0.183%) (25.000%) (7.250%) n.a. Slovakia 0.585% 0.282% 26.400% 16.230% 34.690% (0.570%) (0.281%) (25.000%) (16.950%) (34.690%) Spain 0.902% 0.000% 34.881% 13.600% 37.500% (0.870%) (0.409%) (35.000%) (13.000%) (37.500%) Sweden 3.395% 2.227% 32.585% 6.163% 40.570% (3.500%) (2.373%) (28.000%) (6.225%) (40.570%) Switzerland 2.467% 1.718% 26.698% 2.982% 34.760% (2.600%) (1.789%) (27.800%) (3.480%) (34.760%) The Netherlands 1.906% 0.938% 34.719% 4.926% 33.390% (1.930%) (0.907%) (35.000%) (4.940%) (33.390%) United Kingdom 1.929% 0.923% 31.857% 6.968% 31.620% (1.860%) (0.898%) (31.000%) (6.810%) (31.620%) Europe 1.677% 0.913% 34.172% 7.726% 38.464% (1.690%) (0.822%) (34.000%) (7.200%) (37.870%) Mean and median (in parenthesis) values of variables related to the macroeconomic and institutional environment in the second submarket. 1) RDl1it: Gross domestic expenditure on R&D divided by the country’s GDP. 2) RD_indl1it: Share of gross domestic expenditure on R&D financed by industry divided by the country’s GDP. 3) TAXit: Corporate tax rate. 4) URl1it: Harmonised unemployment rate par year and per country, lagged one year. 5) JOB_TENi Percentage of workers that have been in their current or main job or with their current employer over 10 years. Sources: Eurostat and OECD.

37
Table 6. Correlations among the macroeconomic and institutional variables
1 2 3 4 5 6 7 8 9 10 11 1 1 2 -0.08 1 (0.11) 3 -0.42 0.12 1 (0.00) (0.03) 4 -0.20 0.02 0.44 1 (0.00) (0.76) (0.00) 5 -0.24 0.19 0.05 0.04 1 (0.00) (0.00) (0.33) (0.53) 6 0.22 -0.03 -0.44 -0.44 -0.05 1 (0.00) (0.54) (0.00) (0.00) (0.31) 7 -0.32 -0.07 0.47 0.25 -0.08 0.01 1 (0.00) (0.20) (0.00) (0.00) (0.13) (0.89) 8 -0.31 -0.06 0.52 0.21 -0.06 0.04 0.96 1 (0.00) (0.26) (0.00) (0.00) (0.28) (0.48) (0.00) 9 0.29 -0.16 -0.26 -0.08 -0.17 0.23 0.02 -0.01 1 (0.00) (0.00) (0.00) (0.13) (0.00) (0.00) (0.77) (0.79) 10 0.20 0.11 -0.23 -0.17 -0.02 0.07 -0.34 -0.27 0.03 1 (0.00) (0.04) (0.00) (0.00) (0.71) (0.17) (0.00) (0.00) (0.52) 11 0.11 -0.03 -0.21 -0.13 -0.13 0.15 -0.21 -0.17 0.26 0.26 1 (0.04) (0.53) (0.00) (0.02) (0.02) (0.01) (0.00) (0.00) (0.00) (0.00) Correlations among the independent variables included in the empirical analysis: 1) IRit: 10-year government bond yields. 2) SMRit: Yearly change in the local Share Price Index.. 3) MCAPit: Market capitalisation of the local market, divided by the local GDP. 4) EXITSit: Amount divested at cost per year and per country through trade sale, IPO and secondary buyouts, divided by the local GDP. 5) GDPgit: Growth of local GDP in constant currency; 6) EVCA INDEXit: Index that reports the valuation of a country’s tax and legal environment as more (1) or less favourable (3) to VC/PE activity. 7) RDl1it: Gross domestic expenditure on R&D divided by the country’s, GDP lagged one year. 8) RD_indl1it: Share of gross domestic expenditure on R&D financed by industry divided by the country’s GDP, lagged one year. 9) TAXit: Corporate tax rate. 10) URl1it: Harmonised unemployment rate par year and per country, lagged one year. 11) JOB_TENi Average percentage of workers that have been in their current or main job or with their current employer over 10 years. p-values in parenthesis.
38
Table 7. Regression results of the fundraising side of the VC/PE market.
Dependent variable: New funds raised divided by GDP
Independent Variables
Robust GLS estimation
Robust GLS estimation
Robust GLS estimation
Robust GLS estimation
IRit -0.000006 0.000018 -0.000008 0.000008 0.000058 0.000058 0.000055 0.000055
SMRit 0.030420 0.001197 -0.094519 -0.108032 0.085184 0.086999 0.090125 0.091240
MCAPit 813.760100** 1218.710000*** 849.023300** 1279.881000*** 347.113200 369.910000 353.884400 375.725600
EXITSit 4.924221*** 4.995443*** 4.877423*** 4.974376*** 0.313874 0.327977 0.314238 0.328375
GDPgit -0.001851 -0.000906 -0.000603 0.000400 0.003426 0.003412 0.003569 0.003535
EVCA INDEXit 0.000891 0.000977 0.000595 0.000601
Time dummies YES YES YES YES
Constant -0.000568 -0.002794 -0.000729 -0.003121** 0.000750 0.001551 0.000785 0.001564
# Observations 287 278 280 272 # Countries 22 21 22 21 Hausman test (p-value) 0.9274 0.8383 0.9863 0.8672
Random effects GLS estimation robust to heteroskedasticity. The dependent variable is the amount of new funds raised per year and per country, divided by the country’s GDP. The independent
variables are: 1) IRit: 10-year government bond yields. 2) SMRit: Yearly change in the local Share Price Index.. 3) MCAPit: Market
capitalisation of the local market, divided by the local GDP. 4) EXITSit: Amount divested at cost per year and per country through
trade sale, IPO and secondary buyouts, divided by the local GDP. 5) GDPgit: Growth of local GDP in real terms; 6) EVCA INDEXit: Index that reports the valuation of a country’s tax and legal environment as more (1) or less favourable (3) to VC/PE activity. Standard errors in small case.. ***= significant at 1%, ** = significant at 5%, * = significant at 10%.
39
Table 8. Regression results of the investment side of the VC/PE market (all investments)
Dependent variable: VC/PE Investments divided by GDP
Independent Variables
Robust GLS estimation
Robust GLS estimation
Robust GLS estimation
Robust GLS estimation
IRit 0.000022 0.000030 0.000010 0.000006 0.000030 0.000061 0.000029 0.000060
MCAPit -127.079800 -124.598500 -208.348700 -214.147900 189.668400 193.399900 198.064500 202.278800
EXITSit 3.808746*** 3.766389*** 3.882822*** 3.845464*** 0.153871 0.157983 0.153933 0.157876
GDPgit -0.000245 -0.000724 -0.000530 -0.001055 0.001791 0.001896 0.001783 0.001886
RDl1it 5.773056*** 5.796146*** 1.216401 1.225187
RD_indl1it 7.657870*** 7.666595*** 1.626705 1.648850
TAXit 0.000015 0.000025* 0.000014 0.000024* 0.000013 0.000014 0.000013 0.000014
URl1it -0.000023 -0.000033 0.000022 0.000022
JOB_TENi -0.000031** -0.000033** 0.000016 0.000016
Time dummies YES YES YES YES Constant -0.001162* -0.000457 -0.000718 0.000088 0.000634 0.000832 0.000598 0.000789
# Observations 289 282 289 282 # Countries 22 21 22 21 Hausman test (p-value) 0.7915 0.8079 0.6414 0.6598
Random effects GLS estimation robust to heteroskedasticity. The dependent variable is the total VC/PE amount invested per year and per country, divided by the country’s GDP. The independent
variables are: 1) IRit: 10-year government bond yields. 2) MCAPit: Market capitalisation of the local market, divided by the local
GDP. 3) EXITSit: Amount divested at cost per year and per country through trade sale, IPO and secondary buyouts, divided by the
local GDP. 4) GDPgit: Growth of local GDP in constant currency. 5) RDl1it: Gross domestic expenditure on R&D divided by the
country’s, lagged one year. 6) RD_indl1it: Share of gross domestic expenditure on R&D financed by industry divided by the country’s
GDP, lagged one year. 7) TAXit: Corporate tax rate. 8) URl1it: Harmonised unemployment rate per year and per country, lagged one
year. 9) JOB_TENi: Average percentage of workers that have been in their current or main job or with their current employer over 10 years. Standard errors in small case.. ***= significant at 1%, ** = significant at 5%, * = significant at 10%.
40
Table 9. Regression results of the investment side of the VC market
Dependent variable: Venture capital investments divided by GDP
Independent Variables
Robust GLS estimation
Robust GLS estimation
Robust GLS estimation
Robust GLS estimation
IRit 0.000044** -0.000031 0.000036** -0.000047 0.000017 0.000036 0.000017 0.000035
MCAPit -194.905500* -247.351900** -222.089100* -276.963100** 109.193800 109.548300 114.513200 114.941900
EXITSit 0.874824*** 0.871477*** 0.914887*** 0.911531*** 0.088367 0.089055 0.088847 0.089409
GDPgit -0.000267 -0.000793 -0.000467 -0.001013 0.001058 0.001103 0.001059 0.001104
RDl1it 3.248642*** 3.040400*** 0.703455 0.696741
RD_indl1it 4.008067*** 3.712587*** 0.945943 0.942283
TAXit 0.000004 0.000011 0.000003 0.000011 0.000007 0.000008 0.000007 0.000008
URl1it -0.000039*** -0.000045*** 0.000013 0.000013
JOB_TENi -0.000027*** -0.000029*** 0.000009 0.000009
Time dummies YES YES YES YES Constant -0.000060 0.001019** 0.000225 0.001357*** 0.000370 0.000485 0.000351 0.000463
# Observations 283 276 283 276 # Countries 22 21 22 21 Hausman test (p-value) 0.9156 0.8305 0.8294 0.7493
Random effects GLS estimation robust to heteroskedasticity. The dependent variable is the total VC amount invested per year and per country, divided by the country’s GDP. The independent
variables are: 1) IRit: 10-year government bond yields. 2) MCAPit: Market capitalisation of the local market, divided by the local
GDP. 3) EXITSit: Amount divested at cost per year and per country through trade sale, IPO and secondary buyouts, divided by the
local GDP. 4) GDPgit: Growth of local GDP in constant currency. 5) RDl1it: Gross domestic expenditure on R&D divided by the
country’s, lagged one year. 6) RD_indl1it: Share of gross domestic expenditure on R&D financed by industry divided by the country’s
GDP, lagged one year. 7) TAXit: Corporate tax rate. 8) URl1it: Harmonised unemployment rate par year and per country, lagged one
year. 9) JOB_TENi: Average percentage of workers that have been in their current or main job or with their current employer over 10 years. Standard errors in small case.. ***= significant at 1%, ** = significant at 5%, * = significant at 10%.
41
Table 10. Regression results of the investment side of the VC/PE market (buyout investments)
Dependent variable: Buyout investments divided by GDP
Independent Variables
Robust fixed effects estimation
Robust fixed effects estimation
Robust fixed effects estimation
Robust fixed effects estimation
IRit 0.000019 0.000004 0.000017 -0.000004 0.000023 0.000045 0.000023 0.000045
MCAPit 354.595500 360.779800 386.917700 386.865400 246.547200 254.598100 243.343900 251.220900
EXITSit 2.531414*** 2.539004*** 2.557949*** 2.566468*** 0.289576 0.288635 0.285080 0.283480
GDPgit 0.000282 0.000155 0.000270 0.000140 0.001367 0.001369 0.001365 0.001363
RDl1it -6.400559** -6.354606** 2.807752 2.877112
RD_indl1it -7.604587* -7.591039* 3.848388 3.897391
TAXit 0.000031** 0.000031** 0.000032** 0.000033** 0.000014 0.000014 0.000014 0.000015
URl1it 0.000023 0.000023 0.000036 0.000036
Time dummies YES YES YES YES Constant -0.000463 -0.000206 -0.000895 -0.000624 0.000728 0.000591 0.000662 0.000507
# Observations 287 280 287 280 # Countries 22 21 22 21 Hausman test (p-value) 0.0028 0.0065 0.0031 0.0058
Fixed effects estimation robust to heteroskedasticity. The dependent variable is the total PE invested in buyouts per year and per country, divided by the country’s GDP. The independent
variables are: 1) IRit: 10-year government bond yields. 2) MCAPit: Market capitalisation of the local market, divided by the local
GDP. 3) EXITSit: Amount divested at cost per year and per country through trade sale, IPO and secondary buyouts, divided by the
local GDP. 4) GDPgit: Growth of local GDP in constant currency. 5) RDl1it: Gross domestic expenditure on R&D divided by the
country’s, lagged one year. 6) RD_indl1it: Share of gross domestic expenditure on R&D financed by industry divided by the
country’s GDP, lagged one year. 7) TAXit: Corporate tax rate. 8) URl1it: Harmonised unemployment rate par year and per country,
lagged one year. 9) JOB_TENi: Average percentage of workers that have been in their current or main job or with their current employer over 10 years. Standard errors in small case.. ***= significant at 1%, ** = significant at 5%, * = significant at 10%.