the drivers of team-based inside sales …...the drivers of team-based inside sales performance at...
TRANSCRIPT

The Drivers of Team-based Inside Sales Performance at
Different Stages of The Sales Pipeline
By
Rahat Haque
Supervised By
Prof. Morad Benyoucef and Prof. Pavel Andreev
Thesis submitted to the Faculty of Graduate and Postdoctoral Studies
in partial fulfillment of the requirements of
Master of Science in Management
University of
Ottawa
© Rahat Haque, Ottawa, Canada, 2019

ii
TABLE OF CONTENTS
ABSTRACT ...................................................................................................................... v
ACKNOWLEDGEMENT ................................................................................................ vii
CHAPTER 1: INTRODUCTION .................................................................................... 1
1.1. MOTIVATION ............................................................................................................ 4
1.2. PROBLEM STATEMENT & RESEARCH QUESTION .................................................... 6
1.3. RESEARCH OBJECTIVE ............................................................................................. 6
CHAPTER 2: BACKGROUND ...................................................................................... 9
2.1. LITERATURE REVIEW ............................................................................................... 9
2.2. CLASSIFICATION OF STAGES IN THE SALES PIPELINE ............................................ 11
2.3. OUTCOME: CLASSIFICATION OF STAGES IN THE SALES PIPELINE ......................... 12
2.4. PREDICTORS ............................................................................................................ 14
2.4.1. QUALITY OF TEAM COMPOSITION ............................................................. 19
2.4.1.1. TEAM SIZE .................................................................................................................. 19
2.4.1.2. TEAM EXPERIENCE ................................................................................................... 20
2.4.1.3. TEAM EFFORT ................................................................................................... 20
2.4.2. TASK UTILITY ................................................................................................ 21
2.4.2.1. TASK INPUT ................................................................................................................. 22
2.4.2.2. TEAM GOAL MONITORING ................................................................................ 22
2.4.3. INTRA-TEAM COORDINATION ..................................................................... 23
2.4.3.1. SPECIFICITY OF ROLE ................................................................................................ 24
2.4.3.2. REPETITION .................................................................................................................. 24
2.4.3.3. INTRA-TEAM COMMUNICATION ........................................................................ 25
CHAPTER 3: METHODOLOGY ................................................................................ 26
3.1. RESEARCH DESIGN ............................................................................................. 26
3.1.1. DATA COLLECTION ................................................................................................. 26
3.1.2. DATA TRANSFORMATION ..................................................................................... 27
3.2. SAMPLE .................................................................................................................. 27
3.3. MEASURES: PREDICTOR VARIABLES ............................................................. 28
3.3.1. TEAM SIZE ........................................................................................................... 28
3.3.2. TEAM EXPERIENCE ............................................................................................. 29 3.3.3. TEAM EFFORT ..................................................................................................... 30
3.3.4. TASK INPUT ........................................................................................................ 30 3.3.5. TEAM GOAL MONITORING ................................................................................... 31 3.3.6. SPECIFICITY OF ROLE ........................................................................................ 32 3.3.7. REPETITION ........................................................................................................ 32
3.3.8. INTRA-TEAM COORDINATION ............................................................................ 33
3.4. IDENTIFFYING THE OUTCOME VARIABLE MEASURES ...................... 34
3.4.1. PRELIMINARY FINDING: DETERMINING THE CONCEPTS ........................... 34
3.4.2. PROCEDURE TO EXTRACT OUTCOME VARIABLES ..................................... 38
3. 4.2.1. PHASE 1: TEXT MINING ANALYSIS ........................................................ 38

iii
3.4.2.2. PHASE 2: JENKS NATURAL BREAKS OPTIMIZATION ............................. 40
3.5. PROCEDURE TO BUILD THE CONCEPTUAL MODEL .................................... 41
3.6. PROCEDURE TO VALIDATE THE CONCEPTUAL MODEL ............................ 41
CHAPTER 4: OUTCOME VARIABLE RESULTS ................................................... 45
4.1. PHASE 1: TEXT MINING ANALYSIS ................................................................ 45
4.1.1. IDENTIFICATION OF THE FIVE STAGES ............................................................. 45
4.1.2. THE PROCESS USED TO EXTRACT THE FIVE STAGES ...................................... 45
4.1.3. FINAL OUTCOME OF EACH SALES LEAD ..................................................... 50
4.1.4. DESCRIPTIVES STATISTICS FROM PHASE 1 .......................................... 50
4.1.5. MEASURES: OUTCOME VARIABLES ...................................................... 51
4.2. PHASE 2: JENKS NATURAL BREAKS OPTIMIZATION ................................. 52
CHAPTER 5: CONCEPTUAL MODEL DEVELOPEMENT................................... 54
5.1. TEAM SIZE............................................................................................................. 54
5.2. TEAM EXPERIENCE ............................................................................................... 56
5.3. TEAM EFFORT ....................................................................................................... 56
5.4. TASK INPUT ........................................................................................................... 57
5.5. TEAM GOAL MONITORING .................................................................................... 58
5.6. SPECIFICITY OF ROLE ......................................................................................... 58
5.7. REPETITION .......................................................................................................... 59
5.8. INTRA-TEAM COMMUNICATION ........................................................................... 59
5.9. MODEL: DRIVERS OF TEAM-BASED PERFORMANCE IN INSIDE SALES ................. 60
CHAPTER 6: DATA ANALYSIS- MODEL RESULTS ............................................ 61
6.1. MULTINOMIAL LOGISTIC REGRESSION ......................................................... 61
6.1.1. CHECKING FOR MULTICOLLINEARITY .............................................................. 61
6.1.2. CHECKING FOR OUTLIERS ..................................................................................... 62
6.1.3. RUNNING THE MODELS .......................................................................................... 62
6.1.3.1. SUSPECT RATIO .................................................................................................... 62
6.1.3.2. PROSPECT RATIO ................................................................................................. 63
6.1.3.3. QUALIFICATION RATIO ........................................................................................ 64
6.1.4. TESTING OF HYPOTHESES ..................................................................................... 65
6.2. ROC CURVES ........................................................................................................ 67
6.3. VALIDITY .............................................................................................................. 71
CHAPTER 7: CONCLUSION....................................................................................... 72
7.1. KEY FINDINGS .................................................................................................... 72
7.2. CONTRIBUTIONS ................................................................................................. 75 7.2.1. CONTRIBUTIONS TO PRACTICE............................................................................ 76
7.2.2. CONTRIBUTIONS TO RESEARCH .......................................................................... 77
7.3. LIMITATIONS & WAY FORWARD ............................................................................ 79
REFERENCES ............................................................................................................... 83
APPENDIX A ................................................................................................................. 102
APPENDIX B ................................................................................................................. 106

iv
APPENDIX C ................................................................................................................. 107
APPENDIX D ................................................................................................................. 108
APPENDIX E ................................................................................................................. 110
APPENDIX F .................................................................................................................. 113
APPENDIX G ................................................................................................................. 114
APPENDIX H ................................................................................................................. 140
APPENDIX I .................................................................................................................. 141
APPENDIX J .................................................................................................................. 142
APPENDIX K ................................................................................................................. 143
APPENDIX L ................................................................................................................. 144
APPENDIX M ................................................................................................................ 145
APPENDIX N ................................................................................................................. 150
APPENDIX O ................................................................................................................. 151
APPENDIX P .................................................................................................................. 152
APPENDIX Q ................................................................................................................. 154
APPENDIX R ................................................................................................................. 156
APPENDIX S .................................................................................................................. 159
APPENDIX T ................................................................................................................. 162
APPENDIX U ................................................................................................................. 165
APPENDIX V ................................................................................................................. 171

v
ABSTRACT
There is a lack of academic research on sales teams, despite team selling becoming more
prominent in recent years. Particularly in Inside Sales, there is a lack of clarity as to what are the
drivers of optimum team-based selling and their degree of effect on sales performance. We utilize
a team-based approach that aims to study the characteristics of Inside Sales teams and their
interactions with business leads, using data from a well-reputed leads management software
vendor. Based on prior team-based constructs in the literature, we built a framework that posits
Quality of Team Composition, Task Utility and Intra-team Coordination leading to different
categories of sales performance at various stages of the sales pipeline via their reflective variables.
We tested our conceptual model in the following fashion: first, we used text mining on sales
results to classify the different stages of the sales pipeline. Following that, we measured the
conversion ratio at each stage as appropriate. Next, we discretized each conversion ratio into three
levels of performance groups. The outcome variables in the model are different categories of team
performance at each stage of the sales pipeline. Subsequently, we used multinomial logistic
regression to regress our outcome variables on our team-based predictor variables in the hopes of
establishing and validating important drivers for nuanced Inside Sales success.
We uncovered new insight regarding team-selling best practices, using pre-identified constructs
from the literature which are uniquely suited to teams and also constructs which are aggregated at
a team level from an individual level. Our study is especially relevant to the Inside Sales process,
as the outcome measures relate to the sales pipeline. Our main finding was that in there is a
difference in skills required at different stages of the sales pipeline, in that more customization and
experience is needed at the more advanced stages, whereas more repetition of activity is needed at
the beginner stages. We also found that smaller team sizes tend to do better in Inside Sales, which

vi
was an unsettled research question in team research with plenty of evidence in favor of both smaller
and bigger teams.
Additionally, even if it was not a primary goal of our study, by virtue of classifying the leads by
their final outcomes, we stumbled across an interesting finding, which is that an overwhelming
majority of the sales leads tend to stay at one stage in their entire lifecycle. The implications of all
our findings are very relevant to both practitioners and researchers of Inside Sales who are
interested in team-based sales optimization. More research should be done in the field of Industrial
Marketing, building upon what we found to be true for the B2B sector.

vii
ACKNOWLEDGEMENT
I sincerely want to express my deepest gratitude to each and everyone who have helped me in
this quest to finish the MSc program at Telfer, and complete my thesis. Three individuals
especially stand out. Prof. Morad Benyoucef, Prof. Pavel Andreev and Alhassan, I thank you for
all your counsel and mentorship in this academic journey. I hope more work is done in this field,
and I for one, would surely love to collaborate again at some capacity in the future.

1
CHAPTER 1: INTRODUCTION
Team-based selling is a trending approach in sales with over 75% of companies using sales
teams (Cummings, 2007). In their report on Human Capital Trends, Deloitte found that
organizations are increasingly employing teams (Schwartz, Bohdal-Spiegelhoff, Gretczko, &
Sloan, 2016). Salesforce surveyed over 3100 global sales professionals to find that top performers
were almost three times more likely to be engaged in collaborative selling (i.e., team selling)
compared to underperformers (State of Sales, 2015). Hence, the virtues of team selling are widely
appreciated for their ability to increase performance, which explains team selling’s increased
prominence in organizational design in recent years. However, there is a dearth of research on the
factors that lead to the success of team selling (Perry, Pearce & Sims Jr., 1999).
Team-based selling has become an integral part of the sales strategy of organizations. The
increasing number of stakeholders from the buyer’s side as well as the increasing complexity of
the selling tasks, have led to more organizations adopting selling teams instead of relying upon
individual salespeople (Smith & Barclay, 1993). With greater strategic focus on relationship
building with buyers over the decades, it is more difficult for one person to strictly sell and not be
involved in any other value adding activities that help build a relationship (Cannon & Perreault,
1999). So the need for multi-skilled teams where people coordinate their resources has become
imperative to manage ongoing sales relationships.
Adamson, Dickson and Toman (2014) write that the focus has shifted from individual
performance to network performance in sales in organizations. Network performance is defined as
how much people give to and take from their coworkers. They report that from 2002 to 2012, the
impact of individuals’ task performance on unit profitability decreased by 27% on average. At the

2
same time, the impact of employees’ network performance increased by 27%. It is therefore
understood that the best salespeople collaborate more with their colleagues for optimum
performance. They rely upon each other to coordinate resources in the best way possible to deliver
results. One of the key facilitators of such a transformation is sales technology. The use of sales
information technology enables an easy transfer of knowledge, experience and skills, to strengthen
network ties within companies.
The best example of such sales technology is salesforce automation (SFA) software, of which
there are various kinds in the market. Morgan and Inks (2001) define SFA as the use of information
and communication technologies to perform selling or sales management tasks. Such technologies
come in the form of marketing automation software, customer relationship management (CRM)
software, and lead management software (LMS), which manage sales leads. A sales lead is defined
as a member from your target market who has signalled interest in your product (Carrol, 2006).
Vendors of software such as LMS have inundated the sales and marketing departments across
industries (Ahearne, Jones, Rapp & Mathieu, 2008). They have experienced tremendous uptake
from Inside-Sales programs in companies that use such software to conduct their operations
(Magnotta, 2018; Martin, 2013). Inside Sales are defined as organized sales that are conducted
remotely or virtually usually from a central location, as opposed to an outside selling force which
engages in more traditional face-to-face selling (Gessner & Scott, 2009; Rapp, Beitelspacher,
Schillewaert, & Baker, 2012).
A greater number of stakeholders from the buyer’s side, an increased complexity of the sales
process and the use of sales information technology have necessitated the existence of sales teams
in the modern era. Yet, academic research on team selling has not caught up to speed with
practitioner research (Moon & Armstrong, 2013). While evaluating Team-based selling’s
3
performance against individual selling is rare in the literature, Team-based Selling is declared more
efficient in the limited occasions where the two types of selling have been directly contrasted
(Steiner, 1976; Batt, 1999). Garrett and Gopalakrishna (2017) found that people performed better
at team tasks than at individual tasks. This further magnifies the importance of team selling, not
just as a practice in of itself, but as the better method of selling. Additionally, even if the two
selling methods are not contrasted, team-based factors have a moderating effect on individual
performance (Carboni & Ehrlich, 2013). Hence, its importance is underscored by the fact that it
adds value at both the team level and individual level.
The term “team” has replaced “work group” to describe a collection of individuals seen as an
entity in the workplace (Guzzo & Dickinson, 1996). The term team implies a greater sense of
cohesiveness, interdependency and shared purpose than the term group (Katzenbach & Smith,
1993, Neuman & Wright, 2009; Baker & Salas, 1997). Modern sales has used team selling and
group selling interchangeably, however the term “team” better defines the assigned clusters of
salespeople as they are bounded by a shared objective. Team based job design is defined as when
there are two or more people working in a group who are dependent on each other’s activities and
who share a common goal (Rajagopal & A.Rajagopal, 1998 ; Salas, Dickinson, Converse, &
Tannenbaum, 1992 ).This is applicable to our case, as in Inside Sales, each team is assigned a
particular set of leads or a particular project consisting of a certain kind of leads. The team
members are expected to work together to accomplish a shared objective marked by the
interdependency of their tasks. With the advent of technology, team members are more fluid than
they have been in the past, in the sense that they can be in and out of multiple teams depending on
the project (O’Leary, Mortensen & Woolley, 2011).

4
The following motivation section describes the situation and symptoms that culminated into the
research question. Such a process is empirical in nature, as it looks to the industry to provide cues
for research objectives instead of focusing on existing theories. Once the problem area is identified,
we highlight the research question that this study attempts to answer.
1.1. MOTIVATION
As the world’s business outlook has shifted from a transactional-based economy to a
relationship-based economy, the concept of team selling has grown concurrently with the use of
SFA. SFA’s leverage as a tool has increased as a way to initiate and maintain relationships with
sales prospects and customers alike. Currently in the US, the total Enterprise Software market is
$49.1 billion, out of which CRM comprises a 29% segment (Industry at a Glance, 2018). Note that
the terms SFA and CRM are used interchangeably (Ahearne et al, 2008; Avlonitis &
Panagopoulos, 2009). The CRM industry is defined by IBIS World as software platforms for
managing a company’s interactions with customers, clients and sales prospects (Curran, 2017).
Hence, lead management systems (LMS) is included in the domain of CRM.
The growth of the total Enterprise Software market over the past five years, and projected
growth over the next 5 years are 6.6% and 3.2% respectively. However, for the CRM segment by
itself, these numbers are 11.3% and 7.5% respectively (Industry at a Glance, 2018). Thus one can
notice the rapid rise of SFA/CRM software, and its increasing stake in the Enterprise Software
market. There was 16% growth per annum in the CRM/SFA industry before the credit crunch of
2008 (Payne, 2009). This growth would have been even more spectacular had it not been for the
dotcom crash of the early 2000s. Nevertheless, the advent of SFA pushed through that crisis, as it
did the 2008 global recession, and it continues to be a mainstay for businesses today.

5
Despite team-based selling becoming more prominent via the use of SFA systems such as LMS,
there is discontent in the rate of return on investment for such sales technology. 55% to 75% of
companies fail to meet their expected rate of return according to public data (Zablah, Bellenger &
Johnston, 2004). 70% of all implemented SFA projects lead to losses or no bottom line
improvements according to a Gartner report (Reimann, Schilke & Thomas, 2009). Thus we notice
that while the concept of team selling and usage of SFA grows contemporaneously, there is a lot
more expected of SFA in terms of delivery. Such a chasm between expectations and results can be
explained by a large performance variance in team-selling via SFA usage, where different teams
get different results albeit using the same tools.
We embarked on this research study with the primary intention of understanding what drove
team-based Inside Sales performance. To narrow down our target population where we would
measure the team-based constructs, we turn our focus to users of LMS software. As previously
described, there is a great variance of performance in LMS usage by teams, which makes it an
ideal substrate of population to conduct our study on. We focus on companies in the business-to-
business (B2B) sector, in the Insurance and Marketing & Advertising industries. The B2B sector
is known for its use of SFA software such as LMS. It is not that the business to consumer (B2C)
sector does not use SFA software, only that they are more reliant on reaching the masses through
advertising. They do not emphasize account based selling as much as much as the B2B sector does,
where every sales lead is highly valuable (Kumar & Reinartz, 2012; Moore, Raymond & Hopkins,
2015). Hence, as our study aims to measure the performance of progression through the sales
pipeline, it is more relevant to the B2B sector.

6
1.2. PROBLEM STATEMENT & RESEARCH QUESTION
We observe the lack of research done on the drivers of team-based selling success despite team-
based selling’s rising prevalence in the industry. There is a lack of understanding as to what
constructs can be studied at a team level which would explain the variance of performance in Inside
Sales. There is no mandate when it comes to identifying the best of these team-based constructs,
the optimization of which would increase team-based sales performance. Moreover, there are no
academic studies that measure performance based on leads pipeline progression, which is a process
commonly used in Inside Sales and hence has great relevance to the Inside Sales process. Taking
into account these current gaps of knowledge, we structure our research question as: What are the
drivers of team-based Inside Sales performance pertaining to the leads pipeline in the B2B
sector?
1.3. RESEARCH OBJECTIVE
We list five objectives that will enable us to answer the research question posed prior. In
chronological order, they are listed below.
1. Formalize the performance of Inside Sales teams. This includes defining the sales lead
pipeline, and its stages.
In order to formalize the performance of Inside Sales teams, we have the responsibility
of choosing an objective outcome measure amongst the many that are available in the
literature. Objectivity is important because it enables a fair comparison of teams within an
organization, and between organizations. To this cause, we first want to define the various
stages of the sales pipeline that are usually seen in Inside Sales, so the outcome measure is
more nuanced and appropriate for Inside Sales. This gives us the ability to compare the

7
effect of team-based constructs on the performance of sales teams at various stages of the
sales pipeline.
2. Systematize existing knowledge regarding team-based factors that impact the
performance of Inside Sales teams.
There is prior literature on the drivers of team-based success in sales. For the purpose of
our study, we only focus on predictors that have to do with the characteristics of teams and
their interaction with sales leads. This allows us to fixate on our research question as we
are dealing with Inside Sales teams who use SFA systems such as LMS. Much like the
outcome variable, we also want our predictor variables to be objective. Hence, we look for
those team characteristics and sales lead interaction constructs that have direct measures or
have appropriate proxies, which can be quantified directly from the field environment. We
avoid those constructs which are subjective upon self-reporting or survey based measures.
It should be noted that in addition to using papers to identify relevant team-based factors
that fit our criteria, we also use studies on individual salespersons to further develop those
constructs. This is because in some cases, team-based constructs are aggregations of
individual-based constructs who are a part of that team.
3. Classify stages of the sales pipeline and create relevant performance ratios and levels
of performance, which shall serve as the outcome variables of the study.
First, we shall identify the stages of the sales pipeline from our data. Second, we shall
discretize the performance at various stages of the sales pipeline into categorical outcome
variables.
4. Develop a conceptual model of Inside Sales team performance based on previously
identified predictor and outcome variables from objectives 2 and 3 respectively.

8
We will build a model to show the hypothesized relationships between each of the
previously identified team-based constructs and sales performance at multiple stages of the
sales pipeline. The direction of each hypothesized relationship will be determined by
supporting literature.
5. Empirically validate the proposed model.
Finally, there is the task of empirically validating our proposed model for statistical
significance, which also includes validating the direction and degree of effect of each
pathway in which sales teams can achieve greater performance. We shall test our model by
regressing our outcome variables on our predictor variables.

9
CHAPTER 2: BACKGROUND
The background chapter addresses the first two research objectives. We briefly describe the
literature review process that was undertaken to meet the first two objectives from our Research
Objectives section. We take a rationalist approach, and hence consider all relevant literature on the
subject matter to gain an understanding of the extant theories. It is on shoulders of such literature
that we later construct a new model for team-based success in Inside Sales, contingent upon the
data that is available to us. After describing the literature review process, we delve into the
remainder of the background section which covers key themes of the paper that are essential to
understand. They consist of: the classification of stages in the sales pipeline, sales performance
and the many predictors or team-based Inside Sales performance.
2.1. LITERATURE REVIEW
In order for us to answer our research question, a literature review was conducted on three main
areas, namely: classification of stages of sales pipeline; types of team-based sales performance;
and drivers of team-based sales performance. The first two areas correspond to objective one from
the Research Objective, while the third corresponds to objective two. Our search strategy is best
described as exploratory in nature where we aim to synthesize information by comprehensively
searching each research area. Such a strategy best fits the definition of a scoping review where the
goal to is to preliminarily assess the nature and range of a broad topic area (Arksey & O’Malley,
2007; Paré, Trudel, Jaana & Kitsiou, 2014). After synthesizing the contents of an explicit selection
of papers, both narrative commentary and tables are used to present the information in line with
Grant and Booth’s (2009) instruction for conducting a scoping review.

10
The search terms and the electronic databases used are tabularized (Please refer to Appendix
A), where the search terms are categorized into objectives one and two from the Research
Objective section. The search terms were constructed using the Boolean operators AND and OR,
to see if an article contained all the necessary information that was sought, and to see if they existed
under various synonyms respectively. Quotation marks and asterisks were also used to extract
specific concepts and consider all root variants respectively. Both business databases and
interdisciplinary databases were used in the search.
All search results were ranked in terms of relevance. We read the title and abstract of each article
to decide if it merited further inspection. We did this until the title and abstract stopped becoming
relevant. The only two filters that were used were the “peer reviewed” and “English”. Using any
other filters posed a risk of unintentionally filtering out information that could be relevant to our
study. After all suspected relevant articles were rounded up, we skimmed each article to more
accurately assess if it would be constructive to our study. Such an approach can be more laborious
on the front end, but it ensures that no relevant article is unintentionally omitted in the initial
search.
Via the scoping review, we were firstly able to gather an understanding of all the research that
has been done in the main and periphery areas concerning our research question. Such a dive into
the literature enabled us to distinguish the important articles from the extraneous articles. We were
then able to select and focus on only the necessary pieces of literature which addressed our research
objectives.

11
2.2. CLASSIFICATION OF STAGES IN SALES PIPELINE
Published academic literature on the classification of stages of a business lead is very sparse, as
opposed to gray literature, industry literature, and doctoral theses, where there is more material on
this subject. Nonetheless, we focus on the available academic literature published in journals due
to them undergoing higher scrutiny. Jolson and Wortuba (1992) lay out three main steps in the
selling process, called suspecting, prospecting and qualifying. Suspecting refers to guessing the
needs and buying intent of a particular sales lead. Prospecting refers to categorizing the sales leads
as having the right needs and buying intent to be a potential customer. Qualifying is an advanced
form of prospecting where the sales leads are further winnowed in terms of displaying the right
actions or having the right characteristics, which are ideal for a future sale. Smith, Gopalakrishna
and Chatterjee (2006) propose a three-stage model of the sales process. In order, the stages are
lead generation, conversion of leads to sales appointments and conversion of appointments into
sales. Jaramillo and Marshall (2004) have the same three steps, along with the prospecting stage
between lead generation and appointments.
The sales funnel divides the customer acquisition process into multiple stages (Ang & Buttle,
2006; Patterson, 2007). D’Haen and Van Den Poel (2013) classify a sales funnel into four stages:
suspects, prospects, leads and customers. We opt to substitute the word “lead” with “opportunity”
or “appointment” as it is consistent with the aforementioned literature. This is because we are
describing the journey of a lead, and hence “lead” cannot itself be the title of one of the stages of
the sales pipeline. Henceforth, after juxtaposing various stages of a lead from different papers, we
obtain a total of five identified stages of a lead as it moves along a sales pipeline. These are:
Suspect, Prospect, Qualified, Opportunity and Client. Taking into account the definitions from
prior papers where the differences between each step are clearly articulated, we define each step

12
in the following manner. A suspect is a new lead which has not been contacted yet. A prospect is
a lead that has been contacted, but has not yet been qualified yet to see if it has the budget,
authority, time and need for the product. The lead is qualified when an appropriate fit has been
determined for the aforementioned requirements. A qualified lead becomes an opportunity when
an appointment or further meeting is established with the decision maker where a final sales pitch
occurs. If the lead agrees to buy, it becomes a client. These five stages can potentially be the
different stages we refer to when measuring success at multiple stages of the sales pipeline.
Furthermore, sales leads can be classified as won, lost and cancelled (Virtanen et al., 2015).
The classifications “won” and “lost” apply to the last (i.e., closing) stage, where the lead is either
won and becomes a customer, or is lost because the salesperson failed to close the deal. The
classification “cancelled” means that the lead never made it to the final stage because of various
reasons. A lead can be cancelled because of a loss of interest, an unsurmountable obstacle or a
difference that hinders progression, or simply a loss of contact. The classification of “lost” at the
final stage can be extended to the earlier stages as well to mean “cancelled”. Thus every stage can
have just two outcomes, “won” or “lost”, where “won” means progress and “lost” means cessation
of progress. Therefore, depending on how many stages a lead goes through in the pipeline, one
can calculate the conversion (i.e., “won”) ratio of each stage to measure the progress of that lead.
2.3. OUTCOME: SALES PERFORMANCE IN THE SALES PIPELINE
Team-based sales performance is an under researched area in the realm of Inside Sales
performance (Smith & Barclay, 1993; Perry et. al, 2009). Team-based performance is defined in
terms of behavior and outcome (Beal, Cohen, Burke & McLendon, 2003; Cohen & Bailey, 1997;
Schwepker Jr. & Good, 2011). Behavior refers to those actions, abilities and tendencies that
supposedly lead to a higher success rate. Behavior can be assessed, although subjectively.
13
Outcome refers to actual countable sales results that indicate performance, such as market share,
volume of sales, new accounts and profits. Outcome can be assessed objectively.
As this study relies on the sales pipeline, we use quantifiable sales conversions as a measure at
each stage of the sales pipeline. Several papers suggested such an output measure for sales
performance because of its objectivity (Ahearne, Srinivasan & Weinstein, 2004; Smith & Barclay,
1993). Being a quantitative measure, there is no room for qualitative observer dependent
interpretation. Thus, sales teams will be assessed based on the same quantifiable output.
Furthermore, a sales conversion (or any advancement leading up to a sales conversion) is more a
measure of effectiveness and less a measure of efficiency. Effectiveness is a more objective
measure of sales performance than efficiency, because while efficiency informs us about the ability
of the sales team to accomplish a desired outcome, effectiveness informs us about the actual
accomplishment of a desired outcome.
In a study with sales executives, the introduction of new accounts for products and the closing
ratio were listed as sales performance measures under externally oriented (i.e., marketplace)
metrics (Zallocco, Pullins & Mallin, 2009). The former is a sales outcome measure, while the latter
is a sales activity measure. Both are highly objective as they are dependent on the successful
acquisition of a customer. We intend to use both in this research. First, the total number of
successful conversions from stage to stage will be counted, and second, the success ratio of each
stage will be calculated by dividing the total number of successful conversions to the next stage
by the total number of available leads at the current stage.
Smith and Barclay (1993) used sales targets as a performance output in their study where closing
a business deal was the idea of the sales target objective. Our study uses the same definition (i.e.
successfully converting a sales lead) albeit in the framework of a sales lead pipeline where there

14
are multiple conversions before a lead becomes a customer. Analyzing the sales pipeline is
essential for business success, and estimating the conversion of opportunities is said to be the
“fundamental block” for sales management (Yan, Gong, Sun, Huang & Chu, 2015). Hence, we
chose sales performance vis-à-vis sales conversion at each stage of the sales pipeline as our
outcome variable.
2.4. PREDICTORS
The predictors of team-based sales performance are diverse and plentiful. But as this is a study
on team-based performance in Inside Sales, the search criteria is limited to the characteristics of
the teams, and their interactions with LMS. Furthermore, because the outcome of the study is
defined so stringently as actual quantifiable conversions of sales leads, the same objective rigor is
applied to the predictors. Hence any predictors that require subjective assessment are ruled out.
These include all behavior based constructs at the individual level such as leadership, personality
and orientation, and also at the team level such as team potency, team cohesiveness and team
identification.
From our scoping review, we identified the following three main research areas in the prediction
of team-based Inside Sales performance which can be objectively measured: composition of the
selling team which includes team design; task utility which consists of the interactions of sales
team members with the LMS; and intra-team coordination which consists of joint interactions of
the sales team members with the LMS. The existing literature related to each of these three areas
is reviewed in the following sections. It is also tabularized in Table 1.
The latent constructs are described first, followed by the reflective variables that are indicative
of them. For the purpose of this study, we are not measuring the latent constructs. Nevertheless,

15
we describe them to better appreciate the foundation of our measured variables. This allows us to
better summarize the key team-based constructs via their parent groups.

16
Table 1
Note: This table covers the literature used to identify our team-based constructs affecting performance. There were other studies done at solely an individual salesperson level, covering some of
these same variables. We refer to these studies throughout this document in order to further develop our understanding of the relevant variables.
Targeted Categories of Team-based Predictors of Performance from our Objectives Team Characteristics Interaction with Sales Leads
Identified Subcategories Design Composition Task Utility Intra-team Coordination
Variables in our Study Team
Size
Team
Experience
Team
Effort
Task
Input
Team Goal
Monitoring
Specificity
of Role Repetition
Intra-team
Communication
Paper Title Authors Relevant Pathways
Empowered selling teams: How shared
leadership can contribute to selling
team outcomes
Perry, Pearce & Sims Jr.
(1999)
Team Size → Shared Leadership (Moderator) → Internal Role Performance
Maturity → Shared Leadership (Moderator) → Internal Role Performance
Effort→ Sales Performance
Task Characteristic (interdependence) → Sales Performance
✓ ✓ ✓
✓ ✓
A Meta-Analytic Review of
Relationships Between Team Design
Features and Team Performance
Gooding and Wagner
(1985) Team Size → Performance ✓
Relations between work group
characteristics and effectiveness:
implications for designing effective
work groups.
Campion, Medsker and
Higgs (1993)
Relative Size→ Productivity
Task Interdependence→ Productivity
Communication within groups→ Productivity ✓
✓ ✓ ✓
Team Dimensions: Their Identity, Their
Measurement and Their Relationships
Nieva, Fleishman and
Reick (1985) Group Size→ Performance ✓

17
Work Groups and Teams in
Organizations
Kozlowski and Bell
(2001) Team Size→ Success ✓
Team‐based employee involvement
programs: effects of design and
administration
Magjuka and Baldwin
(1991) Team Size→ Team Effectiveness ✓
Managing sales teams in a virtual
environment
A.Rapp, Ahearne,
Mathieu and T. Rapp
(2010)
Team Experience→ Performance
✓
Technology Usage and Sales Teams: A
Multilevel Analysis of the Antecedents
of Usage
Weinstein and Mullins
(2012)
Team Sales Experience → Technology Usage
Team Goal Acceptance → Technology Usage *Tech usage is
said to lead to performance in other studies
✓
✓
Making sales technology effective Hunter and Perreault Jr.
(2007)
Experience→ Administrative Performance
Effort→ Administrative Performance
Communicating→ Administrative Performance
✓ ✓
✓
Key accounts and team selling: a
review, framework, and research
agenda
Jones, Dixon, Chonko &
Cannon( 2005) Team Tenure → Relational Learning Outcome→ Firm Outcome
✓
Does experience matter? The effect of
founding team experience on the
survival and sales of newly founded
ventures
Delmar and Shane (2006) Founding Team Experience → Sales
✓
Intangible sales team resources:
Investing in team social capital and
transactive memory for market-driven
behaviors, norms and performance
Bachrach, A. Rapp and
Mullins (2016)
Learning Effort → Selling Performance
Team Goal Monitoring → Learning Effort → Selling Performance
Transactive Memory Systems → (Moderator) Selling Performance
✓
✓
✓
Task-performing Groups Steiner (1976) Task Input→ Goals
✓
Team effectiveness: beyond skills and
cognitive ability.
Neuman and Wright
(2009) Checking & Form Completion → Task Performance
✓
Composition, process, and performance
in self-managed groups: The role of
personality.
Barry and Stewart (1997) Task Input→ Impact
✓
Organizational Behavior: Group
Structure, Process, and Effectiveness
Gist, Locke &
Taylor(1987) Task Characteristic→ (moderator)Group Performance
✓

18
The role of team goal monitoring in the
curvilinear relationship between team
efficacy and team performance.
T. Rapp, Bachrach, A.
Rapp & Mullins (2014) Team Goal Acceptance → (Moderator) Team Performance
✓
Teams in organizations: Recent
research on performance and
effectiveness
Guzzo and Dickinson
(1996) Group Goals→ Team Effectiveness
✓
Team Selling Effectiveness:: A Small
Group Perspective Smith and Barclay (1993) Member Interdependence →Perceived Task Performance
✓ ✓
Group Effectiveness: What Really
Matters? Shea and Guzzo (1987) Task Interdependence → Group Task Effectiveness
✓ ✓
A Meta-Analysis of Cohesion and
Performance: Effects of Level of
Analysis and Task Interdependence
Gully, Devine & Whitney
(1995) Task Interdependence →(Moderator) Performance
✓ ✓
A Meta-Analytic Review of
Relationships Between Team Design
Features and Team Performance
Stewart (2006) Intra-team Cooperation → Performance
✓ ✓
Team performance and control process
in sales organizations
Rajagopal & A. Rajagopal
(1998) Team Coordination→ Sales unit Performance
✓ ✓
Sales teamwork: a dominant strategy
for improving salesforce effectiveness
El Ansary, Zabriskie and
Browning (1993) Temam work(coordination) → Salesforce Effectivenss
✓ ✓
Team Structure and Performance:
Assessing the Mediating Role of
Intrateam Process and the Moderating
Role of Task Type
Stewart & Barrick (2000) Interdependence( task interdependence)→ Work Team Performance
Interdependence( Communication)→ Work Team Performance
✓ ✓ ✓
Key account teams: success factors for
implementing strategy Lai and Gelb (2015) Within team communication → Sales Result
✓

19
2.4.1. QUALITY OF TEAM COMPOSITION
The terms team and group are used interchangeably. Group refers to the contribution of each
individual member in a team in terms of skills, abilities and disposition (Hollenbeck, Ilgen, LePine,
Colquitt & Hedlund, 1998; Tesluk & Mathieu, 1999). Team composition is a latent construct in
the scope of our study, which is formed by three observed variables: Team size, Team experience
and Team effort. Experience is seen as possessing greater skills and abilities. A salesperson’s skills
and abilities are expected to grow with the duration of time he/he spends on a certain sales lead or
use a LMS. Effort can be looked upon as a type of disposition that each salesperson has towards
work, in terms of the level of activity. As for size, it is a basic element of team design which
determines the number of members there should be per team. Despite it being a design feature,
Kozlowski and Bell (2001) and Smith and Barclay (1993) include team size under team
composition. It is important in terms of its aggregative properties in the sense that more effort and
experience would be equal to a better performing team if one uses aggregate measures to define
the team variables of experience and effort. Hence team size, along with team effort and team
experience are important components of a favorable team composition.
2.4.1.1. TEAM SIZE
In order to define team size, we must first define a team. As stated before, team-based job
design is defined as when there are two or more people working in a group who are dependent on
each other’s activities and who share a common goal (Rajagopal & A. Rajagopal, 1998; Salas et
al., 1992). So naturally, the number of people in the context of such a team design forms the team
size. Each team is assigned a particular set of leads or a particular project which receives a certain
type of leads. Both scenarios are defined by their temporal nature. Indeed, the members of a sales
team can be put together temporarily depending on the needs of the buyers (Rapp, 1989). Hence a

20
team’s size can fluctuate over the course of its existence, depending on whether new members are
added or removed for new projects or new sets of leads.
2.4.1.2 TEAM EXPERIENCE
Weinstein and Mullins (2012) define team experience as the aggregation of each salesperson’s
experience in a team, where experience is the length of service over the whole career of each team
member. Mintu-Wimsatt and Gassenheimer (2000) and A.Rapp, Ahearne, Mathieu and T. Rapp
(2010) constrain the boundaries of such a definition of a team to mean length of service in the
current position of each member of the team. The latter definition is adopted for our study because
we do not have, in our data, records of the salesperson’s experience outside the context of their
current organization.
In general, there are two ways of measuring team experience. One is by aggregating the team
experience of each member, the other is by measuring the heterogeneity of experience within a
team, where a greater heterogeneity is seen as a positive trait. In this study, the aggregate
experience of all members in a team is used since several studies used such an aggregation
technique (Weinstein & Mullins, 2012; T. Rapp, Bachrach, A. Rapp & Mullins, 2014).
2.4.1.3. TEAM EFFORT
To the best of our knowledge, team effort has not been defined in prior literature, but individual
salesperson’s effort is defined as the force, energy or activity with which work related tasks are
accomplished (Brown & Peterson, 1994). Hence we aggregate the effort of each team member to
mean team effort. Effort is also described as the persistency of salespeople in terms of length of
time committed to work despite failure (Sujan, Weitz & Kumar, 1994). Therefore it reveals the
force or energy of teams with which they carry out work related tasks, such as calling sales leads.

21
In this case, length of time translates to the number of call attempts, where the sales team persists
with its activity of calling sales leads despite failure.
2.4.2. TASK UTILITY
Levine & Moreland (1990) state the potential importance of team task and inter member
communication for measuring team productivity. Collectively, this can be described as the latent
construct of task utility, where team task includes the observed variables of Task input, while Inter-
member communication refers to the observed variable of team goal monitoring.
Job analysis involves tracking job components which determine job performance (Neuman &
Wright, 2009). Hence in order to measure performance, it is important to measure the interactions
of the sales teams with the LMS employed by the company, as it is a component of their job. Since
using LMSs is a part of their job description, it is important to understand how efficiently they use
it. Neuman and Wright (2009) identify forms completed, and checking as two subset measures for
assessing job specific skills. Forms completed corresponds to task input, as it is being checked if
a particular task has been inputted or completed. Checking corresponds to the quality of Task
input, as is done to observe the accuracy or quality of the task that is completed. Jelinek, Ahearne,
Matheieu and Schillewaert (2006) measure sales technology adoption by how frequently a
salesperson uses the technology, and to what extent he/she fully utilizes the capabilities of that
technology. These correspond to task input and the quality of task input respectively.
Barry and Stewart (1997) include measures called “pulls weight” and “quality concerns” to
quantify the effect of task on group impact. “Pulls weight” is comparable to “form completion” as
a salesperson is mandated to do his/her part. “Quality concerns” is comparable to “checking” as
22
one is expected to do his/her part with proper rigor and efficiency. Thus, Task input and the quality
of task input repeatedly prove themselves to be important indicators of task utility.
2.4.2.1. TASK INPUT
Task input is defined by Barry and Stewart (1997) as fulfilling any responsibility towards
achieving a certain goal. Researchers on teams have expounded task input and socioemotional
input as moderators of team performance. While measuring socioemotional input is beyond the
scope of this study, it is possible to measure the task input which leads to sales performance in the
usage of LMS.
The task product must be specified before certain information cues can be recognized as task
input (Wood, 1986). In our case, the task product is the set of attributes that make up the
functionalities of the LMS. There are many information fields in such a system which act as
opportunities of task input. The other part of Task Input is task characteristic, which is defined as
the composition of “key components of what the selling team must do and how the selling team
must do it” (Perry et al., 1999, p.43). Therefore, task input can be said to have two components,
one is merely the doing of a task, the other inspects how well or thoroughly a task has been done.
2.4.2.2. TEAM GOAL MONITORING
Bachrach, Mullins and Rapp (2016) define Team goal monitoring as the facilitation of auxiliary
corroboration to ensure that “critical market focused processes are activated and performance
criteria are met” (p.9). Marks, Mathieu & Zaccaro (2001) concur that Team goal monitoring is a
process by which the members of a team track progress towards the accomplishment of goals. This
is applicable to our case as there is communication among team members pertaining to the mutual
overseeing of progress.
23
There is a link between interpersonal cooperation and Team goal monitoring in that effective
information sharing among members is only possible when team members are cooperative. Yilmaz
& Hunt (2001) describe cooperation to be the sharing of skills, knowledge, time and effort with
coworkers to achieve common objectives. Thus just like team goal monitoring, cooperation also
contains a theme of sharing information to keep every member of the team on the same page for
furthering a certain objective. Hence, it strengthens our case for measuring team goal monitoring
via communication within teams where progress related information is shared.
2.4.3. INTRA-TEAM COORDINATION
The latent Intra-team coordination construct is formed by the observed variables Specificity of
Role, Repetition and Intra-team communication. According to Stewart (2006), intra-team
coordination captures task coordination activities within a team, rather than between a team and
the rest of the organization. Such intra-team coordination fosters a type of interdependence where
the team members depend on each other for information and knowledge (Campion, Medsker &
Higgs, 1993). Therefore, team members have to be more specialized in order to become a better
functioning and more coordinated unit. Such specialization is incumbent on having multiple roles
in one team where that role is performed by only one person. So, high coordination is contingent
on the existence of multiple specialized roles. High coordination is said to result in shared
expectations and common behavior (Stewart & Barrick, 2000). This leads to repetitive behavior
within a team where everyone is accustomed to executing a task in a certain way. High
coordination is also said to open communication channels (Stewart, 2006). Team members have
to effectively communicate with each other to achieve shared objectives.
Cespedes (1992) laments the lack of research on coordination within sales teams. He identifies
two types of coordination, namely: coordination via planning and coordination via feedback. The

24
first of these corresponds to Specificity of Role and Repetition, the second corresponds to
communication. Each indicator is further explained in the following passages. (See Section 2.4.3.1,
2.4.3.2 and 2.4.3.3)
2.4.3.1. SPECIFICITY OF ROLE
We define specificity of role as the number of specialized roles in a team, where one member is
solely responsible for performing that one specialized role. It is a strong antecedent to task
interdependence, which is defined as the extent to which salespersons depend on one another for
information and assistance to accomplish their tasks and improve their performance (Thompson,
2003). Hence, the greater the specificity of roles within a team, the more specialized that team is
and members depend on each other. The workload is amply distributed in such teams. One of the
measures for task distribution is workload distribution amongst salespeople (Rajagopal & A.
Rajagopal, 1998), where each person is said to be specialized in a certain task. This again coincides
with our idea of greater specificity to mean greater specialization.
2.4.3.2. REPETITION
The concept of repetition is close to a transactive memory system. Bachrach et al. (2016)
propose that a transactive memory system mediates the relationship between effort or commitment,
and sales performance. In such a system, members of a team gain efficiency by repeatedly
performing a task and engaging with other team members in a certain way. Hence, we define
repetition as the iteration of sets by team members, where each set is a unique ordering of team
members, each responsible for one or more roles. Lewis (2003) uses the measures of specialized
knowledge of team members and the repeated integration of expertise of different team members
in different areas to measure transactive memory systems. We can thus infer that in order for

25
coordination to work, it needs the repetition of specialization where team members repeat their
roles in order to achieve greater efficiency.
2.4.3.3. INTRA-TEAM COMMUNICATION
Intra-team or within-team communication is defined by Guzzo and Shea (1992) as the social
interaction between team members regarding how decisional and affective information is
exchanged. Rajagopal and A. Rajagopal (1998) measure team coordination as communication and
flow of directives with salespeople. While Levine and Moreland (1990) find little evidence for
within-team communication leading directly to productivity, they do find it to have a positive
impact on cooperation amongst team members. They attest to more equal participation because of
electronic communication. Thus, intra-team communication is also a vital piece of intra-team
coordination by which it can positively affect sales performance, because good coordination in the
face of a continually changing workplace dynamics cannot happen without adequate
communication between team members. One of the virtues of using LMSs is the benefit of virtual
communication. The right team members irrespective of geographical barriers are able to better
collaborate in order to accomplish relevant tasks and goals (Griffith & Dunham, 2015).

26
CHAPTER 3: METHODOLOGY
Hitherto, our first two research objectives are complete. We formalized the team-based performance
in Inside Sales, and systemized the team-based factors that affect Inside Sales performance to identify the
predictor variables that are relevant to us. Going forward, this chapter discusses the research design, the
sample, and the operationalization of our predictor variables. Then we dive into the methodologies used to
extract our outcome variables, build our conceptual model, and finally empirically test our model.
3.1. RESEARCH DESIGN
Our study explores the effects of the drivers of team-based Inside Sales on sales performance.
For that we use quantitative methods on secondary data from our industrial partner, a major North
American Lead Management Software Company. The quantitative approach is suitable for the
type of applied research that we do, as it involves a large quantity of data that is already available
and upon which predictive analytics may be performed.
3.1.1. DATA COLLECTION
Our study is data centric. Ensuring the maintenance and protection of the secondary data is
important. Therefore, the data is stored in one computer located in a research lab at the University
of Ottawa. This is done in order to geographically restrict its access to one place. It is stored in the
computer’s drive and not the cloud, as a security measure. The computer has the necessary anti-
virus systems and firewalls to ensure the safety of the data while it is being processed. Furthermore,
the designated computer is password protected, which adds another layer of security to the already
locked lab doors. Such measures are necessary to protect the privacy of the data that our industrial
partner entrusts us with.
27
3.1.2. DATA TRANSFORMATION
The secondary data we obtained from our industrial partner was very unorganized, so a lengthy
process was followed to organize it according to the needs of our project. The assessment and
preparation of the data involved filtering it to extract only the variables that are relevant for the
scope of the research. Then it involved preparing or converting that data to correct units of
measurement for subsequent analysis. The ultimate goal was to create a data file containing all the
relevant variables which are ready to be analyzed.
3.2. SAMPLE
The sample needed for this study consists of B2B companies employing teams which have
implemented lead management software in their Inside Sales operations. Six of these companies
represent our sample, three from the insurance industry and three from the Marketing &
Advertising Industry. The unit of analysis is the characteristics of each team derived from the team
design or composition, or the interaction of team members with sales leads.
There are no issues in obtaining a minimum number of leads from these companies for the
research to be statistically significant because it is common for companies to generate hundreds of
leads each month. These leads in turn have hundreds of interactions everyday with the sales teams
of the companies in question. While our unit of analysis is teams represented by the 4237 cases,
the variables for those teams were derived from over three million interactions of sales teams with
sales leads. Regarding the final number of cases after the raw data was converted to variables,
Schwab (2002) states that there must be a minimum of ten cases per variable in multinomial
logistic regression, which is the method used in Phase 3 of our research. We have nine predictor

28
variables, including industry. Considering our lowest amount of cases in Qualification Ratio,
which is 1762 teams, we are still covered by that estimate.
This study will use nonprobability sampling. We make use of all the data that we have at our
disposal from the six companies since the provider of this data is a lead management software
company whose clientele represents our target population. The thought of doing quota sampling
was also considered in order to have an equal representation of the different industries that these
companies represent. But since this was a study were the raw data comprised of over three million
interactions of sales teams with leads, the research would be better off with as much information
as possible. Attempting to make a large volume of data manageable by taking smaller sample sizes
overrides the scale of the data that makes it so appealing in the first place (Tinati, Halford, Carr &
Pope, 2014). Narrowing the scope of interpretability by choosing only two industries helps with
the external validity of the study.
3.3. MEASURES: PREDICTOR VARIABLES
3.3.1. TEAM SIZE
To measure Team Size, we count the average number of salespeople assigned to each sales team
for all the leads that team has worked on. We do this by counting how many distinct IDs are within
each ContactOwnerGroupID for every interaction history with a lead, then finding the average of
this number for all the leads the team has worked on. ContactOwnerGroupID refers to the sales
team that a lead is assigned to. Its IDs include the following: AddUserID, which is the ID of the
salesperson who added the lead to the list; UpdateUserID, which is the ID of the salesperson who
last updated the call data of the lead; and UserID, which is the ID of the salesperson who called
the lead. Hence, by counting distinct IDs from these three variables per ContactOwnerGroupID

29
for each lead, we are able to ascertain the number of members in that sales team for that lead. To
arrive at the team size, we can find the average of this number for every lead the team has worked
on.
Team Size was a relatively straightforward measure to operationalize. Stewart (2006) and
Gooding and Wagner (1985) both conducted a meta-analysis of studies that measured the effect of
team size on performance. In all instances, team size was calculated by the number of members
that were designated in teams. Those teams follow the prior definition of a team as established in
the Outcome: sales performance in the sales pipeline section (see Section 2.3). The
ContactOwnerGroupID constitutes such a team, as it is a group of more than one person, in charge
of selling to leads, whose tasks are interdependent on each other.
3.3.2. TEAM EXPERIENCE
To measure Team Experience, we sum up the number of months a salesperson has been working
in the organization for all team members. We first see when that salesperson’s user account was
created. Then we look at the date of the last contact made with a lead by checking the Call Date of
the last CallHistoryID for that particular salesperson within that team. The difference between the
user account creation and the latest activity determines the experience of that salesperson within
his or her team. Following that, we sum up the experience of each team member to calculate the
total experience for that team.
Measuring team experience by accounting for the duration of each team member’s stay in the
organization has been practiced before (A. Rapp et al., 2010; Mintu-Wimsatt & Gassenheimer
2000). It is different from measuring experience in the context of a singular team because team
members can be members of multiple teams throughout their stint in the organization. Indeed,

30
greater team experiences have meant the presence of members in the team who were part of
multiple teams prior (Rentsch, Heffner & Duffy, 1994).
3.3.3. TEAM EFFORT
To measure Team Effort, we count the average number of successful and unsuccessful contact
attempts made by a particular ContactOwnerGroupID per lead. We do this by summing the total
CallHistoryIDs for each ContactOwnerGroupID. CallHistoryID is a unique identifier for each call
made. Thus, by summing the number of CallHistoryIDs for each ContactOwnerGroupID per lead,
we can ascertain how many times that team tried to, or successfully established contact with that
lead. By averaging this number for every lead the team has worked on, we arrive at team effort.
Many researchers have operationalized effort by counting the number of calls made by each
salesperson (Brown & Peterson, 1994; Sujan et al., 1994). Such individual effort of team members
may be aggregated to account for team effort. Calling is one of the features of an LMS. It is an
actual activity that is recorded and requires effort; it is not merely an administrative task (Ahearne
et al., 2004).
3.3.4. TASK INPUT
To measure Task Input, we count the average number of content words per call history comments
made for each lead worked on by a team. Content words are nouns, verbs, adjectives and adverbs
in a sentence. The comments variable in call history is a textual form of data. It is an observation
made by the salesperson about the call he/she made. Adding the total number of content words of
all call history comments for each lead gives us the total task input for that lead. Subsequently we
can average this number for all leads worked on by a team to ascertain the task input of that team.

31
From a sales point of view, the input of data by salespeople is essential to understand the selling
or buying situation (Tanner et al., 2005). Hence, fulfilling such responsibilities by salespeople is
an important act which can and should be measured. Task Input has been measured by the survey
measure of “pulls weight” which asks if the team members have done their part in contributing to
the overall work process, and “quality concerns” which asks if a task has been done diligently
(Barry & Stewart, 1997). In other words, it measures if salespeople have fulfilled the task they are
responsible for with due diligence. Wood (1986) describes task input as a required act. It has also
been measured by the survey item describing frequency of use and extent of utilization by Jelinek
et al. (2006). Similar to our measure, task input has previously been measured by other researchers
as the fulfillment of required duties with a particular level of meticulousness. More specifically,
Ahearne et al. (2008) include “note taking” as a part of their archival IT use measures, which is
what we are measuring.
3.3.5. TEAM GOAL MONITORING
To measure Team Goal Monitoring, we count the average number of LeadStatus updates for all
leads worked on by a team. In other words, we count the number of different lead statuses for each
lead, then average that number for all leads to obtain the team goal monitoring rating for that team.
LeadStatus is a textual field like call history comments. It is the name and description of the status
or position of a lead in its journey through the sales pipeline.
Marks et al. (2001) and Bachrach et al. (2016) use measures such as tracking progress towards a
goal and monitoring the advancement towards a goal to measure team goal monitoring, which is
similar to how we do it.

32
3.3.6. SPECIFICITY OF ROLE
To measure Specificity of Role, we count the number of user IDs in a team that serve only one
role in the team’s interaction with a lead. Subsequently, we average this figure for all the leads that
team has worked on to ascertain the specificity of role for the team. Different roles in this case
constitute AddUserID, UserID and UpdateUserID. All have been already defined in the team size
subsection. While team size is calculated by counting the average number of distinct user IDs per
lead for a team, Specificity of Role sees how many of these distinct user IDs perform only one
role, as opposed to performing more than one role out of the three possible roles.
Campion et al. (1993) and Yilmaz and Hunt (2001) have both used measures of task
interdependence to measure coordination within teams, which is dependent on everyone doing
their part or being involved. Survey items measure the dyadic relationship between employees and
their coworkers, regarding their ability to do their jobs well without information and assistance
from each other. Other researchers measure team usage across all members of a team to verify if
the SFA is utilized by all, hence reinforcing the notion of everyone being involved (Eggert &
Serdaroglu, 2011; Schillewaert, Ahearne, Frambach & Moenaert, 2005).
3.3.7. REPETITION
To measure Repetition, we count the number of sets per lead per team, where each set is a
different combination of roles performed by those team members. We average this number for all
the leads the team has worked on to arrive at the repetition of a team. Different roles in this case
constitute AddUserID, UserID and UpdateUserID. All have been already defined in the team size
subsection. Combination of role refers to team structure, where each team member can be
responsible for one or more role. We find all such combinations of roles in a team, each of which

33
constitutes an unique set. We then sum the number of times all sets are repeated per lead, and
average the number for all leads worked on by a team.
Lewis (2003) and Barachrach et al. (2016) used survey measures such as lack of
misunderstanding, working well together, and fulfillment of work promises to measure
coordination and team goal monitoring. This suggests the perpetual continuity of work in what can
be described as repetition. Along with involvement of differentiated roles, repetition of those roles
is the other half of specialization. Lewis (2003) measured specialization with the survey items that
measure the existence of different roles for different members of the team, and the necessity for
each team member to be expert in his/her respective role. This demonstrates the need for repetition,
where one repeats the given role until expertise is achieved.
3.3.8. INTRA-TEAM COMMUNICATION
To measure Intra-team communication, we sum the product of the number of content words in
call history comments and lead statuses per lead, and the number of distinct members of the team
responsible for inputting those call history comments and lead statuses. To arrive at intra-team
communication, we count the average of this figure for all leads worked on by the team.
Counting the number of content words accounts for decisional and affective information
exchanged between team members. Counting the number of different team members making the
comments and updates shows the level of engagement in the team with regards to communication.
Together, their product indicates how much intra-team communication is going on by taking into
account both the participation and the quality of the participation. While intra-team communication
has not been directly measured in the past, Rodriguez and Honeycutt Jr. (2011) measured
collaboration as the willingness to communicate client needs. In order to do this, they attempted

34
to note all signs of communication flow between team members. Other researchers employed
collaboration measures such as directive language pertaining to feedback and any information
regarding the business, such as product attributes, competitors and customers (Rajagopal & A.
Rajagopal, 2008; Yilmaz & Hunt, 2001). Note that it is intra-team communication that is being
measured, but under the guise of collaboration.
3.4. IDENTIFYING THE OUTCOME VARIABLE MEASURES
This section corresponds to objective three from our Research Objective section, where we first
identify the stages of the sales pipeline to calculate then performance ratios, and then discretize
them into tiers to unearth our outcome variables. Distinct stages have previously been identified
in the literature regarding the progress or journey of a business lead through the sales funnel or
pipeline. The words funnel and pipeline are used interchangeably. It was our intention to confirm
these stages of the sales pipeline via the extant taxonomy, but also propose a new taxonomy to
describe new stages of the sales funnel if need be. Identifying and labeling different stages of the
sales pipeline allows us to measure the variance in sales performance at those stages. We did this
via topic categorization, which involves identifying the main theme in a text by employing both
semantic and relational algorithms (Fan, Wallace, Rich & Zhang, 2006). This usually involves
working with a number of predefined concepts.
3.4.1. PRELIMINARY FINDING: DETERMINING THE CONCEPTS
In our preliminary textual exploration of the data, we identified five distinct stages of the sales
pipeline, four of which are documented in the literature, namely: Suspect, Prospect, Qualified and
Client, and one new stage which we have chosen to label as “No Contact”. The chronological order

35
of these stages in the sales pipeline is as follows: No Contact, Suspect, Qualified, Prospect, and
Client.
In order to derive the five stages from the data, exploratory text categorization was conducted
using the software Leximancer, which uses a mix of semantic and relational algorithms to create
concept maps. Leximancer was chosen because it is a concept or topic extraction tool (Smith,
2003). Leximancer creates concepts as indicated by grey dots. The more connected these concepts
are to other concepts, the larger the size of that concept’s grey dot. For a certain range of
connectivity, Leximancer assigns a theme to a group of concepts, labelling the theme as the most
connected concept in that theme. The size of the thematic circles bear no relevance, but the
thematic circles are color coded from hot to cold in terms of the number of concepts present in the
circle.
When salespeople report on (i.e., document) the results of their dealings with leads, the language
they use can be very polysemous in the sense that one word can have multiple meanings. This is
true for our data. Hence, it was important to choose concept extraction and not clustering for
identifying themes of information, which we could then use to delineate the five stages of the sales
pipeline. Whereas clustering separates concepts on the basis of mutual exclusivity, concept
extraction separates concepts based on whether they share a common source word. We chose
Leximancer as an initial exploration tool because of its ability to generate concept maps using its
semantic and relational algorithms. Leximancer is recognized as an advanced tool for generating
concepts and its use is validated by many studies (Nunez‐Mir, Iannone, Pijanowski, Kong & Fei,
2016; Smith & Humphreys, 2006).
The stages of the sales pipeline were classified using text mining on the Result Codes sheet,
which consist of codes for different Result IDs. A Result ID uniquely identifies different outcomes

36
of each call made to the lead. Sales teams from companies work on projects which receive sales
leads. Each Project ID has different Result IDs which correspond to different Result Codes, as
indicated by the Result Codes sheet. In total, there are 595,027 Result Codes used by teams. It was
our intention to textually explore all the Result Codes to understand how sales teams classify the
results of each call. This allows us to understand the different states of a lead as it progresses
through the sales pipeline.
We are more interested in the concepts than the themes. This is because the result codes are all
a sentence each, with no more than a few words on average. So semantically speaking, it is easy
for group them with other result codes under one theme even if they represent different stages of
the sales pipeline. It is quite likely that multiple concepts exist within one theme where the theme
would not be an accurate descriptor of the stage. Hence, we examined all the concepts from the
concept map (as produced through Leximancer) and noticed that they can be categorized under
five stages of the sales pipeline, namely No Contact, Suspect, Prospect, Qualified and Client. There
are many concepts which are too vague to be interpreted, but five types of concepts can be noticed
from the concept map (see Appendix B). These concepts are binned into their categories in Table
2.

37
Table 2
Result Codes: Identification of the Stages from Leximancer
No Contact Suspect Prospect Qualified Client
Wrong Number
Bad number
Left voicemail
Retry in n days
Call back
Bad fit
Currently
using “ ”
Wrong
Person
Not
interested
Requested
information
Requested
call back
Scheduled
Dm-
decision
maker
Interested
in future
Wants info
Refer
Scheduled
Appointment
Scheduled
Meeting
Confirmed
Survey
completed
Registered
Client
Sold Account
Order
completed
We were interested in uncovering many concepts, then seeing if those concepts converge around
certain themes that we have identified from the literature, or completely new themes. If we set a
predefined number of concepts to begin with, a lot of information could be lost as each concept
could have multiple important sub concepts. Thus, the strategy is to first uncover as many concepts
as possible, so each topic is representative of a singular area of information. Then we accounted
for all these separate areas of information to see if they could be grouped into the stages of the
sales pipeline. A total of 63 concepts were extracted. See Appendix C for a total count and
relevance of each concept. Using our expert knowledge, we understood the relation between each
separate concept in the context of sales. Thus, we were able to group them into the five
aforementioned buckets in line with the literature.
Further text mining analysis was conducted to verify the five stages of the sales pipeline. Once
the stages were determined, progression through the pipeline could be measured in terms of
performance ratios. The best way to calculate progression would depend on the descriptive data
from the classification of leads. Once the performance ratios were identified however, there would

38
be tiered performance groups for each performance ratio. Those tiered performance groups would
serve as our outcome variables. The fixing of the performance ratios and the ideal number of tiered
performance groups are discussed in the following section (in Phase 1 and Phase 2 respectively).
3.4.2. PROCEDURE TO EXTRACT OUTCOME VARIABLES
3.4.2.1. PHASE 1: TEXT MINING ANALYSIS: Use topic extraction to classify the stages of the
sales pipeline. Subsequently classify all result codes into the identified stages.
The first phase involved text mining analysis to classify sales performance in the context of the
sales pipeline of an organization. Text mining is a broad field encompassing many procedures and
techniques which analyze qualitative textual data to provide both quantitative and qualitative
insight. One of its applications is discovering business knowledge from the wealth of information
generated from sales and customer relationship related software (Gupta & Lehal, 2009). In the
realm of text mining, we are particularly interested in concept extraction, which allow us to identify
the different stages of the sales pipeline.
To validate our preliminary findings, Latent Dirichlet Allocation (LDA) was used as a topic
modelling technique to extract concepts from the text. LDA as a topic modelling tool generates
topics or concepts not only through the co-occurrence of words but also through a semantic
connection between words (Maier et al., 2018). LDA treats each document as a mixture of topics,
and each topic as a mixture of words (Silge & Robinson, 2017). This makes sense as our Result
Code sheet contains tabular data, and we hope to uncover multiple topics from this data via
unsupervised machine learning, where each formed topic consists of a mixture of words from
various rows in the document. The LDA method is particularly suitable for studies with a large
volume of data. (Maskeri, Sarkar & Heafield, 2008; Tirunillai & Tellis, 2014). Indeed, compared

39
to other topic modelling techniques, LDA was found to be particularly adept at detecting multiple
topics from lengthy documents (Lee, Song & Kim, 2010; Maier et al, 2018). This is suitable for
our case, as the Result Code sheet is a lengthy document consisting of hundreds of thousands of
rows.
When conducting the actual LDA test, we first removed all stop words as a necessary
preprocessing step to obtain a more insightful result (Luo, Pan & Zhu, 2017; Zhao et al., 2011).
There is no estimate of an optimal number of topics in LDA, as the number of topics is an external
parameter which must be experimented with (Elgesem, Steskal, & Diakopoulos, 2015). The best
strategy would be to extract multiple topics and see if those topics fit within the five pre-identified
themes (i.e., No Contact, Suspect, Prospect, Qualified and Client). We were able to do this using
an ontological approach, which seeks to understand what exists. In our view, the different
classifications of leads in the pipeline exists as per a priori research on this subject matter.
Moreover, the author of this study was able to use his expert knowledge having worked as a lead
researcher before to borrow from the empirics to supplement the rational approach. We manually
coded the unique Result Codes, assigning them to one of the five stages of the sales pipeline.
Insight from topic modelling provided cues on all the different topics of information that could
cause a result code to be classified into a certain stage. This allowed us to hand code the various
types of result codes into one of the five stages of the sales pipeline, despite the semantic or
contextual differences that may exist between them.
To measure the reliability of our classification, we used the test-retest method where we
assigned each sales result into one of the five identified stages at two different points of time. A
correlation score of above 0.8 between the two classifications meant that there is good reliability

40
(Vilagut, 2014). Our measurement possesses criterion and construct validities in line with the
definitions of the five identified stages (see Section 2.2).
3.4.2.2. PHASE 2: JENKS NATURAL BREAKS OPTIMIZATION: Discretizing performance ratios
at each stage of the sales pipeline into levels of categorical performance, which will serve as our
output variables.
After having calculated the performance ratios from the identified stages of the sales pipeline,
the next phase is to identify the outcome variables. The outcome variables in our study measure
different levels of team performance, which is based on the discretization of performance ratios at
each stage of the sales pipeline.
Our data does not allow us to extract the formation dates of the sales teams, but it allows us to
extract the date of the teams’ first interaction with a lead (i.e., when a member of the team first
interacted with a lead). Hence, to calculate the performance ratios, we measured the interactions
of sales teams with leads from the first to the last interaction.
Once all teams and their performance ratios were listed, we plotted histograms that showed the
frequency distribution for each ratio across all teams. Our aim is to discretize the continuous ratio
variable into distinct groups. Therefore, we had to determine the cut-off points in the data to
classify these groups. While a lot of discretization happens on the basis of equal length of groups
over a certain range of data, or groups demarcated on a certain quartile or percentage of the data,
we are more interested in identifying the natural breaks (if any) in the data. To do this, we used
Jenks Natural Breaks clustering. It is a non-hierarchical iterative partitioning method
recommended for dividing observations into a pre-determined number of clusters. It finds the
natural breaks in the data by minimizing within-class variance, while maximising between class

41
variance (Jenks, 1963). Non-hierarchical methods such as K-means clustering are better than their
hierarchical counterparts as they are robust to outliers and heavily skewed distributions (Slater &
Olson, 2001). But while K-means clustering is traditionally a multivariate technique, the Jenks
Natural Breaks clustering is suitable for classifying one dimensional data while retaining the non-
hierarchical attributes.
3.5. PROCEDURE TO BUILD THE CONCEPTUAL MODEL
Once we had extracted both the predictor and outcome variables, we would have to build a
conceptual model showing the relationships between each set. To do this, we weighed the
directional hypothesis of each predictor on Inside Sales performance based on all prior research
conducted on the constructs. This allowed us to hypothesize the direction of effect of each
construct on sales performance. Hence, we followed a deductive approach. Please note that for
those constructs that were never measured at a team level before, we extended their results at an
individual level to hypothesize performance at a team level.
3.6. PROCEDURE TO VALIDATE THE CONCEPTUAL MODEL
MULTINOMIAL LOGISTIC REGRESSION: Extract and logistically regress the predictor
variables on the outcome variables, -i.e., the low, medium and high performing groups for each of
the performance ratios.
Even though our outcome variables are categorical in nature and have a tiered aspect to them
where the team performance increases from low to medium to high, we could not use ordinal
regression on our data. This is because each of the groups did not meet the proportional odds
assumption, which is a necessity for ordinal regression. Appendix D shows that, for each ratio the
null hypothesis is rejected, the slope coefficients are the same across the three response categories.

42
Multinomial logistic regression is used when the dependent variable is categorical with more
than two levels, as it is with our case. As stated earlier, we are interested in deriving three groups
which are characterized by the maximization of their intra-similarity and inter-dissimilarity, and
not their size. Multinomial regression does not require the group sizes to be equal (Tabachnick &
Fidell, 2007). Additionally, multinomial logistic regression has an advantage in that it does not
need the predictor variables to meet requirements of normality, linearity and homoscedasticity
(Bayaga, 2010). We are yet to determine the nature of our predictor variables, but it is a safe bet
that many of them will not meet the criteria for normality, linearity and homoscedasticity.
However, the assumption of non-multicollinearity of variables has to be met for logistic regression.
Only VIF values of less than 10 will be accepted, and as such a threshold value has been
recommended before (Hair, 2014; Kennedy, 1992).
Logistic regression has the benefit that it can directly produce probabilities which are better for
business interpretation. It is a common method for measuring sales performances. Some
researchers use logistic regression to measure sales performance where the outcome variables are
nominal, and are representative of certain sales success (Liu, Chugh & Noel Gould, 2016). Other
researchers frequently use logistic regression to measure sales performance where the outcome
variables are ordinal, and are representative of levels of sales success (Warren, 2016; Gilinksy,
Newton & Ayler, 2018). The latter is akin to our case. Also, in the sales force management context
where the data can be complex and unstructured, data mining techniques such as logistic regression
and decision trees are more useful than the simpler linear regression techniques (Albers, Raman &
Lee, 2015).
After we identified the three categories of performance for the Suspect, Prospect and
Qualification ratios, we ran a multinomial logistic regression model for each ratio that comprises

43
the eight predictor variables and the three outcome variables. For each hypothesis, we verified if
the proposed relationship between the predictor variable and outcome variables is significant in
terms of direction and effect. The low performance group was the designated baseline comparison
group. The relative probability of a team being in the medium and high performance groups had
to be significant for each predictor variable in order to prove the respective hypothesis.
We first checked for overall model fit via chi-square likelihood ratio test at the 0.05 confidence
level and the Pseudo R-Squared values. In particular, we looked at the McFadden R-Squared
because it satisfies almost all criteria for running multiple logistic regressions together in a
multinomial setting (Menard, 2000). A value between 0.20 and 0.40 is set to exemplify an excellent
fit (McFadden, 1973). From the classification table, we obtained the accuracy of the models in
predicting the outcome performance group. We looked at the Akaike information criterion (AIC)
values to see if a balance could be struck between goodness of fit and parsimony. We constructed
the Receiver Operating Characteristic (ROC) curves of these different models to see how they
compare in terms of diagnostic ability, but also to understand which variables have more predictive
ability. The use of ROC curves is heralded due to its summarization of performances across all
possible thresholds (Muñoz & Felicísimo, 2004). It really allows us to isolate the chances of
predicting a high and medium performing team respectively with respect to the other two
performance groups in each case. Finally, to validate our findings, we employed bootstrapping
validation where the data is repeatedly sampled using replacements from the original dataset.
As far as the environmental or external factors go when it comes to determining sales
performance, none of our main variables are beyond the influence of the company or the employees
of the company. However we will use industry as a control variable, which can be categorized as
an external factor. As we have two industries, it is important to control for them to see if they have

44
an effect on the results. It is equally important to control for the number of leads worked on by a
team, as our sample contains data from 2005 to 2016. For this reason, all our predictor variables
were calculated on a per lead basis, where any measurement would be averaged for all leads
worked on by that team. The B2B sector has long sales cycles, so the lead in question takes
precedence over the year of operation. Gaps between years of operation signify that contact with
leads was paused because of a loss of contact, or that a need could not be met, and that it was only
reengaged later on in a different context. Hence for teams who had such gaps in their record for
leads, only their history with the lead post gap was considered.

45
CHAPTER 4: OUTCOME VARIABLE RESULTS
4.1. PHASE 1: TEXT MINING ANALYSIS
4.1.1. IDENTIFICATION OF THE FIVE STAGES
Sales teams work on projects which receive leads. Each Project ID has different Result IDs which
correspond to different result codes. In total, there are 595,027 result codes that are used by teams.
Result ID is a unique identifier of different outcomes of each call made to a lead. Through text
mining, we explored all the result codes to determine how sales teams classified the results of each
call. We were able to extract the different stages a lead goes through during its journey through
the sales pipeline, namely No Contact, Suspect, Prospect, Qualified and Client. For a definition of
each stage, refer to Appendix E.
4.1.2. THE PROCESS USED TO EXTRACT THE FIVE STAGES
In order to identify the stages of the sales pipeline defined above, we looked at the full range of
595,026 result codes irrespective of the frequency of terms. This meant the application of text
mining to all 24,746 unique terms that made up those 595,026 terms. When text mining the result
codes, there were some cases that were unclassifiable in our framework. So it didn’t make any
sense to group them under one of our 5 identified stages. The Results Codes that were not counted
as one of the five stages include: already a client, post client services, foreign language result,
gibberish information (numbers, wildcards), redirectory information, etc. For leads associated with
such results, there were other results in the call history that were more meaningful, hence the
classification of these leads into one of the five stages was still possible. But when a lead consisted
only of non-classifiable results, it was excluded from our study. For the rest of the terms where
there was sufficient coherency, we did not want to miss the opportunity to classify them when

46
possible. Therefore, all 24,746 unique result codes constituted the sample frame used to run the
concept extraction.
Running Leximancer yielded 63 concepts as we saw from our initial textual exploration of the
data. We then used Latent Dirichlet Allocation (LDA). LDA’s bag of words method is best for the
short length of the result codes, as each code consists of few words. It has the capability to generate
enough relevant concepts whereby we can strengthen the definitions of our five stages. It also
sheds light on the unassignable concepts to see if they can be stowed in a new category or fit within
an existing category. We ran LDA modelling in R. We first preprocessed the text by removing
punctuation, stop words and whitespaces. Then we plotted a perplexity chart to determine the
optimum number of concepts by comparing models with different numbers of topics (see
Appendix F). Perplexity is a statistical measure of how well a probability model predicts a sample.
Perplexity was lowest at 203 topics, hence a LDA model using 203 topics was run. The 203
generated topics and the top five words of each topic per topic distribution are shown in Appendix
G. The keywords are binned into the five identified categories in Table 3.

47
Table 3
Result Codes: Identification of the Stages using LDA in R
No Contact Suspect Prospect Qualified Client
Answering
machine
Busy signal
Drop
Leave vm
Left message
Duplicate
Invalid
Unreachable
Skipped
Retry
Blind email
Future prospect
Potential
prospect
Dnc (do not
contact)
Number
disconnected
Research
Corp handles
Unqualified
Unsuitable
Disqualified
Resigned
Currently
satisfied
Refused
Research
Already engaged
No longer with
company
Hung up
Screened
Using “ “
Remove from list
Denied
Gatekeeper
Language barrier
Rejected
Blocked
Verify
Purchased
recently
Enrolled to
competitor
Deceased
Delete
Uninsurable
Info requested
Cold
Refer
Rescheduled
Missed
appointment
Wants “ “
Interested
Needs
confirmation
Yes
Expressed
interest
Warm
Request for
quote
Unhappy
Send
whitepaper
Pitched
Verified
Progress
Drip
Pending
Dead
Fit
Nurture
Explain
Decision
maker
Follow up
Positive
Office webinar
Presented
Interview
Demo
Transferred
Appointment
Confirmed
Cancellation
Approved
Consultation
Registered
Scheduled
presentation
Meeting
Lost
Set time
Hot lead
Opportunity
Declined
Completed
survey
Closer
Sale
Order
placed
Deal
Won
Sold
Bought
Just as we did using Leximancer, we were able to successfully bin most of the topics into five
bins using LDA.

48
Looking at both Leximancer and LDA, our identified stages of the sales pipeline do not follow
any pattern related to the volume of composition of concepts and topics respectively. Rather,
concepts and topics at various rankings in terms of frequency agglomerate to comprise the five
identified stages. There were some unassignable concepts. But these concepts were too esoteric in
nature or occurred too infrequently in order for them to have an effect on the overall results. It’s a
safe assumption that wherever the result codes related to those concepts occurred, there would be
other result codes for that lead’s interaction history which would serve as better classifiers of its
stage. The only exception to this was the concept of email. Despite being a major concept extracted
in all of our text mining phases, it was hard to determine the stage of an email sent even with more
context added by the LDA on top of the Leximancer analysis. Unless there was textual evidence
to suggest that prior contact was established via email, all email related results were assigned the
No contact stage. Even when in doubt, the No contact stage is a safer option due to it being the
lowest in rank. This means that if there were any other results belonging to a higher stage for a
lead’s call history, it would be rightly assigned to that stage when it came to the tallying of results.
Next, we embarked on a process of manually coding the result codes into one of the five stages.
Manually coding after topic modelling is a process commonly used by researchers (Chuang et al.,
2015; Jacobi, Van Atteveldt, & Welbers, 2016). We had a clear indication of how the five stages
differed from each other based on the literature and based on the topics we obtained from
Leximancer and LDA. The subsequent classification of each result code was considered too
important a task to be left to automation, especially considering that classifying 24,746 unique
terms by hand was manageable. The scrutiny each result code received was worth the human effort.
We were able to classify 12,478 unique result codes out of 24,746. This amounted to 78% of all

49
result codes when accounting for total frequency. When we looked at the Insurance and Marketing
& Advertising industries only, it amounted to 99.45% of all result codes.
Apart from the Result IDs, each Project ID also has different LeadStatus IDs, which correspond
to different lead statuses. Lead Status is a field that is defined as the name and description of the
state or position of the lead. Thus we found it useful to use the lead statuses as a confirmatory
classifier along with the result codes in order to classify the stage of the lead.
However, Lead Status was only a secondary classifier because every call history ID for a lead in
a project did not have a LeadStatusID. Furthermore, lead status was more about what the
salesperson was doing about the lead, rather than what was the actual result of the lead. While
ResultID revealed the actual state of the lead, the LeadStatus revealed the activity surrounding the
lead which can be descriptive, but offers little value to determining its actual state like Result ID
does. As with the result codes, the lead statuses were also subjected to a concept map using
Leximancer, and a factor analysis using WordStat and LDA topic modelling using R. Finally, just
as we had manually coded the unique result codes, we also manually coded the unique lead status
IDs. Like with the result codes, coding the sum of cases was not an insurmountable task, and was
worth the human effort for the careful deliberation that goes into each classification. The process
is repeated for the lead statuses in Appendices H, I, J, K, L and M respectively. Perplexity was
lowest at 39 topics. Thus a LDA model using 39 topics was run. The 39 generated topics and the
top five words of each topic per topic distribution are shown in Appendix L. The keywords are
binned into the five identified categories in Appendix K.

50
4.1.3. FINAL OUTCOME OF EACH SALES LEAD
Throughout each lead’s (Contact ID) interaction history (record of call history IDs) with the
sales team, each lead can be classified into one or more of the five stages we have identified thus
far. However, to measure the performance of the teams, the lead will be categorized in the last
chronological stage out of the five possible stages. This will let us know the final outcome of that
lead for that team i.e., if it was in the No contact, Suspect, Prospect, Qualified or Client stage. Only
then, can we begin to calculate the performance ratios of a team, after accounting for the final
outcomes of all the leads the team has worked on.
The Result Code is the primary lead classifier because it tells us were the lead rests at the
moment. The lead status is the secondary classifier as it tells us what is being done about the lead.
The lead status is not as succinctly accurate as the result code, so it is used only as a confirmatory
classifier. Hence, if a lead status is classified in a lower stage than a lead result (result code), then
there is no problem because the higher stage of the lead result assigns that leads its final outcome.
However, when a lead status is classified in a higher stage than a lead result (result code), then it
is a case that we analyze to see if that particular lead status is significant enough to overturn the
final outcome gathered from its result code only.
4.1.4. DESCRIPTIVE STATISTICS FROM PHASE 1
There were 4,237 teams in total. Their distribution according to the five different lead stages is
shown in Table 4.

51
Table 4
As we calculate progression ratios, we need to consider the number of teams who had leads at
a particular stage and all prior stages as well. When we do this calculation for Client and all other
stages before it, we see that there are only nine teams that have leads in all five stages including
Client. The Suspect, Prospect and Qualified stages had enough teams who had leads in those
stages, and all stages before it respectively. Hence, a decision was made to combine Client with
Qualified and label the group as Qualified. No Contact was the beginning stage of each lead.
Hence the ratios of our three stages are computed in the next section.
4.1.5. MEASURES: OUTCOME VARIABLES
Suspect Ratio for a team was calculated by dividing the number of leads in the Suspect stage by
the number of leads in the Suspect and No Contact stages for that team.
Prospect Ratio for a team was calculated by dividing the number of leads in the Prospect stage by
the number leads in the Prospect and No Contact stages for that team.
Qualification Ratio for a team was calculated by dividing the number of qualified leads by the
number of qualified and No Contact leads for that team.
The average suspect, prospect and qualification rate for all teams were 43.7 %, 26.6% and 17.9%
respectively.
No Contact Suspect Prospect Qualified Client
3957 3889 1850 2821 41
No Contact + Suspect No Contact + Suspect + Prospect
No Contact +
Suspect + Prospect
+ Qualified
No Contact + Suspect +
Prospect + Qualified +
Client
3741 1727 1207 9

52
4.2. PHASE 2: JENKS NATURAL BREAKS OPTIMIZATION
There were 3,736 teams in total for which we had suspect ratios. There were 2,263 teams in total
for which we had prospect ratios. There were 1,762 teams in total for which we had qualification
ratios. Next, we applied Jenks Natural Breaks Optimization to these ratios to find the natural break
points whereby we could classify the teams for each ratio into groups. Each ratio is discretized into
two, three, four, five and six classes respectively in Table 5.
Table 5
For all three ratios, we can see that there is a significant jump in the goodness of variance fit
(GVF) for three classes compared to two. Thus, it is worth our effort to segment our outcome
variables into the three groups of low performers, medium performers and high performers for
each ratio. We see that when we choose four classes, the increase in the GVF is not as much as it
is for three classes. Also, interpreting the results would be a tougher task with four classes and it
would negate the purpose of discretizing the data in the first place for achieving greater parsimony.
Just choosing two classes however sacrifices the huge jump in the GVF that we get with three
classes. Thus, three classes is optimum. Our outcome variables are low performers, medium
performers and high performers. The three classes for each ratio with their breaking points are
shown in Appendix N.
Classes
Goodness of
Variance Fit for
Suspect Ratio
Goodness of
Variance Fit for
Prospect Ratio
Goodness of
Variance Fit for
Qualification Ratio
2 0.644042 0.8343023 0.75351
3 0.82317 0.9257326 0.903998
4 0.90291 0.9604293 0.948249
5 0.937383 0.976087 0.969252
6 0.957293 0.9849779 0.979266

53
The ordinal outcome variables of low, medium and high performance categories are chosen
because of their ability to reflect performance better than the ratio outcome variables. We cannot
assume the performance is linearly distributed when it comes to ratio outcome variables, therefore
it is not possible to understand the differences in performance levels between each ratio. An
incremental increase at one end of the scale may not mean the same thing as an incremental
increase on the other end of the scale. Thus, the categorization of teams provides a better
representation of team performance with respect to each ratio. Trichotomizing continuous
variables is preferred to dichotomization as it reduces inefficiency of lost data due to the
transformation process (Gelman & Park, 2009).

54
CHAPTER 5: CONCEPTUAL MODEL DEVELOPMENT
This chapter covers our fourth research objective. Here we develop a framework for sales
performance in Inside Sales based on the team-based constructs identified in the previous sections.
While there are many studies on constructs depicting individuals’ impact on sales performance,
there are few studies that predict the aggregated effect of these constructs with regards to teams
(Stewart, 2006). Many constructs that distinguish sales teams are dependent on the individuals that
form the team. Even if team level constructs are aggregations from individual level constructs, the
predictor-outcome relationships vary between the individual and group levels (Ostroff, 1993). This
means that a team is more than the sum of its parts (i.e., individuals).
The constructs used to predict individual sales performance can be categorized as organizational
factors, salesperson factors and environmental or external factors (Churchill, Ford & Walker,
1990). The aggregated team level effects of each construct are hypothesized to increase the
performance in a team-based setting. Salesperson level constructs include effort and experience,
while team size, task input, team goal monitoring, specificity of role, repetition and intra-team
communication can be classified as organizational factors. We did not have any environmental or
external factors in the model, but the industry of the team was used as a control variable. These
constructs are detailed below in the same order they were defined in the Predictors section (see
Section 3.4). Each section is concluded with a hypothesis. All the hypotheses are consolidated in
our proposed model to assess the drivers for team-based sales performance.
5.1. TEAM SIZE
According to Stewart (2006), findings on Team Size’s effect on sales performance are mixed.
Arguing against bigger teams, Gooding and Wagner (1985) state that the size of a subunit in an
55
organization is negatively correlated or not correlated at all with performance. Process losses and
free rider effects are blamed for this negative correlation. Mullen, Symons, Hu and Salas (1989)
claim that larger group sizes lead to increased dissatisfaction among group members because of
greater formalized structures. Arguing for bigger teams, Magjuka and Baldwin (1991) posit that
while designing and administering employee involvement programs, team size has a positive
impact on sales performance. Larger teams are said to perform better due to greater access to
information. Yetton and Bottger (1982) find bigger teams to be better problem solvers and decision
makers à la “the best member strategy”. By having more members in a team, there is a higher
likelihood the a single member of that group comes up with the best decision that results in higher
performance.
Kozlowski and Bell (2001) cite the difficulty of measuring the effectiveness of Team Size on
performance given that the benefits or a larger team depend on the task and environment. They
agree however that evidence seems to suggest that larger teams may be better positioned for
success from a resources point of view, but they suffer from loss of coordination. Nieva, Fleishman
and Reick (1985) propose a curvilinear relationship between team members and performance,
where too few or too many members is less than optimal.
There is a theory that larger teams are more effective because of greater heterogeneity. Magjuka
and Baldwin’s (1991) findings support such a claim while (Campion et al. (1993) find contrary
evidence or no evidence to support such a claim. Perry et al. (1999) state that evidence points to
a drop of effective communication with bigger teams. All in all, there is a fair amount of evidence
on both sides regarding the appropriate team size for achieving greater sales performance. But the
evidence is slightly skewed in favor of smaller teams due to process losses, free rider effects and
the increasing difficulty of coordination as stated before.

56
Finally, Stewart (2006) found team size to be positively related to project and management
teams, but not to production teams. The former two differ from the latter in that their tasks are
complicated and require interactions with employees and units outside the team in order to attain
necessary resources (Sundstrom, DeMeuse & Futrell, 1990). One can see that production teams
are similar to Inside Sales teams which have greater autonomy resulting from their
interdependence and well defined tasks. Therefore, the size of such teams would be negatively
correlated with team performance. In light of that, we posit:
H1: Inside Sales teams of smaller size perform better at various stages of the sales pipeline.
5.2. TEAM EXPERIENCE
Delmar and Shane (2006) state that greater Team Experience leads to higher sales performance
in new ventures, albeit the effect is non-linear and varies with the age of the venture. A team is
composed of multiple salespersons, and salesperson experience is identified as one of the
contributors to greater sales performance via coordination (Cespedes, 1992). Other scholars
confirm that salesperson experience leads to greater sales performance via salesperson behavior
(Rapp, Ahearne, Mathieu & Schillewaert, 2006; Park & Holloway, 2003). Hence, we posit that:
H2: Inside Sales teams with more experience perform better at various stages of the sales
pipeline.
5.3. TEAM EFFORT
Individual effort explains the variance of sales performance in teams (Hunter & Perreault Jr.,
2007; Perry et al., 1999). Selling effort mediates the relationship between sales team connectedness
and performance (Nowlin, Walker & Anaza, 2017). Selling effort is also found to mediate the
relationship between group goal setting and performance (Guzzo & Dickinson, 1996). So it is
57
understood that effort is a contributor to greater performance. Moreover, there is a link between a
team’s learning effort and sales performance, where team members make a concerted effort to
learn new skills in the environment that they operate in (Jones, Dixon, Chonko & Cannon, 2005).
Hence, all these factors point to effort having a positive effect on sales performance either via
learning, goal setting or team connectedness. So we posit that:
H3: Inside Sales teams with greater effort perform better at various stages of the sales pipeline.
5.4. TASK INPUT
From a sales point of view, the input of data by sales personnel is essential to understanding the
selling or buying situation (Tanner, Ahearne, Leigh, Mason & Moncrief, 2005). Such input of data
is a task by itself, and it has an effect on sales performance via collaboration. Steiner (1976)
corroborates the necessity of task input, highlighting its importance in a team-based atmosphere
for the successful completion of goals. Hence, we are inclined to say that greater task input leads
to better sales performance.
The quality of such Task Input can be a moderator for group processes on outcomes (Gist, Locke
& Taylor, 1987). Proper fulfillment of tasks is a powerful mechanism to achieve sales performance
via cooperation (Ahearne et al., 2008; Yilmaz & Hunt, 2001). Task quality is also found to be a
moderator between process and effectiveness in sales teams. We posit that:
H4: Inside Sales teams with higher task input perform better at various stages of the sales
pipeline.
58
5.5. TEAM GOAL MONITORING
Bachrach et al. (2016) found that team goal monitoring leads to higher sales performance via
commitment to service quality. Team Goal Monitoring also moderates the effect of team efficacy
on sales team performance (T. Rapp et al., 2014). Hence, we are inclined to say that greater team
goal monitoring leads to better sales performance. We posit that:
H5: Inside Sales teams with higher team goal monitoring perform better at various stages of the
sales pipeline.
El Ansary, Zabriskie and Browning (1993) identify coordination as a dimension of teamwork,
which is said to be an important contributor to sales performance. Stewart (2006) finds intra-team
coordination to exhibit a positive relationship with performance. Particularly, intra-team
coordination leads to greater performance in knowledge-based work environments than in physical
work environments. Guzzo and Dickinson (1996) claim that a large part of the success of computer
technology comes down to the structuring of the task. Therefore, the success of Inside Sales teams
who use LMS is a function of how structured their work process is. Jones et al. (2005) write that
sales teams are better equipped than individuals to make better decisions because of the sum of
their intelligence and access to more sources of information, but that coordination plays a great
role in fulfilling this potential. We see that higher intra-team coordination leads to a greater sales
performance. The reflective variables Specificity of Role, Repetition and Intra-team
communication also lead to a greater sales performance by virtue of intra-team coordination.
5.6. SPECIFICITY OF ROLE
According to Yilmaz & Hunt (2001), task interdependence is a highly explanatory antecedent
of salespeople’s cooperative or coordinative behavior by way of task characteristics. The

59
Specificity of Role of team members or specialization thus necessitates the existence of
coordination. Such a linkage between the two is corroborated by Dickinson and McIntyre (1997).
Hence specialization is an important part of intra-team coordination in that each team member is
specialized enough where they stand to profit from coordination. This leads to better sales
performance via intra-team coordination. We posit that:
H6: Inside Sales teams with greater specificity of role perform better at various stages of the
sales pipeline.
5.7. REPETITION
Salespeople can become very adept at using sales technology to execute tasks by means of
repetition. The effective and habitual use of technology in sales have facilitated collaboration
amongst salespeople (Rodriguez & Honeycutt Jr., 2011). This helps them to collaborate with
colleagues and managers irrespective of where they are situated. Coordination is a huge subpart of
collaboration, whereby the efforts of salespeople are coordinated among themselves, with other
departments in the firm, and with stakeholders outside the firm (Tanner et al., 2005). Such a
repetitive system of coordination enables the co-creation of new knowledge that is instrumental in
achieving the company’s objectives (Plouffe, Williams & Leigh, 2004). Hence, repetition is an
important gauge of intra-team coordination, leading to a better sales performance. We posit that:
H7: Inside Sales teams with greater repetition perform better at various stages of the sales
pipeline.
5.8. INTRA-TEAM COMMUNICATION
Kiesler and Sproull (1992) found that computer usage leads to more open and direct
communication, which results in more equal participation from all group members, leading to
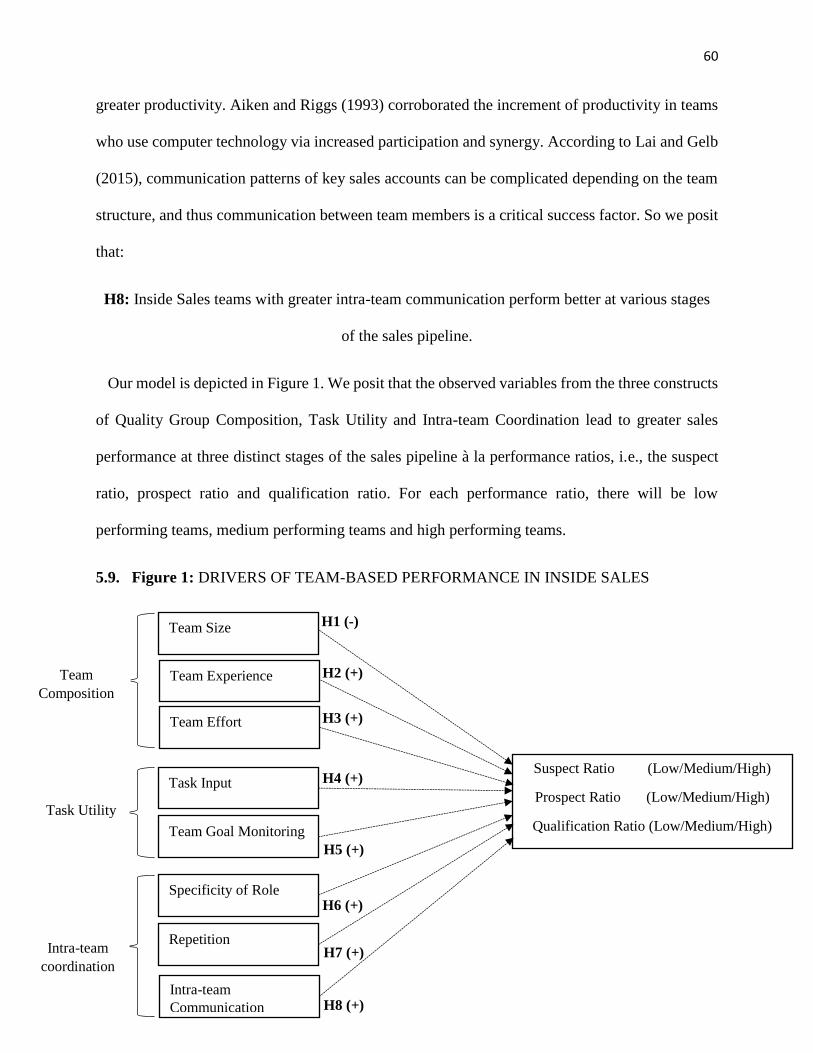
60
greater productivity. Aiken and Riggs (1993) corroborated the increment of productivity in teams
who use computer technology via increased participation and synergy. According to Lai and Gelb
(2015), communication patterns of key sales accounts can be complicated depending on the team
structure, and thus communication between team members is a critical success factor. So we posit
that:
H8: Inside Sales teams with greater intra-team communication perform better at various stages
of the sales pipeline.
Our model is depicted in Figure 1. We posit that the observed variables from the three constructs
of Quality Group Composition, Task Utility and Intra-team Coordination lead to greater sales
performance at three distinct stages of the sales pipeline à la performance ratios, i.e., the suspect
ratio, prospect ratio and qualification ratio. For each performance ratio, there will be low
performing teams, medium performing teams and high performing teams.
5.9. Figure 1: DRIVERS OF TEAM-BASED PERFORMANCE IN INSIDE SALES
H2 (+)
H8 (+)
H7 (+)
H6 (+)
H5 (+)
H4 (+)
H3 (+)
H1 (-)
Suspect Ratio (Low/Medium/High)
Prospect Ratio (Low/Medium/High)
Qualification Ratio (Low/Medium/High)
Team Size
Team Experience
Team Effort
Task Input
Team Goal Monitoring
Specificity of Role
Repetition
Intra-team
Communication
Team
Composition
Task Utility
Intra-team
coordination

61
CHAPTER 6: DATA ANALYSIS- MODEL RESULTS
The leads were classified by their highest reached stages. When we looked at the distribution of
the leads by their progression, we saw that 93 % of all leads who progressed from No Contact were
solitary leads. We define solitary leads as leads who only had one stage, namely: Suspect, Prospect,
Qualified or Client, or had No Contact plus one of those stages. Since No Contact is the starting
stage for a lead, No Contact plus one of those Stages still constituted as just one stage. See
Appendix O for a breakdown of the leads by progression. The fact that there was an overwhelming
majority of solitary or one stage leads means that there was not much movement between the
stages, but rather the teams were more likely to take a lead to its highest stage in their first call
where they were actually able to contact the lead. This makes sense because it gets more and more
difficult to move a lead down the sales pipeline.
What this means for our predictor variables is that we would calculate them separately for our
Suspect, Prospect and Qualification Ratios. The team variables can be dynamic in nature, and are
calculated on the basis of the average of interactions with every lead. Since 93% of leads who
progressed are solitary leads, it would make sense to divvy them up while calculating our team
variables. For instance, the team variables used to calculate suspect ratio would only be calculated
using the average interaction with suspect leads.
6.1. MULTINOMIAL LOGISTIC REGRESSION
6.1.1. CHECKING FOR MULTICOLLINEARITY
The VIF values were checked for the Suspect, Prospect and Qualification ratios respectively.
None of them crossed the threshold of 10 as predetermined earlier (see Appendix P). Also, none
of the full factorial models for Suspect, Prospect and Outcome Ratios improved the model fit.

62
Thus, each variable was uniquely important to the overall fit of the model. The AIC did improve
without some of the variables, but not by much (see Appendix Q). Furthermore, with only nine
variables, all of which are relevant to our models capturing team characteristics or interaction with
sales leads, sacrificing fit for parsimony did not make sense.
6.1.2. CHECKING FOR OUTLIERS
In our model, the outcome variables are distributed on a ratio scale of 0 to 1, and they are
demarcated into three distinct groups based on the strength of their intragroup similarities and
intergroup differences. Hence, there is no concept of outliers as the multinomial logistic regression
model assumes that the error terms may have an independent and identical value distribution. But
there is the scope of having high leverage points of the predictor variables which could have undue
influence on our model. Thus, we looked at the Cook’s distance to eliminate the high leverage
points which had a high influence on our model. We used the recommended cut-off point of four
divided by the sample size in each of the three models of performance ratios (Das & Gogoi, 2015).
After that, we ran all three models.
6.1.3. RUNNING THE MODELS
6.1.3.1 SUSPECT RATIO
The Suspect Ratio Model was found to be significant at the 0.05 confidence level. With the
exception of team experience and industry, all other variables were significant. The model
achieved a 58.6% classification accuracy rate as seen in Table 6. It achieved a McFadden pseudo
R square of 0.088. Refer to Appendix R for the case processing summary, model fitting
information, likelihood ratio tests evaluating each variable as a whole, and the parameter estimates
for the medium and high performing teams in reference to the baseline low performing teams. All

63
significant variables are highlighted in yellow. The Suspect Ratio model was not as good as the
Qualification ratio model and the Qualification Ratio model in terms of its predictive ability.
Table 6: Classification of Suspect Ratio Model
Observed
Predicted
1 2 3 Percent Correct
1 773 556 8 57.8%
2 436 1388 33 74.7%
3 97 415 30 5.5%
Overall Percentage 35.0% 63.1% 1.9% 58.6%
6.1.3.2. PROSPECT RATIO
The Prospect Ratio Model was also found to be significant at the 0.05 confidence level. With
the exception of industry, all other variables were significant. The model achieved a 87.2%
classification rate as seen in Table 7. It achieved a McFadden pseudo R square of 0.499. Refer to
Appendix S for the case processing summary, model fitting information, likelihood ratio tests
evaluating each variable as a whole, and the parameter estimates for the medium and high
performing teams in reference to the baseline low performing teams. All significant variables are
highlighted in yellow. It was the best performing model out of the three.

64
Table 7: Classification of Prospect Ratio Model
Observed
Predicted
1 2 3 Percent Correct
1 1615 42 1 97.4%
2 107 263 33 65.3%
3 45 62 95 47.0%
Overall Percentage 78.1% 16.2% 5.7% 87.2%
6.1.3.3. QUALIFICATION RATIO
The Qualification Ratio Model was also found to be significant. With the exception of
specificity of role and industry, all other variables were significant. The model achieved a 83.3%
classification rate as seen in Table 8. It achieved a McFadden pseudo R square of 0.362. Refer to
Appendix T for the case processing summary, model fitting information, likelihood ratio tests
evaluating each variable as a whole, and the parameter estimates for the medium and high
performing teams in reference to the baseline low performing teams. All significant variables are
highlighted in yellow. It was the second best performing model out of the three.
Table 8: Classification of Qualification Ratio Model
Observed
Predicted
1 2 3 Percent Correct
1 1284 58 3 95.5%
2 157 145 8 46.8%
3 41 27 39 36.4%
Overall Percentage 84.1% 13.1% 2.8% 83.3%
65
6.1.4. TESTING OF HYPOTHESES
Each hypothesis from the conceptual model development section is evaluated below for all three
of our models.
With reference to low performing teams (the baseline group for this study):
Team Size was found to be significant at the 0.05 confidence level for both medium and high
performing teams for all three models, namely: Suspect Ratio, Prospect Ratio and Qualification
Ratio. Smaller team sizes lead to higher performance ratios in all cases except for medium
performing teams for Suspect Ratio.
Team Experience was found to be significant at the 0.05 confidence level for only high
performing teams for Suspect and Prospect Ratio, and for both high performing and medium
performing teams for Qualification Ratio. More team experience leads to higher performance
ratios for Prospect and Qualification ratios, but not high performing teams for Suspect Ratios.
Team Effort was found to be significant at the 0.05 confidence level for both medium and high
performing teams for Suspect and Qualification Ratio, and for only medium performing teams for
Prospect Ratio. More Team Effort leads to higher performance ratios in all cases.
Task Input was found to be significant at the 0.05 confidence level for both medium and high
performing teams for Suspect and Qualification Ratio, and for only high performing groups for
Prospect Ratio. More Task Input leads to higher performance ratios in all cases except for high
performing teams for Suspect Ratio and Prospect Ratio.
Team Goal Monitoring was found to be significant at the 0.05 confidence level for both medium
and high performing teams for Prospect Ratio, and for only high performing teams for Suspect
66
Ratio and Qualification Ratio. More Team Goal Monitoring leads to higher performance ratios in
all cases except high performing teams for Suspect Ratio.
Specificity of Role was found to be significant at the 0.05 confidence level for only medium
performing teams for all three models. More Specificity of Role leads to higher performance ratios
in all cases except medium performing teams in Suspect, Prospect and Qualification ratios.
Repetition was found to be significant at the 0.05 confidence level for both medium and high
performing teams for Suspect and Qualification Ratio, and for only medium performing groups
for Prospect Ratio. More repetition leads to higher performance ratios in all cases except medium
and high performing teams for Qualification Ratio.
Intra-team Communication was found to be significant at the 0.05 confidence level for both
medium and high performing teams for Prospect and Qualification Ratio, and for only high
performing groups for Suspect Ratio. More Intra-team Communication leads to higher
performance ratios in all cases.
All the above information is captured in Table 9 Green arrows and red arrows indicate positive
and negative significance respectively. Empty spaces without arrow indicate non-significance.

67
Table 9
6.2. ROC CURVES
Suspect Ratio
The Suspect Ratio model, despite being significant, did not do as well in predicting team
performance as the Prospect and Qualification Ratio. All variables more or less closely follow the
diagonal reference line. Refer to Appendix U for the area under the curve for each variables. One
can notice more of a curve for the variables for high performers, but this pattern is common among
all models as high performers are a more distinctive group compared to medium and low
performers. Please see figures 2 and 3.

68
Figure 2: Suspect Ratio Medium Performers
Figure 3: Suspect Ratio High Performers

69
Prospect Ratio
The Prospect Ratio model achieves the highest prediction accuracy among the three models. For
medium and high performers, one can see the high lift of Intra-team Communication and Team
Goal Monitoring. Please see figures 4 and 5.
Figure 4: Prospect Ratio Medium Performers
Figure 5: Prospect Ratio High Performers

70
Qualification Ratio
The qualification ratio model achieves a high prediction accuracy, but not as high as the prospect
ratio model. For both medium and high performers, one can see the high lift of intra-team
communication and task input. Particularly for high performers, one can also see that Team
Experience separates itself from the rest of the pack in terms of its predictive capability. More
interestingly for high performers, Repetition and Team Size both have curves with high lifts, but
in the other direction. This means the absence of each has a tremendous effect on the true positive
rate for high performers. Please see figures 6 and 7.
Figure 6: Qualification Ratio Medium Performers

71
Figure 7: Qualification Ratio High Performers
6.3. VALIDITY
Bootstrapping was performed using 1000 samples at the 95% confidence interval. Refer to
Appendix V for the parameter estimates of the variables after bootstrapping. The significance of
the variables for the Prospect Ratio Model remains unchanged. For the Suspect Ratio Model, team
size was found to be insignificant for medium performers. But Specificity of Role was found to be
significant for high performers, which wasn’t the case pre bootstrapping. For the Qualification
Ratio model, Task Input and Repetition was found to be insignificant for high performers, but
Specificity of Role was found to be significant, which was not the case pre bootstrapping. Thus it
can be inferred, that our calculations for the Prospect Model was most robust. Elsewhere, there is
no cause for concern because in all three stages, there were no cases were the results for both
medium and high performing groups were overturned.

72
CHAPTER 7: CONCLUSION
7.1. KEY FINDINGS
Smaller Sized Teams Do Better in Inside Sales
All directional hypotheses were definitive from the literature with the exception of Team Size.
There was enough evidence from the literature to make a case for both bigger and smaller team
sizes increasing team performance, with slightly more papers vouching for smaller team sizes.
Hence, we hypothesized smaller teams to have better performance. From our study, we saw that
to be a medium performing team, bigger teams were better at suspecting, but smaller teams were
better at prospecting and qualifying. This makes sense, as one would want more members for lower
skilled jobs such as suspecting, compared to prospecting and qualifying which require more skill
that cannot be substituted by assigning more team members. However, to be a high performing
team, smaller team sizes was the way to go throughout all stages of the sales pipeline (i.e.,
suspecting, prospecting and qualifying). This means that while more team members may initially
be good for suspecting, the number of members in the team will decrease over time to retain the
best performers, and those suited for the role of suspecting will get better results in smaller sized
teams.
Higher stages of the Sales pipeline require more skills, as reflected by the significance of
direction found for Team Composition and Task Utility variables in each model
Except for team size, all our other predictor variables were hypothesized to have a positive effect
on team performance. But apart from Team Effort and Intra-Team Communication, the six other
predictor variables had at least one instance of significant negative effect on either the suspect,

73
prospect or qualification models. Such a pattern manifested itself through the differences between
the lower and higher stages of the sales pipeline.
To be a medium performing team, team experience was not even significant for suspecting and
prospecting, but it was for qualification. Thus, this shows that for jobs requiring more skills, teams
would need more experience, whereas for lower level jobs, it would not make a difference. Such
a difference shows itself more clearly when looking at high performing teams, where experience
was found to be significant for all three stages, but teams with lower experience fared better in
suspecting and teams with higher experience fared better in prospecting and qualifying.
Regarding task utility, less task input is better for performance at suspecting and prospecting,
but more task input is better for performance at qualifying. Again, this alludes to the increment in
skill levels as one moves along the sales pipeline. For suspecting and prospecting, inputting words
into the system may be taking away from effort, which is all that it takes to succeed in those levels.
Whereas for qualification, mere effort is not enough, and one has to diligently perform other duties
such as inputting content words into the leads management systems. The same can be said of
Team Goal Monitoring, where in order to be a medium or high performing team, you need less of
it for suspecting, but more of it for prospecting and qualifying. So monitoring the progress of goals
also takes away from effort in suspecting, but it is important enough a duty at the prospect and
qualification stages, where you would need some level of knowledge about the state of the lead.
This is because you are not just merely looking to establish contact, but actually the beginning of
a relationship. Any prior research on the lead about its internal or external situation may help you
in achieving your goal.

74
Specificity of Role is a detractor in Intra-Team Communication
Regarding intra-team coordination, Specificity of Role was found to be insignificant for high
performing teams. It was found to be significant for the medium performing teams, but lesser
specificity of role meant better performance, which was contrary to higher intra-team coordination
leading to better performances. Thus, it can be surmised that when intra-team communication is
talked about leading to better performances, it is Repetition and Intra-Team Communication that
is primarily being referred to. Indeed, intra-team coordination unanimously leads to higher
performances across the board. Thus irrespective of the stage in the sales pipeline, more intra-team
communication is always a good thing. As for Repetition, while more Repetition leads to better
performances for suspecting and prospecting, less repetition leads to better performance in
qualifying. Thus once again, this constitutes the difference in skills required for the lower level
jobs and higher level jobs in the sales pipeline. Whereas for suspecting and prospecting, repeatedly
doing something in unison with others may be good for building up expertise, in qualification, it
is more about a customized approach which can obtain results.
While the sales pipeline exists, the goal is to convert a lead to a customer in one shot
Lead classification was not the principle goal of our study; identifying the drivers of team-based
sales performance was. However, by virtue of classifying each lead by its highest stage, we were
able to look at all other stages that lead was in. It turned out that 93% of all leads who progressed
from No Contact were stuck in one stage. Thus, while it helps to think of the sales pipeline as a
mechanism of progression, in reality it is an artificial construct created by sales professionals to
indicate the stage of the lead. The stages are extremely sticky, which is understandable or it would
be easy to convert every lead into a customer with just three stages separating a client from a new
lead. But it is not, and so it is more likely that a lead is stuck in one stage after a very successful

75
contact. So it becomes imperative for the salespeople to do their best in their first successful contact
attempt. It also makes sense to develop specialized teams who are only suited to either suspect,
prospect or quality. All three are important and would be better off with specialized teams
attending to them. Our findings also reflect that different variables are needed for each model.
Suspecting does not need experience and team goal monitoring like prospecting and qualifying do.
Both suspecting and prospecting do not need task input like qualifying does, but they need
repetition, which qualifying does not.
7.2. CONTRIBUTIONS
The overarching contribution of this study is team-based selling optimization in Inside Sales.
Inside Sales practitioners are better off knowing that smaller teams are more effective for selling
(a much contested issue in the past, with researchers split on the verdict), and that it is better not
to bother suspecters (i.e., salespeople dealing with suspects) with other tasks such as task input,
and team goal monitoring which may hinder their process of becoming specialized at calling leads.
These tasks should be left up to prospectors or qualifiers, who need more experience (of doing
activities other than just calling) and less repetition (just expanding effort on calling) to succeed.
Inside Sales researchers are better off knowing what the team-based factors that affect sales
performance are. We provide a comprehensive model which captures not only previously studied
team-based factors, but also four new factors which have never been studied at a team level before,
namely Effort, Task input, Specificity of Role and Repetition. We show their effect on the different
stages of the sales pipeline as it is relevant to the inside sales process, something that has never
been done before. Hence, we analyze the team-based factors' predictive abilities on three different
types of sales performance, namely suspecting, prospecting and qualifying.

76
7.2.1. CONTRIBUTIONS TO PRACTICE
This study contributes to the field of sales management by understanding what makes sales
teams successful based on the teams’ nature and their interaction with sales leads. It does this via
measuring the impact of team variables on specific stages of the sales pipeline, and hence ventures
into territory unscathed by research. Thus, it has great practical implications. Due to the increased
operational costs of maintaining an external salesforce, Inside Sales has gained prominence where
data analytics is used to best support such inside sales teams (Gessner & Scott Jr., 2009). Ours
would be an example of such a study, whereby we built a predictive model stating what things can
be improved in a team-based setting for a greater chance at succeeding. Even though the model is
hypothesis based, it is through the comprehension of the important success factors by which
managers can strategize their sales process. There is a need for research in sales optimization
beyond just conceptual studies and anecdotal case studies (Avlonitis & Panagopoulos, 2009).
Empirical studies on the engineering of the sales process such as ours provide salespeople with the
insights to better suspect, prospect and qualify leads.
It is true that it is harder to predict successful suspecting, compared to prospecting and
qualifying. Nevertheless, one can use the insight that it is more about effort (e.g., volume of calls),
and less about checking progress or completing specific tasks such as inputting a comment into
the LMS. The classification tables and ROC curves of prospect and qualification ratios show that
a much higher prediction accuracy can be achieved for those two acts. It is interesting that while
inputting comments continues to have a negative impact on prospecting, checking progress has a
positive effect on it. In fact, team goal monitoring via checking progress, and intra-team
communication are the strongest predictors of successful prospecting. Regarding qualification,
Task input, Intra-team coordination and Team Experience are its strongest predictors. Repetition
77
also has a negative effect on it, which is not the case with suspecting and prospecting. Based on
this knowledge, companies can allocate different teams for different tasks. More experienced
members who have a more customized approach to each lead would do the qualifying, whereas
less experienced members who have more a direct approach of dealing the same way with every
lead would do the suspecting and prospecting.
7.2.2. CONTRIBUTIONS TO RESEARCH
Our study looks into the much neglected field of team sales, using team-based predictors to
measure team-based performance. Whereas many studies have focused on individual salesperson
factors to measure sales performance, it remains to be seen if those same individual factors can be
aggregated at a team level to measure sales performance (Verbeke, Dietz & Verwaal, 2011). This
is what we did with the variables Team Effort, Task Input, Specificity of Role, and Repetition
while also identifying and analyzing priori team-based variables such as Team Size, Team
Experience, Team-goal monitoring, and Intra-team communication.
Apart from the classification posed by Churchill, et al. (1990), there is an alternate category of
constructs that measure sales performance, which is equally applicable to our case, namely sales
technology usage. The advent of sales technology has placed increased demands on companies to
employ teams that will be able to maximize the efficiency of SFA use (Devine, Clayton, Philips,
Dunford, & Melner, 1999; Rangarajan, Jones & Chin, 2004).The computerization of the workplace
has meant the “expansion of research on groups that use computers in their work” (Guzzo &
Dickinson, 1996, p.320). Indeed, constructs that we are attempting to measure bar group size are
the result of some type of interaction with the LMS used by the company. This study indirectly
confirms the positive effect of SFA acceptance and usage on sales performance which has been
advocated in many papers (Ahearne et al., 2004; Hunter & Perreault Jr, 2006). Due to the fact that

78
the measurement of every construct except team size was dependent upon the salespeople’s usage
of SFA, proven hypotheses not only indicate the existence of the proposed relationships but also
the validity of SFA usage overall.
Hunter and Perreault Jr. (2007) take the sales technology angle of measuring sales performance
by measuring how it is swayed by different usage levels of sales technology. Sales technology
usage levels are measured using the paradigms of infrequent and frequent, and sporadic and
routine. Similarly, all of our predictor variables with the exception of group size are derived from
how or how often one uses the LMS. While there has been a lot of research comparing technology-
using groups to non-technology or face to face groups, there has not been much comparison within
technology using sales teams as to what factors enable better outcomes (Guzzo & Dickinson,
1996). This study enabled us to do just that as we study thousands of teams to uncover possible
performance drivers à la our predictor variables.
To conclude, our study is new for two reasons. First, the study is conducted using secondary
data exclusively. Thanks to our industrial partner, we have access to records of companies from
multiple industries interacting with sales leads. The survey method, which was the main method
of data collection in most of the prior studies, has many risks, including self-selection bias,
Hawthorne effect, acquiescence bias and extremity bias (Zikmund, Babin, Carr & Griffin, 2013).
But with secondary data, there is no worry about the motivation or incentives of the person
participating in the survey, or any chance of response error caused by the interviewer if it is an
onsite survey. There is also no chance of retrospective bias because there is no dependence on the
person’s memory and objectivity to truthfully answer questions, but rather the data is captured by
the LMS in the very act of performing the duty on the part of salespeople. Second, to the best of
our knowledge, our study is the only one that measures sales performance at multiple levels of the

79
sales pipeline. There have been numerous measures for sales performance used in the past, from
which we chose the acquisition of a new customer. While such a measure has been used as an
outcome variable in the past (Virtanen, Parvinen & Rollins, 2015; Gessner & Scott Jr., 2009), there
have been no attempts to measure sales performance at demarcated stages of the sales pipeline
before the acquisition happens. By segmenting stages of a sales pipeline, we monitored the
performance of sales teams on each lead at distinct points of its journey, from the time of its entry
into the sales pipeline to the time it becomes a client or falls out of the pipeline.
7.3. LIMITATIONS & WAY FORWARD
From a broad perspective, there are some team constructs which we cannot measure from our
data, but are highly relevant in explaining why a team may or may not succeed. The personalities
of each team member, particularly their preference for teamwork, would be great information to
have in order to understand what leads to performance beyond the reflective variables of
coordination, task utility and favorable group composition. Such constructs are extremely difficult
to measure using a data source that is not explicitly created for the purpose of measuring the said
constructs. Hence, a survey research method would be best suited to accomplish this in the realm
of quantitative studies.
Shea and Guzzo (1987) define task interdependence as the degree of task-driven interaction
between group members. Task interdependence necessitates coordination. There is a lot of
literature on task interdependence, so it would be appropriate if we could measure the level of task
interdependency for each team for such a project that focuses on the reflective variables of intra-
team coordination. But we are unable to do so with the data at our disposal because each company
can have its own organizational setup to dictate the level of interdependency each task mandates.
Antecedents of task interdependence include the use of technology, work rules and proximity of

80
members. While we do not have data on the work rules and proximity of members of organizations,
we know that they use a common technology, which in this case is the LMS.
Task-driven interaction is an important mediator between group constructs and sales outcome
(Gully, Devine & Whitney, 1995). This makes sense given it manifests itself in intra-team
coordination, which is defined by the many-task driven interactions that occur between team
members. We previously established how intra-team coordination leads to sales performance. We
also established how the reflective indicators of quality of group composition lead to sales
performance via coordination (Cespedes, 1992; Perry et al., 1999). Hence measuring task
interdependence of teams would strengthen the overall validity of our model because of its
pervasiveness in the literature and its possible mediation effects by way of intra-team coordination.
For future studies in this field, again a survey measure would be better suited to capture this
variable.
In terms of specificity of the results, there is a lot left to be desired because correlation does not
equate to causation. There could be a number of third variables which could explain the covariance
of the construct and the outcome. To mitigate this, we use the three control variables lead source,
year and industry. It is possible that salespeople become more used to the LMS over the years to
build up their competency. It could also reveal that over time salespeople learn to not input data in
some of the fields, as they don’t perceive them to be useful to the final outcome. Also, our
industrial partner has a client base comprising of multiple industries. These industries can easily
have different patterns of data input into the system or different team characteristics, and so the
industry was used as a control variable. While it was found to be non-significant, we were only
dealing with two industries, namely: Insurance and Marketing & Advertising. So we are only

81
limited to these two industries for external validity. For future studies, it would be better if more
industries from the B2B sector could be included in the study.
In order to truly prove causation, future studies can try experimental research where team based
inside sales performance is checked pre and post administration of a particular construct. This
would meet the sequential condition necessary to prove causation. However, such an experiment
would be more costly and less time efficient. But it would definitely lend more credibility to the
claims of some variables being better predictors of sales performance than others.
It is always a daunting task to come up with measures that fully encapsulate respective
constructs. Especially for the reflective variables of task utility and intra-team coordination, we
are heavily dependent on recorded inputs in the LMS. But our study passes the test of criterion
validity, because there have been plenty of studies which use data input into a computer system to
measure constructs relating to task utility. They include studies such as Straub, Limayem and
Karahanna-Evaristo (1995) who had measures very similar to this study such as computer recorded
system usage to measure variables relating to task utility. Rap et al. (2014), Weinstein & Mullins
(2012) and Ahearne et al., (2008) similarly incorporate archival sales data from SFA systems in
their studies. For measuring intra-team coordination, we find experts who say that collaboration,
which is a grander notion of coordination, can only be measured by adoption of collaboration tools
(Hwang, 2013), which in our case is the LMS. LMS providers claim collaboration/coordination as
a benefit of using their software, especially amongst marketing and sales teams. Hence, it can be
argued that coordination can be in fact measured through system usage, by the act of Specificity
of Role, Repetition and Intra-team communication.
Regarding group composition, size and experience are straightforward measures that do not
need any proxies. As for effort, its measurement is already justified in the measures section. But

82
nevertheless, the intra-team coordination variables Specificity of Role, Repetition and Intra-Team
Communication are limited in the sense that they are dependent on just three roles and content
words from two fields. If industry and academia are more serious about uncovering such attributes
from secondary data, they must design LMS to capture such data. Only if such systems are
designed with the purpose of capturing such data, can we have an accurate measurement of our
intended constructs. Until then, we will depend on proxies.

83
REFERENCES
Adamson, B., Dixon, M., & Toman, N. (2014). Why Individuals No Longer Rule on Sales Teams.
Retrieved March 17, 2018, from https://hbr.org/2014/01/why-the-individual-no-longer-rules-in-
sales
Ahearne, M., Jones, E., Rapp, A., & Mathieu, J. (2008). High Touch Through High Tech: The Impact
of Salesperson Technology Usage on Sales Performance via Mediating Mechanisms.
Management Science, 54(4), 671–685. https://doi.org/10.1287/mnsc.1070.0783
Ahearne, M., Srinivasan, N., & Weinstein, L. (2004). Effect of technology on sales performance:
Progressing from technology acceptance to technology usage and consequence. Journal of
Personal Selling & Sales Management, 24(4), 297–310.
Aiken Milam, & Riggs Mary. (1993). Using a Group Decision Support System For Creativity. The
Journal of Creative Behavior, 27(1), 28–35. https://doi.org/10.1002/j.2162-6057.1993.tb01384.x
Albers, S., Raman, K., & Lee, N. (2015). Trends in optimization models of sales force management.
Journal of Personal Selling & Sales Management, 35(4), 275–291.
https://doi.org/10.1080/08853134.2015.1085807
Ang, L., & Buttle, F. (2006). Managing For Successful Customer Acquisition: An Exploration.
Journal of Marketing Management, 22(3-4), 295–317.
https://doi.org/10.1362/026725706776861217
Arksey, H., & O’Malley, L. (2005). Scoping studies: towards a methodological framework.
International Journal of Social Research Methodology, 8(1), 19–32.
https://doi.org/10.1080/1364557032000119616

84
Avlonitis, G. J., & Panagopoulos, N. G. (2005). Antecedents and consequences of CRM technology
acceptance in the sales force. Industrial Marketing Management, 34(4), 355–368.
https://doi.org/10.1016/j.indmarman.2004.09.021
Avlonitis, G. J., & Panagopoulos, N. G. (2010). Selling and sales management: An introduction to the
special section and recommendations on advancing the sales research agenda. Industrial
Marketing Management, 39(7), 1045–1048. https://doi.org/10.1016/j.indmarman.2009.12.006
Bachrach, D. G., Mullins, R. R., & Rapp, A. A. (2016). Intangible sales team resources: Investing in
team social capital and transactive memory for market-driven behaviors, norms and
performance. Industrial Marketing Management, 62, 88–99.
https://doi.org/10.1016/j.indmarman.2016.08.001
Baker, D. P., & Salas, E. (1997). Principles and measuring teamwork: A
summary and look toward the future. In M. T. Brannick, E. Salas, & C. Prince (Eds.), Team
performance assessment and measurement: Theory, methods, and applications (pp. 331–355).
Mahwah, NJ: Erlbaum.
Barry, B., & Stewart, G. L. (1997). Composition, process, and performance in self-managed groups:
The role of personality. Journal of Applied Psychology, 82(1), 62.
Batt, R. (1999). Work organization, technology, and performance in customer service and sales. ILR
Review, 52(4), 539–564.
Bayaga, A. (2010). Multinomial Logistic Regression: Usage and Application in Risk Analysis.
Journal of Applied Quantitative Methods, 5(2), 288–297.
Beal, D. J., Cohen, R. R., Burke, M. J., & McLendon, C. L. (2003). Cohesion and performance in
groups: a meta-analytic clarification of construct relations. The Journal of Applied Psychology,
88(6), 989–1004. https://doi.org/10.1037/0021-9010.88.6.989
85
Bell, S. T. (2007). Deep-level composition variables as predictors of team performance: A meta-
analysis. Journal of Applied Psychology, 92(3), 595–615. https://doi.org/10.1037/0021-
9010.92.3.595
Brown, S. P., & Peterson, R. A. (1994). The effect of effort on sales performance and job satisfaction.
Journal of Marketing, 58(2), 70.
Campion, m. A., medsker, g. J., & higgs, a. C. (1993). Relations between work group characteristics
and effectiveness: implications for designing effective work groups. Personnel Psychology,
46(4), 823–847. https://doi.org/10.1111/j.1744-6570.1993.tb01571.x
Cannon, J. P., & Perreault, W. D. (1999). Buyer-Seller Relationships in Business Markets. Journal of
Marketing Research, 36(4), 439–460. https://doi.org/10.2307/3151999
Carboni, I., & Ehrlich, K. (2013). The Effect of Relational and Team Characteristics on Individual
Performance: A Social Network Perspective. Human Resource Management, 52(4), 511–535.
https://doi.org/10.1002/hrm.21539
Carroll, B. (2006). What’s a Lead?: [1]. Target Marketing; Philadelphia, 29(11), 28-30,32-34.
Cespedes, F. V. (1992). Sales coordination: an exploratory study. Journal of Personal Selling &
Sales Management, 12(3), 13–29.
Chuang, J., Roberts, M. E., Stewart, B. M., Weiss, R., Tingley, D., Grimmer, J., & Heer, J. (2015).
TopicCheck: Interactive Alignment for Assessing Topic Model Stability. Proceedings of the
2015 Conference of the North American Chapter of the Association for Computational
Linguistics: Human Language Technologies.
Churchill, G. A., Ford, N. M., & Walker, O. C. (1990). Sales force management: planning,
implementation, and control. Homewood: Irwin.
86
Cohen, S. G., & Bailey, D. E. (1997). What Makes Teams Work: Group Effectiveness Research from
the Shop Floor to the Executive Suite. Journal of Management, 23(3), 239–290.
https://doi.org/10.1177/014920639702300303
Cummings, B. (2007). Group Dynamics. Sales and Marketing Management; New York, 159(1), 8.
Curran, J. (2017). CRM System Providers in the US (IBISWorld Industry Report No. OD4592).
Melbourne, Australia: IBISWorld Services. Retrieved from
http://clients1.ibisworld.com/reports/us/industry/default.aspx?entid=4592
Das, M., & Gogoi, B. (2015). Influential Observations and Cutoffs of Different Influence Measures in
Multiple Linear Regression. International Journal of Computational and Theoretical Statistics,
2, 79–85.
D’Haen, J., & Van den Poel, D. (2013). Model-supported business-to-business prospect prediction
based on an iterative customer acquisition framework. Industrial Marketing Management, 42(4),
544–551. https://doi.org/10.1016/j.indmarman.2013.03.006
Dickinson, T. L., & McIntyre, R. M. (1997). A conceptual framework for teamwork measurement. In
M. T. Brannick, E. Salas, & C. Prince (Eds.), Series in applied psychology. Team performance
assessment and measurement: Theory, methods, and applications (pp. 19-43). Mahwah, NJ, US:
Lawrence Erlbaum Associates Publishers.
Delmar, F., & Shane, S. (2006). Does experience matter? The effect of founding team experience on
the survival and sales of newly founded ventures. Strategic Organization, 4(3), 215–247.
https://doi.org/10.1177/1476127006066596
Devine, D., Clayton, L., Philips, J., Dunford, B., & Melner, S. (1999). Teams in Organizations. Small
Group Research, 30(6), 678–711. https://doi.org/10.1177/104649649903000602

87
Eggert, A., & Serdaroglu, M. (2011). Exploring the Impact of Sales Technology on Salesperson
Performance: A Task-Based Approach. Journal of Marketing Theory and Practice; Abingdon,
19(2), 169–185.
El‐Ansary, A. L., Zabriskie, N. B., & Browning, J. M. (1993). Sales Teamwork: A DOMINANT
STRATEGY FOR IMPROVING SALESFORCE EFFECTIVENESS. Journal of Business &
Industrial Marketing, 8(3), 65–72. https://doi.org/10.1108/08858629310044183
Elgesem, D., Steskal, L., & Diakopoulos, N. (2015). Structure and Content of the Discourse on
Climate Change in the Blogosphere: The Big Picture. Environmental Communication, 9(2), 169–
188. https://doi.org/10.1080/17524032.2014.983536
Fan, W., Wallace, L., Rich, S., & Zhang, Z. (2006). Tapping the power of text mining.
Communications of the ACM, 49(9), 76–82. https://doi.org/10.1145/1151030.1151032
Garrett, J., & Gopalakrishna, S. (2017). Sales team formation: The right team member helps
performance. Industrial Marketing Management.
https://doi.org/10.1016/j.indmarman.2017.06.007
Gelman, A., & Park, D. K. (2009). Splitting a Predictor at the Upper Quarter or Third and the Lower
Quarter or Third. The American Statistician, 63(1), 1–8. https://doi.org/10.1198/tast.2009.0001
Gessner, G., & Scott, R. A. (2009). Using Business Intelligence Tools to Help Manage Costs and
Effectiveness of Business-to-Business Inside-Sales Programs. Information Systems Management,
26(2), 199–208. https://doi.org/10.1080/10580530902797623
Gilinsky, A., Newton, S., & Eyler, R. (2018). Are strategic orientations and managerial characteristics
drivers of performance in the US wine industry? International Journal of Wine Business
Research, 30(1), 42–57. https://doi.org/10.1108/IJWBR-08-2016-0029

88
Girish Maskeri, Santonu Sarkar, Kenneth Heafield (2008), “Mining Business Topics in Source Code
using Latent Dirichlet Allocation”, ACM
Gist, M. E., Locke, E. A., & Taylor, M. S. (1987). Organizational Behavior: Group Structure, Process,
and Effectiveness. Journal of Management, 13(2), 237–257.
https://doi.org/10.1177/014920638701300204
Gladstein, D. L. (1984). Groups in Context: A Model of Task Group Effectiveness. Administrative
Science Quarterly, 29(4), 499–517. https://doi.org/10.2307/2392936
Gooding, R. Z., & Wagner III, J. A. (1985). A Meta-Analytic Review of the Relationship between
Size and Performance: The Productivity and Efficiency of Organizations and Their Subunits.
Administrative Science Quarterly, 30(4), 462–481.
Grant, M. J., & Booth, A. (2009). A typology of reviews: an analysis of 14 review types and
associated methodologies: A typology of reviews, Maria J. Grant & Andrew Booth. Health
Information & Libraries Journal, 26(2), 91–108. https://doi.org/10.1111/j.1471-
1842.2009.00848.x
Griffith, B. A., & Dunham, E. B. (2014). Working in Teams: Moving From High Potential to High
Performance. SAGE Publications.
Gully, S. M., Devine, D. J., & Whitney, D. J. (1995). A Meta-Analysis of Cohesion and Performance:
Effects of Level of Analysis and Task Interdependence. Small Group Research, 43(6), 702–725.
https://doi.org/10.1177/1046496412468069
Gupta, V., & Lehal, G. S. (2009). A Survey of Text Mining Techniques and Applications. Journal of
Emerging Technologies in Web Intelligence, 1(1). https://doi.org/10.4304/jetwi.1.1.60-76
Guzzo, R. A., & Dickson, M. W. (1996). Teams in organizations: Recent research on performance
and effectiveness. Annual Review of Psychology, 47(1), 307–338.

89
Guzzo, R. A., & Shea, G. P. (1992). Group performance and intergroup relations in organizations. In M.
D. Dunnette & L. M. Hough (Eds.), Handbook of industrial and organizational psychology (pp.
269-313). Palo Alto, CA, US: Consulting Psychologists Press.
Hair, J. F. (Ed.). (2014). Multivariate data analysis (7. ed., Pearson new internat. ed). Harlow:
Pearson.
Hollenbeck, J. R., Ilgen, D. R., LePine, J. A., Colquitt, J. A., & Hedlund, J. (1998). Extending the
Multilevel Theory of Team Decisic Making: Effects of Feedback and Experience in Hierarchical
Teams. Academy of Management Journal, 41(3), 269–282. https://doi.org/10.2307/256907
Hunter, G. K., & Perreault Jr, W. D. (2007). Making sales technology effective. Journal of Marketing,
71(1), 16–34.
Hunter, G. K., & Perreault, W. D. (2006). Sales Technology Orientation, Information Effectiveness,
and Sales Performance. Journal of Personal Selling & Sales Management, 26(2), 95–113.
https://doi.org/10.2753/PSS0885-3134260201
Hwang, H. (2013, November 11). The Correlation Is Clear: Measuring Collaboration Is Directly Tied
to Better Adoption of Collaboration Tools. Retrieved May 1, 2018, from
https://blogs.cisco.com/collaboration/the-correlation-is-clear-measuring-collaboration-is-
directly-tied-to-better-adoption-of-collaboration-tools
Industry at a Glance. (2017). IBISWorld US - Industry, Company and Business Research Reports and
Information. Retrieved April 24, 2018, from
http://clients1.ibisworld.com/reports/us/industry/ataglance.aspx?entid=4592
Industry at a Glance. (2018). IBISWorld US - Industry, Company and Business Research Reports and
Information. Retrieved April 24, 2018, from
http://clients1.ibisworld.com/reports/us/industry/ataglance.aspx?entid=1989

90
Ingram, T. N., LaForge, R. W., & Leigh, T. W. (2002). Selling in the new millennium: a joint agenda.
Industrial Marketing Management, 31(7), 559–567.
Jacobi, C., Van Atteveldt, W., & Welbers, K. (2016). Quantitative analysis of large amounts of
journalistic texts using topic modelling. Digital Journalism, 4(1), 89–106.
https://doi.org/10.1080/21670811.2015.1093271
Jaramillo, F., & Marshall, G. W. (2004). Critical success factors in the personal selling process: An
empirical investigation of Ecuadorian salespeople in the banking industry. International Journal
of Bank Marketing, 22(1), 9–25. https://doi.org/10.1108/02652320410514906
Jelinek, R., Ahearne, M., Mathieu, J., & Schillewaert, N. (2006). A Longitudinal Examination of
Individual, Organizational, and Contextual Factors on Sales Technology Adoption and Job
Performance. Journal of Marketing Theory & Practice, 14(1), 7–23.
F. Jenks, g. (1963). Generalisation in Statistical Mapping. Annals of the Association of American
Geographers, 53, 15–26. https://doi.org/10.1111/j.1467-8306.1963.tb00429.x
Jolson, M. A., & Wotruba, T. R. (1992). Selling and Sales Management in Action: Prospecting: A
New Look at this Old Challenge. Journal of Personal Selling & Sales Management, 12(4), 59–
66. https://doi.org/10.1080/08853134.1992.10753928
Jones, E., Dixon, A. L., Chonko, L. B., & Cannon, J. P. (2005). Key accounts and team selling: a
review, framework, and research agenda. Journal of Personal Selling & Sales Management,
25(2), 181–198.
Katzenbach, J. R., & Smith, D. K. (1993). The discipline of teams. Harvard Business Review, 71(2),
111–120.
Kennedy, P. (1992). A Guide to econometrics. Oxford: Blackwell.

91
Kiesler, S., & Sproull, L. (1992). Group decision making and communication technology.
Organizational Behavior and Human Decision Processes, 52(1), 96–123.
https://doi.org/10.1016/0749-5978(92)90047-B
Kozlowski, S., & Bell, B. (2001). Work Groups and Teams in Organizations. Articles and Chapters.
Retrieved from https://digitalcommons.ilr.cornell.edu/articles/389
Kumar, V & Reinartz, Weiner. (2012). Customer Relationship Management: Concept, Strategy and
Tools. Springer. Retrieved May 23, 2019, from
https://www.springer.com/gp/book/9783662553800
Lai, C. J., & Gelb, B. D. (2015). Key account teams: success factors for implementing strategy.
Journal of Business Strategy, 36(4), 48–55. https://doi.org/10.1108/JBS-07-2014-0079
Lee, S., Song, J., & Kim, Y. (2010.). An Empirical Comparison of Four Text Mining Methods.
Journal of Computer Information System, 1–10.
Levine, J. M., & Moreland, R. L. (1990). Progress in Small Group Research. Annual Review of
Psychology, 41(1), 585–634. https://doi.org/10.1146/annurev.ps.41.020190.003101
Lewis, K. (2003). Measuring Transactive Memory Systems in the Field: Scale Development and
Validation. Journal of Applied Psychology, 88(4), 587–604. https://doi.org/10.1037/0021-
9010.88.4.587
Liu, A. H., Chugh, R., & Noel Gould, A. (2016). Working smart to win back lost customers the role
of coping choices and justice mechanisms. European Journal of Marketing; Bradford, 50(3/4),
397–420.
Luo, J., Pan, X., & Zhu, X. (2017). Discovery of repost patterns by topic analysis in enterprise social
networking. Aslib Journal of Information Management, 69(2), 158–173.
https://doi.org/10.1108/AJIM-08-2016-0128

92
Magjuka, R. J., & Baldwin, T. T. (1991). Team‐based employee involvement programs: effects of
design and administration. Personnel Psychology, 44(4), 793–812.
https://doi.org/10.1111/j.1744-6570.1991.tb00699.x
Magnotta, S. R. (2018). Can You Hear Me Now? An Innovative Experiential Learning Module to
Prepare Tomorrow’s Inside Salespeople. Marketing Education Review, 28(2), 75–79.
https://doi.org/10.1080/10528008.2018.1464884
Maier, D., Waldherr, A., Miltner, P., Wiedemann, G., Niekler, A., Keinert, A., … Adam, S. (2018).
Applying LDA Topic Modeling in Communication Research: Toward a Valid and Reliable
Methodology. Communication Methods and Measures, 12(2–3), 93–118.
https://doi.org/10.1080/19312458.2018.1430754
Marks, M. A., Mathieu, J. E., & Zaccaro, S. J. (2001). A Temporally Based Framework and
Taxonomy of Team Processes. Academy of Management Review, 26(3), 356–376.
https://doi.org/10.5465/amr.2001.4845785
Martin, S. W. (2013, November 4). The Trend that is Changing Sales. Harvard Business Review.
Retrieved from https://hbr.org/2013/11/the-trend-that-is-changing-sales
Maskeri, G., Sarkar, S., & Heafield, K. (2008). Mining Business Topics in Source Code Using Latent
Dirichlet Allocation. In Proceedings of the 1st India Software Engineering Conference (pp. 113–
120). New York, NY, USA: ACM. https://doi.org/10.1145/1342211.1342234
McFadden, D. L. (1973). Conditional Logit Analysis of Qualitative Choice Behavior. In Frontiers in
Econometrics. New York: Wiley.
Menard, S. (2000). Coefficients of Determination for Multiple Logistic Regression Analysis. The
American Statistician, 54(1), 17–24. https://doi.org/10.2307/2685605

93
Mintu-Wimsatt, A., & Gassenheimer, J. B. (2000). The Moderating Effects of Cultural Context in
Buyer-Seller Negotiation. Journal of Personal Selling & Sales Management, 20(1), 1–9.
https://doi.org/10.1080/08853134.2000.10754215
Moon, M. A., & Armstrong, G. M. (1994). Selling teams: A conceptual framework and research
agenda. Journal of Personal Selling & Sales Management, 14(1), 17–30.
Moore, J. N., Raymond, M. A., & Hopkins, C. D. (2015). Social Selling: A Comparison of Social
Media Usage Across Process Stage, Markets, and Sales Job Functions. Journal of Marketing
Theory and Practice, 23(1), 1–20. https://doi.org/10.1080/10696679.2015.980163
Morgan, A. J., & Inks, S. A. (2001). Technology and the Sales Force. Industrial Marketing
Management, 30(5), 463–472. https://doi.org/10.1016/S0019-8501(99)00115-7
Moutot, J.-M., & Bascoul, G. (2008). Effects Of Sales Force Automation Use On Sales Force
Activities And Customer Relationship Management Processes. Journal of Personal Selling and
Sales Management, 28, 167–184. https://doi.org/10.2753/PSS0885-3134280205
Mullen, B., Symons, C., Hu, L.-t., & Salas, E. (1989). Group size, leadership behavior, and
subordinate satisfaction. Journal of General Psychology, 116(2), 155-170.
http://dx.doi.org/10.1080/00221309.1989.9711120
Muñoz, J., & Felicísimo, Á. M. (2004). Comparison of statistical methods commonly used in
predictive modelling. Journal of Vegetation Science, 15(2), 285–292.
https://doi.org/10.1111/j.1654-1103.2004.tb02263.x
Neuman, G. A., & Wright, J. (1999). Team effectiveness: beyond skills and cognitive ability. Journal
of Applied Psychology, 84(3), 376.
Nieva, V. F., Fleishman, E. A., & Rieck, A. (1985). Team Dimensions: Their Identity, Their
Measurement and Their Relationships. Advanced research resources organization bethesda md,

94
advanced research resources organization bethesda md. Retrieved from
http://www.dtic.mil/docs/citations/ADA149662
Nowlin, E. L., Walker, D., & Anaza, N. A. (2018). How does salesperson connectedness impact
performance? It depends upon the level of internal volatility. Industrial Marketing Management,
68, 106–113. https://doi.org/10.1016/j.indmarman.2017.10.007
Nunez‐Mir, G. C., Iannone, B. V., Pijanowski, B. C., Kong, N., & Fei, S. (2016). Automated content
analysis: addressing the big literature challenge in ecology and evolution. Methods in Ecology
and Evolution, 7(11), 1262–1272. https://doi.org/10.1111/2041-210X.12602
Oleary, M., Mortensen, M., & Woolley, A. (2011). Multiple Team Membership: a Theoretical Model
of its Effects on Productivity and Learning for Individuals and Teams. International Federation
for Information Processing Digital Library; Virtuality and Virtualization;
https://doi.org/10.5465/amr.2009.0275
Ostroff, C. (1993). Comparing Correlations Based on Individual-Level and Aggregated Data. Journal
of Applied Psychology, 78(4), 569–582.
P. Shea, G., & A. Guzzo, R. (1987). Group effectiveness: what really matters? Sloan Management
Review, 28, 25–31.
Paré, G., Trudel, M.-C., Jaana, M., & Kitsiou, S. (2015). Synthesizing information systems
knowledge: A typology of literature reviews. Information & Management, 52(2), 183–199.
https://doi.org/10.1016/j.im.2014.08.008
Park, J.-E., & Holloway, B. B. (2003). Adaptive Selling Behavior Revisited: An Empirical
Examination of Learning Orientation, Sales Performance, and Job Satisfaction. Journal of
Personal Selling & Sales Management, 23(3), 239–251.
https://doi.org/10.1080/08853134.2003.10749001

95
Patterson, L. (2007). Marketing and sales alignment for improved effectiveness. Journal of Digital
Asset Management, 3(4), 185–189. https://doi.org/10.1057/palgrave.dam.3650089
Payne, A. (2009). Handbook of CRM: achieving excellence in customer management. Oxford;
Burlington, MA: Elsevier Butterworth-Heinemann.
Perry, M. L., Pearce, C. L., & Sims Jr, H. P. (1999). Empowered selling teams: How shared
leadership can contribute to selling team outcomes. Journal of Personal Selling & Sales
Management, 19(3), 35–51.
Plouffe, C. R., Williams, B. C., & Leigh, T. W. (2004). Who’s on First? Stakeholder Differences in
Customer Relationship Management and the Elusive Notion of “Shared Understanding.” Journal
of Personal Selling & Sales Management, 24(4), 323–338.
https://doi.org/10.1080/08853134.2004.10749041
Rajagopal, & Rajagopal, A. (2008). Team performance and control process in sales organizations.
Team Performance Management: An International Journal, 14(1/2), 70–85.
https://doi.org/10.1108/13527590810860212
Rangarajan, D., Jones, E., & Chin, W. (2005). Impact of sales force automation on technology-related
stress, effort, and technology usage among salespeople. Industrial Marketing Management,
34(4), 345–354. https://doi.org/10.1016/j.indmarman.2004.09.015
Rapp, A. A. (1989). Team Selling Is Changing The Sales Trainer’s Role. Training; Minneapolis,
26(5), S6.
Rapp, A., Ahearne, M., Mathieu, J., & Rapp, T. (2010). Managing sales teams in a virtual
environment. International Journal of Research in Marketing, 27(3), 213–224.
https://doi.org/10.1016/j.ijresmar.2010.02.003

96
Rapp, A., Ahearne, M., Mathieu, J., & Schillewaert, N. (2006). The impact of knowledge and
empowerment on working smart and working hard: The moderating role of experience.
International Journal of Research in Marketing, 23(3), 279–293.
https://doi.org/10.1016/j.ijresmar.2006.02.003
Rapp, T. L., Bachrach, D. G., Rapp, A. A., & Mullins, R. (2014). The role of team goal monitoring in
the curvilinear relationship between team efficacy and team performance. Journal of Applied
Psychology, 99(5), 976–987. https://doi.org/10.1037/a0036978
Rapp, A., Beitelspacher, L. S., Schillewaert, N., & Baker, T. L. (2012). The differing effects of
technology on inside vs. outside sales forces to facilitate enhanced customer orientation and
interfunctional coordination. Journal of Business Research, 65(7), 929–936.
https://doi.org/10.1016/j.jbusres.2011.05.005
Reimann, M., Schilke, O., & Thomas, J. S. (2009). Customer relationship management and firm
performance: The mediating role of business strategy. Journal of the Academy of Marketing
Science, 38(3), 326–346. https://doi.org/10.1007/s11747-009-0164-y
Rentsch, J. R., Heffner, T. S., & Duffy, L. T. (1994). What You Know is What You Get from
Experience Group & Organization Management, 19(4), 450–474.
https://doi.org/10.1177/1059601194194004
Rodriguez, M., & Honeycutt, E. D. (2011). Customer Relationship Management (CRM)’s Impact on
B to B Sales Professionals’ Collaboration and Sales Performance. Journal of Business-to-
Business Marketing, 18(4), 335–356. https://doi.org/10.1080/1051712X.2011.574252
Salas, E., L. Dickinson, T., A. Converse, S., & I. Tannenbaum, S. (1992). Toward an understanding of
team performance and training. Teams: Their Training and Performance.

97
Salesforce UK. (2015). Team Selling: Why Selling Together Is Winning Together. Retrieved May 8,
2018, from https://www.salesforce.com/uk/blog/2015/08/team-selling-why-selling-togeher-is-
winning-together.html
Schwab, J. A. (2002). Multinomial logistic regression: Basic relationships and complete
problems. http://www.utexas.edu/courses/schwab/sw388r7/SolvingProblems/
Schwartz, J., Bohdal-Spiegelhoff, U., Gretczko, M., Sloan, N (2016). Global Human Capital Trends
Deloitte Press. Retrieved from https://www2.deloitte.com/insights/us/en/focus/human-capital-
trends/2016.html
Schillewaert, N., Ahearne, M. J., Frambach, R. T., & Moenaert, R. K. (2005). The adoption of
information technology in the sales force. Industrial Marketing Management, 34(4), 323–336.
https://doi.org/10.1016/j.indmarman.2004.09.013
Schwepker, C. H., & Good, D. J. (2011). Moral Judgment and its Impact on Business-to-Business
Sales Performance and Customer Relationships. Journal of Business Ethics, 98(4), 609–625.
Second Annual State of Sales (2015). Salesforce Research. Retrieved from
https://a.sfdcstatic.com/content/dam/www/ocms/assets/pdf/misc/state-of-sales-report-
salesforce.pdf
Silge, J., & Robinson, D. (2017). Text Mining with R. O’Reilly Media. Retrieved from
https://www.tidytextmining.com/
Slater, S. F., & Olson, E. M. (2001). Marketing’s contribution to the implementation of business
strategy: an empirical analysis. Strategic Management Journal, 22(11), 1055–1067.
https://doi.org/10.1002/smj.198

98
Smith, A. E. (2003). Automatic Extraction of Semantic Networks from Text using Leximancer.
Companion Volume of the Proceedings of HLT-NAACL 2003 - Demonstrations, 23–24.
Retrieved from https://www.aclweb.org/anthology/N03-4012
Smith, A. E., & Humphreys, M. S. (2006). Evaluation of unsupervised semantic mapping of natural
language with Leximancer concept mapping. Behavior Research Methods, 38(2), 262–279.
https://doi.org/10.3758/BF03192778
Smith, J. B., & Barclay, D. W. (1993). Team Selling Effectiveness:: A Small Group Perspective.
Journal of Business-to-Business Marketing, 1(2), 3–32. https://doi.org/10.1300/J033v01n02_02
Smith, T. M., Gopalakrishna, S., & Chatterjee, R. (2006). A three-stage model of integrated marketing
communications at the marketing–sales interface. Journal of Marketing Research, 43(4), 564–
579.
Steiner, Ivan D. (1976), "Task-performing Groups," in Contemporary
Topics in Social Psychology,
Stewart, G. L. (2006). A Meta-Analytic Review of Relationships Between Team Design Features and
Team Performance. Journal of Management, 32(1), 29–55.
https://doi.org/10.1177/0149206305277792
Stewart, G. L., & Barrick, M. R. (2000). Team Structure and Performance: Assessing the Mediating
Role of Intrateam Process and the Moderating Role of Task Type. Academy of Management
Journal, 43(2), 135–148. https://doi.org/10.2307/1556372
Straub, D., Limayem, M., & Karahanna-Evaristo, E. (1995). Measuring System Usage: Implications
for IS Theory Testing. Manage. Sci., 41(8), 1328–1342. https://doi.org/10.1287/mnsc.41.8.1328
Sujan, H., Weitz, B. A., & Kumar, N. (1994). Learning Orientation, Working Smart, and Effective
Selling. Journal of Marketing, 58(3), 39.

99
Sundstrom, E., De Meuse, K. P., & Futrell, D. (1990). Work Teams: Applications and Effectiveness.
The American Psychologist; Washington, 45(2), 120.
Tabachnick, B. G., & Fidell, L. S. (2007). Using multivariate statistics, 5th ed. Boston, MA: Allyn &
Bacon/Pearson Education.
Tanner, J. F., Ahearne, M., Leigh, T. W., Mason, C. H., & Moncrief, W. C. (2005). CRM in Sales-
Intensive Organizations: A Review and Future Directions. Journal of Personal Selling & Sales
Management, 25(2), 169–180. https://doi.org/10.1080/08853134.2005.10749057
Tesluk, P. E., & Mathieu, J. E. (1999). Overcoming Roadblocks to Effectiveness: Incorporating
Management of Performance Barriers Into Models of Work Group Effectiveness. Journal of
Applied Psychology, 84(2), 200–217. https://doi.org/10.1037/0021-9010.84.2.200
Thompson, J. D. (2003). Organizations in Action | Social Science Bases of Administrative Theory |
Taylor & Francis Group. Retrieved March 23, 2018, from
https://www.taylorfrancis.com/books/9781351501101
Tinati, R., Halford, S., Carr, L., & Pope, C. (2014). Big Data: Methodological Challenges and
Approaches for Sociological Analysis. Sociology, 48(4), 663–681.
https://doi.org/10.1177/0038038513511561
Tirunillai, S., & Tellis, G. J. (2014). Mining Marketing Meaning from Online Chatter: Strategic Brand
Analysis of Big Data Using Latent Dirichlet Allocation. Journal of Marketing Research (JMR),
51(4), 463–479.
Verbeke, W., Dietz, B., & Verwaal, E. (2011). Drivers of sales performance: a contemporary meta-
analysis. Have salespeople become knowledge brokers? Journal of the Academy of Marketing
Science, 39(3), 407–428. https://doi.org/10.1007/s11747-010-0211-8

100
Vilagut, G. (2014). Test-Retest Reliability. In A. C. Michalos (Ed.), Encyclopedia of Quality of Life
and Well-Being Research (pp. 6622–6625). https://doi.org/10.1007/978-94-007-0753-5_3001
Virtanen, T., Parvinen, P., & Rollins, M. (2015). Complexity of sales situation and sales lead
performance: An empirical study in business-to-business company. Industrial Marketing
Management, 45, 49–58. https://doi.org/10.1016/j.indmarman.2015.02.024
Warren, C. (2016). Social Media and Outbound Ticket Sales: Examining Social Media Strategies
Among Top-Performing Salespeople. Journal of Applied Sport Management, 8(4).
https://doi.org/10.18666/JASM-2016-V8-I4-7263
Weinstein, L., & Mullins, R. (2012). Technology Usage and Sales Teams: A Multilevel Analysis of
the Antecedents of Usage. Journal of Personal Selling & Sales Management, 32(2), 245–259.
https://doi.org/10.2753/PSS0885-3134320205
Wood, R. E. (1986). Task complexity: Definition of the construct. Organizational Behavior and
Human Decision Processes, 37(1), 60–82. https://doi.org/10.1016/0749-5978(86)90044-0
Yan, J., Gong, M., Sun, C., Huang, J., & Chu, S. M. (2015). Sales pipeline win propensity prediction:
a regression approach. In Integrated Network Management (IM), 2015 IFIP/IEEE International
Symposium on (pp. 854–857). IEEE.
Yetton, P. W., & Bottger, P. C. (1982). Individual versus group problem solving: An empirical test of
a best-member strategy. Organizational Behavior and Human Performance, 29(3), 307–321.
https://doi.org/10.1016/0030-5073(82)90248-3
Yilmaz, C., & Hunt, S. D. (2001). Salesperson Cooperation: The Influence of Relational, Task,
Organizational, and Personal Factors.

101
Zablah, A. R., Bellenger, D. N., & Johnston, W. J. (2004). Customer Relationship Management
Implementation Gaps. Journal of Personal Selling & Sales Management, 24(4), 279–295.
https://doi.org/10.1080/08853134.2004.10749038
Zallocco, R., Bolman Pullins, E., & Mallin, M. L. (2009). A re‐examination of B2B sales
performance. Journal of Business & Industrial Marketing, 24(8), 598–610.
https://doi.org/10.1108/08858620910999466
Zhao, W. X., Jiang, J., Weng, J., He, J., Lim, E.-P., Yan, H., & Li, X. (2011). Comparing Twitter and
Traditional Media Using Topic Models. In Advances in Information Retrieval (pp. 338–349).
Springer, Berlin, Heidelberg. https://doi.org/10.1007/978-3-642-20161-5_34
Zikmund, W., Babin, B., Carr, J. and Griffin, M. (2013). Business research methods. 9th ed. Mason,
OH: South-Western.

102
APPENDICES
A
Database
Web of Science
Objective 1
Types of Sales Performance
sales process broken down into stages
("classification*" OR "category*" OR "stage*" OR "level*") AND ("sales performance*" OR "sales performance*") AND ("team*" OR "group*")
("classification*" OR "category*" OR "stage*" OR "level*") AND ("sales pipeline*" OR "sales pipeline*") AND ("team*" OR "group*")
("classification*" OR "category*" OR "stage*" OR "level*") AND ("sales process*" OR "sales process*") AND ("team*" OR "group*")
("classification*" OR "category*" OR "stage*" OR "level*") AND ("sales funnel*" OR "sales funnel*") AND ("team*" OR "group*")
Objective 2
Team-based predictors of sales performance
optimal team structure for selling
("team selling*" OR "group selling*") AND ("sales performance*" OR "sales outcome*" OR "sales result*")
("team design*" OR "team structure*" OR "team dynamics*" OR "team feature*") AND ("sales performance*" OR "sales outcome*" OR "sales result*")
("sales teams*" OR "team selling*") AND antecedents to sales performance
(antecedent* OR predictor*) AND (team* OR group*) AND (Sales* performance*)
Scopus
Objective 1
Types of Sales Performance
sales process broken down into stages
("classification*" OR "category*" OR "stage*" OR "level*") AND ("sales performance*" OR "sales performance*") AND ("team*" OR "group*")
("classification*" OR "category*" OR "stage*" OR "level*") AND ("sales pipeline*" OR "sales pipeline*") AND ("team*" OR "group*")
("classification*" OR "category*" OR "stage*" OR "level*") AND ("sales process*" OR "sales process*") AND ("team*" OR "group*")
("classification*" OR "category*" OR "stage*" OR "level*") AND ("sales funnel*" OR "sales funnel*") AND ("team*" OR "group*")
Objective 2
Team-based predictors of sales performance
optimal team structure for selling
("team selling*" OR "group selling*") AND ("sales performance*" OR "sales outcome*" OR "sales result*")

103
("team design*" OR "team structure*" OR "team dynamics*" OR "team feature*") AND ("sales performance*" OR "sales outcome*" OR "sales result*")
("sales teams*" OR "team selling*") AND antecedents to sales performance (antecedent* OR predictor*) AND (team* OR group*) AND (Sales* performance*)
ProQuest
Objective 1
Types of Sales Performance
sales process broken down into stages
("classification*" OR "category*" OR "stage*" OR "level*") AND ("sales performance*" OR "sales performance*") AND ("team*" OR "group*")
("classification*" OR "category*" OR "stage*" OR "level*") AND ("sales pipeline*" OR "sales pipeline*") AND ("team*" OR "group*")
("classification*" OR "category*" OR "stage*" OR "level*") AND ("sales process*" OR "sales process*") AND ("team*" OR "group*")
("classification*" OR "category*" OR "stage*" OR "level*") AND ("sales funnel*" OR "sales funnel*") AND ("team*" OR "group*")
Objective 2
Team-based predictors of sales performance
optimal team structure for selling
("team selling*" OR "group selling*") AND ("sales performance*" OR "sales outcome*" OR "sales result*")
("team design*" OR "team structure*" OR "team dynamics*" OR "team feature*") AND ("sales performance*" OR "sales outcome*" OR "sales result*")
("sales teams*" OR "team selling*") AND antecedents to sales performance
(antecedent* OR predictor*) AND (team* OR group*) AND (Sales* performance*)
Ebsco- Business Source
Complete
Objective 1
Types of Sales Performance
sales process broken down into stages
("classification*" OR "category*" OR "stage*" OR "level*") AND ("sales performance*" OR "sales performance*") AND ("team*" OR "group*")
("classification*" OR "category*" OR "stage*" OR "level*") AND ("sales pipeline*" OR "sales pipeline*") AND ("team*" OR "group*")
("classification*" OR "category*" OR "stage*" OR "level*") AND ("sales process*" OR "sales process*") AND ("team*" OR "group*")
("classification*" OR "category*" OR "stage*" OR "level*") AND ("sales funnel*" OR "sales funnel*") AND ("team*" OR "group*")
Objective 2
Team-based predictors of sales performance
optimal team structure for selling
("team selling*" OR "group selling*") AND ("sales performance*" OR "sales outcome*" OR "sales result*")
("team design*" OR "team structure*" OR "team dynamics*" OR "team feature*") AND ("sales performance*" OR "sales outcome*" OR "sales result*")
("sales teams*" OR "team selling*") AND antecedents to sales performance

104
(antecedent* OR predictor*) AND (team* OR group*) AND (Sales* performance*)
IEEE Explore
Objective 1
Types of Sales Performance
sales process broken down into stages
("classification*" OR "category*" OR "stage*" OR "level*") AND ("sales performance*" OR "sales performance*") AND ("team*" OR "group*")
("classification*" OR "category*" OR "stage*" OR "level*") AND ("sales pipeline*" OR "sales pipeline*") AND ("team*" OR "group*")
("classification*" OR "category*" OR "stage*" OR "level*") AND ("sales process*" OR "sales process*") AND ("team*" OR "group*")
("classification*" OR "category*" OR "stage*" OR "level*") AND ("sales funnel*" OR "sales funnel*") AND ("team*" OR "group*")
Objective 2
Team-based predictors of sales performance
optimal team structure for selling
("team selling*" OR "group selling*") AND ("sales performance*" OR "sales outcome*" OR "sales result*")
("team design*" OR "team structure*" OR "team dynamics*" OR "team feature*") AND ("sales performance*" OR "sales outcome*" OR "sales result*")
("sales teams*" OR "team selling*") AND antecedents to sales performance
(antecedent* OR predictor*) AND (team* OR group*) AND (Sales* performance*)
Scholars Portal Journal
Objective 1
Types of Sales Performance
sales process broken down into stages
("classification*" OR "category*" OR "stage*" OR "level*") AND ("sales performance*" OR "sales performance*") AND ("team*" OR "group*")
("classification*" OR "category*" OR "stage*" OR "level*") AND ("sales pipeline*" OR "sales pipeline*") AND ("team*" OR "group*")
("classification*" OR "category*" OR "stage*" OR "level*") AND ("sales process*" OR "sales process*") AND ("team*" OR "group*")
("classification*" OR "category*" OR "stage*" OR "level*") AND ("sales funnel*" OR "sales funnel*") AND ("team*" OR "group*")
Objective 2
Team-based predictors of sales performance
optimal team structure for selling
("team selling*" OR "group selling*") AND ("sales performance*" OR "sales outcome*" OR "sales result*")
("team design*" OR "team structure*" OR "team dynamics*" OR "team feature*") AND ("sales performance*" OR "sales outcome*" OR "sales result*")
("sales teams*" OR "team selling*") AND antecedents to sales performance
(antecedent* OR predictor*) AND (team* OR group*) AND (Sales* performance*)
Google Scholar Objective 1
Types of Sales Performance

105
sales process broken down into stages
("classification*" OR "category*" OR "stage*" OR "level*") AND ("sales performance*" OR "sales performance*") AND ("team*" OR "group*")
("classification*" OR "category*" OR "stage*" OR "level*") AND ("sales pipeline*" OR "sales pipeline*") AND ("team*" OR "group*")
("classification*" OR "category*" OR "stage*" OR "level*") AND ("sales process*" OR "sales process*") AND ("team*" OR "group*")
("classification*" OR "category*" OR "stage*" OR "level*") AND ("sales funnel*" OR "sales funnel*") AND ("team*" OR "group*")
Objective 2
Team-based predictors of sales performance
optimal team structure for selling
("team selling*" OR "group selling*") AND ("sales performance*" OR "sales outcome*" OR "sales result*")
("team design*" OR "team structure*" OR "team dynamics*" OR "team feature*") AND ("sales performance*" OR "sales outcome*" OR "sales result*")
("sales teams*" OR "team selling*") AND antecedents to sales performance
(antecedent* OR predictor*) AND (team* OR group*) AND (Sales* performance*)
JStor
Objective 1
Types of Sales Performance
sales process broken down into stages
("classification*" OR "category*" OR "stage*" OR "level*") AND ("sales performance*" OR "sales performance*") AND ("team*" OR "group*")
("classification*" OR "category*" OR "stage*" OR "level*") AND ("sales pipeline*" OR "sales pipeline*") AND ("team*" OR "group*")
("classification*" OR "category*" OR "stage*" OR "level*") AND ("sales process*" OR "sales process*") AND ("team*" OR "group*")
("classification*" OR "category*" OR "stage*" OR "level*") AND ("sales funnel*" OR "sales funnel*") AND ("team*" OR "group*")
Objective 2
Team-based predictors of sales performance
optimal team structure for selling
("team selling*" OR "group selling*") AND ("sales performance*" OR "sales outcome*" OR "sales result*")
("team design*" OR "team structure*" OR "team dynamics*" OR "team feature*") AND ("sales performance*" OR "sales outcome*" OR "sales result*")
("sales teams*" OR "team selling*") AND antecedents to sales performance
(antecedent* OR predictor*) AND (team* OR group*) AND (Sales* performance*)
Journals
Journal of Applied Psychology, The Journal of Personal Selling & Sales Management, Journal of Marketing, The Journal of Business & Industrial Marketing, Journal of the Academy of Marketing Science, Journal of Business Ethics, European Journal of Marketing, Journal of Marketing Theory and Practice, Journal of Marketing Research, information processing & management, information resources management journal

106
B
The Sentences-per-block option was set to one since our text segments are no more than a sentence
on average. We expect each case to contain enough information within it for it to be classified to
a category. The languages French and Spanish were added to the stop word list, as we are dealing
with English only (as dictated by our data). The total number of concepts to be extracted was left

107
at automatic, which allows Leximancer to extract the naturally emergent number of concepts from
the data.
C
Concepts Generated from Result Codes using Leximancer
Word-Like Count Relevance
email 1656 100%
contact 1289 78%
sent 940 57%
lead 804 49%
appointment 768 46%
interested 745 45%
left 668 40%
info 587 35%
send 489 30%
follow 439 27%
callback 438 26%
interest 431 26%
mail 400 24%
appt 387 23%
wrong 375 23%
customer 355 21%
phone 328 20%
vm 298 18%
cb 297 18%
client 295 18%
number 291 18%
dm 281 17%
scheduled 269 16%
sold 267 16%
wants 262 16%
information 235 14%
requested 234 14%
day 228 14%
days 227 14%
sale 227 14%
answer 213 13%
future 209 13%
time 206 12%
completed 206 12%
team 196 12%
prospect 195 12%
current 193 12%
rep 187 11%

108
confirmed 187 11%
need 186 11%
request 180 11%
complete 180 11%
survey 174 11%
needs 167 10%
schedule 160 10%
registered 160 10%
qualified 158 10%
company 158 10%
decision 155 09%
service 154 09%
list 153 09%
person 151 09%
meeting 146 09%
bad 144 09%
sales 139 08%
order 137 08%
received 133 08%
working 132 08%
non 129 08%
longer 128 08%
transfer 124 07%
account 107 06%
use 98 06%
D
Suspect Ratio
Test of Parallel Linesa
Model
-2 Log
Likelihood Chi-Square df Sig.
Null Hypothesis 6061.327
General 5977.679b 83.648c 8 .000
The null hypothesis states that the location parameters (slope coefficients) are
the same across response categories.
a. Link function: Logit.
b. The log-likelihood value cannot be further increased after maximum number
of step-halving.

109
c. The Chi-Square statistic is computed based on the log-likelihood value of
the last iteration of the general model. Validity of the test is uncertain.
Prospect Ratio
Test of Parallel Linesa
Model
-2 Log
Likelihood Chi-Square df Sig.
Null Hypothesis 2205.981
General 2009.774b 196.207c 8 .000
The null hypothesis states that the location parameters (slope coefficients) are
the same across response categories.
a. Link function: Logit.
b. The log-likelihood value cannot be further increased after maximum number
of step-halving.
c. The Chi-Square statistic is computed based on the log-likelihood value of
the last iteration of the general model. Validity of the test is uncertain.
Qualification Ratio
Test of Parallel Linesa
Model
-2 Log
Likelihood Chi-Square df Sig.
Null Hypothesis 1326.905
General 1249.462b 77.443c 8 .000
The null hypothesis states that the location parameters (slope coefficients) are
the same across response categories.
a. Link function: Logit.
b. The log-likelihood value cannot be further increased after maximum number
of step-halving.
c. The Chi-Square statistic is computed based on the log-likelihood value of
the last iteration of the general model. Validity of the test is uncertain.
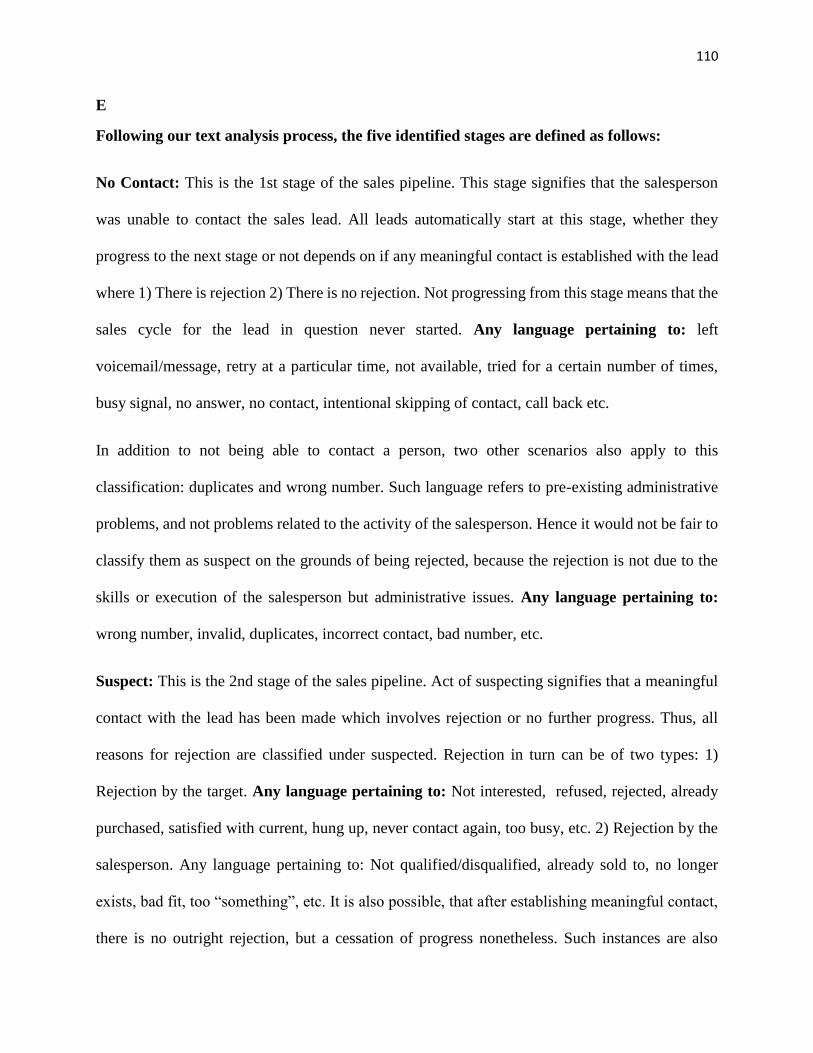
110
E
Following our text analysis process, the five identified stages are defined as follows:
No Contact: This is the 1st stage of the sales pipeline. This stage signifies that the salesperson
was unable to contact the sales lead. All leads automatically start at this stage, whether they
progress to the next stage or not depends on if any meaningful contact is established with the lead
where 1) There is rejection 2) There is no rejection. Not progressing from this stage means that the
sales cycle for the lead in question never started. Any language pertaining to: left
voicemail/message, retry at a particular time, not available, tried for a certain number of times,
busy signal, no answer, no contact, intentional skipping of contact, call back etc.
In addition to not being able to contact a person, two other scenarios also apply to this
classification: duplicates and wrong number. Such language refers to pre-existing administrative
problems, and not problems related to the activity of the salesperson. Hence it would not be fair to
classify them as suspect on the grounds of being rejected, because the rejection is not due to the
skills or execution of the salesperson but administrative issues. Any language pertaining to:
wrong number, invalid, duplicates, incorrect contact, bad number, etc.
Suspect: This is the 2nd stage of the sales pipeline. Act of suspecting signifies that a meaningful
contact with the lead has been made which involves rejection or no further progress. Thus, all
reasons for rejection are classified under suspected. Rejection in turn can be of two types: 1)
Rejection by the target. Any language pertaining to: Not interested, refused, rejected, already
purchased, satisfied with current, hung up, never contact again, too busy, etc. 2) Rejection by the
salesperson. Any language pertaining to: Not qualified/disqualified, already sold to, no longer
exists, bad fit, too “something”, etc. It is also possible, that after establishing meaningful contact,
there is no outright rejection, but a cessation of progress nonetheless. Such instances are also

111
counted as suspects, as they are not due to administrative issues, but has more to do with the
activity of the salesperson in developing further progress. Any language pertaining to: could not
get past gatekeeper, contact not there, language barrier, research needed, etc.
For our study, this is the base level from which progression will be measured. Hence it is
important to exactly specify what types of leads are classified under this category. This is why
leads such as duplicates and wrong numbers were not included as suspects, because teams could
be unfairly penalized for getting a higher proportion of such leads which would then affect their
subsequent ratios used to measure progress.
Prospect: This is the 3rd stage of the sales pipeline. Act of prospecting signifies that a meaningful
contact with the target has been made which involves non-rejection or further progress. If there is
no rejection, then all other reasons that may signal wanting to continue discussions are included in
the Prospected Stage, short of committing to an actual activity where a sale may be discussed. Any
language pertaining to: Strong interest, wanting quote, needing help, wanting to talk later,
indecisiveness, requesting more info, rescheduling, updated, verified, spoke to decision maker,
future interest/potential, needs “ something”, set up callback, profiled, nurture, looking to
“something”, partially complete, waiting on “something”, etc.
A sales lead moving to prospect means that it has escaped initial rejection. This is to the merit
of the salesperson, for being able to establish some sort of relationship with the lead without getting
rejected. But that does not mean that a lead cannot be rejected at this stage. What often happens is
that the lead stops responding (becomes dead), only later on into the conversations is it determined
that there is not a current fit for whatever reason, or refuses to participate in an activity that might
lead to a sale. But it is still to the credit of the salesperson for having been able to progress the
conversation to this stage. Henceforth, such advanced form of rejections are also classified under

112
prospects. Any language pertaining to: dead, cancelled, withdraw, would not like “something”,
decline, etc.
Qualified: This is the 4th stage of the sales pipeline. Act of qualifying signifies an agreement
made by the lead to move one step closer into entertaining the prospect of becoming a client by
participating in a certain sales activity. It does not merely rest on discussions or need for
information anymore, but rather agreeing to a next step from which a potential sale can either be
won or lost. Any language pertaining to: Face-to-face meeting, confirmed
appointment/registration/meeting, agreed to a next step, demo/appointment scheduled, hot/warm
lead, presentation/pitch complete, qualified, affirmative answers, intention to purchase, survey
completed, opportunity, met with “someone”, quote sent, proposal sent, set up webinar, etc. It
also involves an even more advanced form of rejection at this step, which translates to not
becoming a client or completing the sales cycle. Any language pertaining to: Offer declined,
lost to competitor, etc.
A lead moving to qualified means, that it has progressed to a more concrete stage which is based
on an actual sales activity other than just talk about determining a fit or the salesperson selling the
product. The same rejection symptoms from the prospect stage still apply to this stage, but albeit
at a lower rate. So a lead can still go cold after making it thus far, but as before, it is to the credit
of the sales person for having been able to progress the conversation to this stage.
Client: The 5th and last stage of the sales pipeline. Advancing to this stage signifies a successful
conversion of a lead to a sale, and the completion of the sales cycle for that sales lead. Any
language pertaining to: The account has been closed, a sale has been made, acceptances of offers,
won, sale, deal, client, retained etc.

113
If a lead is successfully converted to a client, than it is to the full credit of the salesperson for
having converted that lead. Once a sale has been made, we treat it as the achievement of the goal.
Any forms of cross selling or up selling are seen as different efforts, as thus mark the beginning
of a separate sales cycle.
F

114
G
topic term beta
1 office 0.226992
1 webinar 0.184564
1 detail 0.067885
1 staff 0.061521
1 head 0.04455
2 future 0.292151
2 prospect 0.274881
2 spoke 0.194288
2 potential 0.093546
2 attendee 0.012953
3 info 0.580539
3 requested 0.249265
3 refusal 0.036688
3 gatekeeper 0.03453
3 access 0.009593
4 event 0.235721
4 trial 0.216535
4 free 0.117861
4 member 0.076746
4 page 0.032891
5 answer 0.371587
5 2nd 0.24305
5 one 0.098155
5 machine 0.070111
5 find 0.053752
6 month 0.399619
6 conflict 0.065691
6 cycle 0.065691
6 seller 0.049268
6 base 0.03832
7 never 0.255261
7 dnc 0.173795
7 asked 0.130346
7 ever 0.043449
7 cooloff 0.038018
8 number 0.731864
8 disconnected 0.041668
8 residence 0.020574
8 disco 0.014696

115
8 replacing 0.014696
9 busy 0.278266
9 signal 0.110147
9 dealer 0.101451
9 line 0.081122
9 place 0.057972
10 upsell 0.076258
10 presented 0.046928
10 rest 0.046928
10 patient 0.041062
10 motivo 0.041062
10 ring 0.041062
11 contract 0.28379
11 interview 0.133924
11 drop 0.098848
11 failed 0.079716
11 sched 0.051019
12 demo 0.306619
12 issue 0.132788
12 able 0.079673
12 bdr 0.050701
12 billing 0.038629
13 fax 0.256085
13 address 0.137477
13 sample 0.097043
13 kit 0.062
13 catalog 0.037739
13 researched 0.037739
14 data 0.387753
14 r-ans 0.040816
14 profiling 0.035714
14 decide 0.035714
14 regional 0.02551
15 per 0.117271
15 possible 0.093923
15 admin: 0.073051
15 transfered 0.073051
15 fedex 0.062615
16 provider 0.137018
16 insurance 0.091345
16 firm 0.076121

116
16 followed 0.068509
16 recently 0.064954
17 agreed 0.256455
17 uses 0.139378
17 ups 0.133802
17 partner 0.122652
17 qbs 0.055751
18 vendor 0.199059
18 corp 0.111667
18 handles 0.082537
18 pre 0.063116
18 production 0.048551
19 3rd 0.276765
19 apt 0.108299
19 third 0.078216
19 existing 0.075038
19 contact) 0.071993
20 confirmed 0.373077
20 name 0.117373
20 accepted 0.060782
20 (retry 0.052398
20 hours) 0.052398
21 llamada 0.164052
21 (campa<f1>a) 0.086343
21 gestor 0.06044
21 solo 0.051929
21 informacion 0.051806
22 por 0.186321
22 quiere 0.11361
22 cliente 0.07597
22 sale: 0.0409
22 cancelation 0.031811
23 follow 0.8773
23 quotes 0.010201
23 bro 0.008161
23 retiring 0.008161
23 ms, 0.008161
24 cancelada: 0.228628
24 monthly 0.150037
24 black 0.050012
24 set- 0.042868

117
24 friday 0.035723
25 app 0.254958
25 ********** 0.195585
25 maybe 0.111763
25 attendance 0.080329
25 pipeline 0.062597
26 use 0.276096
26 approved 0.181972
26 consultation 0.075299
26 entry 0.065886
26 canceled 0.043924
27 training 0.419409
27 eligible 0.071741
27 reference 0.055185
27 truck 0.044148
27 usa 0.044148
27 unknown 0.044148
28 try 0.460122
28 leave 0.165483
28 vm, 0.088796
28 minutes 0.060542
28 em2 0.036325
29 attempt 0.442888
29 submission 0.058146
29 unqualified 0.047736
29 4th 0.037128
29 check- 0.037128
30 registered- 0.310585
30 enviada 0.045176
30 seattle 0.016941
30 apresenta<e7><e3>o 0.016941
30 phi 0.016941
31 cold 0.224912
31 case 0.124419
31 message, 0.07178
31 ... 0.047854
31 delivered 0.033498
31 cro 0.033498
31 resell 0.033498
32 tech 0.137807
32 support 0.08917

118
32 leaders 0.072957
32 (close) 0.072957
32 based 0.064851
32 progress) 0.064851
33 account 0.44515
33 yes- 0.109105
33 callbacks 0.069827
33 international 0.065463
33 corrected 0.056735
34 marketing 0.126381
34 **data 0.081121
34 planning 0.076731
34 lft 0.067704
34 msg 0.06064
35 thanks 0.02352
35 04-Mar 0.017672
35 duplicated 0.01764
35 interest/uncooperative 0.01176
35 printed 0.01176
35 clock 0.01176
35 hostile 0.01176
35 sorti 0.01176
35 modified 0.01176
35 coming-specify 0.01176
35 300 0.01176
36 client 0.662048
36 life 0.072778
36 l.. 0.03052
36 s.d. 0.028172
36 recontacter 0.021129
37 move 0.262761
37 calendar 0.098045
37 fup 0.094123
37 registering 0.054905
37 recieved 0.054905
38 plus 0.139416
38 action 0.123926
38 pour 0.089071
38 package 0.054217
38 rappeler 0.046472
38 artwork 0.046472

119
39 gift 0.22841
39 policy 0.123994
39 single 0.071786
39 students 0.055471
39 many 0.045682
40 register 0.375559
40 live 0.299432
40 unaware 0.035526
40 conversation, 0.035526
40 unsuitable 0.030451
41 email 0.241746
41 sms 0.105296
41 lvm 0.084237
41 influencer 0.075813
41 f/u 0.071602
42 appointment 0.788619
42 multiple 0.035311
42 management 0.026751
42 red 0.020331
42 cell 0.014981
43 order 0.518882
43 placed 0.136985
43 permanent 0.049813
43 previously 0.049396
43 dist 0.012474
44 rep 0.424536
44 paid 0.095637
44 issues 0.079309
44 feedback 0.05365
44 recruiter 0.034989
45 tiene 0.195111
45 otros 0.078044
45 cuenta 0.062471
45 cancelada 0.058533
45 enviado 0.039022
45 movil 0.039022
45 interesado. 0.039022
46 direct 0.212788
46 less 0.106877
46 times 0.091195
46 debit 0.08251

120
46 mandate 0.047769
47 buyer 0.16705
47 producto 0.110101
47 caller 0.075932
47 competencia 0.036766
47 del 0.033995
48 end 0.242825
48 queue 0.214878
48 status 0.147806
48 video 0.031673
48 message- 0.028154
48 moves 0.028154
49 refer 0.403926
49 credit 0.208478
49 subscription 0.048862
49 interest/ 0.026135
49 advance 0.019545
50 interesado 0.086378
50 commission 0.063123
50 interesse 0.056478
50 cita 0.053156
50 recibida 0.049891
51 qualified 0.373976
51 calls 0.087847
51 low 0.085337
51 keep 0.067767
51 incoming 0.042668
52 registered 0.488086
52 donation 0.119629
52 donate 0.028711
52 appropriate 0.028711
52 attending, 0.019141
53 schedule 0.306042
53 presentation 0.158088
53 msg 0.116671
53 complete- 0.085124
53 self 0.054723
54 business 0.372772
54 good 0.182997
54 got 0.162664
54 lead, 0.044055

121
54 ezpay 0.020333
55 tax 0.148003
55 reset 0.115113
55 fiche 0.071261
55 disqualified 0.071261
55 debt 0.060297
56 return 0.244073
56 recibido 0.081358
56 cliente 0.059139
56 activacion 0.050066
56 chase 0.043808
56 getting 0.043808
57 left 0.325028
57 message 0.22957
57 mail 0.175691
57 voice 0.138266
57 final 0.058949
58 show 0.268311
58 rescheduled 0.24498
58 missed 0.10888
58 appoinment 0.038886
58 better 0.023331
59 email 0.185485
59 packet 0.092203
59 aahoa 0.030734
59 tina 0.023051
59 contact/email 0.023051
59 drop/ 0.023051
60 reason 0.193843
60 emailed 0.191358
60 form 0.173962
60 given 0.084496
60 processing 0.047218
61 new 0.494531
61 website 0.092601
61 details 0.066988
61 replacement 0.065018
61 resigned 0.033494
62 wrong 0.517215
62 disconnected 0.1039
62 health 0.059286

122
62 process 0.055197
62 type 0.040887
63 current 0.335026
63 satisfied 0.147484
63 cliente 0.125936
63 services 0.080115
63 desea 0.034595
64 e-mail 0.497212
64 upcoming 0.024861
64 offered 0.024861
64 renter 0.024861
64 autres 0.019888
64 pbp 0.019888
65 working 0.312661
65 already 0.240424
65 speaking 0.075723
65 tomorrow 0.03664
65 sage 0.029312
66 con 0.202917
66 oficina 0.109913
66 promesse 0.101458
66 area 0.076094
66 descontento 0.064821
67 refus 0.200237
67 rendez 0.074598
67 vous 0.074598
67 placement 0.058893
67 sans 0.054967
68 book 0.173783
68 intro 0.167685
68 deal 0.088194
68 sem 0.060976
68 attended 0.060976
69 service 0.259918
69 attending 0.201345
69 agent 0.122637
69 program 0.117146
69 enough 0.040269
70 avec 0.077916
70 refuse 0.057026
70 lender 0.057026

123
70 considering 0.053462
70 autre 0.049988
71 want 0.268228
71 equipment 0.103165
71 bid 0.05674
71 solicita 0.046137
71 cliente 0.027176
72 face 0.328786
72 reschedule 0.311707
72 appt. 0.149448
72 tbc 0.02135
72 passed 0.017763
73 close 0.396874
73 online 0.167908
73 interesa 0.036715
73 uso 0.033582
73 messages 0.024423
74 card 0.241594
74 found 0.208143
74 pledge 0.189559
74 internal 0.059469
74 donated 0.037168
75 attend 0.214959
75 hipaa 0.127729
75 said 0.084114
75 term 0.062307
75 going 0.04673
75 activated 0.04673
76 available 0.412801
76 voice 0.110764
76 mail, 0.095262
76 dropped 0.067477
76 answer, 0.067477
77 wants 0.421102
77 quote 0.183515
77 now 0.144191
77 store 0.048642
77 price 0.045879
78 research 0.24367
78 assign 0.158227
78 leads 0.136075

124
78 someone 0.110759
78 broker 0.056889
79 interested 0.838347
79 products 0.05175
79 unsure 0.018112
79 qualified, 0.007762
79 acquired 0.006469
80 initial 0.105827
80 cancellation 0.071963
80 acct 0.050797
80 solar 0.050797
80 error 0.050797
81 already 0.572208
81 engaged 0.082055
81 second 0.067589
81 push 0.046668
81 local 0.016093
82 call) 0.108045
82 (pre 0.063026
82 deposit 0.063026
82 voicemail/ 0.063026
82 structure 0.063026
83 information 0.404392
83 follow- 0.148515
83 updated 0.144937
83 talked 0.066206
83 contacts 0.042944
84 hour 0.173887
84 erronea 0.040574
84 /call 0.028981
84 persona 0.028981
84 birthday 0.017389
84 disconected 0.017389
84 union 0.017389
85 user 0.305774
85 submitted 0.128564
85 choice 0.104241
85 cash 0.069494
85 fleet 0.048646
86 invalid 0.115327
86 booking 0.105716

125
86 validated 0.100911
86 discuss 0.091301
86 emails 0.086495
87 1st 0.556567
87 mins 0.07951
87 (email) 0.039755
87 hit 0.034076
87 xsell 0.028396
88 full 0.111896
88 added 0.097551
88 code 0.088251
88 put 0.068859
88 speak 0.057383
89 company 0.319997
89 longer 0.288448
89 interested- 0.099154
89 exit 0.022535
89 exists 0.015774
90 refused 0.280306
90 profile 0.225463
90 amp 0.127966
90 courtesy 0.085311
90 strong 0.048749
91 meeting 0.46859
91 financial 0.04546
91 question 0.027976
91 changes 0.024532
91 fuera 0.024479
92 will 0.48024
92 provided 0.06701
92 hung 0.061426
92 consider 0.046535
92 que 0.02606
93 needs 0.484228
93 confirmation 0.13609
93 still 0.085452
93 linkedin 0.075957
93 club 0.025319
94 agreement 0.210339
94 currently 0.210339
94 arrange 0.082633

126
94 customers 0.052585
94 receiving 0.045073
95 otro 0.136507
95 prior 0.122137
95 saved 0.071846
95 engagement 0.071846
95 closing 0.064661
96 yes 0.777832
96 seminar 0.077783
96 load 0.022224
96 study 0.00926
96 pr<e9>sent 0.007408
97 days 0.534604
97 check 0.135029
97 expressed 0.030352
97 interest- 0.030313
97 screen 0.024801
98 warm 0.389559
98 email- 0.102516
98 identified 0.087138
98 annual 0.051258
98 reply 0.041006
98 cards 0.041006
98 client, 0.041006
99 sales 0.313763
99 review 0.185509
99 manager 0.130544
99 passed 0.0546
99 property 0.050385
100 recontact 0.087379
100 w/contact 0.087379
100 now, 0.07767
100 rfq 0.058252
100 qualification 0.058252
101 voicemail 0.523764
101 reached 0.257934
101 eoq 0.036848
101 (contact 0.010528
101 contacting 0.010528
102 general 0.299144
102 returned 0.106275

127
102 discussion 0.059042
102 prospecting 0.051169
102 vc/nc 0.031489
103 make 0.132156
103 rco 0.097681
103 samples 0.074697
103 carrier 0.051713
103 cant 0.051713
104 par 0.187274
104 d<e9>j<e0> 0.077352
104 argumente 0.073281
104 suivi 0.065139
104 validation 0.056997
105 phone 0.622402
105 application 0.135393
105 risk 0.024249
105 works 0.022229
105 nothing 0.018187
106 first 0.200696
106 specific 0.154635
106 give 0.082253
106 kick 0.082253
106 amount 0.072382
107 request 0.341592
107 later 0.142992
107 get 0.067524
107 cancel 0.061566
107 mailed 0.051636
108 record 0.367447
108 attempted 0.097986
108 problem 0.069407
108 cleansed 0.032662
108 evening 0.028579
109 proposal 0.18785
109 lost 0.120988
109 brad 0.055952
109 (cb) 0.047991
109 contact) 0.047977
110 conversation 0.313679
110 owner 0.199278
110 different 0.081187

128
110 connection 0.047974
110 filled 0.047974
111 funds 0.091631
111 legacy 0.04998
111 vin 0.03332
111 north 0.03332
111 south 0.02499
112 signed 0.171617
112 using 0.160021
112 add 0.146106
112 yes, 0.071893
112 refund 0.032468
113 hors 0.137378
113 yet 0.131133
113 cible 0.049955
113 temp 0.049955
113 unhappy 0.037467
114 budget 0.166912
114 immediate 0.087848
114 church 0.074671
114 travel 0.070279
114 met 0.065886
115 timeframe 0.09402
115 box 0.079555
115 mgr 0.06509
115 awaiting 0.057858
115 mo. 0.057858
116 recorded 0.02857
116 achat 0.017142
116 installed 0.017142
116 fait 0.011505
116 1hour 0.011428
116 candidate, 0.011428
116 months. 0.011428
116 non-committal 0.011428
116 vcal 0.011428
116 fax/email 0.011428
116 ignore 0.011428
116 lunch- 0.011428
116 scope 0.011428
116 published 0.011428

129
116 re-send 0.011428
117 needed 0.432083
117 additional 0.168344
117 encouraged 0.067338
117 short 0.03928
117 fourth 0.033669
118 conversion 0.170907
118 titular 0.089523
118 imposible 0.081384
118 duplicado 0.056969
118 contactar 0.048831
119 list 0.411823
119 remove 0.132372
119 attempts 0.091189
119 ownership 0.047065
119 max 0.029416
119 profiled, 0.029416
120 file 0.257511
120 sends 0.193133
120 chaser 0.059426
120 whitepaper 0.034665
120 queue 0.034374
121 email 0.568805
121 sent 0.387593
121 via 0.02417
121 (contact) 0.000879
121 flyer/cb 0.000879
122 set 0.407861
122 time 0.236591
122 date 0.102924
122 interested, 0.041437
122 pitched 0.03208
123 hours 0.488916
123 take 0.191315
123 denied 0.0744
123 apply 0.031886
123 contact/call 0.021257
123 physician 0.021257
124 bond 0.030469
124 precall 0.030469
124 imposibilidad 0.024456

130
124 acudir 0.024375
124 outstanding 0.024375
125 n<e3>o 0.11384
125 vanilla 0.071899
125 problemas 0.059916
125 telefone 0.047933
125 nao 0.041941
125 ocupado 0.041941
126 renewal 0.241016
126 pass 0.107688
126 funded 0.066664
126 stips 0.05128
126 complaint 0.05128
127 interest 0.822528
127 regular 0.024586
127 lit 0.022349
127 conv. 0.011176
127 class 0.008815
128 wrong# 0.113408
128 sur 0.065658
128 eow 0.065658
128 whole 0.041782
128 versement 0.041782
129 faxed 0.099836
129 spanish 0.078442
129 retenida: 0.06418
129 10% 0.060615
129 disc 0.057049
129 descuento 0.057049
130 lead 0.763216
130 hot 0.091671
130 requires 0.024517
130 custom 0.017055
130 months) 0.009593
131 test 0.165486
131 solution 0.126948
131 visita 0.072527
131 fecha 0.047606
131 gestor: 0.040805
132 opportunity 0.337733
132 talk 0.185753

131
132 interest, 0.090062
132 verification 0.084433
132 funding 0.056289
133 rappel 0.300517
133 active 0.189214
133 ste 0.074202
133 secretaire 0.048231
133 indisponible 0.029681
134 payment 0.315112
134 declined 0.252089
134 tecan 0.048477
134 stage 0.038783
134 aca 0.033935
134 doe 0.033935
135 tarjeta 0.291418
135 contrata 0.052807
135 #NAME? 0.033441
135 estado 0.033441
135 cr<e9>dito 0.028664
136 contact, 0.260667
136 appel 0.09413
136 modif 0.065167
136 annule 0.057926
136 retour 0.057926
137 another 0.239257
137 verified 0.200035
137 work 0.133356
137 progress 0.066678
137 reassign 0.0353
138 waiting 0.249851
138 enrollment 0.060309
138 practice 0.056001
138 medical 0.056001
138 doc 0.051693
139 contact 0.947896
139 abr 0.003335
139 locate 0.002501
139 aktualisiert 0.001667
139 availalbe 0.001667
139 mat<e9>riel 0.001667
139 renouvel<e9> 0.001667

132
140 call 0.668159
140 back 0.294812
140 ams 0.005345
140 keeper 0.003289
140 gate 0.002842
141 months 0.33825
141 purchase 0.158648
141 lead- 0.152661
141 plans 0.125721
141 #NAME? 0.029934
142 product 0.24762
142 plan 0.233863
142 invitation 0.072222
142 promo 0.034392
142 successful 0.03282
143 send 0.599803
143 drip 0.134998
143 done 0.084374
143 mos 0.037125
143 chasing 0.015187
144 project 0.172288
144 moved 0.172288
144 school 0.172288
144 won 0.055378
144 forwarded 0.049225
145 contacted 0.494365
145 wish 0.045775
145 (progress) 0.045774
145 previously 0.028383
145 ken 0.027465
145 call-back 0.027465
145 organizer 0.027465
146 admin 0.278759
146 date/time 0.063354
146 thank 0.063354
146 cust. 0.063354
146 task 0.050683
147 weeks 0.249867
147 language 0.079745
147 inquiry 0.063796
147 barrier 0.042531

133
147 coms 0.037214
147 medicare 0.037214
148 group 0.205349
148 forward 0.108078
148 coverage 0.086463
148 early 0.054039
148 hospital 0.054039
149 required 0.296579
149 testing 0.164766
149 consult 0.061199
149 provide 0.051784
149 comment 0.047076
150 calling 0.162332
150 set 0.135073
150 telephone 0.114587
150 statement 0.062068
150 wait 0.047745
150 worth 0.047745
151 rdv 0.194991
151 hrs 0.10928
151 c/b 0.101475
151 ncrt 0.083261
151 touch 0.065048
152 web 0.176953
152 link 0.152545
152 auto 0.146444
152 registration 0.143393
152 resend 0.122036
153 completed 0.35814
153 survey 0.313604
153 duplicate 0.100205
153 rejected 0.044536
153 blocked 0.01299
154 just 0.13357
154 req 0.094792
154 buy 0.073248
154 meet 0.064631
154 today 0.051705
155 booked 0.278685
155 corporate 0.194084
155 referred 0.109483

134
155 location 0.084601
155 inbound 0.074648
156 response 0.197333
156 verify 0.156706
156 old 0.145098
156 negative 0.10447
156 recall 0.10447
157 appt 0.627502
157 set 0.13759
157 ordered 0.073935
157 fly 0.009479
157 tag 0.009408
158 sold 0.524986
158 year 0.141594
158 student 0.050102
158 paperwork 0.02614
158 $199 0.021784
159 week 0.341311
159 sending 0.119253
159 see 0.098692
159 interested-wants 0.03701
159 value 0.032876
160 within 0.192541
160 transferred 0.162456
160 email) 0.120338
160 unreachable 0.114321
160 renew 0.07822
161 pending 0.489814
161 approval 0.089626
161 requests 0.082358
161 opened 0.073689
161 vmail 0.030342
162 need 0.434164
162 person 0.34442
162 source 0.029106
162 correct 0.021829
162 contact/ 0.021829
163 sin 0.067111
163 telefono 0.04945
163 llamar 0.049063
163 cambio 0.045918

135
163 reg 0.038854
164 due 0.119023
164 candidate 0.098619
164 invoice 0.088417
164 gave 0.06842
164 closer 0.064612
165 may 0.142093
165 small 0.099239
165 sign 0.094729
165 sell 0.07443
165 bought 0.065408
166 made 0.416004
166 welcome 0.108371
166 note 0.104875
166 docs 0.076856
166 skipped 0.055933
167 purchased 0.172145
167 recently 0.163199
167 system 0.157556
167 competitor 0.081696
167 enrolled 0.052519
168 email 0.294346
168 send 0.256634
168 merchant 0.159602
168 referral 0.141362
168 sent, 0.02508
169 update 0.219922
169 unable 0.170655
169 stop 0.07226
169 partial 0.069118
169 trying 0.062835
170 high 0.148125
170 empresa 0.0948
170 convert 0.05925
170 cost 0.05925
170 #NAME? 0.0474
170 sub 0.0474
170 std 0.0474
171 dead 0.202397
171 reach 0.195168
171 unavailable 0.122884

136
171 rsvp 0.079513
171 unable 0.067518
172 pitch 0.166129
172 home 0.162518
172 outbound 0.057784
172 session 0.050561
172 competition 0.039727
173 fit 0.195999
173 pay 0.10584
173 step 0.10192
173 sit 0.08624
173 (bdc) 0.07448
174 conference 0.187524
174 x-mailout 0.037505
174 facilitated 0.025003
174 prospects 0.025003
174 pausa 0.018752
175 text 0.216535
175 donor 0.149909
175 deceased 0.055522
175 nrp 0.04997
175 occupe 0.033313
176 transfer 0.488035
176 changed 0.072005
176 employees 0.056004
176 buying 0.056004
176 mark 0.044003
177 day 0.247652
177 retry 0.21163
177 team 0.20375
177 letter 0.061913
177 change 0.043618
178 closed 0.355068
178 skip 0.173911
178 hold 0.090578
178 deja 0.036231
178 delete 0.032608
179 target 0.170378
179 right 0.141981
179 cust 0.102227
179 draft 0.051113

137
179 rebuttal 0.051113
180 outside 0.157218
180 happy 0.120226
180 employee 0.055489
180 criteria 0.046241
180 geo 0.041617
180 mobile 0.041617
181 called 0.378335
181 confirm 0.119678
181 comments 0.088793
181 turn 0.054048
181 large 0.038606
182 nurture 0.168647
182 providers 0.099655
182 issued 0.061326
182 aaron 0.030663
182 region 0.030663
183 last 0.1846
183 result 0.133676
183 contactado 0.070021
183 anyone 0.050924
183 savings 0.038193
184 customer 0.610552
184 previous 0.065861
184 like 0.035601
184 owned 0.02136
184 quality 0.01958
185 cancelled 0.375908
185 incorrect 0.085434
185 taken 0.064075
185 created 0.064075
185 care 0.059804
186 callback 0.778831
186 oui 0.041996
186 coberturas 0.01718
186 exact 0.009545
186 certified 0.007636
187 sponsor 0.102721
187 exhibitor 0.093383
187 vocal 0.05603
187 impossible 0.05603

138
187 joindre 0.037353
188 offer 0.231491
188 notes 0.206799
188 post 0.145068
188 report 0.061731
188 decline 0.046298
189 please 0.247191
189 questions 0.141649
189 profiled 0.091655
189 answered 0.088878
189 explain 0.083323
190 pas 0.314566
190 faux 0.048394
190 car 0.031093
190 cont. 0.02823
190 int<e9>ress<e9> 0.02823
191 accept 0.106556
191 sendout 0.084123
191 gen 0.078515
191 ameriprise 0.050474
191 exchange 0.050474
192 bad 0.399915
192 campaign 0.160622
192 state 0.04917
192 windows 0.039336
192 experience 0.026224
193 received 0.481345
193 bill 0.057597
193 selling 0.057597
193 invoices 0.045255
193 int 0.032912
194 numero 0.140516
194 membership 0.120442
194 renewed 0.080295
194 tel 0.066912
194 promotion 0.046839
195 decision 0.381597
195 maker 0.250012
195 min 0.084214
195 pci 0.060529
195 later, 0.036844

139
195 pricing 0.036844
196 open 0.121817
196 invite 0.110538
196 email, 0.06542
196 market 0.06542
196 qualify 0.063165
196 blind 0.063165
197 non 0.308351
197 visit 0.075781
197 site 0.073168
197 valid 0.062715
197 sup 0.04965
198 incomplete 0.161304
198 listed 0.077665
198 tpv 0.059742
198 oficina: 0.059742
198 condiciones 0.047794
198 o-ans 0.047794
199 sale 0.388343
199 complete 0.2655
199 ready 0.093123
199 activation 0.031701
199 8821 0.023776
200 surveys 0.117598
200 star 0.044099
200 ambassador 0.036749
200 groupe 0.036749
200 d<e9>cision 0.036749
200 telesales 0.036749
201 scheduled 0.520542
201 next 0.209021
201 reminder 0.068334
201 f2f 0.062304
201 179d 0.017268
202 fixed 0.127543
202 prequal 0.070857
202 uninsurable 0.035429
202 9f. 0.035429
202 medicaid 0.035429
203 positive 0.313871
203 followup 0.305612

140
203 renewing 0.082598
203 reason-list 0.049559
203 replied 0.024779
H
Concept Map for Lead Status generated using Leximancer

141
I
Lead Status: Identification of the Stages from Leximancer
No Contact Suspect Prospect Qualified Client
Prospect dead
Waiting
Sent Info
Follow up
Warm
Interested
Qualified
Hot lead
Scheduled phone appt, demo
Cancelled Appointment
Declined
Sold

142
J
Total no. of Concepts Extracted from Lead Status: 36.
Word-Like Count Relevance
lead 194 100%
appointment 147 76%
sold 126 65%
email 119 61%
sent 115 59%
contact 110 57%
info 88 45%
interested 82 42%
appt 80 41%
follow 77 40%
pending 77 40%
dead 76 39%
needs 72 37%
scheduled 70 36%
client 70 36%
customer 63 32%
qualified 53 27%
mail 52 27%
interest 46 24%
send 45 23%
closed 45 23%
completed 45 23%
hot 44 23%
complete 41 21%
waiting 39 20%
training 38 20%
phone 38 20%
admin 38 20%
warm 34 18%
declined 34 18%
request 33 17%
cancelled 32 16%
decision 31 16%
demo 30 15%
card 29 15%
prospect 29 15%

143
K

144
L
Lead Status: Identification of the Stages using LDA in R
No
Contact
Suspect Prospect Qualified Client
Denied
Refuse
Current
Do not
contact
Cold
Dead
Cancel
Prospect
Progress
Decision
maker
Pending
Warm
Potential
Interest
Drip
Send info
Confirmed
Verified
Waiting
Appointment
set
Booked
webinar
Quote requested
Transfer
Hot
Decline
Proposal
Registered
Lost
Pitch
Sold
Retained
Sale
Won

145
M
topic term beta
1 appointment 0.417143
1 set 0.254286
1 working 0.057143
1 show 0.031429
1 sold: 0.025714
2 booked 0.088598
2 intro 0.059065
2 webinar 0.054847
2 fees 0.04219
2 dead- 0.037971
2 register 0.037971
3 future 0.109756
3 needed 0.105691
3 life 0.065041
3 number 0.04878
3 cancel 0.044715
4 attempt 0.091256
4 already 0.087454
4 bad 0.068442
4 pas 0.04943
4 web 0.038023
4 business 0.038023
5 per 0.11245
5 prospect 0.108434
5 denied: 0.108434
5 notification 0.060241
5 low 0.044177
6 non 0.110616
6 made 0.075219
6 lead: 0.070795
6 initial 0.048671
6 past 0.048671
7 call 0.503191
7 application 0.057691
7 post 0.044871
7 progress: 0.041665

146
7 please 0.03205
8 quote 0.113821
8 requested 0.089431
8 account 0.089431
8 step 0.065041
8 unable 0.04878
9 transfer 0.139237
9 data 0.06329
9 android 0.042193
9 stage 0.037974
9 live 0.033754
10 sold 0.326284
10 decision 0.093656
10 left 0.066465
10 maker 0.063444
10 message 0.048338
11 contact 0.527919
11 corp. 0.06599
11 week 0.030457
11 worth 0.020305
11 apt 0.020305
11 next 0.020305
11 rendez 0.020305
11 vous 0.020305
12 mail 0.20749
12 review 0.087146
12 cita 0.087146
12 positivo 0.041498
12 never 0.037348
12 con 0.037348
13 complete 0.138462
13 prev-mix 0.061539
13 rdv 0.057692
13 enrolled 0.046154
13 date 0.038462
13 refus 0.038462
14 fbso 0.177686
14 mix 0.107438
14 will 0.099174
14 available 0.03719
14 rep 0.028926

147
15 pending 0.242424
15 new 0.158249
15 hot 0.138047
15 order 0.087542
15 user 0.074074
16 cancelled 0.12971
16 hours 0.087868
16 retained 0.075316
16 update 0.046026
16 potential 0.041842
17 phone 0.139996
17 warm 0.115997
17 interview 0.083998
17 failed 0.043999
17 first 0.039999
17 fax 0.039999
18 (admin) 0.11194
18 contract 0.100746
18 offer 0.078358
18 days 0.05597
18 accepted 0.048507
19 interest 0.163636
19 deliverable 0.138182
19 vendor 0.069091
19 year 0.065455
19 visit 0.043636
20 qualified 0.199225
20 received 0.109378
20 sale 0.101565
20 test 0.054689
20 credit 0.046876
21 degree 0.077135
21 ready 0.064279
21 voicemail 0.042853
21 decline 0.034282
21 associate 0.034282
21 close 0.034282
21 existing 0.034282
22 prev- 0.238427
22 customer 0.224193
22 yes 0.085407

148
22 letter 0.021352
22 patient 0.017793
23 email 0.419802
23 drip 0.068695
23 online 0.057246
23 pay 0.04198
23 doa 0.038164
24 appt 0.259935
24 sales 0.122747
24 demo 0.104696
24 proposal 0.068594
24 person 0.057763
25 info 0.369099
25 send 0.193133
25 final 0.042918
25 leads 0.038627
25 consult 0.025751
25 pass 0.025751
26 confirmed 0.110204
26 information 0.073469
26 completed: 0.053061
26 schedule 0.028571
26 verified 0.028571
27 client 0.283269
27 closed 0.180262
27 yet 0.04292
27 approval 0.038628
27 won 0.034336
27 account, 0.034336
28 waiting 0.143382
28 completed 0.106618
28 active 0.091912
28 signed 0.051471
28 docs 0.044118
28 survey 0.044118
28 current 0.044118
28 registered 0.044118
29 training 0.142292
29 request 0.130435
29 card 0.114625
29 comm 0.075099

149
29 ordered 0.031621
29 cards 0.031621
30 dead 0.22008
30 declined 0.119692
30 app 0.061777
30 payment 0.054055
30 process 0.050194
31 sent 0.442687
31 time 0.079051
31 approved 0.055336
31 updated 0.055336
31 office 0.031621
32 line 0.230769
32 exp 0.174089
32 registration 0.044534
32 required 0.040486
32 dnc 0.036437
33 interested 0.305344
33 back 0.137405
33 aca 0.087786
33 plan 0.045802
33 quoted 0.034351
34 follow 0.300781
34 service 0.058594
34 program 0.054687
34 month 0.046875
34 follow- 0.035156
35 cold 0.120332
35 meeting 0.107884
35 reached 0.095436
35 wants 0.062241
35 wip 0.045643
36 need 0.106869
36 reschedule 0.079162
36 lost 0.047497
36 verification 0.047497
36 ach 0.043539
37 needs 0.235528
37 company 0.101458
37 hotel 0.094211
37 area. 0.043482

150
37 area 0.036235
38 scheduled 0.264591
38 callback 0.11284
38 contacted 0.085603
38 open 0.054475
38 group 0.035019
39 lead 0.519187
39 rescheduled 0.058999
39 health 0.044249
39 unworkable 0.038349
39 2nd 0.026549
39 pitch 0.026549
N
Qualification Ratio Classes
[0,0.1853933] (0.1853933,0.6086957] (0.6086957,1]
Low Medium High
Prospect Ratio Classes
[0,0.2361111] (0.2361111,0.6513317] (0.6513317,1]
Low Medium High
Suspect Ratio Classes
[0,0.3248945] (0.3248945,0.6308594] (0.6308594,1]
Low Medium High
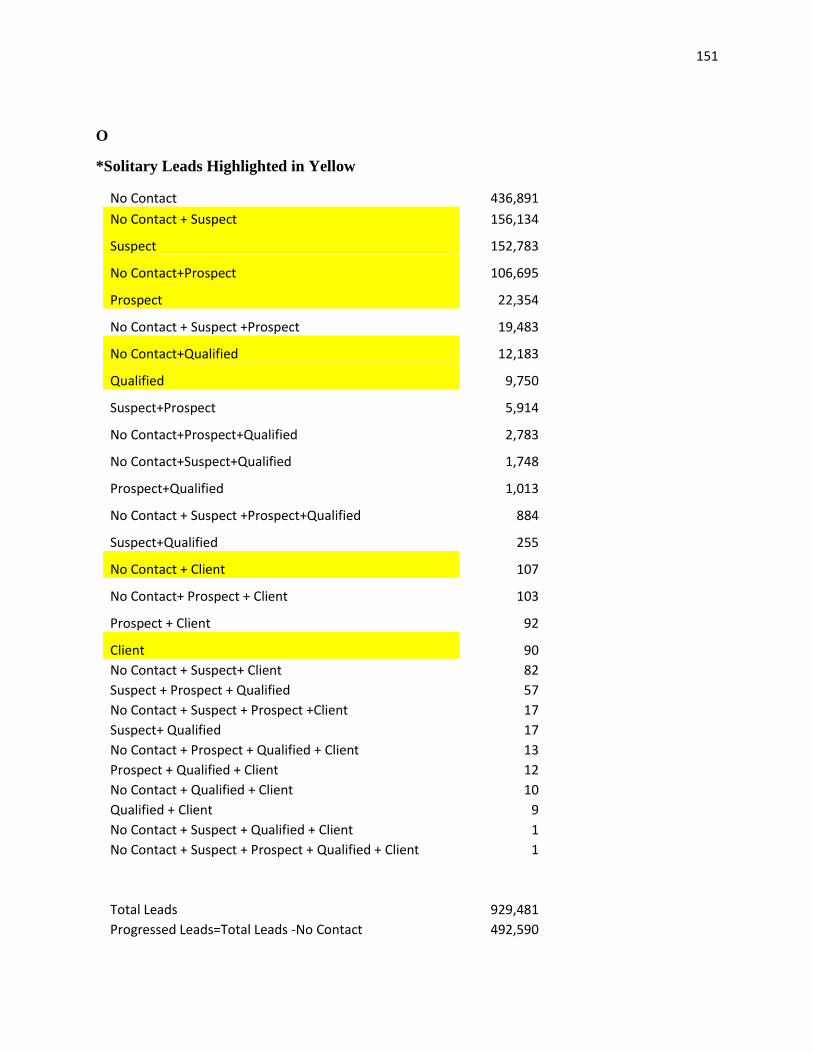
151
O
*Solitary Leads Highlighted in Yellow
No Contact 436,891
No Contact + Suspect 156,134
Suspect 152,783
No Contact+Prospect 106,695
Prospect 22,354
No Contact + Suspect +Prospect 19,483
No Contact+Qualified 12,183
Qualified 9,750
Suspect+Prospect 5,914
No Contact+Prospect+Qualified 2,783
No Contact+Suspect+Qualified 1,748
Prospect+Qualified 1,013
No Contact + Suspect +Prospect+Qualified 884
Suspect+Qualified 255
No Contact + Client 107
No Contact+ Prospect + Client 103
Prospect + Client 92
Client 90
No Contact + Suspect+ Client 82
Suspect + Prospect + Qualified 57
No Contact + Suspect + Prospect +Client 17
Suspect+ Qualified 17
No Contact + Prospect + Qualified + Client 13
Prospect + Qualified + Client 12
No Contact + Qualified + Client 10
Qualified + Client 9
No Contact + Suspect + Qualified + Client 1
No Contact + Suspect + Prospect + Qualified + Client 1
Total Leads 929,481
Progressed Leads=Total Leads -No Contact 492,590

152
Solitary Leads 460,096
Percentage of Progressed Leads that are Solitary Leads 93%
P
Coefficientsa
Model
Correlations Collinearity Statistics
Zero-order Partial Part Tolerance VIF
1 (Constant)
TeamSizeSus .185 -.037 -.036 .158 6.310
TeamExperienceSus -.044 -.027 -.026 .913 1.095
TeamEffortSus .236 .136 .132 .357 2.800
TaskInputSus .085 -.017 -.016 .311 3.215
TeamGoalMonitoringSus .076 -.046 -.044 .586 1.707
SpecificityofRoleSus -.048 -.059 -.057 .958 1.044
RepetitionSus .050 .028 .027 .907 1.103
Intra-
TeamCommunicationSus
.198 .065 .063 .140 7.135
Coefficientsa
Model
Correlations Collinearity Statistics
Zero-order Partial Part Tolerance VIF
1 (Constant)
TeamSizePros .288 -.179 -.135 .182 5.510

153
TeamExperiencePros -.003 .034 .025 .912 1.096
TeamEffortPros .247 .020 .015 .373 2.678
TaskInputPros .295 -.151 -.114 .234 4.267
TeamGoalMonitoringPros .561 .345 .273 .546 1.832
SpecificityofRolePros -.046 -.056 -.042 .939 1.064
RepetitionPros .119 .016 .012 .779 1.283
Intra-
TeamCommunicationPros
.559 .335 .264 .143 7.011
Coefficientsa
Model
Correlations Collinearity Statistics
Zero-order Partial Part Tolerance VIF
1 (Constant)
TeamSizeQual -.085 -.243 -.203 .184 5.433
TeamExperienceQual .197 .125 .102 .867 1.153
TeamEffortQual .087 .270 .227 .401 2.491
TaskInputQual .493 .104 .084 .200 5.004
TeamGoalMonitoringQual -.040 .101 .082 .555 1.801
SpecificityofRoleQual -.112 -.088 -.071 .955 1.047
RepetitionQual -.136 -.074 -.060 .810 1.235
Intra-
TeamCommunicationQual
.425 .178 .146 .173 5.777

154
Q
Likelihood Ratio Tests
Effect
Model Fitting Criteria Likelihood Ratio Tests
AIC of Reduced
Model
BIC of Reduced
Model
-2 Log
Likelihood of
Reduced Model Chi-Square df
Intercept 6822.055 6946.570 6782.055a .000 0
TeamSizeSus 6857.110 6969.174 6821.110 39.055 2
TeamExperienceSus 6822.710 6934.774 6786.710 4.655 2
TeamEffortSus 6933.438 7045.502 6897.438 115.383 2
TaskInputSus 6828.433 6940.497 6792.433 10.378 2
TeamGoalMonitoringSus 6830.232 6942.296 6794.232 12.177 2
SpecificityofRoleSus 6827.954 6940.018 6791.954 9.899 2
RepetitionSus 6898.479 7010.543 6862.479 80.425 2
Intra-
TeamCommunicationSus
6855.156 6967.220 6819.156 37.101 2
Industry 6822.382 6934.446 6786.382 4.327 2
Likelihood Ratio Tests
Effect
Model Fitting Criteria Likelihood Ratio Tests
AIC of Reduced
Model
BIC of Reduced
Model
-2 Log
Likelihood of
Reduced Model Chi-Square df

155
Intercept 1741.273 1855.762 1701.273a .000 0
TeamSizePros 1860.521 1963.561 1824.521 123.248 2
TeamExperiencePros 1759.150 1862.190 1723.150 21.877 2
TeamEffortPros 1799.577 1902.617 1763.577 62.304 2
TaskInputPros 1803.697 1906.737 1767.697 66.424 2
TeamGoalMonitoringPros 2068.985 2172.025 2032.985 331.712 2
SpecificityofRolePros 1746.863 1849.903 1710.863 9.590 2
RepetitionPros 1788.207 1891.247 1752.207 50.934 2
Intra-
TeamCommunicationPros
1955.657 2058.697 1919.657 218.384 2
Industry 1739.863 1842.903 1703.863 2.590 2
Likelihood Ratio Tests
Effect
Model Fitting Criteria Likelihood Ratio Tests
AIC of Reduced
Model
BIC of Reduced
Model
-2 Log
Likelihood of
Reduced Model Chi-Square df
Intercept 1572.790 1682.274 1532.790a .000 0
TeamSizeQual 1633.514 1732.050 1597.514 64.725 2
TeamExperienceQual 1599.944 1698.480 1563.944 31.154 2
TeamEffortQual 1625.855 1724.391 1589.855 57.065 2
TaskInputQual 1584.657 1683.192 1548.657 15.867 2
TeamGoalMonitoringQual 1601.367 1699.902 1565.367 32.577 2
SpecificityofRoleQual 1574.366 1672.902 1538.366 5.576 2
RepetitionQual 1587.621 1686.157 1551.621 18.832 2
Intra-
TeamCommunicationQual
1615.215 1713.751 1579.215 46.425 2

156
Industry 1569.212 1667.747 1533.212 .422 2
R
Case Processing Summary
N
Marginal
Percentage
Suspect Ratio 1 1337 35.8%
2 1857 49.7%
3 542 14.5%
Industry Insurance 10 0.3%
Marketing and Advertising 3726 99.7%
Valid 3736 100.0%
Missing 360
Total 4096
Subpopulation 3734a
a. The dependent variable has only one value observed in 3734 (100.0%)
subpopulations.
Model Fitting Information
Model
Model Fitting Criteria Likelihood Ratio Tests
AIC BIC
-2 Log
Likelihood Chi-Square df Sig.
Intercept Only 7440.719 7453.171 7436.719

157
Final 6822.055 6946.570 6782.055 654.664 18 .000
Pseudo R-Square
Cox and Snell .161
Nagelkerke .186
McFadden .088
Likelihood Ratio Tests
Effect
Likelihood Ratio Tests
Sig.
Intercept .
TeamSizeSus .000
TeamExperienceSus .098
TeamEffortSus .000
TaskInputSus .006
TeamGoalMonitoringSus .002
SpecificityofRoleSus .007
RepetitionSus .000
Intra-TeamCommunicationSus .000
Industry .115

158
Parameter Estimates
Suspect Ratioa B Std. Error Wald df Sig. Exp(B)
2 Intercept 2.050 1.218 2.832 1 .092
TeamSizeSus .125 .058 4.599 1 .032 1.133
TeamExperienceSus -.002 .004 .296 1 .586 .998
TeamEffortSus .237 .048 24.601 1 .000 1.268
TaskInputSus -.026 .029 .776 1 .378 .974
TeamGoalMonitoringSus -.097 .087 1.240 1 .265 .907
SpecificityofRoleSus -3.300 1.170 7.957 1 .005 .037
RepetitionSus .133 .016 66.247 1 .000 1.142
Intra-
TeamCommunicationSus
.038 .019 3.776 1 .052 1.039
[Industry=Insurance] -1.456 1.154 1.593 1 .207 .233
[Industry=Marketing and
Advertising]
0b . . 0 . .
3 Intercept 1.366 1.571 .756 1 .385
TeamSizeSus -.243 .074 10.807 1 .001 .784
TeamExperienceSus -.012 .005 4.531 1 .033 .988
TeamEffortSus .550 .055 100.618 1 .000 1.733
TaskInputSus -.122 .040 9.129 1 .003 .886
TeamGoalMonitoringSus -.402 .118 11.685 1 .001 .669
SpecificityofRoleSus -2.804 1.500 3.494 1 .062 .061
RepetitionSus .078 .022 12.577 1 .000 1.081

159
Intra-
TeamCommunicationSus
.135 .024 31.087 1 .000 1.145
[Industry=Insurance] .294 1.129 .068 1 .794 1.342
[Industry=Marketing and
Advertising]
0b . . 0 . .
S
Case Processing Summary
N
Marginal
Percentage
Prospect Ratio 1 1658 73.3%
2 403 17.8%
3 202 8.9%
Industry Insurance 9 0.4%
Marketing and Advertising 2254 99.6%
Valid 2263 100.0%
Missing 1888
Total 4151
Subpopulation 2260a
Model Fitting Information
Model
Model Fitting Criteria Likelihood Ratio Tests
AIC BIC
-2 Log
Likelihood Chi-Square df Sig.

160
Intercept Only 3402.436 3413.885 3398.436
Final 1741.273 1855.762 1701.273 1697.164 18 .000
Pseudo R-Square
Cox and Snell .528
Nagelkerke .679
McFadden .499
Likelihood Ratio Tests
Effect
Likelihood Ratio Tests
Sig.
Intercept .
TeamSizePros .000
TeamExperiencePros .000
TeamEffortPros .000
TaskInputPros .000
TeamGoalMonitoringPros .000
SpecificityofRolePros .008
RepetitionPros .000
Intra-TeamCommunicationPros .000
Industry .274

161
Parameter Estimates
Prospect Ratioa B Std. Error Wald df Sig.
2 Intercept 1.922 1.619 1.409 1 .235
TeamSizePros -.928 .097 90.743 1 .000
TeamExperiencePros .003 .009 .113 1 .737
TeamEffortPros .283 .044 40.717 1 .000
TaskInputPros -.168 .033 26.335 1 .000
TeamGoalMonitoringPro
s
3.214 .266 145.695 1 .000
SpecificityofRolePros -5.608 1.593 12.396 1 .000
RepetitionPros .140 .025 31.110 1 .000
Intra-
TeamCommunicationPro
s
.217 .022 99.294 1 .000
[Industry=Insurance] 2.426 1.247 3.787 1 .052
[Industry=Marketing and
Advertising]
0b . . 0 .
3 Intercept -1.753 2.238 .614 1 .433
TeamSizePros -.995 .128 60.258 1 .000
TeamExperiencePros .057 .013 18.697 1 .000
TeamEffortPros -.185 .097 3.629 1 .057
TaskInputPros -.331 .044 55.836 1 .000
TeamGoalMonitoringPro
s
3.772 .299 159.247 1 .000
SpecificityofRolePros -3.971 2.127 3.485 1 .062
RepetitionPros .019 .037 .272 1 .602
Intra-
TeamCommunicationPro
s
.338 .028 141.913 1 .000
[Industry=Insurance] -14.529 .000 . 1 .
[Industry=Marketing and
Advertising]
0b . . 0 .
Exp(B)
.395
1.003
1.327
.845
24.875
.004
1.150
1.243
11.313
.
.370
1.059
.831
.718
43.459
.019
1.019
1.403
4.898E-7
.

162
T
Case Processing Summary
N
Marginal
Percentage
Qualification Ratio 1 1345 76.3%
2 310 17.6%
3 107 6.1%
Industry Insurance 9 0.5%
Marketing and Advertising 1753 99.5%
Valid 1762 100.0%
Missing 2358
Total 4120
Subpopulation 1760a
Model Fitting Information
Model
Model Fitting Criteria Likelihood Ratio Tests
AIC BIC
-2 Log
Likelihood Chi-Square df Sig.
Intercept Only 2407.276 2418.224 2403.276
Final 1572.790 1682.274 1532.790 870.486 18 .000
Pseudo R-Square
Cox and Snell .390
Nagelkerke .524
McFadden .362
Likelihood Ratio Tests

163
Effect
Likelihood Ratio Tests
Sig.
Intercept .
TeamSizeQual .000
TeamExperienceQual .000
TeamEffortQual .000
TaskInputQual .000
TeamGoalMonitoringQual .000
SpecificityofRoleQual .062
RepetitionQual .000
Intra-TeamCommunicationQual .000
Industry .810
Parameter Estimates
Qualification Ratioa B Std. Error Wald df Sig. Exp(B)
2 Intercept -.197 1.775 .012 1 .911
TeamSizeQual -.448 .076 34.760 1 .000 .639
TeamExperienceQual .037 .008 23.974 1 .000 1.038
TeamEffortQual .325 .043 58.196 1 .000 1.384
TaskInputQual .120 .031 15.415 1 .000 1.128
TeamGoalMonitoringQual .191 .100 3.630 1 .057 1.210
SpecificityofRoleQual -4.018 1.717 5.476 1 .019 .018
RepetitionQual -.163 .053 9.311 1 .002 .850

164
Intra-
TeamCommunicationQual
.107 .020 29.378 1 .000 1.113
[Industry=Insurance] -.517 .960 .290 1 .590 .596
[Industry=Marketing and
Advertising]
0b . . 0 . .
3 Intercept -.819 2.292 .128 1 .721
TeamSizeQual -1.019 .169 36.355 1 .000 .361
TeamExperienceQual .051 .012 17.837 1 .000 1.052
TeamEffortQual .249 .083 9.031 1 .003 1.283
TaskInputQual .096 .038 6.304 1 .012 1.101
TeamGoalMonitoringQual .941 .154 37.095 1 .000 2.562
SpecificityofRoleQual -3.684 2.113 3.039 1 .081 .025
RepetitionQual -.362 .142 6.513 1 .011 .696
Intra-
TeamCommunicationQual
.166 .027 37.024 1 .000 1.181
[Industry=Insurance] .106 1.418 .006 1 .941 1.112
[Industry=Marketing and
Advertising]
0b . . 0 . .

165
U
Case Processing Summary
Suspect Ratio Valid N (listwise)
Positivea 1857
Negative 1879
Missing 360
Larger values of the test result
variable(s) indicate stronger
evidence for a positive actual state.
a. The positive actual state is 2.
Area Under the Curve
Test Result Variable(s) Area Std. Errora Asymptotic Sig.b
Asymptotic 95% Confidence
Interval
Lower Bound Upper Bound
TeamSizeSus .628 .009 .000 .610 .646
TeamExperienceSus .491 .009 .323 .472 .509
TeamEffortSus .607 .009 .000 .589 .625
TaskInputSus .495 .009 .608 .477 .514
TeamGoalMonitoringSus .543 .009 .000 .524 .561
SpecificityofRoleSus .478 .009 .022 .460 .497
RepetitionSus .624 .009 .000 .606 .642
Intra-
TeamCommunicationSus
.579 .009 .000 .560 .597
Case Processing Summary
Suspect Ratio Valid N (listwise)
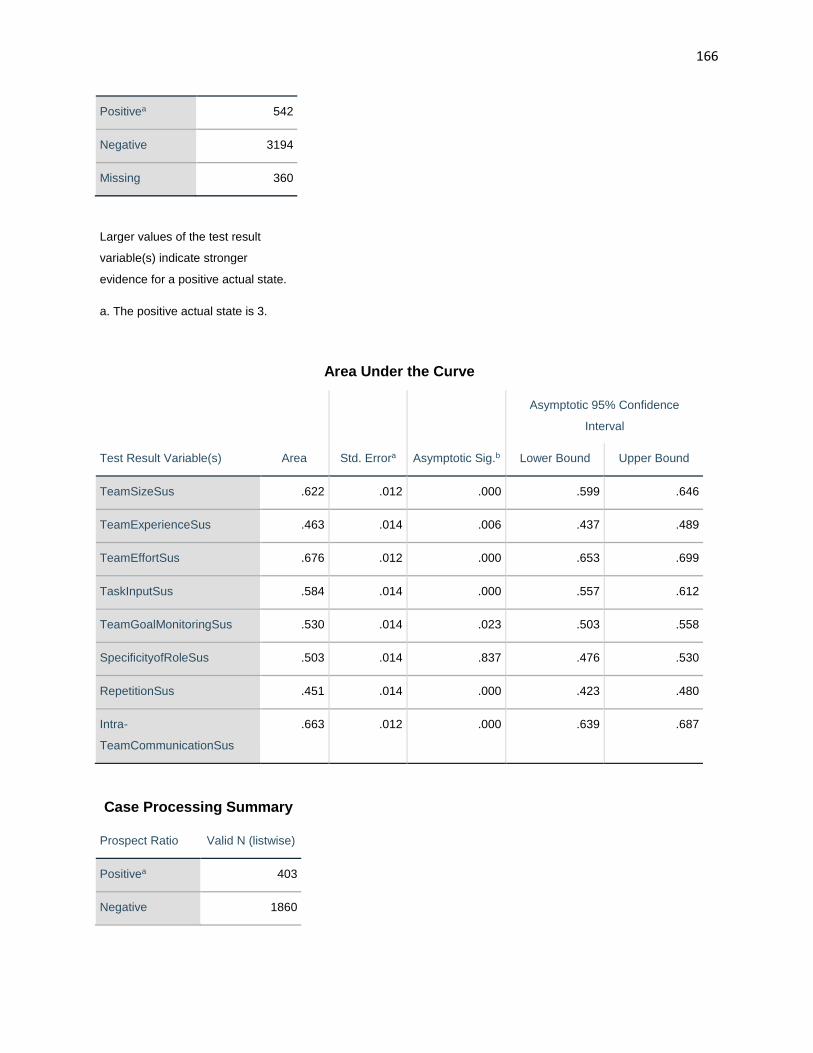
166
Positivea 542
Negative 3194
Missing 360
Larger values of the test result
variable(s) indicate stronger
evidence for a positive actual state.
a. The positive actual state is 3.
Area Under the Curve
Test Result Variable(s) Area Std. Errora Asymptotic Sig.b
Asymptotic 95% Confidence
Interval
Lower Bound Upper Bound
TeamSizeSus .622 .012 .000 .599 .646
TeamExperienceSus .463 .014 .006 .437 .489
TeamEffortSus .676 .012 .000 .653 .699
TaskInputSus .584 .014 .000 .557 .612
TeamGoalMonitoringSus .530 .014 .023 .503 .558
SpecificityofRoleSus .503 .014 .837 .476 .530
RepetitionSus .451 .014 .000 .423 .480
Intra-
TeamCommunicationSus
.663 .012 .000 .639 .687
Case Processing Summary
Prospect Ratio Valid N (listwise)
Positivea 403
Negative 1860

167
Missing 1888
Larger values of the test result
variable(s) indicate stronger
evidence for a positive actual state.
a. The positive actual state is 2.
Area Under the Curve
Test Result Variable(s) Area Std. Errora Asymptotic Sig.b
Asymptotic 95% Confidence
Interval
Lower Bound Upper Bound
TeamSizePros .667 .014 .000 .639 .694
TeamExperiencePros .454 .017 .004 .421 .486
TeamEffortPros .691 .012 .000 .667 .715
TaskInputPros .660 .013 .000 .634 .686
TeamGoalMonitoringPros .822 .011 .000 .799 .844
SpecificityofRolePros .474 .017 .103 .440 .508
RepetitionPros .685 .016 .000 .654 .715
Intra-
TeamCommunicationPros
.795 .011 .000 .774 .817
Case Processing Summary
Prospect Ratio Valid N (listwise)
Positivea 202
Negative 2061
Missing 1888

168
Larger values of the test result
variable(s) indicate stronger
evidence for a positive actual state.
a. The positive actual state is 3.
Area Under the Curve
Test Result Variable(s) Area Std. Errora Asymptotic Sig.b
Asymptotic 95% Confidence
Interval
Lower Bound Upper Bound
TeamSizePros .631 .021 .000 .590 .672
TeamExperiencePros .533 .023 .117 .489 .578
TeamEffortPros .638 .018 .000 .603 .673
TaskInputPros .739 .017 .000 .707 .771
TeamGoalMonitoringPros .885 .010 .000 .865 .905
SpecificityofRolePros .443 .021 .008 .402 .484
RepetitionPros .597 .020 .000 .558 .636
Intra-
TeamCommunicationPros
.830 .016 .000 .800 .861
Case Processing Summary
Qualification Ratio Valid N (listwise)
Positivea 310
Negative 1452
Missing 2358
Larger values of the test result
variable(s) indicate stronger evidence for
a positive actual state.

169
a. The positive actual state is 2.
Area Under the Curve
Test Result Variable(s) Area Std. Errora Asymptotic Sig.b
Asymptotic 95% Confidence
Interval
Lower Bound Upper Bound
TeamSizeQual .478 .016 .228 .447 .509
TeamExperienceQual .619 .018 .000 .584 .653
TeamEffortQual .604 .016 .000 .574 .635
TaskInputQual .825 .012 .000 .801 .849
TeamGoalMonitoringQual .443 .018 .002 .409 .478
SpecificityofRoleQual .456 .017 .014 .422 .489
RepetitionQual .370 .015 .000 .340 .399
Intra-
TeamCommunicationQual
.732 .015 .000 .703 .761
Case Processing Summary
Qualification Ratio Valid N (listwise)
Positivea 107
Negative 1655
Missing 2358
Larger values of the test result
variable(s) indicate stronger evidence for
a positive actual state.
a. The positive actual state is 3.
Area Under the Curve
Test Result Variable(s) Area Std. Errora Asymptotic Sig.b
Asymptotic 95% Confidence
Interval

170
Lower Bound Upper Bound
TeamSizeQual .338 .022 .000 .295 .381
TeamExperienceQual .715 .024 .000 .668 .762
TeamEffortQual .465 .024 .221 .417 .513
TaskInputQual .810 .025 .000 .762 .859
TeamGoalMonitoringQual .542 .026 .141 .491 .593
SpecificityofRoleQual .446 .026 .059 .394 .497
RepetitionQual .222 .024 .000 .175 .268
Intra-
TeamCommunicationQual
.714 .029 .000 .657 .770

171
V
Bootstrap for Parameter Estimates
Suspect Ratio B
Bootstrapa
Bias Std. Error Sig. (2-tailed)
2 Intercept 2.035 .102 1.244 .076
TeamSizeSus .125 .004 .065 .059
TeamExperienceSus -.002 .000 .004 .578
TeamEffortSus .237 -.001 .052 .001
TaskInputSus -.026 -.001 .033 .424
TeamGoalMonitoringSus -.099 -.003 .091 .273
SpecificityofRoleSus -3.285 -.107 1.191 .003
RepetitionSus .133 .001 .019 .001
Intra-
TeamCommunicationSus
.038 .000 .022 .085
[Industry=Insurance] -1.454 1560.037 46437.722 .215
[Industry=Marketing and
Advertising]
0 0 0
3 Intercept 1.351 .128 1.384 .294
TeamSizeSus -.243 .001 .076 .001
TeamExperienceSus -.012 .000 .006 .037
TeamEffortSus .550 .001 .057 .001
TaskInputSus -.122 -.001 .043 .006
TeamGoalMonitoringSus -.403 .005 .122 .001
SpecificityofRoleSus -2.789 -.136 1.315 .020
RepetitionSus .078 -.001 .026 .005

172
Intra-
TeamCommunicationSus
.135 .001 .026 .001
[Industry=Insurance] .296 2.376 7.109 .774
[Industry=Marketing and
Advertising]
0 0 0
Bootstrap for Parameter Estimates
Prospect Ratio B
Bootstrapa
Bias Std. Error Sig. (2-tailed)
2 Intercept 1.997 .882b 2.629b .186b
TeamSizePros -.922 -.018b .121b .001b
TeamExperiencePros .003 .000b .009b .697b
TeamEffortPros .273 .006b .044b .001b
TaskInputPros -.170 -.005b .043b .001b
TeamGoalMonitoringPros 2.938 .072b .406b .001b
SpecificityofRolePros -5.432 -.949b 2.549b .010b
RepetitionPros .149 .002b .024b .001b
Intra-
TeamCommunicationPros
.220 .005b .031b .001b
[Industry=Insurance] 2.235 -6.106b 9.037b .070b
[Industry=Marketing and
Advertising]
0 0b 0b
3 Intercept -1.597 1.005b 2.764b .417b
TeamSizePros -.986 -.027b .136b .001b
TeamExperiencePros .058 .001b .011b .001b
TeamEffortPros -.198 -.003b .097b .046b

173
TaskInputPros -.334 -.013b .049b .001b
TeamGoalMonitoringPros 3.473 .080b .414b .001b
SpecificityofRolePros -3.851 -1.012b 2.648b .070b
RepetitionPros .029 -.004b .034b .394b
Intra-
TeamCommunicationPros
.342 .009b .035b .001b
[Industry=Insurance] -14.813 .297b .843b
[Industry=Marketing and
Advertising]
0 0b 0b
Bootstrap for Parameter Estimates
Qualification Ratio B
Bootstrapa
Bias Std. Error Sig. (2-tailed)
2 Intercept -.140 .161b 1.686b .919b
TeamSizeQual -.455 -.011b .089b .001b
TeamExperienceQual .036 .001b .007b .001b
TeamEffortQual .325 .004b .044b .001b
TaskInputQual .118 .000b .042b .004b
TeamGoalMonitoringQual .205 .001b .110b .056b
SpecificityofRoleQual -4.020 -.179b 1.600b .007b
RepetitionQual -.161 -.010b .057b .005b
Intra-
TeamCommunicationQual
.108 .002b .026b .001b
[Industry=Insurance] -.514 18.773b 632.682b .556b
[Industry=Marketing and
Advertising]
0 0b 0b

174
3 Intercept -.690 .141b 2.085b .685b
TeamSizeQual -1.039 -.041b .186b .001b
TeamExperienceQual .050 -.001b .011b .001b
TeamEffortQual .248 .001b .080b .004b
TaskInputQual .091 -.004b .048b .051b
TeamGoalMonitoringQual .946 .032b .158b .001b
SpecificityofRoleQual -3.698 .008b 1.963b .025b
RepetitionQual -.362 -.063b .265b .104b
Intra-
TeamCommunicationQual
.170 .005b .033b .001b
[Industry=Insurance] .125 -1.963b 113.113b .917b
[Industry=Marketing and
Advertising]
0 0b 0b