the drosophila protein, nausicaa, regulates lamellipodial actin … · the drosophila protein,...
TRANSCRIPT
RESEARCH ARTICLE
The Drosophila protein, Nausicaa, regulates lamellipodial actindynamics in a Cortactin-dependent mannerMeghan E. O’Connell1,2, Divya Sridharan1,3, Tristan Driscoll4, Ipsita Krishnamurthy1, Wick G. Perry1 andDerek A. Applewhite1,*
ABSTRACTDrosophila CG10915 is an uncharacterized protein coding gene withsequence similarity to human Cortactin-binding protein 2 (CTTNBP2)and Cortactin-binding protein 2 N-terminal-like (CTTNBP2NL). Here,we have named this gene Nausicaa (naus) and characterize itthrough a combination of quantitative live-cell total internal reflectionfluorescence microscopy, electron microscopy, RNAi depletion andgenetics. We found that Naus co-localizes with F-actin and Cortactinin the lamellipodia of Drosophila S2R+ and D25c2 cells and thislocalization is lost following Cortactin or Arp2/3 depletion or bymutations that disrupt a conserved proline patch found in itsmammalian homologs. Using permeabilization activated reductionin fluorescence and fluorescence recovery after photobleaching, wefind that depletion of Cortactin alters Naus dynamics leading to adecrease in its half-life. Furthermore, we discovered that Nausdepletion in S2R+ cells led to a decrease in actin retrograde flow anda lamellipodia characterized by long, unbranched filaments. Wedemonstrate that these alterations to the dynamics and underlyingactin architecture also affect D25c2 cell migration and decreasearborization in Drosophila neurons. We present the hypothesis thatNaus functions to slow Cortactin’s disassociation from Arp2/3nucleated branch junctions, thereby increasing both branchnucleation and junction stability.
KEY WORDS: Actin filament dynamics, Cell migration, Cortactin,Cortactin binding proteins
INTRODUCTIONCell migration is critical to a number of physiological processesincluding wound healing and immune function, development,neurogenesis and vascularization. Aberrant cell migration leads to anumber of diseases including schizophrenia and mental disabilities,immunodeficiency, craniofacial disorders andmetastasis (Ridley et al.,2003). Cell migration relies heavily on the actin cytoskeleton, andproceeds in four major steps - protrusion, adhesion, contraction andretraction (Ridley et al., 2003). During the protrusion step of cellmigration, the cell generates twomajor types of actin-based structures:
lamellipodia and filopodia. While filopodia are characterized byparallel, unbranched actin filaments (Svitkina et al., 2003), thelamellipodium is composed of a densely-branched network of actinfilaments forming a sheet-like exploratory organelle (Abercrombieet al., 1970). One protein that defines the lamellipodia is the actin-related protein 2/3 (Arp2/3) complex which generates new branchesfrom the sides of pre-existing filaments resulting in a highly branchedactin network (Machesky et al., 1999; Mullins et al., 1997; Suraneniet al., 2012; Svitkina and Borisy, 1999). It is the addition of actinsubunits (G-actin), spread across the entire expanse of thelamellipodium that leads to protrusion of this organelle. The Arp2/3complex must be activated by proteins known as nucleationpromoting factors (NPFs) in order to nucleate filaments (Macheskyet al., 1999; Prehoda et al., 2000; Zalevsky et al., 2001). NPFs havebeen divided into two types: the WASP/N-WASP and the SCAR/WAVE family of proteins comprise type I NPFs, while Cortactin andthe closely related hematopoetic-specific protein-1 (HS1) comprisetype II NPFs (Goley and Welch, 2006). While type I NFPs generallybind and activate Arp2/3 via a shared VCA (verprolin homology,central, acidic) region, Cortactin and HS1 use an N-terminal acidicregion (NtA) (Goley and Welch, 2006; Weaver et al., 2001).
Cortactin, unlike type I NPFs, can be found integrated within thelamellipodia. Data from fluorescence recovery after photobleaching(FRAP) analysis suggests that it recovers throughout the organelleafter photobleaching rather than just at the leading edge (Lai et al.,2008). Cortactin can bind to both the sides of actin filaments and atArp2/3-generated branch junctions where it is thought to stabilizethem (Weaver et al., 2001). Interestingly, in vitro single-moleculeexperiments determined that Cortactin has a ∼300-fold increasedaffinity for branch junctionsover the sidesof actin filaments, suggestingthe protein preferentially targets these sites (Helgeson and Nolen,2013). Type I NPFs are more potent activators of the Arp2/3 complexthan Cortactin, however the addition of Cortactin to GST-VCA beadsincreased bead motility, suggesting that Cortactin may synergize withtype I NPFs during filament nucleation (Helgeson and Nolen, 2013;Siton et al., 2011; Weaver et al., 2002). Previously, it had been shownthat Cortactin competes with the VCA domain for binding to the Arp3subunit of the Arp2/3 complex, and more recently single-moleculeexperiments from Helgeson and Nolen demonstrate that Cortactinreplaces the VCA domain of type I NPFs during nucleation (Helgesonand Nolen, 2013; Weaver et al., 2001). Thus, it appears that Cortactinboth stimulates the formation of branches while simultaneouslystabilizing them. This type of synergy may allow for continueddendritic nucleation while preventing the potential stalls caused by thetight membrane association of type 1 NPFs (Helgeson and Nolen,2013). An examination of this synergy between type I and type II NPFsremains to be fully investigated in vivo, thus it is unclear how it fits intothe paradigm of lamellipodial protrusion and cell migration.
Overexpression of Cortactin has been associated with increasedmetastasis and invasion in a number of cancers (Åkervall et al.,Received 30 August 2018; Accepted 20 May 2019
1Department of Biology, Reed College, Portland, Oregon 97202, USA. 2Departmentof Molecular Genetics and Cell Biology, University of Chicago, Chicago, Illinois60637, USA. 3Department of Biology, BostonCollege, Chestnut Hill, Massachusetts02467, USA. 4Department of Cardiovascular Medicine, Yale University, NewHaven, Connecticut 06511, USA.
*Author for correspondence ([email protected])
T.D., 0000-0002-2426-5551; D.A.A., 0000-0002-2431-0316
This is an Open Access article distributed under the terms of the Creative Commons AttributionLicense (https://creativecommons.org/licenses/by/4.0), which permits unrestricted use,distribution and reproduction in any medium provided that the original work is properly attributed.
1
© 2019. Published by The Company of Biologists Ltd | Biology Open (2019) 8, bio038232. doi:10.1242/bio.038232
BiologyOpen
by guest on May 21, 2020http://bio.biologists.org/Downloaded from
1995; Buday and Downward, 2007; Hirakawa et al., 2009;Kirkbride et al., 2011; Rothschild et al., 2006; Weaver, 2008; Xuet al., 2010). In support of this, overexpression of Cortactin in NIH3T3 cells led to an increase in motility and invasiveness. Similarly,overexpression of Cortactin in breast cancer cells led to increasedmetastasis in nude mice (Patel et al., 1998). RNAi experiments inHT1080 cells suggest that Cortactin enhances lamellipodialpersistence, and both the Arp2/3 and F-actin binding sites ofCortactin were required for this persistence (Bryce et al., 2005).Cortactin depletion also led to a decrease in the rate of adhesionformation, however, given the importance of lamellipodia to theformation of nascent adhesions, it may be difficult to uncouple thesephenotypes (Bryce et al., 2005; Wu et al., 2012). Interestingly,studies from Lai and colleagues, which used cells-derivedCortactin-knockout mice, found few differences between thelamellipodia of Cortactin-null and wild-type fibroblasts. Theyobserved a slight decrease in the assembly of actin in lamellipodia ofCortactin-null fibroblasts, as well as a decrease in the speeds ofrandom cell migration and wound healing in scratch-wound assays.They also observed defects in PDGF-stimulated actin re-organization (Lai et al., 2009). These seemingly contradictoryfindings suggest that Cortactin’s role in lamellipodial organizationand actin dynamics still remains ill-defined.Cortactin also localizes to other parts of the cell where dynamic
actin assembly occurs including endosomes, podosomes,invadopodia and the dendritic spines of neurons (Ammer andWeed, 2008; Buday and Downward, 2007; MacGrath and Koleske,2012; Ren et al., 2009). Coincident with Cortactin at some of thesesites of dynamic actin are two Cortactin-binding proteins, Cortactin-binding protein 2 (CTTNBP2) and Cortactin-binding proteinN-terminal-like (CTTNBP2NL or CortBP2NL).Human CTTNBP2, coded for by the CTTNBP2 gene, is found
primarily in neurons. CTTNBP2 interacts with the C-terminal SH3domain of Cortactin (Ohoka and Takai, 1998) and previous studieshave demonstrated that CTTNBP2 co-localizes with both Cortactinand actin at lamellipodia. CTTNBP2 depletion in rat hippocampalneurons decreased the width and density of dendritic spines,suggesting that CTTNBP2 plays a role alongside with Cortactin indendritic spine maintenance (Chen and Hsueh, 2012). Additionally,before dendritic spine formation, CTTNBP2 associates withmicrotubules through its central region and oligomerizes throughits N-terminal region coiled-coil motif. CTTNBP2 oligomers boundto microtubules promotes microtubule bundle formation and tubulinacetylation (Shih et al., 2014).Much less is known about CTTNBP2NL, and a clear cellular
function for the protein has yet to be fully elucidated. CTTNBP2NLis found in epithelial, spleen and liver cells and unlike CTTNBP2,CTTNBP2NL does not associate at the cell cortex, but instead canbe found on actin stress fibers where it can redistribute Cortactin tothese structures (Chen et al., 2012). Interestingly, in rat hippocampalneurons, exogenous CTTNBP2NL is unable to rescue the effects ofCTTNBP2 depletion on dendritic spine morphology (Chen et al.,2012), indicating that the two proteins are not functionally similar inthe context of mammalian dendritic spine morphology. GivenCortactin’s widespread expression, CTTNBP2NL may very wellplay important roles in other dynamic actin-based structures in non-neuronal cell types. Drosophila CG10915 is an uncharacterizedprotein-coding gene that shows amino acid sequence similarity toCTTNBP2 and CTTNBP2NL. CG10915 is expressed ubiquitouslythroughout the larval and adult fly, with higher expression levels inthe central nervous system and ovaries (Gelbart and Emmert, 2013).Here, we investigate the role of CG10915 in Drosophila to
determine its role in actin dynamics. We demonstrate that theDrosophila gene CG10915 [hereafter referred to as Nausicaa(naus)] alters lamellipodial and protrusive actin dynamics inmigratory cells and neurons in a Cortactin-dependent manner.
RESULTSBioinformatic queries indicated that theDrosophilaCG10915 locusat cytological position 55B9 was a potential homolog of humanFilamin-A interacting protein due to it sharing approximately 20%identity. Further refinement of these queries (Clustal OmegaMultiple Sequence Alignment, Goujon et al., 2010; Sievers et al.,2011) indicated that CG10915 is similar to human CTTNBP2NLand CTTNBP2 sharing approximately 30 and 28% identity,respectively (Fig. S1). We have subsequently named CG10915,the putative Drosophila homolog of CTTNBP2 and CTTNBP2NL,naus, after the princess in Homer’s The Odyssey, who helps toensure Odysseus’s safe passage home from Phaeacia. Naus has twosplice variants (cg10915-A and cg10915-B), which vary in lengthin their 3′ and 5′-untranslated regions, however each encodes for anidentical polypeptide 609 amino acids in length. The highest degreeof conservation between Naus, CTTNBP2 and CTTNBP2NLoccurs in the coiled-coil motif found within the N-terminalCortactin-binding protein (CortBP2) domain. Furthermore, thethree proteins also share a highly conserved proline-rich patchlocated near their C-termini that has been shown to facilitate theinteraction between Cortactin and CTTNBP2 in COS cells (Fig. S1)(Chen et al., 2012).
Naus localizes to lamellipodia of S2R+ cells in a Cortactin-dependent mannerWe first assessed the localization of EGFP-tagged Naus by live-cellimaging of Drosophila S2R+ cells using total internal reflectionfluorescence (TIRF) microscopy (Fig. 1A, Movie 1). Interestingly,we observed an enrichment of Naus in the circumferentiallamellipodia of these cells which persisted following fixation(data not shown) and when we extracted the cells with detergentprior to fixation (Fig. 1B). This circumferential lamellipodiallocalization can also be observed by spinning disk confocalmicroscopy (Fig. S2A,B). We next investigated whether Nauslocalized to other actin-based structures. Drosophila S2R+ cells donot form prominent stress fibers, however, ML-DmD25c2 (D25)cells, which are derived from third instar imaginal wing discs,readily form these structures. We co-expressed EGFP-tagged Nauswith mCherry-Alpha-actinin to mark stress fibers and actin bundles,and observed Naus weakly localizing to these structures as well(Fig. S3A). Furthermore, much like our results from S2R+ cells,we also observed lamellipodial enrichment of Naus in D25 cells(Fig. S3B). Interestingly, while CTTNBP2NL can also be foundco-localizing to microtubules in COS cells (Chen et al., 2012), wefailed to observe any colocalization between Naus and microtubulesin either S2R+ or D25 cells under these conditions (data not shown).Collectively, these results suggest that Naus behaves similarly toboth CTTNBP2 and CTTNBP2NL, localizing to both thelamellipodia and bundled actin structures.
Given the potential interaction between Naus and DrosophilaCortactin (CG3637), we next tested whether this lamellipodialenrichment in S2R+ cells is Cortactin-dependent. While it has beendemonstrated that mammalian CTTNBP2 and CTTNBP2NLinteracts with Cortactin, the role Cortactin plays in this interactionis unclear. Using two independent dsRNA sequences, we depletedCortactin (Fig. S4A) and expressed EGFP-tagged Naus andobserved a distinct loss on Naus’s lamellipodial localization
2
RESEARCH ARTICLE Biology Open (2019) 8, bio038232. doi:10.1242/bio.038232
BiologyOpen
by guest on May 21, 2020http://bio.biologists.org/Downloaded from
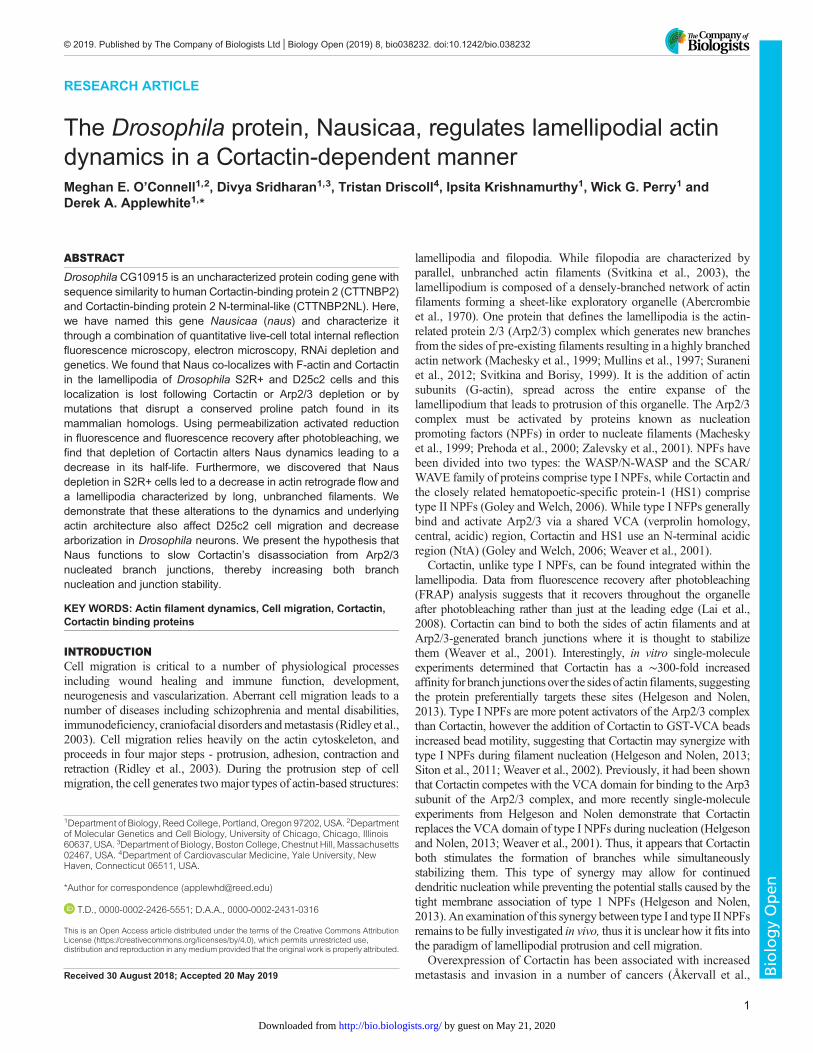
(Fig. 1C, Movie 1). This loss in enrichment was even more evidentin cells that were detergent extracted prior to fixation (Fig. 1D).Line-scan analysis where we compared control RNAi-treated cellsto cells treated with either Cortactin dsRNAs or in combination,further corroborated this change in localization (Fig. 1E). Toquantify this change, we used Mander’s coefficient and measuredthe fraction of Naus overlapping with F-actin (stained byfluorescently labeled phalloidin) following Cortactin depletionand found a statistically significant decrease in the amount ofNaus overlapping with actin, further supporting that Naus’sassociation with actin cytoskeleton is Cortactin-dependent (Bolteand Cordelieres, 2006) (Fig. 1G,H). This differs from CTTNBP2where upon Cortactin re-distribution, CTTNBP2 does not re-localize in neurons suggesting a Cortactin-independent mechanismof localization for this potential Naus homolog (Chen and Hsueh,2012). Given that Cortactin interacts with Arp2/3 complex at thelamellipodia (Uruno et al., 2001), we depleted the p20 subunit ofArp2/3 complex by RNAi and observed a similar loss oflocalization to the periphery of the cells (Fig. S5). Collectively,these results suggest that Naus is enriched in the lamellipodia andthat this enrichment to actin structures is Cortactin-dependent.Given that Naus’s lamellipodial localization is Cortactin-
dependent, we next wanted to characterize the relationshipbetween the two proteins. We co-expressed Naus-EGFP withmyc-tagged Cortactin in S2R+ cells and again used Mander’scoefficient to determine the degree of overlap between theseproteins (Fig. 2A,B,D). The Mander’s coefficient revealed that just
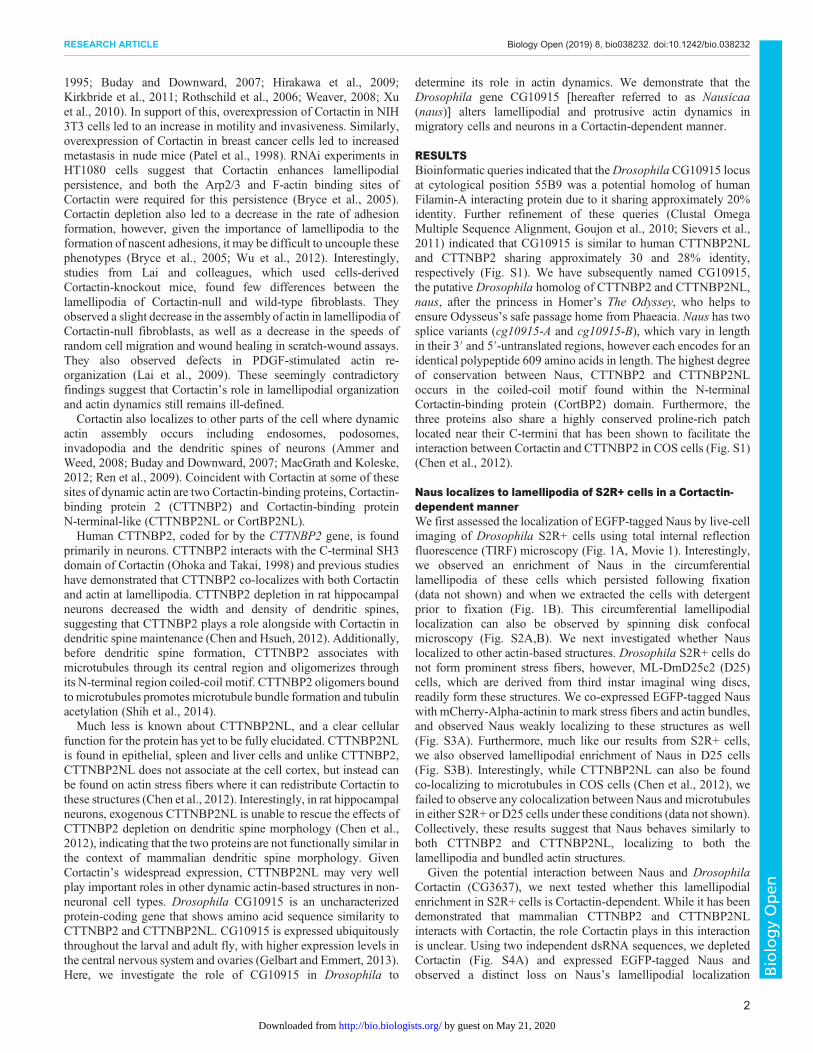
over 50% of myc-Cortactin overlapped with Naus-EGFP whilenearly 80% of Naus overlapped with Cortactin. This asymmetry inco-localization, which was statistically significant (Student’s t-test,P<0.0001), suggests that while not all of the Cortactin in the cell isassociated with Naus, the majority of the Naus in the cell can befound overlapping with Cortactin. This supports the hypothesisthat Naus relies on Cortactin for proper localization. Naus, likeCTTNBP2 and CTTNBP2NL, has a proline-rich patch (PPPIP) thatwas previously shown to be required for Cortactin binding (Fig. S1)(Chen et al., 2012). To further elucidate the relationship betweenNaus and Drosophila Cortactin we mutated all of these prolineresidues (amino acid positions 563–567) to alanine and expressedan EGFP-tagged version (Naus-AAAIA) in S2R+ cells (Fig. 2C).Our initial observations indicated that rather than a specificlocalization to actin-based structures, Naus-AAAIA appeared tobe distributed non-specifically throughout the cell which a patternsimilar to what we observe when we expressed untagged-EGFP inthese cells (Fig. 2C,E, Fig. S2C,D). Line-scan analysis corroboratesthis observation revealing distinct loss in lamellipodial-enrichedNaus when these residues are mutated (Fig. 2F). This loss is similarto the loss of lamellipodial enrichment we observed followingCortactin RNAi (Fig. 1C). When we quantified the amount ofcolocalization by Mander’s coefficient, we observed a statisticallysignificant decrease in the amount of overlap between Naus-AAAIA and Cortactin further supporting the observation that thisproline patch is facilitating the interaction between Naus andCortactin (Fig. 2B,D). Similar to what we observed in S2R+ cells,
Fig. 1. Naus’s lamellipodial localization is Cortactin-dependent. (A,B) Control RNAi-treated S2R+ cells transfected with Naus-EGFP (left, green inmerged image) and mCherry-Actin (middle, red in the merged image) imaged live (A) or extracted stained for F-actin (middle, red in the merged image) (B).(C,D) Cortactin RNAi-treated S2R+ cells transfected with Naus-EGFP (left, green in the merged images) and mCherry-Actin (middle, red in the mergedimage) imaged live (C) or extracted cells stained for (middle, red in the merged images) F-actin (D). Scale bar: 10 µm. (E) Line-scan analysis of thelamellipodial distribution of Naus-EGFP in fixed S2R+ cells treated with control RNAi (black circles) or Cortactin RNAi from two independent RNAi targets(open gray circles or squares) or the combination of the two targets (open gray triangles). Inset is the corresponding averaged normalized actin fluorescence.Error bars denote s.e.m. (F) Line-scan analysis of the lamellipodial distribution of Naus-EGFP in extracted cells following control RNAi (black circles) ortreatment with two independent Cortactin RNAi targets (open gray circles or squares) or the combination of the two (open gray triangles). Inset is thecorresponding averaged normalized actin fluorescence. Error bars denote s.e.m. (G) Mander’s coefficient of the fraction of overlap between Naus-EGFP andF-actin stained by phalloidin. Cells were treated with control RNAi (black circles) or one of two Cortactin RNAi targets (open black circles or squares) or thecombination of the two (open black triangles). Error bars show s.e.m., n=30–45 cells per condition; P<0.0001, Student’s t-test). (H) Mander’s coefficientquantifying the amount of overlap between Naus-EGFP and F-actin as visualized by phalloidin in extracted cells. Control RNAi is shown in black circles,Cortactin RNAi (from two independent targets) is shown in open black circles or squares and the combination of the two Cortactin RNAi targets is shown inopen black triangles. Error bars show s.e.m., n=40–50 cells per condition; P<0.0001, Student’s t-test.
3
RESEARCH ARTICLE Biology Open (2019) 8, bio038232. doi:10.1242/bio.038232
BiologyOpen
by guest on May 21, 2020http://bio.biologists.org/Downloaded from
EGFP-tagged Naus-AAAIA failed to localize specifically to actinstructures in D25 cells (Fig. S3C). These results suggest that Naus,like its mammalian counterparts, interacts with Cortactin throughthis conserved proline patch, but uniquely, requires Cortactin forproper localization. Interestingly, while we failed to observemicrotubule localization in cells expressing wild-type EGFP-Naus, on occasion we did observe EGFP-tagged Naus-AAAIAco-localizing with microtubules in both S2R+ and D25 cells(Fig. S3D). It is likely that under conditions where its affinity forCortactin is reduced, Naus may bind microtubules. While moredetailed analysis of this microtubule localization is needed, we feelthat this is beyond the scope of this current study.Given this dependence on Cortactin for its lamellipodial
localization, we next sought to determine if Naus’s dynamics arealtered in the absence of Cortactin. We first used permeabilizationactivated reduction in fluorescence (PARF) to measure the loss ofNaus-EGFP fluorescence following control or Cortactin RNAitreatments (Fig. 3). PARF uses a low concentration of digitonin togently permeabilize cells leading to a large-scale dilution of theunbound pool of protein and a disruption of the initial equilibriumof the bound protein. The subsequent decrease in fluorescence canbe fit to a two-phase exponential decay model which can be used to
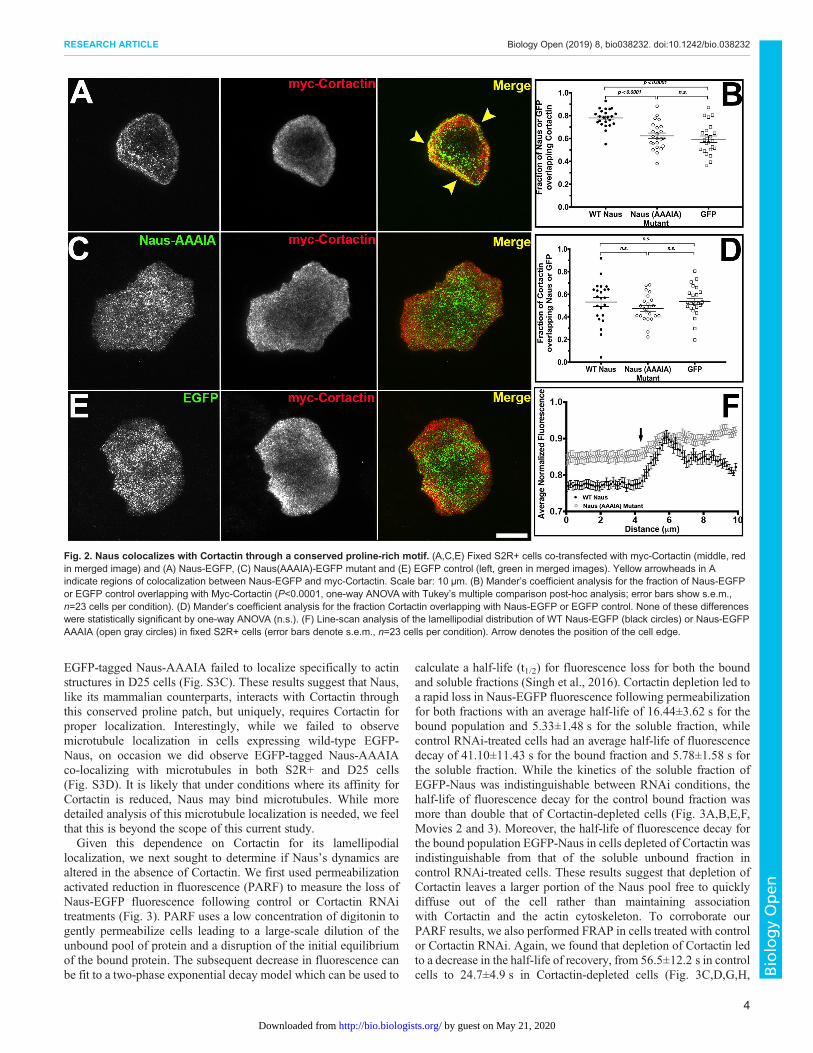
calculate a half-life (t1/2) for fluorescence loss for both the boundand soluble fractions (Singh et al., 2016). Cortactin depletion led toa rapid loss in Naus-EGFP fluorescence following permeabilizationfor both fractions with an average half-life of 16.44±3.62 s for thebound population and 5.33±1.48 s for the soluble fraction, whilecontrol RNAi-treated cells had an average half-life of fluorescencedecay of 41.10±11.43 s for the bound fraction and 5.78±1.58 s forthe soluble fraction. While the kinetics of the soluble fraction ofEGFP-Naus was indistinguishable between RNAi conditions, thehalf-life of fluorescence decay for the control bound fraction wasmore than double that of Cortactin-depleted cells (Fig. 3A,B,E,F,Movies 2 and 3). Moreover, the half-life of fluorescence decay forthe bound population EGFP-Naus in cells depleted of Cortactin wasindistinguishable from that of the soluble unbound fraction incontrol RNAi-treated cells. These results suggest that depletion ofCortactin leaves a larger portion of the Naus pool free to quicklydiffuse out of the cell rather than maintaining associationwith Cortactin and the actin cytoskeleton. To corroborate ourPARF results, we also performed FRAP in cells treated with controlor Cortactin RNAi. Again, we found that depletion of Cortactin ledto a decrease in the half-life of recovery, from 56.5±12.2 s in controlcells to 24.7±4.9 s in Cortactin-depleted cells (Fig. 3C,D,G,H,
Fig. 2. Naus colocalizes with Cortactin through a conserved proline-rich motif. (A,C,E) Fixed S2R+ cells co-transfected with myc-Cortactin (middle, redin merged image) and (A) Naus-EGFP, (C) Naus(AAAIA)-EGFP mutant and (E) EGFP control (left, green in merged images). Yellow arrowheads in Aindicate regions of colocalization between Naus-EGFP and myc-Cortactin. Scale bar: 10 µm. (B) Mander’s coefficient analysis for the fraction of Naus-EGFPor EGFP control overlapping with Myc-Cortactin (P<0.0001, one-way ANOVA with Tukey’s multiple comparison post-hoc analysis; error bars show s.e.m.,n=23 cells per condition). (D) Mander’s coefficient analysis for the fraction Cortactin overlapping with Naus-EGFP or EGFP control. None of these differenceswere statistically significant by one-way ANOVA (n.s.). (F) Line-scan analysis of the lamellipodial distribution of WT Naus-EGFP (black circles) or Naus-EGFPAAAIA (open gray circles) in fixed S2R+ cells (error bars denote s.e.m., n=23 cells per condition). Arrow denotes the position of the cell edge.
4
RESEARCH ARTICLE Biology Open (2019) 8, bio038232. doi:10.1242/bio.038232
BiologyOpen
by guest on May 21, 2020http://bio.biologists.org/Downloaded from
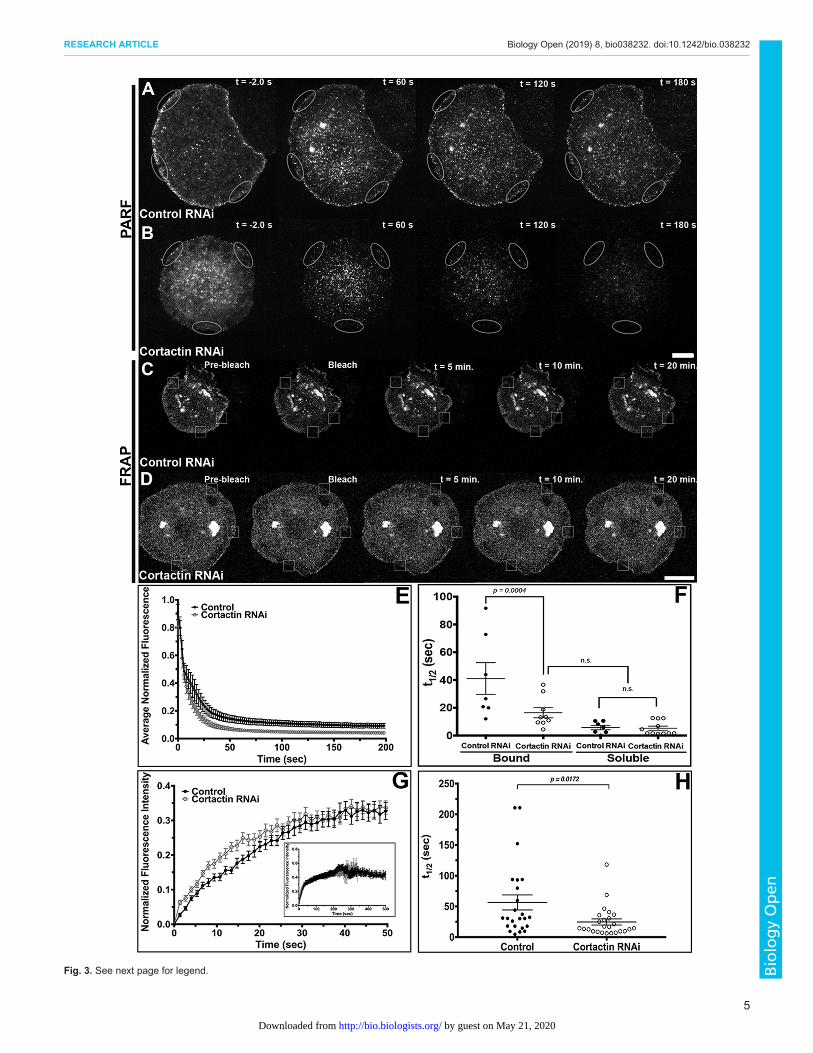
Fig. 3. See next page for legend.
5
RESEARCH ARTICLE Biology Open (2019) 8, bio038232. doi:10.1242/bio.038232
BiologyOpen
by guest on May 21, 2020http://bio.biologists.org/Downloaded from
Movies 4 and 5). Similar to our PARF results, our FRAPexperiments suggest that in the presence of Cortactin, Naus ismore stably associated with the cytoskeleton leading to a slowerhalf-life of recovery as compared to Cortactin-depleted cells.Collectively, these results indicate that Cortactin may function asan anchor, helping Naus maintain lamellipodial localization.While our results indicate that Cortactin affects Naus’s dynamics,
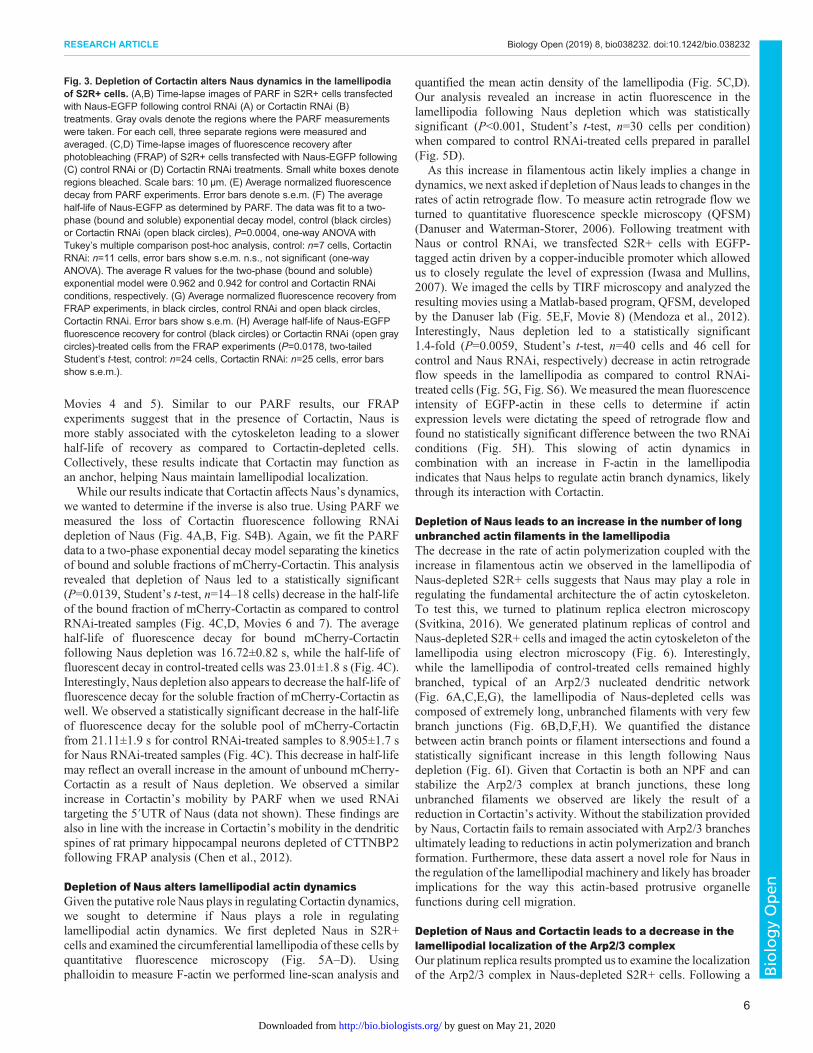
we wanted to determine if the inverse is also true. Using PARF wemeasured the loss of Cortactin fluorescence following RNAidepletion of Naus (Fig. 4A,B, Fig. S4B). Again, we fit the PARFdata to a two-phase exponential decay model separating the kineticsof bound and soluble fractions of mCherry-Cortactin. This analysisrevealed that depletion of Naus led to a statistically significant(P=0.0139, Student’s t-test, n=14–18 cells) decrease in the half-lifeof the bound fraction of mCherry-Cortactin as compared to controlRNAi-treated samples (Fig. 4C,D, Movies 6 and 7). The averagehalf-life of fluorescence decay for bound mCherry-Cortactinfollowing Naus depletion was 16.72±0.82 s, while the half-life offluorescent decay in control-treated cells was 23.01±1.8 s (Fig. 4C).Interestingly, Naus depletion also appears to decrease the half-life offluorescence decay for the soluble fraction of mCherry-Cortactin aswell. We observed a statistically significant decrease in the half-lifeof fluorescence decay for the soluble pool of mCherry-Cortactinfrom 21.11±1.9 s for control RNAi-treated samples to 8.905±1.7 sfor Naus RNAi-treated samples (Fig. 4C). This decrease in half-lifemay reflect an overall increase in the amount of unbound mCherry-Cortactin as a result of Naus depletion. We observed a similarincrease in Cortactin’s mobility by PARF when we used RNAitargeting the 5′UTR of Naus (data not shown). These findings arealso in line with the increase in Cortactin’s mobility in the dendriticspines of rat primary hippocampal neurons depleted of CTTNBP2following FRAP analysis (Chen et al., 2012).
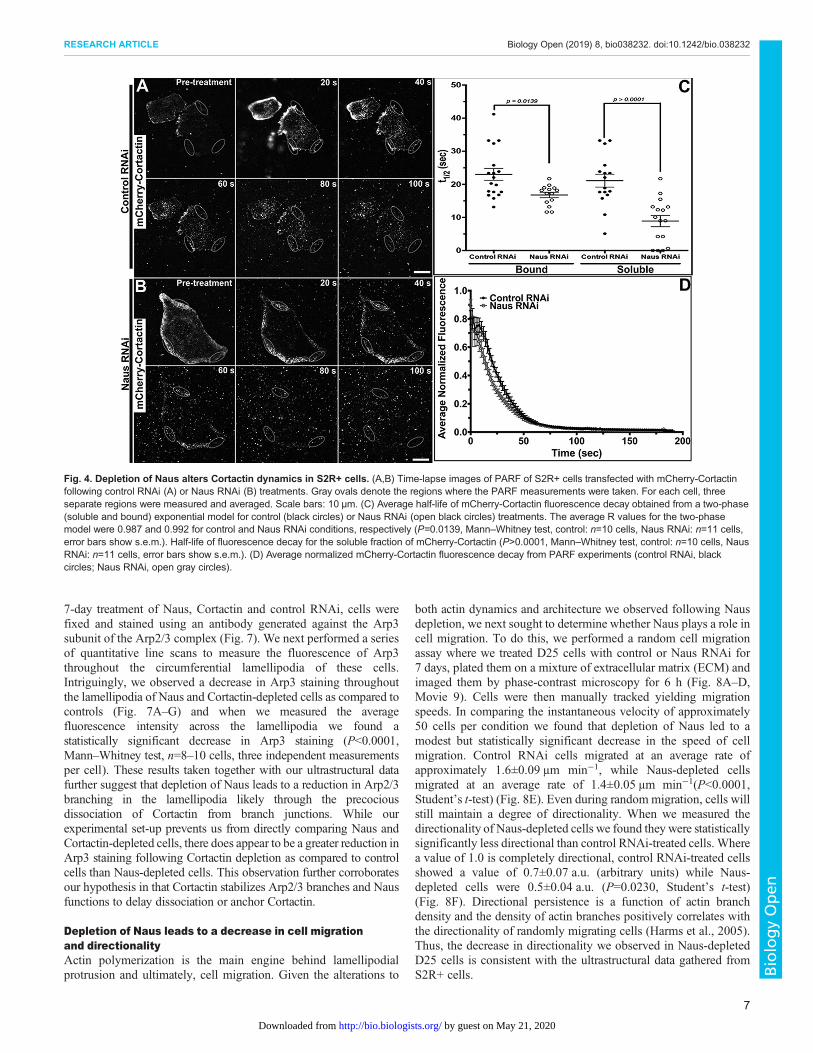
Depletion of Naus alters lamellipodial actin dynamicsGiven the putative role Naus plays in regulating Cortactin dynamics,we sought to determine if Naus plays a role in regulatinglamellipodial actin dynamics. We first depleted Naus in S2R+cells and examined the circumferential lamellipodia of these cells byquantitative fluorescence microscopy (Fig. 5A–D). Usingphalloidin to measure F-actin we performed line-scan analysis and
quantified the mean actin density of the lamellipodia (Fig. 5C,D).Our analysis revealed an increase in actin fluorescence in thelamellipodia following Naus depletion which was statisticallysignificant (P<0.001, Student’s t-test, n=30 cells per condition)when compared to control RNAi-treated cells prepared in parallel(Fig. 5D).
As this increase in filamentous actin likely implies a change indynamics, we next asked if depletion of Naus leads to changes in therates of actin retrograde flow. To measure actin retrograde flow weturned to quantitative fluorescence speckle microscopy (QFSM)(Danuser and Waterman-Storer, 2006). Following treatment withNaus or control RNAi, we transfected S2R+ cells with EGFP-tagged actin driven by a copper-inducible promoter which allowedus to closely regulate the level of expression (Iwasa and Mullins,2007). We imaged the cells by TIRF microscopy and analyzed theresulting movies using a Matlab-based program, QFSM, developedby the Danuser lab (Fig. 5E,F, Movie 8) (Mendoza et al., 2012).Interestingly, Naus depletion led to a statistically significant1.4-fold (P=0.0059, Student’s t-test, n=40 cells and 46 cell forcontrol and Naus RNAi, respectively) decrease in actin retrogradeflow speeds in the lamellipodia as compared to control RNAi-treated cells (Fig. 5G, Fig. S6). We measured the mean fluorescenceintensity of EGFP-actin in these cells to determine if actinexpression levels were dictating the speed of retrograde flow andfound no statistically significant difference between the two RNAiconditions (Fig. 5H). This slowing of actin dynamics incombination with an increase in F-actin in the lamellipodiaindicates that Naus helps to regulate actin branch dynamics, likelythrough its interaction with Cortactin.
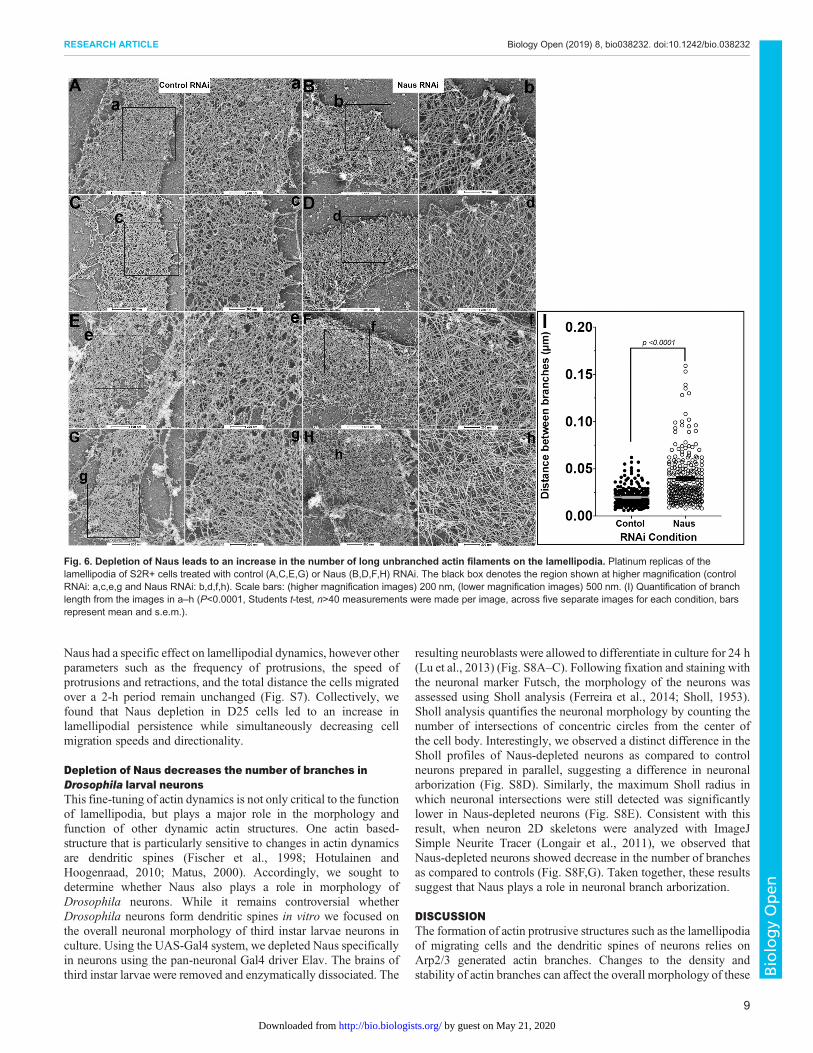
Depletion of Naus leads to an increase in the number of longunbranched actin filaments in the lamellipodiaThe decrease in the rate of actin polymerization coupled with theincrease in filamentous actin we observed in the lamellipodia ofNaus-depleted S2R+ cells suggests that Naus may play a role inregulating the fundamental architecture the of actin cytoskeleton.To test this, we turned to platinum replica electron microscopy(Svitkina, 2016). We generated platinum replicas of control andNaus-depleted S2R+ cells and imaged the actin cytoskeleton of thelamellipodia using electron microscopy (Fig. 6). Interestingly,while the lamellipodia of control-treated cells remained highlybranched, typical of an Arp2/3 nucleated dendritic network(Fig. 6A,C,E,G), the lamellipodia of Naus-depleted cells wascomposed of extremely long, unbranched filaments with very fewbranch junctions (Fig. 6B,D,F,H). We quantified the distancebetween actin branch points or filament intersections and found astatistically significant increase in this length following Nausdepletion (Fig. 6I). Given that Cortactin is both an NPF and canstabilize the Arp2/3 complex at branch junctions, these longunbranched filaments we observed are likely the result of areduction in Cortactin’s activity. Without the stabilization providedby Naus, Cortactin fails to remain associated with Arp2/3 branchesultimately leading to reductions in actin polymerization and branchformation. Furthermore, these data assert a novel role for Naus inthe regulation of the lamellipodial machinery and likely has broaderimplications for the way this actin-based protrusive organellefunctions during cell migration.
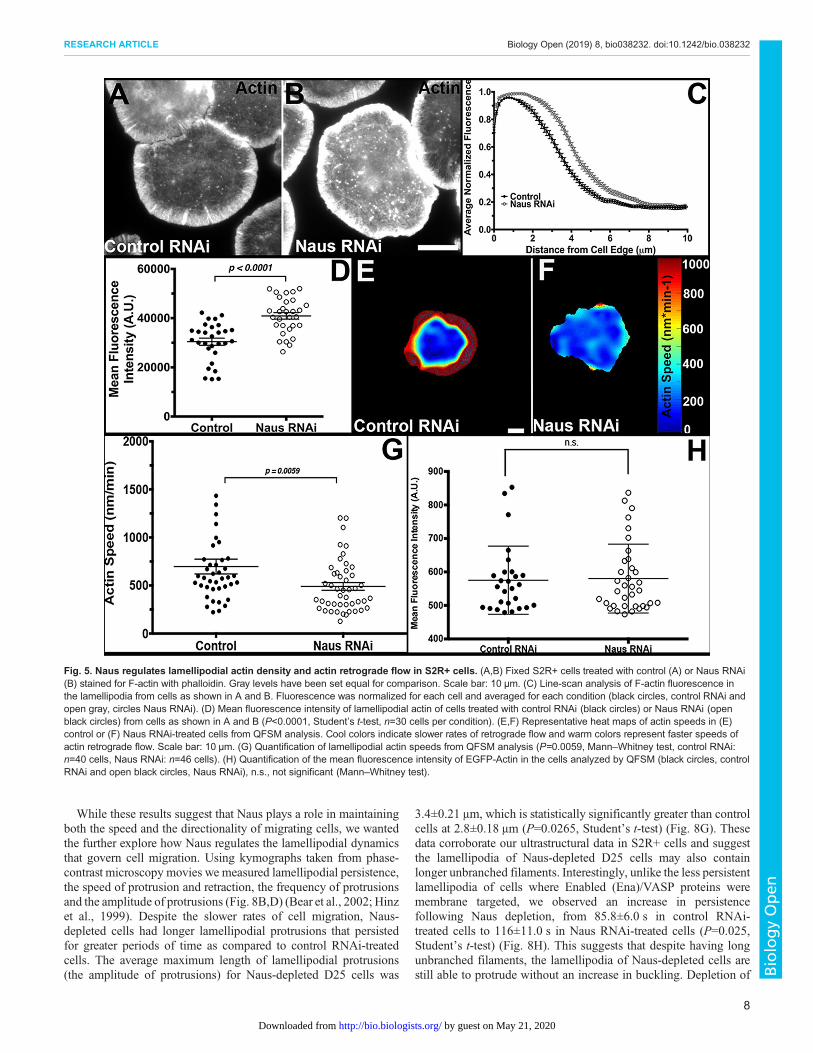
Depletion of Naus and Cortactin leads to a decrease in thelamellipodial localization of the Arp2/3 complexOur platinum replica results prompted us to examine the localizationof the Arp2/3 complex in Naus-depleted S2R+ cells. Following a
Fig. 3. Depletion of Cortactin alters Naus dynamics in the lamellipodiaof S2R+ cells. (A,B) Time-lapse images of PARF in S2R+ cells transfectedwith Naus-EGFP following control RNAi (A) or Cortactin RNAi (B)treatments. Gray ovals denote the regions where the PARF measurementswere taken. For each cell, three separate regions were measured andaveraged. (C,D) Time-lapse images of fluorescence recovery afterphotobleaching (FRAP) of S2R+ cells transfected with Naus-EGFP following(C) control RNAi or (D) Cortactin RNAi treatments. Small white boxes denoteregions bleached. Scale bars: 10 µm. (E) Average normalized fluorescencedecay from PARF experiments. Error bars denote s.e.m. (F) The averagehalf-life of Naus-EGFP as determined by PARF. The data was fit to a two-phase (bound and soluble) exponential decay model, control (black circles)or Cortactin RNAi (open black circles), P=0.0004, one-way ANOVA withTukey’s multiple comparison post-hoc analysis, control: n=7 cells, CortactinRNAi: n=11 cells, error bars show s.e.m. n.s., not significant (one-wayANOVA). The average R values for the two-phase (bound and soluble)exponential model were 0.962 and 0.942 for control and Cortactin RNAiconditions, respectively. (G) Average normalized fluorescence recovery fromFRAP experiments, in black circles, control RNAi and open black circles,Cortactin RNAi. Error bars show s.e.m. (H) Average half-life of Naus-EGFPfluorescence recovery for control (black circles) or Cortactin RNAi (open graycircles)-treated cells from the FRAP experiments (P=0.0178, two-tailedStudent’s t-test, control: n=24 cells, Cortactin RNAi: n=25 cells, error barsshow s.e.m.).
6
RESEARCH ARTICLE Biology Open (2019) 8, bio038232. doi:10.1242/bio.038232
BiologyOpen
by guest on May 21, 2020http://bio.biologists.org/Downloaded from
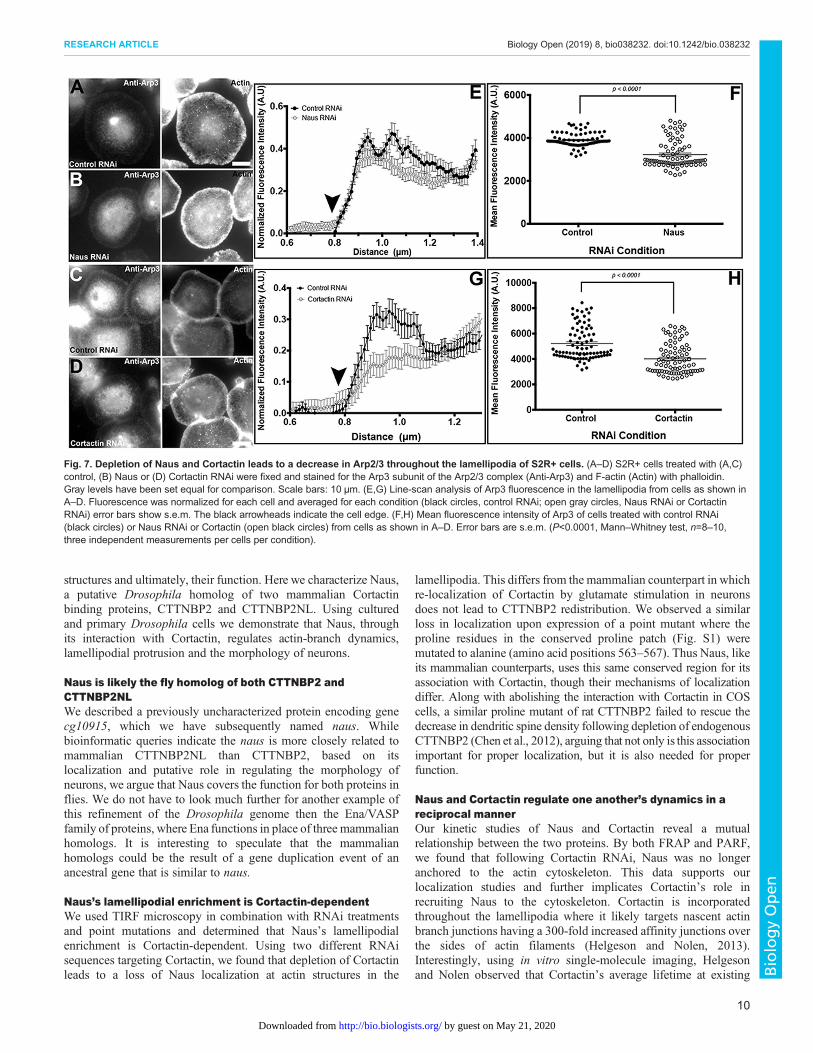
7-day treatment of Naus, Cortactin and control RNAi, cells werefixed and stained using an antibody generated against the Arp3subunit of the Arp2/3 complex (Fig. 7). We next performed a seriesof quantitative line scans to measure the fluorescence of Arp3throughout the circumferential lamellipodia of these cells.Intriguingly, we observed a decrease in Arp3 staining throughoutthe lamellipodia of Naus and Cortactin-depleted cells as compared tocontrols (Fig. 7A–G) and when we measured the averagefluorescence intensity across the lamellipodia we found astatistically significant decrease in Arp3 staining (P<0.0001,Mann–Whitney test, n=8–10 cells, three independent measurementsper cell). These results taken together with our ultrastructural datafurther suggest that depletion of Naus leads to a reduction in Arp2/3branching in the lamellipodia likely through the precociousdissociation of Cortactin from branch junctions. While ourexperimental set-up prevents us from directly comparing Naus andCortactin-depleted cells, there does appear to be a greater reduction inArp3 staining following Cortactin depletion as compared to controlcells than Naus-depleted cells. This observation further corroboratesour hypothesis in that Cortactin stabilizes Arp2/3 branches and Nausfunctions to delay dissociation or anchor Cortactin.
Depletion of Naus leads to a decrease in cell migrationand directionalityActin polymerization is the main engine behind lamellipodialprotrusion and ultimately, cell migration. Given the alterations to
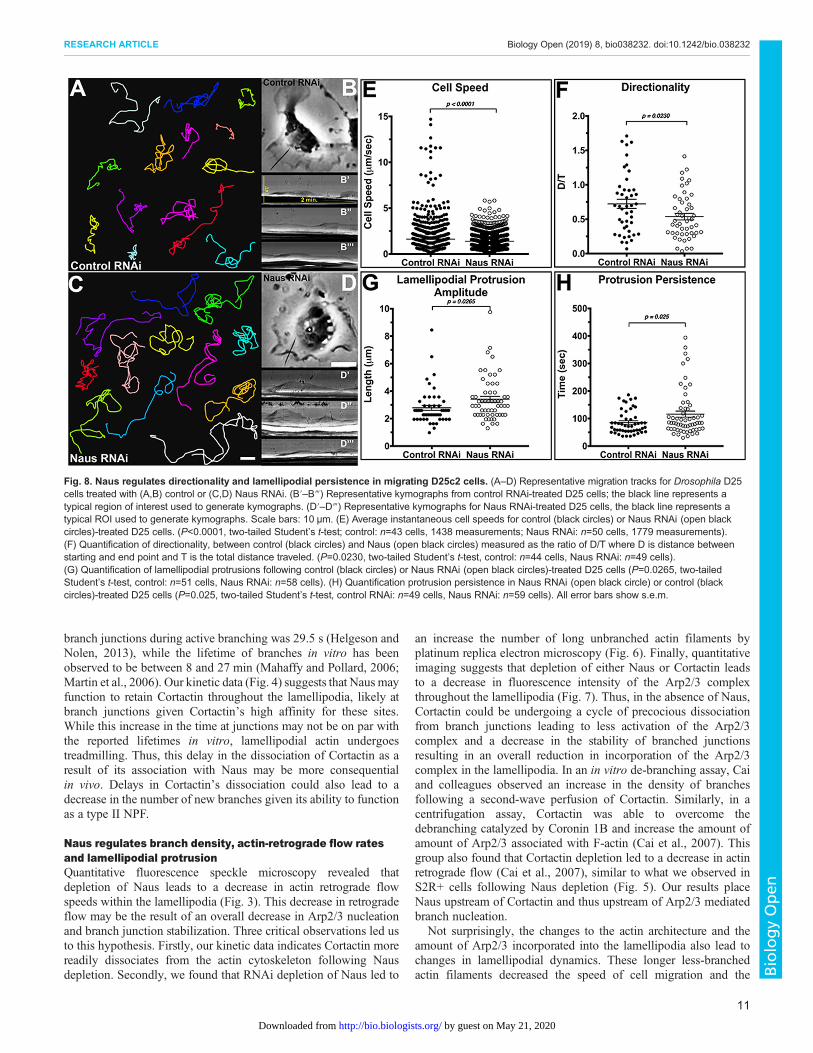
both actin dynamics and architecture we observed following Nausdepletion, we next sought to determine whether Naus plays a role incell migration. To do this, we performed a random cell migrationassay where we treated D25 cells with control or Naus RNAi for7 days, plated them on a mixture of extracellular matrix (ECM) andimaged them by phase-contrast microscopy for 6 h (Fig. 8A–D,Movie 9). Cells were then manually tracked yielding migrationspeeds. In comparing the instantaneous velocity of approximately50 cells per condition we found that depletion of Naus led to amodest but statistically significant decrease in the speed of cellmigration. Control RNAi cells migrated at an average rate ofapproximately 1.6±0.09 μm min−1, while Naus-depleted cellsmigrated at an average rate of 1.4±0.05 μm min−1(P<0.0001,Student’s t-test) (Fig. 8E). Even during random migration, cells willstill maintain a degree of directionality. When we measured thedirectionality of Naus-depleted cells we found they were statisticallysignificantly less directional than control RNAi-treated cells. Wherea value of 1.0 is completely directional, control RNAi-treated cellsshowed a value of 0.7±0.07 a.u. (arbitrary units) while Naus-depleted cells were 0.5±0.04 a.u. (P=0.0230, Student’s t-test)(Fig. 8F). Directional persistence is a function of actin branchdensity and the density of actin branches positively correlates withthe directionality of randomly migrating cells (Harms et al., 2005).Thus, the decrease in directionality we observed in Naus-depletedD25 cells is consistent with the ultrastructural data gathered fromS2R+ cells.
Fig. 4. Depletion of Naus alters Cortactin dynamics in S2R+ cells. (A,B) Time-lapse images of PARF of S2R+ cells transfected with mCherry-Cortactinfollowing control RNAi (A) or Naus RNAi (B) treatments. Gray ovals denote the regions where the PARF measurements were taken. For each cell, threeseparate regions were measured and averaged. Scale bars: 10 µm. (C) Average half-life of mCherry-Cortactin fluorescence decay obtained from a two-phase(soluble and bound) exponential model for control (black circles) or Naus RNAi (open black circles) treatments. The average R values for the two-phasemodel were 0.987 and 0.992 for control and Naus RNAi conditions, respectively (P=0.0139, Mann–Whitney test, control: n=10 cells, Naus RNAi: n=11 cells,error bars show s.e.m.). Half-life of fluorescence decay for the soluble fraction of mCherry-Cortactin (P>0.0001, Mann–Whitney test, control: n=10 cells, NausRNAi: n=11 cells, error bars show s.e.m.). (D) Average normalized mCherry-Cortactin fluorescence decay from PARF experiments (control RNAi, blackcircles; Naus RNAi, open gray circles).
7
RESEARCH ARTICLE Biology Open (2019) 8, bio038232. doi:10.1242/bio.038232
BiologyOpen
by guest on May 21, 2020http://bio.biologists.org/Downloaded from
While these results suggest that Naus plays a role in maintainingboth the speed and the directionality of migrating cells, we wantedthe further explore how Naus regulates the lamellipodial dynamicsthat govern cell migration. Using kymographs taken from phase-contrast microscopy movies we measured lamellipodial persistence,the speed of protrusion and retraction, the frequency of protrusionsand the amplitude of protrusions (Fig. 8B,D) (Bear et al., 2002; Hinzet al., 1999). Despite the slower rates of cell migration, Naus-depleted cells had longer lamellipodial protrusions that persistedfor greater periods of time as compared to control RNAi-treatedcells. The average maximum length of lamellipodial protrusions(the amplitude of protrusions) for Naus-depleted D25 cells was
3.4±0.21 μm, which is statistically significantly greater than controlcells at 2.8±0.18 μm (P=0.0265, Student’s t-test) (Fig. 8G). Thesedata corroborate our ultrastructural data in S2R+ cells and suggestthe lamellipodia of Naus-depleted D25 cells may also containlonger unbranched filaments. Interestingly, unlike the less persistentlamellipodia of cells where Enabled (Ena)/VASP proteins weremembrane targeted, we observed an increase in persistencefollowing Naus depletion, from 85.8±6.0 s in control RNAi-treated cells to 116±11.0 s in Naus RNAi-treated cells (P=0.025,Student’s t-test) (Fig. 8H). This suggests that despite having longunbranched filaments, the lamellipodia of Naus-depleted cells arestill able to protrude without an increase in buckling. Depletion of
Fig. 5. Naus regulates lamellipodial actin density and actin retrograde flow in S2R+ cells. (A,B) Fixed S2R+ cells treated with control (A) or Naus RNAi(B) stained for F-actin with phalloidin. Gray levels have been set equal for comparison. Scale bar: 10 µm. (C) Line-scan analysis of F-actin fluorescence inthe lamellipodia from cells as shown in A and B. Fluorescence was normalized for each cell and averaged for each condition (black circles, control RNAi andopen gray, circles Naus RNAi). (D) Mean fluorescence intensity of lamellipodial actin of cells treated with control RNAi (black circles) or Naus RNAi (openblack circles) from cells as shown in A and B (P<0.0001, Student’s t-test, n=30 cells per condition). (E,F) Representative heat maps of actin speeds in (E)control or (F) Naus RNAi-treated cells from QFSM analysis. Cool colors indicate slower rates of retrograde flow and warm colors represent faster speeds ofactin retrograde flow. Scale bar: 10 µm. (G) Quantification of lamellipodial actin speeds from QFSM analysis (P=0.0059, Mann–Whitney test, control RNAi:n=40 cells, Naus RNAi: n=46 cells). (H) Quantification of the mean fluorescence intensity of EGFP-Actin in the cells analyzed by QFSM (black circles, controlRNAi and open black circles, Naus RNAi), n.s., not significant (Mann–Whitney test).
8
RESEARCH ARTICLE Biology Open (2019) 8, bio038232. doi:10.1242/bio.038232
BiologyOpen
by guest on May 21, 2020http://bio.biologists.org/Downloaded from
Naus had a specific effect on lamellipodial dynamics, however otherparameters such as the frequency of protrusions, the speed ofprotrusions and retractions, and the total distance the cells migratedover a 2-h period remain unchanged (Fig. S7). Collectively, wefound that Naus depletion in D25 cells led to an increase inlamellipodial persistence while simultaneously decreasing cellmigration speeds and directionality.
Depletion of Naus decreases the number of branches inDrosophila larval neuronsThis fine-tuning of actin dynamics is not only critical to the functionof lamellipodia, but plays a major role in the morphology andfunction of other dynamic actin structures. One actin based-structure that is particularly sensitive to changes in actin dynamicsare dendritic spines (Fischer et al., 1998; Hotulainen andHoogenraad, 2010; Matus, 2000). Accordingly, we sought todetermine whether Naus also plays a role in morphology ofDrosophila neurons. While it remains controversial whetherDrosophila neurons form dendritic spines in vitro we focused onthe overall neuronal morphology of third instar larvae neurons inculture. Using the UAS-Gal4 system, we depleted Naus specificallyin neurons using the pan-neuronal Gal4 driver Elav. The brains ofthird instar larvae were removed and enzymatically dissociated. The
resulting neuroblasts were allowed to differentiate in culture for 24 h(Lu et al., 2013) (Fig. S8A–C). Following fixation and staining withthe neuronal marker Futsch, the morphology of the neurons wasassessed using Sholl analysis (Ferreira et al., 2014; Sholl, 1953).Sholl analysis quantifies the neuronal morphology by counting thenumber of intersections of concentric circles from the center ofthe cell body. Interestingly, we observed a distinct difference in theSholl profiles of Naus-depleted neurons as compared to controlneurons prepared in parallel, suggesting a difference in neuronalarborization (Fig. S8D). Similarly, the maximum Sholl radius inwhich neuronal intersections were still detected was significantlylower in Naus-depleted neurons (Fig. S8E). Consistent with thisresult, when neuron 2D skeletons were analyzed with ImageJSimple Neurite Tracer (Longair et al., 2011), we observed thatNaus-depleted neurons showed decrease in the number of branchesas compared to controls (Fig. S8F,G). Taken together, these resultssuggest that Naus plays a role in neuronal branch arborization.
DISCUSSIONThe formation of actin protrusive structures such as the lamellipodiaof migrating cells and the dendritic spines of neurons relies onArp2/3 generated actin branches. Changes to the density andstability of actin branches can affect the overall morphology of these
Fig. 6. Depletion of Naus leads to an increase in the number of long unbranched actin filaments on the lamellipodia. Platinum replicas of thelamellipodia of S2R+ cells treated with control (A,C,E,G) or Naus (B,D,F,H) RNAi. The black box denotes the region shown at higher magnification (controlRNAi: a,c,e,g and Naus RNAi: b,d,f,h). Scale bars: (higher magnification images) 200 nm, (lower magnification images) 500 nm. (I) Quantification of branchlength from the images in a–h (P<0.0001, Students t-test, n>40 measurements were made per image, across five separate images for each condition, barsrepresent mean and s.e.m.).
9
RESEARCH ARTICLE Biology Open (2019) 8, bio038232. doi:10.1242/bio.038232
BiologyOpen
by guest on May 21, 2020http://bio.biologists.org/Downloaded from
structures and ultimately, their function. Here we characterize Naus,a putative Drosophila homolog of two mammalian Cortactinbinding proteins, CTTNBP2 and CTTNBP2NL. Using culturedand primary Drosophila cells we demonstrate that Naus, throughits interaction with Cortactin, regulates actin-branch dynamics,lamellipodial protrusion and the morphology of neurons.
Naus is likely the fly homolog of both CTTNBP2 andCTTNBP2NLWe described a previously uncharacterized protein encoding genecg10915, which we have subsequently named naus. Whilebioinformatic queries indicate the naus is more closely related tomammalian CTTNBP2NL than CTTNBP2, based on itslocalization and putative role in regulating the morphology ofneurons, we argue that Naus covers the function for both proteins inflies. We do not have to look much further for another example ofthis refinement of the Drosophila genome then the Ena/VASPfamily of proteins, where Ena functions in place of three mammalianhomologs. It is interesting to speculate that the mammalianhomologs could be the result of a gene duplication event of anancestral gene that is similar to naus.
Naus’s lamellipodial enrichment is Cortactin-dependentWe used TIRF microscopy in combination with RNAi treatmentsand point mutations and determined that Naus’s lamellipodialenrichment is Cortactin-dependent. Using two different RNAisequences targeting Cortactin, we found that depletion of Cortactinleads to a loss of Naus localization at actin structures in the
lamellipodia. This differs from the mammalian counterpart in whichre-localization of Cortactin by glutamate stimulation in neuronsdoes not lead to CTTNBP2 redistribution. We observed a similarloss in localization upon expression of a point mutant where theproline residues in the conserved proline patch (Fig. S1) weremutated to alanine (amino acid positions 563–567). Thus Naus, likeits mammalian counterparts, uses this same conserved region for itsassociation with Cortactin, though their mechanisms of localizationdiffer. Along with abolishing the interaction with Cortactin in COScells, a similar proline mutant of rat CTTNBP2 failed to rescue thedecrease in dendritic spine density following depletion of endogenousCTTNBP2 (Chen et al., 2012), arguing that not only is this associationimportant for proper localization, but it is also needed for properfunction.
Naus and Cortactin regulate one another’s dynamics in areciprocal mannerOur kinetic studies of Naus and Cortactin reveal a mutualrelationship between the two proteins. By both FRAP and PARF,we found that following Cortactin RNAi, Naus was no longeranchored to the actin cytoskeleton. This data supports ourlocalization studies and further implicates Cortactin’s role inrecruiting Naus to the cytoskeleton. Cortactin is incorporatedthroughout the lamellipodia where it likely targets nascent actinbranch junctions having a 300-fold increased affinity junctions overthe sides of actin filaments (Helgeson and Nolen, 2013).Interestingly, using in vitro single-molecule imaging, Helgesonand Nolen observed that Cortactin’s average lifetime at existing
Fig. 7. Depletion of Naus and Cortactin leads to a decrease in Arp2/3 throughout the lamellipodia of S2R+ cells. (A–D) S2R+ cells treated with (A,C)control, (B) Naus or (D) Cortactin RNAi were fixed and stained for the Arp3 subunit of the Arp2/3 complex (Anti-Arp3) and F-actin (Actin) with phalloidin.Gray levels have been set equal for comparison. Scale bars: 10 µm. (E,G) Line-scan analysis of Arp3 fluorescence in the lamellipodia from cells as shown inA–D. Fluorescence was normalized for each cell and averaged for each condition (black circles, control RNAi; open gray circles, Naus RNAi or CortactinRNAi) error bars show s.e.m. The black arrowheads indicate the cell edge. (F,H) Mean fluorescence intensity of Arp3 of cells treated with control RNAi(black circles) or Naus RNAi or Cortactin (open black circles) from cells as shown in A–D. Error bars are s.e.m. (P<0.0001, Mann–Whitney test, n=8–10,three independent measurements per cells per condition).
10
RESEARCH ARTICLE Biology Open (2019) 8, bio038232. doi:10.1242/bio.038232
BiologyOpen
by guest on May 21, 2020http://bio.biologists.org/Downloaded from
branch junctions during active branching was 29.5 s (Helgeson andNolen, 2013), while the lifetime of branches in vitro has beenobserved to be between 8 and 27 min (Mahaffy and Pollard, 2006;Martin et al., 2006). Our kinetic data (Fig. 4) suggests that Naus mayfunction to retain Cortactin throughout the lamellipodia, likely atbranch junctions given Cortactin’s high affinity for these sites.While this increase in the time at junctions may not be on par withthe reported lifetimes in vitro, lamellipodial actin undergoestreadmilling. Thus, this delay in the dissociation of Cortactin as aresult of its association with Naus may be more consequentialin vivo. Delays in Cortactin’s dissociation could also lead to adecrease in the number of new branches given its ability to functionas a type II NPF.
Naus regulates branch density, actin-retrograde flow ratesand lamellipodial protrusionQuantitative fluorescence speckle microscopy revealed thatdepletion of Naus leads to a decrease in actin retrograde flowspeeds within the lamellipodia (Fig. 3). This decrease in retrogradeflow may be the result of an overall decrease in Arp2/3 nucleationand branch junction stabilization. Three critical observations led usto this hypothesis. Firstly, our kinetic data indicates Cortactin morereadily dissociates from the actin cytoskeleton following Nausdepletion. Secondly, we found that RNAi depletion of Naus led to
an increase the number of long unbranched actin filaments byplatinum replica electron microscopy (Fig. 6). Finally, quantitativeimaging suggests that depletion of either Naus or Cortactin leadsto a decrease in fluorescence intensity of the Arp2/3 complexthroughout the lamellipodia (Fig. 7). Thus, in the absence of Naus,Cortactin could be undergoing a cycle of precocious dissociationfrom branch junctions leading to less activation of the Arp2/3complex and a decrease in the stability of branched junctionsresulting in an overall reduction in incorporation of the Arp2/3complex in the lamellipodia. In an in vitro de-branching assay, Caiand colleagues observed an increase in the density of branchesfollowing a second-wave perfusion of Cortactin. Similarly, in acentrifugation assay, Cortactin was able to overcome thedebranching catalyzed by Coronin 1B and increase the amount ofamount of Arp2/3 associated with F-actin (Cai et al., 2007). Thisgroup also found that Cortactin depletion led to a decrease in actinretrograde flow (Cai et al., 2007), similar to what we observed inS2R+ cells following Naus depletion (Fig. 5). Our results placeNaus upstream of Cortactin and thus upstream of Arp2/3 mediatedbranch nucleation.
Not surprisingly, the changes to the actin architecture and theamount of Arp2/3 incorporated into the lamellipodia also lead tochanges in lamellipodial dynamics. These longer less-branchedactin filaments decreased the speed of cell migration and the
Fig. 8. Naus regulates directionality and lamellipodial persistence in migrating D25c2 cells. (A–D) Representative migration tracks for Drosophila D25cells treated with (A,B) control or (C,D) Naus RNAi. (B′–B‴) Representative kymographs from control RNAi-treated D25 cells; the black line represents atypical region of interest used to generate kymographs. (D′–D‴) Representative kymographs for Naus RNAi-treated D25 cells, the black line represents atypical ROI used to generate kymographs. Scale bars: 10 µm. (E) Average instantaneous cell speeds for control (black circles) or Naus RNAi (open blackcircles)-treated D25 cells. (P<0.0001, two-tailed Student’s t-test; control: n=43 cells, 1438 measurements; Naus RNAi: n=50 cells, 1779 measurements).(F) Quantification of directionality, between control (black circles) and Naus (open black circles) measured as the ratio of D/T where D is distance betweenstarting and end point and T is the total distance traveled. (P=0.0230, two-tailed Student’s t-test, control: n=44 cells, Naus RNAi: n=49 cells).(G) Quantification of lamellipodial protrusions following control (black circles) or Naus RNAi (open black circles)-treated D25 cells (P=0.0265, two-tailedStudent’s t-test, control: n=51 cells, Naus RNAi: n=58 cells). (H) Quantification protrusion persistence in Naus RNAi (open black circle) or control (blackcircles)-treated D25 cells (P=0.025, two-tailed Student’s t-test, control RNAi: n=49 cells, Naus RNAi: n=59 cells). All error bars show s.e.m.
11
RESEARCH ARTICLE Biology Open (2019) 8, bio038232. doi:10.1242/bio.038232
BiologyOpen
by guest on May 21, 2020http://bio.biologists.org/Downloaded from
directionality of this migration, but increased the amplitude oflamellipodial protrusions and increased lamellipodial persistence(Fig. 8). Interestingly, depletion of Cortactin also led to a decrease inrandom cell motility, however these cells had less persistentlamellipodial protrusions suggesting nuanced differences betweenthe loss of Cortactin and the loss of Naus to actin dynamics (Bryceet al., 2005). These differences may very well lie in function of Nausto stabilize Cortactin retaining it in the lamellipodia. Naus depletionappears to differ somewhat from the depletion of the branchdestabilizer Coronin 1B as well. The depletion of Coronin 1B leadsto a more densely-branched actin network and a decrease inretrograde flow rates. Coronin 1B depletion also leads to an increasein the speed of lamellipodial protrusion while reducinglamellipodial persistence (Cai et al., 2007; de Hostos et al., 1993;Krause and Gautreau, 2014). Thus, Naus’s role in fine-tuning thelamellipodia is distinct from that of both Cortactin and Coronin 1B.Many of these conclusions have been drawn from experiments
where Cortactin levels have been reduced by RNAi depletion,however, results from Lai and colleagues using geneticallyCortactin-null fibroblasts tell a slightly different story. Theseresearchers found very little differences in the lamellipodialdynamics of Cortactin-null fibroblasts as compared to wild-typefibroblasts, but did observe slightly slower rates of randomlymigrating cells and the rates of wound closure in scratch-woundassays. Furthermore, the rates of actin incorporation into thelamellipodia were slightly reduced (Lai et al., 2009). Moreover,Sung and colleagues found that many of the Cortactin depletionphenotypes were the result of Cortactin dependent secretion offibronectin (Sung et al., 2011; Schoor et al., 2018). Of note, S2R+cells lack the appropriate integrin pairs to adhere to ECM (Bunchand Brower, 1992; Ribeiro et al., 2014) and are plated on a lectinwhere they are likely not engaged in integrin signaling or secretion.Some of these seemingly contradictory results may point tophenotypes that arise from differences in dosage, cell type or longterm compensatory mechanisms. It is clear from these findings thatthe exact role of Cortactin in actin dynamics, lamellipodialformation and cell migration has yet to be clearly defined.
Naus plays a role in regulating neuronal morphologyThis role in regulating actin dynamics also plays out in determiningthe morphology of neurons. Using fly genetics, we depleted Naus inneuroblasts, which differentiate into neurons in culture. We foundthat depletion of Naus led to a decrease in the number of neuronalprocesses made in comparison to wild-type neurons (Fig. S8).Similarly, depletion of CTTNBP2 also led to a decrease in neuronalarborization as well as a decrease in the density of dendritic spines(Chen and Hsueh, 2012; Chen et al., 2012; Shih et al., 2014).However, CTTNBP2 also promotes microtubule stability, thus itsrole in promoting neuronal arborization may have diverged from itsrole in regulating Cortactin dynamics (Shih et al., 2014).Interestingly, we did not observe wild-type Naus associating withmicrotubules and it was only upon expression of the alanine mutant(Naus-AAAIA, Fig. S2D), albeit on a rare occasion, did weobserved co-localization with microtubules. Understanding thedifferences between Naus and CTTNBP2 will likely be the focus offuture studies, particularly if they both contribute to the morphologyof neurons in distinct ways despite being closely related.
Working model for Naus’s role in branch nucleation,stabilization and the fine-tuning of the lamellipodiaGiven the observations detailed here, we propose a model whereinNaus acts through the stabilization of Cortactin at Arp2/3 generated
branches to regulate their dynamics (Fig. S9). By stabilizingCortactin, Naus inhibits its precocious dissociation while preventingdebranching. Without Naus, Cortactin more freely dissociates fromArp2/3 generated branches leading to the destabilization of branchjunctions and an overall decrease in actin branch density throughoutthe lamellipodia. This decreased density leads to larger scalecellular changes, such as reduced speeds in cell migration (Fig. 8)and a decrease in the number and arborization of neuronal branchesobserved in this study (Fig. S8). In a similar manner, Cortactinmaintains Naus at the lamellipodia and when Cortactin is absent,Naus loses this enrichment and, in extremely rare cases, relocalizesto other structures such as microtubules. Collectively, both Nausand Cortactin act in concert to ensure the appropriate spatial andtemporal regulation of lamellipodial actin dynamics.
MATERIALS AND METHODSCell culture and RNAiDrosophila S2R+ cell culture and RNAi were performed as described inRogers and Rogers (2008) and Applewhite et al. (2016). Briefly, S2R+(Drosophila Genomics Resource Center) cells were cultured in Shields andSanger media (Sigma-Aldrich) supplemented with 100× antibiotic-antimycotic (Thermo Fisher Scientific) and 10% fetal bovine serum(Thermo Fisher Scientific) maintained at 25°C. RNAi was administered insix-well plates by treating cells (approximately 50% confluent) with 10 μgof double-stranded RNA (dsRNA) in 1 ml of medium each day for 7 days.Control RNAi was made from dsDNA amplified from pBlueScript vectorwith no known homology to the Drosophila genome. For all other dsRNAtargets please see Table S1 for primer sequences.
Drosophila ML-DmD25c2 (D25 cells, Drosophila Genomics ResourceCenter) were maintained as described in Currie and Rogers (2011). Briefly,D25 cells were cultured in Schneider’s media (Thermo Fisher Scientific)supplemented with 100× antibiotic-antimycotic (Thermo Fisher Scientific),10% fetal bovine serum (FBS, Thermo Fisher Scientific) and 10 μg/mlinsulin (Thermo Fisher Scientific). RNAi regimen was the same asdescribed for S2R+ cells (see above).
Drosophila primary neuroblasts were harvested and cultured as describedin Lu et al. (2013). Briefly, the brains of third instar larvae were dissected inSchneider’s media supplemented with 20% FBS and then enzymaticallydissociated with liberase (Roche, Basel, Switzerland) at a final concentrationof 0.20–0.25 mg/ml in Modified Dissecting Saline (137 mMNaCl, 5.4 mMKCl, 0.17 NaH2PO4 0.22 mMHKPO4 3.3 mMGlucose, 43.8 mM Sucrose,9.9 mM Hepes, pH 7.5). The Modified Dissecting Solution was replacedwith Schneider’s media supplemented with 20% FBS and neuroblasts wereplated on ECM harvested from the D25 cells (see Currie and Rogers, 2011)and allowed to differentiate for 24 h at 25°C.
Molecular biologyThe cDNA clones for Naus (CG10915) and Cortactin (CG3637) wereobtained from the Drosophila Genomics Resource Center and were clonedinto pMT or pIZ (Invitrogen) vectors following standard PCR procedures.Naus’s conserved Cortactin binding motif (amino acid positions 563–567)were mutated to alanine by site-directed mutagenesis.
Immunofluorescence and live-cell imagingCells were prepared for immunofluorescence and live-cell imaging asdescribed in Applewhite et al. (2016). S2R+ cells were plated onconcanavalin A-treated coverslips attached to laser cut 35 mm tissueculture dishes with UV-curable adhesive (Norland Products, Cranbury,USA) in Shields and Sanger media supplemented with 10% FBS and 100×antibiotic-antimycotic for both fixed and live-cell imaging. D25 cells wereplated on glass-bottom dishes (described above) treated with ECMharvested from the cells as described in Currie and Rogers (2011).Antibodies used in this study include anti-Myc 9E10, anti-Futsch, anti-alphaand anti-beta tubulin (all from Developmental Hybridoma Bank)diluted 1:200 in a 5% solution of normal goat serum (Sigma-Aldrich)and phosphate-buffered solution with 0.1% Triton x-100 (PBST)
12
RESEARCH ARTICLE Biology Open (2019) 8, bio038232. doi:10.1242/bio.038232
BiologyOpen
by guest on May 21, 2020http://bio.biologists.org/Downloaded from
(Sigma-Aldrich). Secondary antibodies (Alexa-488 and Alexa 594; JacksonImmunoResearch) and phalloidin (Alexa-488 and Alexa-594; ThermoFisher Scientific) were used at final dilution of 1:100 in PBST. Hoechst(Thermo Fisher Scientific) was diluted 1:10,000 in PBST. All transfectionswere carried out using using FuGENE HD (Promega). Expression of pMTvectors was achieved with 250–500 μM final concentration of copper sulfateunless noted otherwise. Cells were fixed using a 10% solution ofParaformaldehyde (Electron Microscopy Sciences, Hatfield, USA) andPEM buffer (100 mM Pipes, 1 mM EGTA, 1 mM MgCl2). Fixed cellswere mounted using Dako anti-fade mounting media (Agilent, SantaClara, USA). All imaging was performed on a TIRF system mounted on aninverted microscope (Ti-E, Nikon, Tokyo, Japan) using a 100×/1.49NA oilimmersion TIRF objective driven by Nikon Elements software unlessnoted otherwise. Images were captured using an Orca-Flash 4.0(Hamamatsu, Japan) and were processed for brightness and contrastusing ImageJ before analysis.
ImmunoblottingS2R+ cells were treated with RNAi targeting Naus or Cortactin for 7 days.On the fifth day of treatment cells were transfected with either pMT-EGFP-Naus or pMT-myc-Cortactin and induced to expression the transgeneovernight with 600 µM CuSO4. Whole-cell lysate from the cells was thencollected by re-suspending cell pellets with SDS-sample buffer followingby boiling for 5 min. The efficiency of RNAi was determined by westernblotting the lysates where equal protein amounts were loaded. Antibodiesused in this study were diluted in standard 5% milk Tris- buffered solutionplus 0.1% Tween, pH 7.4 (TBST) solution and include anti-GFP (1: 5000,Abcam), anti-myc 9E10 (1:200, Drosophila Hybridoma Bank), anti-betatubulin 12G10 (1:200, Drosophila Hybridoma Bank) and anti-mouse HRP(1:5000, Cell Signaling).
Co-localization analysisCo-localization was analyzed by line-scan analysis and Mander’scoefficient analysis. For line-scan analysis, a 10 μm line was drawn fromthe cell edge inward and fluorescence intensity was measured. These valueswere normalized and then averaged for all cells within that condition.Mander’s coefficient analysis was performed using the Just AnotherColocalization Program (JACoP) plugin for ImageJ (Bolte and Cordelieres,2006). Briefly, intensity thresholds were manually set for both fluorescencechannels and then the fraction of overlap was calculated in each direction.
Neuroblast analysisNeuroblasts were analyzed using the Simple Neurite Tracer and ShollAnalysis plugins in ImageJ (Ferreira et al., 2014; Longair et al., 2011). ForSholl Analysis, neuroblasts were converted to a threshold image. Followingthis, a line from the center of the soma to past the further branch tip wasdrawn to define the space for analysis. The radius for analysis was set to2 μm concentric circles and the number of intersections per radius wascalculated. Similarly, the max Sholl radius was then extracted by themaximum radius at which the number of intersections was greater than zero.For analysis of average branch length and number of branches using SimpleNeurite Tracer, a line skeleton of the neuron image was manually drawn andthese values were then calculated using the plugin.
Permeabilization activated reduction in fluorescencePARF was performed as described in Singh et al. (2016). Briefly, cells wereprepared for live imaging as described above. Time-lapse images werecaptured with constant exposure at a rate of one frame every 2 s. After 40 s(20 frames), digitonin (25 μM final concentration) was added. Cells from thesame dish were imaged under the same conditions but without digitonintreatment for use as a photofading due to acquisition (PDA) control.Analysis was performed using ImageJ and GraphPad Prism 6. The area ofeach region of interest (ROI) was held constant. An ellipse of thebackground of each movie (control and digitonin treatment) was selectedand intensity density was determined for the background in each frame.PDA was determined as previously described in Applewhite et al. (2007).The intensity density was determined for a lamellipodial ROI in the control(no digitonin treatment) movie for each plate. The background intensity was
subtracted and change in fluorescence was fit to a one-phase exponentialdecay of the following general equation where I is intensity, k is thephotofading factor, e is Euler’s constant, t is time in seconds and Io is theinitial intensity:
I ¼ e�kt þ Io:
The intensity density of a lamellipodial ROI for digitonin cells was obtainedin the same manner. Background intensity was subtracted and the intensitydensity was then multiplied by ekt. The intensity was normalized for eachcell and the data were averaged for each condition. To compare the half-lifebetween conditions for statistical significance, the normalized fluorescencefor each cell was fit to a two-phase exponential decay and t1/2 wasdetermined. These half-life values were averaged in each condition andcompared using a two-tailed Student’s t-test.
Fluorescence recovery after photobleachingFRAP was performed using a Zeiss LSM880 laser-scanning confocalmicroscope (Jena, Germany). Cells were prepared for live imaging asdescribed above. Time-lapse images were captured every 1.34 s. After 50cycles (65.6 s), selected regions of the cell were bleached (five iterations)and the intensity was recorded. Intensity was also recorded for a non-bleached region and a background region of the same size was used for PDAcontrols. FRAP analysis was performed as described in Applewhite et al.(2007). The fluorescence intensities in the bleached zone in each frameweremeasured. The background was subtracted and the intensity was correctedfor photofading as described above. The intensity was normalized for eachROI. This corrected intensity was fit to a one-phase association. The half-life of recovery was calculated as ln2 k−1. Values were compared using atwo-tailed Student’s t-test.
Quantitative imaging and analysisFor quantification of F-actin in the lamellipodia, RNAi-treated S2R+ cellswere prepared in parallel and fixed using a 10% solution ofParaformaldehyde (Electron Microscopy Sciences, Hatfield, PA) andPEM buffer (100 mM Pipes, 1 mM EGTA, 1 mM MgCl2). Cells werestained for F-actin using phalloidin (Alexa-488, Thermo Fisher Scientific) atfinal dilution of 1:100 in PBST. Fixed cells were mounted using Dako anti-fade mounting media (Agilent). All imaging was performed on a totalinternal reflection fluorescence (TIRF) system mounted on an invertedmicroscope (Ti-E, Nikon) using a 100×/1.49NA oil immersion TIRFobjective driven by Nikon Elements software unless noted otherwise andimages were captured using an Orca-Flash 4.0 (Hamamatsu). F-actinintensity was analyzed by line-scan analysis and ROI. For line-scananalysis, a 10 µm line was drawn from the cell edge inward along which thefluorescence intensity was measured. These values were backgroundsubtracted, normalized and then averaged for all cells within thatcondition. To measure the mean fluorescence intensity of the lamellipodiaan ROI of the cell perimeter was made and the fluorescence intensity wasmeasured from the cell perimeter inward 2.7 µm encompassing thelamellipodia. The mean intensity along this perimeter was measured andplotted for each condition.
For quantification of Arp3 in the lamellipodia, RNAi-treated S2R+ cellswere prepared in parallel and simultaneously fixed in a solution of PEMbuffer (100 mM Pipes, 1 mM EGTA, 1 mM MgCl2) supplemented with0.5% Triton-X-100 and 0.25% glutaraldehyde (EM grade from ElectronMicroscopy Sciences) for approximately 2 min followed by a 15-minfixation in 2% glutaraldehyde in 0.1 M sodium cacodylate, pH 7.3.Following a rinse with PBD, the cells were then incubated overnight withanti-Arp3 antibody (A5979, Sigma-Aldrich) diluted 1:400 in 5% normalgoat serum (Sigma-Aldrich) in PBST. The cells were rinse again with PBSand then incubated with anti-mouse Alexa-488 (Jackson ImmunoResearch)and Alexa-595 (Thermo Fisher Scientific) diluted 1:100 in PBST andmounted with anti-fade mounting media (Dako). All imaging wasperformed on a total internal reflection fluorescence (TIRF) systemmounted on an inverted microscope (Ti-E, Nikon) using a 100×/1.49NAoil immersion TIRF objective driven by Nikon Elements software unlessnoted otherwise and images were captured using an Orca-Flash 4.0
13
RESEARCH ARTICLE Biology Open (2019) 8, bio038232. doi:10.1242/bio.038232
BiologyOpen
by guest on May 21, 2020http://bio.biologists.org/Downloaded from
(Hamamatsu). The fluorescence of Arp3 was measured along lines 1.75 µmin length encompassing 0.875 µm of the background and 0.875 µm of thelamellipodia. 8–10 cells were measured per condition with threeindependent lamellipodia measurements taken. These values werebackground subtracted, normalized and then averaged for all cells withinthat condition. The mean raw fluorescence intensities from thesemeasurements were also recorded (Fig. 7F,H) with the backgroundmeasurements excluded.
Quantitative fluorescence speckled microscopyRNAi treatment and transfection was performed as described above.Following transfection, cells were induced with 30 μM copper sulfate andincubated overnight. Live cellmovieswere obtained at 200 ms exposure in 2 sintervals for 2 min. The resulting movies were analyzed using a previouslydescribed Quantitative Fluorescent Speckle Microscopy (QFSM) software inMATLAB (Mendoza et al., 2012). Imageswere acquired at a rate of 30 framesper minute (130 nm per pixel, NA=1.4, 16 bit images). Full cell masks weregenerated using automatic thresholding (MinMax setting). Flow analysis wasperformed using the flow tracking setting with a six-frame integrationwindow. For cell-wise quantification of lamellipodial flow rates, masks oflamellipodial regions for each cell were generated and the average actin flowratewas calculated for the first 30 s of each movie (n=27−35 cells per group).To compare the overall fluorescence of the cells used in QFSM an ROIencompassing the cell perimeter was made and the mean fluorescenceintensity of this ROI was recorded for each cell.
Platinum replica electron microscopySample preparation for platinum replica electron microscopy was performedas previously described in Svitkina (2016). Briefly, cells were extracted inExtraction buffer [1% Triton X-100, 2% PEG (MW 35 kDa) in PEM buffersupplemented 2 µM phalloidin], washed with PBS and then fixed with 2%glutaraldehyde (EM grade from Electron Microscopy Sciences) in 0.1 Msodium cacodylate, pH 7.3. Fixed cells were then treated with 0.1% tannicacid and 0.2% uranyl acetate in water, critical-point dried and coated withplatinum and carbon. They were then transferred to EM grids for imaging.All EM measurements were made on images of 30,000× resolution (highmagnification images Fig. 6A–H). As distinct branch sites are difficult todetermine from the largely dense network, especially in the case of controlimages, we measured the distance between branch points or filamentintersections in each condition to get a rough estimate of the branching in thelamellipodial network. Measurements between branches or filamentintersections were made by drawing a segmented line from one filamentbranch or crossing to the next, for those that could be discernibly determinedas the same filament or same filament bundle. At least 40 measurementswere made per image, across five separate images for each condition (n>200per condition).
Random cell migration assay and kymographyD25 cells were plated at a subconfluent density on ECM-coated glass-bottom dishes and allowed to attach overnight. Cells were imaged every5 min for 6 h by phase-contrast microscopy using 40×/0.75NA objective.Individual cells were manually tracked using Manual Tracker (ImageJ). Celldirectionality was calculated as a ratio of the direct distance between startand end points (D) to the total path length taken by the cells (T). To measurethe rates of lamellipodial protrusion, retraction, persistence, frequency andamplitude, kymographs were made using the Multi Kymograph ImageJplugin from phase-contrast movies acquired every 2 s for 10 min.Kymographs were generated from phase-contrast movies of migratingD25 cells acquired every 2 s for 10 min. A line approximately 16 µm inwidth was drawn from the center of the cell to a few microns beyond the cellperiphery. Following the protocol established by Hinz et al. (1999), thesekymographs were used to extract the lamellipodial protrusion parameters.All statistics for this manuscript were performed using GraphPad Prism 6unless otherwise noted.
AcknowledgementsWe would like to acknowledge the help of Dr Stephanie Kaeche Petrie at OregonHealth and Science University for her mentorship and training on the FRAP
experiments, and Dr Farida Korbova for the electron microscopy and fruitfuldiscussions. In addition, we would like to thank Drs Ryan Fink, Joseph Leeand J. Clapp for their assistance in transcontinental fly transportation, Drs JeremyCoate and Anna Ritz for their assistance with bioinformatics, the DrosophilaGenomics Resources Center (NIH grant 2P40OD010949 to DGRC) andDevelopmental Studies Hybridoma Bank created by the NICHD of the NIH andmaintained at The University of Iowa, Department of Biology, Iowa City, USA forreagents. Additionally, we would like to thank Mari Cobb, Emily Merfeld and AbrarAbidi for their input and helpful discussions throughout this project, and Drs. VladimirGelfand, Stephen Rogers, Omar Quintero and Amy Platenkamp for carefulreading of this manuscript.
Competing interestsThe authors declare no competing or financial interests.
Author contributionsConceptualization: M.E.O., D.A.A.; Methodology: D.A.A.; Validation: D.A.A.; Formalanalysis: M.E.O., D.S., T.D., I.K., W.G.P.; Investigation: M.E.O., D.S., T.D., I.K.,W.G.P., D.A.A.; Data curation: M.E.O.;Writing - original draft: M.E.O., D.A.A.;Writing- review & editing: M.E.O., D.A.A.; Visualization: M.E.O., D.A.A.; Supervision:D.A.A.; Project administration: D.A.A.; Funding acquisition: D.A.A.
FundingThis work was supported by the National Science Foundation STEM Grant(NSF1154004 to Reed College), the Reed College Biology UndergraduateResearch Fellowship (to M.E.O.), the Reed College Science Research Fellowship(to M.E.O.), the National Institutes of Health (R15 GM122019-01 to D.A.A. and2P40OD010949), the National Science Foundation (NSF 716964 to D.A.A.) andgenerous start-up funds from Reed College (to D.A.A.).
Supplementary informationSupplementary information available online athttp://bio.biologists.org/lookup/doi/10.1242/bio.038232.supplemental
ReferencesAbercrombie, M., Heaysman, J. E. M. and Pegrum, S. M. (1970). The locomotion
of fibroblasts in culture: II “Ruffling”. Exp. Cell Res. 60, 437-444. doi:10.1016/0014-4827(70)90537-9
Åkervall, J. A., Jin, Y., Wennerberg, J. P., Zatterstrom, U. K., Kjellen, E.,Mertens, F., Willen, R., Mandahl, N., Heim, S. and Mitelman, F. (1995).Chromosomal abnormalities involving 11q13 are associated with poor prognosisin patients with squamous cell carcinoma of the head and neck. Cancer 76,853-859. doi:10.1002/1097-0142(19950901)76:5<853::AID-CNCR2820760520>3.0.CO;2-6
Ammer, A. G. and Weed, S. A. (2008). Cortactin branches out: roles in regulatingprotrusive actin dynamics. Cell Motil. Cytoskeleton 65, 687-707. doi:10.1002/cm.20296
Applewhite, D. A., Barzik, M., Kojima, S., Svitkina, T. M., Gertler, F. B. andBorisy, G. G. (2007). Ena/VASP proteins have an anti-capping independentfunction in filopodia formation. Mol. Biol. Cell 18, 2579-2591. doi:10.1091/mbc.e06-11-0990
Applewhite, D. A., Davis, C. A., Griffis, E. R. and Quintero, O. A. (2016). Imagingof the cytoskeleton using live and fixed Drosophila tissue culture cells. MethodsMol. Biol. 1365, 83-97. doi:10.1007/978-1-4939-3124-8_4
Bear, J. E., Svitkina, T. M., Krause, M., Schafer, D. A., Loureiro, J. J., Strasser,G. A., Maly, I. V., Chaga, O. Y., Cooper, J. A., Borisy, G. G. et al. (2002).Antagonism between Ena/VASP proteins and actin filament capping regulatesfibroblast motility. Cell 109, 509-521. doi:10.1016/S0092-8674(02)00731-6
Bolte, S. and Cordelieres, F. P. (2006). A guided tour into subcellular colocalizationanalysis in light microscopy. J. Microsc. 224, 213-232. doi:10.1111/j.1365-2818.2006.01706.x
Bryce, N. S., Clark, E. S., Leysath, J. M. L., Currie, J. D., Webb, D. J. andWeaver,A. M. (2005). Cortactin promotes cell motility by enhancing lamellipodialpersistence. Curr. Biol. 15, 1276-1285. doi:10.1016/j.cub.2005.06.043
Buday, L. and Downward, J. (2007). Roles of cortactin in tumor pathogenesis.Biochim. Biophys. Acta Rev. Cancer 1775, 263-273. doi:10.1016/j.bbcan.2006.12.002
Bunch, T. A. and Brower, D. L. (1992). Drosophila PS2 integrin mediates RGD-dependent cell-matrix interactions. Development 116, 239-247.
Cai, L., Marshall, T. W., Uetrecht, A. C., Schafer, D. A. and Bear, J. E. (2007).Coronin 1B coordinates Arp2/3 complex and cofilin activities at the leading edge.Cell 128, 915-929. doi:10.1016/j.cell.2007.01.031
Chen, Y.-K. and Hsueh, Y.-P. (2012). Cortactin-binding protein 2 modulates themobility of cortactin and regulates dendritic spine formation and maintenance.J. Neurosci. 32, 1043-1055. doi:10.1523/JNEUROSCI.4405-11.2012
Chen, Y.-K., Chen, C.-Y., Hu, H.-T. and Hsueh, Y.-P. (2012). CTTNBP2, but notCTTNBP2NL, regulates dendritic spinogenesis and synaptic distribution of the
14
RESEARCH ARTICLE Biology Open (2019) 8, bio038232. doi:10.1242/bio.038232
BiologyOpen
by guest on May 21, 2020http://bio.biologists.org/Downloaded from
striatin–PP2A complex. Mol. Biol. Cell 23, 4383-4392. doi:10.1091/mbc.e12-05-0365
Currie, J. D. and Rogers, S. L. (2011). Using the Drosophila melanogaster D17-c3cell culture system to study cell motility. Nat. Protoc. 6, 1632-1641. doi:10.1038/nprot.2011.397
Danuser, G. and Waterman-Storer, C. M. (2006). Quantitative fluorescent specklemicroscopy of cytoskeleton dynamics. Annu. Rev. Biophys. Biomol. Struct. 35,361-387. doi:10.1146/annurev.biophys.35.040405.102114
de Hostos, E. L., Rehfuess, C., Bradtke, B., Waddell, D. R., Albrecht, R.,Murphy, J. and Gerisch, G. (1993). Dictyostelium mutants lacking thecytoskeletal protein coronin are defective in cytokinesis and cell motility. J. CellBiol. 120, 163-173. doi:10.1083/jcb.120.1.163
Ferreira, T. A., Blackman, A. V., Oyrer, J., Jayabal, S., Chung, A. J., Watt, A. J.,Sjostrom, P. J. and vanMeyel, D. J. (2014). Neuronal morphometry directly frombitmap images. Nat. Methods 11, 982-984. doi:10.1038/nmeth.3125
Fischer, M., Kaech, S., Knutti, D. and Matus, A. (1998). Rapid actin-basedplasticity in dendritic spines. Neuron 20, 847-854. doi:10.1016/S0896-6273(00)80467-5
Gelbart, W. M. and Emmert, D. B. (2013). FlyBase High Throughput ExpressionPattern Data.
Goley, E. D. and Welch, M. D. (2006). The ARP2/3 complex: an actin nucleatorcomes of age. Nat. Rev. Mol. Cell Biol. 7, 713-726. doi:10.1038/nrm2026
Goujon, M., McWilliam, H., Li, W., Valentin, F., Squizzato, S., Paern, J. andLopez, R. (2010). A new bioinformatics analysis tools framework at EMBL–EBI.Nucleic Acids Res. 38, W695-W699. doi:10.1093/nar/gkq313
Harms, B. D., Bassi, G. M., Horwitz, A. R. and Lauffenburger, D. A. (2005).Directional Persistence of EGF-Induced Cell Migration Is Associated withStabilization of Lamellipodial Protrusions. Biophys. J. 88, 1479-1488. doi:10.1529/biophysj.104.047365
Helgeson, L. A. and Nolen, B. J. (2013). Mechanism of synergistic activation ofArp2/3 complex by cortactin and N-WASP. eLife 2, e00884. doi:10.7554/eLife.00884
Hinz, B., Alt, W., Johnen, C., Herzog, V. and Kaiser, H.-W. (1999). Quantifyinglamella dynamics of cultured cells by SACED, a new computer-assisted motionanalysis. Exp. Cell Res. 251, 234-243. doi:10.1006/excr.1999.4541
Hirakawa, H.-W., Shibata, K. and Nakayama, T. (2009). Localization of cortactin isassociated with colorectal cancer development. Int. J. Oncol. 35, 1271-1276.doi:10.3892/ijo_00000444
Hotulainen, P. and Hoogenraad, C. C. (2010). Actin in dendritic spines:connecting dynamics to function. J. Cell Biol. 189, 619-629. doi:10.1083/jcb.201003008
Iwasa, J. H. and Mullins, R. D. (2007). Spatial and temporal relationships betweenactin-filament nucleation, capping, and disassembly. Curr. Biol. 17, 395-406.doi:10.1016/j.cub.2007.02.012
Kirkbride, K. C., Sung, B. H., Sinha, S. and Weaver, A. M. (2011). Cortactin. CellAdhes. Migr. 5, 187-198. doi:10.4161/cam.5.2.14773
Krause, M. and Gautreau, A. (2014). Steering cell migration: lamellipodiumdynamics and the regulation of directional persistence. Nat. Rev. Mol. Cell Biol.15, nrm3861. doi:10.1038/nrm3861
Lai, F. P. L., Szczodrak, M., Block, J., Faix, J., Breitsprecher, D., Mannherz,H. G., Stradal, T. E. B., Dunn, G. A., Small, J. V. and Rottner, K. (2008). Arp2/3complex interactions and actin network turnover in lamellipodia. EMBO J. 27,982-992. doi:10.1038/emboj.2008.34
Lai, F. P. L., Szczodrak, M., Oelkers, J. M., Ladwein, M., Acconcia, F., Benesch,S., Auinger, S., Faix, J., Small, J. V., Polo, S. et al. (2009). Cortactin promotesmigration and platelet-derived growth factor-induced actin reorganization bysignaling to Rho-GTPases. Mol. Biol. Cell. 20, 3209-3223. doi:10.1091/mbc.e08-12-1180
Longair, M. H., Baker, D. A. and Armstrong, J. D. (2011). Simple NeuriteTracer: open source software for reconstruction, visualization and analysis ofneuronal processes. Bioinformatics 27, 2453-2454. doi:10.1093/bioinformatics/btr390
Lu, W., del Castillo, U. and Gelfand, V. I. (2013). Organelle transport in cultureddrosophila cells: S2 cell line and primary neurons. J. Vis. Exp., e50838. doi:10.3791/50838
MacGrath, S. M. and Koleske, A. J. (2012). Cortactin in cell migration and cancer ata glance. J. Cell Sci. 125, 1621-1626. doi:10.1242/jcs.093781
Machesky, L. M., Mullins, R. D., Higgs, H. N., Kaiser, D. A., Blanchoin, L., May,R. C., Hall, M. E. and Pollard, T. D. (1999). Scar, a WASp-related protein,activates nucleation of actin filaments by the Arp2/3 complex. Proc. Natl. Acad.Sci. USA 96, 3739-3744. doi:10.1073/pnas.96.7.3739
Mahaffy, R. E. and Pollard, T. D. (2006). Kinetics of the formation and dissociationof actin filament branches mediated by Arp2/3 complex. Biophys. J. 91,3519-3528. doi:10.1529/biophysj.106.080937
Martin, A. C., Welch, M. D. and Drubin, D. G. (2006). Arp2/3 ATP hydrolysis-catalysed branch dissociation is critical for endocytic force generation. Nat. CellBiol. 8, 826-833. doi:10.1038/ncb1443
Matus, A. (2000). Actin-based plasticity in dendritic spines. Science 290, 754-758.doi:10.1126/science.290.5492.754
Mendoza, M. C., Besson, S. and Danuser, G. (2012). Quantitative fluorescentspeckle microscopy (QFSM) to measure actin dynamics. Curr. Protoc. FlowCytom. 62, 2.18.1-2.18.26. doi:10.1002/0471142956.cy0218s62
Mullins, R. D., Stafford, W. F. and Pollard, T. D. (1997). Structure, subunittopology, and actin-binding activity of the Arp2/3 complex from acanthamoeba.J. Cell Biol. 136, 331-343. doi:10.1083/jcb.136.2.331
Ohoka, Y. and Takai, Y. (1998). Isolation and characterization of cortactin isoformsand a novel cortactin-binding protein, CBP90. Genes Cells 3, 603-612. doi:10.1046/j.1365-2443.1998.00216.x
Patel, A. S., Schechter, G. L., Wasilenko, W. J. and Somers, K. D. (1998).Overexpression of EMS1/cortactin in NIH3T3 fibroblasts causes increased cellmotility and invasion in vitro. Oncogene 16, 3227-3232. doi:10.1038/sj.onc.1201850
Prehoda, K. E., Scott, J. A., Dyche Mullins, R. and Lim, W. A. (2000). Integrationofmultiple signals through cooperative regulation of the N-WASP-Arp2/3 complex.Science 290, 801-806. doi:10.1126/science.290.5492.801
Ren, G., Crampton, M. S. and Yap, A. S. (2009). Cortactin: coordinating adhesionand the actin cytoskeleton at cellular protrusions. Cell Motil. Cytoskeleton 66,865-873. doi:10.1002/cm.20380
Ribeiro, S. A., D’Ambrosio, M. V. and Vale, R. D. (2014). Induction of focaladhesions and motility in Drosophila S2 cells. Mol. Biol. Cell 25, 3835-3985.doi:10.1091/mbc.e14-04-0863
Ridley, A. J., Schwartz, M. A., Burridge, K., Firtel, R. A., Ginsberg, M. H., Borisy,G., Parsons, J. T. and Horwitz, A. R. (2003). Cell migration: integrating signalsfrom front to back. Science 302, 1704-1709. doi:10.1126/science.1092053
Rogers, S. L. andRogers, G. C. (2008). Culture of Drosophila S2 cells and their usefor RNAi-mediated loss-of-function studies and immunofluorescence microscopy.Nat. Protoc. 3, 606-611. doi:10.1038/nprot.2008.18
Rogers, S. L., Wiedemann, U., Stuurman, N. and Vale, R. D. (2003). Molecularrequirements for actin-based lamella formation in Drosophila S2 cells. J. Cell Biol.162, 1079-1088. doi:10.1083/jcb.200303023
Rothschild, B. L., Shim, A. H., Ammer, A. G., Kelley, L. C., Irby, K. B., Head, J. A.,Chen, L., Varella-Garcia, M., Sacks, P. G., Frederick, B. et al. (2006). Cortactinoverexpression regulates actin-related protein 2/3 complex activity, motility, andinvasion in carcinomas with chromosome 11q13 amplification. Cancer Res. 66,8017-8025. doi:10.1158/0008-5472.CAN-05-4490
Schoor, M., Stradal, T. E. and Rottner, K. (2018). Cortactin: cell functions of amultifaced actin-binding protein. Trends Cell Biol. 28, 79-98. doi:10.1016/j.tcb.2017.10.009
Shih, P.-Y., Lee, S.-P., Chen, Y.-K. and Hsueh, Y.-P. (2014). Cortactin-bindingprotein 2 increases microtubule stability and regulates dendritic arborization.J. Cell Sci. 127, 3521-3534. doi:10.1242/jcs.149476
Sholl, D. A. (1953). Dendritic organization in the neurons of the visual and motorcortices of the cat. J. Anat. 87, 387-406.
Sievers, F., Wilm, A., Dineen, D., Gibson, T. J., Karplus, K., Li, W., Lopez, R.,McWilliam, H., Remmert, M., Soding, J. et al. (2011). Fast, scalable generationof high-quality protein multiple sequence alignments using Clustal Omega. Mol.Syst. Biol. 7, 539. doi:10.1038/msb.2011.75
Singh, P. P., Hawthorne, J. L., Davis, C. A. and Quintero, O. A. (2016).Permeabilization Activated Reduction in Fluorescence (PARF): a novel method tomeasure kinetics of protein interactions with intracellular structures. Cytoskelet.Hoboken NJ 73, 271-285. doi:10.1002/cm.21306
Siton, O., Ideses, Y., Albeck, S., Unger, T., Bershadsky, A. D., Gov, N. S. andBernheim-Groswasser, A. (2011). Cortactin releases the brakes in actin- basedmotility by enhancing WASP-VCA detachment from Arp2/3 branches. Curr. Biol.21, 2092-2097. doi:10.1016/j.cub.2011.11.010
Sung, B. H., Zhu, X., Kaverina, I. andWeaver, A. M. (2011). Cortactin controls cellmotility and lamellipodial dynamics by regulating ECM secretion. Curr. Biol. 21,1460-1469. doi:10.1016/j.cub.2011.06.065
Suraneni, P., Rubinstein, B., Unruh, J. R., Durnin, M., Hanein, D. and Li, R.(2012). The Arp2/3 complex is required for lamellipodia extension anddirectional fibroblast cell migration. J. Cell Biol. 197, 239-251. doi:10.1083/jcb.201112113
Svitkina, T. (2016). Imaging cytoskeleton components by electron microscopy.Methods Mol. Biol. 1365, 99-118. doi:10.1007/978-1-4939-3124-8_5
Svitkina, T. M. and Borisy, G. G. (1999). Arp2/3 complex and actin depolymerizingfactor/cofilin in dendritic organization and treadmilling of actin filament array inlamellipodia. J. Cell Biol. 145, 1009-1026. doi:10.1083/jcb.145.5.1009
Svitkina, T. M., Bulanova, E. A., Chaga, O. Y., Vignjevic, D. M., Kojima, S.,Vasiliev, J. M. and Borisy, G. G. (2003). Mechanism of filopodia initiation byreorganization of a dendritic network. J. Cell Biol. 160, 409-421. doi:10.1083/jcb.200210174
Uruno, T., Liu, J., Zhang, P., Fan, Y., Egile, C., Li, R., Mueller, S. C. and Zhan, X.(2001). Activation of Arp2/3 complex-mediated actin polymerization by cortactin.Nat. Cell Biol. 3, 259-266. doi:10.1038/35060051
Uruno, T., Liu, J., Li, Y., Smith, N. and Zhan, X. (2003). Sequential interaction ofactin-related proteins 2 and 3 (Arp2/3) complex with neural Wiscott-AldrichSyndrome Protein (N-WASP) and cortactin during branched actin filamentnetwork formation. J. Biol. Chem. 278, 26086-26093. doi:10.1074/jbc.M301997200
15
RESEARCH ARTICLE Biology Open (2019) 8, bio038232. doi:10.1242/bio.038232
BiologyOpen
by guest on May 21, 2020http://bio.biologists.org/Downloaded from
Weaver, A. M. (2008). Cortactin in tumor invasiveness. Cancer Lett. 265, 157-166.doi:10.1016/j.canlet.2008.02.066
Weaver, A. M., Karginov, A. V., Kinley, A. W., Weed, S. A., Li, Y., Parsons, J. T.and Cooper, J. A. (2001). Cortactin promotes and stabilizes Arp2/3-induced actinfilament network formation. Curr. Biol. 11, 370-374. doi:10.1016/S0960-9822(01)00098-7
Weaver, A. M., Heuser, J. E., Karginov, A. V., Lee,W., Parsons, J. T. andCooper,J. A. (2002). Interaction of cortactin and N-WASp with Arp2/3 complex.Curr. Biol.12, 1270-1278. doi:10.1016/S0960-9822(02)01035-7
Wu, C., Asokan, S. B., Berginski, M. E., Haynes, E. M., Sharpless, N. E., Griffith,J. D., Gomez, S. M. and Bear, J. E. (2012). Arp2/3 is critical for lamellipodia and
response to extracellular matrix cues but is dispensable for chemotaxis. Cell 148,973-987. doi:10.1016/j.cell.2011.12.034
Xu, X.-Z., Garcia, M. V., Li, T.-Y., Khor, L.-Y., Gajapathy, R. S., Spittle, C., Weed,S., Lessin, S. R. and Wu, H. (2010). Cytoskeleton alterations in melanoma:aberrant expression of cortactin, an actin-binding adapter protein, correlates withmelanocytic tumor progression. Mod. Pathol. Off. J. U. S. Can. Acad. Pathol. Inc23, 187-196. doi:10.1038/modpathol.2009.157
Zalevsky, J., Lempert, L., Kranitz, H. and Mullins, R. D. (2001). DifferentWASP family proteins stimulate different Arp2/3 complex-dependentactin-nucleating activities. Curr. Biol. 11, 1903-1913. doi:10.1016/S0960-9822(01)00603-0
16
RESEARCH ARTICLE Biology Open (2019) 8, bio038232. doi:10.1242/bio.038232
BiologyOpen
by guest on May 21, 2020http://bio.biologists.org/Downloaded from