the dry bulk shipping market, emissions & the green transition
TRANSCRIPT

The Dry Bulk Shipping Market, Emissions & The Green TransitionPresentation to the International Dry Bulk Terminals Group6 October 2020Trevor Crowe, Director,Clarksons Research
CRSL Ref: A4125

Decline this year comparable to 2009, but variation across commodities and signs of impact easing
Source: Clarksons Research. *Based on a basket of trade covering c.80% of annual seaborne dry bulk trade. For further details see Shipping Intelligence Network..
Covid-19 & Seaborne Dry Bulk Trade
2
-6%
-4%
-2%
0%
2%
4%
6%
8%
10%
12%
14%
0
1
2
3
4
5
6
2000
2001
2002
2003
2004
2005
2006
2007
2008
2009
2010
2011
2012
2013
2014
2015
2016
2017
2018
2019
2020
(f)20
21(f)
Iron OreCoalGrainMinor BulkGrowth (RHS)
-14%
-12%
-10%
-8%
-6%
-4%
-2%
0%
2%
4%
6%
Iron
Ore
Cok
ing
Coa
l
Stea
m C
oal
Gra
in
Stee
l Pro
duct
s
Oth
er M
inor
Bul
k
Tota
l Dry
Bul
k
2019 2020 (f)
Seaborne Dry Bulk Trade, bn tonnes Dry Bulk Trade Growth By Commodity Monthly Dry Bulk Trade Growth Indicator*
-12%
-10%
-8%
-6%
-4%
-2%
0%
2%
4%
6%
8%
10%
jan-
18
apr-1
8
jul-1
8
okt-1
8
jan-
19
apr-1
9
jul-1
9
okt-1
9
jan-
20
apr-2
0
jul-2
0
y-o-y
y-o-y, 3mma
Year to date: -2.3%Peak impact (May): -11.1%Latest (Aug): -1.8%
The Dry Bulk Shipping Market, Emissions & The Green Transition | Dry Bulk Terminals Group, 6 October 2020

Daily tracking of Port Call and ‘Idle’ statistics…
Source: Clarksons Research. *See Port Call Activity Tracker on SIN for further details. ^See timeseries on Shipping Intelligence Network for further details.
Covid-19: Bulk Shipping Activity Indicators
3
0
1
2
3
4
5
6
7
8
9
10
jan-16 jul-16 jan-17 jul-17 jan-18 jul-18 jan-19 jul-19 jan-20 jul-20
CapesizePanamax
‘Idle’ Fleet, % (dwt) ^
220
240
260
280
300
320
jan feb mrt apr mei jun jul aug sep okt
2019
2020
Global large bulkcarrier port calls up 0.7% y-o-y so far this year
Global Bulkcarrier (65,000+ dwt) Port Calls (No. Calls, 7dma) *
The Dry Bulk Shipping Market, Emissions & The Green Transition | Dry Bulk Terminals Group, 6 October 2020
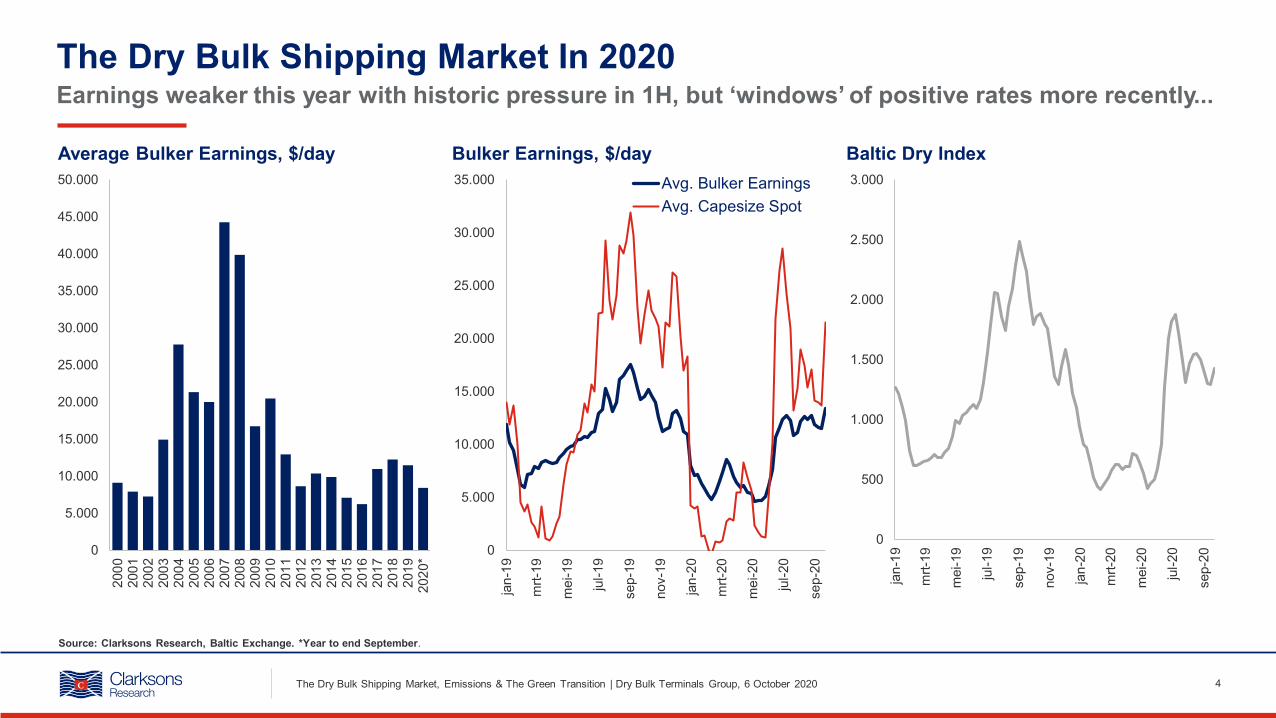
Earnings weaker this year with historic pressure in 1H, but ‘windows’ of positive rates more recently...
Source: Clarksons Research, Baltic Exchange. *Year to end September.
The Dry Bulk Shipping Market In 2020
The Dry Bulk Shipping Market, Emissions & The Green Transition | Dry Bulk Terminals Group, 6 October 2020 4
0
5.000
10.000
15.000
20.000
25.000
30.000
35.000
40.000
45.000
50.000
2000
2001
2002
2003
2004
2005
2006
2007
2008
2009
2010
2011
2012
2013
2014
2015
2016
2017
2018
2019
2020
*
Average Bulker Earnings, $/day Bulker Earnings, $/day Baltic Dry Index
0
5.000
10.000
15.000
20.000
25.000
30.000
35.000
jan-
19
mrt-
19
mei
-19
jul-1
9
sep-
19
nov-
19
jan-
20
mrt-
20
mei
-20
jul-2
0
sep-
20
Avg. Bulker EarningsAvg. Capesize Spot
0
500
1.000
1.500
2.000
2.500
3.000
jan-
19
mrt-
19
mei
-19
jul-1
9
sep-
19
nov-
19
jan-
20
mrt-
20
mei
-20
jul-2
0
sep-
20
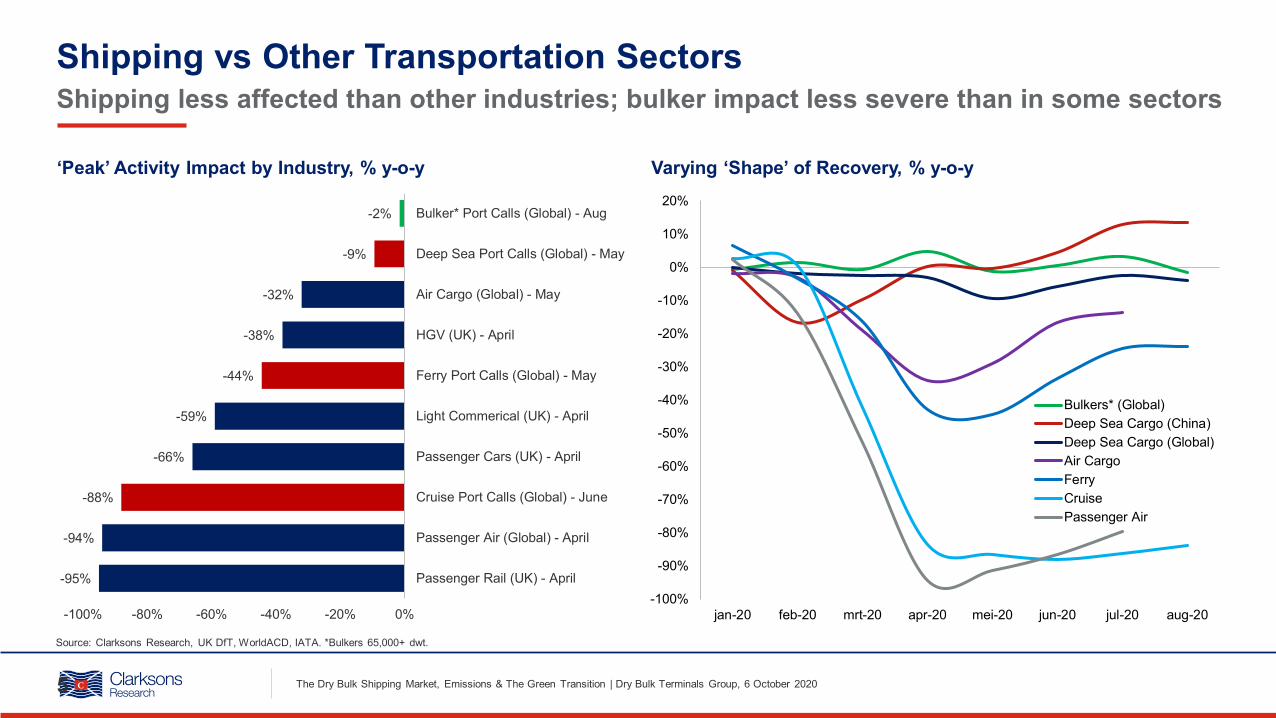
Shipping less affected than other industries; bulker impact less severe than in some sectors
Source: Clarksons Research, UK DfT, WorldACD, IATA. *Bulkers 65,000+ dwt.
Shipping vs Other Transportation Sectors
5
‘Peak’ Activity Impact by Industry, % y-o-y
-2%
-9%
-32%
-38%
-44%
-59%
-66%
-88%
-94%
-95%
-100% -80% -60% -40% -20% 0%
Bulker* Port Calls (Global) - Aug
Deep Sea Port Calls (Global) - May
Air Cargo (Global) - May
HGV (UK) - April
Ferry Port Calls (Global) - May
Light Commerical (UK) - April
Passenger Cars (UK) - April
Cruise Port Calls (Global) - June
Passenger Air (Global) - April
Passenger Rail (UK) - April-100%
-90%
-80%
-70%
-60%
-50%
-40%
-30%
-20%
-10%
0%
10%
20%
jan-20 feb-20 mrt-20 apr-20 mei-20 jun-20 jul-20 aug-20
Bulkers* (Global)Deep Sea Cargo (China)Deep Sea Cargo (Global)Air CargoFerryCruisePassenger Air
Varying ‘Shape’ of Recovery, % y-o-y
The Dry Bulk Shipping Market, Emissions & The Green Transition | Dry Bulk Terminals Group, 6 October 2020

The Green Transition, Emissions & Dry Bulk Shipping
6
Environmental pressures set to have a range of impacts on the dry bulk shipping sectors
The Dry Bulk Shipping Market, Emissions & The Green Transition | Dry Bulk Terminals Group, 6 October 2020
“The Energy Transition”
• Impacts on the energy mix (and production)
• Impacts on seaborne dry bulk (coal) trade volumes
Emissions Targets & “The Fuelling Transition”
• Impacts on vessel fuel and technology choices
• Impacts on vessel trading patterns
• Impacts on infrastructure requirements (including at ports)
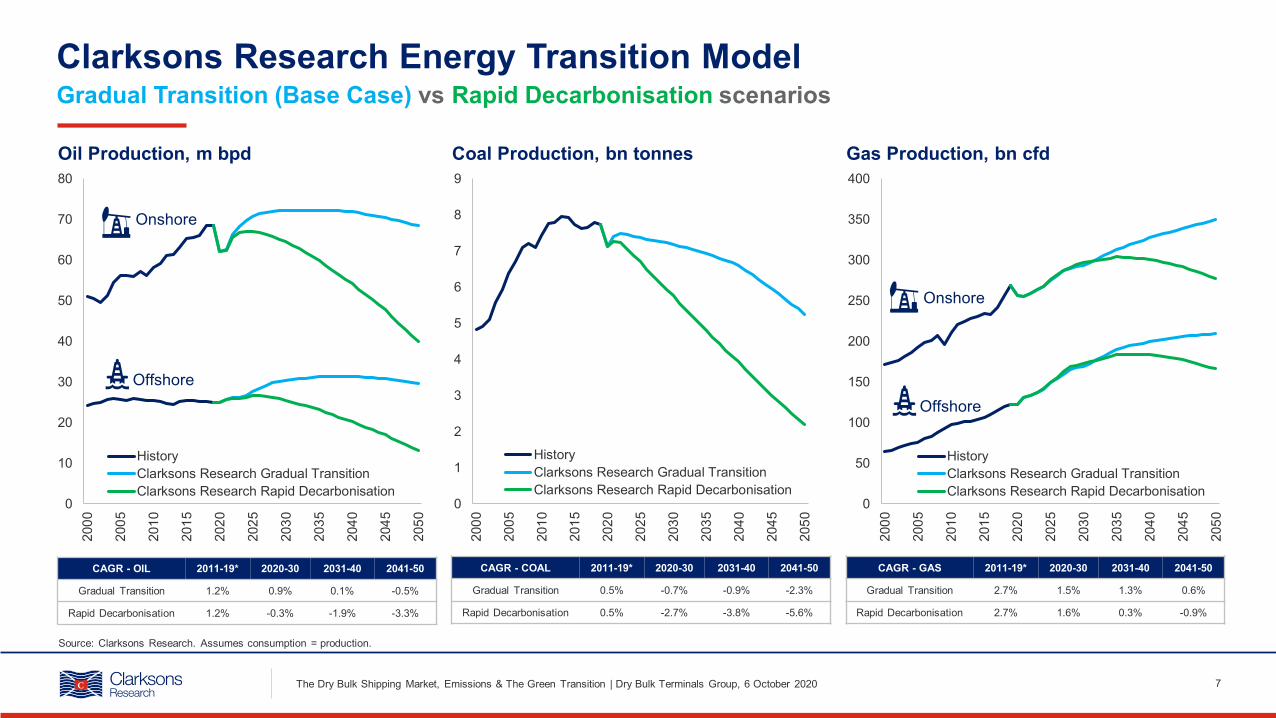
Gradual Transition (Base Case) vs Rapid Decarbonisation scenarios
Source: Clarksons Research. Assumes consumption = production.
Clarksons Research Energy Transition Model
7
0
10
20
30
40
50
60
70
80
2000
2005
2010
2015
2020
2025
2030
2035
2040
2045
2050
HistoryClarksons Research Gradual TransitionClarksons Research Rapid Decarbonisation
Onshore
Offshore
Oil Production, m bpd Coal Production, bn tonnes Gas Production, bn cfd
0
1
2
3
4
5
6
7
8
9
2000
2005
2010
2015
2020
2025
2030
2035
2040
2045
2050
HistoryClarksons Research Gradual TransitionClarksons Research Rapid Decarbonisation
CAGR - OIL 2011-19* 2020-30 2031-40 2041-50
Gradual Transition 1.2% 0.9% 0.1% -0.5%
Rapid Decarbonisation 1.2% -0.3% -1.9% -3.3%
CAGR - COAL 2011-19* 2020-30 2031-40 2041-50
Gradual Transition 0.5% -0.7% -0.9% -2.3%
Rapid Decarbonisation 0.5% -2.7% -3.8% -5.6%
CAGR - GAS 2011-19* 2020-30 2031-40 2041-50
Gradual Transition 2.7% 1.5% 1.3% 0.6%
Rapid Decarbonisation 2.7% 1.6% 0.3% -0.9%
0
50
100
150
200
250
300
350
400
2000
2005
2010
2015
2020
2025
2030
2035
2040
2045
2050
HistoryClarksons Research Gradual TransitionClarksons Research Rapid Decarbonisation
Onshore
Offshore
The Dry Bulk Shipping Market, Emissions & The Green Transition | Dry Bulk Terminals Group, 6 October 2020

Debate over long-term growth potential; coal and iron ore clearly face headwinds…
Source: Clarksons Research.
Long-Term Dry Bulk Trade Growth Scenarios
8
0
1
2
3
4
5
6
7
1990
1991
1992
1993
1994
1995
1996
1997
1998
1999
2000
2001
2002
2003
2004
2005
2006
2007
2008
2009
2010
2011
2012
2013
2014
2015
2016
2017
2018
2019
2020
2021
2022
2023
2024
2025
2026
2027
2028
2029
2030
Iron OreCoalGrainMinor Bulk
Long Term Dry Bulk Trade, bn tonnes
High Case: c.2% p.a. growth?
Low Case: c.0.5-1% p.a. growth ?Base Case: c.1.5% p.a. growth?
1990s: 3.5% growth p.a.
2000s: 5.1% growth p.a.
2010s: 3.5% growth p.a.
2020s: Key Themes• Peaking Chinese steel production & iron ore imports?
• Steam coal trade peaked/starting to ease back?• Grain trade and minor bulk trade become the major
drivers of growth, but maturing?
Base Case CAGRs:Iron ore 0.0%Coal -0.1% (Steam coal -0.4%)Grain 2.6%Minor bulk 2.1%
Base Case adding 0.9bt by 2030 compared to 1.2bt in 2010s
The Dry Bulk Shipping Market, Emissions & The Green Transition | Dry Bulk Terminals Group, 6 October 2020
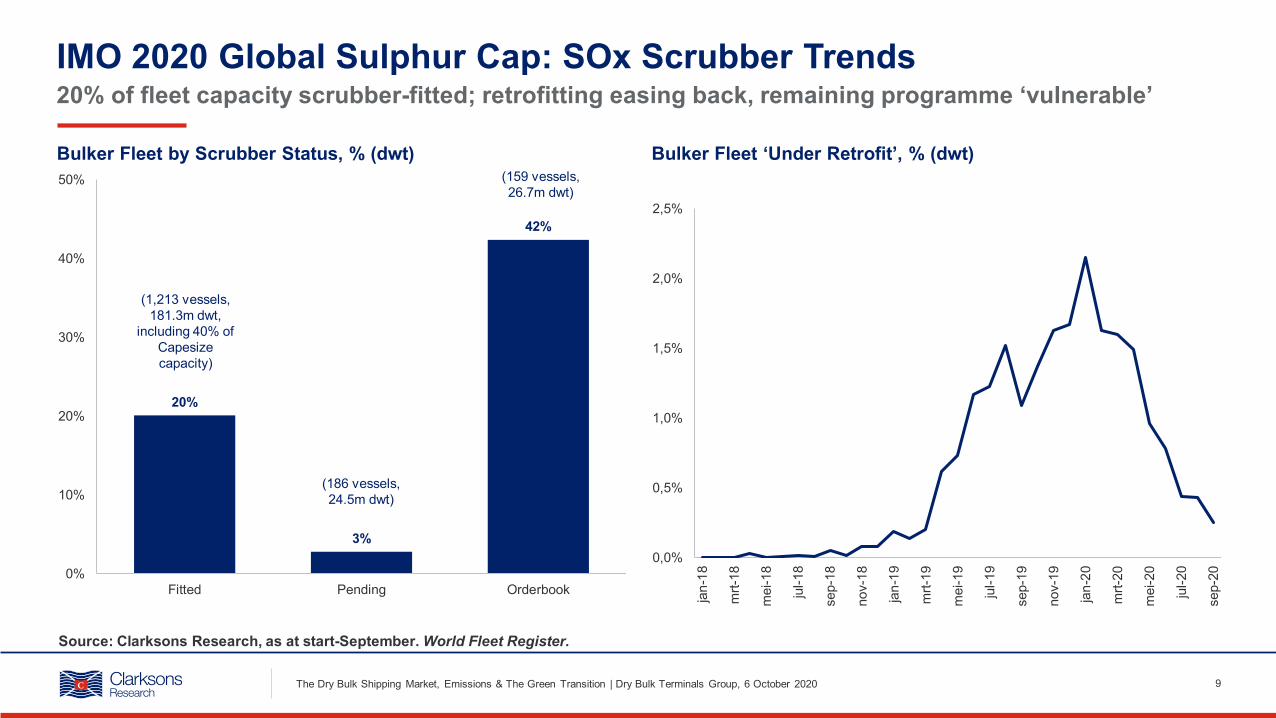
20% of fleet capacity scrubber-fitted; retrofitting easing back, remaining programme ‘vulnerable’
Source: Clarksons Research, as at start-September. World Fleet Register.
IMO 2020 Global Sulphur Cap: SOx Scrubber Trends
9
Bulker Fleet by Scrubber Status, % (dwt) Bulker Fleet ‘Under Retrofit’, % (dwt)
20%
3%
42%
0%
10%
20%
30%
40%
50%
Fitted Pending Orderbook
0,0%
0,5%
1,0%
1,5%
2,0%
2,5%
jan-
18
mrt-
18
mei
-18
jul-1
8
sep-
18
nov-
18
jan-
19
mrt-
19
mei
-19
jul-1
9
sep-
19
nov-
19
jan-
20
mrt-
20
mei
-20
jul-2
0
sep-
20
(1,213 vessels,181.3m dwt,
including 40% of Capesizecapacity)
(186 vessels,24.5m dwt)
(159 vessels,26.7m dwt)
The Dry Bulk Shipping Market, Emissions & The Green Transition | Dry Bulk Terminals Group, 6 October 2020
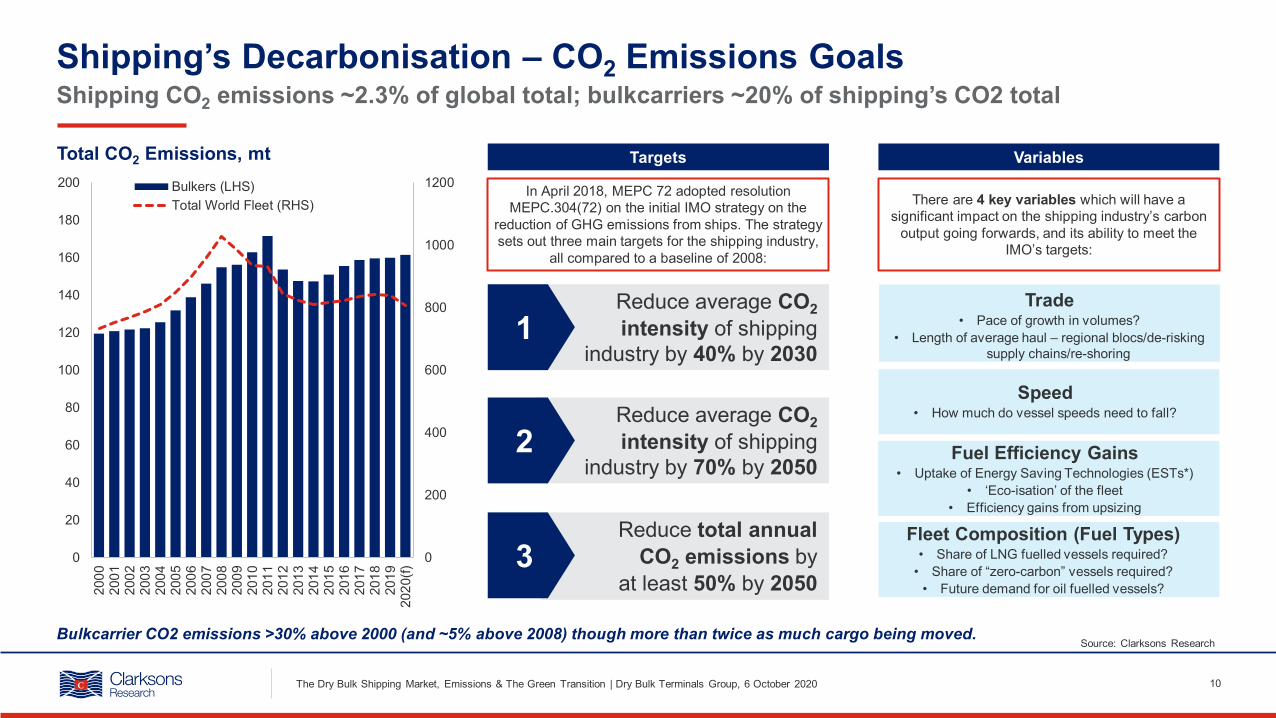
Shipping CO2 emissions ~2.3% of global total; bulkcarriers ~20% of shipping’s CO2 total
Source: Clarksons Research
Shipping’s Decarbonisation – CO2 Emissions Goals
10
0
200
400
600
800
1000
1200
0
20
40
60
80
100
120
140
160
180
200
2000
2001
2002
2003
2004
2005
2006
2007
2008
2009
2010
2011
2012
2013
2014
2015
2016
2017
2018
2019
2020
(f)
Bulkers (LHS)Total World Fleet (RHS)
Total CO2 Emissions, mt
The Dry Bulk Shipping Market, Emissions & The Green Transition | Dry Bulk Terminals Group, 6 October 2020
In April 2018, MEPC 72 adopted resolution MEPC.304(72) on the initial IMO strategy on the
reduction of GHG emissions from ships. The strategy sets out three main targets for the shipping industry,
all compared to a baseline of 2008:
Targets
Reduce average CO2intensity of shipping
industry by 40% by 20301
Variables
Reduce average CO2intensity of shipping
industry by 70% by 20502
Reduce total annualCO2 emissions by
at least 50% by 20503
There are 4 key variables which will have a significant impact on the shipping industry’s carbon
output going forwards, and its ability to meet the IMO’s targets:
Trade• Pace of growth in volumes?
• Length of average haul – regional blocs/de-risking supply chains/re-shoring
Speed• How much do vessel speeds need to fall?
Fleet Composition (Fuel Types)• Share of LNG fuelled vessels required?
• Share of “zero-carbon” vessels required?• Future demand for oil fuelled vessels?
Fuel Efficiency Gains• Uptake of Energy Saving Technologies (ESTs*)
• ‘Eco-isation’ of the fleet• Efficiency gains from upsizing
Bulkcarrier CO2 emissions >30% above 2000 (and ~5% above 2008) though more than twice as much cargo being moved.
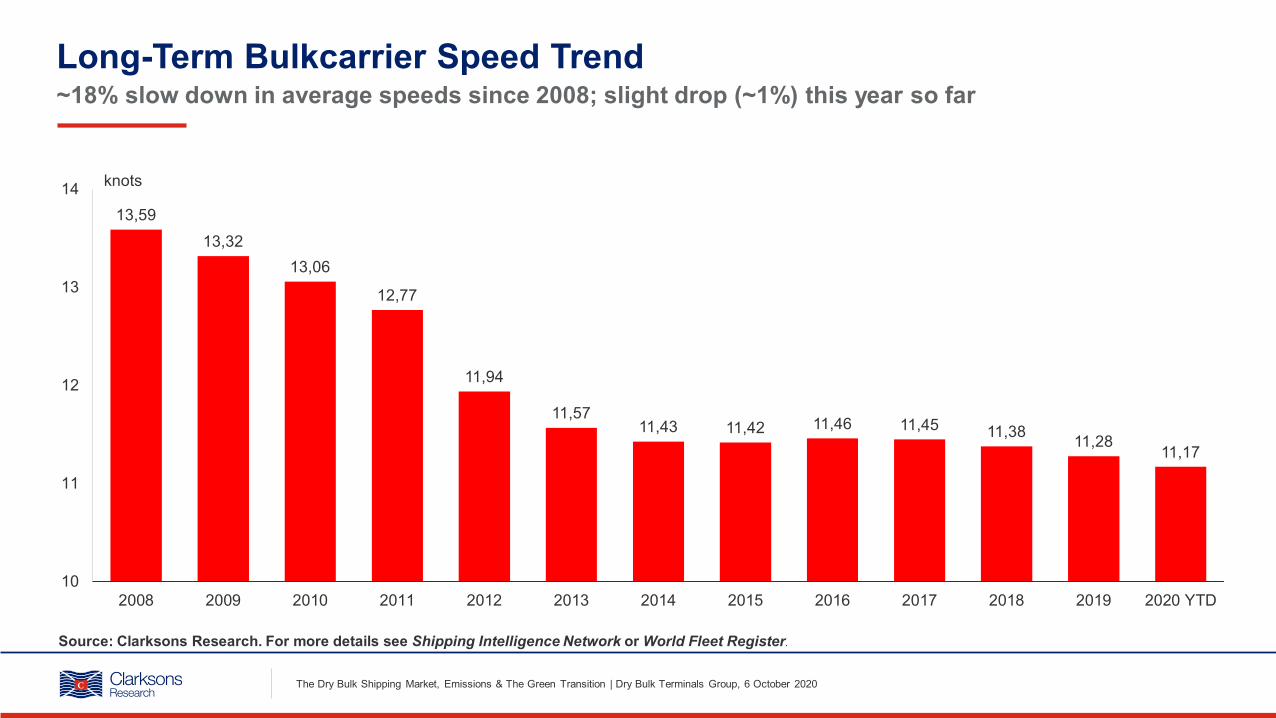
Long-Term Bulkcarrier Speed Trend~18% slow down in average speeds since 2008; slight drop (~1%) this year so far
13,5913,32
13,06
12,77
11,94
11,5711,43 11,42 11,46 11,45 11,38 11,28 11,17
10
11
12
13
14
2008 2009 2010 2011 2012 2013 2014 2015 2016 2017 2018 2019 2020 YTD
knots
Source: Clarksons Research. For more details see Shipping Intelligence Network or World Fleet Register.
The Dry Bulk Shipping Market, Emissions & The Green Transition | Dry Bulk Terminals Group, 6 October 2020

‘Eco’ fleet/orderbook, significant scrubber uptake, limited alternative fuel interest so far; plenty to do…
Source: Clarksons Research, see World Fleet Register for further details. BWMS = Ballast Water Management System. HVS = High Voltage Shore Connection.
The Bulkcarrier Fleet Technology Transition
12
27%20%
0%
45%
2%
100%
42%
2%0%
10%
20%
30%
40%
50%
60%
70%
80%
90%
100%
110%
Eco Scrubber Alt. fuel BWMS HVSC
Fleet
Orderbook
‘Eco’ characteristics/equipment uptake, % dwt
The Dry Bulk Shipping Market, Emissions & The Green Transition | Dry Bulk Terminals Group, 6 October 2020
Remainder of fleet requires Ballast Water Management
System in next ~4 years
‘Eco’ vessels ordered since 2012 with an electronic injection main engine
Limited take up of alternative fuels by
bulkcarrier owners so far

Alternative Fuels: Current Uptake By Shipping Sector
13
LNG gaining traction, limited bulker uptake, uncertainty over longer-term ‘solution’, many pros & cons
Source: Clarksons Research, Data As Of September 2020. World Fleet Register.‘Biofuel’ includes vessels reported to be using or designed for biofuels; many other vessels in the fleet are also capable of using biofuel blends. All ethane fuelled vessels are ethane/LPG or ‘multigas’ carriers.
Fleet (100+ GT) Using Alternative Fuels Orderbook (100+ GT) Set To Use Alternative Fuels
0
25
50
75
100LNG (c.580)LPG (1)Methanol (12)Ethane (6)Hydrogen (0)Biofuels (19)Battery/Hybrid (c.140)
0
25
50
75
100 LNG (c.360)LPG (31)Methanol (10)Ethane (14)Hydrogen (3)Biofuel (8)Battery/Hybrid (94)
c.400 LNG capable
LNG carriers
c.140 LNG capable
LNG carriers
c.70 Battery/Hybrid
Passenger Ferries
The Dry Bulk Shipping Market, Emissions & The Green Transition | Dry Bulk Terminals Group, 6 October 2020

Clarksons Research tracking uptake
Source: Clarksons Research, August 2020. Data coverage is not comprehensive and may underestimate total uptake.
Energy Saving Technologies (ESTs): Key Examples
14
Equipment Group Technologies Example Projects Fuel Savings
(Marketing claim)
Vessels Equipped (Fleet & Orderbook All Vessel Types)
Engine RoomWaste Heat Recovery System ABB, Calnetix Hydrocurrent 3-8% >38
Exhaust Gas Economiser Alfa Laval, Wartsila, Kangrim, Miura, Osaka, Others 4-6% >1,515
Propeller
Propeller Duct Becker Mewis Duct, other in-house shipyard designs 3-8% >1161
Pre-Swirl Stator DSME Pre-Swirl, Wartsila EnergoFlow 4-6% >8
Rudder Bulb Rolls-Royce Promas, Wartsila Energopac, other in-house shipyard designs 3-5% >268
Deck Equipment
Flettner Rotors Norsepower Rotor Sail (Maersk), Anemoi Wind Engine 7-10% >8
Rigid Sail DSIC 8-30% >2
Wind Kite Airseas Seawing Up to 20% >0
Solar Sail Eco Marine EnergySail Up to 20% >0
HullAir Lubrication System Silverstream, DSM ALS, Mitsubishi MALS, Samsung
SAVER Air 5-10% >71
Bow Enhancement Ulstein X-Bow, Damen Sea Axe, Kawasaki SEA-Arrow, other in-house shipyard designs 4-10% >252
The Dry Bulk Shipping Market, Emissions & The Green Transition | Dry Bulk Terminals Group, 6 October 2020
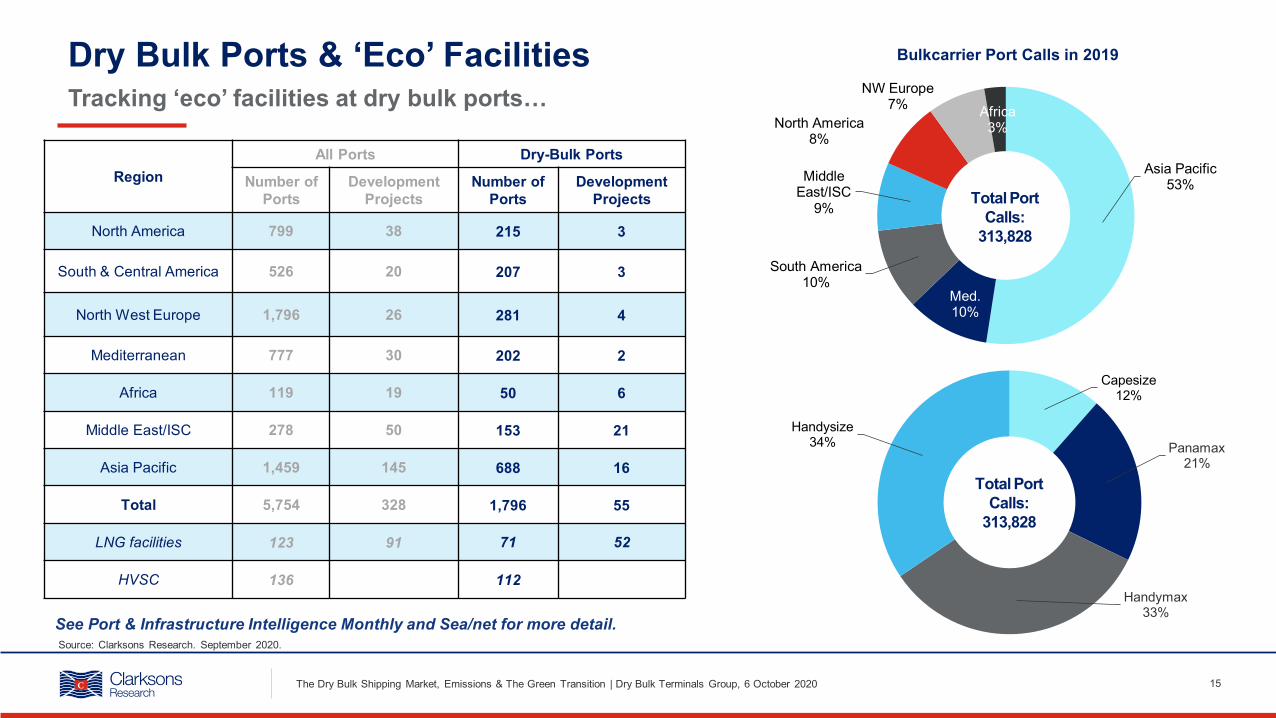
Dry Bulk Ports & ‘Eco’ Facilities
Source: Clarksons Research. September 2020.
Tracking ‘eco’ facilities at dry bulk ports…
15
RegionAll Ports Dry-Bulk Ports
Number of Ports
Development Projects
Number of Ports
Development Projects
North America 799 38 215 3
South & Central America 526 20 207 3
North West Europe 1,796 26 281 4
Mediterranean 777 30 202 2
Africa 119 19 50 6
Middle East/ISC 278 50 153 21
Asia Pacific 1,459 145 688 16
Total 5,754 328 1,796 55
LNG facilities 123 91 71 52
HVSC 136 112
See Port & Infrastructure Intelligence Monthly and Sea/net for more detail.
Asia Pacific53%
Med.10%
South America10%
Middle East/ISC
9%
North America8%
NW Europe7% Africa
3%
Total Port Calls:
313,828
Bulkcarrier Port Calls in 2019
Capesize12%
Panamax21%
Handymax33%
Handysize34%
Total Port Calls:
313,828
The Dry Bulk Shipping Market, Emissions & The Green Transition | Dry Bulk Terminals Group, 6 October 2020

Bulkcarrier Calls At Ports With ‘Eco’ Facilities Increasing
16
Proportion of total bulkcarrier port calls made at ports with LNG bunkering or HVSC facilities
Source: Clarksons Research. Data as of September 2020. See Port & Infrastructure Intelligence Monthly and Sea/net for more detail.Port calls data basis all instances of vessels entering and leaving a defined port location, excluding instances where vessel not recorded as travelling at less than 1 knot, and combining multiple consecutive instances at the same port where the vessel has not left a buffered shape around the port.
0%
2%
4%
6%
8%
10%
12%
14%
16%
18%
20%
2012 2013 2014 2015 2016 2017 2018 2019 2020
% Port Calls At LNG Bunkering Ports
% (Total GT)
30%
32%
34%
36%
38%
40%
2012 2013 2014 2015 2016 2017 2018 2019 2020
% Port Calls At HVSC Ports
% (Total GT)
HVSC port callings based on current active HSVC ports
The Dry Bulk Shipping Market, Emissions & The Green Transition | Dry Bulk Terminals Group, 6 October 2020

Stalling? Amplification?
• Stimulus prioritises economic activity, low oil & gas pricing, financial stress.
• Delays to planned IMO meetings including Marine Environment Protection Committee (MEPC).
• CAPEX spend under pressure from weak earnings.• Disruption at yards has led to special survey waivers, delaying
repair work and upgrades e.g. retrofitting of BWMS.• Potential for owners to focus on business continuity,
profitability and employment of vessels.• Low fossil fuel prices weakening incentive to transition to
alternative fuels or fit energy saving technologies (ESTs).• Operational difficulties mean some countries have suspended
inspections on compliance with regulation such as IMO 2020.
• Strong pre-Covid-19 trend, society pressures for sustainability is “amplified”, integrated into Covid-19 recovery.
• Increased demolition of older vessels and accelerated fleet renewal are likely.
• Low newbuild prices may drive shipyards to push additional green technology on newbuild vessels.
• Weak markets may provide suitable window for owners to undertake retrofit work on vessels.
• Lower trade volumes and idling of ships could have short-term impact on emissions.
• Owners may be able to make clearer decisions on technology after delaying newbuilding programmes e.g. choosing LNG fuel in 1-2 years when bunkering network is more developed.
Wide range of potential impacts on Energy Transition, Technology, Regulation & Infrastructure
Source: Clarksons Research
Green Transition: Stalling Or Amplification Of Pre-Covid-19 Trends?
17The Dry Bulk Shipping Market, Emissions & The Green Transition | Dry Bulk Terminals Group, 6 October 2020

Key Takeaways
18
Covid-19 impacts, the ‘Green Transition’, emissions reduction targets
The Dry Bulk Shipping Market, Emissions & The Green Transition | Dry Bulk Terminals Group, 6 October 2020
1. Covid-19 impacts - similar magnitude trade “shock” to global financial crisis, but sharper and impacts now “easing”; less severe impact than in other transportation/shipping sectors; 1H vessel earnings deeply depressed, some “windows” of improvement in 2H
2. “Energy Transition” - putting pressure on future dry bulk trade growth scenarios
3. “Green Transition” & Emissions Targets - “plenty to do”: “fuel transition”, alternative fuels, ESTs, trading patterns, infrastructure & port facilities
4. Post Covid-planning - environmental trends (including emissions control) generally “amplified”

Disclaimer
19
The material and the information (including, without limitation, any future rates and/or forward looking predictions) contained herein (together, the "Information") are provided by Clarkson Research Services Limited ("Clarksons Research") for general guidance and not by way of recommendation. The Information is provided on "as is" and “as available” basis. Clarksons Research and all its Group companies make no representations or warranties of any kind, express or implied about the completeness, accuracy, reliability, suitability or availability with respect to the Information. Any reliance placed on such Information is therefore strictly at the recipient's own risk and no responsibility is accepted for any loss or damage howsoever arising. Please note that future rates and/or forward looking predictions are for illustration purposes only and given without guarantee; the ultimate outcome may be different.
This Information is not for reproduction or distribution without Clarksons Research’s prior written consent. Especially, the Information is not to be used in any document for the purposes of raising finance whether by way of debt or equity. All intellectual property rights are fully reserved by Clarksons Research, its Group companies and/or its licensors.
This disclaimer shall be governed by and construed in accordance with English law.
CLARKSON RESEARCH SERVICES LTD, COMMODITY QUAY, ST KATHARINE DOCKS, LONDON, UNITED KINGDOM, E1W 1BF
Clarksons Research
The Dry Bulk Shipping Market, Emissions & The Green Transition | Dry Bulk Terminals Group, 6 October 2020