the dynamic co-movement of credit default swap and stock markets
TRANSCRIPT
������ 2008 � 12 � � � 1-27
���������� ����������������� ����������������� ����������������� ������������ � � � � � �� � � � � � �� � � � � � �� � � � � � �
The Dynamic Co-Movement of Credit Default Swap and Stock Markets: Evidence from Japan
���
���� � � � � � � � �
� � �
���� � � � � � � � � � � � � � �
Abstract
This study investigates the dynamic behavior of stock market and credit derivative market with a focus on lead-lag relations. We collect the daily CDS rate from the Tokyo International Financial Exchange (TIFFE), covering the period from March 2004 to July 2007. Seventy-eight reference entities are selected as our sample. We find that the long run cointegration relationship exits regardless of the comment of data. Second, stock return leads CDS spread in both VAR and VECM investigation. Third, volatility of stock return leads that of CDS return only in the short run, however, the volatility of CDS return conveys more information in the long run. Overall, the stock market, compare with the credit derivative market, plays a more important role for price discovery in Japan.
Keywords: Credit default swap, Stock market, Price discovery, VAR, VECM.
2 ������2008 � 12 � � �
I. Introduction:
In the mid of August 2007, there was a big brunt in U.S. subprime mortgage market. This crisis has disarranged the standard of U.S. credit derivative market, capital asset market and worldwide stock market, specially, in credit derivative Collateralized debt obligation (CDO)1 that includes subprime mortgage. After bad news being released, many investors sold quickly their relevant stocks and funds, which causes capital asset market declining. This event indicates the there seems to exist a spillover effort from credit derivative market to stock market and motivates us to investigate the dynamic behavior of stock market and credit derivative market with focus on lead-lag relations.
In the past decades, credit derivatives market in Japan has rapidly grown. According to the survey of British Banker’s Association2, CDS accounts for around 33% of the credit derivatives market, it is a popular credit derivative to reflect the default risk of particular firms and more liquidity than other credit derivatives. CDS is similar to an insurance resists credit risk for particular reference entity. The changes in a firm’s credit risk (the content of information) not only affect credit default swap prices on the firm, but also affect the firm’s market prices. Norden and Weber (2004) find that in efficient market, all claims of firms should be reflected by market prices of these firms. Hence, there is an approximate link between market prices of different claims. Therefore, the dynamic relation of stock market and CDS market is investigated, especially for the outbreak of subprime mortgage market crash in U.S. So far, relevant researches focus on the U.S. and the European market, relatively few studies have emphasized the Asian market. We empirically analyze the co-movement of CDS market and stock market at individual firm-level to investigate the price discovery in Japan.
Our study makes three contributions. First, this study compares their efficiency and the capacity of information content to examine which market provides more timely information. Second, beside the first moment discussion, CDS spreads versus stock returns, the second moment investigation between the volatility of CDS returns and that of stock returns will be additionally provided to enhance the understanding of nature of price discovery. Third, the investigation in the Asian market is emphasized.
We collect the daily CDS rate from the Tokyo International Financial Exchange (TIFFE), covering the period from March 2004 to July 2007. Seventy-eight reference entities are selected as our sample. Regardless of the comment of data, we find that CDS market and stock market exist in long run. Second, stock return leads CDS
1 CDO is a product of asset backed securities (ABS) for the portfolio of debt instruments. 2 BBA Credit Derivatives Report 2006 by Barrentt (Director Wholesale) and Ewan (BBA LIBOR Manager).
The Dynamic Co-Movement of Credit Default Swap and Stock Markets: Evidence from Japan 3
spread in both VAR and VECM investigation. Third, volatility of stock return leads that of CDS return only in the short run, however, the volatility of CDS return conveys more information in the long run. Overall, stock market mainly contributes to price discovery in Japan.
The reminder of the paper is organized as follow. In section 2, we review the literature and propose two hypotheses. Section 3, describes the data and Section 4 investigates empirically the short- and long- term relations between CDS market and stock market. Section 5 is conclusion.
II. Literature
The Price discovery, defined by Lehmann (2002), refers to the efficient and timely incorporation of the information implicit in investor trading into market prices. Conveyance of relative speed of new information about the credit risk of companies incorporates into different market has been concentrated for many scholars in recent years. A number of recent studies investigate the CDS-bond-stock market and CDS-bond market at the individual firm-level of price discovery (a lead-lag framework) and with data frequency (monthly, weekly, daily, hourly). Therefore, we first review lead-lag relationship of CDS and bond market, and survey the dynamic relationship among stock, CDS and bond market to focus on their contributions to price discovery.
1. The lead-lag relationship of CDS and bond market
Previous researches are related to the contemporaneous and intertemporal co-movement of corporate bond spreads and CDS spread changes. Passing over the region, the results of those researches solidly detect CDS market is the role of leading with respect to bond market.
Zhu (2004) compares the pricing of credit risk in the daily CDS market and daily bond market from 1999 to 2002 in U.S. market and Europe market. They find that CDS spreads and bond spreads have the relationships of long term, but there is a deviation between CDS and bond market in short term. VECM reports that CDS market leads bond market, however, CDS spread leads significantly bond spread in U.S. market compared to Europe market.
Blanco, Brennan and Marsh (2005) examine daily lead-lag relationships between CDS prices and investment-grade credit spreads of U.S. firms and European firms, both are the relationships of long term, which is cointegration, support for the hypothesis that CDS prices and credit spread changes move together in long term. And applying Vector error correct model (VECM) to analyze the measure of the contributions to price discovery, they find that CDS market leads bond market.

4 ������2008 � 12 � � �
2. The lead-lag relationship of CDS, bond, stock market
We incorporate additional variable, stock market, into CDS market and bond market to investigate their relationship. There is strong evidence that stock market leads CDS market and bond market, and CDS market has more leading characteristic than bond market.
Longstaff (2003) analyze the weekly data of CDS spreads changes, corporate bond spreads and stock returns to represent the lead-lag relationship for 67 U.S. firms with 1 lagged value and 2 lagged values. They find clear evidence that both CDS spreads and stock returns often lead corporate bond spreads in Vector-autoregressive model.
Norden and Weber (2004) analyze 24 U.S. firms, 58 Europe firms, 8 Asia firms of the response of stock and credit default swap (CDS) markets with three major agencies of rating announcements by event study methodology during the period from 2000 to 2002. They find that both markets not only forecast the rating downgrade, but also reviews for downgrade by all three agencies, and stock market leads CDS market to anticipates downgrade, reviews for downgrade is opposite to market. Due to reviews for downgrade often precede actual downgrade, they suggest that the CDS market leads stock market.
Norden and Weber (2007) investigate the relationships between Credit default swap (CDS), bond and stock markets with monthly, weekly and daily data during 2000-2002. Focusing on the intertemporal co-movement by VAR and on the dynamic adjustment process by VECM. They find that stock returns are noteworthily negative associated with bond and CDS spread changes, and stock market lead CDS and bond market, CDS is more sensitive to the stock market than the one of bond and stock market. Furthermore, CDS spread changes Granger cause bond spread changes for a higher number of reference entities than vice versa. Finally, CDS market is the role of price discovery for U.S. firms than European firms.
Forte and Peña (2007) investigate the sample of 20 firms North American and European companies dynamic relationship of price discovery between stock market implied credit spreads (ICS) that based on Leland and Toft’s (1996) structural credit risk model, CDS spreads, bond spreads in the period 2001-2003. The result of this paper is that stock leads CDS and bond more frequently than vice versa, and all of three variables exist the long run equilibrium, and then also observe assuredly the existence of leading role of the CDS market apropos of the bond market of previous researches. In light of previous literature, we propose the following hypotheses H1 and H2.

The Dynamic Co-Movement of Credit Default Swap and Stock Markets: Evidence from Japan 5
H1: Positive stock returns (return volatility) are associated with negative CDS spread changes
(return volatility).
As a rule, bear news incorporate the stock market which causes the decline of stock price for individual firm that, results from firm’s potential default risk will be increase, generates the CDS price will increase later on. Thence in of economics opinion, the relationship of both markets is negative. Norden and Weber (2007) make a description of three markets correlation, stock returns are significantly negative associated with bond and CDS spread changes.
H2: Stock market leads CDS market.
We expect the stock market leads CDS market for the following reasons. First, there is some prior empirical evidence which suggests information reflected earlier in stock market than CDS market, Norden and Weber (2007) and Forte and Peña (2007) find stock market leads CDS market with U.S. and European firms. Second, the institutional features of stock market is more developed than CDS market in Japan, the number of traders, trades and the trading volume and liquidity is clearly higher in stock market.
III. Data description
In this section, we explain how to collect data and summary its statistics, and then introduce the current development of credit derivative market and the popular credit derivatives such as Credit Default Swaps (CDS).
1. Data collection and descriptive analysis
We collect data on CDS market and stock market from Japan, which includes prices and individual firm characteristics. CDS data is gratefully provided by a Tokyo International Financial Exchange Inc. (TIFFX), which was established by worldwide large sized financial institutions in April 1989 under the Financial Futures Trading Law of Japan, includes 126 reference entities in June 11, 2007 and we collect these data which cover the period from March 26, 2004 to August 1, 2007. We select CDS quotes in the following restrictions: First, we exclude all quotes on reference entities without stock prices due to analyze the relation between CDS and stock market. Second, we ignore the number of CDS price observation which settled early before August 1, 2007. Third, we select all CDS that quotes are more than 200. Fourth, all firms’ credit rating is investment rating, no matter what the credit rating agency. Our study accepts four credit rating agencies which Japan credit rating agency, Rating and Investment Information Inc, Standard & Poor’s and Moody’s. This selection

6 ������2008 � 12 � � �
procedure leads to a final sample of 78 firms in 126 CDS observation. Finally, we combine the CDS data with time-serious of daily common stock closing prices obtained from Thomson Financial DataStream in local currency.
The eventual data set are the observations of 78 firms from the period March 26, 2004 to August 1, 2007. It covers 7 industries that are real estate, finance, building, transportation, commerce, telecommunications, manufacturing. However, the most important industries are finance (=10.3%), transportation (=19.2%) and manufacturing (=51.3%). The credit rating bases consist of four agencies, 59 of 78 firms come from Japan credit rating agency, 13 of 78 firms come from Standard & Poor’s, 3 of 78 firms come from Rating and Investment Information Inc, 3 of 78 firms Moody’s. The investment-credit rating combines with 7 firms on AAA credit rating, 22 firms on AA, 34 firms on A and 14 firms for BBB credit rating.
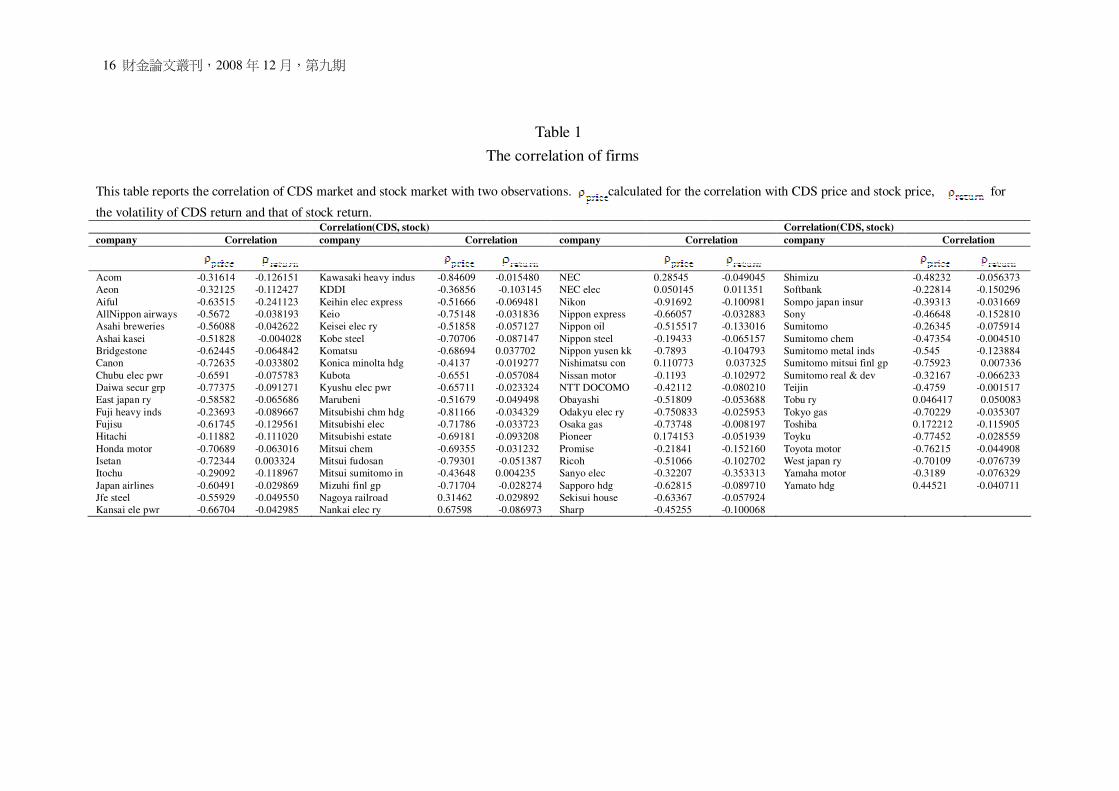
To acquire an impression of the contemporanceous co-movement of the two market, we investigate the correlation of both market with two observations, first observation is the individual CDS price and stock price time series, the second observation we utilize the volatility of CDS return and that of stock return in Table 1. It reveals that both markets exit a negative relation regardless the observation of data.
[ Insert Table 1 here ]
2. Credit derivatives
According to British Bankers’ Association (BBA) Credit Derivatives Report 2006, which reveals credit derivatives is one of the most important markets in banking today. The rapid growth in global credit derivatives market has outperformed the expectations that forecast a market size $8.2 trillion of 2006 from the 2004 BBA survey, then the survey of the end of 2006 BBA estimated the actual market size was $20 trillion. Banks consider that the growth will be continue, and anticipate the global credit derivatives market will have expanded to $33 trillion. There are kind of credit derivatives, in CDS represent a significant section of the market, the share is first largest product in table 2.
[ Insert Table 2 here ]
CDS is the most popular credit derivative and are transacted in the over-the-counter (OTC) market, notional principle amount is 500 million yen, that is a contract that provides an insurance to the buyer of protection to against the default risk by particular company. The buyer of protection has to pay periodic payment to the seller of protection until, whichever is first, the occurrence of a credit event or the maturity of the contract. The regular quarterly payments from the buyer of protection to the seller of protection cease when there is a credit event in Japan. Therefore the
The Dynamic Co-Movement of Credit Default Swap and Stock Markets: Evidence from Japan 7
buyer obtains the right to have the protection when a credit default event occurs, and the seller of the protection is obligated to give the protection to the buyer when a credit event occurs. These payments of default are either physical delivery of a reference asset (physical settlement) or a cash payment (cash settlement). The Physical Settlement is the way for delivering the credit asset in exchange for the specified amount of cash. Hence, the Physical Settlement is required in any default event in Japan market. Default events are in CDS market that all of the following:
A. Bankruptcy
B. Failure to pay
C. Restructuring (old restructuring)
The three definitions are based on the "the 2003 ISDA Credit Derivatives Definitions”, so these are not particularly problematic.
IV. The empirical relation between Credit Default Swaps and Stock and methodology.
This section analyses their efficiency and the capacity of information content based on CDS spreads versus stock returns, and volatilities of CDS spreads versus those of stock returns, respectively.
1. Credit Default Swaps price changes and Stock returns.
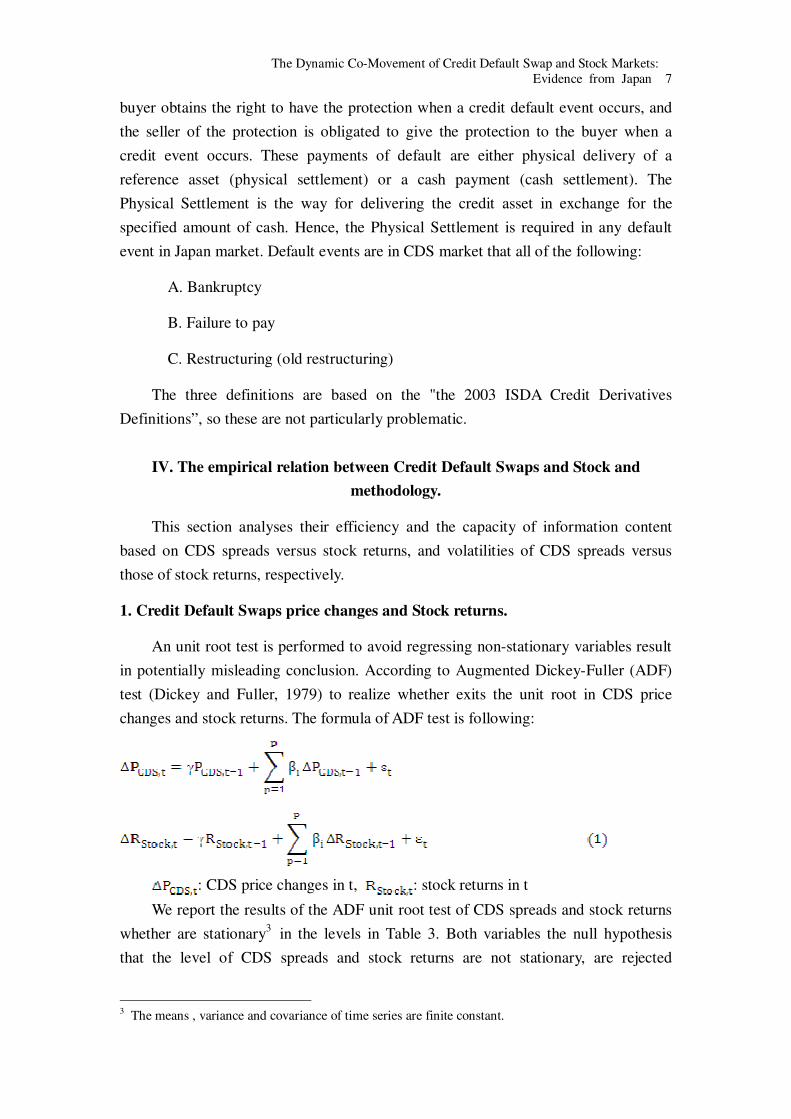
An unit root test is performed to avoid regressing non-stationary variables result in potentially misleading conclusion. According to Augmented Dickey-Fuller (ADF) test (Dickey and Fuller, 1979) to realize whether exits the unit root in CDS price changes and stock returns. The formula of ADF test is following:
: CDS price changes in t, : stock returns in t
We report the results of the ADF unit root test of CDS spreads and stock returns whether are stationary3 in the levels in Table 3. Both variables the null hypothesis that the level of CDS spreads and stock returns are not stationary, are rejected
3 The means , variance and covariance of time series are finite constant.

8 ������2008 � 12 � � �
forcefully. These results mean that original CDS price changes and stock returns do not have a unit root which is stationary variables. Whereby, we continue to analyze the dynamic relationship of CDS and stock market in short term by VAR.
[ Insert Table 3 here ]
The Vector Autoregressive (VAR) model provides a multi-variables or multi-regression, that variables were affected by its own lags and the other variables. Our basic model specification is the following:
With : CDS price changes in t, : stock return in t, p: lag order length,
: disturbance term in t. VAR approach is appropriate for develop lead-lag relationships within and
between stationary variables. In order to analyze the VAR model, we have to determine firstly the accurate lag length in VAR model, which is chosen by the Akaike Information Criterion (AIC). Norden and Weber (2004) find that the daily lag for 5 and weekly lag for 2 by median of the individual criteria from all 58 firms. We utilize the same method of choosing the median lags with the method of Norden and Weber (2004), is appropriate lag length of the median is 4 in all 78 firms. We estimate regression models with CDS spreads and stock returns as dependent variables to analyze the lead-lag relationship between markets.
Table 4 presents the results of VAR model for individual firms, which reports CDS price changes, dependent variables is CDS, was affected by past 4 lags of CDS price changes and past 4 lags of stock returns, but primary influences are lags length of 4 in CDS’s own and lags length of 3 in stock market. For dependent variable is stock price changes, was significantly affected by stock’s own at lags length of 4 and the lag 1 in CDS market. In addition the stock market leads the CDS market with lag 1 at 0.05-level for 23 of 78 firms. (31 of 78 firms at 0.1-level) With regard to CDS market leads stock market for lag 1 at 0.05-level for 7 of 78 firms. (at 0.1-level for 15 of 78 firms) More important, stock market leads CDS market for a higher number of firms than vice versa. As a whole, we could realize that analyzing the dynamic relationship of CDS price changes and stock price changes in short term, specifically, note that lags 1-4 of have a significantly negative impact on while the same is true for lags 1-4 of , that support H1.

The Dynamic Co-Movement of Credit Default Swap and Stock Markets: Evidence from Japan 9
[ Insert Table 4 here ]
After understanding stock market leads CDS market in short term, we could investigate whether the long run relationship is identical result with VAR model. In the reminder analysis, we utilize the VECM to further investigate the long run adjustment process between CDS spread and stock return. The specific formula of VECM is following:
The coefficients and are the error correction term which are speed of adjustment parameters. If the coefficient is positive, the variable was underestimated in short term, it will adjust incrementally next term and if the coefficient is negative, the variable was overestimated in short term, it will adjust
diminishingly next term. And if is significant, the CDS market is contributing significantly to the price discovery, if is significant, the stock market is contributing significantly to the price discovery, however, if both coefficients are significant, the smaller coefficient it is, the more capacity of price discovery it has.
First of all, we utilize the cointegration, using both variables of lags 4 to be examined the relation of the long term by Engle-Granger test, to observe the long run relationship of CDS market and stock market. If two variables exit cointegration which means both variables have a long run relationship. All firms are stationary in long term, indicating CDS price change and stock return move together in the long term, but may deviate from each other in the short run. Table 5 reports the result of VECM model that 29 firms price discovery takes place significantly only in the stock market and for 49 firms in the CDS and stock market, however, the coefficients of stock return are smaller than that of CDS spread. As a result, stock market is clearly more important for price discovery than CDS market.
[ Insert Table 5 here ]
Finally, the conclusion with Credit Default Swaps price changes and Stock returns has been detected: i) CDS spread and stock return exist long term relationship. ii) CDS spreads and stock returns are significantly negative relation. iii) Stock return leads CDS spread in VAR and VECM.

10 ������2008 � 12 � � �
2. Volatility of the return of Credit Default Swaps and Stock. Both the volatilities of CDS returns and those of stock returns are stationary in
Table 6. The volatility of CDS returns and that of stock returns are from Augmented Dickey-Fuller (ADF) model. Due to their stationary, we further analyze the dynamic relationships of the volatility of CDS return and that of stock return in Japan. The ADF model describes specifically following:
[ Insert Table 6 here ]
In order to analyze the relationship of volatility of CDS return and that of Stock
return, we follow the method by Huang et al. (2005), the standardized residual from a GARCH(1,1) model (Sadorsky, 1999) as the shown below:
The standardized residual error is estimated by Note that is the
conditional variance at t and are the volatility of CDS returns and stock returns, respectively. Without regard to difference of the lag length of individual firm, we investigate the volatility of CDS return and Stock return by GARCH (1,1).
Obviously, the standard volatility of the return of CDS and stock which are specified by and are stationary by the unit root test. Although the
Granger causality does not provide powerful evidence on economic causality, it provides insightful proofs to the direction of the linkage of two variables. The formula of VAR model is following:

The Dynamic Co-Movement of Credit Default Swap and Stock Markets: Evidence from Japan 11
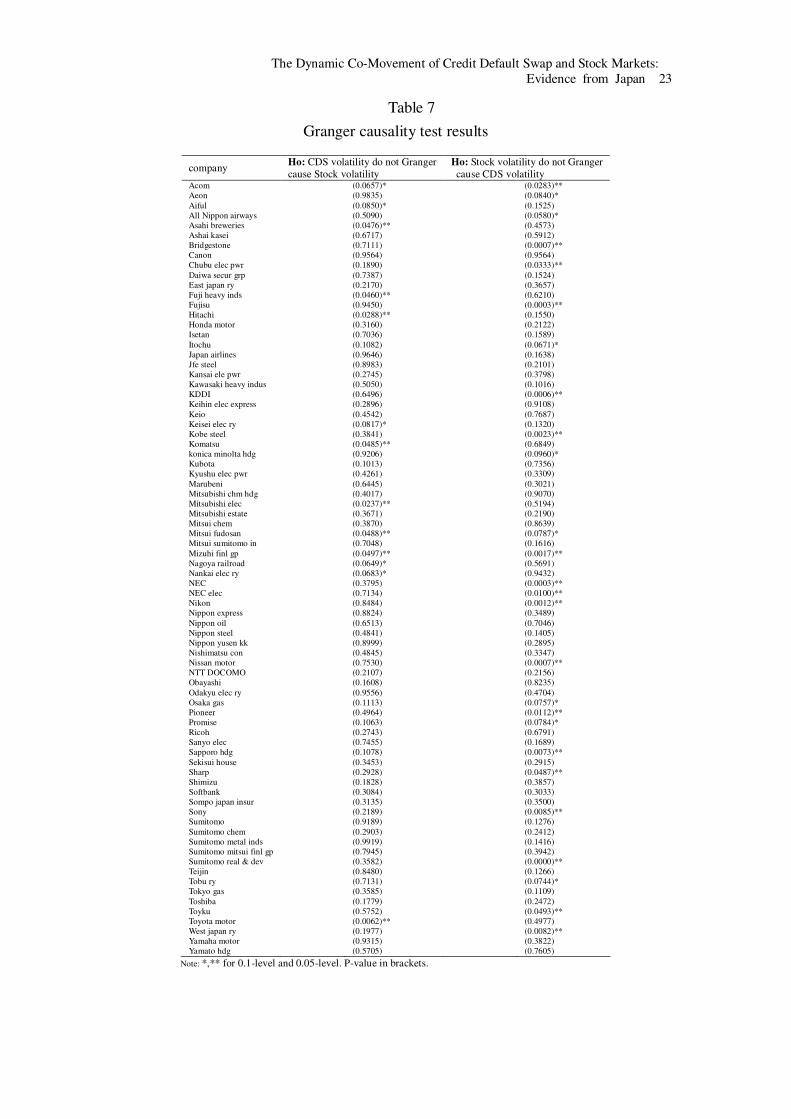
Table 7 reports the results of Granger causality tests with different lag length of
individual entities. According to the Table 7, Granger causality test is performed with a significance level of 5% and 10%. At the 5%-level, there is bi-lateral causality of 2 reference entities, and no causal relationship in 53 entities. However, there is unilateral causality of 24 entities. 17 of 24 entities are unilateral relationships from the stock return volatility to CDS return volatility, while other are from the CDS return volatility to stock return volatility. At the 10%-level, 3 reference entities are bi-lateral causality, and 33 entities are unilateral causality. 23 of 33 entities are from stock return volatility to CDS return volatility, and 10 of 33 entities are from CDS to stock. Overall, stock return volatility Granger causes CDS return volatility. However, Granger causality test does not directly explain that connection of a certain direction of causality relationships between volatility of CDS return and volatility of stock return (see Zhu (2004)). VAR model is employed to further examine their dynamic connection.
[ Insert Table 7 here ]
Base on the Akaike Information Criterion (AIC), VAR model provides an appropriate the lag length for individual firms. The maximal lag is 11 and the minimal lag is 1. There are 48 firms in lag 1, 13 firms in lag 2, 4 firms in lag 3, 6 firms in lag 4, 3 firms in lag 5, 2 firms in lag 7, 1 firm in lag 8 and in lag 11. Norden and Weber (2004) who collect daily, weekly and monthly of CDS, stock and bond find that the daily lag is 5, lag 2 for weekly data and lag 2 for monthly data. Zhu (2004) finds that appropriate daily lag for CDS and bond are 5.
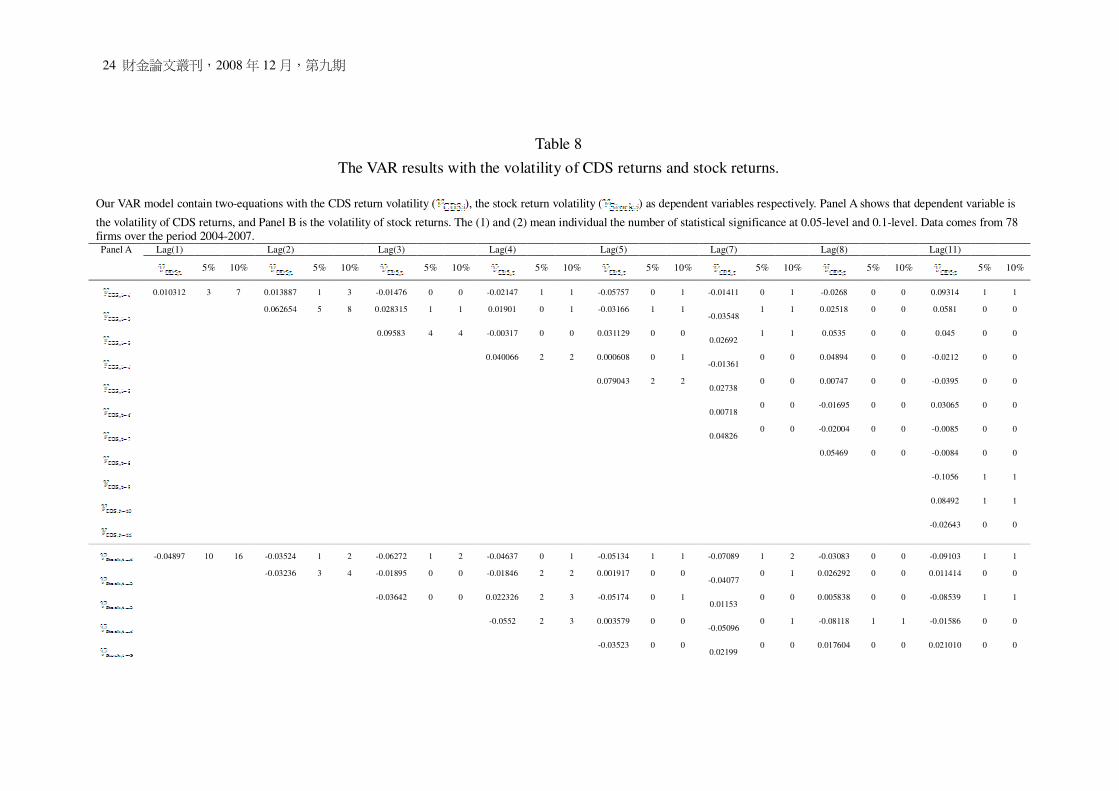
The result in Table 8 reports the medians of estimated coefficients by VAR of individual firm with dependent variables of CDS return (Panel A) and stock return (Panel B). Regardless of the significant level, the volatility of CDS return was affected by both previous CDS returns and stock returns.
We can find that at the lag 1 in both Panel A and B, the number of the volatility of stock returns lead that of CDS returns at o.o5-level (0.1-level) in 10 (16) firms is higher than the volatility of CDS returns lead stock returns at 0.05-level (0.1-level) in 6 (9) firms. In lag 2 of both panels with 13 firms, stock market remarkably contributes with regard to the contribution of CDS market. Obviously, regardless of those lags,
12 ������2008 � 12 � � �
stock market is a more important role for price discovery.
[ Insert Table 8 here ]
By comparing Panel A with Panel B, we find that the negative relationship exists for most of firms which supports H1. Furthermore, both historical the volatility of CDS return and stock return have a feedback relationship, but stock return volatility significantly leads CDS return volatility at both 0.05-level and 0.1-level.
In summary, we find that stock return volatility leads CDS return volatility in Japan market, and there is an approximately negative relationship between CDS and stock return volatility. Our findings are different from those in U.S. firms ( Longstaff et al. (2003)), but consistent with that of Norden and Weber (2004) who analyzes European, U.S. and Asian markets and find that stock market leads CDS market. Because CDS market in U.S. is more well developed than that in Japan.
In order to understand whether the volatility of CDS returns and stock returns are stationary for long term, we examine the cointegration test for the volatility of CDS returns and that of stock return. Based on Akaike Information Criterion (AIC) of VAR model to choose appropriate lag length, both variables of all firms reject null hypothesis of ADF test of residuals, implying that volatility of CDS and that of stock return move together in the long run.
Both variables have a cointegration effect which implies that there is a direction of permanent adjustment process to an economic equilibrium in long term. Although in short term, variables could deviate from equilibrium of long term, the deviation will converge in the long run. We use the following vector error correction model (VECM) specification:
Table 9 reports the medians of estimated coefficients for all sample firms. We find that price discovery occurs significantly only in stock market with 13 firms, in CDS market with 4 firms. Contemporaneous price discovery in both CDS and stock market is found with 61 firms, even coefficients of CDS market are smaller than those of stock market with 41 firms. Overall, CDS market leads strongly stock market with 45 firms and stock market contribute to price discovery with 33 firms. In other words,
The Dynamic Co-Movement of Credit Default Swap and Stock Markets: Evidence from Japan 13
CDS market is exclusive contribution to price discovery in long run.
[ Insert Table 9 here ]
In conclusion, the volatility of Credit Default Swaps returns and that of Stock returns has been examined and found that: i) Both CDS market and stock market exist long term relationship. ii) The correlation of the volatility of both returns is significantly negative. iii) The volatility of Stock return leads that of CDS return in VAR, though, CDS market is an obviously leading role of long run.
V. Conclusions
We investigate the dynamic behavior of stock market and credit derivative market with a focus on lead-lag relations to compare their efficiency and the capacity of information content. Beside the first moment discussion, CDS spreads versus stock returns, second moment investigation between the volatility of CDS returns and that of stock returns will be additionally provided to enhance the understanding of nature of price discovery.
We collect the daily CDS rate from the Tokyo International Financial Exchange (TIFFE), covering the period from March 2004 to July 2007. Seventy-eight reference entities are selected as our samples. We find that the long run cointegration relationship exits regardless of the comment of data. Second, stock return leads CDS spread in both VAR and VECM investigation. Third, volatility of stock return lead that of CDS return only in the short run, however, the volatility of CDS return conveys more information in the long run. Overall, the stock market, compare with the credit derivative market, plays a more important role for price discovery in Japan. Such as analysis provides the implications for trading strategies, risk management, policy and regulation in Japan.

14 ������2008 � 12 � � �
Reference
1. �� � � � 96 � � � � � � - � � � � � � � � � � � � ! "#$
2. % & ! � � 95 ' ( ) � * + , - . /- 0 1 � 2 3 4 � � 5 6 *7 8 � 9 : ; 8 < = > ? @ A $
3. B C D � � 96 � � � � � � - � � � � � E � � � F G " H $ 4. I J A K L M � � 95 ' N O ( P ) Q R S T U ( P V W � X 0 1
Y , � Z [ 5 \ 7 ] ^ 8 _ ` 26 a ` 1/$ 5. b A c � � 91 ' 0 1 Y , de f g h d� ) Q i j ─ N ( /- ) Q
� Z [ 5 � � � � 8 k `l a `m /$
6. Bwo-Nung Huang, M.J. Hwang, Hsiao-Ping Peng, 2005, "The asymmetry of the impact of oil price shocks on economic activities: An application of the multivariate threshold model" Energy Economics 27,455-476
7. Francis A. Longstaff, Sanjay Mithal, Eric Neis, 2003, "The Credit-Default Swap Market: In Credit Protection Priced Correctly?" Working Paper.
8. Gong-meng Chen, Michael Firth, Oliver Meng Rui, 2002, "Stock market linkages: Evidence from Latin America" Journal of Banking & Finance 26, 1113-1141.
9. Haibin Zhu, 2004, "An empirical comparsion of credit spreads between the bond market and the credit default swap market", BIS Working Papers,No 160.
10. Hwahsin Cheng, John L. Glascock, 2006, "Stock Market Linkages Before and After the Asian Financial Crisis: Evidence from Three Greater China Economic Area Stock Markets and the US" Review of Pacific Basin Financial Markets and Policies Vol.9, No.2, 297-315.
11. John C. Hull, Fundamentals of Futures and Options Markets. Fifth Edition. 12. Lars Norden, Martin Weber, 2004,"Informational efficiency of credit default
swap and stock markets: The impact of credit rating announcements"Journal of Banking & Finance 28, 2813-2843.
13. Lars Norden, Martin Weber, 2007,"The Co-movement of Credit Default Swap, Bond and Stock Markets: an Empirical Analysis" European Financial Management.
14. Maghyereh Aktham, 2004, "Oil price shocks and Emerging stock market: A Generalized VAR approach", International Journal of Applied Econometrics and Quantitative Studies, Vol. 1-2.
15. Roberto Blanco, Simon Brennan, Ian W. Marsh, 2005,"An Empirical Analysis of the Dynaimic Relation between Investment-Grade Bonds and Credit Default Swaps" The Journal of Finance.VOL. LX, No.5.

The Dynamic Co-Movement of Credit Default Swap and Stock Markets: Evidence from Japan 15
16. Santiago Forte, Juab Ignacio Peña, 2007,"Credit Spreads: Theory and Evidence on the informational content of Stocks, Bonds, and CDS" Working Paper.
16 �������2008 � 12 � � �
Table 1 The correlation of firms
This table reports the correlation of CDS market and stock market with two observations. calculated for the correlation with CDS price and stock price, for
the volatility of CDS return and that of stock return. Correlation(CDS, stock) Correlation(CDS, stock) company Correlation company Correlation company Correlation company Correlation
Acom -0.31614 -0.126151 Kawasaki heavy indus -0.84609 -0.015480 NEC 0.28545 -0.049045 Shimizu -0.48232 -0.056373 Aeon -0.32125 -0.112427 KDDI -0.36856 -0.103145 NEC elec 0.050145 0.011351 Softbank -0.22814 -0.150296 Aiful -0.63515 -0.241123 Keihin elec express -0.51666 -0.069481 Nikon -0.91692 -0.100981 Sompo japan insur -0.39313 -0.031669 AllNippon airways -0.5672 -0.038193 Keio -0.75148 -0.031836 Nippon express -0.66057 -0.032883 Sony -0.46648 -0.152810 Asahi breweries -0.56088 -0.042622 Keisei elec ry -0.51858 -0.057127 Nippon oil -0.515517 -0.133016 Sumitomo -0.26345 -0.075914 Ashai kasei -0.51828 -0.004028 Kobe steel -0.70706 -0.087147 Nippon steel -0.19433 -0.065157 Sumitomo chem -0.47354 -0.004510 Bridgestone -0.62445 -0.064842 Komatsu -0.68694 0.037702 Nippon yusen kk -0.7893 -0.104793 Sumitomo metal inds -0.545 -0.123884 Canon -0.72635 -0.033802 Konica minolta hdg -0.4137 -0.019277 Nishimatsu con 0.110773 0.037325 Sumitomo mitsui finl gp -0.75923 0.007336 Chubu elec pwr -0.6591 -0.075783 Kubota -0.6551 -0.057084 Nissan motor -0.1193 -0.102972 Sumitomo real & dev -0.32167 -0.066233 Daiwa secur grp -0.77375 -0.091271 Kyushu elec pwr -0.65711 -0.023324 NTT DOCOMO -0.42112 -0.080210 Teijin -0.4759 -0.001517 East japan ry -0.58582 -0.065686 Marubeni -0.51679 -0.049498 Obayashi -0.51809 -0.053688 Tobu ry 0.046417 0.050083 Fuji heavy inds -0.23693 -0.089667 Mitsubishi chm hdg -0.81166 -0.034329 Odakyu elec ry -0.750833 -0.025953 Tokyo gas -0.70229 -0.035307 Fujisu -0.61745 -0.129561 Mitsubishi elec -0.71786 -0.033723 Osaka gas -0.73748 -0.008197 Toshiba 0.172212 -0.115905 Hitachi -0.11882 -0.111020 Mitsubishi estate -0.69181 -0.093208 Pioneer 0.174153 -0.051939 Toyku -0.77452 -0.028559 Honda motor -0.70689 -0.063016 Mitsui chem -0.69355 -0.031232 Promise -0.21841 -0.152160 Toyota motor -0.76215 -0.044908 Isetan -0.72344 0.003324 Mitsui fudosan -0.79301 -0.051387 Ricoh -0.51066 -0.102702 West japan ry -0.70109 -0.076739 Itochu -0.29092 -0.118967 Mitsui sumitomo in -0.43648 0.004235 Sanyo elec -0.32207 -0.353313 Yamaha motor -0.3189 -0.076329 Japan airlines -0.60491 -0.029869 Mizuhi finl gp -0.71704 -0.028274 Sapporo hdg -0.62815 -0.089710 Yamato hdg 0.44521 -0.040711 Jfe steel -0.55929 -0.049550 Nagoya railroad 0.31462 -0.029892 Sekisui house -0.63367 -0.057924 Kansai ele pwr -0.66704 -0.042985 Nankai elec ry 0.67598 -0.086973 Sharp -0.45255 -0.100068

The Dynamic Co-Movement of Credit Default Swap and Stock Markets: Evidence from Japan 17
Table 2
The product range of credit derivatives market
Type 2000 2002 2004 2006
Basket products 6.0% 6.0% 4.0% 1.8% Credit linked notes 10.0% 8.0% 6.0% 3.1% Credit spread options 5.0% 5.0% 2.0% 1.3% Equity linked credit products n/a n/a 1.0% 0.4% Full index trades n/a n/a 9.0% 30.1% Single-name credit default swaps 38.0% 45.0% 51.0% 32.9% Swaptions n/a n/a 1.0% 0.8% Synthetic CDOs-full capital n/a n/a 6.0% 3.7% Synthetic CDOs-partial capital n/a n/a 10.0% 12.6% Tranched index trades n/a n/a 2.0% 7.6% Others 41.0% 36.0% 8.0% 5.7% From: British Bankers’ Association – credit derivatives report 2006

18 �������2008 � 12 � � �
Table 3 Unit root test results of CDS spread and stock return.
This table shows that the ADF of all firms at 5% and 10% with t-statistical (p-value in brackets). The (1) express the variable of CDS spreads and (2) the variable of Stock returns. Data stems from 78 firms over the period 2004-2007.
Observation Observation
Company (1) (2) Company (1) (2)
Acom -19.24939** (0.0000) -30.03036** (0.0000) Mitsui chem -21.96849** (0.0000) -28.95101** (0.0000)
Aeon -21.43314** (0.0000) -30.53505** (0.0000) Mitsui fudosan -23.04474** (0.0000) -27.20974** (0.0000)
Aiful -26.07572** (0.0000) -29.41924** (0.0000) Mitsui sumit in -20.53723** (0.0000) -30.56131** (0.0000)
All Nipp air -20.31503** (0.0000) -27.35353** (0.0000) Mizuhi finl gp -22.65510** (0.0000) -25.46274** (0.0000)
Asahi breweri -20.78852** (0.0000) -30.05606** (0.0000) Nagoya railroad -9.480680** (0.0000) -14.95282** (0.0000)
Ashai kasei -16.54642** (0.0000) -21.09448** (0.0000) Nankai elec ry -8.717583** (0.0000) -17.93601** (0.0000)
Bridgestone -19.92286** (0.0000) -28.78791** (0.0000) NEC -20.86261** (0.0000) -27.32153** (0.0000)
Canon -22.25172** (0.0000) -27.97926** (0.0000) NEC elec -19.27863** (0.0000) -22.26897** (0.0000)
Chubu elec p -17.70392** (0.0000) -30.64385** (0.0000) Nikon -20.92766** (0.0000) -27.71539** (0.0000)
Daiw secur g -20.08901** (0.0000) -26.80697** (0.0000) Nippon express -21.64152** (0.0000) -24.76989** (0.0000)
East japan ry -17.20428** (0.0000) -30.21388** (0.0000) Nippon oil -19.97534** (0.0000) -29.92215** (0.0000)
Fuji hea ind -16.41626** (0.0000) -29.66190** (0.0000) Nippon steel -19.40789** (0.0000) -30.91745** (0.0000)
Fujisu -21.63407** (0.0000) -28.68254** (0.0000) Nippon yusen kk -20.13142** (0.0000) -24.12787** (0.0000)
Hitachi -19.65793** (0.0000) -29.50780** (0.0000) Nishimatsu con -12.19397** (0.0000) -17.50393** (0.0000)
Honda motor -19.09216** (0.0000) -29.35527** (0.0000) Nissan motor -20.90657** (0.0000) -26.11516** (0.0000)
Isetan -19.92855** (0.0000) -22.58574** (0.0000) NTT DOCOMO -17.04624** (0.0000) -29.02658** (0.0000)
Itochu -15.51188** (0.0000) -21.31906** (0.0000) Obayashi -19.33660** (0.0000) -26.22112** (0.0000)
Japan airlines -17.71446** (0.0000) -28.39945** (0.0000) Odakyu elec ry -16.57743** (0.0000) -24.85957** (0.0000)
Kansai ele pw -22.63317** (0.0000) -29.47725** (0.0000) Osaka gas -20.83403** (0.0000) -32.45795** (0.0000)
Jfe steel -18.71801** (0.0000) -30.08219** (0.0000) Pioneer -10.69952** (0.0000) -13.31259** (0.0000)
Kawa hea Ind -22.11046** (0.0000) -28.53304** (0.0000) Promise -18.97794** (0.0000) -29.20135** (0.0000)
KDDI -22.32763** (0.0000) -28.15779** (0.0000) Ricoh -21.21125** (0.0000) -30.10843** (0.0000)
Keihin elec ex -22.69073** (0.0000) -24.23950** (0.0000) Sanyo elec -23.80497** (0.0000) -29.75120** (0.0000)
Keio -19.33585** (0.0000) -20.70625** (0.0000) Sapporo hdg -21.41287** (0.0000) -28.91922** (0.0000)
Keisei elec ry -11.36809** (0.0000) -14.82102** (0.0000) Sekisui house -20.56542** (0.0000) -28.47973** (0.0000)
Kobe steel -19.20126** (0.0000) -26.48466** (0.0000) Sharp -19.25028** (0.0000) -26.94211** (0.0000)
Komatsu -17.40578** (0.0000) -24.72228** (0.0000) Shimizu -17.54506** (0.0000) -23.20104** (0.0000)
konica min h -9.27559** (0.0000) -16.26611** (0.0000) Softbank -14.80401** (0.0000) -21.90175** (0.0000)
Kubota -19.50429** (0.0000) -23.30763** (0.0000) Sompo jap insur -20.61827** (0.0000) -29.59498** (0.0000)
Kyus elec pwr -15.16500** (0.0000) -23.33220** (0.0000) Sony -21.42754** (0.0000) -26.78825** (0.0000)
Marubeni -11.30859** (0.0000) -14.40410** (0.0000) Sumitomo -18.52407** (0.0000) -27.40086** (0.0000)
Note: ADF unit root test with the Ho: Variables have a unit root. *,** for 0.1-level and 0.05-level.

The Dynamic Co-Movement of Credit Default Swap and Stock Markets: Evidence from Japan 19
Table 3-Continued
Observation Observation
Company (1) (2) Company (1) (2)
Mitsub chm h -14.33841** (0.0000) -21.22470** (0.0000) Sumitomo chem -18.74285** (0.0000) -29.91897** (0.0000)
Mitsubi elec -18.32316** (0.0000) -32.11083** (0.0000) Sumito metl inds -20.26656** (0.0000) -30.57429** (0.0000)
Mitsubishi es -21.90605** (0.0000) -26.23756** (0.0000) Sumit mit finl gp -19.79624** (0.0000) -25.76314** (0.0000)
Sumito rl & d -11.29645** (0.0000) -14.24398** (0.0000) Toyku -18.37838** (0.0000) -26.40370** (0.0000)
Teijin -22.49743** (0.0000) -22.98126** (0.0000) Toyota motor -14.26473** (0.0000) -24.35898** (0.0000)
Tobu ry -13.65308** (0.0000) -17.89926** (0.0000) West japan ry -16.88323** (0.0000) -22.23613** (0.0000)
Tokyo gas -19.05199** (0.0000) -33.65852** (0.0000) Yamaha motor -17.04900** (0.0000) -29.75417** (0.0000)
Toshiba -20.34488** (0.0000) -26.24067** (0.0000) Yamato hdg -18.83415** (0.0000) -21.16755** (0.0000)
Note: ADF unit root test with the Ho: Variables have a unit root. *,** for 0.1-level and 0.05-level.
Table 4 Firm-specific results from estimation of the VAR model
This table reports the median coefficient of all firms and the number of statistical significance at 0.05-level and 0.1-level. Data stems from 78 firms over the period 2004-2007.
Ind Var.
Dep Var. Coefficient 5% 10% Coefficient 5% 10%
0.28330 76 76 0.00047 7 15
0.03662 35 40 -0.0005 4 7
0.08472 42 46 -0.0005 3 8
-0.01564 23 24 0.00003 7 8
-0.98247 23 31 -0.01581 15 21
-0.27614 6 10 -0.03521 8 15
-0.30770 8 12 0.00533 4 7
-0.27742 4 7 -0.02611 6 9

20 �������2008 � 12 � � �
Table 5 The result of all firms with a VECM model.
This table represents that the adjustment process of CDS spreads and stock returns. Data stems from 78 firms over the period 2004-2007. Company t-Statistic t-Statistic Acom -0.056094 (-2.72124)** -0.004550 (-12.7885)** Aeon -0.020619 (-1.66069) -0.008108 (-12.7430)** Aiful -1.271261 (-14.2374)** -0.001620 (-2.43992)** All Nippon airways -0.025407 (-2.78224)** -0.001552 (-12.5035)** Asahi breweries -0.055650 (-3.26860)** -0.010797 (-12.7781)** Ashai kasei 0.015296 ( 0.42629) 0.044134 ( 10.2855)** Bridgestone -0.144454 (-5.61754)** -0.020601 (-10.7627)** Canon -0.024007 (-2.09243)** -0.010780 (-12.1097)** Chubu elec pwr -0.000612 (-0.16019) -0.003242 (-12.1129)** Daiwa secur grp 0.000628 ( 0.73255) 0.000537 ( 12.6130)** East japan ry -0.022636 (-2.35739)** -0.011041 (-13.4767)** Fuji heavy inds 0.008271 ( 1.25264) -0.002681 (-12.7553)** Fujisu -0.141281 (-5.25272)** -0.006285 (-10.3931)** Hitachi -0.007658 (-0.68597) -0.004744 (-12.3451)** Honda motor -0.133571 (-5.96976)** -0.015951 (-12.2403)** Isetan -0.028410 (-2.35286)** -0.005193 (-10.2347)** Itochu -0.012353 (-1.35723) -0.003391 (-9.44500)** Japan airlines -0.048575 (-3.04836)** -0.000486 (-11.7329)** Jfe steel -0.000294 (-0.75499) 0.000118 ( 12.0523)** Kansai ele pwr -0.037248 (-2.37610)** -0.013841 (-12.3015)** Kawasaki heavy indus -0.071438 (-4.56438)** -0.007758 (-12.0414)** KDDI -0.017194 (-1.91725)* -0.007052 (-13.1319)** Keihin elec express -0.149604 (-4.46847)** -0.018290 (-11.4353)** Keio -0.060183 (-2.16378)** -0.016587 (-9.93135)** Keisei elec ry -0.141864 (-2.78691)** -0.019969 (-6.76798)** Kobe steel -0.038792 (-2.71404)** -0.006458 (-11.1496)** Komatsu -0.171346 (-6.26409)** -0.025708 (-10.9821)** Konica minolta hdg -0.105775 (-2.09356)** -0.015997 (-7.11300)** Kubota -0.082721 (-3.51275)** -0.020799 (-9.69624)** Kyushu elec pwr -0.002315 (-0.28693) -0.006308 (-10.0589)** Marubeni -0.004971 (-0.18677) 0.006085 ( 6.94456)** Mitsubishi chm hdg -0.046332 (-2.32604)** -0.009189 (-9.49720) ** Mitsubishi elec -0.032214 (-2.64501)** -0.006601 (-11.9571) ** Mitsubishi estate -0.086763 (-3.86131)** -0.014452 (-12.0100) ** Mitsui chem -0.041142 (-2.38706)** -0.015516 (-13.8974) ** Mitsui fudosan -0.072401 (-4.20676)** -0.011831 (-13.2015) ** Mitsui sumitomo in -0.026813 (-2.29932)** -0.017238 (-13.0861) ** Mizuhi finl gp -0.052506 (-2.25041)** -0.008152 (-12.1706) ** Nagoya railroad -0.011178 (-0.92597) -0.002976 (-7.13231) ** Nankai elec ry -0.011224 (-1.36389) 0.000954 ( 6.20301) ** NEC -0.326252 (-8.62997)** -0.007840 (-8.16924) ** NEC elec 0.008579 ( 0.52829) 0.004437 ( 10.7066) ** Nikon -0.033602 (-3.02562)** -0.005660 (-12.4183) ** Nippon express -0.005791 (-0.64569) 0.006719 (10.5510) ** Nippon oil -0.003767 (-0.71676) -0.004642 (-12.8479) ** Nippon steel -0.031770 (-3.04839)** -0.006016 (-12.6233) ** Nippon yusen kk -0.044529 (-2.08568)** -0.015823 (-10.9622) ** Nishimatsu con -0.019377 (-1.84955)* -0.003835 (-8.71810) ** Nissan motor -0.151211 (-5.26419)** -0.005784 (-11.8388) ** NTT DOCOMO -0.079097 (-3.72021)** -0.023448 (-11.9204) ** Obayashi -0.048777 (-2.38775)** -0.011583 (-12.2017) ** Odakyu elec ry -0.008611 (-0.74537) -0.008190 (-11.0435) ** Osaka gas -0.012642 (-1.43477) -0.008124 (-14.1828) ** Pioneer 0.051170 ( 1.17889) 0.007982 ( 6.39212) ** Promise -0.054047 (-2.39447)** -0.004946 (-12.3140) ** Ricoh -0.153566 (-5.09965)** -0.023965 (-11.1660) ** Sanyo elec -1.120064 (-15.5860)** 0.000252 ( 1.98179) ** Sapporo hdg -0.061788 (-3.82917)** 0.006658 (12.9783) ** Sekisui house -0.081366 (-3.82505)** -0.018971 (-12.3979) ** Sharp -0.065931 (-3.37583)** -0.013067 (-11.7080) ** Shimizu 0.000846 ( 0.58088) -0.000813 (-11.1029) ** Softbank -0.149349 (-3.11327)** -0.002403 (-7.47227) ** Sompo japan insur -0.044760 (-3.03744)** -0.018749 (-12.0673) ** Sony -0.138214 (-5.08435)** -0.008224 (-11.4802) ** Sumitomo -0.059782 (-4.01923)** -0.010160 (-11.7270) ** Sumitomo chem -0.001645 (-0.76714) 0.002381 (13.5473) ** Sumitomo metal inds -0.016139 (-0.86894) -0.021578 (-12.1182) ** Sumitomo mitsui finl gp -0.013877 (-1.40768) -0.004899 (-13.0216) ** Sumitomo real & dev -0.117696 (-3.62684)** -0.007531 (-5.62786) ** Teijin -0.017773 (-1.88071)* -0.005487 (-11.2326) ** Tobu ry -0.012835 (-1.41969) -0.002175 (-8.75228) ** Tokyo gas 0.000493 ( 0.49903) -0.001021 (-12.5109) ** Toshiba -0.064986 (-3.10845)** -0.006854 (-11.2877) ** Toyku -0.020976 (-2.28408)** -0.006176 (-12.7372) ** Toyota motor -0.005890 (-2.36469)** -0.003381 (-12.0857) ** West japan ry -0.004481 (-1.44507) 0.003291 ( 10.8234) ** Yamaha motor -0.028914 (-2.31361)** -0.014343 (-13.4452) ** Yamato hdg -0.045594 (-1.72907)* 0.023004 ( 10.0577) ** Note:*,** for 0.1-level and 0.05-level.

The Dynamic Co-Movement of Credit Default Swap and Stock Markets: Evidence from Japan 21
Table 6 Unit root test results of the volatility in both markets.
This table shows that the ADF of all firms at 5% and 10% with t-statistical (p-value in brackets). The (1) express the variable of CDS return volatility and (2) the variable of Stock return volatility. Data stems from 78 firms over the period 2004-2007.
Observation Observation
company (1) (2) company (1) (2)
Acom -19.52869** (0.0000) -30.63290** (0.0000) Mitsui chem -27.77006** (0.0000) -28.75516** (0.0000)
Aeon -22.13906** (0.0000) -30.49675** (0.0000) Mitsui fudosan -27.77222** (0.0000) -27.75364** (0.0000)
Aiful -25.52172** (0.0000) -29.68545** (0.0000) Mitsui sumit in -28.13440** (0.0000) -28.49039** (0.0000)
All Nipp air -28.93039** (0.0000) -28.01969** (0.0000) Mizuhi finl gp -29.51441** (0.0000) -27.10078** (0.0000)
Asahi breweri -27.85400** (0.0000) -29.32150** (0.0000) Nagoya railroad -15.20366** (0.0000) -15.44931** (0.0000)
Ashai kasei -21.31962** (0.0000) -22.20942** (0.0000) Nankai elec ry -12.92335** (0.0000) -13.58867** (0.0000)
Bridgestone -30.37194** (0.0000) -28.64887** (0.0000) NEC -26.09785** (0.0000) -28.66789** (0.0000)
Canon -28.38838** (0.0000) -28.34390** (0.0000) NEC elec -24.38773** (0.0000) -22.14619** (0.0000)
Chubu elec p -18.39964** (0.0000) -30.86528** (0.0000) Nikon -28.93953** (0.0000) -27.50923** (0.0000)
Daiw secur g -20.49813** (0.0000) -26.99801** (0.0000) Nippon express -22.06314** (0.0000) -23.51332** (0.0000)
East japan ry -17.80813** (0.0000) -30.50574** (0.0000) Nippon oil -28.47629** (0.0000) -28.74541** (0.0000)
Fuji hea ind -27.35003** (0.0000) -26.08586** (0.0000) Nippon steel -27.78959** (0.0000) -28.63281** (0.0000)
Fujisu -26.68720** (0.0000) -28.05117** (0.0000) Nippon yusen kk -23.25367** (0.0000) -23.54719** (0.0000)
Hitachi -27.11849** (0.0000) -28.80566** (0.0000) Nishimatsu con -17.47079** (0.0000) -17.47224** (0.0000)
Honda motor -29.10226** (0.0000) -28.77963** (0.0000) Nissan motor -27.52123** (0.0000) -28.54160** (0.0000)
Isetan -23.10604** (0.0000) -23.89329** (0.0000) NTT DOCOMO -30.25197** (0.0000) -27.76420** (0.0000)
Itochu -20.96823** (0.0000) -20.62414** (0.0000) Obayashi -27.59021** (0.0000) -26.30927** (0.0000)
Japan airlines -27.20881** (0.0000) -25.66615** (0.0000) Odakyu elec ry -25.79167** (0.0000) -25.00031** (0.0000)
Kansai ele pw -30.19744** (0.0000) -29.68498** (0.0000) Osaka gas -29.50051** (0.0000) -29.14061** (0.0000)
Jfe steel -26.33604** (0.0000) -28.31331** (0.0000) Pioneer -12.10067** (0.0000) -13.85173** (0.0000)
Kawa hea Ind -26.19511** (0.0000) -29.21282** (0.0000) Promise -28.43263** (0.0000) -28.87933** (0.0000)
KDDI -28.24111** (0.0000) -29.92041** (0.0000) Ricoh -29.26483** (0.0000) -28.51529** (0.0000)
Keihin elec ex -23.98473** (0.0000) -25.12072** (0.0000) Sanyo elec -27.27893** (0.0000) -28.40395** (0.0000)
Keio -21.40462** (0.0000) -21.84764** (0.0000) Sapporo hdg -28.69273** (0.0000) -27.80662** (0.0000)
Keisei elec ry -16.02858** (0.0000) -15.50280** (0.0000) Sekisui house -28.52468** (0.0000) -27.92406** (0.0000)
Kobe steel -23.80371** (0.0000) -24.20580** (0.0000) Sharp -28.77116** (0.0000) -28.53884** (0.0000)
Komatsu -28.97677** (0.0000) -27.61039** (0.0000) Shimizu -24.04040** (0.0000) -23.75009** (0.0000)
konica min h -16.16013** (0.0000) -16.08345** (0.0000) Softbank -18.55040** (0.0000) -18.55295** (0.0000)
Kubota -25.84206** (0.0000) -23.60663** (0.0000) Sompo jap insur -28.93572** (0.0000) -28.32052** (0.0000)
Kyus elec pwr -22.35697** (0.0000) -21.32646** (0.0000) Sony -24.97102** (0.0000) -26.97266** (0.0000)
Marubeni -14.86707** (0.0000) -15.05435** (0.0000) Sumitomo -26.84886** (0.0000) -28.17058** (0.0000)
Note: ADF unit root test with the Ho: Variables have a unit root. *,** for 0.1-level and 0.05-level.

22 �������2008 � 12 � � �
Table 6-Contiuned
Observation Observation
company (1) (2) company (1) (2)
Mitsub chm h -22.14961** (0.0000) -20.82340** (0.0000) Sumitomo chem -28.88114** (0.0000) -27.91828** (0.0000)
Mitsubi elec -29.15566** (0.0000) -28.52121** (0.0000) Sumito metl inds -19.66252** (0.0000) -20.69632** (0.0000)
Mitsubishi es -28.04615** (0.0000) -28.13434** (0.0000) Sumit mit finl gp -29.74638** (0.0000) -26.33713** (0.0000)
Sumito rl & d -13.74091** (0.0000) -14.95802** (0.0000) Toyku -26.96718** (0.0000) -27.91296** (0.0000)
Teijin -22.98687** (0.0000) -24.84849** (0.0000) Toyota motor -26.71389** (0.0000) -25.79746** (0.0000)
Tobu ry -19.06151** (0.0000) -17.88602** (0.0000) West japan ry -20.96521** (0.0000) -20.92441** (0.0000)
Tokyo gas -30.18239** (0.0000) -28.58414** (0.0000) Yamaha motor -29.13565** (0.0000) -28.91736** (0.0000)
Toshiba -26.94104** (0.0000) -27.68333** (0.0000) Yamato hdg -21.14085** (0.0000) -20.16205** (0.0000)
Note: ADF unit root test with the Ho: Variables have a unit root. *,** for 0.1-level and 0.05-level.
The Dynamic Co-Movement of Credit Default Swap and Stock Markets: Evidence from Japan 23
Table 7 Granger causality test results
company Ho: CDS volatility do not Granger cause Stock volatility
Ho: Stock volatility do not Granger cause CDS volatility
Acom (0.0657)* (0.0283)** Aeon (0.9835) (0.0840)* Aiful (0.0850)* (0.1525) All Nippon airways (0.5090) (0.0580)* Asahi breweries (0.0476)** (0.4573) Ashai kasei (0.6717) (0.5912) Bridgestone (0.7111) (0.0007)** Canon (0.9564) (0.9564) Chubu elec pwr (0.1890) (0.0333)** Daiwa secur grp (0.7387) (0.1524) East japan ry (0.2170) (0.3657) Fuji heavy inds (0.0460)** (0.6210) Fujisu (0.9450) (0.0003)** Hitachi (0.0288)** (0.1550) Honda motor (0.3160) (0.2122) Isetan (0.7036) (0.1589) Itochu (0.1082) (0.0671)* Japan airlines (0.9646) (0.1638) Jfe steel (0.8983) (0.2101) Kansai ele pwr (0.2745) (0.3798) Kawasaki heavy indus (0.5050) (0.1016) KDDI (0.6496) (0.0006)** Keihin elec express (0.2896) (0.9108) Keio (0.4542) (0.7687) Keisei elec ry (0.0817)* (0.1320) Kobe steel (0.3841) (0.0023)** Komatsu (0.0485)** (0.6849) konica minolta hdg (0.9206) (0.0960)* Kubota (0.1013) (0.7356) Kyushu elec pwr (0.4261) (0.3309) Marubeni (0.6445) (0.3021) Mitsubishi chm hdg (0.4017) (0.9070) Mitsubishi elec (0.0237)** (0.5194) Mitsubishi estate (0.3671) (0.2190) Mitsui chem (0.3870) (0.8639) Mitsui fudosan (0.0488)** (0.0787)* Mitsui sumitomo in (0.7048) (0.1616) Mizuhi finl gp (0.0497)** (0.0017)** Nagoya railroad (0.0649)* (0.5691) Nankai elec ry (0.0683)* (0.9432) NEC (0.3795) (0.0003)** NEC elec (0.7134) (0.0100)** Nikon (0.8484) (0.0012)** Nippon express (0.8824) (0.3489) Nippon oil (0.6513) (0.7046) Nippon steel (0.4841) (0.1405) Nippon yusen kk (0.8999) (0.2895) Nishimatsu con (0.4845) (0.3347) Nissan motor (0.7530) (0.0007)** NTT DOCOMO (0.2107) (0.2156) Obayashi (0.1608) (0.8235) Odakyu elec ry (0.9556) (0.4704) Osaka gas (0.1113) (0.0757)* Pioneer (0.4964) (0.0112)** Promise (0.1063) (0.0784)* Ricoh (0.2743) (0.6791) Sanyo elec (0.7455) (0.1689) Sapporo hdg (0.1078) (0.0073)** Sekisui house (0.3453) (0.2915) Sharp (0.2928) (0.0487)** Shimizu (0.1828) (0.3857) Softbank (0.3084) (0.3033) Sompo japan insur (0.3135) (0.3500) Sony (0.2189) (0.0085)** Sumitomo (0.9189) (0.1276) Sumitomo chem (0.2903) (0.2412) Sumitomo metal inds (0.9919) (0.1416) Sumitomo mitsui finl gp (0.7945) (0.3942) Sumitomo real & dev (0.3582) (0.0000)** Teijin (0.8480) (0.1266) Tobu ry (0.7131) (0.0744)* Tokyo gas (0.3585) (0.1109) Toshiba (0.1779) (0.2472) Toyku (0.5752) (0.0493)** Toyota motor (0.0062)** (0.4977) West japan ry (0.1977) (0.0082)** Yamaha motor (0.9315) (0.3822) Yamato hdg (0.5705) (0.7605)
Note: *,** for 0.1-level and 0.05-level. P-value in brackets.
24 �������2008 � 12 � � �
Table 8 The VAR results with the volatility of CDS returns and stock returns.
Our VAR model contain two-equations with the CDS return volatility ( ), the stock return volatility ( ) as dependent variables respectively. Panel A shows that dependent variable is
the volatility of CDS returns, and Panel B is the volatility of stock returns. The (1) and (2) mean individual the number of statistical significance at 0.05-level and 0.1-level. Data comes from 78 firms over the period 2004-2007. Panel A Lag(1) Lag(2) Lag(3) Lag(4) Lag(5) Lag(7) Lag(8) Lag(11)
5% 10%
5% 10%
5% 10%
5% 10%
5% 10%
5% 10%
5% 10%
5% 10%
0.010312 3 7 0.013887 1 3 -0.01476 0 0 -0.02147 1 1 -0.05757 0 1 -0.01411 0 1 -0.0268 0 0 0.09314 1 1
0.062654 5 8 0.028315 1 1 0.01901 0 1 -0.03166 1 1 -0.03548
1 1 0.02518 0 0 0.0581 0 0
0.09583 4 4 -0.00317 0 0 0.031129 0 0 0.02692
1 1 0.0535 0 0 0.045 0 0
0.040066 2 2 0.000608 0 1 -0.01361
0 0 0.04894 0 0 -0.0212 0 0
0.079043 2 2 0.02738
0 0 0.00747 0 0 -0.0395 0 0
0.00718
0 0 -0.01695 0 0 0.03065 0 0
0.04826
0 0 -0.02004 0 0 -0.0085 0 0
0.05469 0 0 -0.0084 0 0
-0.1056 1 1
0.08492 1 1
-0.02643 0 0
-0.04897 10 16 -0.03524 1 2 -0.06272 1 2 -0.04637 0 1 -0.05134 1 1 -0.07089 1 2 -0.03083 0 0 -0.09103 1 1
-0.03236 3 4 -0.01895 0 0 -0.01846 2 2 0.001917 0 0 -0.04077
0 1 0.026292 0 0 0.011414 0 0
-0.03642 0 0 0.022326 2 3 -0.05174 0 1 0.01153
0 0 0.005838 0 0 -0.08539 1 1
-0.0552 2 3 0.003579 0 0 -0.05096
0 1 -0.08118 1 1 -0.01586 0 0
-0.03523 0 0 0.02199
0 0 0.017604 0 0 0.021010 0 0

The Dynamic Co-Movement of Credit Default Swap and Stock Markets: Evidence from Japan 25
-0.00471
0 0 0.009210 0 0 0.020687 0 0
-0.01610
0 0 0.040443 0 0 0.008228 0 0
0.015181 0 0 -0.00105 0 0
-0.02229 0 0
0.031585 0 0
-0.01303 0 0
Table 8-Continued
Panel B Lag(1) Lag(2) Lag(3) Lag(4) Lag(5) Lag(7) Lag(8) Lag(11)
5% 10%
5% 10%
5% 10%
5% 10%
5% 10%
5% 10%
5% 10%
5% 10%
-0.00297 6 9 -0.00047 3 3 0.014679 0 0 0.035445 1 1 -0.00554 0 0 -0.01165 1 1 -0.02981 0 0 0.019214 0 0
0.026329 1 1 0.006656 0 0 -0.0032 0 0 0.0082 0 0 0.01520 0 0 -0.02125 0 0 0.009254 0 0
-0.05156 1 2 0.004139 0 0 -0.08302 2 2 -0.04518 0 0 -0.03606 0 0 -0.00399 0 0
-0.02376 1 1 0.000782 0 0 -0.03354 0 0 0.000468 0 0 8.54E-05 0 0
0.014483 0 0 0.04828 0 0 -0.0047 0 0 -0.01318 0 0
0.01228 0 0 -0.01169 0 0 0.067645 0 1
-0.02455 0 0 0.009272 0 0 0.047194 0 0
0.032074 0 0 0.014450 0 0
-0.03414 0 0
-0.03176 0 0
-0.06721 0 1

26 �������2008 � 12 � � �
0.010337 1 2 -0.00313 0 0 0.01782 0 0 0.003014 0 0 0.003441 0 0 0.01123 0 0 -0.01776 0 0 -0.01697 0 0
-0.0102 0 1 -0.03241 0 1 0.015676 0 0 -0.02411 0 0 0.00233 0 0 -0.02162 0 0 0.017100 0 0
0.011747 0 1 0.001271 0 0 0.036186 0 0 -0.00009 0 0 -0.03725 0 0 -0.0025 0 0
-0.03176 1 1 0.019421 0 0 -0.01633 0 0 -0.00972 0 0 0.021224 0 0
0.060699 1 2 -0.03576 0 0 -0.01691 0 0 -0.02748 0 0
-0.03903 0 0 -0.04885 0 0 0.003850 0 0
-0.02171 0 0 -0.01304 0 0 0.007662 0 0
-0.02431 0 0 -0.00739 0 0
-0.07058 1 1
0.029306 0 0
-0.06535 0 1

Examining Co-movements within Stock Prices in Industries and the Derived Investment Strategy 27
Table 9 Results from VECM estimation with the volatility of both returns.
This table represents that the adjustment process of volatility of CDS returns and stock returns. Data stems from 78 firms over the period 2004-2007. company
t-Statistic
t-Statistic
Acom -0.647842 (-12.1531)** -0.458432 (-8.25171)** Aeon -0.827439 (-17.1728)** -0.357694 (-6.60341)** Aiful -0.083430 (-3.25273)** -0.488539 (-17.9075)** All Nippon airways -0.081006 (-4.75718)** 0.284151 (19.4408)** Asahi breweries -0.029633 (-3.02755)** 0.164235 (20.0432)** Ashai kasei -0.001000 (-0.43640) -0.031087 (-16.6380)** Bridgestone -0.166908 (-5.53536)** -0.335631 (-11.2158)** Canon -0.394345 (-11.6412)** 0.506955 (15.7666)** Chubu elec pwr -0.023822 (-1.35028) -0.186272 (-11.1811)** Daiwa secur grp -0.076550 (-4.31176)** -0.290277 (-19.0904)** East japan ry -0.799821 (-17.0765)** -0.402822 (-7.73951)** Fuji heavy inds -0.495681 (-9.22460)** -0.530701 (-9.73251)** Fujisu -0.489414 (-12.2832)** -0.446274 (-11.0827)** Hitachi -0.167614 (-6.19939)** -0.431107 (-18.1434)** Honda motor -0.456866 (-10.4956)** -0.462381 (-10.5740)** Isetan -1.021240 (-17.4454)** -0.024533 (-0.34810) Itochu -0.003017 (-0.25245) -0.151560 (-15.1528)** Japan airlines -0.789776 (-16.9045)** -0.409129 (-7.86086)** Jfe steel -0.077546 (-4.89911)** -0.256380 (-18.4121)** Kansai ele pwr -0.168048 (-4.08229)** -0.420208 (-10.6885)** Kawasaki heavy indus -0.025145 (-1.37657) -0.158127 (-8.55571)** KDDI -0.010754 (-1.40413) -0.137978 (-21.4637)** Keihin elec express -0.001747 (-0.96388) 0.023185 (14.7177)** Keio -0.281698 (-6.74099)** -0.497885 (-13.0418)** Keisei elec ry -0.260347 (-4.08928)** -0.444579 (-7.73545)** Kobe steel -0.354976 (-9.10151)** -0.453576 (-12.0396)** Komatsu -0.353458 (-10.9618)** -0.437965 (-14.3859)** konica minolta hdg -0.701603 (-8.52542)** -0.587559 (-5.96186)** Kubota -0.945761 (-13.3753)** -0.305146 (-3.93271)** Kyushu elec pwr -0.27935 (-6.91110)** 0.46233 (12.4995)** Marubeni -0.367511 (-6.16595)** -0.461718 (-8.02960)** Mitsubishi chm hdg -0.833163 (-9.88642)** -0.423817 (-5.24743)** Mitsubishi elec -0.040180 (-2.98231)** 0.225210 (19.8548)** Mitsubishi estate -0.022780 (-2.26080)** -0.141574 (-15.7600)** Mitsui chem -0.000613 (-0.43420) -0.021961 (-17.2008)** Mitsui fudosan 7.73E-05 (0.07516) 0.017234 (20.5170)** Mitsui sumitomo in -0.988143 (-20.2301)** -0.049258 (-0.80882) Mizuhi finl gp -1.013681 (-20.2371)** 0.031631 (0.51822) Nagoya railroad -0.258259 (-4.90134)** -0.446250 (-9.05360)** Nankai elec ry -0.990533 (-10.3358)** -0.228252 (-1.99434)** NEC -0.390007 (-11.3427)** -0.491026 (-14.6886)** NEC elec -0.668167 (-13.5676)** -0.492654 (-9.21264)** Nikon -0.341550 (-8.95322)** -0.454632 (-12.6844)** Nippon express -0.420350 (-10.3493)** -0.451616 (-11.2691)** Nippon oil -1.056782 (-11.7013)** -0.143117 (-1.36432) Nippon steel -0.157625 (-6.17746)** -0.352715 (-14.9246)** Nippon yusen kk -1.041571 (-13.7390)** -0.324346 (-3.27310)** Nishimatsu con -0.063252 (-3.08136)** -0.220594 (-12.7180)** Nissan motor -0.393655 (-8.69907)** -0.480590 (-10.2042)** NTT DOCOMO -0.201525 (-3.95769)** -0.499764 (-9.85449)** Obayashi -0.062194 (-3.13631)** -0.311839 (-18.5288)** Odakyu elec ry -0.050023 (-2.34189)** -0.241978 (-12.9669)** Osaka gas -0.230657 (-6.56178)** -0.430123 (-12.8391)** Pioneer -0.177997 (-3.70826)** -0.339379 (-7.53047)** Promise -0.618399 (-13.7474)** -0.485753 (-10.5283)** Ricoh -1.045239 (-20.9088)** 0.134102 (2.19083)** Sanyo elec -0.596082 (-16.4302)** 0.518703 (13.9581)** Sapporo hdg -0.252939 (-6.66401)** 0.322017 (10.7568)** Sekisui house -0.127094 (-4.84538)** -0.335524 (-13.1671)** Sharp -0.530516 (-12.8121)** -0.531600 (-12.8221)** Shimizu -0.028294 (-1.95141)* -0.209997 (-17.3560)** Softbank -0.936813 (-12.9993)** -0.321020 (-3.89306)** Sompo japan insur -0.420357 (-12.0076)** 0.506054 (14.5841)** Sony -0.215858 (-7.28369)** -0.426120 (-15.7726)** Sumitomo 0.000548 (0.36782)** -0.025083 (-20.4390)** Sumitomo chem -0.003941 (-1.24686) -0.051665 (-20.1914)** Sumitomo metal inds -0.184023 (-4.03204)** -0.341084 (-7.83725)** Sumitomo mitsui finl gp -0.979515 (-19.6748)** -0.170798 (-2.97550)** Sumitomo real & dev -0.767149 (-10.0320)** -0.348199 (-3.85768)** Teijin -0.135257 (-3.44202)** -0.447947 (-8.89253)** Tobu ry -1.110979 (-8.69068)** -0.325328 (-2.38287)** Tokyo gas -0.718104 (-16.3847)** 0.533811 (11.5262)** Toshiba -0.371370 (-10.6844)** -0.443113 (-13.2227)** Toyku -0.270795 (-9.33138)** -0.440326 (-16.3174)** Toyota motor -0.345699 (-5.75839)** -0.618513 (-10.8200)** West japan ry 0.008054 (0.91538) -0.075220 (-9.36016)** Yamaha motor -0.005354 (-1.69268)* 0.030938 (10.1617)** Yamato hdg -1.023438 (-15.2902)** -0.182694 (-2.55691)** Note:*,** for 0.1-level and 0.05-level.