the dynamic range of lz
TRANSCRIPT

Jun Yin Department of Physics and Astronomy, University of Rochester, Slide 1
The Dynamic Range of LZ
Jun YinFor the LZ Collaboration
Department of Physics and AstronomyUniversity of Rochester, Rochester, NY 14627
LIDINE 2015, August 29, 2015.
This work is supported by the U.S. Department of Energy, award number DE-SC0006605

Jun Yin Department of Physics and Astronomy, University of Rochester, Slide 2
Outline
• Energy and position reconstruction in LZ.
• Factors that limit the dynamic range:• PMTs• Amplifiers• Digitizers
• Assumptions made to estimate the dynamic range:• Light yields• Ionization yields• Light collection efficiency
• Results
• Summary

Jun Yin Department of Physics and Astronomy, University of Rochester, Slide 3
Energy and position reconstruction in LZ.
• S1 pulse area:• Most light is detected with the
bottom PMT array.• Uniform light distribution.
• S2 pulse area:• Most light is detected with the top
array.• A large fraction of the total light
is detected in a single PMT.• S2 signals produce a uniform
light distribution across the bottom PMT array.
• Position:• (x,y) position: center of the S2
light distribution on the top array.• z position: drift time between S1
and S2 signals.

Jun Yin Department of Physics and Astronomy, University of Rochester, Slide 4
Dynamic range requirements
• Requirements:
• Provide a 95% detection efficiency for single photoelectrons (SPHEs).
• Provide the ability to calibrate LZ with a variety of sources:• CH3T: 18.6 keV endpoint (electron-recoil calibration).• 83mKr: 41.6 keV (purity measurements).• Neutrons from DD: 74 keV endpoint (nuclear-recoil calibrations).• 129mXe activation line: 236 keV.
• Good energy and position reconstruction for other possible physics goals and background studies:• High energy depositions for decays in the U and Th chains.• 0νββ: 2457.8 keV.

Jun Yin Department of Physics and Astronomy, University of Rochester, Slide 5
Constraints on dynamic range.���PMTs.
• The LZ PMTs operate with a gain of 3.5 × 10⁶.• The pulse area of 1 phe equals 28 mV ns.• Due to attenuation in the internal signal cables, the LZ amplifiers see a
pulse area of 23 mV ns for 1 phe.• By adding capacitors to the last dynode stages on the PMT base, we can
assume a linear PMT response except for the very large S2 signals associated with 0νββ. For these events the response of up to 19 PMTs located above the interaction point will be non-linear.
• A 1 µs square S2 pulse with 15,000 phes can be handled without PMT saturation (it produces a 440 mV amplitude at the PMT output).
Jun Yin Department of Physics and Astronomy, University of Rochester, Slide 6
Constraints on dynamic range.���Amplifier and Digitizers.
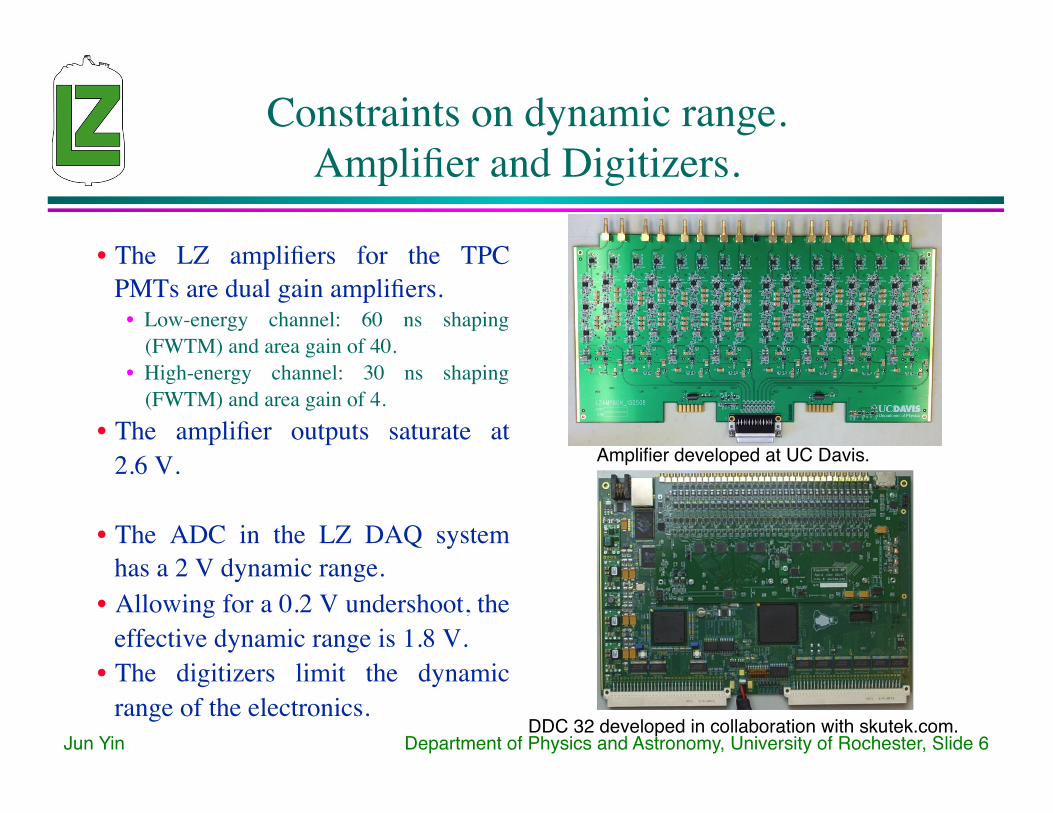
• The LZ amplifiers for the TPC PMTs are dual gain amplifiers.
• Low-energy channel: 60 ns shaping (FWTM) and area gain of 40.
• High-energy channel: 30 ns shaping (FWTM) and area gain of 4.
• The amplifier outputs saturate at 2.6 V.
• The ADC in the LZ DAQ system has a 2 V dynamic range.
• Allowing for a 0.2 V undershoot, the effective dynamic range is 1.8 V.
• The digitizers limit the dynamic range of the electronics.
Amplifier developed at UC Davis.
DDC 32 developed in collaboration with skutek.com.

Jun Yin Department of Physics and Astronomy, University of Rochester, Slide 7
Scintillation and ionization yields.���Noble Element Simulation Technique (NEST).
• The scintillation and ionization yields used to determine the dynamic range were obtained from NEST.
• Numbers used (700 V/cm):Source Scintillation
Yield (S1)Ionization Yield (S2)
CH3T 43 ph/keV 30 e-/keV83mKr 39 ph/keV 34 e-/keV
DD 12 ph/keV 3 e-/keV
129mXe 30 ph/keV 43 e-/keV0νββ 20 ph/keV 53 e-/keV LZ Conceptual Design Report

Jun Yin Department of Physics and Astronomy, University of Rochester, Slide 8
S1 dynamic range.���Assumptions made
• The average photon detection efficiency (fraction of UV photons that produce photoelectrons in any of the LZ PMTs) is 7.5%.
• Two different calculations are carried out to determine the pmt with the maximum number of phes:
• Assume that 80% of S1 light is detected with the bottom PMTs and assume a uniform light distribution across that array. Fraction of photoelectrons in one bottom PMT = 0.075*0.8/241 = 0.025%
• Assume the interaction happens 1 cm above the cathode: Largest fraction of photoelectrons in one bottom PMT = 0.4%. LZ Conceptual Design Report

Jun Yin Department of Physics and Astronomy, University of Rochester, Slide 9
S1 dynamic range at 700 V/cm.
1 cm above cathode
uniform

Jun Yin Department of Physics and Astronomy, University of Rochester, Slide 10
Dynamic range S2.���Assumptions made.
• The photon yield is 500 photons/ionization electron (e-).• The ionization electron yield is 27 e-/keV (at low energies)
– 55 e-/keV (at high energies).• Assume 100% extraction efficiency.• The light detected on the top array is concentrated in a
single PMT. The photon detection efficiency in this PMT is 2%.
• The total S2 pulse area can be reconstructed on the basis of the bottom light only (this provides the largest dynamic range).
• The position reconstruction requires the distribution of S2 light on the top array (this constrains the dynamic range).
• The dynamic range also depends on S2 width (depth dependent).

Jun Yin Department of Physics and Astronomy, University of Rochester, Slide 11
S2 dynamic range at 700 V/cm.

Jun Yin Department of Physics and Astronomy, University of Rochester, Slide 12
Conclusions
• The dual-gain design of the LZ electronics allows us to optimize the dynamic range for the smallest energy depositions and at the same time be sensitive to large energy depositions (e.g. 0νββ).
• Saturation:• For the low-energy channels: the digitizers saturate before the PMTs saturate.• For the high-energy channels: the PMTs saturate before the digitizers saturate.
• The dynamic range for S1 signals accommodates energy depositions up to the endpoint of 0νββ.
• The dynamic range for S2 signals, based on the response of the bottom PMTs , accommodates energy depositions up to 0νββ.
• The dynamic range for S2 signals observed with the top PMTs is limited by saturation in the PMTs. This impacts position reconstruction for large energy depositions.

Jun Yin Department of Physics and Astronomy, University of Rochester, Slide 13
BACKUP SLIDES

Jun Yin Department of Physics and Astronomy, University of Rochester, Slide 14
Nuclear Recoils
LZ Conceptual Design Report

Jun Yin Department of Physics and Astronomy, University of Rochester, Slide 15
S2 Width and Gain.���Different operating conditions.
LZ Conceptual Design Report

Jun Yin Department of Physics and Astronomy, University of Rochester, Slide 16
S2 Top Array
Jun Yin Department of Physics and Astronomy, University of Rochester, Slide 17
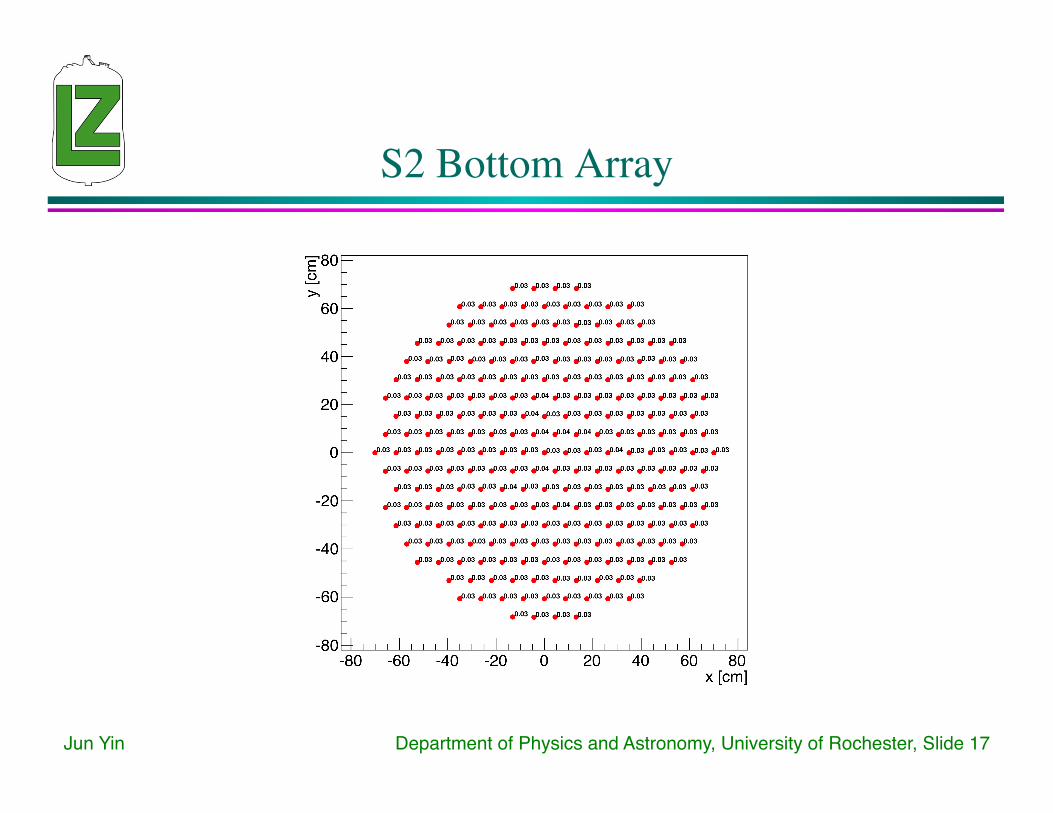
S2 Bottom Array

Jun Yin Department of Physics and Astronomy, University of Rochester, Slide 18
S1 Bottom Array���(1 cm below gate)

Jun Yin Department of Physics and Astronomy, University of Rochester, Slide 19
S1 Bottom Array���(1 cm above cathode)