the dynamics of monetary policy and inflation in...
TRANSCRIPT

IOSR Journal of Economics and Finance (IOSR-JEF)
e-ISSN: 2321-5933, p-ISSN: 2321-5925.Volume 10, Issue 2 Ser. I (Mar. – Apr.2019), PP 37-49
www.iosrjournals.org
DOI: 10.9790/5933-1002013749 www.iosrjournals.org 37 | Page
The Dynamics of Monetary Policy and Inflation in Nigeria
Tonprebofa Waikumo Okotori Niger Delta University, Department of Banking & Finance , Wilberforce Island, Bayelsa-Nigeria,
Corresponding Author: Tonprebofa Waikumo Okotori
Abstract: This study evaluated the dynamics of monetary policy and inflation in Nigeria. Monthly data from
2009-2017 were used to estimate the model derived. The Augmented Dickey-Fuller (ADF) unit root test,
Johansen Cointegration test and Error Correction model (ECM) were adopted. The findings of the ADF
revealed that except for money supply and exchange rate that are integrated at order two1(2), all other
variables are stationary at order one 1(1). The Johansen Cointegration test reveals the presence of a long run
relationship between inflation and all the variables adopted. The ECM result for the two estimated models show
a self-equilibrating mechanism of 5.2% and 9.4% for the first and second models respectively. The findings
brought us to the conclusion that money supply, exchange rate, monetary policy rate, treasury bills rate, reserve
requirement and liquidity ratio have significant and effective impact on the inflation rate. Based on the
foregoing, it is recommended that the CBN stay focused on its current foreign exchange rate policy as well as
making an unrestricted use of the monetary policy tools in its attempt to arrive and remain at the 6-9% inflation
threshold for Nigeria.
Keywords: CBN, ECM, exchange rate, inflation rate, monetary policy rate, money supply.
----------------------------------------------------------------------------------------------------------------------------- ----------
Date of Submission: 27-02-2019 Date of acceptance:13-03-2019
----------------------------------------------------------------------------------------------------------------------------- ----------
I. Introduction
Progress made in science and technology has brought countries all over the world into greater
economic cooperation and integration. The impact of this integration can be felt in the closer economic
integration of various countries in the world. Thus, “…no country is immune to external economic shocks which
cause fluctuations of macroeconomic variables like output and inflation (Gajic, 2012 [1]; Okotori, 2017[1]).
Inflation which is a sustained rise in general price levels in itself cannot be said to be adverse, but its rate of
increase must fall within levels and bands that are peculiar to each country as regards its inflation threshold. De
Grauve and Polan (2005[1]) observed that this country specificity increases as inflation increases.
Inflationary pressures in Nigeria are revealed through increases in prices of commodities in the country
and these increases have drawn the attention of those who are in charge of the economy (Orubu, 2009[2]).The
foregoing is controlled via macroeconomic policy which has two basic strands; (i) monetary policy and (ii)
fiscal policy, though the International Monetary Fund (IMF) adds structural reforms as a third strand to
complete an effective triad for macroeconomic stabilization.
Monetary policy is the use of money supply or interest rates to achieve macroeconomic goals, while
fiscal policy deals with the use of tax revenue to influence economic activities in a country. Ajie et al (2007[1])
did state that macroeconomic policy has been the main tool for achieving output stabilization in the short run
and a diversified self- sustaining economic growth in the long run.
Buiter (2014)[1] observed concerning the monetary/fiscal policy dichotomy that the unwillingness or
inability of governments to use countercyclical fiscal policy measures has left monetary policy as the only tool
in town. The economic and financial situation of a country is said to be based largely on the monetary policy
being implemented in the country, (Ahiabor, 2013[3]).The Central Bank of Nigeria (CBN) had commenced the
use of the monetary policy rate (MPR) as its main tool of stabilization by 2009 in an inflation targeting regime
(Job, 2009[4]). In 2014 it seems the bank had soft pedaled on that move (Bassey & Essien, 2014[5]).
The CBN promised that open market operations (OMO), remained the main instrument of monetary
policy, to be complemented by reserve requirement and discount window operations as well as the monetary
policy rate (MPR) ( Central Bank of Nigeria [CBN], 2015[2]; Okotori, 2017). The main thrust of the CBN’s
strategy for 2014/2015 was monetary targeting as well as a close monitoring of growth in money supply (MS).
Policy makers don’t need only to specify a set of objectives in order to succeed, but they need to understand the
effects of policies designed to arrive at those objectives ( Altavila & Ciccarelli, 2009[2]).
There is a need to investigate whether these monetary policy variables actually had the impact as stated
in apriori expectation when tested empirically; (i) did the monetary policy variables adopted by the CBN have
the desired significant effect on the inflation rate? (ii) did the combined effect of these variables have the desired

The Dynamics of Monetary Policy and Inflation in Nigeria
DOI: 10.9790/5933-1002013749 www.iosrjournals.org 38 | Page
significant impact on the inflation rate? When there is a potent monetary policy instrument, it is expected that
contractionary monetary policy shocks should be able to reduce inflationary pressure (Bonga-Bonga, 2017[3]).
1.1 Research Hypotheses
We did consider the following hypotheses that were tested in this research;
H01: Bank reserve requirement movement has not made any significant impact in reducing the inflation rate
over the period under study.
H02: Broad money supply has no major impact in bringing down the rate of inflation.
H03: The exchange rate movement has no significant effect in checking a spike in the inflation rate for the period
under study.
H04: Monetary policy rate has no significant effect in checking a spike in the inflation rate.
H05: The treasury bills rate does not have a significant effect in restraining an increase in the inflation rate
H06: The liquidity ratio has no significant effect in restraining an increase or decrease in the inflation rate
The rest of the study is divided into, Literature review, Data and Methodology, Data analysis and finally
the conclusion of the study.
II. Literature Review 2.1 Conceptual Framework
Inflation refers to a situation whereby in the economy too much money is chasing too few available goods
and services. Hamilton (2001)[2] saw inflation as an economic situation where the increase in the money supply
is more than the additional output of goods and services produced in the economy. The impact of inflation is
fare reaching because of its potentials to both influence positively as well as negatively any economy, hence the
effort to control it via monetary policy (Okotori, 2017).
Monetary policy is the use of money supply to deliberately influence the economy in order to achieve
some combination of inflation and output stabilization (Wrightsman, 1976[3]; Mathai, 2012[4]).The adjustment of
money supply by the Central Bank is to avoid monetary disequilibrium, hence, monetary policy attempts to
offset changes in money demand with changes in money supply (Salter,2014[5]).
2.2 Theoretical Framework
Keynesian analyses sees Demand pull inflation as the most important factor that raises the price level as
rising quantity of money that is not accompanied by proportionate increase in output. The resulting negative
output gap according to Frank and Bernanke (2003)[4] occurs from excessive aggregate demand that is
expansionary and result in increased pressure on prices. There is also the Supply or Cost push inflation view that
states that inflation arises based on supply side factors such as import or raw material prices, unit wage costs and
various elements that are part of the cost of production (Riley, 2011[4]). Nguyen et al (2015)[5] discovered that in
Non- CFA sub Saharan countries (including Nigeria) supply shocks account for 45% of inflation fluctuations,
while Demand pull shocks account for 55% of total fluctuations.
Modern quantity theorists of the neo-classical school of economic thinking see inflation purely as a
monetary phenomenon and that this occurs only as a result of a more rapid expansion in the quantity of money
more than in output (Friedman, 1956[5]; Okotori, 2017). Friedman (1963)[6] was more explicit when he
postulated that if the money stock growth rate is kept at a constant rate in relation to output growth rate, inflation
will be checked. Though the Friedman exposition on a constant k principle was controversial, yet the money
stock/ output ratio seem to be an effective way of looking at attempts at curtailing an inflationary spiral in the
economy.
McCallum and Nelson (2011)[6] revealed that Friedman preferred to regard the quantity theory of
money as a proposition exclusively about the demand function of money. McCallum (1984)[6] had suggested
that Friedman constant growth rule can be improved with an adjustable growth rule, where the money supply
growth rate is adjusted for changes in output and corrected for irregular changes in the velocity of money,
declaring that such a rule would have stronger and automatic, countercyclical effect on aggregate demand.
Nasser (2005)[7] observed that countries with underdeveloped financial markets generally rely on the existence
of a stable money demand function in conduct of efficient monetary policy. In Nigeria, inflation is said to be
directly related to monetary aggregates (CBN, 2007[8]; Oyejide, 1972[7]; Adeyeye & Fakiyesi, 1980[9]).In many
developing countries, studies show that one of the dominant predictors of inflation is the growth of money (
Onwumere et al, 2012[6]; Owoye, 1997[8]; Olanikpekun et al, 2013)[9].
The opinion of Ogbuagu et al (2014)[10] is that an increase in the ratio of money supply growth to GDP
ratio or some price indexes can be referred to as liquid money increase, that the degree of financial development
is generally measured by an economy’s depth ( that is, the relative size of its banking system or stock market).
The literature on determinants of inflation in developing countries postulates a money demand function and this

The Dynamics of Monetary Policy and Inflation in Nigeria
DOI: 10.9790/5933-1002013749 www.iosrjournals.org 39 | Page
is said to specify how expansionary monetary policy creates disequilibrium in the money and goods market,
(Nasser, 2005; Toujas-Bernate, 1996[8]; Sacerdoti & Xiao, 2001[9]).
Mordi (2009)[9] saw the underpinning theory as the quantity theory and that was the basic reason the
CBN in its monetary policy framework targets money. The operating target, base money is set on the
relationship between money supply and base money and this is based on the assumption of a stable money
multiplier k, which is illustrated as follows;
M2=kBM
Where M2 is broad money supply, k is the money multiplier and BM is base money.
The impact of the foregoing was well illustrated by Yu and Ming (2001)[7] that when the monetary
authority adjusts the monetary base, then the financial fields will experience changes in money supply and
interest rates leading to lending activities of deposit money banks and the financial situation of financial markets
.In summary, monetarism suggests that in the long run prices are mainly affected by the growth rate of money,
while having no real effects on economic growth. That if the growth in the money supply is higher than the
economic growth rate, inflation will result (Assenmacher-Weche & Gerlach, 2006[11]).There is therefore the
claim that in order to control inflation monetary policy must be used ( Adalid & Detken, 2007[10]; Barro &
Grilli,1994[7]; Markin, 2010[8]). Kilindo(1997)[12] opined that monetarist approach that money supply growth
causes inflation can be tested by observing the correlation between the rate of inflation and the rate of monetary
growth and that causality can be determined by statistical analysis and institutional evidence.
2.3 Tools of Monetary Policy
Table 2.1Monetary Policy Tools, Targets & Goals
Source-(Handa, 2009[8]; CBN, 2011a[11]; Okotori, 2017)
The Central Bank of Nigeria [CBN] (2011a) identified three issues that arise in its selection and use of
the goals, intermediate variables, operating targets and instruments;
(i)Effort at establishing the existence or otherwise of a stable and predictable relationship between the ultimate
goal variable, intermediate variables and operating targets.
(ii)Determine if the monetary authorities can actually achieve the desired level of the operating target with the
instruments at their disposal.
(iii)Establishing the nature of the lag structure (short or long i.e. when a policy is made, implemented and when
its effect is felt) which has the implication of influencing prediction of the future course of the economy as it
becomes increasing less precise in the case of long lags, ( Okotori, 2017).
The Central Bank of Nigeria’s (CBN) use of monetary targeting is still its preferred monetary policy
framework in Nigeria and this is based on its capacity in enabling the CBN handle domestic issues and the
ability to immediately signal its policy stance ( Okoroafor, et al (2018)[13].
2.4 Empirical Review
The preference for monetary policy over fiscal policy was revealed by Ajisafe and Foloronso (1999)[14]
for the period 1970-1999 concerning the Nigerian economy, their finding was that monetary policy had a greater
impact on economic activity than fiscal policy as was later confirmed by Adefeso and Mobolaji(2010)[15].
Simwaka et al (2012)[16] examined the relative importance of monetary factors in driving inflation in
Malawi, using a stylized inflation model specification which included standard monetary variables, exchange
rate and supply side factors. The results indicate that inflation in Malawi is as a result of both monetary and
supply side factors, exchange rate adjustments played a relatively more significant role in fueling cost push
inflation. Onwachukwu (2014)[12] using times series data from 1970 to 2010 employed the ordinary least
squares(OLS) to estimate the model, found that the bank rate, deposit with the Central Bank, liquidity ratio and

The Dynamics of Monetary Policy and Inflation in Nigeria
DOI: 10.9790/5933-1002013749 www.iosrjournals.org 40 | Page
broad money supply are statistically significant in explaining changes in inflation in Nigeria.
Gbadebo and Mohammed (2015)[17] explored the relationship between inflation and monetary
impulses, adopting cointegration and error correction method approach on quarterly times series data spanning
from 1980 Q1 to 2012 Q4. Their finding was that interest rate, exchange rate, money supply and oil price are the
major causes of inflation in Nigeria. That the money supply variable shows a significant positive impact on
inflation both in the short and long run. Hence, Nigeria’s inflationary situatiation is driven by monetary
impulses. While this is revealing there is the need to identify individual variable significance and the quantum
impact of the combined variables that are operating and intermediate targets of the CBN.
Chuku(2015)[18] used structural Vector Autoregression (SVAR) model to trace the effects of monetary
policy shocks on output and prices in Nigeria, found evidence that monetary policy innovation carried out on
quantity based nominal anchor (M2) has modest effect on output and prices with a very fast speed of
adjustment. While shocks on price based anchors (MRR and REER) has neutral and fleeting effects on output,
concluding that the CBN should lay more emphasis on using quantity based nominal anchors. But Naoyuki et al
(2012)[19] though discovered through their empirical analysis a strong support for the optimality of monetary
over interest rate instruments, yet suggested that a combination of both instruments is superior to the two used
separately. Tule et al(2015)[13] discovered that money supply as a policy instrument has a weakening effect on
inflation in Nigeria, attributing this to the increasing sophistication of the Nigerian economy.
Emerenini and Eke (2014)[20] in investigating the determinants of inflation in Nigeria using monthly
data from January 2007 to August 2014 adopted ordinary least squares (OLS) method and found that expected
inflation, exchange rate and money supply influenced inflation, while annual treasury bills and monetary policy
rate though rightly signed did not influence inflation in Nigeria within the period of investigation. The estimated
model displayed that all the explanatory variables used for the analyses accounted for 90% variation in
explaining the direction of inflation as regards its increase or decrease. The cointegration test showed that a long
run relationship existed among the variables and they were stationary at order one 1(1). Though the analyses
used monthly data for almost all the variables, the use of annual data for a very useful tool of monetary policy
that is issued almost weekly in open market operation will tend to limit the predictive capacity of the annual
treasury bills rate data employed. It might not adequately answer the two questions that were raised in this
study; (i) did all the variables adopted by the CBN have a significant effect on the inflation rate? (ii) did the
combined effect of all the variables have impact on the inflation rate?.The conclusion of Fatukasi(2015)[21] was
that the causes of inflation in Nigeria are multidimensional, requiring a full knowledge at any point in time to be
able to proffer solutions to inflationary trends in the economy(Okotori, 2017). This choice of policy instruments
mix to be adopted in any given economic environment is hence very important..
III. Data and Methodology
The research employed quasi- experimental or Ex post facto as the investigation starts after the facts
occurred (Okotori, 2017). The use of this research design is based on the fact that historical data was sourced
from the National Bureau of Statistics and Central Bank of Nigeria statistical bulletin from 2009 to 2017), the
fact is that the data is from events that have already occurred and cannot be controlled or manipulated by the
researcher. Ex post facto design in its application is causal comparative and used when the researcher aims to
establish between the independent and dependent variables with a view to establishing the causal link between
them (Kerlinger, 1978[9]; Onwumere, 2005[10]). Multiple regression analyses of the ordinary least squares (OLS)
is the estimation technique that is employed in this study to determine the effect of monetary policy on inflation
in Nigeria.
3.1 Mode Specification
INF=a+b1MS +b2 EXR +b3 MPR + e (1)
INF=a+b1TBR +b2 REQ +b3LQR + e (2)
Where;
INF= Inflation rate
MS= Money Supply (MS2/GDP ratio)
EXR=Exchange rate
MPR= Monetary policy rate
TBR= Monthly Treasury bills rate
REQ= Reserve Requirement
LQR= Liquidity ratio
e= Error term

The Dynamics of Monetary Policy and Inflation in Nigeria
DOI: 10.9790/5933-1002013749 www.iosrjournals.org 41 | Page
3.4 Description of variables
3.4.1 Inflation
This has been referred to as a persistent increase in average level of price in an economy. The findings
of Deme and Fayissa (1995) found empirical evidence of the inflationary effects of the money supply growth,
(Okotori, 2017).
3.4.2 Bank Reserve Requirement (REQ
The monetary authority in any nation would require deposit money banks to keep a predetermined
amount of funds on hand against depositors' liabilities, according to the Board of Governors of the Monetary
Policy Committee. Hence the apriori expectation is negative (-), (Okotori, 2017).
3.4.3 Money Supply
Money supply is the amount of money in circulation in an economy at any given time period.
Nuutilainen (2016)[2] referred to the position of Milton Friedman that if money supply percentage growth rate in
relation to GDP percentage growth is kept at a constant k, there will be no inflation. The CBN in 2008 opted to
watch that ratio as a means of its monetary targeting regime. Hence, the use of that ratio as a proxy for Broad
money supply. The apriori expectation is positive (+), (Okotori, 2017).
3.4.4 Exchange Rate (EXR)
Exchange rate is the price of a currency in terms of other currencies. Obadan (2012)[10] stated that the
CBN is the main regulator of the foreign exchange market and it monitors developments from time to time,
issuing guidelines and circulars guiding the conduct of trading activities and operators in order to achieve the
desired monetary policy objectives. Nwosa and Oseni(2012)[22] established empirically a bi-directional causality
between inflation and exchange rate in Nigeria as did Yinusa and Akinlo(2007)[23] , hence the apriori
expectation is positive (+),(Okotori, 2017).
3.4.5 Monetary Policy Rate (MPR)
There is an established fact that banks borrow like every other corporate entity on a daily basis from
each other and from their respective monetary authorities who set the baseline interest rate in the economy and
every other interest rate add on to it. That baseline interest rate is the monetary policy rate. . The monetary
policy rate (MPR) is expected to have a negative relationship with the inflation rate (-), (Okotori,2017).
3.4.6 Treasury Bills Rate (TBR)
Treasury bills are issued by the monetary authority as short-term investments and are referred to as
being relatively risk-free investment. The bills are purchased at discount and are held until maturity date. Hence
the apriori expectation is negative as regards inflation (-).
3.4.7 Liquidity ratio (LQR)
The liquidity ratio refers to the ratio of liquid assets to the liabilities of a bank as stipulated by a
countries monetary authority. These assets refer to the banks cash balance plus all other assets owned by the
bank that can be easily converted into cash as against the liabilities owed by the bank, especially depositors
money in the bank. Where the liquidity ratio is high it has a contractionary impact on inflation.The aprioi
expectation is negative on inflation(-).
IV. Data Analyses and Results
Chapter three in this work had established two different models derived from theoretical and empirical
studies and presented a detailed description of the data used in this study. A monthly time series data was
constructed from 200901-12- 201701-12. This Chapter presents the data analysis and results. The chapter looks at
some trend and descriptive analysis, stationarity test, Johansen cointegration test, followed by some diagnostic
tests, and finally, the vector error correction regression model for the determinants of inflation in Nigeria stated
in the model.
4.1 Descriptive Statistics
Table 4.1 presents the summary of descriptive statistics for all variables. This table reports the mean,
standard deviation, maximum, minimum and the number of observations for each of the variables.
Table 4.1Descriptive Statistics for Dependent and Independent Variables
Variables Mean Median Max Min Stdev Obs.
INF 12.15741 12.00000 18.70000 8.000000 2.921471 108
MS 23.03970 20.18927 37.95685 18.92846 5.580591 108

The Dynamics of Monetary Policy and Inflation in Nigeria
DOI: 10.9790/5933-1002013749 www.iosrjournals.org 42 | Page
EXR 184.6405 157.4075 327.4421 121.3633 55.36718 108
MPR 10.87046 11.71451 14.49653 6.130000 2.644673 108
TBR 14.92069 16.25375 20.00000 4.635833 4.512610 108
REQ 2.116107 1.856748 6.584149 0.180000 1.577825 108
LQR 42.98737 42.39496 65.20139 15.64306 10.76548 108
Source: Authors own computation using E-views
The mean and median in the table above were computed to find the central tendency of each variable
for 108 observations. The standard deviation indicates the sample’s dispersion (spread) level of the variables.
According to the above table, the average inflation rate is 12.1% which means the consumer price index during
the period under study is approximately 12%, while money supply (MS), Exchange rate (EXR), monetary policy
rate (MPR), treasury bill rate (TBR), reserve require (REQ) and liquidity ratio (LQR) recorded an average of 23
billion naira, 185 naira, 10.8% 14.9% 2.1% and 43%.
4.2 Multicollinearity
Table 4.2(a) 4.2(b) presents the correlation matrix and variance inflation factor (VIF) for all the
independent variables used in the analysis. According to the results, there are no multicollinearity problems
among the variables since the inter-correlations among the explanatory variables are low i.e. below 0.80 as the
bench mark. To check further, another diagnostic test for multicollinearity is used, with the variance inflation
factor (VIF) calculated for independent variables as follows: VIF (Bi) = 1/ (1-R2), where R
2 is the squared
multiple correlation coefficient between independent variables. When R2 is equal to zero, then VIF has its
minimum value of one (Maddala, 2001[11]). Therefore the closer the value of VIF to one, the degree of
multicollinearity is lower. If one of the VIFs is greater than 10, then the multicollinearity is a problem (Gujarati,
2004[12]). Based on the results in table 4.2, all the VIF values are much lower than 10. Therefore there is no
multicollinearity problem among the independent variables in model one and two.
Table 4.2a: Correlation Matrix and Variance Inflation Factors (model 1) MS EXR MPR
MS 1.000000
EXR -0.222125 1.000000
MPR -0.423811 0.688158 1.000000
VIF 1.217482 1.802546 2.072590
Source: Authors own computation using E-views
Table 4.2b: Correlation Matrix and Variance Inflation Factors (model 2) TBR REQ LQR
TBR 1.000000
REQ 0.615220 1.000000
LQR 0.503461 0.381560 1.000000
VIF 2.133199 2.056966 1.500867
Source: Authors own computation using E-views
4.3 Normality Test
Table 4.3 presents the summary of normality for all variables. This result reports the mean, median
standard deviation, maximum, minimum and the skewness of the variables. The probability and Jaque-Bera
values shall be used as a measure to test the normality of the variables.
Table 4.3a: Normality Test for model 1
0
2
4
6
8
10
12
-0.3 -0.2 -0.1 0.0 0.1 0.2
Series: Residuals
Sample 2009M01 2017M12
Observations 108
Mean 1.04e-15
Median 0.031826
Maximum 0.244830
Minimum -0.318469
Std. Dev. 0.157735
Skewness -0.491747
Kurtosis 2.297362
Jarque-Bera 6.574320
Probability 0.037360

The Dynamics of Monetary Policy and Inflation in Nigeria
DOI: 10.9790/5933-1002013749 www.iosrjournals.org 43 | Page
Table4.3b: Normality Test for model 2
0
2
4
6
8
10
12
-0.3 -0.2 -0.1 0.0 0.1 0.2 0.3 0.4 0.5
Series: Residuals
Sample 2009M01 2017M12
Observations 108
Mean 2.14e-16
Median 0.008899
Maximum 0.483478
Minimum -0.367854
Std. Dev. 0.238834
Skewness 0.236967
Kurtosis 2.301678
Jarque-Bera 3.205203
Probability 0.201372
Source: Authors own computation using E-views
From the above table the result shows that the variables are normally distributed because the value of
the Jaque-Bera test statistic is greater the table value. Likewise the probability value is less than 5% which is
statistically significant. Therefore the null hypothesis is rejected which state that the variables are not normally
distributed.
4.4Test of Stationarity using ADF Unit Root Test
The Augmented Dickey–Fuller test statistic is used in testing the null hypothesis that there is a unit root in a
particular time series of interest. The ADF is not the only test available, but it represents widely used approach
in most of the data analysis. The unit root tests are presented in Table 4.4. The lag length used in the ADF test is
based on minimizing the Schwarz Information Criterion (SIC), starting with maximum lag length.
Table 4.4 Unit Root Test (ADF)
Variables
Augmented Dickey-Fuller Test
d (I)
Remark
@ Levels @ 1st Diff. @ 2nd Diff.
INF -1.868245 -3.700142 - I (1) Stationary
MS -2.754693 -2.752401 -11.11293 I (2) Stationary
EXR -1.226147 -2.358041 -7.779161 I (2) Stationary Log(MPR) -2.470337 -9.950769 - I (1) Stationary
Log(TBR) -1.852133 -4.268595 - I (1) Stationary
Log(REQ) -0.662592 -9.591457 - I (1) Stationary Log(LQR) -1.678179 -9.821363 - I (1) Stationary
1% level -4.049586 Test critical values 5% level -3.454032
10% level -3.152652
Source: Authors own computation using E-views
Table 4.4 above presents the summary results of the ADF unit root tests. The results show that the null
hypotheses of a unit root test for first and second difference series for all the variables (INF, MS, EXR, TBR,
REQ and LQR) can be rejected at 5% critical value, indicating that the level series which is largely time-
dependent and non-stationary can be made stationary at the first and second difference. Thus, the reduced form
models follow an integrating order of 1(1) and I (2) process, respectively; and are, therefore, stationary at order
one and two. Furthermore, this indicates that the short run static regression result is spurious and cannot be used
for analysis. That is to say, all the variables are individually stationary and stable.
4.5 Cointegration Test
Cointegration analysis helps to clarify the long-run relationship between integrated variables. Johansen’s
procedure is the maximum likelihood for finite-order vector autoregressions (VARs) and is easily calculated for
such systems, so it is used in this study. The Johansen’s technique was chosen not only because it is VAR based
but also due to the evidence that it performs better than single equation and alternate multivariate methods. The
results of the Cointegration test are presented in Table 4.5.

The Dynamics of Monetary Policy and Inflation in Nigeria
DOI: 10.9790/5933-1002013749 www.iosrjournals.org 44 | Page
Table 4.5 Johansen Cointegration test
Unrestricted Cointegration Rank Test (Trace) Hypothesized Trace 0.05
No. of CE(s) Eigenvalue Statistic Critical Value Prob.**
None * 0.358655 206.9034 125.6154 0.0000
At most 1 * 0.309236 161.1520 95.75366 0.0000
At most 2 * 0.298616 123.0465 69.81889 0.0000 At most 3 * 0.283290 86.51246 47.85613 0.0000
At most 4 * 0.244853 52.20476 29.79707 0.0000 At most 5 * 0.199669 23.27796 15.49471 0.0028
At most 6 0.003265 0.336830 3.841466 0.5617
Trace test indicates 6 cointegrating eqn(s) at the 0.05 level
Unrestricted Cointegration Rank Test (Maximum Eigenvalue) Hypothesized Max-Eigen 0.05
No. of CE(s) Eigenvalue Statistic Critical Value Prob.**
None 0.358655 45.75136 46.23142 0.0562
At most 1 0.309236 38.10550 40.07757 0.0820 At most 2 * 0.298616 36.53408 33.87687 0.0235
At most 3 * 0.283290 34.30770 27.58434 0.0059
At most 4 * 0.244853 28.92679 21.13162 0.0033 At most 5 * 0.199669 22.94113 14.26460 0.0017
At most 6 0.003265 0.336830 3.841466 0.5617
Max-eigenvalue test indicates 4 cointegrating eqn(s) at the 0.05 level
Source: Authors own computation using Eviews
The above result revealed that there are six (6) cointegrating equations in the model. Since Johansen
tests showed that the trace and maximal Eigen statistics reveals the existence of six and four cointegrating
relationships between inflation (INF) and its determinants at 5% level of significance (Table 4.5). The
conclusion drawn from this result is that there exist a unique long run relationship between monetary policy
variables and inflation in Nigeria. Since there are six cointegrating vectors, an economic interpretation of the
long-run relationship between monetary policy dynamics and inflation in Nigeria can be obtained by
normalizing the estimates of the unconstrained cointegrating vector on monetary policy instruments.
4.6 Error Correction Mechanism (ECM)
Having ascertained that the variables are non-stationary at their levels but stationary after differencing
once, and that they are cointegrated, the stage is set to formulate an error correction model. The intuition behind
the error correction model is the need to recover the long-run information lost by differencing the variables. The
error correction model rectifies the problem by introducing an error correction term. The error correction term is
derived from the long-run equation based on economic theory.
The error correction term enables us to gauge the speed of adjustment of the impact of monetary policy
variables to its long-run effect on inflation. It gives the proportion of the disequilibrium errors accumulated in
the previous period which are corrected in the current period. The results show that the speed of adjustment of
inflationary trend to long-run equilibrium path is very low in model one and two. Specifically, about 5% and 9%
of the disequilibrium errors, which occurred in the previous year, are corrected in the current year.
Table 4.6 Parsimonious Error Correction Model (ECM) 1
Dependent Variable: DLOG(INF) Variable Coefficient Std. Error t-Statistic Prob.
C -0.001412 0.004767 -0.296289 0.7678 DLOG(INF(-1)) 0.491475 0.111800 4.396038 0.0000
DLOG(INF(-2)) 0.137564 0.116652 1.179265 0.2419 DLOG(INF(-3)) 0.402159 0.110236 3.648170 0.0005
DLOG(INF(-4)) -0.327254 0.119416 -2.740445 0.0076
DLOG(INF(-5)) 0.076430 0.115212 0.663384 0.5091 DLOG(MS) 0.122517 0.095939 2.056869 0.0548
DLOG(MS(-2)) 0.201615 0.514500 0.391866 0.6962
DLOG(MS(-3)) -0.239091 0.514252 -0.464931 0.6433 DLOG(MS(-5)) -0.217723 0.363025 -0.599747 0.5504
DLOG(EXR) 0.560198 1.701451 2.329247 0.0429
DLOG(EXR(-1)) 0.899326 2.511119 0.358137 0.7212 DLOG(EXR(-3)) 0.868935 2.503554 0.347081 0.7295
DLOG(EXR(-4)) -0.511079 2.504134 -0.204094 0.8388
DLOG(MPR) 0.045979 0.071223 2.645571 0.0205 DLOG(MPR(-2)) 0.029149 0.084739 0.343983 0.7318

The Dynamics of Monetary Policy and Inflation in Nigeria
DOI: 10.9790/5933-1002013749 www.iosrjournals.org 45 | Page
DLOG(MPR(-3)) 0.043858 0.084127 0.521335 0.6036 DLOG(MPR(-5)) 0.051157 0.071345 0.717037 0.4755
ECM1(-1) -0.052817 0.019933 -2.649736 0.0098
R-Square = 0.642281, F-statistic = 5.760533, Prob(F-stat) = 0.000000, D-W = 1.9875
Source: Authors own computation using Eviews
The coefficient of determination i.e. R-Square (R2) of the estimated model 1 indicates that about 64%
of the variations in constant increase in the prices of goods and services are explained by the combined effects
of all the determinants (money supply, exchange rate and monetary policy rates). The F-Statistics is 5.7605,
which is greater than the table value of 5% level. Both coefficient of determination (R-square) and F-statistics
show that the overall regression model is significant at 5% levels. Furthermore, given the DW value of 1.99,
there was no suggestion of serial or autocorrelation problems.
As shown in the table, money supply (MS) and exchange rates are positively related to inflation rate
and are statistically significant at 5% level. This result is in agreement with a priori and theoretical expectation.
The result revealed that if money supply increases by 100% general price level will increase also by 13% all
things being equal. Likewise increase in the price of dollar by 100% will also increase the general price level in
Nigeria by 56%.
On the other hand, Interest rate has a negative impact on inflation rate in Nigeria and is statistically
significant at 5% level. That is if the cost of borrowing increase by 100%, it will increase the price of goods and
services by 5%.
Table 4.7 Parsimonious Error Correction Model (ECM) 2
Dependent Variable: DLOG(INF) Variable Coefficient Std. Error t-Statistic Prob.
C -0.000945 0.001705 -0.553936 0.5819 DLOG(INF(-1)) 0.579569 0.130638 4.436461 0.0000
DLOG(INF(-2)) 0.114694 0.152404 0.752563 0.4550
DLOG(INF(-3)) 0.168817 0.150592 1.121023 0.2672 DLOG(INF(-5)) -0.206688 0.128462 -1.608947 0.1135
DLOG(TBR) 0.189752 0.147677 2.607758 0.0459 DLOG(TBR(-3)) -0.226421 0.190795 -1.186721 0.2405
DLOG(TBR(-4)) 0.149078 0.188911 0.789146 0.4335
DLOG(TBR(-5)) 0.052165 0.141331 0.369099 0.7135
DLOG(REQ) -0.129477 0.025828 -2.141294 0.0588
DLOG(REQ(-2)) 0.015319 0.030375 0.504322 0.6161
DLOG(REQ(-4)) 0.022013 0.030312 0.726196 0.4709 DLOG(REQ(-5)) -0.040665 0.025976 -1.565508 0.1233
DLOG(LQR) 0.109311 0.023459 3.396891 0.0130
DLOG(LQR(-3)) -0.032710 0.030457 -1.073956 0.2876 DLOG(LQR(-4)) 0.050590 0.030480 1.659769 0.1028
DLOG(LQR(-5)) -0.026805 0.028297 -0.947295 0.3477
ECM2(-1) 0.094172 0.006310 0.661213 0.0113
R-Square = 0.693282, F-statistic = 5.085740, Prob(F-stat) = 0.000000, D-W = 2.1548
Source: Authors own computation using Eviews
The over parameterized model from which the parsimonious ECM emanated is presented above. The
examination of the econometric models in Table 4.7 above shows that treasury bill rate, required reserve
requirement and liquidity ratio variables explains 69% of the total variations in inflation rate in Nigeria. This is
indicated by the values of the R2 (0.693282). Given the F-values of 5.085740, reveals that the overall regression
is statistically significant while the Durbin–Watson statistics of 2.15 indicated the absence of serial
autocorrelation. As shown in Table 4.7, all the variables have the expected signs and conform to economic
theory as well as significant both at 5% levels of significant. The coefficient of the error correction term is
statistically significant and carries the expected negative sign at 5% level of significant. Hoverer, the speed of
adjustment is slow, that is 9.4% of the adjustment to equilibrium inflation rate is expected to occur in the long
run. This result indicates that ignoring error correction in non-stationary time series analysis would lead to
misspecification of the underlying process to achieve real price stability in the Nigerian economy.
4.7 Hypothesis Testing.
From the results, we see that at 5% level of significance with a degree of freedom of 104(108-4), the
tabulated value (t-table) is 1.96 for a two tailed test, while the calculated(t-statistics ) for the three variables(
Broad money supply, Exchange rate and the monetary policy rate are 2.06, 2.33 and2.65 respectively. Since the
calculated value is greater than the tabulated value, it can be decided that Broad money supply, Exchange rate
and monetary policy rate all have significant impact on the inflation rate in Nigeria, thereby rejecting all the null

The Dynamics of Monetary Policy and Inflation in Nigeria
DOI: 10.9790/5933-1002013749 www.iosrjournals.org 46 | Page
hypotheses with respect to the aforementioned variables. In model two, at 5% level of significance with a degree
of freedom of 104(108-4), the tabulated value (t-statistics) is 1.96 for a two tailed test. The calculated ( t-
statistic) for the three variables( Treasury bills rate, Reserve requirement and Liquidity ratio) are 2.61, -2.14 and
3.40 respectively, since the calculated value is greater than the tabulated value for a two tailed test, it can be
concluded that Treasury bills rate, Reserve requirement and Liquidity ratio have significant impact on the
inflation rate in Nigeria, thereby also rejecting the null hypothesis concerning these variables. The variables in
model 1 and 2 had combined impact of 64% and 69% respectively on the inflation rate in Nigeria for the period
under study.
V. Conclusion
Conclusively, we submit that the results show a causal relationship between the inflation rate and the
selected monetary policy instruments as the determinants of the inflation rate in Nigeria, namely, broad money
supply, exchange rate, monetary policy rate, Treasury bill rates, reserve requirement, and liquidity ratio. The
relationship is not only significant, but they contributed to impacting on the inflation rate for the period under
study. There is need for the CBN to have periodic research that determines the changing dynamics of the
established relationship in order to have a far more effective policy intervention that will have traction on the
economy as the inflation band of 6-9% is attained. The study is supportive of the notion that monetary policy
impulses introduced by the CBN do have desired effect on the economy as the variables are effective at
transmitting these impulses via the various channels of monetary policy transmission. The Central Bank of
Nigeria has to identify the speed of transmission through the various policy channels in order to know the level
of policy shocks to introduce and the anticipated effect. This calls for further research on the monetary policy
transmission channels in Nigeria.
References
Journal Papers: [1]. P. De Graurve, & M. Polan, Is inflation always and every where a monetary phenomenon? The Scandinavian Journal of
Economics, 107, (2), 2005, 239-259. [2]. C. O. Orubu, Inflation in Nigeria: Concept, measurement and control, Bullion, 33, (1). 2009.
[3]. G. Ahiabor, The effect of monetary policy on inflation in Ghana, IISTE Developing Countries series, 3(12), 2013. [4]. P.M. Job, Is monetary policy the best instrument for inflation targeting in the Nigerian Economy? Journal of Business and
Organizational Development, 3, 2011, 35-39.
[5]. G.E Bassey, & E.B. Essien, Monetary credit, foreign trade and exchange rate policy guidelines for fiscal years 2014/2015, Journal of Economics and Sustainable Development, 5(12), 2014, 88-101.
[6]. B.T. McCallum, Monetarists rule in the light of recent experiences, American Economic Review, 74, 1984, 388-391.
[7]. T.A Oyejide, Deficit financing, inflation and capital formation: An analysis of the Nigerian experience 1957-1970, Nigeria Journal of Economics and Social Studies, 14(10), 1992, 27-43.
[8]. O. Owoye, Income velocity and the variability of money growth: Evidence from less developed countries”, Applied Economics, 29,
1997, 485-496. [9]. D.B. Olanikpekun & R.F. Akeju , Money Supply, inflation and Accumulation in Nigeria, Journal of Economic and Sustainable
Development, 4(4), 2013.
[10]. A.R. Ogbuagu, & D.B. Ewubare, Financial deepening and inflation in Nigeria: An open economy model approach, Journal of Economics and Sustainable Development. 5(25), 2014, 39-42.
[11]. Assenmacher-Weche, K., & Gerlach, S. (2006), “Money at low frequencies, Journal of European Economic Association, (5), 2006,
635 -642. [12]. A.A.L Kilindo, Fiscal operations, money supply and inflation in Tanzania , African Economic Research Consortium, AERC
Research Paper Series,65, 1997.
[13]. D.O.K. Okoroafor, S.O. Adeniji, and T. Olasehinde, Estimating and Forecasting the Impact of Inflation on Economic Growth in Nigeria using Threshold Analysis, CBN Journal of Applied Statistics, 9(1), 2018.
[14]. [1R.A. Ajisafe, & B.A. Folorunso, The relative Effectiveness of fiscal and monetary policies in macroeconomic management in
Nigeria , The African Economic and Business Review, 3(1),1999, 23-40. [15]. H.A. Adefeso, & M.I Mobolaji,(2010), The Fiscal-monetary policy and economic growth in Nigeria: Further Empirical evidence,
Pakistan Journal of Social Sciences, 7(2), 2010, 137-142.
[16]. K. Simwaka, P Ligoya, P Kabango, and M. Chikondo, Money supply and inflation in Malawi: An econometric investigation , Journal of Economics and international Finance, 4(2), 2012, 36-48.
[17]. A. D. Gbadebo, & A. Mohammed, Monetary Policy and Inflation Control In Nigeria”, Journal of Economics and Sustainable
Development. 6(8), 2015, 108-115. [18]. A.C. Chuku, Measuring the effects of monetary policy innovations in Nigeria: A structural vector autoregression (SVAR)
approach, Journal of Accounting, Economics, Finance and Banking Research, 5(5), 2015, 112-129.
[19]. Y. Naoyuki, S. Kaji, & T. Asonuma, Choices of optimal monetary policy instruments under the floating and basket- peg regimes, The Singapore Economic Review, 87(4), 2012, 1-13.
[20]. F.N. Emerenini, & C.N. Eke, C (2014), The impact of monetary policy rate on inflation Nigeria, Journal of Economics and
Sustainable Development, 5, (28), 2014. [21]. B. Fatukasi, Determinants of Inflation in Nigeria: An Empirical Analysis. International Journal of Humanities and Social
Sciences.1 (18), 2015, 262-271.
[22]. P.I. Nwosa, & I.O. Oseni, Monetary policy, exchange rate and inflation rate in Nigeria, A Co-integration and Multi- Variate Error Correction Approach. Research Journal of Finance and Accounting, 3(8), 2012, 62- 69.
[23]. D.O. Yinusa, & A.O. Akinlo, A vector error–correction analysis of relationship between exchange rates, Currency substitution
and monetary policy In Nigeria: 1968-2004, NJESS.49 (2) 2007.

The Dynamics of Monetary Policy and Inflation in Nigeria
DOI: 10.9790/5933-1002013749 www.iosrjournals.org 47 | Page
Books: [24]. H.A. Ajie, J. Akekere, & D.B. Ewubare, Issues in macroeconomics (Port Harcourt, Nigeria: Pearl Publishers, 2007).
[25]. A. Hamilton, (2001), Exploding Inflation ( Zeal Intelligence, 2001)
[26]. D. Wrightsman, An Introduction to Monetary Theory and Policy ( (New York :The Free Press, 1976). [27]. R.H. Frank, and B.S. Bernanke, Principles of Economics (2nd Edition McGraw- Hill/Urwin, 2003)
[28]. M. Friedman, Studies in the Quantity Theory of Money ( Chicago : University Press, 1956).
[29]. M. Friedman, Inflation: Causes and Consequences ( New York: Asia Publishing House, 1963). [30]. R. Barro, and V. Grilli, European macroeconomics (Chapter 8: Macmillan Publishers,1994).
[31]. J. Handa, Monetary Economics ( Routledge,2009). [32]. F.N. Kerlinger, Foundations of Behavioural Research Technique in Business and Economics, Eleventh Edition , 1978..
[33]. M.I. Obadan, Foreign exchange market & the balance of payments (Benin City, Nigeria: Goldmark Press, 2012).
Theses: [34]. T.W. Okotori, Effect of monetary policy on inflation in Nigeria 2009-2014, Masters’ Thesis, Niger Delta University,Wilberforce
Island Bayelsa, Nigeria, 2017.
[35]. Riika Nuutilainen, Essays on Monetary Policy in China”, doctoral diss., Acta Universitatis, Ouluensis.G, Oeconomica. Tapere, Finland , 2016.
Working/ Discussion Papers: [36]. W.H. Buiter, Central banks: Powerful, political and unaccountable? Centre for Economic Policy Research-Discussion Paper
Series, 2014, 10223.
[37]. C. Altavilla, & M. Ciccarelli, The effects of monetary policy on unemployment under model uncertainty: Evidence from the US
and Euro Area, European Central Bank ( Eurosystems) Working papers, 2009, 1089. [38]. D.M. Nguyen, J. Dridi, F.D. Unsal, & O.H. Williams, The Drivers of inflation in Sub Saharan Africa, International Monetary
Fund Working Papers, 2015, WP/15/189.
[39]. B.T. McCallum, & E. Nelson, Commentary, Federal Reserve Bank of St, Louis Review, 2011, 87(50:627-631. [40]. K. Nasser, Money demand and inflation in Madagascar, IMF Working Paper, 2005, WP/05/236.
[41]. Central Bank of Nigeria[CBN], The dynamics of inflation in Nigeria, Main Report, Occasional papers, 2007 32.
[42]. E.A. Adeyeye, & T.O. Fakiyesi, Productivity, prices and income board and anti-inflationary policy in Nigeria, In Nigerian economy under the military, proceedings of the Annual Conference of the Nigerian Economic Society, Ibadan, 1980.
[43]. J. Tojas-Bernate, Inflation and monetary policy in Madagascar, In Madagascar selected issues and statistical analyses, IMF country
report, 96/59, by Pierre Dhonte and others,1996, Washington DC. [44]. E. Sacerdoti, and Y. Xiao, Inflation dynamics in Madagascar, 1971-2000, IMF Working papers, 01/118, 2001,Washington DC.
[45]. G.G. Mordi,Overview of monetary policy framework in Nigeria, Bullion. 3(1), 2009,289.
[46]. R. Adalid, & C. Detken, Liquidity shocks and asset price boom bust cycles, ECB working paper, 2007, 732. [47]. Central Bank of Nigeria[CBN] Central Bank of Nigeria monetary programme: Understanding monetary policy series 2 2011b,
[48]. C. I. Onwachkwu, Impact of monetary policy on inflation control in Nigeria” MPRA paper 67087, University of Munich,2014,
Germany. [49]. M.K., Tule, E.C. Obioma, U.M. Okpanachi, S.O. Odeniran, and O.J. Olaoye, Monetary Growth and Inflation Dynamic in
Nigeria. CBN Working Paper Series.Vol.01, No.02, 2015.
Internet: [50]. R. Gajic, (2012), Macroeconomic shocks and monetary policy analysis of Sweden and the United Kingdom, Retrieved from
www.divaportal.org/smash/get/divas2:567314/fulltext01
[51]. CentralBankofNigeria[CBN]2015, Monetary Policy Review. Retrieved from http://www.cbn.gov.ng/out/2015/MRD/MPR%20FEBRUARY%202014pdf.
[52]. L. Bonga-Bonga, (2017), Assessing the effectiveness of the monetary policy instrument during inflation targeting period in South
Africa, Retrieved from https://mpra_ub-mechen.de/80794/MPRA_paper_80794pdf [53]. K. Mathai, (2012), Monetary policy: Stabilizing Prices and Output, Retrieved from
http://www.imf.org/external/pubs/ft/fandd/basics /monpol.htm [54]. A.W Salter, (2018), An introduction to monetary policy rules, Retrieved from http://mercatus.org/publication/introdction-
monetarypolicy rules.
[55]. J.U.J. Onwumere, G.I. Imo, & U.B. Ugwuanya, (2012), Does open market operations as monetary policy tool have impact on
Price stability in Nigeria, Retrieved from http ://www .iiste .org /journals /index .php /RJFA /dowload/3359/3387 [56]. W. Yu, & W. Ming, (2001), Reforming the transmission mechanism of monetary policy in China,Retrieved from
http://www.iwep.org.cn/
[57]. J.A. Markin, (2010), “ Bernanke battles US deflation threat”, Economic Outlook
[58]. M. Deme, M., & M. Fayissa, (1995), Inflation, money, interest rate, exchange rate and causality: The case of Egypt, Morocco andTunisia, Retrieved from https ://www.tandfoline /doi/abs/10.1080 /00036849 500000104#preview
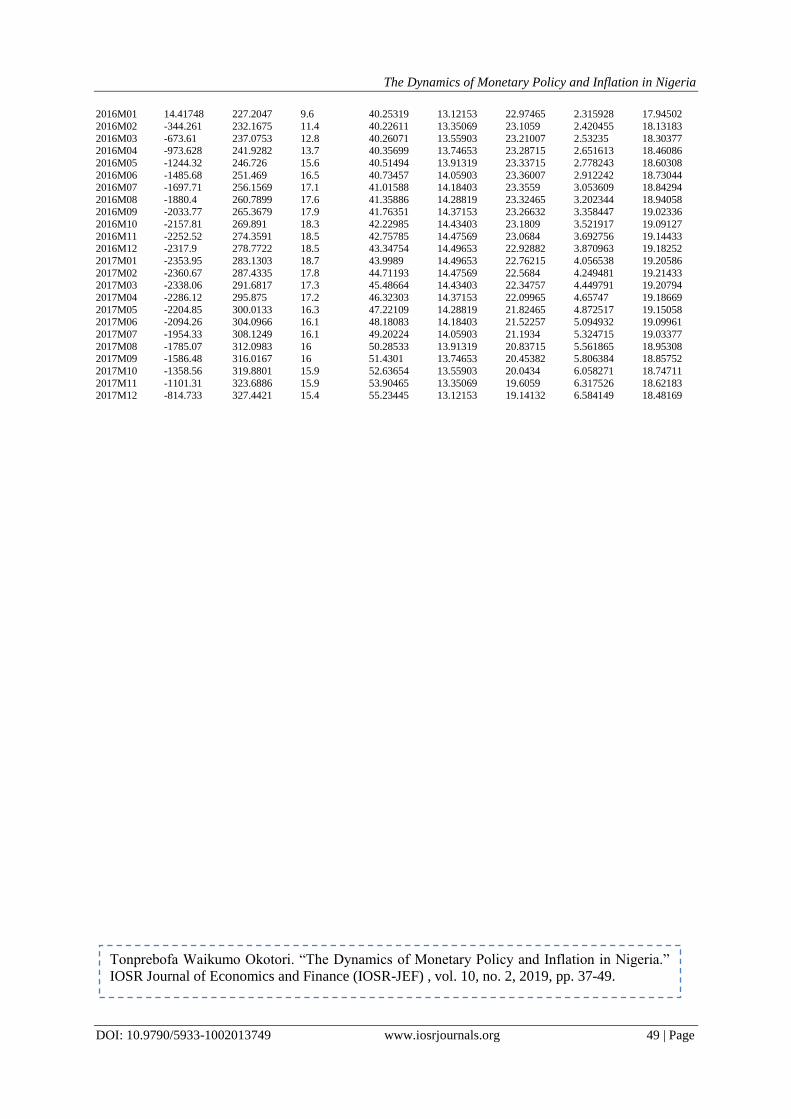
Monthly Data for the period 2009-2017 YEAR BOP EXR INF LQR MPR MS REQ TBR
2009M01 -10.6141 121.3633 12 34.32211 9.6125 33.37732 0.5975 4.635833
2009M02 -11.0892 123.8667 12.6 33.38808 9.415 33.79364 0.575 4.771667 2009M03 -11.5643 126.37 13.1 32.53669 9.2175 34.20996 0.5525 4.9075
2009M04 -12.0394 128.8733 13.5 31.76794 9.02 34.62628 0.53 5.043333
2009M05 -12.5146 131.3767 13.8 31.08183 8.8225 35.0426 0.5075 5.179167 2009M06 -12.9897 133.88 13.7 30.47836 8.625 35.45893 0.485 5.315
2009M07 -13.4648 136.3833 13.4 29.95752 8.4275 35.87525 0.4625 5.450833
2009M08 -13.9399 138.8867 13.3 29.51933 8.23 36.29157 0.44 5.586667 2009M09 -14.415 141.39 13.1 29.16377 8.0325 36.70789 0.4175 5.7225
2009M10 -14.8901 143.8933 12.8 28.89086 7.835 37.12421 0.395 5.858333

The Dynamics of Monetary Policy and Inflation in Nigeria
DOI: 10.9790/5933-1002013749 www.iosrjournals.org 48 | Page
2009M11 -15.3653 146.3967 12.6 28.70058 7.6375 37.54053 0.3725 5.994167
2009M12 -15.8404 148.9 12.5 28.59294 7.44 37.95685 0.35 6.13
2010M01 -14.8677 148.97 12.6 28.56794 7.330833 36.47761 0.335833 6.64 2010M02 -13.895 149.04 12.7 28.62558 7.221667 34.99837 0.321667 7.15
2010M03 -12.9223 149.11 12.8 28.76586 7.1125 33.51913 0.3075 7.66
2010M04 -11.9496 149.18 12.9 28.98877 7.003333 32.03989 0.293333 8.17 2010M05 -10.9769 149.25 12.9 29.29433 6.894167 30.56065 0.279167 8.68
2010M06 -10.0042 149.32 13.1 29.68252 6.785 29.08141 0.265 9.19 2010M07 -9.03145 149.39 13.3 30.15336 6.675833 27.60217 0.250833 9.7
2010M08 -8.05874 149.46 13.5 30.70683 6.566667 26.12293 0.236667 10.21
2010M09 -7.08604 149.53 13.8 31.34294 6.4575 24.64369 0.2225 10.72 2010M10 -6.11334 149.6 13.9 32.06169 6.348333 23.16446 0.208333 11.23
2010M11 -5.14063 149.67 13.9 32.86308 6.239167 21.68522 0.194167 11.74
2010M12 -4.16793 149.74 13.7 33.74711 6.13 20.20598 0.18 12.25 2011M01 -3.92779 150.0833 13.5 37.32882 6.385 20.13276 0.266667 12.89583
2011M02 -3.68765 150.4267 13.2 38.2684 6.64 20.05955 0.353333 13.54167
2011M03 -3.44752 150.77 13 39.1809 6.895 19.98634 0.44 14.1875 2011M04 -3.20738 151.1133 12.7 40.06632 7.15 19.91313 0.526667 14.83333
2011M05 -2.96724 151.4567 12.6 40.92465 7.405 19.83991 0.613333 15.47917
2011M06 -2.7271 151.8 12.3 41.7559 7.66 19.7667 0.7 16.125 2011M07 -2.48696 152.1433 12 42.56007 7.915 19.69349 0.786667 16.77083
2011M08 -2.24683 152.4867 11.6 43.33715 8.17 19.62028 0.873333 17.41667
2011M09 -2.00669 152.83 11.4 44.08715 8.425 19.54706 0.96 18.0625 2011M10 -1.76655 153.1733 11.1 44.81007 8.68 19.47385 1.046667 18.70833
2011M11 -1.52641 153.5167 11 45.5059 8.935 19.40064 1.133333 19.35417
2011M12 -1.28627 153.86 10.8 46.17465 9.19 19.32743 1.22 20 2012M01 -1.27057 154.1625 10.9 45.21088 9.424167 19.33149 1.274167 19.76667
2012M02 -1.25487 154.465 11 45.89282 9.658333 19.33555 1.328333 19.53333
2012M03 -1.23916 154.7675 10.9 46.61505 9.8925 19.3396 1.3825 19.3 2012M04 -1.22346 155.07 11.1 47.37755 10.12667 19.34366 1.436667 19.06667
2012M05 -1.20776 155.3725 11.1 48.18032 10.36083 19.34772 1.490833 18.83333
2012M06 -1.19205 155.675 11.3 49.02338 10.595 19.35178 1.545 18.6 2012M07 -1.17635 155.9775 11.6 49.90671 10.82917 19.35584 1.599167 18.36667
2012M08 -1.16065 156.28 11.8 50.83032 11.06333 19.3599 1.653333 18.13333
2012M09 -1.14494 156.5825 11.9 51.79421 11.2975 19.36396 1.7075 17.9 2012M10 -1.12924 156.885 11.9 52.79838 11.53167 19.36802 1.761667 17.66667
2012M11 -1.11354 157.1875 12.1 53.84282 11.76583 19.37208 1.815833 17.43333
2012M12 -1.09783 157.49 12.2 54.92755 12 19.37614 1.87 17.2
2013M01 -1.44394 157.475 11.9 63.36806 12 19.33883 1.95 16.87833
2013M02 -1.79004 157.46 11.7 64.22639 12 19.30152 2.03 16.55667
2013M03 -2.13614 157.445 11.4 64.81806 12 19.26422 2.11 16.235 2013M04 -2.48224 157.43 11.1 65.14306 12 19.22691 2.19 15.91333
2013M05 -2.82834 157.415 10.8 65.20139 12 19.1896 2.27 15.59167
2013M06 -3.17444 157.4 10.4 64.99306 12 19.1523 2.35 15.27 2013M07 -3.52054 157.385 10 64.51806 12 19.11499 2.43 14.94833
2013M08 -3.86664 157.37 9.8 63.77639 12 19.07769 2.51 14.62667
2013M09 -4.21275 157.355 9.5 62.76806 12 19.04038 2.59 14.305 2013M10 -4.55885 157.34 9.2 61.49306 12 19.00307 2.67 13.98333
2013M11 -4.90495 157.325 8.8 59.95139 12 18.96577 2.75 13.66167
2013M12 -5.25105 157.31 8.5 58.14306 12 18.92846 2.83 13.34 2014M01 -5.02552 157.6508 8.4 56.06806 12.16583 19.00576 2.928333 13.66583
2014M02 -4.79999 157.9917 8.3 53.72639 12.33167 19.08305 3.026667 13.99167
2014M03 -4.57446 158.3325 8.2 51.11806 12.4975 19.16035 3.125 14.3175 2014M04 -4.34894 158.6733 8.1 48.24306 12.66333 19.23765 3.223333 14.64333
2014M05 -4.12341 159.0142 8 45.10139 12.82917 19.31495 3.321667 14.96917
2014M06 -3.89788 159.355 8 41.69306 12.995 19.39224 3.42 15.295 2014M07 -3.67235 159.6958 8 38.01806 13.16083 19.46954 3.518333 15.62083
2014M08 -3.44682 160.0367 8 34.07639 13.32667 19.54684 3.616667 15.94667
2014M09 -3.22129 160.3775 8 29.86806 13.4925 19.62413 3.715 16.2725 2014M10 -2.99577 160.7183 8 25.39306 13.65833 19.70143 3.813333 16.59833
2014M11 -2.77024 161.0592 8 20.65139 13.82417 19.77873 3.911667 16.92417 2014M12 -2.54471 161.4 8 15.64306 13.99 19.85602 4.01 17.25
2015M01 6606.288 163.3637 8.2 45.38879 8.746528 19.28715 1.636311 14.54419
2015M02 5895.652 168.9861 8.4 44.6216 9.225694 19.7434 1.652421 14.90933 2015M03 5214.345 174.5536 8.5 43.9161 9.684028 20.17257 1.6759 15.25961
2015M04 4562.367 180.066 8.7 43.27226 10.12153 20.57465 1.706747 15.59502
2015M05 3939.72 185.5235 9 42.69011 10.53819 20.94965 1.744962 15.91558 2015M06 3346.403 190.9261 9.2 42.16963 10.93403 21.29757 1.790545 16.22127
2015M07 2782.415 196.2736 9.2 41.71082 11.30903 21.6184 1.843495 16.51211
2015M08 2247.758 201.5662 9.3 41.31369 11.66319 21.91215 1.903814 16.78808 2015M09 1742.43 206.8038 9.4 40.97824 11.99653 22.17882 1.971501 17.04919
2015M10 1266.432 211.9865 9.3 40.70446 12.30903 22.4184 2.046556 17.29544
2015M11 819.764 217.1142 9.4 40.49236 12.60069 22.6309 2.128979 17.52683 2015M12 402.4258 222.1869 9.6 40.34194 12.87153 22.81632 2.218769 17.74336
The Dynamics of Monetary Policy and Inflation in Nigeria
DOI: 10.9790/5933-1002013749 www.iosrjournals.org 49 | Page
2016M01 14.41748 227.2047 9.6 40.25319 13.12153 22.97465 2.315928 17.94502
2016M02 -344.261 232.1675 11.4 40.22611 13.35069 23.1059 2.420455 18.13183
2016M03 -673.61 237.0753 12.8 40.26071 13.55903 23.21007 2.53235 18.30377 2016M04 -973.628 241.9282 13.7 40.35699 13.74653 23.28715 2.651613 18.46086
2016M05 -1244.32 246.726 15.6 40.51494 13.91319 23.33715 2.778243 18.60308
2016M06 -1485.68 251.469 16.5 40.73457 14.05903 23.36007 2.912242 18.73044 2016M07 -1697.71 256.1569 17.1 41.01588 14.18403 23.3559 3.053609 18.84294
2016M08 -1880.4 260.7899 17.6 41.35886 14.28819 23.32465 3.202344 18.94058 2016M09 -2033.77 265.3679 17.9 41.76351 14.37153 23.26632 3.358447 19.02336
2016M10 -2157.81 269.891 18.3 42.22985 14.43403 23.1809 3.521917 19.09127
2016M11 -2252.52 274.3591 18.5 42.75785 14.47569 23.0684 3.692756 19.14433 2016M12 -2317.9 278.7722 18.5 43.34754 14.49653 22.92882 3.870963 19.18252
2017M01 -2353.95 283.1303 18.7 43.9989 14.49653 22.76215 4.056538 19.20586
2017M02 -2360.67 287.4335 17.8 44.71193 14.47569 22.5684 4.249481 19.21433 2017M03 -2338.06 291.6817 17.3 45.48664 14.43403 22.34757 4.449791 19.20794
2017M04 -2286.12 295.875 17.2 46.32303 14.37153 22.09965 4.65747 19.18669
2017M05 -2204.85 300.0133 16.3 47.22109 14.28819 21.82465 4.872517 19.15058 2017M06 -2094.26 304.0966 16.1 48.18083 14.18403 21.52257 5.094932 19.09961
2017M07 -1954.33 308.1249 16.1 49.20224 14.05903 21.1934 5.324715 19.03377
2017M08 -1785.07 312.0983 16 50.28533 13.91319 20.83715 5.561865 18.95308 2017M09 -1586.48 316.0167 16 51.4301 13.74653 20.45382 5.806384 18.85752
2017M10 -1358.56 319.8801 15.9 52.63654 13.55903 20.0434 6.058271 18.74711
2017M11 -1101.31 323.6886 15.9 53.90465 13.35069 19.6059 6.317526 18.62183 2017M12 -814.733 327.4421 15.4 55.23445 13.12153 19.14132 6.584149 18.48169
Tonprebofa Waikumo Okotori. “The Dynamics of Monetary Policy and Inflation in Nigeria.”
IOSR Journal of Economics and Finance (IOSR-JEF) , vol. 10, no. 2, 2019, pp. 37-49.