the dynamics of stock prices and exchange rates: evidence...
TRANSCRIPT

THE DYNAMICS OF STOCK PRICES AND EXCHANGE RATES: EVIDENCE FROM NIGERIA
Mutiu A. Oyinlola, Oluwatosin Adeniyi and Olusegun Omisakin17
Abstract
This paper probed the long-run and short-run dynamics between stock prices and exchange rates in Nigeria using the Johansen and Gregory-Hansen cointegration analyses, causality test and Exponentional General Autoregressive Conditional Heteroskedasticity modeling on daily data from January 2, 2002 to August 11, 2011.The results showed that there is no long run relationship between stock prices and exchange rate in Nigeria, albeit, with a structural break date of mid April 2007, which coincides with the period when the stock prices plumped precipitously from the impact of global financial crisis in early 2007. In addition, the results indicated that there is a unidirectional relationship from stock prices to exchange rate and that the EGARCH modeling suggested that a 100% increase in stock prices would lead to a 1.66% appreciation of the exchange rate. Thus, it is imperative for monetary authorities in Nigeria to take into account the role of stock market development in the conduct of its exchange rate policy.
JEL Classification: C13, F31, G12. Keywords: Stock price, Stock market, Exchange rate, Structural break cointegration, and Exponential GARCH modeling
INTRODUCTION
The recent global financial crisis characterized by sudden fall in the prices of equities and the unexpected ebb and flow in exchange rates has brought to the fore, the need to further investigate the relationship between exchange rate and stock prices. The attention of academics and researchers has focused increasingly on the mechanics of the stock prices-exchange rate nexus as world economies become more integrated. This is of particular importance for the far less researched developing countries that equally felt the impact of the world-wide dreary economic tidal wave. In Nigeria, a cursory look at the
17
Mr. Mutiu A. Oyinlola and Mr. Olusegun Omisakin are Lecturers at University of Ibadan,
Nigeria and Redeemer’s University, Nigeria respectively while Mr. Oluwatosin Adeniyi works
at Centre for the Study of the Economies of Africa, Nigeria. The views expressed in this paper
are personal to the authors and does not represent the official position of their employers.

Mutiu A. Oyinlola, Oluwatosin Adeniyi and Olusegun Omisakin
69
daily trend of stock prices (All Share Index) and bilateral exchange rate (Naira, N per USD) suggests a seemingly inverse relationship between the variables especially for the period from the financial crisis to date. The daily stock price, captured by All Share Index, increased marginally from an average of 11,659 in 2002 to 27605 units in mid 2006. Thereafter, the growth rate gained momentum and climaxed at 66,286 units in early April 2008. Over the same period, exchange rate depreciated steadily from an average of N120 per USD in 2002 to N129 per USD at the end of 2003, after which, it experienced gradual appreciation reaching a trough at the same period the stock price reached its peak in 2008. Thenceforth, the Nigeria stock market crashed to 19,814 units in mid May 2009 and hovered at an average of 24,739 units between 2009 and 2011. Similarly, exchange rate fell to N150 per USD at the time of the crash, and also remained at an average of N149 per USD between same periods.18 Nevertheless, the extent and direction of the relationship remain to be explored. Theoretically, the association between stock prices and exchange rates takes two forms. First, are the “Flow-oriented” models of exchange rates. These models assume that exchange rates changes will affect a firm’s value via changes in international competitiveness and the value of firm’s assets and liabilities denominated in foreign currency. Eventually, profits will be affected, and hence, the equity value of firms will change. Thus, the flow-oriented models represent a positive relationship between stock prices and exchange rates with direction of causation running from exchange rates to stock prices. Second, the “Stock-oriented” models of exchange rates otherwise referred to the “portfolio balance approaches” are contingent on the role of capital account transaction. These models posit that exchange rates play the role of balancing the demand for and supply of assets. An increase in domestic stock prices lead individuals to demand more domestic assets. This will prompt local investors to dispose off their foreign assets, which has become less attractive, thereby leading to appreciation of local currency. Hence, the relationship is negative with causation flowing from stock prices to exchange rate. There is therefore no consensus on the relationship as well as the direction of causation between stock prices and exchange rates. Initial empirical studies, which examined the relationship between stock and exchange rates markets, chiefly focused on the developed economies, mostly on US with unsettled results (see for instance, Aggarwal, 1981; Soenen and Hennigar, 1988; Chow et al., 1997). Aggarwal (1981) finds that the US stock prices and the trade-weighted dollar value are positively correlated while Soenen and Hennigar (1988) report a significant negative
18
See Figure A1 in the appendix for graphical illustration of the relationship between stock
prices and exchange rate.

Vol. 12, No.1 Journal of Monetary and Economic Integration
70
relationship. Chow et. al. (1997) represents a different view on the relationship. They posit that no association exists between the two markets. Contemporary studies explore different time horizons and regions to investigate the relationship between stock prices and exchange rates. The nature of the relationship remains inconclusive. The results of some of the studies in the industrialized countries show that the stock markets influence developments in the foreign exchange markets both in the short-run and long run (see for example, Ajayi and Mougoue, 1996; Ajayi, Friedman and Mehdian, 1998). In his submission, Stavarek (2005) states that long-run relation exists between the variables only in countries with developed stock markets. Few studies done on the developing economies also demonstrate the inconclusiveness found in the literature especially in the direction of causality. Nath and Samanta (2003) find no long-run relations between the markets in India. However, some elements of causality were found in recent years running from stock markets to currency markets. Similar conclusion was reached by Adebiyi, Adenuga, Abeg, and Omanukwue (2010) who used Johansen cointegration method to investigate the long-run relations between the variables in Nigeria. Other bivariate and multivariate investigations done on Nigeria include Aliyu, (2009), Mbutor (2010), Adjasi, Biekpe and Osei (2011), Adaramola (2012), Okpara and Odionye (2012) and Osamwonyi and Evbayiro-Osagie (2012). The outcomes are mixed. While they all reported long run relations between the variables, some even weakly cointegrated; the results however show different directions. Most of the aforementioned studies used either the Vector autoregressive (VAR) or Vector error correction model (VECM) modeling to examine the nature of the relationship. In addition, the direction of causality was prominently determined by pair wise Granger causality test. It is also discovered that most of the studies relied on the Johansen’s (1988) cointegration test (see for example Aliyu, 2009; Adaramola, 2012; and Okpara and Odionye, 2012). The Johansen’s test assumes that long run relations are time invariant. The power of cointegration tests, however, is substantially reduced when applied to cointegrated series which experience a change in their cointegrating relationship. Kunitomo (1996) argues that in the presence of a structural change, traditional cointegration tests, which do not allow for this, may produce spurious cointegration. This reason may be attributed to the mix outcome of the cointegration tests observed by Aliyu (2009). In view of this, this present attempt applies the Gregory and Hansen (1996) cointegration test in order to explicitly allow for breaks at an unknown time in the long-run relationship between exchange rate and stock prices. This test permits examination of the hypothesis that failure to detect cointegration using standard tests may result from time variation in an underlying cointegrating relationship. The main objective of this paper is to examine the relationship between stock market prices and exchange rates in Nigeria. The present effort is distinctive from extant studies, in a number of ways. First, daily data over a fairly long period is employed in the present enquiry. The long period is expected to improve the significance of the results obtained.

Mutiu A. Oyinlola, Oluwatosin Adeniyi and Olusegun Omisakin
71
Second, the study uses a barrage of approaches to investigate the mean reversion characteristics of stock prices and exchange rates. The variety of the approaches provides robustness for the reliability of the result obtained. Lastly, the long run relationship is examined through the use of a method that considers the possibility of existence of structural breaks, a la the Gregory-Hansen endogenous structural break cointegration method. The paper is subsequently structured as follows. Section 2 provides the background to the study. Section 3 offers a brief review of empirical studies; Section 4explains the data and methodology. Section 5 presents the empirical results while section 6 summarizes the main findings and the policy implication.
AN OVERVIEW OF THE NIGERIAN STOCK MARKET19
The indicators of the development in the capital market include Market capitalization and All Share index. Market capitalization is the total value of all equity securities listed on the stock exchange. It measures the size of a capital market. The All Share index (ASI) is a weighted average of the market prices of all shares listed in the Stock Exchange. The market is captured by the All Share Index and the Market capitalization. The market was and is still predominantly driven by equities with the banking sector making up a significant proportion of total market capitalization. The growth in the Nigeria’s capital market over the past decade was phenomenal. The Figure below captures the remarkable growth. The value of the market capitalization doubled within two years; it rose from N644 million in January 2002 to about N1.3 billion in December 2003. The All Share index portrayed similar impressive performance. The figure went up from 10,895 points to 20,782 points within the same period. During the period, exchange rate depreciated from an average of N 120 per US dollar to N 129 per US dollar. The growth rate of the market slowed down between 2004 and 2006, with the market capitalization and ASI at an average of N2.03 billion and 23,681.92 points, respectively. The trend increased afterwards. The Central Bank of Nigeria reported that in the year 2006, $2.5 billion as foreign direct investment was attracted into the Nigerian economy while in the same year the size of the capital market
19
This section benefits immensely from some insights from Arunma Oteh (2012), The Nigerian
Capital Market , being the submission by the Securities and Exchange Commission at the
March 2012 Public Hearing Organized by the Committee on Capital Market and other
Institutions, House of Representatives of the Federal Republic of Nigeria delivered by the
Director General, Securities and Exchange Commission .

Vol. 12, No.1 Journal of Monetary and Economic Integration
72
grew sevenfold to the tune of N5 trillion. However, the growth recorded in the market was induced by the regulation which mandated the recapitalization of Banks and was a clear deviation from the markets natural growth pattern. Minimal capital requirement for banks was increased to N25 billion or US$200 million. This development triggered a wave of mergers and acquisitions in the industry in which 25 strong banks emerged in 2005 from 89 banks in 2004. Thereafter, the market witnessed unimaginable leap. At its peak in April 2008, market capitalization stood at N12.6 trillion, while the ASI attained 66,371 points. Regrettably, emphasis on risk management and corporate governance did not evolve commensurately to support the fast growth. Invariably, the additional capital raised by the banks went into speculative lending to the oil and gas sector, and unregulated margin finance to brokers, and individual investors which fuelled an asset bubble. Figure 1: Market Capitalization and All Shares Index (2002-2011)
Source: Authors’ construction from data obtained from CBN, NSE.
Market capitalization plunged uncontrollably from the peak recorded in the first quarter of 2008 to N7.4 trillion on the last day of 2008 and further down to N4.978 trillion by end of February, 2009. At the same period, exchange rate fell to N 150 per US dollar (See Figure A1 at the appendix). The emergence of the global financial crisis triggered large portfolio outflows; international investors exited the Nigerian capital markets to address challenges in their home countries. Stock prices started to decline, prompting margin calls and local investors who were unaccustomed to huge and persistent declines started to panic, fueling more sell orders, further depressing prices and eroding investor confidence. The situation was exacerbated by the huge borrowing and margin finance exposure of individual investors, brokers and banks. By March, 2009, index of equities had declined to 21,893 points, with a market capitalization of N4.836 trillion. The

Mutiu A. Oyinlola, Oluwatosin Adeniyi and Olusegun Omisakin
73
negative trend reveals the severity of the market downturn, as the ASI lost a total share of 67 percent, while market capitalization lost 62 percent of its value between March 2008 and March 2009 (Ajakaiye and Fakiyesi, 2009). The Security and Exchange Commission’s strategic interventions to strengthen the market, restore investor confidence, engender market integrity and stimulate interest in the market began to yield positive results in 2010. The market rebound as the All-Share Price Index gained 18.9 percent, closing at 24,770.52, Equity market capitalization increased by 58.5 percent, from N4.99 trillion in 2009 to N7.91 trillion in 2010. At the end of 2011, equities market capitalization declined to N6.5 trillion and the NSE ASI fell to 20,730.63, representing a 17.42 percent and 17.07 percent dip respectively from the closing figures of 2010.
A BRIEF REVIEW OF PREVIOUS STUDIES
In this section, attempt is not made to assume a far-reaching reportage on the subject. Rather, we begin the discussion on the debate from the theoretical perspectives, then later to the early empirical studies and end up with the more recent works with focus on how successive studies have differed and moved the front line of the debate. The section concludes with identified gaps in the literature and how this study attempts to fill them. The theoretical explanations of the link between exchange rate and stock prices are focused on the exchange rate determination models, which are broadly classified into two major strands. The “Flow-oriented” models of exchange rates (Dornbusch and Fischer, 1980) focus on the current account of the balance of payment. These models suggest that exchange rate changes affect international competitiveness and trade balance, impacting real income and output. Thus a given domestic currency depreciation makes local firms more competitive internationally, leading to an increase in their exports. A rise in the foreign exchange inflow-income, in turn raises their stock prices. Therefore, flow oriented models symbolize a positive relationship between stock prices and exchanges rates with direction of causation running from exchange rates to stock prices. The conclusion of a positive relationship stems from the assumption of using direct exchange rate quotation. The Portfolio balance models of exchange rate determination argue that exchange rates should reflect relative demand for domestic against foreign assets (Branson, 1983; Frankel, 1983). In these models individuals hold domestic and foreign assets, including currencies, in their portfolio and hence exchange rates play the role of balancing the demand for and supply of assets. An increase in domestic stock prices lead individuals to demand more domestic assets. Local investors would simply dispose foreign assets, which are relatively less attractive after the increase, to buy more domestic assets, thereby causing local currency appreciation. The increases in domestic stocks prices affect

Vol. 12, No.1 Journal of Monetary and Economic Integration
74
exchange rates through direct and indirect channels. Investors are encouraged to buy more domestic assets while at the same time selling foreign assets to obtain domestic currency required for buying new domestic stocks with an increase in price.20 The described shifts in demand and supply of currencies cause domestic currency appreciation. The indirect channel anchors on the following causality chain. An increase in wealth resulting from a rise in domestic asset price prompts investors to increase their demand for money, which in turn raises domestic interest rates. If domestic interest rate is high enough, foreign capital reacts to the interest rate differentials by increasing inflows. The inflow initiates an increase in foreign demand for domestic currency and its eventual appreciation. Therefore, stock price innovations may affect, or be affected by, exchange rate dynamics. There is no theoretical consensus on the existence of relationship between stock prices and exchange rates or on the direction of the relationship. Empirical studies investigating the relationship between stock prices and exchange rate have increased in folds over the past few decades. Early enquiries into the nexus relied on correlation analyses to show the nature of association (see for example, Franck and Young, 1972; Aggarwal, 1981; Soenen and Hennigan 1988; and Jorion, 1990). The results from these studies were mixed. The first study that examined the relationship between stock prices and exchange rates was by Franck and Young (1972) and they found no link between the variables using six different measures of exchange rates. Aggarwal (1981) explored simple regressions to examine the relationship between the dynamics of dollar exchange rates and stock prices. The results presented a stronger short run positive relationship than in the long run. Contrary to the outcome of Aggarwal(1981), Soenen and Hanniger (1988) detected a strong negative relationship between the value of the U.S. dollar and the change in stock prices for the period 1980-1986. However, when they analyzed the above relationship for a different period, they found a statistical significant negative impact of revaluation on stock prices.
20
Whilst depreciation may lead to international competitiveness and encourage foreign
investments in local assets denominated in foreign currency, it may discourage local
investment in assets denominated in local currency. In situation where the stock market is less
integrated, in the short term depreciation of the local currency may affect the firms’ value
negatively.

Mutiu A. Oyinlola, Oluwatosin Adeniyi and Olusegun Omisakin
75
The latter investigations into the enquiry concluded that the observed mixed outcomes from the earlier studies might be from the non-stationarity of the financial variables that were used. These newer vintage studies used cointegration and Granger causality to show the direction of association between the variables. Prominent among the pioneers of this line of inquiry are Bahmani-Oskooee and Sohrabian (1992). They found bidirectional causality relationship between the stock and exchange rate markets only in the short-run; and that there is no long-run relationship between the two variables using cointegration analysis. Subsequent studies relied on the methodology of Bahmani-Oskooee and Sohrabian (1992); interestingly, those studies were also characterized with mixed and diverse results. While some found bidirectional causality between exchange rate and stock prices (for example, Yu, 1997; Granger, Huang and Yang, 2000; and Husam, 2012), others opined that a unidirectional causality exist, though pronged in different directions. On the one hand are studies that concluded that the direction flows from stock prices to exchange rate (see for example, Ajayi et al. 1998; Nagayasu, 2001; Ramasay and Yeung 2001; and Tabak, 2006), whilst on the other hand are those who hold strongly (and significantly) that the reverse is the case especially during financial crises (see for instance, Pan et al 2007). Digging deeper, Yu (1997) examined the nexus between the two variables for the period 1983-1994 for Hong Kong, Tokyo, and Singapore and observed bidirectional relationship in Tokyo; and unidirectional causality flowing from exchange rates to stock prices while no causation was found for the Singapore market. Husam (2012) also investigated the bilateral relationship between the variables in Turkey between 2001 and 2009, and found long run relationship and bidirectional causality. Tabak (2006) used linear causality to examine the relationship between exchange rate and stock prices in Brazil between August 1 1994 and May 14, 2002 and found support for the portfolio approach. However, when nonlinear causality test was considered the results suggested causality from exchange rates to stock prices, thereby supporting the traditional approach. Pan et. al. (2007) probed the relationship between exchange rate and stock prices in seven Asian countries between 1988 and 1998. They found significant causal relationship flowing from exchange rate to stock prices (in Japan, Malaysia, and Thailand) and that the extent of the link was reported to be intense in all but one country(Malaysia), during and after the financial crisis in 1997. This result was further supported by Beer and Hebein (2008) who found positive spillover from exchange rate to stock markets for Canada, Japan, the USA and India using cointegration and multivariate exponential GARCH modeling. There is, however, a third perspective to the debate. Some studies could not ascertain the direction of causality because of inconsistent relationship between the variables. Ajayi et

Vol. 12, No.1 Journal of Monetary and Economic Integration
76
al. (1998) while noting that stock development has implication for exchange rate in the developed economies also hinted that the relationship is inconsistent in the case of emerging economies. The third argument further garnered support from Stavarek (2005), who examined the nexus between exchange rate and stock prices in EU and the USA over the period 1970 and 2003. The result showed that direction of causality is not uniform across countries except for the UK and the USA that suggested a unidirectional causality from stock prices to exchange rate. Therefore, the study concluded that development of the domestic stock market cannot be efficiently implemented into exchange rate forecasting and as such the monetary authorities of the new Central European EU-member countries are not obliged to take stock development into account in realization of their exchange rate policy. A number of authors have examined the relationship between exchange rate and stock prices in Nigeria with diverse outcomes. Aliyu (2009) found a weak long run relationship with the Johansen cointegration approach and no cointegration at all with the Engle Granger method. Bidirectional causality between the variables was found using the pair wise Granger causality test. Other subsequent researchers, who are segmented into two, found unidirectional causality in varying directions. The first set of authors established that the direction runs from exchange rate to stock prices. In their paper, Adjasi, Biekpe and Osei (2011) found that exchange rate shocks reduce stock returns in Nigeria among other countries using the VAR cointegration and impulse response analysis. This position was further supported by Osamwonyi and Evbayiro-Osagie (2012), who examined the impact of six macroeconomic variables including exchange rate on stock prices between 1975 and 2005 and concluded that exchange rates are positively related to stock market in the short run but negative in the long run. The second set of authors posited that the reverse causation is the case. In his paper, Mbutor (2010) used the VAR methodology and impulse response to investigated exchange rate volatility and stock price fluctuations and the influence of lending behaviour in Nigeria. Stock prices were found to lead to exchange rate depreciation. Similarly, Adebiyi et al., (2010), examined the role of oil price schocks and exchange rate on the behavior of stock market using the VAR methodology and Granger causality. They found no long run relationship among the variables, but the results of the Granger causality suggested a unidirectional causality running from stock prices to exchange rate. Other authors also found similar outcome (see for example, Adaramola, 2012; and Okpara and Odionye, 2012). Both authors employed quarterly data to examine the nexus. Okpara and Odionye (2012) used the VECM and pair wise Granger causality test and found long run relationship and strong unidirectional causality from stock prices to exchange rate. Adaramola (2012), though, detected unidirectional relationship running from stock prices to exchange rate, the signs of the long run and short run coefficients however suggested different impacts on exchange rate.

Mutiu A. Oyinlola, Oluwatosin Adeniyi and Olusegun Omisakin
77
The observed trend in the more recent studies tends to show series of methodological explorations and applications in deciphering the nature of the relationship between the two variables, which had thus far, been emblemed with mixed outcomes from the earlier studies. Of special note are studies that have considered different methods of examining long run relationship between variables as well as the short run through the use of various types of generalized autoregressive conditional heteroscedasticity (GARCH), which was popularized by Bolerslev (1986) and had since been used to estimate relationship between financial variables. The conclusion from the above studies unarguably suggests the existence of a substantial interest on the nexus between the exchange rate and stock prices with the use of different methodologies and data sets. While no consensus has been reached on the robustness of the empirical evidences, it is pertinent to contribute to the debate so as to add a developing country’s view point to the arguments. Since the collapse of the Nigerian Stock market in mid-2009, the market had remained laggard. And if stock prices and exchange rates are related and the causation runs from exchange rates to stock prices then crises in the stock markets can be prevented by controlling the exchange rates. If on the other hand, the causation runs from stock prices to exchange rates then authorities can tweak domestic economic policies to stabilize the stock market. Information of the interaction of the two markets can be utilized by investors to anticipate the behaviour of one market using the information on other market. To unravel the link for Nigeria, this present enquiry employed the endogenous structural break cointegration approach in testing for cointegration and the exponential GARCH. These, to the best of our knowledge, had not been employed on a daily data set for Nigeria before.
DATA DESCRIPTION AND METHODOLOGY
Data
Data used in this empirical study are Nigeria’s daily stock market index (to capture stock prices) and nominal exchange rate (expressed in Nigeria Naira per U.S dollar) for the period spanning January 02, 2002 to August 11, 2011. It is expected that the daily analysis will show how market participants react to incoming information. The stock price is represented in this paper by the All Share Index (ASI), while exchange rate is denoted by EXCH. Data are obtained from the Nigeria Stock Exchange Factsheet and the Central Bank of Nigeria’s website.
Descriptive Statistics
Table 1 (in Appendix) presents the descriptive statistics of exchange rate and stock price in their natural log values. It is evident, by comparing the mean and median of the variables in the table, that the median values of exchange rate and stock price are slightly
Vol. 12, No.1 Journal of Monetary and Economic Integration
78
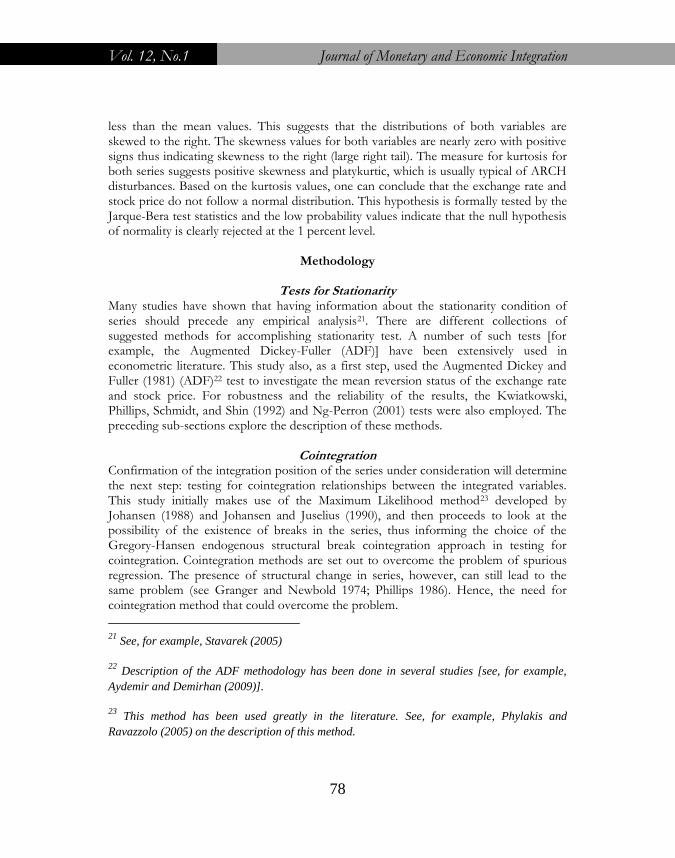
less than the mean values. This suggests that the distributions of both variables are skewed to the right. The skewness values for both variables are nearly zero with positive signs thus indicating skewness to the right (large right tail). The measure for kurtosis for both series suggests positive skewness and platykurtic, which is usually typical of ARCH disturbances. Based on the kurtosis values, one can conclude that the exchange rate and stock price do not follow a normal distribution. This hypothesis is formally tested by the Jarque-Bera test statistics and the low probability values indicate that the null hypothesis of normality is clearly rejected at the 1 percent level.
Methodology
Tests for Stationarity Many studies have shown that having information about the stationarity condition of series should precede any empirical analysis21. There are different collections of suggested methods for accomplishing stationarity test. A number of such tests [for example, the Augmented Dickey-Fuller (ADF)] have been extensively used in econometric literature. This study also, as a first step, used the Augmented Dickey and Fuller (1981) (ADF)22 test to investigate the mean reversion status of the exchange rate and stock price. For robustness and the reliability of the results, the Kwiatkowski, Phillips, Schmidt, and Shin (1992) and Ng-Perron (2001) tests were also employed. The preceding sub-sections explore the description of these methods.
Cointegration
Confirmation of the integration position of the series under consideration will determine the next step: testing for cointegration relationships between the integrated variables. This study initially makes use of the Maximum Likelihood method23 developed by Johansen (1988) and Johansen and Juselius (1990), and then proceeds to look at the possibility of the existence of breaks in the series, thus informing the choice of the Gregory-Hansen endogenous structural break cointegration approach in testing for cointegration. Cointegration methods are set out to overcome the problem of spurious regression. The presence of structural change in series, however, can still lead to the same problem (see Granger and Newbold 1974; Phillips 1986). Hence, the need for cointegration method that could overcome the problem.
21
See, for example, Stavarek (2005)
22 Description of the ADF methodology has been done in several studies [see, for example,
Aydemir and Demirhan (2009)].
23 This method has been used greatly in the literature. See, for example, Phylakis and
Ravazzolo (2005) on the description of this method.

Mutiu A. Oyinlola, Oluwatosin Adeniyi and Olusegun Omisakin
79
Gregory-Hansen Endogenous Structural Break cointegration test Gregory, et al. (1996)’s simulation results showed that the power of the Engle-Granger (1987) test of the null of no cointegration is substantially reduced when there is a break in the cointegrating relationship. To overcome this problem, Gregory and Hansen (1996) extend the Engle-Granger test to allow for breaks in either the intercept or the intercept and trend of the cointegrating relationship at an unknown time. Denoting the familiar Engle-Granger cointegrating regression between two series
{ ty , tx } as:
0t t ty x (1)
Gregory and Hansen (1996) considered three models allowing structural change in the cointegrating relationship, these models being specified and denoted as follows:
Model C: Level shift 0 1t t t ty x (2)
Model C/T: Level shift with trend 0 1t t t ty t x (3)
Model C/S: Regime shift 0 1 1 2t t t t t ty x x (4)
Each of the above models therefore permits structural change via the dummy variable
t which is defined as:
t = 1
0 otherwise
if t ��� ��
���
>
The next step is to test whether t is stationary or has a unit root by using the standard
ADF tests. If the variables are non-stationary and are cointegrated, the adequate method to examine the issue of causation is the Vector Error Correction Model (VECM), which is a Vector Autoregressive Model (VAR) in first differences with the addition of a vector of cointegrating residuals. Thus, this VAR system does not lose long-run information. In the absence of any cointegrating relationship between the variables, the standard Granger causality test based on (Granger, 1988) would be applied.

Vol. 12, No.1 Journal of Monetary and Economic Integration
80
The Exponential Generalized Autoregressive Conditional Heteroscedasticity (EGARCH)24
The Exponential GARCH (EGARCH) model is one of the alternative models of Generalised Autoregressive Conditional Heteroscedasticity (GARCH) and it is used to estimate the relationship between financial variables. Bolerslev (1986) introduced the GARCH model by extending Engles(1982) framework and have been popular since the early 1990s. Nelson (1991) first proposed the Exponential GARCH or EGARCH model due to the perceived problems with standard GARCH (p,q) model. The EGARCH captures asymmetric responses of the time varying variance to shocks25. The representation of the EGARCH variance takes the form:
12 2 10 1
2 2
1 1
2ln ln
ttt t
t t
uu
(5)
Where 0 , , and are the parameters to be estimated. The left hand side is the
log of the conditional variance, thus the leverage effect is exponential as opposed to quadratic with the estimates of the conditional variance guaranteed to be non negative. The EGARCH benefits from the non-negativity constraint which Nelson viewed as too restrictive in linear GARCH model which requires all the explanatory variables in a
GARCH to be positive. 0 denotes the mean of the volatility equation, represents
the size effects which indicate how much volatility increases regardless of the shock direction. The estimate of is used to evaluate the perspective of shocks. The
absolute value of <1 ensures stationarity and ergodicity for EGARCH (P, Q). is
the asymmetric response parameter, it is the sign effect which determines whether positive shocks give rise to higher volatility than negative shock or vice versa.
EMPIRICAL RESULTS
Test for Stationarity and Cointegration Analysis
Prior to testing for cointegration, unit root tests are performed on both stock price indices and exchange rate to determine their order of integration. To achieve this, the
24
This section benefits immensely from a FIW -Working Paper titled “Exploring oil price –
exchange rate nexus for Nigeria” by Zahid Muhammad, Hassan Suleiman, Reza Kouhy, FIW
Working Paper No. 71, September, 2011.
25 It also ensures that the variance is positive

Mutiu A. Oyinlola, Oluwatosin Adeniyi and Olusegun Omisakin
81
Augmented Dickey Fuller, Kwiatkowski, Phillips, Schmidt, and Shin, and Ng-Perron unit root tests were employed. The tests are performed at both the levels and first differences of the stock price indices and exchange rate series. Table 1 and Table 2 report the results of these tests. Table 1: ADF and KPSS Unit roots Tests
ADF
KPSS
Level Differenced Level Differenced
ASI -1.8497 -23.9932*
2.6781 0.5013* EXCH 0.3649 -6.7050*
2.1900 0.1774
Notes: (i) *, **, *** indicate significance at 1%, 5% and 10% levels, respectively. (ii) The 1%, 5% and 10% ADF critical values for the model without time trend are -3.479, -2.883 and -2.578, respectively. (iii) The 1%, 5% and 10% KPSS critical values for the model without time trend are 0.739, 0.463 and 0.347, respectively. (iv)The critical values for the ADF tests are provided by Mackinnon (1996), while critical values for KPSS tests are provided by Kwiatkowski, Phillips, Schmidt, and Shin (1992). Table 2: Ng-Perron Unit root Tests
Notes: (i) *, ** and *** imply statistical significance at the 1%, 5% and 10% level, respectively. (ii) The figure under each unit root test for the variables or their first differences are the unit root test statistics when a constant is used as the deterministic component. (iii) The lag lengths in the Ng-Perron tests were selected using spectral GLS-detrended based on SIC. (iv) The 1%, 5% and 10% Ng-Perron asymptotic critical values for the model without time trend are -13.8, -8.1 and -5.7, respectively for MZa test.
The ADF test statistics show that the null hypothesis of unit root is not rejected for exchange rates and stock prices. However, the first differences of these variables are stationary under the test implying that the variables are integrated of order one, I (1). The mean reversion nature of only the stock prices is confirmed by the KPSS test. The results of the four Ng-Perron unit root tests, however, indicate that both variables are I(1).
MZa MZt MSB MPT
Level 0.02375 0.02745 1.15564 72.8811
ASI Differenced -1150.07* -23.9795* 0.02085* 0.02154*
Level -0.265 -0.14697 0.55461 20.9285
EXCH Differenced -18.8618* -3.07097* 0.16281* 1.29892*

Vol. 12, No.1 Journal of Monetary and Economic Integration
82
Next, the question of whether stock prices and exchange rate are cointegrated is turned to. To address this, the Johansen cointegration approach and the Gregory-Hansen endogenous structural break cointegration test were employed. These are reported in Table 3 and Table 4, respectively, and are discussed in turn. The results of the Johansen tests in Table 3 reveal that there is no long-run equilibrium relationship between stock prices and exchange rates for Nigeria as implied by the trace and Max-Eigen statistics. Having concluded, using the conventional test, that there is no cointegration at the 1% level of significance, the Gregory-Hansen cointegration test was then employed for robustness. Cointegration tests are subject to the assumption that the cointegrating vector does not change with time as indicated in Gregory and Hansen (1996).26 In this study, the suspicion of structural break seems to have been confirmed from the results of the G-H test. Predictably, the results, based on Za and Zt statistics from the Phillips procedure, reveal a structural break date of April 19, 2007. However, the null hypothesis of no cointegration cannot be rejected thus confirming the outcome of the Johansen tests. The structural break date of mid April 2007 coincided with the period when stock prices plumped precipitously from the impact of global financial crisis in early 2007. The association between the variables is further explored through the conduct of correlation and causality testing with non-cointegrated data (VAR Granger causality) suggested by Oxley and Greasley (1998) and Stern (2011). Table 3: Johansen cointegration Tests
Hypothesized No. of CE(s) Trace Statistic
Max-Eigen Statistic
0.05 Critical Value Prob.**
Eigenvalue
None 0.003012 7.81183 7.028722 15.49471 0.4857
At most 1 0.000336 0.783109 0.783109 3.841466 0.3762
Notes: Max-eigenvalue and Trace tests indicate no cointegration at the 0.05 level * denotes rejection of the hypothesis at the 0.05 level **MacKinnon-Haug-Michelis (1999) p-values
26
This problem arises also when testing for unit roots since the power of the ADF test is
considerably lower when a structural break is included in the series, and the test tends to reject
more easily the null hypothesis of a unit root if the break is not accounted for.

Mutiu A. Oyinlola, Oluwatosin Adeniyi and Olusegun Omisakin
83
Table 4: The Gregory-Hansen Cointegration Test
Model 4: Regime Shift Critical Values
Phillips Procedure 0.01 0.05 0.10
Za-stat -28.50 -100.69 -88.47 -82.30
Za-break 4/19/2007
Zt-stat -4.09 -7.31 -6.84 -6.58
Zt-break 4/19/2007 Note: The critical values for the Gregory-Hansen tests are drawn from Gregory and Hansen (1996)
Testing for Correlation and Causality
Investigation on any level of interdependency between stock prices and exchange rate was carried out through correlation test. The coefficients of correlation are presented in Table A2 (in the Appendix). The coefficient of -0.15 suggests a negative and fairly weak but statistically significant correlation between the variables. Thus, we may state that the two series are weakly correlated as the coefficient of correlation depicts some interdependency between the two variables albeit, in reverse direction. However, correlations may be spurious. The correlation needs to be further verified for the direction of influence by the Granger causality test. Appropriate lag length was selected using the Hannan-Quinn information criterion. In the present case, the variables are not co-integrated; therefore, a VAR Granger causality test is applied at the first difference of the variables. The results of the VAR Granger causality test are presented in Table A4. The statistics in the table suggest that a unidirectional causality exists between the variables and runs from stock prices to exchange rate. Put differently, stock prices “Granger cause” the exchange rates in Nigeria. This confirms the conclusion of previous studies [see for example, Nath and Samanta (2003) and Adebiyi, Adenuga, Abeg, and Omanukwue (2010)] in line with the aforementioned theoretical “Portfolio balance approaches”.
Exponentional General Autoregressive Conditional Heteroskedasticity
(EGARCH) framework Prior to proceeding to EGARCH modeling, the White test for Heteroscedasticity was conducted and the null hypothesis of no heteroscedasticity cannot be rejected at the 1% level.27 EGARCH has been chosen from variants of the non-linear GARCH models because it has been found to be the most promising for characterizing the dynamic behavior of stock price indices as it reflects their underlying process in terms of serial correlation, asymmetric volatility clustering and leptokurtic innovation (Alberg, Shalit, and Yosef, 2008).
27
Results output is reported in the appendix.
Vol. 12, No.1 Journal of Monetary and Economic Integration
84
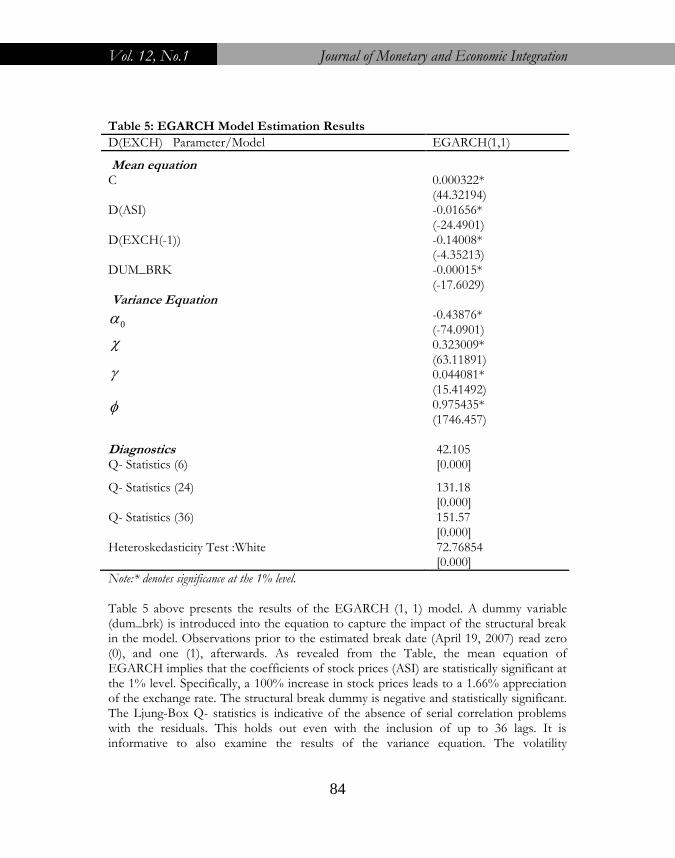
Table 5: EGARCH Model Estimation Results
D(EXCH) Parameter/Model EGARCH(1,1)
Mean equation C 0.000322*
(44.32194) D(ASI) -0.01656*
(-24.4901) D(EXCH(-1)) -0.14008*
(-4.35213) DUM_BRK -0.00015*
(-17.6029) Variance Equation
0 -0.43876* (-74.0901)
0.323009* (63.11891)
0.044081* (15.41492)
0.975435* (1746.457)
Diagnostics Q- Statistics (6)
42.105 [0.000]
Q- Statistics (24) 131.18 [0.000]
Q- Statistics (36) 151.57 [0.000]
Heteroskedasticity Test :White 72.76854 [0.000]
Note:* denotes significance at the 1% level. Table 5 above presents the results of the EGARCH (1, 1) model. A dummy variable (dum_brk) is introduced into the equation to capture the impact of the structural break in the model. Observations prior to the estimated break date (April 19, 2007) read zero (0), and one (1), afterwards. As revealed from the Table, the mean equation of EGARCH implies that the coefficients of stock prices (ASI) are statistically significant at the 1% level. Specifically, a 100% increase in stock prices leads to a 1.66% appreciation of the exchange rate. The structural break dummy is negative and statistically significant. The Ljung-Box Q- statistics is indicative of the absence of serial correlation problems with the residuals. This holds out even with the inclusion of up to 36 lags. It is informative to also examine the results of the variance equation. The volatility

Mutiu A. Oyinlola, Oluwatosin Adeniyi and Olusegun Omisakin
85
persistence term, is positive and statistically significant. The associated coefficient is
close to unity (0.975) suggesting that shocks have permanent effect on exchange rate volatility. In addition, the asymmetry term, is positive and statistically significant
(0.044), contrary to the a priori theoretical negative sign. It therefore suggests that positive stock price shocks result to larger exchange rate volatility than negative shocks.28 In other words, good news that results in stock increase in the market leads to a more volatile stock movement than bad news of equal magnitude. This finding is not consistent to the general leverage effect evidence in the literature.
CONCLUSION
This paper probed the long-run and short-run dynamics between stock prices and exchange rates in Nigeria. For the investigation, the Johansen and Gregory-Hansen cointegration analyses, causality test and Exponentional General Autoregressive Conditional Heteroskedasticity modeling were applied on daily data from January 2, 2002 to August 11, 2011. The following conclusions can be inferred from the analysis. First, evidence showed that there is no long run relationship between stock prices and exchange rate in Nigeria. One plausible explanation is that there may be a channel, not included in the present investigation29, through which the two markets are interrelated. The result also revealed a structural break date of mid April 2007 which coincides with the period when the stock prices plumped precipitously from the impact of global financial crisis in early 2007. Second, the causality test result showed that there is a unidirectional relationship from stock prices to exchange rate. Thus, confirming the outcome of Adebiyi et al (2010). The magnitude of the causal nexus was examined by applying EGARCH modeling and the result showed that a 100% increase in stock prices would lead to a 1.66% appreciation of the exchange rate. Such shocks would have permanent effect on exchange rate volatility. In addition positive stock price shocks would result to larger exchange rate volatility than negative shocks. Although this impact may be modest implying that the linkage may not be substantial, it remains imperative for monetary authorities in Nigeria to take into account the role of stock market development in the conduct of its exchange rate policy. Based on the findings of the study, the study presents recommendation pertinent to the
28
See, for example, Narayan et al, (2008), and Agrawal and Srivastava (2011) for deeper
insight into the interpretation of positive asymmetric term.
29 In line with Phylaktis and Ravazzolo (2005).

Vol. 12, No.1 Journal of Monetary and Economic Integration
86
policy makers and academics. The study recommends that government should reinforce the inclusion of the events in the stock market in the exchange rate stabilization policy. There are a number of possibilities for extension and eventual improvement on the merits of this enquiry. First, it would be insightful to consider the use of the nominal effective exchange rate. This is to capture the notion of the possibility of simultaneous appreciation and/or depreciation against different currencies. Hence, the weight of trade with Nigeria’s major trading partners can be brought to bear on the analysis. Second, the interaction between the exchange rate and the stock market index should be considered in a model augmented by global market indexes that enter the system exogenously as suggested by Ulku and Demirci (2012). The influence of the global market should be considered along with other domestic macroeconomic factors in the model.

Mutiu A. Oyinlola, Oluwatosin Adeniyi and Olusegun Omisakin
87
REFERENCES
Adaramola A.O. (2012), “Exchange Rate Volatility and Stock Market Behaviour: The Nigerian Experience”, European Journal of Business and Management, 4(5)
Adebiyi, M.A.; Adenuga, A.O.; Abeng, M.O. and P.N.Omanukwue, 2010. Oil Price
Shocks, Exchange Rate and Stock Market Behaviour: Empirical Evidence from Nigeria. Unpublished.
Aggarwal, R. (1981) “Exchange Rates and Stock Prices: A Study of thee US Capital
Markets under Floating Exchange Rates,” Akron Business and Economics Review, 7-12
Agrawal and Srivastava (2011) “Stock Market Returns and Exchange Rates Volatility: A
GARCH Application”.Research Journal of International Studies - Issue 20 (September).
Ajakaiye, O. and T. Fakiyesi (2009): Global Financial Crisis Discussion Series. Paper 8:
Nigeria. Overseas Development Institute. London. Ajayi, R., Friedman, J., Mehdian, S., 1998. “On the relationship between stock returns
and exchange rates: tests of Granger causality”. Global Finance Journal 9(2), 241-251.
Ajayi, R., Mougoue, M., (1996), “On the dynamic relationship between stock prices
and Exchange rates”. The Journal of Financial Research 19, 193-207. Alberg D., Shalit H., and R. Yosef (2008). “Estimating stock market volatility using
asymmetric GARCH models”, Applied Financial Economics. Vol.18, pp: 1201-1208.
Aliyu, S.U.R. (2009), “Stock Prices and Exchange Rate Interactions in Nigeria: An Intra-
Global Financial Crisis Maiden Investigation”, Online at http://mpra.ub.uni-muenchen.de/13283/ MPRA Paper No. 13283, posted 09. February 2009 / 13:32
Aydemir, O. and E. Demirhan (2009) The Relationship between Stock Prices and
Exchange Rates Evidence from Turkey. International Research Journal of Finance and Economics Issue 23 (2009)
Bahmani-Oskooee, M. and A. Sohrabian,. (1992), “Stock Prices and the Effective
Exchange Rate of the Dollar”. Applied Economics, vol. 24, 1992, pp. 459–464.

Vol. 12, No.1 Journal of Monetary and Economic Integration
88
Beer, F. and F. Hebein (2008), “An Assessment of the Stock Market and Exchange Rate
Dynamics in Industrialized and Emerging Markets”, International Business & Economics Research Journal, Vol.7, (8).pp. 59-70.
Bolerslev, T(1986). Generalised Autoregressive Conditional Heteroscedasticity. Journal of
Econometrics, 31, 301-27. Charles K.D. Adjasi, Nicholas B. Biekpe, Kofi A. Osei, (2011) "Stock prices and
exchange rate dynamics in selected African countries: A Bivariate Analysis", African Journal of Economic and Management Studies, 2(2), 143 – 164
Chow, E.H., Lee, W.Y., Solt, M.S. 1997. The exchange rate risk exposure of asset
returns. Journal of Business 70, 105-123. Dickey, D. A., & Fuller, W. A. (1981). Likelihood Ratio Statistics for Autoregressive
Time Series with a Unit Root. Econometrica 49, 1057-1072. Engle, R. F (1982). Autoregressive Conditiional Heteroscedasticity with Estimates of the
Variance of United Kingdom Inflation. Econometrica, 50, 987-1007. Franck, P. and Young, A. (1972), “Stock Price Reaction of Multinational Firms to
Exchange Realignments”. Financial Management, vol. 1, 1972, pp. 66–73. Granger, C., Newbold, P., 1974. Spurious regression in econometrics. Journal of
Econometrics 26, 1045-1066. Granger, C.W.J, Huang, B., Yang, C.W., (2000), “A bivariate causality between stock
prices and exchange rates: Evidence form recent Asian flu”. The Quarterly Review of Economics and Finance 40: 337-354.
Gregory, A., Nason, J. and Watt, D. (1996) ‘Testing for structural breaks in cointegrated
relationships’, Journal of Econometrics, 71, 321-341. Gregory, A.W., and Hansen, B.E. (1996) Residual-based tests for cointegration in models
with regime shifts, Journal of Econometrics, 70(1), 99-126. Husam, R. (2012), “Stock prices and Exchange Rates Dynamics: Evidence from
Emerging Markets”, African Journal of Business Management, 6(13), 4728-4733. Johansen, S., 1988. Statistical analysis of cointegration vectors. Journal of Economic
Dynamics and Control 12, 231-254.

Mutiu A. Oyinlola, Oluwatosin Adeniyi and Olusegun Omisakin
89
Johansen, S., Juselius, K., 1990. Maximum likelihood estimation and inference on
cointegration with applications to the demand for money. Oxford Bulletin of Economics and Statistics 52, 169-210.
Jorion, P. (1990): The Exchange Rate Exposure of US Multinationals. Journal of Business,
vol. 63, 1990, pp. 331–345. Kunitomo, N. (1996) Tests of unit roots and cointegration hypotheses in econometric
models, Japanese Economic Review, 47(1), 79-109. Kwiatkowski, D., Phillips, P., Schmidt, and Shin, Y., (1992). “Testing the null
hypothesis of stationarity against the alternative of a unit root”. Journal of Econometrics 54, 159-178.
Mbutor M.O. (2010), “Exchange rate volatility, stock price fluctuations and the lending
behaviour of banks in Nigeria”, Journal of Economics and International Finance, 2(11), 251-260.
Nagayasu, J., (2001), “Currency crisis and contagion: evidence from exchange rate
and sector stock indices of the Philippines and Thailand”. Journal of Asian Economics 12, 529-546.
Narayan, P. K., S. Narayan and A. Prasad (2008), “Understanding the oil price-exchange
rate nexus for the Fiji islands”. Energy Economics. 30(5), 2686-2696. Nath, C. Golaka, and G. P. Samanta (2003). ‘Relationship between Exchange Rate and
Stock Prices in India: An Empirical Analysis.’ Unpublished. Nelson, D. B (1991). “Conditional Heteroscedasticity in asset returns: a new approach”.
Econometrica, 59, 347−370. Ng, S., and Perron, P., (2001). “Lag Length Selection and the Construction of Unit Root
Tests with Good Size and Power”, Econometrica 69, 1519-1554. Okpara G. C. and J.C. Odionye (2012), “Analysis of the Relationship between Exchange
rate and Stock Prices: Evidence from Nigeria”, International Journal of Current Research, 4(3), 175-183.
Osamwonyi, I.O. and E.I. Evbayiro-Osagie (2012), “The Relationship between
Macroeconomic Variables and Stock Market Index in Nigeria”, Journal of Economics, 3(1), 55-63.

Vol. 12, No.1 Journal of Monetary and Economic Integration
90
Oxley L. and D. Greasley (1998), “Vector autoregression, cointegration and causality:
testing for causes of the British industrial revolution”. Applied Economics, vol. 30, pp. 1387- 1397.
Pan, Ming-Shiun, Fok, Robert Chi-Wing and Liu, Y. Angela, (2007). “Dynamic linkages
between exchange rates and stock prices: Evidence from East Asian markets”, International Review of Economics and Finance 16, pp. 503-520.
Phylakits, K., and Ravazzolo, F., 2005. Stock prices and exchange rate dynamics.
Journal of International Money and Finance 24, 1031-1053. Ramasamy, B. and M.Yeung, (2001), “The Causality between Stock Returns and
Exchange Rates: Revisited”. The University of Nottingham in Malaysia-Division of Business and Management Research Paper Series, no. 2001-11.
Sarbapriya R. (2012), “A Bivariate Exploration into Stock Prices and Exchange Rate
Dynamics in Selected Asian Economies”, International Journal of Contemporary Business Studies 3(3), 43-59
Soenen, L. and E. Hennigar, (1988), "An Analysis of Exchange Rates and Stock Prices –
the US Experience between 1980 and 1986," Akron Business and Economic Review, 19, 7-16.
Stavarek, D., (2005), "Stock Prices and Exchange Rates in the EU and the USA:
Evidence on their Mutual Interactions", Czech Journal of Economics and Finance, 55, 3-4
Stern D. I. (2011). From Correlation to Granger Causality Crawford School Research Paper
No 13. Paper presented at the AIJOS Capstone Conference, University of Michigan, Ann Arbor MI. 29-30 September 2011.
Tabak, M. B. (2006). The Dynamic Relationship between Stock Prices and Exchange Rates: evidence for Brazil. International Journal of Theoretical and Applied Finance, 9(8), 1377-1396.
Ulku and Demirci (2012), “Joint Dynamics of Foreign Exchange and Stock Markets in
Emerging Europe”, Journal of International Financial Markets, Institutions & Money, 22(2012) 55-86.
Yu, Q. (1997), “Stock Prices and Exchange Rates: Experience in Leading East Asian
Financial Centres: Tokyo, Hong Kong and Singapore”. Singapore Economic Review, vol. 41, 1997, pp. 47–56.

Mutiu A. Oyinlola, Oluwatosin Adeniyi and Olusegun Omisakin
91
APPENDIX Table A1: Descriptive Statistics of daily Exchange rate and Stock prices
EXCH ASI
Mean 4.882787 10.12673 Median 4.859967 10.09772 Maximum 5.034547 11.10302 Minimum 4.731362 9.227542 Std. Dev. 0.084567 0.450633 Skewness 0.221337 0.174689 Kurtosis 2.025420 2.674545
Jarque-Bera 111.4736 22.18118 Probability 0.000000 0.000015 Sum 11401.31 23645.92 Sum Sq. Dev. 16.69163 473.9650
Observations 2335 2335
Table A2: Descriptive Statistics of daily Exchange rate and Stock prices (Different episodes)
Episode 1 2 3 4 5
ASI EXCH ASI EXCH ASI EXCH ASI EXCH ASI EXCH
Mean 9.62 4.84 10.12 4.87 10.83 4.79 10.12 4.99 10.11 5.01
Median 9.52 4.85 10.08 4.86 10.85 4.76 10.07 4.99 10.13 5.00
Maximum 10.33 4.93 10.47 4.89 11.10 4.84 10.55 5.02 10.24 5.03
Minimum 9.23 4.73 9.94 4.84 10.41 4.76 9.89 4.88 9.93 4.99
Std. Dev. 0.30 0.05 0.14 0.02 0.16 0.04 0.16 0.03 0.08 0.01
Skewness 0.81 -0.60 1.05 -0.05 -0.62 0.39 0.72 -2.35 -0.73 1.12
Kurtosis 2.36 2.54 3.03 1.20 3.04 1.25 2.76 8.50 2.95 3.22
Jarque-Bera 79.21 42.86 111.99 82.63 29.94 70.21 21.72 536.37 35.67 83.98
Probability 0.00 0.00 0.00 0.00 0.00 0.00 0.00 0.00 0.00 0.00
Sum 5965.44 3002.75 6194.35 2979.51 4982.94 2204.20 2489.03 1226.44 4024.12 1993.41
Sum Sq. Dev. 55.12 1.70 11.28 0.24 11.84 0.65 6.11 0.26 2.24 0.04
Observations 620 620 612 612 460 460 246 246 398 398
Notes: If skewness is less than -0.5 or greater than 0.5, the distribution is skewed (Dover, 1979).

Vol. 12, No.1 Journal of Monetary and Economic Integration
92
Figure A1: Time series of Daily Stock Prices (ASI) and exchange rates, 2002-2011
Source: Graphed by author from compiled data.
Table A3: Correlation Test
ASI EXCH
ASI 1.000000
-----
-----
EXCH (Correlation) -0.155218 1.000000
t-Statistic -7.589182 -----
Probability 0.0000 -----
Table A4: Results of the VAR Granger Causality/Block Exogeneity test based on differenced data
Hypothesis Chi-sq Lag Probability
value Decision
EXCH does not Granger cause ASI 1.056376 2 0.5897 Do not reject null
ASI does not Granger cause EXCH 5.729114 2 0.057 Reject null
Climaxed at
66,286 units in
April, 2008.
Plummeted to
19, 814 units in
mid May, 2009
N149/USD