the earth as a work of art - european...
TRANSCRIPT

This issue, produced in cooperation with theHelmholtz Association,combines Art andScience in a series of surprising satelliteimages. A world tour in technicolour…
The Earth as a Work of Art

2 research*eu SATELLITE SPECIAL I SEPTEMBER 2007
The Betsiboka Estuary,Madagascar
The port of Mahajanga on thenorthwest coast of Madagascar isbecoming increasingly siltedbecause the inland forests arebeing cut down. The wood isneeded as fuel, while the clearedforest areas serve as farmland.However, without the protectivefunction of the trees, the heavymonsoon rains wash away the topsoil layer. New paddy fields silt upwith sediment and the soil iswashed into the River Betsibokaand from there into the Bay ofMahajanga, where bush andbrushwood islets form (red andgreen) and obstruct shipping.
Source Top: USGS, EROS Data
Center
Bottom: NASA
Satellite Landsat-7 ETM+
Date 2000
Altitude 705 km
Technique Visible and near-infrared
light, false-colour image
(above) and true-colour
image (below)
The Altun Shan Mountains,China
The image shows the baremountains on the southern edgeof the extremely arid Altun ShanMountains in North China. The green spots in the top right-hand corner indicate thepresence of metalliferous rock. The large ochre-coloured surfaceis a dried-out salt lake. Salinised
soils lie to the left and right in theirbluish colour. The black line thatextends across the image is a road.At the upper edge, the salt lakecan be recognised as a whiteisland. The People’s Republic of China uses such images togeologically map the country.
Source Top: China RSGS
Bottom: NASA
Satellite Landsat-TM
Date 1995/1996
Altitude 705 km
Technique Visible and infrared light

research*eu SATELLITE SPECIAL I SEPTEMBER 2007 3
Ocean Eddies and Currents
The eddies and currents that formin oceans can only be made visibleby satellite images. The colourindicates the presence of tinychlorophyll-containing algae(plankton) – the staple diet formany fish. The higher thetemperature and the chlorophylllevel, the higher the planktonconcentration (red). Areas withfew nutrients (blue) are colder andcontain less food for the fish. The black areas are the mainland(top) or smaller islands (bottomright). Data like this providefisheries with information onwhere rich fishing grounds lie.
Source NASDA
Satellite IKONOS
Date 1998
Altitude 797 km
Technique Ocean colour in the
visible spectrum
combined with various
infrared areas

4 research*eu SATELLITE SPECIAL I SEPTEMBER 2007

research*eu SATELLITE SPECIAL I SEPTEMBER 2007 5
Lake Garda, Italy
Italy’s largest lake – Lake Garda(Lago di Garda) – was formed byglaciers during the last ice age.The peninsula at the southern endof the lake accommodates thetown of Sirmione, Roman ruins,and the famous Scaliger Castle(see left-hand side). Satellites seemore than the human eye: thisimage shows only the lakebecause its surroundings havebeen masked out. Digital imageprocessing has been used toenhance the contrast so thatdifferences in sedimentconcentration are clear, allowingconclusions to be made on thequality of the water.
Source NASA, DLR
Satellite Terra/ASTER
Date 21 July 2001
Altitude 705 km
Technique Thermal image highly
contrast-enhanced

6 research*eu SATELLITE SPECIAL I SEPTEMBER 2007
Bend of the Spree, and CityCentre, Berlin
The face of the German capital haschanged substantially since theIron Curtain fell. From 1961, the Berlin Wall ran in a north-southdirection through the middle ofthis picture, until the people ofEast Germany tore down theGerman-German border inAutumn 1989. A new moderncentre has developed around the
Potsdamer Platz. The distinctiveroof of the Sony Center andBerlin’s new Central Station areclearly recognisable, even from analtitude of 680 km. The Reichstagand Brandenburg Gate stand inthe centre of the image.
Source European Space Imaging,
DLR
Satellite IKONOS
Date 2 September 2005
Altitude 681 km
Technique True-colour image

research*eu SATELLITE SPECIAL I SEPTEMBER 2007 7
Madrid, Spain
Madrid boasts a green heart, the Parque del Retiro, whichappears red in the false-colourimage. Parks and particularly large,open green spaces act like air conditioners for surroundingdistricts during the summer heat.These cool-air islands can be veryeasily observed with satellites andthen taken into account whenplanning new residential areas.
The clearly recognisable roadinfrastructure reveals the variousphases of urban development,from the narrow jumble of oldtown alleys via the linearchequered pattern of later ages through to majorarterial roads and motorways.
Source DLR, NASA
Satellite Terra/ASTER
Altitude 705 km
Technique False-colour image

8 research*eu SATELLITE SPECIAL I SEPTEMBER 2007

research*eu SATELLITE SPECIAL I SEPTEMBER 2007 9
Kaladan Delta, Myanmar/Burma
Enormous mangrove forests growin the Kaladan Delta in Myanmar/Burma – depicted here in darkgreen. The light green areas areswamps, while the dark dotsrepresent cleared islands. The land is often flooded duringthe monsoon because it lies just a few metres above sea level andtherefore is constantly changing.Such images do more than justproduce and update maps. The data aid important decision-making. Where can a school be built so that it is not flooded during the nextmonsoon?
Source DLR
Satellite SIR-C/X-SAR (Space
Shuttle)
Date 1994
Altitude 450 km
Technique Radar (vegetation
coloured green)

10 research*eu SATELLITE SPECIAL I SEPTEMBER 2007

research*eu SATELLITE SPECIAL I SEPTEMBER 2007 11
Escondida: The World’s Largest Mine, Chile
Right in the heart of the AtacamaDesert in northern Chile and at aheight of 3 050 m lies the world’slargest copper, gold and silvermine. This open-cast mineproduces 127 000 tonnes of oreevery day. The image on the rightshows the area as we would see it from a plane with our naked eye.But the mine looks completelydifferent in short-wave infraredlight (colour image). This makes itpossible to identify different kindsof rock. Rocks that contain coppershow up through their greencolour. Mined areas are shown in a reddish-beige hue.
Source NASA
Satellite Terra ASTER
Date 23 April 2000
Altitude 705 km
Technique Short-wave infrared light
contrasted to visible light
with near-infrared light

12 research*eu SATELLITE SPECIAL I SEPTEMBER 2007

research*eu SATELLITE SPECIAL I SEPTEMBER 2007 13
Namib Desert, Namibia
This radar image shows the NamibDesert at Diaz Point near Lüderitz.Only 10 to 20 mm of rainfall peryear are recorded in this region.The violet areas are sand dunesthat extend down to the coast. The orange area is the Atlantic.The narrow band between landand ocean marks the beach. The top right-hand corner showsrocks protruding from the sand.Images like these are used todiscover geological structuresbeneath the desert sand, such assubterranean rivers.
Source NASA
Satellite SIR-C/X-SAR
Date 7 November 1996
Altitude 450 km
Technique Radar

14 research*eu SATELLITE SPECIAL I SEPTEMBER 2007

research*eu SATELLITE SPECIAL I SEPTEMBER 2007 15
Bathymetry of the North Atlantic
Satellite technology is capable ofreconstructing the processes thattake place beneath the oceansurface and decisively shape ourcontinents, as well as the relief of the ocean floor and its history.This image shows the NorthAtlantic with the volcanicallyextremely active Iceland lying on a central-oceanic ridge. Lavapushes to the surface along thesubmarine mountain ridge and indoing so pushes the continentalplates apart. This is how Europeand America began to drift apart120 million years ago, a processthat continued for 80 million years.
Source DLR, GFZ, USGS
Satellite ERS-1 and bathymetric
measurements
Altitude 782 km
Technique Bathymetric model
shown in perspective
Storm Front Lothar/NOAA-14 AVHRR
The dynamics and power of a low-pressure system are clearlyvisible here. Around Christmas1999, storm front Lothar racedacross France, Switzerland andGermany. Around 100 peopledied, more than 100 million treeswere uprooted. Insured damagevalue: some € 3 billion. Satellitetechnology allows ever moreprecise forecasting and socontinually optimizes measures toprotect against weather disasters.Geostationary satellites likeMeteosat or NOAA-14 AVHRR keepa wary eye open for us on theweather on Earth and so provide a basis for early warning systems.
Source DLR
Satellite NOAA-14 AVHRR
Date 25 December 1999
Altitude 833 km
Technique Thermal infrared

16 research*eu SATELLITE SPECIAL I SEPTEMBER 2007

research*eu SATELLITE SPECIAL I SEPTEMBER 2007 17
The “Bull’s Eye” – a Landmark forAstronauts, Mauritania
With a diameter of just under 50 km, the unmistakable Bull’s Eye– actually the “Richat Structure” – is an important landmark forSpace Shuttles. Once they haveflown over it, the astronauts knowthey will soon be landing at CapeCanaveral. Initially, researchersthought the structure was theresult of a meteorite impact.Today, they think it is a plutonite, a magna flow that cooled andsolidified under the earth’s surface.Surface soil has been washedaway by the rain and the hard rocknow protrudes as a plateau.
Source USGS, EROS Data Center
Satellite Landsat-7 ETM+
Date 7 October 2000
Altitude 705 km
Technique The b/w channel
combined with colour
and infrared channels
The Ngorongoro Crater,Tanzania
This image was shot over theSerengeti National Park. The collapsed crater – a caldera –of the Ngorongoro Volcano can beseen in the centre of the picture.The Ngorongoro Game Reservelies in this caldera. The lakes havebeen coloured dark blue, while hills, mountains andexposed rocks are shown inbrown. The dry vegetation of the lower-lying savannah is givena light blue hue. It’s more humid in the crater and so there is alsomore foliage, which is showngreen. Pictures like these are usedby the nature park administratorsto monitor how the vegetation is developing in the park.
Source GAF
Satellite Landsat TM
Date August 1995
Altitude 705 km
Technique Visible spectral range
combined with infrared
channels

18 research*eu SATELLITE SPECIAL I SEPTEMBER 2007
Virtual Panorama – the Alpine Arc, in Perspective
Many different sources, including satellite-basedmeasurements, delivered data for this digital elevationmodel that displays the whole Alpine Arc with consistentquality. Each height gets a colour, ranging from dark green(lowlands) via light green, yellow, ochre, brown through to heights of around 3 000 m shown in dark brown. Heights above 3 000 m or so appear white. Drawn in perspective and artificially lit, the pseudocolouredelevation model becomes more three-dimensional throughthe interplay of light and shadow.
Source DLR, ESA
Satellite ERS-1, ERS-2, SRTM
Date ERS: 1995-1996; SRTM: 2000
Altitude 782 km or approx. 300 km
Technique Computer generated perspective view from
pseudocoloured digital elevations model
Agriculture in Kansas, USA
The image shows meadows andfields. A centre-pivot sprinkler arm up to 400 m long rotates toirrigate the farmland. The coloursindicate how moist the soil is andalso whether cereal or vegetablecrops are being cultivated. Green, irrigated wheat fieldsprobably lie where the infraredlight reflects most (red circles),while brownish circles depictfallow fields or areas where theseeds have not yet sprouted.Green circles are mainly meadowsand pastures. Such images make it possible to estimate theexpected harvest yield for the year.
Source USGS, EROS Data Center
Satellite Landsat-7 ETM+
Date 1 November 2001
Altitude 705 km
Technique Combination of various
spectral bands in the
visible and infrared
spectrum

research*eu SATELLITE SPECIAL I SEPTEMBER 2007 19
Farming in Castilla-La Mancha,Spain
Despite difficult climaticconditions, intensive farming hasdeveloped to the south-west ofAlbacete, in the Spanish provinceof Castilla-La Mancha. The maincrop consists of cereals. Irrigatedfields are seen as circles made by a centre-pivoted irrigation system.The red colour is produced byusing false colours – the moreintensive the red, the healthier the vegetation. At one metre perpixel at ground level, the image’sresolution is extremely high for a satellite picture.
Source European Space Imaging,
DLR
Satellite IKONOS
Altitude 681 km
Technique Near-infrared,
false colour image

20 research*eu SATELLITE SPECIAL I SEPTEMBER 2007

research*eu SATELLITE SPECIAL I SEPTEMBER 2007 21
The Earth at Night
The sleepless planet – oceans oflight wherever heavily built-upareas lie. Yet, brightness does notnecessarily reflect populationdensity. India and China with theirbillions of people are relativelydark. By contrast, the United Statesis wasteful in its use of electriclight. Even sparsely populatedareas are relatively bright.Originally, this kind of earthobservation was used for acompletely different purpose.During the Cold War, the UnitedStates used such imagingmethods to monitor night-timemissile launches.
Source DLR, NASA
Satellite DMSP OLS
Altitude 833 km
Technique Combination of visible
and thermal infrared
light, underlayed with
a world map

22 research*eu SATELLITE SPECIAL I SEPTEMBER 2007
research*eu SATELLITE SPECIAL I SEPTEMBER 2007 23
The Lambert Glacier, Antarctica
The Lambert Glacier in EastAntarctica is the world’s largest. It is more than 400 km long andjust under 50 km wide. An icefallmeasuring 400 m from top tobottom feeds the glacier (upperhalf of the picture). At the coast,the glacier pushes out to the sea.The shelf ice is thus mainly freshwater. The giant icebergs that driftin the polar seas are pieces thathave broken away from suchglaciers. Red tones in the lowerhalf of the image show the cliffsthat protrude from the glacier.
Source USGS, EROS Data Center
Satellite Landsat-7 ETM+
Date 2 December 2000
Altitude 705 km
Technique Visible light
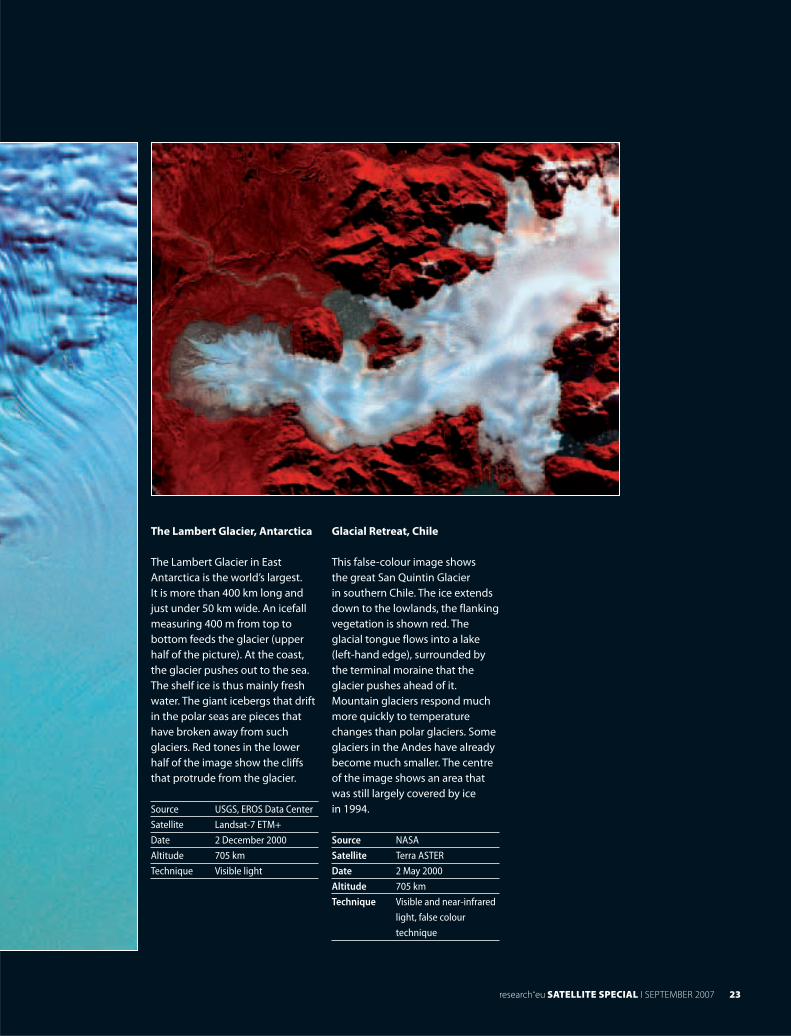
Glacial Retreat, Chile
This false-colour image shows the great San Quintin Glacier in southern Chile. The ice extendsdown to the lowlands, the flankingvegetation is shown red. Theglacial tongue flows into a lake(left-hand edge), surrounded bythe terminal moraine that theglacier pushes ahead of it.Mountain glaciers respond muchmore quickly to temperaturechanges than polar glaciers. Someglaciers in the Andes have alreadybecome much smaller. The centreof the image shows an area thatwas still largely covered by ice in 1994.
Source NASA
Satellite Terra ASTER
Date 2 May 2000
Altitude 705 km
Technique Visible and near-infrared
light, false colour
technique

24 research*eu SATELLITE SPECIAL I SEPTEMBER 2007

research*eu SATELLITE SPECIAL I SEPTEMBER 2007 25
Clear View across Europe
The clouds were removed from a satellite image acquired byEurope’s Meteosat andsuperimposed on to a picture ofEurope without clouds. This produced a very realisticcolour impression that could nothave been achieved in such detailwith a “standard” Meteosat image.Meteosat data play a key role in weather forecasting and long-term climate andatmosphere observation. The satellite measures thetemperature of the earth surfaceand the amount of water vapourin the atmosphere and transmitsthe data once every 15 minutes.
Source EUMETSAT,
DLR/Planetary Visions
Satellite METEOSAT/MODIS
Date June 2005
Altitude 36 000 km and 705 km
Technique Image composed of
various sets of satellite
data

26 research*eu SATELLITE SPECIAL I SEPTEMBER 2007
The Great Salt Desert: Dasht-e Kavir, Iran
The Dasht-e Kavir lies to the south-east of Tehran and is, withan area of 55 000 km2, one ofEarth’s largest salt deserts. The wind has blown away thesand and exposed the ground rock made up of various layers ofdeposited clay – shown brownhere. The blue shades reveal saltlakes or swamps with a salt crust.The concentric circles show thatthe water evaporated very slowlyhere after earlier floods. Imageslike these are used to producesatellite maps of previouslyunsurveyed regions.
Source USGS, EROS Data Center
Satellite Landsat-7 ETM+
Date 24 October 2000
Altitude 705 km
Technique Visible light (red and
green) and infrared
Traces of War in the Persian Gulf,Iraq/Iran
Traces of military conflicts –viewed from space. This image was shot long after the Iraq-Iranwar (1980 to 1988). The RiverSchatt-el-Arab runs along the left-hand side and forms theborder between Iraq and Iran.Fortified walls and dams line upalong the border in the top right-hand corner. The Iraqis builtthese ramparts in the swamplandsfor their artillery. At the same time,they flooded the resulting ditchesfor further military defence.Images like these were usefulwhen reestablishing farming inthe war zone.
Source USGS, EROS Data Center
Satellite Landsat-7 ETM+
Date 24 January 2001
Altitude 705 km
Technique A b/w photo combined
with colour and infrared
channels

research*eu SATELLITE SPECIAL I SEPTEMBER 2007 27
Klyuchevskaya Sopka, Russia
On the sparsely populated RussianKamchatka peninsula stands oneof the world’s most activevolcanoes. Klyuchevskaya Sopka is one of around 500 activevolcanoes in the Pacific Ring of Fire. The Pacific and Eurasianplates collide under Kamchatka.The picture was taken after theeruptions of 30 September 1994.Red areas represent solidified lava. The mud flows of meltedsnow and volcanic ash appeargreenish-blue. These couldthreaten fields and settlementsdown in the valley.
Source NASA
Satellite SIR-C/X-SAR
(Space Shuttle)
Date 5 octobre 1994
Altitude 450 km
Technique Radar, 4 750 m
The Tien Shan Mountains, China
This part of northwest China issparsely populated and wassurveyed in a special missionduring which two satellites flewexactly the same route in tandemexactly 40 minutes apart. This dualsurvey at such a short intervalproduced very precise elevationdata on the region. The colourscorrespond with those ofconventional maps: brown for hillsand mountains, green forlowlands. The three-dimensionaleffect is achieved by additionallyintegrating shadows. Precisionmaps or elevation models of suchremote areas are hardlyconceivable without satellitetechnology.
Source DLR, ESA
Satellite ERS-1 und -2
Date 1999
Altitude 785 km
Technique Radar

28 research*eu SATELLITE SPECIAL I SEPTEMBER 2007

research*eu SATELLITE SPECIAL I SEPTEMBER 2007 29
Farming on the Edge of theDesert, Saudi Arabia
Arid regions like this on the edgeof the Saudi Arabian Desert canonly be farmed with intensiveirrigation. The two dark circles onthe left-hand edge are irrigatedfields. Groundwater pumped tothe surface is distributed viairrigation systems. The areacoloured in shades of red andorange is a dune landscape. On the right, the mountain ran-ges with their exposed rock havebeen coloured blue. Such imageshelp geologists search forgroundwater in arid zones. They believe that they might beable to find water beneath long-dried-out river beds (wadis) thathave meanwhile filled with sand.
Source DLR
Satellite MOMS
Date December 1996
Altitude 700 km
Technique Visible and infrared light

30 research*eu SATELLITE SPECIAL I SEPTEMBER 2007

research*eu SATELLITE SPECIAL I SEPTEMBER 2007 31
Mayon, Philippines
Mayon is the most active volcanoon the Philippines – it has eruptedno less than 47 times since 1616.The image was shot from a radarsatellite and shows characteristiccoloured stripes. These correspondwith the elevation lines on mapsand accurately depict the contourlines to within just a few metres.The closer the coloured lines, the steeper the mountain incline.Any changes in height are a suresign of activity within the volcano.
Source ACRoRS, Bangkok
Thailand, ESA
Satellite ERS-1
Altitude 785 km
Technique Radar interferometry

© Helmholtz Association