the ecology of burrowing owls in the agroecosystem of the imperial valley… · 2017-08-31 ·...
TRANSCRIPT

tudie in Avian Biol gy No. 27: L20- L35, 2004.
THE ECOLOGY OF BURROWING OWLS IN THE AGROECOSYSTEM OF THE IMPERIAL VALLEY, CALIFORNIA
DA IEL K. Ro E BERG D KA THERl L. HALEY
Ab tract. Burrowing Owl (Athene cunicularia) are common in some agroeco y tem , y t their ecology in the e en ironment i poorly known. To addres thi , we c llected dem graphic and pa e-u e data on the Burrowing wl in the Imp rial Valley of outhea tern alifornia during th breeding
a on, 1997-2000. Within our 11.7 km 2 tudy area, wee timated a very high den. ity of Burrowing Owl (8.3 pair /km 2) which remained relatively on tant during the study. Owl nested pred minately on the edg . of constructed drain and canal that bordered agricultural field . Clutch ize ranged from 4- 8 (mean = 6.7) egg /clutch and varied little among year . Productivity averaged 2.5 young/nest and varied con iderably among individuals and year . Adult annual ·urvi al rate for male. (0.65) and females (0.62) were similar or higher than reported for other Burrowing Owl population . We ob erved high nest- ite fidelity for adults, with 85% remaining within 400 m of the previous ear's ne t. Female mo ed greater di tance than male · between breeding ea on : di tances w re greater ~ r o 1 who e net failed. Few juv nil (-0 of 124, 16%) w re ub equently ob erved as adult. Thi , together with a lack of a declining di persal function. uggested juvenil frequently emigrated from the tudy area. Ba ed on e ·timate of n cturnal mo ement of males, we e timated low s lection f r the type of crop in which they foraged. They foraged primarily (> 80%) within 600 m of their ne t, but long-di tanc movement (2-3 km) often re ulted in large estimates (I I 3.7 ± 30.4 ha) of the area traver ed (minimum convex polygon method) and the area used (45.3 ± I 8.2 ha; fixed k rnel method). Becau e f th high densiti , of owls, h me range overlapp d con iderably. Our . timate of demographic parameter and the pace-u ·e pr perties of Burrowing Owl contra t with tho. e rep rted from non-agricultural area . ur results ugge t agricultural area. can pro ide high quality habitat if burrow · ar a ailable, which in our ·tudy area wa determined by the farmers tolerance of b rrow along th canals and drain b rd ring their pr p rty.
Key Word : agroecosystems: Athene cunicularia; Burrowing wl; alifornia: di. p r ·al: imp rial alley ; reproducti e rate ; ·urvival rate .
LA E OLOGf D T COLOTE LLAN RO RIAL, CALIFORNIA
N LOS AGRO I T MAS D L V LL TMPE-
Re 111ne11. L s Tecol te · Llaner · (Athene cuni ularia) on comunes en alguno agro cosi . temas. no o stante su ecologfa en est s ambient s s p co conocida. on cste prop6sito, durante las temporadas reprodu ·ti a de 1997- 2000 se colect6 informa i6n 5obre la d mograffa y el uso espa ial def Tecolote Llaner en el Vall imperial del urest cJ alifornia. Dentro del area d studio (I 1.7 km2 ) se estim ' u a den idad muy al ta de tecolote (8 .3 pareja. /km2) la cual pcrmanec16 relativament constante durante el e tudio. tee lotes anidaron predominant meme n los bon.les de los drenajes y canales q e rocJean a la par las. l tamai'io prom diode las nidada. fu de 4- huevo. por nido (media = 6.7) y vari6 p co entr ai'ios. El pr media n la productividad lue de 2.5 juveniles/nid > y vario c nsid rabl ment entre individuo. aiios . Las ta ·a anual s d supcrvi encia en machos adultos ( .65) y hembra. adulta (0.62) fuer n similares mas altas qu las reportadas para otras poblacione d Tecol te Llanero . e obs r tambien que lo. adultos muestran una alta fidelidad al sitio de a idaci6n, c n el 5% p rrnaneciendo dentr d una di tancia de 400 m del nido utiliLad el ai'io , terior. Las hembra .-e mo ier n a may res di . tan ia que lo machos entre temp radas reprodu -ti a ·, las di tan ias fu ron mayore para aquell tecolote cuyos nidos fraca aron. Pocos ju enil s C~O de I 24, 163 ) fueron ob. er ado po teriorm nte como adultos. . to, jun to con la ausen ia de una funci6n de di p r i6n di minuida, ·u0 iri6 qu los juvenile emigraron def area de estudi . on base e e timacione d movimi nto nocturne de lo. tecolote mach s. s e ·tim6 que hubo poca selecci6n por el tipo de co echa en la cual se alimentar n. llos forrajearon principalmente (> 80%) dentro de un distancia de 600 m de u nido, aunqu lo. m vimiento a mayores distancia (2-3 km) a menudo resultaron en stimacione. mayore (I l .7 ± 0.4 ha) del area atravesada (met d del p lfg no mfnimo convex ) y del area utilizada (45.3 ::!: l 8.2 ha. metodo fijo k rnel). Debido a la alta den. idad de tee lote , la arae utilizada e tra. laparon con iderablem nte. Nuestras e timacion s de los par.imetro demograticos de la propiedad . del u ·o del e pacio de I Tee lote Llanero contra tan c n aquella. reportadas para area no agrfcola . Nue tro re ultad u0 ieren que la area agrfcola
ueden proper i nar un habitat de alta calidad . i hay madriguera. di . ponible , lo cual n nuestra area e. tudio e tuvo determinado por la t lerancia de lo agri ultore a la presencia de la madrigu ra
a lo largo de I canale y drenajesque rodean a u. propiedad .
Palabras clave : Agroeco i tema ; Athene cunicularia; California; di persi 'n; tasa reproductiva; ta a supervivencia; Te olote Llanero; Valle Imperial.
120

CO LOGY B RROWING OWL -Rosenberg and Haley 121
The Burrowing Owl (Athene cunicularia) i a burr w-ne. ting owl characteri ·tic of grassland and desert: throughout we t rn North America. Florida, and entral and South America (Haug et al. 1993). The We tern Burrowing Owl (A. c. hypugaea) wa once wide pread and fairly common ov r w tern North merica. Population declines led to listing of the Burrowing Owl as endangered, threatened, or a pecie of concern in Canada, Mexico, and in a number of U.S. tate (James and E pie 1997). Decline likely
reflect eradication or control of fo orial mammal ' , inten ive pe ticide u e, and conver ion of gra land to agriculture and re idential or commercial development (Haug et al. 1993 Trulio 1997, De mond et al. 2000, G rvai et al. 2000).
California has one of the large. t populations of both re ident and wintering Burrowing Owl (Jame ' and Ethier 1989). Particularly high number and den ities occur in the Imperial Valley, located in outhea tern California (Coulombe 1971; De ante et al. this volume). Historically, Burrowing Owl were present within the Imperial Vall y in low den iti . imilar to tho e in undi turbed habitat of the urrounding Colorado (Sonoran) de. ert (DeSante et al. thi. 1 olume). Inten. ificati n of agriculture in the 1900 (Cleming. I 996) nabled Burrowing Owl population. of the YaJley to increa. c gr ally. Increa ing development and changing pattern of water conveyanc in outhern alifornia (e.g., Cleming 1996) may have major impact on the di -tribution and abundanc f Burrowing Owl in th r gion.
D spite th large populari n )f Burrowing Owls in th Imperial Valley, th r hav been f w in e. tigations f their ec I gy. oulomb ( 197 l) and D ant t al. (this 110/ume) docum nted th concentration of Burrowing OwL along th vari u. watercourse-.. Although th ir re earch pr wided a fram w rk for understanding thes is ue , a quantitati e approach to the d m graphy and pace-u. c l gy of thi . pecies is needed to develop ·ci ntifically credibl manag ment strategie . ~ address thi need, we initiated tudie of
the wl' d mography and pace-u. e pattern. within the agroecosy tern of the Imperial Valley. In thi pap r, we examin ( 1) pattern of di tribution of Burrowing Owls; (2) rate f and factor affecting survival, reproduction, and between-year m vement; and (3) patt rn of paceu e of indi iduals. We explor factor that affect individual · and how thi may ultimately affect the dynamic · of the population.
STUDY AR A
The study area wa at the southern rim f the Salton Sea, 40 km north of El Centro, alifornia (Fig. I). We
divided the study area into several subarea . We captured and marked Burrowing wl only in the [nten-i e tudy Area (I A), which totaled l 175 ha (Fig. I).
The second subarea ( rea B; ig. I) extended 0.8 km beyond the lSA. Together, these two area repre ented the Demography tudy rea (D A). The third ubarea ( rea ; Fig. l) extended 0.8 km ( 1999) or 1.6 km (2000) b yond the DSA. Most (8 l % ) of the ISA con-i ted of privately owned agricultural field . The re
maind r encompa ed a . egm nt of the Sonny Bono Salton Sea National Wildlife Refuge (hereafter, Refuge; ig. l ). The Refuge maintain d a . et of 35 ne t bo e situated between roads and fields. De ign of nest boxes were imilar to those described by Trulio ( 1995).
The tudy area wa. characterized by agricultural field . framed by a y tern of concrete water-delivery ditche. and canal , and earthen drains. Drain wer deep (up t 8-9 m). dredged waterways maintained by the Imp rial Irrigation District. Within thi agricultural matrix Burrowing Owl ne ted almo t entirely within or along drain , ditches, and canal . Field were intensively managed for year-round production of vegetables and cattle feed. Primary crops were Sudan gra . ( orghum bi color), Bermuda gras · ( Cynodo11 dacty/011), alfalfa (Medicago sativa). onions (A/Lium cepa) , and corn (Zea may. ).
M TH D
DE SJTY STIM TIO
To . timate the density of Burrowing Owl we fir t estimated th probability of detecting ne. ting pairs of Bu.-r wing Owl within the I ' . W divided th tudy area into approximat ly 20 00-m block , and ur-
eyed each alternating block out. ide of the Refuge (N = 7) from 14 to 30 April 1998. We surveyed all roads and watercour. that b rd r d fi Ids three time. , t o by ehicle and one on foot. We ·onducted ·ur ey: at
ehicle speeds :5 I 0 km/hr ith two obs rver during the morning (30 min b fore ·unrise to 4 hrs after) and evening (3 hrs before sunset until suns t) when wind :p eds wer < 15 km/hr. W' us d hath behavioral and ph _ sical evidence f nestin' to determine if a pair occupied a given burrow e .g., Millsap and Bear 1997). To stimat the pr bability ot detecting nesting owls, we applied the removal model f Zippin ( 1958), which estimates population ·i1e a. a fun ti n of the number of new individual , or n sts as in this study, that are
ncount r d on each survey ( tis t al. 1978:2 ).
DIF~T
W estimated the di t compos1t1on of Burrowing wb from regurgitated pellets. We collected p llet~
from ranuomly elected nests (2000) and from nest boxe within the Refuge ( 1998 and 2000) All pellet<; fr m a given ne t and year were treated a a . ingl ample. We estimat d the relative fr~quency of conumption by recording the oc urrence of each taxo
nomic order. Because earlier ob. er ation indicated that the frequer.cy of rodent. in the diet may trongly inOuen e productivity (D. Ro!'.>enberg et al., unpubl. data), we computed an index of rodent con umption.
keletal remains were counted to e timate the minimum number of rodent con urned. The index was computed for each ample a: the rati of the minimum numb r of r dent consumed/number of pellet . We
122 STUDIES IN A VIAN BIOLOGY NO. 27
N
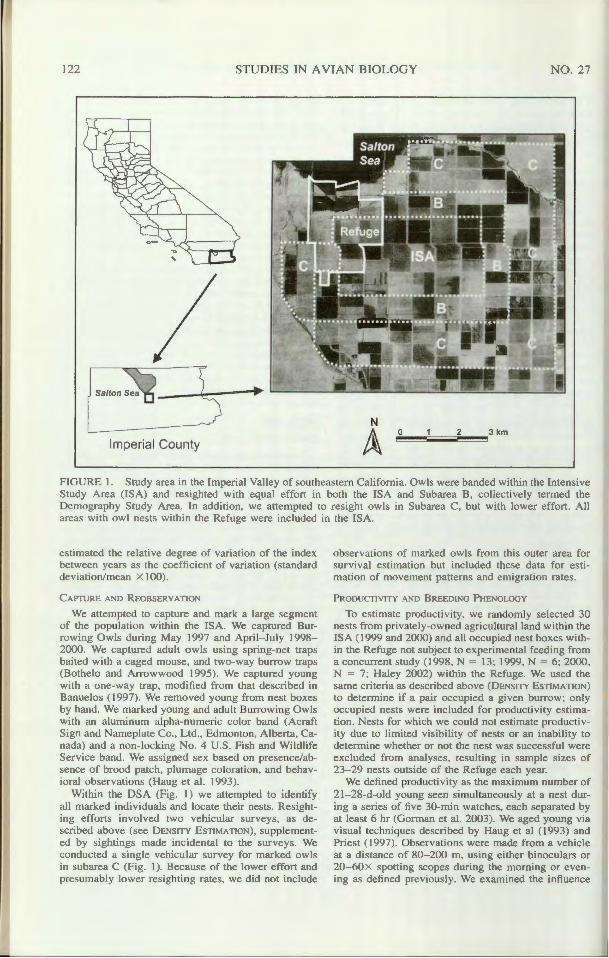
Imperial County A RE I. Study ar a in th Imperial YalI y f s uthea ·tern California. Owls were banded within the lnten ive
tudy Area (ISA) and resighted with equal effort in both the ISA and Subarea B, collectively t rmed the emography Study Area. ln addition, we attempted to re ight owl in ubarea , but with lower effc rt. All
area with owl ne L within the Refuge wer includ d in the ISA.
estimated the relative degr e of variati n of the index b tween years a. the coefficient f variation ( tandard deviati n/mean X I 00) .
APT R D R EOB "RV no We attempted to capture and mark a large s gment
of the population within the IS . We captured Burr wing Owl during May 1997 and April- July 1998-2000. We captured adult wls u. ing pring-n t trap. baited with a caged mou. and two-wa burr trap (Bothe! and Arr wwood 1995) . We captured young with a one-way trap modified from that de cribed in Banuelo ( 1997). W rem ved young from n t boxes by hand. We marked young and adult Burrowing Owl with an aluminum alpha-numeric color band (Acraft
ign and Nameplate o., td., dmonton, Alb rta, anada) and a non-locking o. 4 U . . Fish and Wildlife
ervice band. We a igned ex ba ed on pre ence/abence of brood pat h, plumage coloration and behav
ioral ob er ation (Haug et al. 1993). Within the DSA (Fig. l) we attempted to identify
all marked individual · and I cate their ne t . Re ighting efforts involved two vehicular urveys, as de-cribed above ( ee DEN ITY ESTIMATLO ). upplem nt
ed by ighting made incidental to the ur ey . We conducted a single vehi ular urvey for marked owl in ubarea C (Fig. I). Be au e of the lower effort and pre. umably lower re ighting rate , we did not include
observati n. f marked wt · from this uter ar a for urvival e ·timation but includ d the e data for esti
mation of movement pattern and emigration rates.
PROD CTIVITY D BRE DI G PHE OLOGY
To e timate pr ductivity, we random ly s lccted 0 n t · from pri ately-owned agricultural land within the T A (1999 and 2000) and all occupied net bo es within the Refuge not subj ct to xp rimental feeding fr m a concurrent ·tudy (I 98, N = 13; J 999, N = 6; -000, N = 7: Haley 2002) within the Refug . W u d the am criteria a de ·cribed ab ve (DE SITY TIMATIO )
to determine if a pair occupied a giv n burr w; only occupied ne t were in luded for pr ducti ity e ·timation. Ne c for which we could not e timate produ tivity due to limited vi ibility f ne t or an inabi lity to determine wh cher or not the nest wa uccessful were excluded from ana ly e , re ulting in ample ·ize f 23-29 ne t outside of the Refuge each year.
We defined pr ductivity a the maximum number f 21-28-d-old young e n imultaneou ly at a ne t during a erie of fi e 0-min wacche . each eparated by at least 6 hr (Gorman et al. 2003). We aged young via visual technique de ·cribed by Haug et al ( 199 ) and Prie t ( 1997). Ob ervati n were made from a vehic le at a di tance of 80- 200 m, u ing either binocular or 20-60 X p tting scope during the mornincr or evening a defined previously. We e amined th influen e

ECOLOGY 0 B RROWING OWLS-Rosenberg and Haley 123
of diet (rodent inde ), intraspecific competiti n, and year on productivity from the randomly selected nests in 1999 and 2000. We u ed the minimum nearestneighbor distance (log-transformed) and number of nests within 600 m (radius of foraging concentration: , ee R SULT ) a. an index of intraspecific competi tion. We used a generalized linear model with a negative binomial response probability disu-ibution and a log-link function ( AS In. titute 1993). We cho e this regressi n mod I because count data, such as the number of young, often conforms to a negative binomial distribution, and because this model, when the data are o distributed, pr vides a more powerful approach with
fewer as umptions than other methods (White and Bennetts J 996).
Wee timated Burrowing Owl reproductive biology by examining n t boxe within the Refuge and the Refuge headquarters, approximately I 0 km ast of the ISA. In 1999 and 2000, we evaluated date of fir t laying, clutch completion, and hatching, and measured clutch ize and ne. t uccess. We monitored all nest boxe withe idcnce of owl use weekly until eggs were een. During each visit, we u ed an infrared probe
(Sandpiper Technologies, Manteca, C ) to bserve nest contents. Once eggs were seen, we visited nest'> at 3 to 4-d inter al to estimate clutch completion date . A clutch wa. defin d as complete when th number of eggs did not increase by more than one egg/ 72 hr (Haley 2002). We estimated hat h success a. the per ent f eggs that hatched/nest.
BETWEEN-YLAR Mo EMENTS
To estimate movement patterns, w used data from owls marked in 1998- 1999 and resiglited in 1999-2000. We estimated mo ements of b th juveniles and adults. However, we e aluated mo ement function'> and factors ass ciat d with 1110 cments only for adults because we like! undere timatcd movement rates for juveniles (see R ~ LT ).
We did not attempt to di ff r •ntiat • between adults und rgoing br eding disper al (<.,cnsu r em>vood 1980) and tho"e moving \ di..,tance from th 'ir ne t the previous year. Rather, we simply modeled distances mov d between years under the notion that, ba. ed on movement data alone, there is no exact distance that can be consider d fundamentally different than any other. We compared two functi( ns, a h<l/ard rate and a n gativ xponential. The ha1ard rate model has propertie similar to those of the exponential but al low. for a "sh ulder" (i.e .. a distance interval at which the probability t mo e remains constant) near 7ero distanc . We xplored the two functional forms because based on theory, a decreasing probability of movement as distance increa should exi'>t and there were . ampling and biological reasons (e.g., Olson and Van Horne 1998) to e pect a ·houlder near zero distan e. In . uch cas s, the hazard-rate function is often u eful (e.g., Buckland et al. 1993). Th hazard-rate function we u. ed wa of Lhe form Pr( ) = I - exp ( - [x/rr] h) and the negative ponential function was ex pres, ed a. Pr{x) = exp - xtA .. ) (Buckland et al. 1993). To de. cribe the probability density function, we re caled the function by c, where c was the alue or the integration of the function evaluated from zero to the furthe. t distance an owl wa., obser cd Lo move
b tween years . We selected the most appropriate run·tion with Akaike's Information riterion, adjusted for small -sample si7e (Al c; Burnham and Anderson 1998) for adults with sexes and years pooled, and then used Al c to compare modeb fit as x, year, or se -and year-specific.
The si1:e and geom try of the area in which movements can be detected may result in the appearance of underlying mo ement functions that fit model such as the exp nential (Porter and Dooley 1993) or hazardrate. We evaluated this by recreating a set of mo ements with a uniform probability for which distances from zero to the maximum movement di tance we observed (3065 m) all had equal probabilities of occurring. We a.·signed each owl located in 1998 and relocated in 1999 with a new location ~ r 1999 based on a random direction of movement and a random distance that followed a uniform distribution. Only those individuals that would ha e been within the D A (and thus detected) were considered relocated. We fit these data to the same function that was selected for the ob'>er ed distribution of movements. We graphically approximated the point at which the probability of moving de lined from the expected uniform pattern. Similar dispersal patterns between the simulated and the ob. ened distances would sugge. t that observed mo ement pattern were affected by the size and geometr or the study area.
We de eloped ten a priori modt Is to explore fact 1rs that may affect the distan ·e adults moved between years. We e amin d each m d I with multiple regre .. -'>ion and used A!Cc as a basis for model sele Lion. The response ariable was the log-transformed distance an adult owl moved between years and c planatory factors rncluded a combination of year. distance to the nearest n st. and whether or not the owl' mate wa. still present on the stud area. Th simpl st mod I consiuered was a no-effect mod I in which only an intercept term (represenllng average distance mo ed) was e:timatcd. For tho1-t' individuals for which we estimated producti it and m wem nt, we included a., a parameter in the model "" h thcr or n t their nest wa., successful 111 the previous year. We compared n111e a priori models for this smaller data set. In both set1". of an<!lyscs, we used data only from individuals that were '>CCn in two successi e year" and for whi h be th member'-. of the pair were initially banded.
R IVA!
We used mark-recapture analysis to estimate apparent (i .e., we assum d no emigration fr m tudy area occurred) '-.urvival rates of Burrowing Owl.. first captured a'> adults. We eluded individuals first aptured as young because we determined s f only 17 of 242 marked ye ung, and these were unlikely representative of the population. We fitted modified Jolly-Seber-Cormack models to the mark-recapture data u ing Program MARK (White and Burnham 1999). We developed ten £1 priori m dels to estimate survival rates. We used Al c weights w) to compar the relative likelihood or each model. We used the. e weight toe timate an average survi al rate from all models considered . Model averaging allows inference to be ba ed on all models considered, thus increasing the inferential validity over that of a single model approach (Burnham

124 STUDIES IN A VIAN BIOLOGY NO. 27
and nder. on 199 ). We a. sessed goodn s- f-nt f r the global model u ing 10 0 boot trap imulation t evaluate the likelihood of th ob erved d ian e (White and Burnham 1999).
pparent ur i al rates reAect both mortality and emigration; however, we ere intere ted in e timating "true" ( en u Franklin et al. 1996) urvival rates. To allow e timation of sur ival, we e timated emigration rate. of adult Burr wing wl from ob erved mo -ment of individual between 1998-1999. We th n e -timated urvival a
s = cl> + £ where S, cl>. and E are the e timated probabilitie f annual urvival, apparent survival, and emigrati n of individual from the D , re pecti ely (Burnham et al. 1996). To implify e. timation, we a urned owls emigrated ju t before ne ting and thu experienc d no mortality between emigration and the time of re ighting. Becau e the probability of emigration i a function of the location of an individual from the boundary of a tudy area (e.g., Barrowcl ugh 1978) we randomized ob erved di tances among owl and randomly elected an angle of movement to e timate a new I cation. We did thi separately for male and female. becau e of the differen e. in ob erved movement pattern ( ee RESULTS). We c timated the probabilily of emigrati n a :
where 11 * wa the number f adults withe tirnated lo-ations outside of the study area, n wa the numb r of
marked owl in year t that sur ived and were r ~l cated in year t + 1, and R wa1'. the number of replicatton& of th rand m proce ·s f re reating mo ement patterns. We used R - IOOO replication and used the m an of E as our best stimat f emie,ration. This meth d of e timating cmigrati n a sumcs that the observed distances renect th tru di tribution f dbtances moved, such that individuals that moved outside
f the c;;tudy area and wcr not detected had m cment patterns imilar to tho.' ' owls that were d tectcd. Thi . as. umption wa upport d b the rapidly declining di -per al function (&ee R I..: ). similar patt rns of mo ment for wls located in the center of the stud area a for th e lo ated throughout (D. Ro& nb rg, unpubl. data), and a relati ly uniform en ir nment within the study area (homogeneity a sumpti n or Z ng and Brown 1987 .
PA E
In May 1998, we radio-tracked ix male owls to gain quantitative in ight int the owl ' pace-u e patterns. We u ed necklace-de ign radio tran mitter (4.5 g) with a 20-cm antennae (H lohil Sy tern , Ltd., arp,
ntario, Canada . We aptured owl that ne ted within a 0.4 X 0.8 km area along the edge of the road and fields within the Refuge. We attempted lo lra k wl each night from 2000 t 0400 hr from 5 June-13 July. The receiving antenna a. embly con isted of two Hconngured antennae (Telonic , Me a, AZ) , eparated by a er boom and connected to a null combiner, mounted to a 2-m rotating tower with a fixed compa . . The t wer was ecured in the bed of a truck, making th
ant nnae height appro imat ly 3 m abo e ground, following meth d de. cribed in Gervai , et al. (2003).
We e tablish d a grid y tern of tations at approximately 400 m interval to obtain biangulation data. Thi allowed a formal . ear h method to negate the p tential bias of ob erver returning to kn wn ·ite f occurrence, . uch a nest (Ro enberg and McKelvey 1999). We attempted to obtain location of a giv n owl every 15 min. Only location computed from timates of the angle of the owl from two tation within 5 min were included in analy e . We omitted all ob ervation that led to lo ati ns greater than l km from the telemetry tation b cau e of their greater expected error (Gervai et al. 2003).
Wee timated horn range to estimat the area u ed (kernel method ) and the area traver ed (minimum con ex polygon, M P). We u ed a fixed kernel e timator with lea t quare cro validati n (L V) and al o an adaptive kernel to e timate area used (Worton 1989). To e timate home range ize we used pr gram KERNELHR (fixed kernel; Seaman et al. 1998), HomeRanger (adaptive kernel; Hovey 1999), and Telem (MCP; K. McK Ivey, per . comm.).
We evaluated factor that potentially affected the owl ' likelihood f u e. We e aluated di tance of owl location to field edg , di ranee to nest. and within each field the rep typ , dominant crop height, and percent bare ground. Th data tructure consi ted of a sample of cell. (30-m 2 pixel ) in which the individual wa located by radio telemetry and a . ample of randomly elected cells (De ign III of Manly et al. 1993). Random cells were sampled from within a cin.:l with a radiu equal to the maximum di tance an individual wa located from its nest (Ro enberg and McKelvey 1999). The binary response variable wa coded I if an individual was I cated in a particular cell, 0 if random. We u ed logistic regressi n to e timate selection a. th odd:-. ratio or use (Hosmer and Lemeshow 1989:40), Proc L gisti ( A lnstitut 1994) to obtain pararnet r stimates, and 1 c weights t evaluate th r hti e
likelih od of a given model a being the b . t am ng those we consid red (Burnham and nderson 1998).
We de elop d sc en a priori mod I. to estimate habitat sel tion. We evaluated di tan e t the n st a., either a I g-functi n r a 3rd-order po lyn mial. We categori?ed crops using two pooling regirn s based n d nsity of eg tation: ( 1) crop with cl . cd canopy . tructure during the . tudy period (hay, heat [Triticwn ae tivwn], udan grass, Bermuda grass, alfalfa, and
orn) or an p n can py structure (n crops, nion , and cotton) and (2) . imply wh ther or not . tanding
rop exi ted. Ith ugh cotton becomes den e near maturity, it wa. relatively open during the tudy. F r ea h field, we e timat d average crop height and p rcent of bare gr und during the mid-p int of the pa eu e tudy. W ubj cti ely pooled crop types into ' imple cla e that we exp cted would inAuenc wl foraging behavior t a commodate the mall number of observation. /owl and the large number of different crop type . We expected a negative relati n hip of foraging with incr asing d n ity of egetation, and ba d on central plac foraging behavior of th owls, a trong d crea e of u e with di ·tance from the ne t. Alth ugh w were interested in investigating the . election for edge habitat, we were unable to do so be ause of the

ECOLO Y 0 BURROWING WLS-Rosenberg and Haley 125
TABL~ I. r~ RE T El llHC R DISTA ES (M) 01
B RROWI G \.\L EST WITlll 11 IE I Tr. SIVc STUDY
ARcA, [MP RI L VALLEY, C , 1998-2000
Range Mean \I 1cd1an
199 13-760 125.4 I 1.2 98.6 1999 8-818 149.1 15.2 IOI.I 2000 7-806 165.9 15.9 121.5
confounding effect of di lance from the ne. t given all nests were I cated in edge habitat.
RE LT
NET DE SITY D DI TRIS TlO
Ba ed on the number of new n ·ts found in the thr e urvey (37, 8, 0 nest ), we e, timated a 0.85/ urvey detection probability under the Zippin model. Thi very high detection/ ur ey re ult in counting mo t f the Burrowing OwL within th ,' tudy area from two (98%) or three (99.9~) sur ey . Thu , our ·ti mates f den ity based n ount hould ha negligibl bia . .
Den ity of n ting pairs of Burrowing OwL· remain d fairly con tant during the three years of the ur y within the ISA. In ach year, w local J appr imately l 00 nestino pairs ( 199 : I 06; 1999: 93; 2000: 94). rom th , count , we e timatcd an average cru<l (entire area) den ity of .3 pairs/km2 and an a crag linear occurr nc of 2.9 pair /km of nest ( Jg ) habitat. N ·ting pairs of owl were ceptionally d n. e along drain. and canal., r . ulting in an average n ar st n ighbor di tanc ranging from 125-166 m aero s y ars (Table 1 ). Nests, eluding those in n st bo c:, were local d primanly along drains 43% , deli ery ditches (43 ~).and canals (11 % ), ith little variation among ears.
DIET
Based n fr quenc f occurrenc in pellet . amples, the diet wa dominated by arthropods, parti ularly 1thoptera (grasshopp r'> and crickets), ole ptera (beetle ), and Dennaptera (earwigs; ig. 2). mall mammals (primarily hous mouse [Mus nwsculusJ, pocket mouse [Perognathus. pp.], deer mou ·e [Peromyscus spp.J, and Botta's po ket gopher [Thomom.vs bottae]) were th dominant ertebrate prey, though bird were frequent in 2000. The av rage number of rodent. /pellet wa similar in 1998 (0.10 ± 0.04; CV = 14 Sk) to 2000 (0.13 ± 0.03; CV = 115%).
BR "DI G PHE OLOGY D PROD TIVITY
Burr wing Owl in the Refuge generally initiated br eding in April and May and extended into late ummcr. Egg-laying began a early as 24 April in 1999 and prior to our fir. t ob er a-
100
80 >. (J
c: Q) :l 60 CT ~ u. -c: 40 Q)
~ Q)
0.. 20
l - 1998(N=13)
2000 (N= 33)
- I ,. m 1 Col Orth Derm Hem Aran Scor $011 Crus Rep Amp Bird Rod
Taxa
FIG R 2. Diet of Burrowing Owls based on the~ frequency of tax.a within pellet samples. Imperial Valley, A, 1997-2000. Taxa included oleoptera ( ol, beetles), Orthoptera (Orth. grasshoppers and crickets). Dermaptera (Derm. earwigs). Hemiptera (Hem. true bugs). Araneae (Aran, spider. ), corpionida ( c:or, scorpions) .• olpugida ( oli. wind scorpion. ), rustaceans ( rus). Reptiles (Rep). Amphibian ( mp), Bird-, (Bird). and Rodents (Rod). The sample .,i?c ror each ear is the number of nest'> from which pellets were collected.
tions on 7 pril in 2000. lutches were comp! ted as early as 30 pril (1999) and 9 pril (2000), but average dates w re 14 May (SE = 4.2 d, - 6 ne t:) and 29 April ( E = 3.5 d, = 17 ne'>L ), r pecti ly. Pair'> with earl s as n ne'>t failur s that relaid <lid c.,o as late as midJuly in 1999 and 2000. lutch si/e was similar b tween year. ( 1999: 6.5 ± 0.1, = 17; 2000: 6.9 + 0.3, = 19). ranging from 4-8 egg~·.ln st attempt. Young hatch d ithin 1- 6 (3.3 ...!::: I. I, N 4) Ja s of one another in 1999 and 3-7 (4.3 + 0.6, N = 9) days in 2000, resultrng in large si/ ariation among '>iblings (Haley 2002). Based on thi'> larg variation of hatch date within a clutch, female'> apparently began incubation prior to c.:lut ·h completion. Hatching . uc ss in l 999 (70.5% + 14.8, N = 6) was similar to 2000 (84.4% ± 6.9, N = 8) in 2000. Dates of newly hatch ~d young ranged from 13 May-..... 0 June in 1999 (m an 3 June ± 3.6 d, N = I 0) and 30 April-June 22 in 2000 (mean 16 May::!:: 3.4 d, N = 16).
Producti ity ari d dramatically among nests and years within the I A. st failure ranged fr m 0 to 50% among ears and location (Table 2). Productivity, as stimated for all ne. ting attempts and for only those that were ucce,. Cul, wa · similar between nests on private (natural ne. t ·) and Refuge (nest bo es) land . Producti -ity averaged 2.5 ::!:: 0.2 young/nest with a ma -imum of 7 young ob rved. We failed to find explanatory factor. related t producti ity other

126 STU DI IN A VIA BIOLO Y NO. 27
T BL 2. COMP RI 0 F B RROWI G OWL PROD CTIV ITY, l MPERJA Y AIL EY, 1998- 2000
o. of) ung/succes<,ful n.:st
Location" Year E Range % failetl X :!: SE Range
Pri ate Land 1999 23 1.8 ± 0.3 0- 4 26. 1 17 2.5 ± 0.3 1- 4 20 0 29 3.0 :::!:: 0.3 0-5 10.3 26 3.4 :::!:: 0.3 1- 5
R fuge Land 1998 13 2.3 ± 0.6 0-7 30.8 9 3.3 ± 0.6 1- 7 1999 6 1.0 ± 0.5 0-3 50.0 3 2.0 ± 0.6 1-3 2000 7 3.9 ± 0.6 1-6 0 7 3.6 ± 0.6 1- 5
Note : Productivity was defined as th.: maximum number of young 14- 21 ti old obser ed during five 30-min observations (Private) or as the number observed within nest bo es (Refuge). a est wi thin pnvate lands were selected randomly from all nests located within the I A exclutling the Refuge . Nests within the Refuge were from all a ti vc nest b xes, excluding th se randomly selected to recei\e experimental manipu lation .
than year. In 2000, the nly year that we had e timate of both produ tivity and rodent con-umption for an adequate ample of ne t , pro
ductivity wa unrelated to the rodent index (N = 28 ne t , ~ = - 1.3 ::!:::: 1.0). Although ther wa high variability in neare t-neighbor distance (7-596 m) and numb r of neighboring ne t (1-19), neither near t-neighbor distance (N = 52, ~ = -0.04 :±:: 0.11) n r number of ne t within 600 m (N = 52, ~ = 0.01 ::!:::: 0.03 ) wer related to productivity ba. ed on the regre ion model with year and eith r th neare t-neighb r di tance or number of n t a explanatory factor . So although pr ductivity aried by year, we were unable to i olate fact r a ociated with individual variati n of productivity.
BETWI:. - YEAR Mo EM T
Adult Burrowing wls exhibited trong fid 1-ity t th ir n t sit s and their mat f adult Burrowing Owl of known sex ob erved in two . uc e sive year (N = 91 [ 1998- 19991 and 83 [ 1999-2000]), ov r 85 ~ nested within 400 m of
90
80 - Adults - Juveniles
C/) 70 iij
~ '"O 60 ·:;: :0 50
-= ..... 40 0
c: 30 QI
u .... QI 20
ll..
10
400 800 1200 1600 2000 2400 2800 >3200
Distance (m)
FIGURE 3. Frequency hisl gram of between-year movement di tance , of adult (N = J 74) and juvenile (N = 20) Burrowing Owl from the lnlensi e tudy Area, Imperial Valley, , 1998-2000. The percent of indi idual Jo ated in two con ·eculive year i h wn within 400-m distance int r al., . tarting at ::::AOO m.
their previou year' ne t (Fig. 3). Ba ed on data from ne t boxe (known ne t chamber), 48% (11 of 23) and 65~ (JI of 17) of net had at lea t one member of th pair nesting in the ame box between 1998- 1999 and 1999- 2000, re pecti ve-1 y. The strong ne t- ite fidelity corr p nded wen with mat fidelity : > 80% of pair for which both member wer banded and found in a . ucce ive year remained with the ame mate ( 1998- 1999: 19of22 pair 86.4~; 1999-2000: 16 of 20 pair, 0% ).
The hazard-rate function wa clearly a more appropriate m de! than the e ponential (w = 1.0) and demonstrat d a rapidly declining likelihood t m v l ng-di tance ( ig. 4). Th r was strong viden e that the haLard-rat function wa sex and year pecific (w = 1.0) and fit the data (P > 0.05 for ach ex and y ar). Male
0035 1
I
ftmal 1998 1999 Ftmale 1999 - 2000 111 1998 - 1999 bl 1999 - 2000
,-., 0030 ,-----------
~ \ 6 0025 I
:; ~ 0020
g 0015 :c Ct:
.rJ 0
~ 0010
0005
0 ()()() +-----~
50 7. 100
imulalcd Uniform Oi tribution
\
1500
\ \
\
3000
Di tance (m)
IG RE 4. We desc ribed movement data by the hazard-rale model, f( ) = I - exp (- [x/a] h), fit to di . -tance data of adult femal e and male Burrowing wls, 199 - 2000. Th y-a is i the probability of an individual mo ing to a n st location x di tanc (m) from lheir pre ious year's n sl ite. " Study Area ffecl ·" how the e ti mated di . per al di tance at which neg
ati e bia occur given a uniform dist1ibuti n of m vements with a ma imum of km.
ECOLOGY OF BURROWING OWLS-Ro. enberg and Haley 127
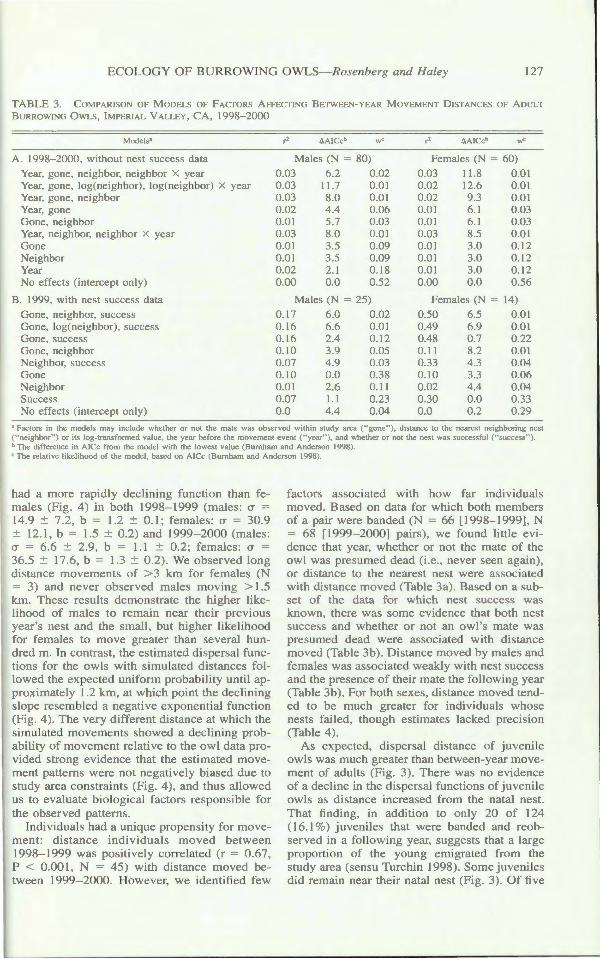
TABLE 3. COMPARI 0 OF MODELS OF FA TOR AFFECT! G BETWEE -YEAR MOVEME T DJ TA CES OF Ao LT
BURROW! G OWL , [MPERIAL VALLEY, CA, 1998-2000
Models"
A. l 998-2000, without ne t succe data Year, gone, neighbor, neighbor X year Year, gone, log(neighbor), log(neighbor) X year Year. gone, neighbor Year, gone Gone, neighbor Year, neighbor, neighbor X year Gone Neighbor Year No effects (intercept only)
B. 1999, with ne t succe. s data Gone, neighbor, succes Gone, log(n ighbor), succe s Gone, ucce Gone, neighbor Neighbor, succes Gone Neighbor Succe No effects (intercept only)
Males (N = 80) Female. (N = 60) 0.03 6.2 0.02 0.03 l] .8 0.01 0.03 11.7 0.0 I 0.02 12.6 0.0 I 0.03 8.0 0.0 I 0.02 9 .3 0.0 I 0.02 4.4 0.06 0.0 I 6. I 0.03 0.0 I 5.7 0.03 0.0 I 6. I 0.03 0.03 8.0 0.0 I 0.03 8.5 0.0 I 0.01 3.5 0.09 0.01 3.0 0.12 0.0 I 3.5 0.09 0.01 3.0 0.12 0.02 2. I 0.18 0.01 3.0 0.12 0.00 0.0 0.52 0.00 0.0 0.56
Male. (N = 25) Female (N = 14)
0. I 7 6.0 0.02 0.50 6.5 0.01 0.16 6.6 0.01 0.49 6.9 0.01 0. 16 2.4 0.12 0.48 0.7 0.22 0. I 0 3.9 0.05 0.1 I 8.2 0.01 0.07 4.9 0.03 0.33 4.3 0.04 0. J 0 0.0 0.38 0.10 3.3 0.06 0.01 2.6 0.1 l 0.02 4.4 0.04 0.07 1.1 0.23 0.30 0.0 0.33 0.0 4.4 0.04 0.0 0.2 0.29
n Factors in the models may include whether or not the mate wa'> observed within study area ( " gone"), di>.tance to the neare'>l neighboring nest ( " neighbor" ) or its log-tran . formed value. the year before the movemenL e\elll (''year" ), and whether or not the ne !> t was succes ful (",uccess " ). h The differen e in I c from the model with the lowest value (Burnham and nder,on 1998). " The rcl i1tivc lif..clihood of the model . based on Al c (Burnham and Anderson 1998).
had a more rapidly declining function than female (Fig. 4) in both 199 - 1999 (males: a = 14.9 :±:: 7.2, b = 1.2 :±:: 0.1; female : a = 30.9 :±:: 12.1, b = 1.5 :±:: 0.2) and J 999- 2000 (males: a = 6.6 :±:: 2.9, b = 1.1 :±:: 0.2; females: a = 36.5 :±:: 17.6, b = 1.3 :±:: 0.2). We b erved long di tanc m vem nt of > 3 km for f male (N = 3) and n ver ob erved mal s moving > l .5 km. The. e re ult · demonstrate the higher likelihood of male to remain near their previou year's ne t and the mall, but higher likelih od for female. to move greater than e eral hundred m. In contrast, the estimated di persal functions for the owls with imulated distance followed the expected uniform probability until approximately 1.2 km, at whi h point the declining lope resembled a negative exponential function
(Fig. 4 ). The very different di tance at which the imulated movements showed a declining prob
ability of movement relative to the owl data provided trong evidence that the e timated movement pattern were not negatively bia ed due to tudy area constraint (Fig. 4), and thu allowed
us to evaluate biological factor respon ible for the ob erved patterns.
Individuals had a unique propensity for movement: distance individuals moved betw en 1998-1999 wa positively con-elated (r = 0.67, P < 0.00 I, N = 45) with di tance moved between 1999-2000. However, we identified few
factors a ociated with how far individual moved. Ba ed on data for which both member of a pair were banded (N = 66 11998-1999], N = 6 [ 1999-2000] pairs), we found little evidence that year, whether or not th mate of the owl wa presumed dead (i.e., ne er seen again , or distance to the neare. t ne t were a, · ciated with di ' tance mo d (Table 3a). Based n a . ubc;;et f the data for which ne. t ucce as known, there wa .. ome evid n e that b th nest sue e. and whether or not an owl '1> mate was pre 'urned dead were a ·sociated with distan e moved (Tabl b). Distance moved by male and female was associated weakly with nest success and the presence of their mate the following year (Table 3b). For both sexe , distance moved tended to be much greater for individual whose ne t failed, though e timate lacked preci ion (Tabl 4).
A expected, disper al distance of juvenile owl was much greater than between-year movement of adult (Fig. 3 ). There wa · no evidence of a decline in the <lisper al function of juvenile owl as di tance increa ed from the natal ne t. That finding, in addition to only 20 of 124 (16.1 %) juveniles that were banded and reobserved in a following year, ugge t that a large proportion of the young emigrated from the tudy area (sen u Turchin 1998). Some juvenile
did remain near their natal ne t (Fig. 3). Of five
128
t.. 0 ti) ti)
0 ...J Q z < .,;-ti) i:.l
TUDIES IN A VIAN BIOLOGY NO. 27
('(')
~'° ~ V')
0 '°'° ~ '° ~ 6 ('(')Ji"" o\
"1: Mr--C"'lo
V'li\C)~-i I '° I °' V') 'T .......
o\
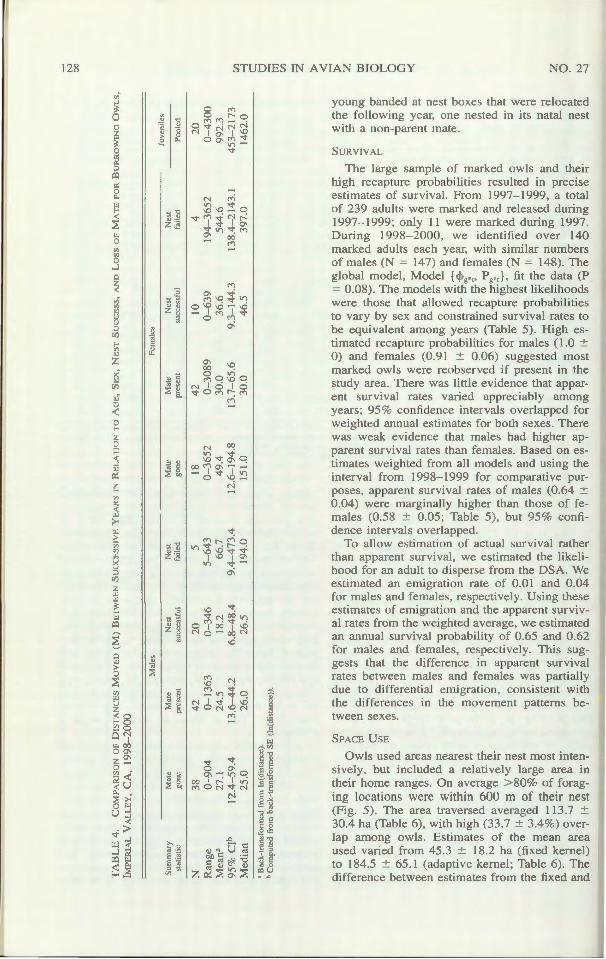
young banded at n t bo e that were r located the following year, one ne ted in it natal ne t with a non-par nt mate.
S RYIVAL
The large sample of marked owl and their high recapture probabilitie re ulted in precise e timate of survival. From 1997-1999, a total of 239 adult were marked and relea ed during 1997-1999; only 11 were marked during 1997. During 1998-2000, we identified over 140 marked adult each year, with imilar numbers of male (N = 147) and female (N = 148). The global model, Model { <l>g•i• Pg.1}, fit the data (P = 0.08). The model with the highe t likelihood · were tho e that allowed recapture probabilities to vary by ex and con trained urvival rates to be equivalent among year (Table 5). High estimated recapture probabilities for male (1.0 ± 0) and females (0.91 ± 0.06) ugge ted mo t marked owls were reob erved if pre ent in the tudy area. There wa little evidence that appar
ent urvival rate varied appreciably among year ; 95o/c confidence interval overlapped for weighted annual e timates for both exe . There was weak evidence that male had higher apparent . urviva1 rates than female . Based on e -timate weighted from all model and using th interval from 1998- 1999 for comparative purposes, apparent survival rate of male (0.64 ± 0.04) were marginally higher than tho e of females (0.5 :::!::: 0.05 · Tabl 5), but 95o/c confid nee interval overlapped. ~ allow estimation of actual urvival rather
than apparent urvival, we e timated the likeliho d for an adult to disp rse from the DSA. We e, ti mat d an emigration rate of 0.0 l and 0.04 for mal s and female , respe riv ly. U ing the e
stimate of emigration and the apparent survival rate from thew ighted averag , wee ti mated an annual ·urvival probability f 0.65 and 0.62 for males and female , respectively. Thi sugge ts that the difference in apparent , urvival rate b tween male and femal wa partially due to differential emigration, con i tent with the differ nee in the movement patt rns betw en exe
SPA E USE
Owl u ed area neare t their ne t mo t intensively, but included a relatively large area in their home range . On average > 80o/c of foraging location were within 600 m of their ne t (Fig. 5). The area travec ed averaged 113.7 ± 30.4 ha (Table 6), with high (33.7 :::!::: 3.4%) overlap among owl . E timate. of the mean area u ed varied from 45.3 :::!::: 18.2 ha (fixed kernel) to 184.5 :::!::: 65.1 (adaptive kernel; Table 6). The difference between e timates from the fixed and
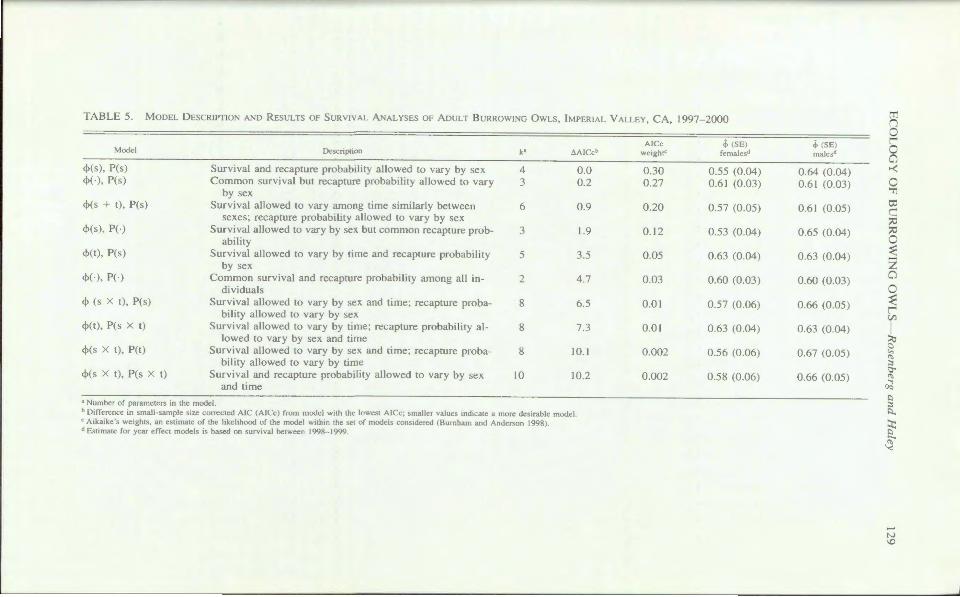
TABLE 5. Moo L DE CRLPTIO D R ESULT. OF RVJ\AL A AL .ES OF ADULT B RROWL G OWLS, IMPERIA L VALLEY, A, 1997-2000
Model
<PC ), P( ) cl>(·), P(s)
<PC + t), P(.)
cl>( ), PO
<l>(t), P( )
cl>(-), P(-)
cl> ( X t), P(s)
<l>Ct), P( • x t)
cl>(. X t), P(t)
<PCs x t), P( x t)
urvi al and recapture probability allowed to ary by ·ex Common . ur ival but recapture pr bability allowed to vary
by ex urvival allowed to vary among time similarly between
e e : recaptur probability allowed to vary b . ex Survival allowed to ary by ex but common recapture prob
ability urvival all w d to vary by time and recapture probability
by .ex Common . urvival and recapture probabilit7 among all in
dividual Sur ival allow d to vary b) ex and tim : recaptur proba
bility allowed to var_ b e ur i al allowed to vary b t1me: recapture probability al
lowed to vary by se and time Survival allow d to vary by e and time; recapture proba
bility allowed to vary by time Survival and recapture pr bability allowed to vary by ex
and time
a umber of parameter · in the model.
4 3
6
3
5
2
8
8
0
0.0 0.2
0.9
1.9
3.5
4.7
6.5
7.3
10.J
10.2
h Difference m small-sample \l/C corrected I ( I c) from model wnh the lowe~t !Cc: 'mailer value. indicate a more de-,1rahle model. c Aikaike "s weight\ . an e'timate of the ltkelthood of the model \\1thin the et of model' con\ldered (Burnham and ndcr,on 1998) J fatimate for year effect models i' ha ed on unh.al between 199 - 1999.
0.30 0.27
0.20
0.12
0.05
0.03
0.01
0.01
0.002
0.002
J, ( El female J
0.55 (0.04) 0.6 1 (0.03)
0.57 (0.05)
0.53 (0.04)
0.63 (0.04)
0.60 (0.03)
0.57 (0.06)
0.63 (0.04)
0.56 (0.06)
0.58 (0.06)
tTl n 0
J, CSE) l malcsJ 0
0 0.64 (0.04) --< 0.61 (0.03) 0
'i1
0.61 (0.05) a:l c:: ~
0.65 (0.04) ~ 0
0.63 (0.04) ~ z 0.60 (0.03) 0
0 0.66 (0.05) ~
l en 0.63 (0.04) I
:::i::i CJ
0.67 (0.05) "' ~ ;::s \:;"'
0.66 (0.05) ~
~ 2 ~ ::i: 2..
'-::

130 STUDIE IN A VIAN BIOLOGY NO. 27
T BLE 6. o Y Boi
TIM T D HOM E R GE SlZ OR I ' RADIO-TAGG ED MALE B RROWI G OWL NE T l G WITHI TH
LTO EA N ATIO L WILDLIFE R EF G , IMPERIAL VALLEY, , M Y- J LY 1998
o. telemetry Owl location-. 100'4- M PJ
71 15 B 17 68
55 247 D 77 0
29 63 52 66
Mean ( E) 113.7 (30.4)
a Minimum corvex polygon .
adaptive kernel were ften large becau e f th different level of mo thing in area farthe t
from the ne t, where data were par e. The fixed-kern~l e timate probably undere. timated the area llied becau e of the high concentration of location near the n t, wherea the adaptive k rnel pr bably ov re timated area because of the few di tant l ation,.
Habitat selection pattern varied among owl . The tronge t ingl effect wa imply di Lane from the r.e t (Table 7, Fig. 5). Them d l with
nly di tance had similar weight to mod I that al o included whether r not cover exi t d. Al-
Area e-.11ma1e (ha)
95<;!·· adapuve 95~ fixed kernel 1-.ernel
191 13 187 8 491 122
73 65 85 53 80 I 1
I 84.5 (65.1) 45 .3 ( 18.2)
acce ibility), and management of a particular field, a well a individual pattern of habitat election.
DISCUSSION
NE TD !TY A D DI TRLB T!ON
continuou
col ni ariability wa due
TABL 7. COMPARI 0 OF· HABIT T SELE TIO MODEL OF MALE B RROWI OWL ( = 6), IMP RI L YALL · Y,
, MAY-J LY 1998
Log (<.11.,tance) 3rd-order polynomial (d1stanc )
VI ode I• • h Range (w)c w h Range (w)<
0.06 0-0.20 0.07 0-0.24 0.20 0-0.87 0.26 0-0.77 0.20 0-0.67 0.20 0- 0.-4
( intercept only) 0.00 0 0.00 0
a Fac1ors in the model may include di<,tance from the neM a<, ei ther a log effect or as a 3rd-order polynomial, and two differem <.chemes of pooling different habii..t types: (I) whether or not the field contained crop., with dense cover ("crop type .. ) or (2) whether or not the field had cover by a crop h The mean of the relauve likelihood of rhe model , based on I c (Burnham and Anderson 199 ) ' The range of 11· among owls.
ECOL Y OF BURROWING OWL -Rosenberg and Haley 131
Q) I/)
60
50
40
::> 30
'E Q)
~ 20 Q)
a. 10
200 400 600 800 1000 1200 1400 1600 1800 2000 2200
Distance (m) From Nest
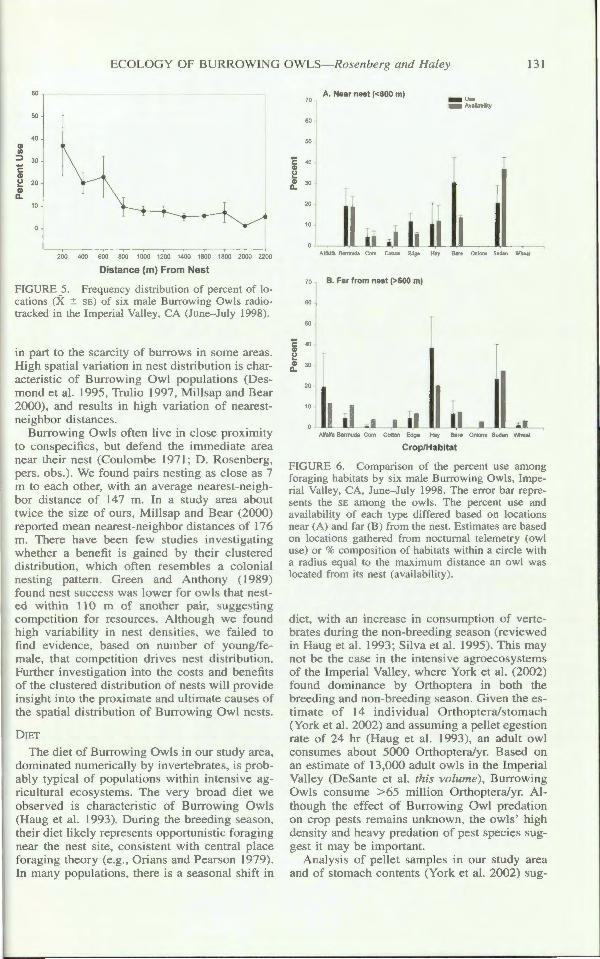
FIGURE 5. Frequency distribution of percent of locations (X ± E) of six male Burrowing Owl radiotra ked in the Imperial Valle), CA (June- July 1998).
in part to the scarcity of bu1Tow in . ome area . High spatial variation in nest distribution i characteri tic of Burrowing Owl population (De. -mond et al. 1995, Trulio 1997, Mill ap and Bear 2000), and result in high ariation of neare tneighbor di tance .
Burrowing Owls often live in clo to conspecifk , but de-D nd the imm diate area near their ne. t (Coulomb 1971; D. Ro enberg, per . ob .). W f und pairs ne. ting a. lo e as 7 m to each other, with an average near t-neighbor di tance of 147 m. ln a study area about twice the . iz of ours, Mi11 ap and B ar (2000) r ported mean neare t-neighbor distances f 176 m. There hav been few studi · inv tigating whether a benefit i gained by th ir clu ·ter cl distribution, which ft n r . mbles a colonial ne. ting pattern. Gre n and Anthony ( 19 9) found ne ·t ucces was lo r for owl: that nested ithin 110 m of another pair, uggesting competition for resource.. lthough we found high variability in nest densities, we failed to find videnc , ba ed on number of young/f -male, th t comp tition drives ne ·t distribution.
urther inv stigation int the co. L and benefits of the clustered distribution of nest will provide insight into the proximal and ultimat cau e. of the . patial di . tribution of Burrowing Owl nests.
DIET
The diet of Burrowing Owls in our study area, d minated numerically by in ertebrates, i probably typical of population. within int n. ive agricultural eco ystem . The very broad diet we ob, erved i characteri ·tic f Bun- wing Owl (Haug et al. 1993). During the breeding ea on, their diet likely repre ent. opportuni tic foraging near the ne, t ite con i tent with central place foraging theory (e.g., Orian. and Pear on 1979). In many population , there i a eas nal hift in
70 A. Near nest (<600 m)
- Use - Ava1lablhty
60
50
J :1 20
10
Alfalfa Bermuda Com Cotton Edge Hay Bare Onions Sudan Wheal
10 B. Far from nest (>600 m)
60
50
"E 40 C1>
~ &. 30
20
10
Alfalfa Bermuda Com Cotton Edge Hay Bare Onions Sudan Wheat
Crop/Habitat
Fl RE 6. Compari on of the percent u. e am ng foraging habitat by . ix male Burrowing Owl , Imperial Valley, CA, Jun - July 1998. The error bar repre<>ents the among the owl . The percent use and a ailability f each type differed ba ed on I ation near ( ) and far (B) from then t. stimate are based m location<> gathered from nocturnal t lemetr ( wl use) or % comp siti n f habitat within a cir le with a radius equal to the ma imum distan e an wl wa · located from its nest (a\ ailability) .
diet, with an increase in consumption of vert -brat during the n n-breeding . ea on (r viewed in Haug t al. 1993; ilva et al. 1995). Thi . may not b the ca e in the inten. i agroeco. y<.;tem of the Imperial Ya11ey, wher Y rk et al. (2002) found dominance by Orth ptera in b th the breeding and non-breeding sea. n. Given thee -timate of 14 indi idual Orthoptera/stomach (York et al. 2002) and a urning a pellet eg stion rate of 24 hr (Haug et al. J 993), an adult owl con um about 5000 Orthoptera/yr. Ba ed on an estimate of 13,000 adult owl in the Imperial Valley (DeSante et al. thi volume), Burrowing Owls con ume >65 million Orthoptera/yr. Alth ugh lh eU t of Burr wing Owl predation on crop pe ts remain unknown, the owl ' high density and heavy predation of pe t species ugge t it may be important.
Analysi · of pellet sample. in our study area and of . tomach content (York et al. 2002) sug-

132 TUDI IN A VIAN BIOLOGY NO. 27
ge ted very low consumption of rodent in th Imperial Valley relati e to other population in California (D. R · nberg et al., unpubl. data). The rodent inde wa · highly variable am ng n t. and wa likely influenced by field-speci fie crop management. For example, after a fi Id burn we ob erved greater number of rodent remains around owl bun·ow (K. Haley, p rs. ob .). The flood method of irrigation may limit r dent population . York t al. (2002) hypoth -ized that Burrowing Owls select small rodent.
ov r arthropod and that the low frequency of rodent in their diet in the Imperial Vall y wa. due to low abundan and availability, con i -tent with finding ' of trong election ~ r rod nt for a Chilean Burrowing Owl population ( ilva et al. 1995).
Bird were another primary vertebrat con-umed. They were much more frequent in the
diet of owl in th Imp rial Valley than in oth r area of California (D. Ro 'enberg et al., unpubl. data). Prey included both mall pa .. erines, . uch a Wil on' Warbl r (Wilsonia pu ilia), as well as larger bird. that were apparently cavenged, such as American cet (Recurvirostra americana). Bird may be an important component of the diet, p cially during the breeding season when energetic demand · ar high.
BREE.DI G PH OLO AND PROD TIVITY
The owls' nesting s ason is longer than ebewh re in California (D. Rosenberg et al., unpubl. data), with gg-laying extending into July, usually following nc. t failure. Indeed, a nest with 10- 14 d old young was found duling Decernb r (J. Govan, per.. comm.), giving further support to our hypothesis that year-round f od availability may be greater in th Valley than \s -where in the subspecies' range. The only other record of lat -season breeding by Burr wing 0 Is a. in lorida in an area also with high densiti of owl. (Millsap and Bear l 90). De. pile the potential f r an t nded breeding :-.cason and frequent r n . ting following n . t failur (D. atlin and D. Ro ·en berg, unpubl. data), w did not ob erve doubl -brooding, which has b en infrequently obs rved elsewh re (Mill:ap and Bear 1990, Gervai. and Ro enberg 1999).
Clutch ize within a pe ie i belie d to be a r pon to ariati n in protein and nerg availability (William 1996, Nager et al. 1997 . Buuowing Owl produc large clutches (up to IL egg -; Haug et aL I 993), u ually as ociat d with high rodent abundance (D. Ros nberg, p rs. ob .). In the Imperial Valley, we have 11 er ob erved clutch siz > 8 during our study p -riod; of these, few individuals typically fledge.
!though an average of ix egg wer laid per
clutch, an a erage of only 2.5 young ur i ed to 21-28 d old.
We failed t identify factor other than year a, ociated with indi idual variation in pr ductivity. We e plored only two comp nent of tho e often po tulated to be a ociat d with individual variati n of productivity in bird : quality of diet and ompetition for food re ource (Newton J 99 ). W failed to find that ur index of rodent c n umption or the pre enc of neighboring owl were related to productivity. Although it i likely that our finding f a year effect on productivity wa related to food re urce , our index, which e timated th abundance of only one of the many prey re our e , wa not indicative of individual ariability in productivity. How well ur e timate provided a reliable index to rodent con umption at th indi idual ne t level i unknown . Unlike other it in California (D. Ro nberg, unpubl. data , bird were a common comp n nt of the di t, and indeed may be more important than rodent c n umption for providing ufficient energy and nutri 11t for a large brood. 0th r factor affecting individual
ariation in productivity that may be p rative for Burrowing Owl include vulnerability to predation, parental condition, age of adult , and previou reproductive hi tory. The fa tor remain to b e pl r d with our data and future experimental :tudies.
That food supply Limit clutch siz and the number of ft dgling, of many bird . peci s ha been well dem 11 trat d (Newton 1998: 145 , Indeed, Hal y (2002) found an incr as in productivity of ro d-suppl m nted Burrowing Owl. in the Imp rial Valley. We hypoth siz that clutch size of Burrowing Owl in th Im Valley i. limit d primarily b nutri nt and nergy a ailability. W further p ulate that the me hanism f r du ing br d ·ize c ur through infanticide (W llicome 2000) and increa d pr dation through exp ure of young at the burrow (Bot lh 1996), both of whi h are influ need by f d . upply. Determining th eparate role of nutrient and en rgy limitation in clutch iz e.g., Nager et al. 1 97) and fa tor cau ing mortality of ne tling will requir careful ob rvati n and xperimentation.
BETWEE -Y RM EM T
Burrowing Owl typically remained with their mate in ucc . iv br eding ea on . Our finding of great r than 09< mate retention i imilar to the high (92~) rate Millsap and Bear (1997) reported in Fl rida. However, high annual mortality meant that nly appro irnately 40~ of the pair would have b th member aliv by the following breeding . ea n. Following lo f mate , through di orce, emigration or death, new

ECOLOGY OF B RROWING OWL - Rosenberg and Haley 133
pair · were fom1ed; ome owls m ved c n iderable di tance (e.g., >3 km) before new ne. t pair. wer formed.
Our findings on between-year m vement are in gen ral agreement with pri r studies throughout the owl' North American range. Our re ult are . imilar to the high ne t-site fid lity of adulL reported for the Florida , ub pecie by Mill ap and Bear ( 1997) and for a migratory population nesting in Canada (Wellicom et al. 1997). Lutz and Plumpton ( 1999) reported lower rate for a migratory population in Colorado. Adult between- or within-year m vement di tances of over 40 km have been detected for both re ident (1. Ro ier et al., unpubl. data) and migratory (Wellicome et al. 1997) populations. The ize of our tudy area, however, was too small to detect mo ement >4 km u ing only mark-recapture method .
Adult Burrowing Owl , particularly female , will nest in location di tant from their previous year' ne. t, consi tent with a ian di per al pattern (Gre nwood 1980). We found . uch movements ften followed ne t failure. similar to re-ult fr m olorado (Lutz and Plumpton 1997)
and gra. land in California (J. Ro ier et al., unpubl. data). Mill ap and Bear ( 1997) found that longer-distance movement were a sociated with I of a mate. We found idcncc for thi as well, but our data pro id d stronger support for ne t failur a the predominant factor a. iated with m ement .
N~ tal <lisp r ·al pattern . ar poorly uncJersto d and di ' lance di ' tribution · ar typically undere ·timat d for m t bird specie. (Barrowclough 1978, Koenig et al. 2000). Natal disp rsa] patterns in Burrowing Owls ar no e ception. From the non-declining disp r.·al function (s nsu Turchin L 99 ), it wa. clear that our study area was to small to pr p rly e timate thi" important parameter. Natal di per al di . tance of up t 300 km wa rep rt d by Wellicom t al. ( 1997) from a migratory population. MilL ap and Bear ( L 997) reported am dian natal di . p r al di tance of between 0.4- 1.1 km; our m dian distance was similar ( l.5 km), and we usp ct it was everely und r . timated. areful all ntion to the problems of estimating di p rsal, particularly natal di p rsa1 (e.g., Koenig et al. 2000), will be required to provide a better understanding of the population ecology of thi specie:.
S RYIYAL
It was interesting, but not surpri ·inc-, that adult survival rate were imilar b twe n males and female . We su pect that cause of mo1tality differ between exe ·, though annual mortality is imilar. Co ts of reproduction are likely higher for female-, particularly if nutrients required for repro-
duction are limiting. Predation within the burrow by l"o%orial mammals and snakes may be an important mortality factor. If so, thi hould affect adult female more than males becau e only r -males incubate egg. and brood young (Haug et al. 1993). Alternatively, the male's high isibility and the 0 reater amount of time spent foraging during the breeding , eason may make males more vulnerable to olh r pr dators and vehicles.
ew accounts of cau e-speci fie mortality exist. layton and Schmutz ( 1997) quantified cau. e
speci fic mortality for two Canadian population. ; ehicle c lli . ions were the predominate mortality
factor for adult in fragm nted environment., wher as predation by raptors and mammal predominated in the larger grassland ecosy tern .. Millsap (2002), in an urban environment in Florida, ~ und vehicle colli. ions responsible for 70% of banded owls found dead. Ad eper under randing of cau e- pecific mortality is needed to mor fully under tand factors affecting Burrowing Owl population ..
Our e timate of :ur i al rates f Burrowing o, ls i one of the few n t ba · d n return rat s, which typically underestimate sur i al. Lutz and Plumpton 1997) reported adult sur i al rates that aried between 0.17 to 0.7 I among year. within a migratory population in Colorado. In
anada, layton and Schmutz (I 997) e. ti mat d adult . urvival rate, based on kn wn fate data (radio tel m try) and gen rally f und 1 w rates, although they aried from 0.38-J .0 for a 4-mo p riod. In a study de ign similar to ours, Millsap and Bear ( 1997) f und annual . ur ival rates of ~ mal s generally lower (0.52-0.69) than male. (0.62-0.81 ). and in areas r moderate hou<>ing d clopment the t nded to b similar to our stimate.· (Mill ap 2002).
Based on th natural hi'>lory of Burrowrng wls, it i likely that population dynamics ar
more sensitive to ju enile than adult ·urvi al (e.g.. mien and Pikitch 1989). Indeed, that fe acJults but many juveniles mo ed I ng di . tances and that mortality rates of adults are high, sugg 3 . t that e -situ recruitment of young into th breeding population i. an es<>ential feature of the dynamic. of the relatively :tabl population we studied. Martin et al. (2000) reported . imilar findings for White-tailed Ptarmigan (Lagopus feucurus) and uggested that r cruitment from external population may b an important and common feature of avian p pulation dynamic .. In the Imperial VaJley, the Burrowing Owl population i probably structur d as a continuou population rather than as a :et of di tinct ·'external'' population . Ind d, genetic data ugge t high mixing of individuals throughout central and southern California (Korfanta 2001 ).
Becau. e of the high emigration rate of juve-

1 4 STU DI IN A VIAN BIOLOGY NO. 27
nile from our tudy area, a evidenced by the non-declining movement function we ob er ed (Fig. 3), e timate of juvenile urvivor hip w uld have been rely undere timated from our data. Preci e and unbia ed e timate of ju-
enile urvivor hip will be important in order to model the dynamic of thi population, a well a to explore how ensitive the dynamic of the population are to juvenil . ur ivor hip.
SPACE USE
Burrowing Owls tend to remain near their n ite during nocturnal foraging. Similar to our reult , >80'1£ of th nocturnal telemetry location
were within 600 m of the ne t during the breeding sea on in the agricultural matrix of the Central Valley, California, and Sa katchewan, Canada (Haug and Oliphant 1990, Gervai et al. 2003). Haug and Oliphant (1990) repo1ted male Burrowing Owl elected gra -forb area and avoided agricultural field during nocturnal foraging. However, their e timate of election did not take into account di tance from the ne t. B -cau e ne t site w re all located within gra . -forb area (Haug and Oliphant 1990), di tance alone may explain the apparent pattern f habitat election they reported. Our re ult and tho · of G rvais et al. (2003) demon trate that agricultural field are often u ed by Burrowing OwL. Indeed, the high owl densities in th Imperial Valley, pred minated by crop. , ·ugg ~t
agricultural field can pro ide quality f raging habitat. Th tructure of vegetation within an agricultural field i dynamic and changes through-
ut the growing . ea n likely aff ct owl ~el ction. ome crops, ~uch as alfalfa, are grown with ut culti ation for se eral year , ometim as long a six year · (A. Kalin, pers. comm.). In
u ·h ca e , r d nt population may incr as with a parall 1 in r a in lecti n by f raging Burrowing Owl .
H me range siz of adult Burrowing Owls i · highly ariable. E timat (M P m thod) ranged from 14- 4 0 ha ex = 240 ha) in a matrix of grazed pa tur and cereal crop, in anada (Haug and Oliphant 1990) and averaged 189 ha in the entral Vall y of California (G rvai et al. 2003). W found imilarly high variation, regardle of the estimator u ed. Variation in home range iz i likely due to availability of prey, reproductive su ce (i.e., energy demand), and characteri tics of the land cape that affect the di tribution of resource (Newton 1979, Kenward J 9 2, Haug and Oliphant J 90,
arey et al. 1992). Management practi e that affect prey availability, uch a field burning and harvest, were also likely re pon ible for the individual variation we ob erved in patt rn . f space u e. Sampling variation may be r pon i-
ble for much of the ob, erved dirt ren timated h me rang ·ize; thi d erv attention for estimati n of home range in general (Whit and Garrot 1990).
MANAGEME T ON ER
In the Imperial Valle , the availability of burrow i largely dependent on the management practice of private landowner and the Imperial Irrigation Di trict. Mo t of the burrow in our tudy jte likely r ulted from water seepage,
mu krats ( Ondatra -z,ibe1hicu ; Coul mbe 1971 ), and gopher . When gopher reach the concrete lining, they often burr w to the urface (A. Kalin, per . comm.), creating an initial tunnel the owl can enlarge. We al o found n t within burrow initially created by the round-tailed ground quirr J (c;tellus tereticaudus), a did Coulombe ( 1971 ). Within the agroecosyst m of the Imperial Valley, th abundance of the e pecie · and their ability to provide burrow that the owl can modify a ne t are determined largely by local farming practices and method of water onveyance.
The ingl large. t management c n rn for the Burrowing Owl population in th agroec . y tern of th Imperial Valley i how the irrigation y:t m i · managed. Dredging of drain and grading f roads ha the potential to d str y ne t (C ulomb 1971 ; thi study). Inde d, . everal adults and their ne t were buried dming road grading operations (0. Catlin and 0. Ro. en berg, unpubl. data). Flooding from verflow of d livery ditches also cause nest destructi n and death of young (K. Haley, per ·. obs.). A potential pr blem is th growth or tall v g talion along drains, which prevent owl. from nesting; however, current management practi es g nerally reduce or eliminate vegetation along drain . .
llaboration among th Imperial Irrigation Oistri t, ·tate and fed ral agencie , and land wner , uch a lo al farmer , will be in trum ntal in
de eloping strategi s t allow maintenanc of the irrigati n syst m hile minimizing destruction tone. ts. Burrowing Owls and th ir ne · t. are protected under b th state and federal law. but such protection in inten ively managed ecosy -tern is difficult. R ear h on d veloping f a ible method t reduce the likelihood of de troying ne t or entrapping adult owls will b tial in de eloping con er ation trat gie .
Another issue that may affect Burrowing Owl population in th Imperial Valley i th pre -ence of contaminant re idues from current and former agricultural practices. Pre iou findings ugge t low level of contamination by organo
chlorine ·; p,p'DO , the only organochlorine detected in egg. , wa r latively low in the Imp rial Valley (Gervai et al. 2000). Specie that con-

ECOL GY 0 BURROWING OWLS-Rosenberg and Haley 135
ume a large proportion of their diet from aquatic environments have been reported with high level. of p,p'DDE and elenium within the Imperial Vall y (Setrrlire et al. l 990, 1993). The predominance of terre trial-ba ed prey re ource in th diet, particularly Orthopt ra, may be re-pon ible for the relatively low levels of both
p,p'DDE and elenium reported by Gervai et al. (2000). The re ult of Gervais t al. (2000) were ba ed on a maIJ ample from within the Refuge and from only a ingle year; however, Gervais and Catlin (in pre. ) found imilar level of p,p'DDE within and adjacent to the Refuge in 2002. Although we did not evaluate contaminate re idue , the relatively high rates of adult survival and the proportion of ne ting attempt that produced young do not currently indi ate a problem. However ffect could occur if current pattern of pe ticide u e change or if natural str or interact with pesticide expo ur (Gervai and Anthony 2003).
The large numbers of Bun-owing Owl in the agricultural matrix of the Imperial Valley remain vuln rable to change in land u e (e.g., urbanization) and water di tribution. Alth ugh the concentration of Burro ing Owl within the Imperial Valley i. clearly due to farming practices, pre umably a large but pars population exi ted prior to agricultural d v lopment. Th few areas of native habitat that remain in the Imp rial Valley may be important for the per i. tcnce of Burrowing Owl in the Imp rial Valley if chang ~
in agricultural practices prev nt ne ting along the irrigati n sy tern. Succ ful con ervation . trat gi . for Burrowing Owl in the lmperial
Valley will require both a thoughtful con ideration of how future hanges in agricultural practices may affect population. and an evaluati n of the r I of native habitat for population per-i tence.
ACKNOWLEDGMENT
We thank R. Balzer, C. Faustino. A. Felty, K. Hughes, R. Jan en. P. Phelp , and M. York for dedicated field a i tance, J. Ro ier and H. Packard f r preparation of data and analy i of pellet , J. Gervai . fore. ti mating home range ize, . Wood for a si ·tance with GI data, and L. Gorman for preparation of Figure l . We are indebted to K. Sturm and the Sonny Bono Salton Sea National Wildlife Refuge for helping u. initiate the project and for logi tic support throughout the study. Local farmer , particularly A. Kalin, facilitat d our work on pri ate lands. The manu cript wa impr ved through the constructive critici ms of D.
huford, J. Ger ai , B. Mill ap, H. Ober and K. Sturm. We are grateful to the U. . ish and Wildlife Service (Non-Game Bird Program), aJEnergy, Southern Ga. , and the citizens of California (tax-check off fonds through California Department of Fi h and Garn ) for financial upport . The senior author thanks J. and M. ydigger for pro iding a wonderful place to work on thi manuscript. This project wa conducted as part of the Burrowing Owl Research Program, a collaborative re earch program inc.:luding The In titute for Bird Populations, Oregon tat niversity, an Jo ·e tale University, tah State Uni er ity, and the
regon ooperative ish and Wildlife Re earch Unit. ooperators of the Oregon Cooperative Wildlife Re
search Unit included U .. Fish and Wildlife er ice, Oregon lat University. Oregon Department of Fish and Wildlife, Wildli~ Management Institute, and the Bi logical Resources Di ision of th .S . Geologi al
urvc . This i.· publication no. 153 or Th Im.titute for Bird Populations.