the economic contribution of montana’s beer and wine ... · pdf filestate and across...
TRANSCRIPT

Prepared byBureau of Business and Economic ResearchUniversity of MontanaMissoula, MT 59812
July 2014
The Economic Contribution of Montana’s Beer and Wine Distributors
Prepared forMontana Beer and Wine Distributors AssociationP.O. Box 124Helena, MT 59624
1
Acknowledgements
This report was produced and authored by Colin Sorenson and Patrick Barkey, research economist and director, respectively, at the University of Montana Bureau of Business and Economic Research. The research was supported by the Montana Beer and Wine Distributors Association (MBWDA). We would like to thank MBWDA board member Mike Markovich for providing helpful information as we developed and carried out the study plan, and MBWDA bookkeeper Sherri McGuire for providing summary data from MBWDA members. Any errors and omissions are, of course, our own.

2
Contents Acknowledgements ......................................................................................................... 1
Executive Summary ........................................................................................................ 3
1. Policy Analysis with the REMI Model ........................................................................ 5
2. Distributor Operations ............................................................................................... 9
3. The Economic Impact of Distributor Operations ..................................................... 12
Impacts Summary ................................................................................................... 12
Employment Impacts .............................................................................................. 13
Personal Income Impacts ....................................................................................... 14
Gross Sales Impacts .............................................................................................. 16
Compensation Impacts ........................................................................................... 17
Population Impacts ................................................................................................. 17
State Revenue Impacts .......................................................................................... 18
4. Summary and Conclusion ...................................................................................... 19
5. References ............................................................................................................. 20
3
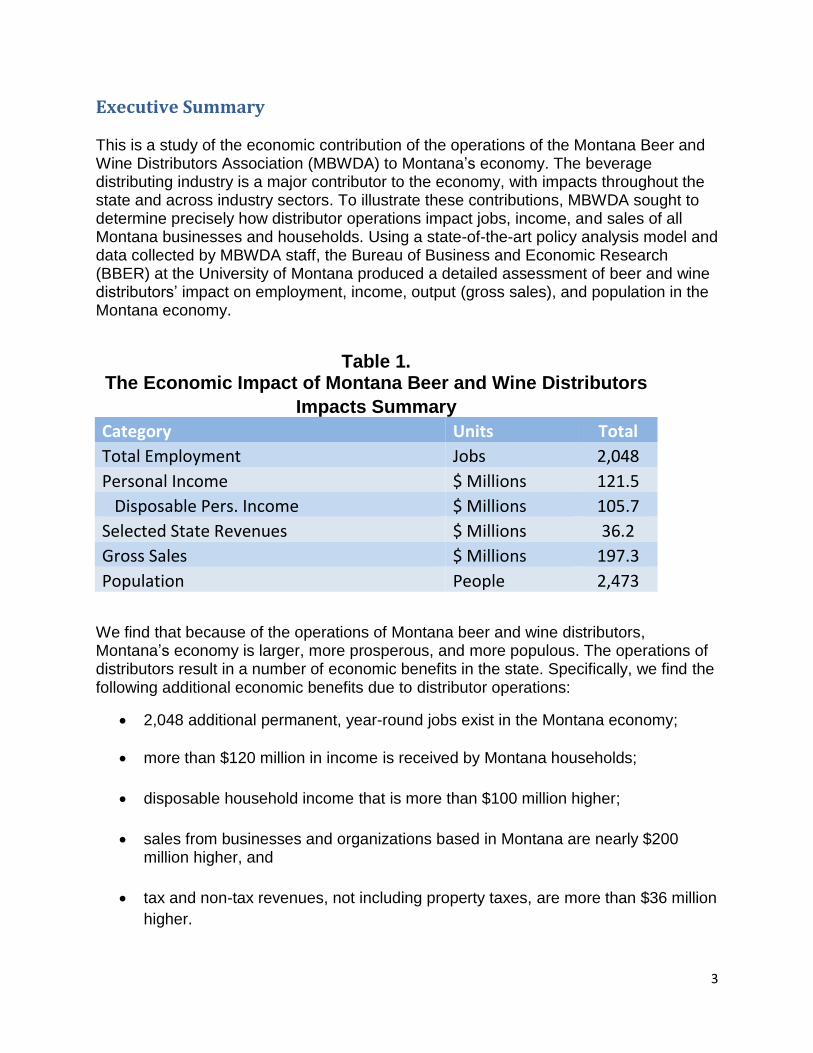
Executive Summary This is a study of the economic contribution of the operations of the Montana Beer and Wine Distributors Association (MBWDA) to Montana’s economy. The beverage distributing industry is a major contributor to the economy, with impacts throughout the state and across industry sectors. To illustrate these contributions, MBWDA sought to determine precisely how distributor operations impact jobs, income, and sales of all Montana businesses and households. Using a state-of-the-art policy analysis model and data collected by MBWDA staff, the Bureau of Business and Economic Research (BBER) at the University of Montana produced a detailed assessment of beer and wine distributors’ impact on employment, income, output (gross sales), and population in the Montana economy.
Table 1. The Economic Impact of Montana Beer and Wine Distributors
Impacts Summary
Category Units Total
Total Employment Jobs 2,048
Personal Income $ Millions 121.5
Disposable Pers. Income $ Millions 105.7
Selected State Revenues $ Millions 36.2
Gross Sales $ Millions 197.3
Population People 2,473
We find that because of the operations of Montana beer and wine distributors, Montana’s economy is larger, more prosperous, and more populous. The operations of distributors result in a number of economic benefits in the state. Specifically, we find the following additional economic benefits due to distributor operations:
2,048 additional permanent, year-round jobs exist in the Montana economy;
more than $120 million in income is received by Montana households;
disposable household income that is more than $100 million higher;
sales from businesses and organizations based in Montana are nearly $200 million higher, and
tax and non-tax revenues, not including property taxes, are more than $36 million
higher.
4
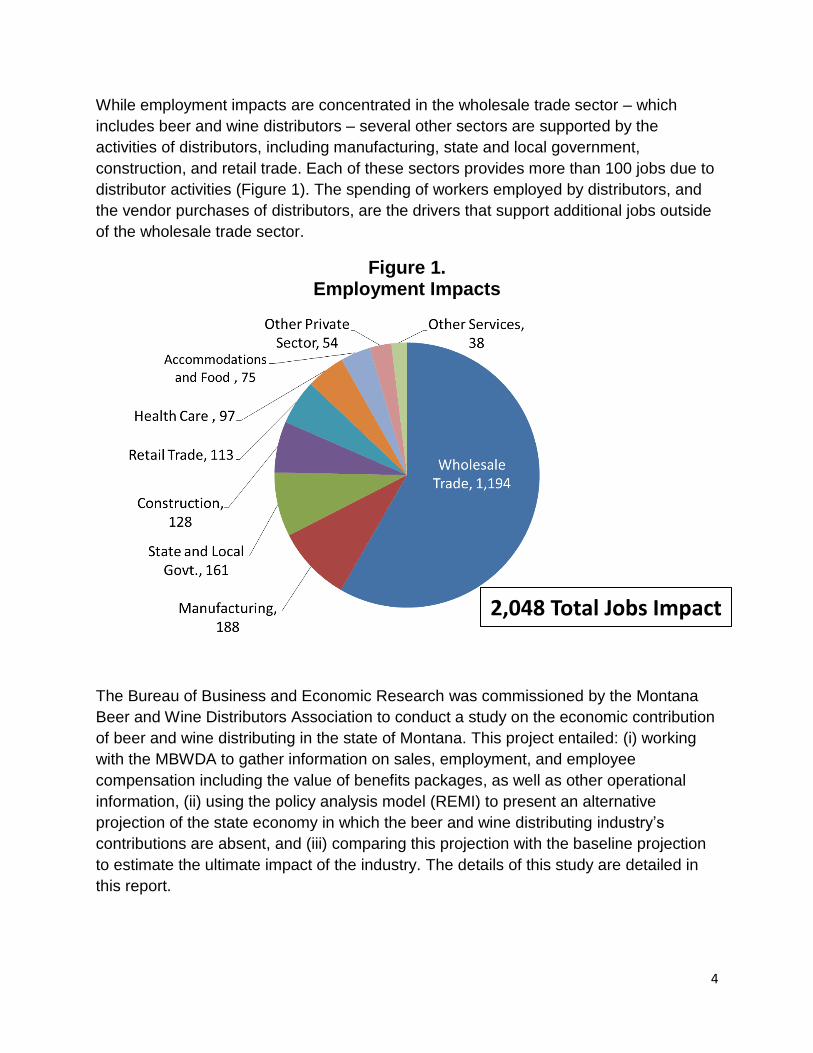
While employment impacts are concentrated in the wholesale trade sector – which
includes beer and wine distributors – several other sectors are supported by the
activities of distributors, including manufacturing, state and local government,
construction, and retail trade. Each of these sectors provides more than 100 jobs due to
distributor activities (Figure 1). The spending of workers employed by distributors, and
the vendor purchases of distributors, are the drivers that support additional jobs outside
of the wholesale trade sector.
Figure 1. Employment Impacts
The Bureau of Business and Economic Research was commissioned by the Montana
Beer and Wine Distributors Association to conduct a study on the economic contribution
of beer and wine distributing in the state of Montana. This project entailed: (i) working
with the MBWDA to gather information on sales, employment, and employee
compensation including the value of benefits packages, as well as other operational
information, (ii) using the policy analysis model (REMI) to present an alternative
projection of the state economy in which the beer and wine distributing industry’s
contributions are absent, and (iii) comparing this projection with the baseline projection
to estimate the ultimate impact of the industry. The details of this study are detailed in
this report.
2,048 Total Jobs Impact

5
1. Policy Analysis with the REMI Model Economic impacts occur as events or activities create new expenditures. New spending that is over and above existing expenditures – and does not simply displace spending elsewhere in the region – not only adds to economic activity, but also induces further spending as the recipients of wages, sales, and tax revenues spend a portion of their income in the local economy. Changes in the path of investment, migration, and prices and wages can occur due to new spending as well.
In order to quantify the economic contribution of Montana’s beer and wine distributors1, this research was designed to answer the question, “What do the activities of distributors contribute to the Montana economy?” To begin the analysis, it was necessary to obtain accurate data on the income flows that the industry itself produces. A brief survey was administered to MBWDA members to quantify the sales, employment, and compensation (including benefits) directly attributable to MBWDA members. In order to quantify the effect that distributor operations have on local beer production, a logistical threshold of Montana craft beer production was put into place. This scenario placed a limit of 2,000 barrels on beer production at individual breweries, assuming that brewers would only produce and self-distribute up to 2,000 barrels without the existence of distributors. The 2011 data from Montana brewers (Sorenson et al. 2012) was used to create this scenario showing less local production of Montana craft beer in the “No Distributors” projection of the economy. The basic tool used in this study to assess the economic contribution of Montana beer and wine distributors is an economic model, calibrated to represent the interactions in the Montana economy, leased from Regional Economic Models, Inc (REMI). The REMI model is one of the best known and most respected analytical tools in the policy analysis arena and has been used for numerous previous studies and peer-reviewed articles in scholarly journals. It is a state-of-the-art econometric forecasting model that incorporates dynamic feedbacks between economic and demographic variables. The REMI model forecasts employment, income, expenditures, and populations for counties and regions based on a model containing over 100 stochastic and dynamic relationships as well as a number of identities. More information on of the underlying approach, design and operation of the model can be found in Treyz (1980 and 1993) and Treyz et al. (1991).
The model used in this study groups the state economy into five regions: Northwest, Southwest, North Central, South Central, and Eastern. It explicitly recognizes trade
1 For the purposes of this report, only data from distributors that are members of MBWDA were collected.
MBWDA members represent the vast majority of beer and wine distribution in the state. In 2012, these firms paid 97 percent of the taxes paid on beer distribution and 85 percent of the taxes paid on wine distribution. In this report the terms “MBWDA”, “MBWDA distributors”, “MBWDA members”, “distributors”, and “Montana beer and wine distributors” are used interchangeably. While MBWDA members represent the vast majority of economic activity in the industry, the impacts presented are conservative measures of the full impacts of the industry on the state economy.

6
flows that exist between these regions, as well as between the regions and the rest of the world. Statewide impacts reported here represent the totals for the five regions. The definition of the regions is shown in Figure 2 below.
Figure 3 is a graphical depiction of the research design and model used to derive the results of this study. First, a baseline for the economy including the operations of distributors is produced using the model. The model is then used a second time, with identical inputs – except that in this alternative scenario, the activity associated with distributors is removed from the economy. Thus, the operations of distributors are an economic stimulus that has produced a more robust state economy. This reflects the addition of the production, employment, and expenditures associated with these distributors, and also how the rest of the economy reacts to those changes. The difference between the baseline and alternative scenarios of the economy represents the economic impact of Montana’s beer and wine distributors.
Figure 2. Economic Regions

7
Figure 3. Policy Analysis with the REMI Model
The model utilizes historical data on production, prices, trade flows, migration, and technological change to calibrate the relationship between five basic blocks of the regional economy as depicted in Figure 4: (1) output (gross sales), (2) labor and capital demand, (3) population and labor force, (4) wages, prices, & production costs, and (5) market shares. The changes in production, labor demand and intermediate demand caused by the operations of the MBWDA distributors causes these blocks of the economy to react and adjust to a new equilibrium. As described above, the difference between the baseline and the alternate scenario is the ultimate impact of distributor activities.

8
Figure 4.
The essential philosophy of the model is that regions throughout the country compete for investment, jobs, and people. When events occur in a region, they set off a series of economic events that cause financial flows toward better investment and production opportunities, followed by a flow of workers and households toward employment opportunities and higher wages. The model embodies an 82-sector input-output matrix that describes the technological interdependence of production sectors of the economy, as well as extensive trade and capital flow data to determine the share of each sector’s demand that can be met by local production.

9
2. Distributor Operations Montana’s beer and wine distributors are a pillar of the three-tiered system of state based regulations on alcoholic beverage production, distribution and retail sales, which came about in the United States after the repeal of prohibition in 1933. These distributors have a major impact on the state and local economies in which they operate. However, their important role as an employer and a contributor to our economic well-being is not well understood by many. Beer and wine distributors are ever-present in the state, traveling within and between our communities to deliver products. While distributors are integral in the beer and wine supply chain, their trucks and equipment are heavily branded with their clients’ logos rather than their own. Therefore, the distributors themselves and their economic contributions are not obvious to the general public. The statewide data collected by MBWDA for this analysis showed that in 2012 MBWDA members accounted for:
$356,009,531 in gross sales,
1,173 beverage distribution jobs, and
$57,642,865 in employee compensation (including benefits).
In addition to the sales, jobs, and compensation generated by MBWDA distributors, it is worth noting that these firms paid beer excise taxes of $3.9 million and wine excise taxes of $2.9 million to the State of Montana for 2012.
The direct financial flows from beer and wine distributing were dispersed among the five economic regions of the state. Figures 5, 6, and 7 show the level of direct sales, employment, and compensation from each region during 2012.

10
Figure 5. Gross Sales by Region
Figure 6.
Employment by Region

11
Figure 7.
Compensation by Region
12
3. The Economic Impact of Distributor Operations Without the operations of Montana’s distributors, the state economy would look much different. The financial flows described above would not be present and the choice and variety offered to consumers would be significantly diminished.
The impacts in this section refer to the difference between the baseline economy that includes distributor operations, and the alternative economy with the economic activities of distributors removed. The alternative simulation represents a new “resting point” for the Montana economy without the economic impacts of distributors.
Impacts Summary
This study clearly shows that because of the operations of Montana’s beer and wine distributors, the Montana economy is larger, more prosperous, and more populous. Taking into account the interactions between industry sectors and geographic regions, Montana’s beer and wine distributors produce significant net benefits to the Montana economy. Distributor operations result in the following ultimate economic impacts in the state:
2,048 jobs, concentrated in the wholesale trade sector, but including jobs in a wide range of industries;
more than $120 million additional income received by Montana households;
disposable household income that is more than $100 million higher;
sales from businesses and organizations based in Montana that are nearly $200 million higher, and
Montana tax and non-tax revenues – not including property taxes – that are more
than $36 million higher.
13
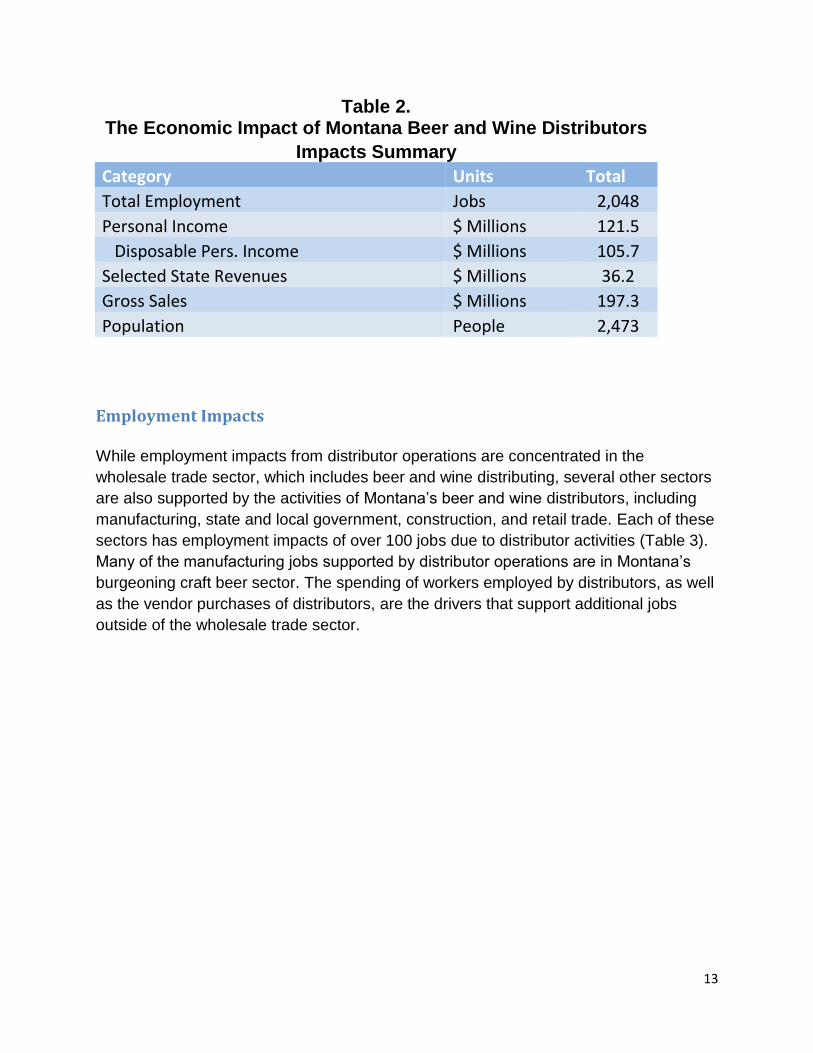
Table 2. The Economic Impact of Montana Beer and Wine Distributors
Impacts Summary
Category Units Total
Total Employment Jobs 2,048
Personal Income $ Millions 121.5
Disposable Pers. Income $ Millions 105.7
Selected State Revenues $ Millions 36.2
Gross Sales $ Millions 197.3
Population People 2,473
Employment Impacts
While employment impacts from distributor operations are concentrated in the
wholesale trade sector, which includes beer and wine distributing, several other sectors
are also supported by the activities of Montana’s beer and wine distributors, including
manufacturing, state and local government, construction, and retail trade. Each of these
sectors has employment impacts of over 100 jobs due to distributor activities (Table 3).
Many of the manufacturing jobs supported by distributor operations are in Montana’s
burgeoning craft beer sector. The spending of workers employed by distributors, as well
as the vendor purchases of distributors, are the drivers that support additional jobs
outside of the wholesale trade sector.

14
Table 3.
Employment Impacts
Industry Jobs Impact
Construction 128
Manufacturing 188
Wholesale Trade 1,194
Retail Trade 113
Health Care and Social Assistance 97
Accommodation and Food Services 75
Other Services, except Public Administration 38
Other Private Sector 54
State Government and Local Government 161
TOTAL 2,048
Personal Income Impacts The operations of Montana’s distributors clearly lead to more income flowing to Montana households, which is detailed in Table 4. Total wage and salary disbursements to Montana employees are nearly $80 million higher due to the activities of distributors. Furthermore, adding the value of benefits packages and business owners’ income results in additional earnings of $110.4 million due to distributor operations.
Other types of income are impacted by distributor operations as well, including induced income of $16.3 million in dividends, interest, and rental income. Finally, disposable personal income, or the income to Montana households net of taxes, is $105.7 higher annually due to the operations of Montana distributors.

15
Table 4.
Personal Income Impacts ($ Millions)
Category Total
Total Earnings by Place of Work 110.4
Total Wage and Salary Disbursements 79.7
Supplements to Wages and Salaries 22.3
Employer contributions for employee pension and insurance funds 14.9
Employer contributions for government social insurance 7.4
Proprietors' income with inventory valuation and capital consumption adjustments 9.8
Less: Contributions for government social insurance 16.0
Employee and self-employed contributions for government social insurance 8.5
Employer contributions for government social insurance 7.4
Plus: Adjustment for residence 0.4
Gross In 2.9
Gross Out 2.5
Equals: Net earnings by place of residence 99.4
Plus: Rental, interest, and dividend income 16.3
Plus: Personal current transfer receipts 5.7
Equals: Personal Income 121.5
Less: Personal current taxes 15.8
Equals: Disposable personal income 105.7

16
Gross Sales Impacts The operations of Montana distributors have a positive effect on gross sales of businesses not only in the Wholesale Trade sector, but across a broad range of other sectors of the Montana economy as well (Figure 8).
Figure 8. Gross Sales Impacts, $ Millions
Wholesale Trade businesses in Montana have $102.3 million more in sales volume thanks to the operations of the beer and wine distributing industry. Furthermore, the Manufacturing sector in turn has an impact of $25 million thanks to distributor activities. The large impact on manufacturing is due in part to the close relationship between manufacturing and distributing locally produced beer and wine. Working with distributors allows local producers to get more of their product to retailers without the logistical constraints of self-distributing.

17
Compensation Impacts Wages and salaries paid to Montana workers are higher by $80 million per year in an economy with beer and wine distributing activities, and when benefits are added to that, the additional compensation is more than $100 million annually. By adding in income of proprietors and the self-employed, that figure adds up to an impact of more than $110 million, thanks to operations of Montana distributors. The additional jobs supported by the beer and wine distributing sector also have relatively high earnings of $53,921 per job.
Table 5.
Compensation Impacts
Category Units Impact
Wages and Salaries $ Millions 79.7
Compensation (including benefits) $ Millions 101.0
Earnings $ Millions 110.4
Earnings per Job $ Dollars 53,921
Population Impacts An economy with beer and wine distribution presents job opportunities that can be expected to attract new Montana residents and a net increase in population. These population impacts can either be due to workers coming from outside of Montana’s borders seeking economic opportunities, or by Montana retaining residents due to the larger economy afforded by a scenario “with” versus “without” beer and wine distributing.
Table 6. Population Impacts
Age Cohort Population Increase
Ages 0-14 652
Ages 15-24 297
Ages 25-64 1,426
Ages 65+ 97
TOTAL 2,472

18
The population impact is mainly in the working age group of 25-64 with 1,426 people. Additionally, the activities of MBWDA distributors have a population impact of 97 people over age 65, 297 people ages 15-24, and another 652 that are age 14 or younger (Table 6). New Montana residents attributable to the beverage distributing sector tend to be in the younger age cohorts. Workers migrating for job opportunities are often younger, and these workers and often bring children with them.
State Revenue Impacts
Beer and wine distributors clearly have an impact on governments as well as other business sectors. The larger and more populous economy due to distributor operations generates a larger tax base. Table 7 includes some of the additional revenues that are generated in a Montana economy that includes the operations of beer and wine distributors.
Table 7.
Selected State Revenue Impacts, $ Millions
Category Impact
Intergovernmental Revenue 6.8
Selective Sales Tax 2.0
License Taxes 1.0
Individual Income Tax 4.8
Corporate Income Tax 0.7
Other Taxes 3.4
Beer and Wine Excise Tax 6.8
Current Charges 2.7
Miscellaneous General Revenue 2.0
Insurance Trust Revenue 6.0
TOTAL 36.2

19
4. Summary and Conclusion
This study set out to evaluate the economic impact of Montana’s beer and wine distributors. The Bureau of Business and Economic Research (BBER) of the University of Montana School of Business Administration was commissioned by the Montana Beer and Wine Distributor Association (MBWDA) to undertake this task.
We found that the activities of Montana distributors have created a more prosperous Montana economy with more gross sales, jobs, and compensation than a Montana economy without these firms. Distributor operations cause direct and indirect impacts through paying wages and salaries and by stimulating increased purchases between vendors. The value added to their products as they move through the supply chain from wholesaler to retailer further stimulates the economy. Finally, induced effects are generated by the new jobs and personal income gains attributable to distributor operations, leading to more goods and services being purchased from all kinds of businesses throughout the state.
Our study approach was to look at two scenarios of the Montana economy – one scenario that includes the operations of distributors, and another scenario that removes these activities through the use of an economic impact modeling software package.
By looking at the difference in the two economic scenarios, we found the following economic impacts due to Montana distributor operations:
2,048 additional permanent, year-round jobs exist in the Montana economy;
average earnings for these additional jobs of $53,921 per year;
more than $120 million additional income is received by Montana households;
disposable household income that is more than $100 million higher;
sales from businesses and organizations based in Montana are nearly $200 million higher, and
tax and non-tax revenues, not including property taxes, are more than $36 million
higher.
These measures all point to the importance of the beer and wine distributing sector to
the Montana economy. In terms of jobs, income, sales, and revenue to state
government, the economic impacts of this sector are evident across industries and
among regions of the state.

20
5. References
Sorenson, C.B., T.A. Morgan, S. Furniss. 2012. The Economic Impact of Craft Brewing in Montana. Montana Business Quarterly, Vol. 50, No. 4, winter 2012.
Treyz, G.I. 1993. Regional Economic Modeling: A Systematic Approach to Economic Forecasting and Policy Analysis. Norwell: Kluwer Academic Publishers.
Treyz, G.I. 1980. Design of a Multiregional Policy Analysis Model. Journal of Regional Science, Volume 20, Issue 2, pp. 191-206.
Treyz, G.I., D.S. Rickman, G. Shao. 1991. The REMI Economic-Demographic Forecasting and Simulation Model. International Regional Science Review, Volume 14, pp. 221-253.