the economic effects of the asian tsunami on the “tear ... · pdf filethe economic...
TRANSCRIPT

The Economic Effects of the Asian Tsunami on the “Tear Drop in the Indian Ocean”: A General Equilibrium
Analysis1
By
Jayatilleke S Bandara
And Athula Naranpanawa
Griffith Business School Griffith University, Nathan Campus
Nathan Australia, QLD 4111
(email: [email protected])
May 2005
(Draft Only, Not for Quotation)
1 This paper is based on an on-going research and, therefore, it is preliminary and uncompleted. Comments are very much appreciated. We thank Dr Mark Horridge for his valuable advice.
1

The Economic Effects of the Asian Tsunami on the “Tear Drop in the Indian Ocean”: A General Equilibrium Analysis
By
Jayatilleke S Bandara
And Athula Naranpanawa
1. Introduction
Sri Lanka was once known as “The Pearl of the Orient”, “The Resplendent Isle”, “The
Garden of Aden” and “Paradise Isle”. It had also been known as “The Tear Drop in
the Indian Ocean”. It has literally become the teardrop in the Indian Ocean since the
Boxing Day tsunami, 26 December 2004. It is the second worst affected country by
the Indian Ocean tsunami (IOT) in absolute terms after Indonesia and the most
affected country in relative terms of per capita deaths, missing and displaced people.
In addition to the damages to public infrastructure and owner-occupied houses, some
sectors of the economy such as fishing and tourism have been severely affected. The
international community has promised to provide a massive amount of foreign aid to
reconstruct the country in addition to immediate relief efforts such as cleaning the
affected areas and providing food, clothing, shelter and medicine.
Although it is difficult to evaluate the cost of lives, missing people and psychological
trauma, it is possible to assess preliminary damages and financial needs to reconstruct
the countries affected by the IOT. The main countries affected by the IOT have
already been prepared these assessments in collaboration with international
community (see for example, Central Government of Indonesia, 2005 for Indonesia
and ADB, et al, 2005 for Sri Lanka). Although these reports have been prepared to
estimate preliminary damages, they have not paid much attention to the direct and
indirect economic effects of the tsunami and the demand effects of re-construction aid
packages on economies such as Indonesia and Sri Lanka within an economy-wide
framework. As the policy analysts have already indicated, the negative effects of IOT
will largely be offset by the positive effects of reconstruction activities. For example,
in its recently released annual report for 2004, the Central Bank of Sri Lanka has
observed this as follows:
2
“Economic growth in 2005 has been revised downwards by about 0.5 – 1.0 per cent
from the original estimate of 6.0 per cent, mainly due to disruptions to the fisheries
and tourism sectors. However, the negative impact of these two sectors will largely be
offset by the extensive reconstruction and rehabilitation activities planned for 2005.”
(Central Bank of Sri Lanka, 2005, p.4)
The positive demand stimulation effects may also pose some challenges to the
macroeconomic management of economies. As indicated in a recent IMF “World
Economic Outlook, April 2005”, an increase in foreign aid and expenditure in the
construction sector may cause a challenge in terms of macroeconomic management
(IMF, 2005, p.14). A CGE model is ideally suited to capture the negative effects of
IOT and the demand effects of reconstruction package together. In the past, single
country CGE models have been used to examine the effects of natural disasters and
diseases (see for example, Adams, et al, 2002, Horridge, et al, 2003 and Wittwer, et
al, 2003). The main objective of this study, therefore, to attempt not only to examine
the negative effects of the IOT but also to examine the possible effects of foreign aid
on the Sri Lankan economy using a computable general equilibrium (CGE) model of
the Sri Lankan economy. The next section of this paper provides a background for the
paper. Section 3 provides a brief overview of the Sri Lankan CGE model. While
section 4 describes the design of simulation experiments with the model, Section 5
analyses the results of policy simulations. The last section is devoted to the
concluding remarks.
2. The Asian Tsunami and Sri Lanka
A massive earthquake of a magnitude of 9.0 on the Richter scale occurred off the east
coast of Sumatra just before 8.00am local time (around 7.00am Sri Lankan time) on
26 December 2004. This triggered giant tidal waves that caused one of the worst
natural disasters in the recent history. At least eleven countries in the Indian Ocean
were affected by the Tsunami. Out of these eleven countries, Indonesia, Sri Lanka,
India, Maldives and Thailand have been the most affected countries. According to
reports, more than a quarter of a million dead or missing and more than a million have
been displaced in the world. Five million people have been directly and indirectly
affected by the IOT (see Table 1 for details). In addition to the human toll, a large
3
number of houses, hotels, schools and infrastructure were destroyed by the tsunami.
The human costs and the psychological trauma cannot be measured. The preliminary
costs of damages to five of the worst affected countries and financial needs to rebuild
these countries have been estimated. The international organisations such as the ADB,
World Bank and IMF and other donor countries have already promised to provide
more than US $ 5 billion worth of foreign aid (see Table 2).
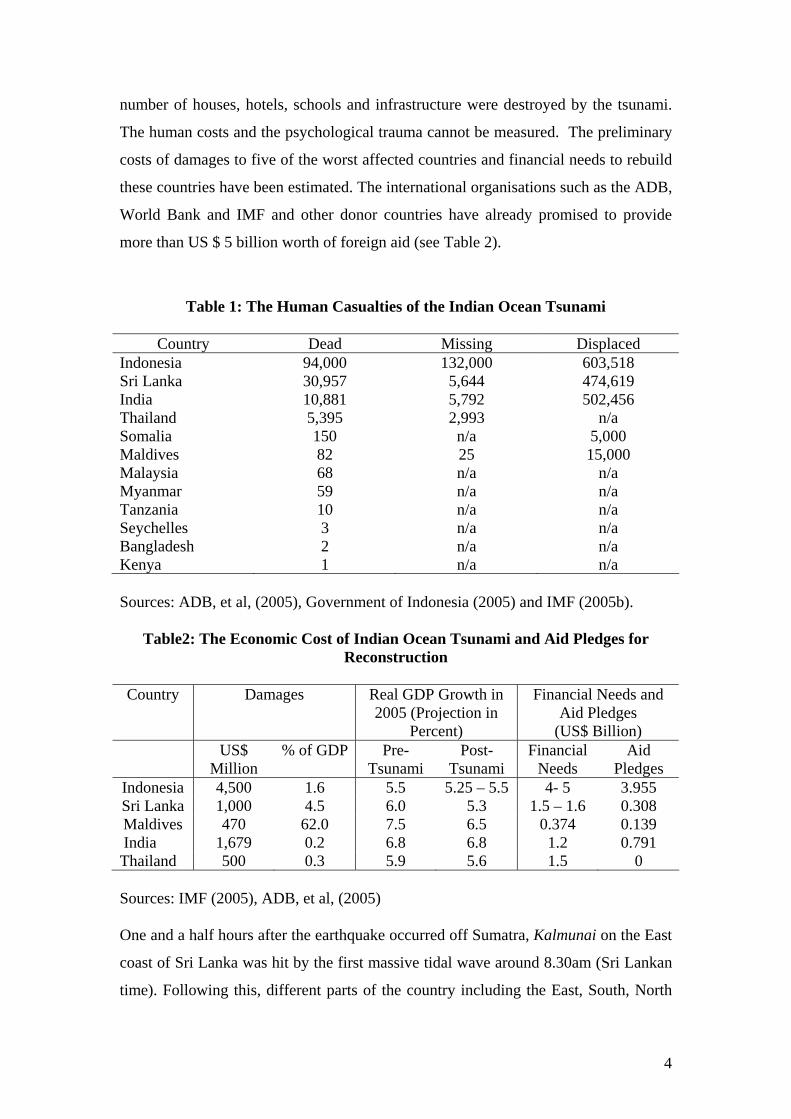
Table 1: The Human Casualties of the Indian Ocean Tsunami
Country Dead Missing Displaced Indonesia 94,000 132,000 603,518 Sri Lanka 30,957 5,644 474,619 India 10,881 5,792 502,456 Thailand 5,395 2,993 n/a Somalia 150 n/a 5,000 Maldives 82 25 15,000 Malaysia 68 n/a n/a Myanmar 59 n/a n/a Tanzania 10 n/a n/a Seychelles 3 n/a n/a Bangladesh 2 n/a n/a Kenya 1 n/a n/a Sources: ADB, et al, (2005), Government of Indonesia (2005) and IMF (2005b).
Table2: The Economic Cost of Indian Ocean Tsunami and Aid Pledges for Reconstruction
Country Damages Real GDP Growth in
2005 (Projection in Percent)
Financial Needs and Aid Pledges
(US$ Billion) US$
Million % of GDP Pre-
Tsunami Post-
Tsunami Financial
Needs Aid
Pledges Indonesia 4,500 1.6 5.5 5.25 – 5.5 4- 5 3.955 Sri Lanka 1,000 4.5 6.0 5.3 1.5 – 1.6 0.308 Maldives 470 62.0 7.5 6.5 0.374 0.139 India 1,679 0.2 6.8 6.8 1.2 0.791 Thailand 500 0.3 5.9 5.6 1.5 0 Sources: IMF (2005), ADB, et al, (2005) One and a half hours after the earthquake occurred off Sumatra, Kalmunai on the East
coast of Sri Lanka was hit by the first massive tidal wave around 8.30am (Sri Lankan
time). Following this, different parts of the country including the East, South, North
4

5
and the West of the island were hit by the IOT between 8.27am and 10.30am. As
shown in Figure 1, more than two thirds or 1000 km of the coastal line of the island
were severely damaged by the IOT. As shown by Figures 2 and 3 nearly 31,000
people have lost their lives, over 5000 people are reported to be missing and more
than half a million people were displaced. More than one million people were directly
or indirectly affected. These figures also show the district-wise distribution of death
and missing people. Southern and Eastern provinces have been the worst affected
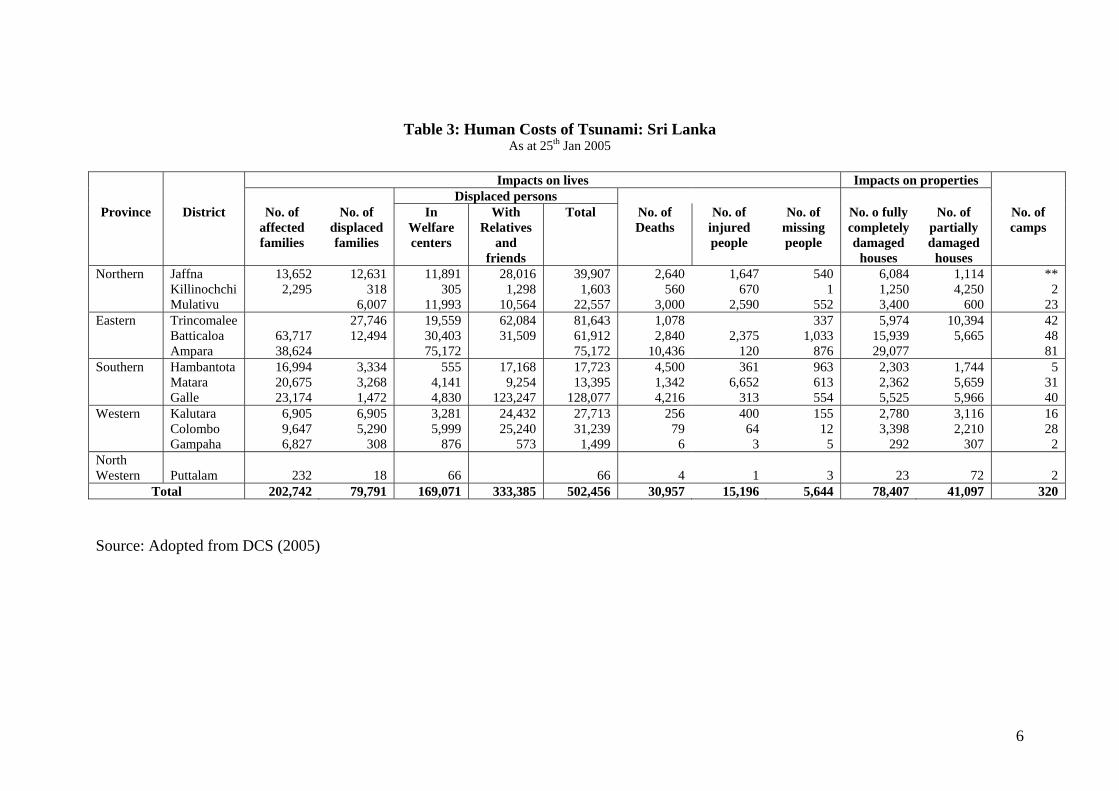
areas. Table 3 further demonstrates the district-wise human cost of the economy.
Immediately after the IOT international donor organisations have prepared a report on
“preliminary damage and needs assessment” as a basis for the 2005 post-tsunami
recovery program in Sri Lanka (see ADB, et al, 2005). Following a methodology
developed by the United Nations Economic Commission for Latin America and the
Caribbean (UN-ECLAC) for estimating the socio-economic and environmental
impacts of disasters, this study has estimated asset losses, output losses, and the
overall macroeconomic and fiscal effects. It has also estimated financial needs for the
reconstruction program. Table 4 shows details of asset losses and financial needs
reported in the study. According to Table 4, while the total damage of the IOT in Sri
Lanka is estimated to be about $1 billion or 4.5 percent of Sri Lankan GDP, the total
financial needs are estimated to be between $1.5 – 1.6 billion or 7.0 – 7.3 percent of
GDP (Note that these numbers are different from other Sri Lankan sources. For
example, the Central Bank of Sri Lanka (2005) notes that the total amount of financial
needs is around $1.8 billion and Tittawella (2005), Chairman of TAFREN – Task
Force for Rebuilding the Nation, notes that the total amount of financial needs is
about $2-2.2 billion). Although the early estimate of reconstruction costs provided by
the Sri Lankan sources was around $3.5 billion, multilateral donor organisations have
downgraded this figure to around $1.5 - $1.6 billion. In terms of output losses, the
most affected sectors are fishing and tourism. According to this study the economic
growth of Sri Lanka in 2005 is expected to slowdown by about 1 percent. The Central
Bank of Sri Lanka (2005) and the IMF (2005a) have also indicated that the Sri
Lankan economic growth rate is expected to slowdown by a similar percentage in
2005. In the present study we attempt to examine the effects of IOT and the recovery
package on the Sri Lankan economy within an economy-wide framework.
6
Table 3: Human Costs of Tsunami: Sri Lanka As at 25th Jan 2005
Impacts on lives Impacts on properties Displaced persons
Province District No. of affected families
No. of displaced families
In Welfare centers
With Relatives
and friends
Total No. of Deaths
No. of injured people
No. of missing people
No. o fully completely damaged
houses
No. of partially damaged
houses
No. of camps
Northern Jaffna Killinochchi Mulativu
13,652 2,295
12,631 318
6,007
11,891 305
11,993
28,016 1,298
10,564
39,907 1,603
22,557
2,640 560
3,000
1,647 670
2,590
540 1
552
6,084 1,250 3,400
1,114 4,250
600
** 2
23 Eastern Trincomalee
Batticaloa Ampara
63,717 38,624
27,746 12,494
19,559 30,403 75,172
62,084 31,509
81,643 61,912 75,172
1,078 2,840
10,436
2,375
120
337 1,033
876
5,974 15,939 29,077
10,394 5,665
42 48 81
Southern Hambantota Matara Galle
16,994 20,675 23,174
3,334 3,268 1,472
555 4,141 4,830
17,168 9,254
123,247
17,723 13,395
128,077
4,500 1,342 4,216
361 6,652
313
963 613 554
2,303 2,362 5,525
1,744 5,659 5,966
5 31 40
Western Kalutara Colombo Gampaha
6,905 9,647 6,827
6,905 5,290
308
3,281 5,999
876
24,432 25,240
573
27,713 31,239 1,499
256 79
6
400 64
3
155 12
5
2,780 3,398
292
3,116 2,210
307
16 28
2 North Western
Puttalam
232
18
66
66
4
1
3
23
72
2
Total 202,742 79,791 169,071 333,385 502,456 30,957 15,196 5,644 78,407 41,097 320 Source: Adopted from DCS (2005)

Table 4: Preliminary Estimates of Losses and Financing Needs ($ Millions)
Losses Financial Needs Sector Asset
Loss Output Loss****
Short Term
Medium Term
Total Needs
Housing 306-341 - 50 387-437 437-487 Roads 60 - 25 175 200 Water and Sanitation 42 - 64 53 117 Railways 15 - 40 90 130 Education 26 - 13 32 45 Health 60 - 17 67 84 Agriculture* 3 - 2 2 4 Fisheries* 97 200 69 49 118 Tourism* 250 130 130 - 130 Power 10 - 27 40-50 67-77 Environment 10 - 6 12 18 Social Welfare** - - 30 - 30 Excluded Items plus 90 30 120 150 Contingency*** Total ($ Millions, rounded) 970-1,000 330 500 1,000-1,100 1,500-1600
Percent of GDP 4.4-4.6 1.5 7.0-7.3 * Includes estimates from livelihood damages assessment of fishermen, small farmers, and small businesses in tourism totalling $140 million. ** Targeted assistance to vulnerable groups *** Includes items mentioned in the report
**** Refer to 2005 and 2006.
Source: Adopted from ADB, et al (2005)
3. A Brief Overview of the CGE Model of the Sri Lankan Economy
Sri Lanka has a long history of applying CGE models in analysing various issues
related to the economy. The availability of quality data has been one of the main
reasons for this trend. In fact, Sri Lanka is the first developing country for which a
Social Accounting Matrix (SAM) was developed in the early 1970’s (Pyatt and Roe,
1977). This has influenced the wide adoption of CGE framework in economic policy
analysis of the country. De Melo (1978) developed the pioneering CGE model for Sri
Lanka. Since then, several studies have developed CGE models for the Sri Lankan
economy2. Bandara (1989) developed the first CGE model of the Johansen class (with
linearized system of equations) following the ORANI model (Dixon et al, 1982) of 2 See Blitzer & Eckaus (1986); Jayawardena et al, (1987); Bandara (1989); CIE (1992); Herath (1994); Somaratne (1998); Bandara & Coxhead (1999); Kandiah (1999). For a comprehensive survey of CGE applications for the Sri Lankan economy see Bandara (1990).
7

the Australian economy. As an extension to the ORANI tradition of Sri Lankan CGE
modelling Naranpanawa (2003) developed a CGE model for the Sri Lankan economy
to incorporate income distribution and poverty following the IDCGEM model of the
South African economy. We used this model to examine the effects of IOT and the
reconstruction package on the Sri Lankan economy.
The core component of the Sri Lankan CGE model developed by Naranpanawa
(2003) follow the previous CGE models, which were based on the Australian ORANI
model (Dixon, et al, 1982) and the IDCGEM model (Horridge, et al., 1995). Similar
to its predecessors, most of the behavioural equations of the core model of the present
Sri Lankan model are derived on the basis of neo-classical utility maximisation and
profit maximisation assumptions. They:
• Describe household and other final demands for commodities;
• Describe industry demand for primary factors and for intermediate inputs
from domestic and imported sources;
• Ensure zero-pure profit conditions, that is, the prices of commodities reflect
costs of production;
• Ensure market clearance;
• Relate producer prices paid by purchasers;
• Describe income distribution of households;
• Describe government income and expenditure sides and
• Define key macroeconomic identities.
All equations in the model can be grouped into a number of blocks as shown in Table
5 (we do not present technical details of the model since they are similar to any
ORANI type model).
8

Table 5: Main blocks of Equations in the Model Block Equations Block 1:
Demands Industry Inputs
Intermediate inputs (domestic and imported) Primary factors Labour by occupation Production subsidies Block 2:
Final Demands for Commodities
Demand for capital creation Household demands Exports Government demand Block 3:
Zero Pure Profits Conditions
Production Capital creation Importing Exporting Distribution Block 4:
Investment Allocation
Distribution of investment Investment budget constraint Block 5:
Market-Clearing Equations
Domestically produced commodities Imported commodities Primary factors Block 6:
Balance of Trade
Imports Exports Balance of trade Block 7:
Income Distribution
Firm’s income Household income Government income Block 8:
Miscellaneous Equations
9
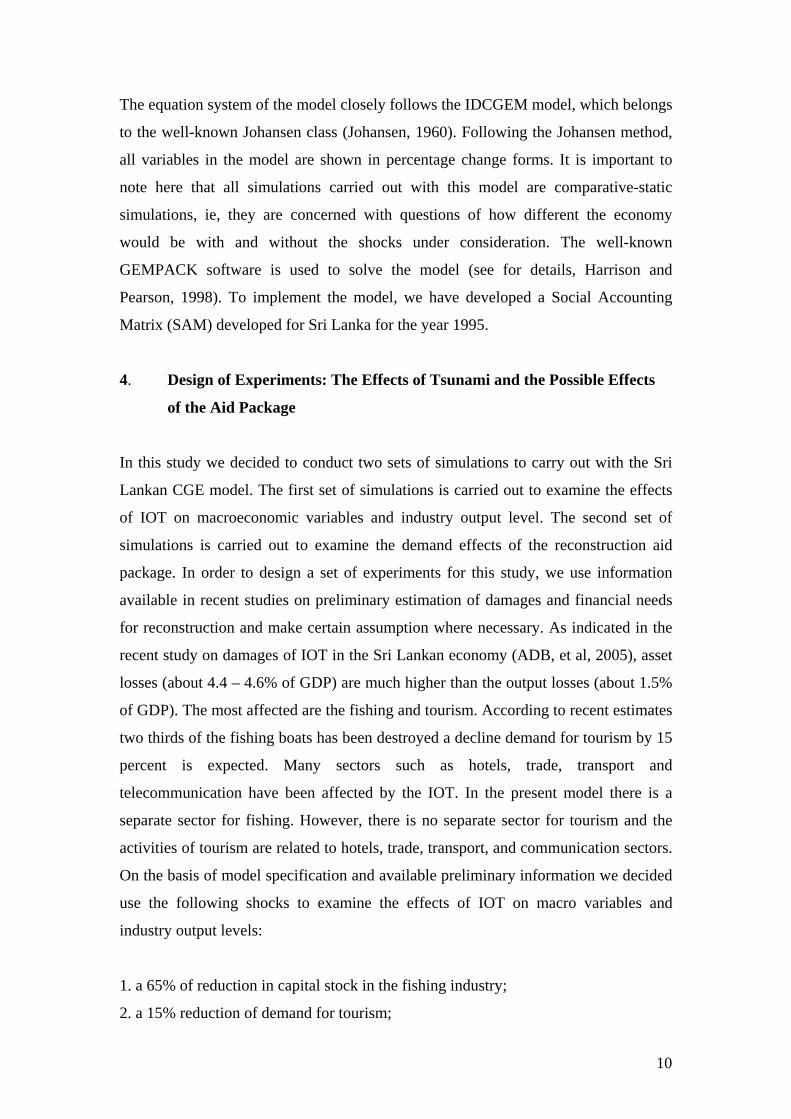
The equation system of the model closely follows the IDCGEM model, which belongs
to the well-known Johansen class (Johansen, 1960). Following the Johansen method,
all variables in the model are shown in percentage change forms. It is important to
note here that all simulations carried out with this model are comparative-static
simulations, ie, they are concerned with questions of how different the economy
would be with and without the shocks under consideration. The well-known
GEMPACK software is used to solve the model (see for details, Harrison and
Pearson, 1998). To implement the model, we have developed a Social Accounting
Matrix (SAM) developed for Sri Lanka for the year 1995.
4. Design of Experiments: The Effects of Tsunami and the Possible Effects
of the Aid Package
In this study we decided to conduct two sets of simulations to carry out with the Sri
Lankan CGE model. The first set of simulations is carried out to examine the effects
of IOT on macroeconomic variables and industry output level. The second set of
simulations is carried out to examine the demand effects of the reconstruction aid
package. In order to design a set of experiments for this study, we use information
available in recent studies on preliminary estimation of damages and financial needs
for reconstruction and make certain assumption where necessary. As indicated in the
recent study on damages of IOT in the Sri Lankan economy (ADB, et al, 2005), asset
losses (about 4.4 – 4.6% of GDP) are much higher than the output losses (about 1.5%
of GDP). The most affected are the fishing and tourism. According to recent estimates
two thirds of the fishing boats has been destroyed a decline demand for tourism by 15
percent is expected. Many sectors such as hotels, trade, transport and
telecommunication have been affected by the IOT. In the present model there is a
separate sector for fishing. However, there is no separate sector for tourism and the
activities of tourism are related to hotels, trade, transport, and communication sectors.
On the basis of model specification and available preliminary information we decided
use the following shocks to examine the effects of IOT on macro variables and
industry output levels:
1. a 65% of reduction in capital stock in the fishing industry;
2. a 15% reduction of demand for tourism;
10
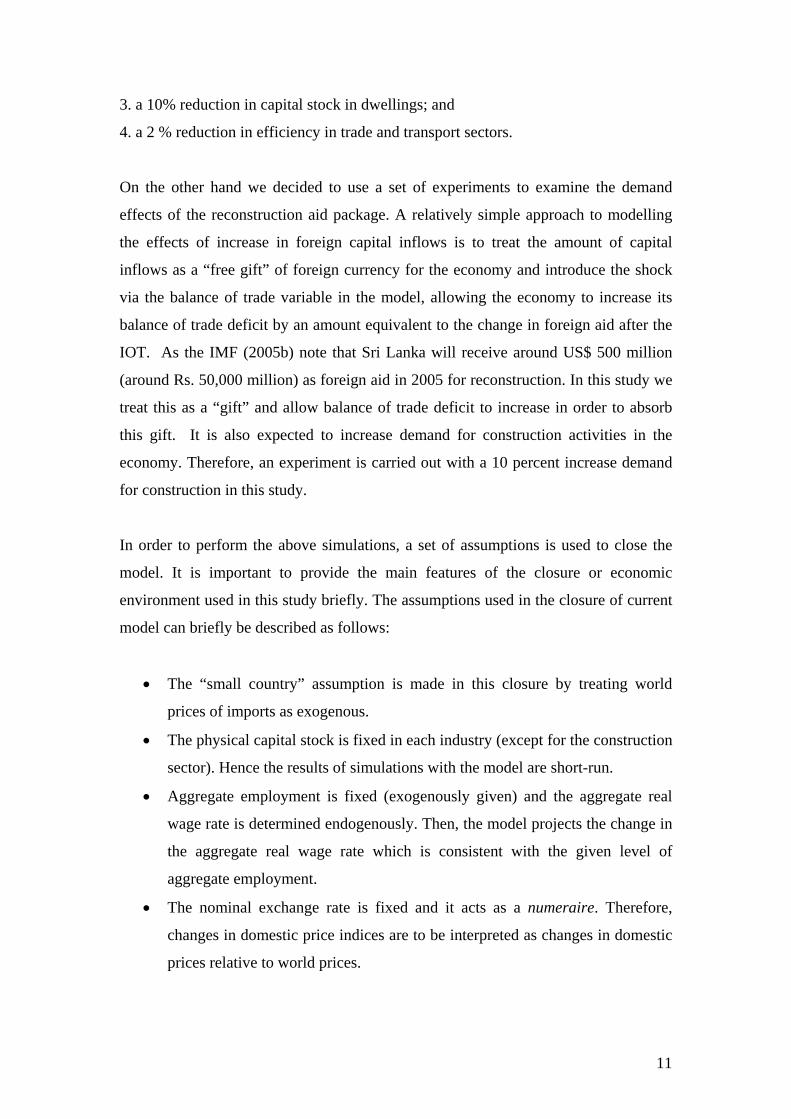
3. a 10% reduction in capital stock in dwellings; and
4. a 2 % reduction in efficiency in trade and transport sectors.
On the other hand we decided to use a set of experiments to examine the demand
effects of the reconstruction aid package. A relatively simple approach to modelling
the effects of increase in foreign capital inflows is to treat the amount of capital
inflows as a “free gift” of foreign currency for the economy and introduce the shock
via the balance of trade variable in the model, allowing the economy to increase its
balance of trade deficit by an amount equivalent to the change in foreign aid after the
IOT. As the IMF (2005b) note that Sri Lanka will receive around US$ 500 million
(around Rs. 50,000 million) as foreign aid in 2005 for reconstruction. In this study we
treat this as a “gift” and allow balance of trade deficit to increase in order to absorb
this gift. It is also expected to increase demand for construction activities in the
economy. Therefore, an experiment is carried out with a 10 percent increase demand
for construction in this study.
In order to perform the above simulations, a set of assumptions is used to close the
model. It is important to provide the main features of the closure or economic
environment used in this study briefly. The assumptions used in the closure of current
model can briefly be described as follows:
• The “small country” assumption is made in this closure by treating world
prices of imports as exogenous.
• The physical capital stock is fixed in each industry (except for the construction
sector). Hence the results of simulations with the model are short-run.
• Aggregate employment is fixed (exogenously given) and the aggregate real
wage rate is determined endogenously. Then, the model projects the change in
the aggregate real wage rate which is consistent with the given level of
aggregate employment.
• The nominal exchange rate is fixed and it acts as a numeraire. Therefore,
changes in domestic price indices are to be interpreted as changes in domestic
prices relative to world prices.
11

• The balance of trade is fixed. Since the change in the balance of trade is set at
zero, the model indicates the change in real absorption, which would be
required to accompany a given level of the balance of trade deficit or surplus.
Hence, real absorption is endogenous in this model.
5. The Results of Simulations
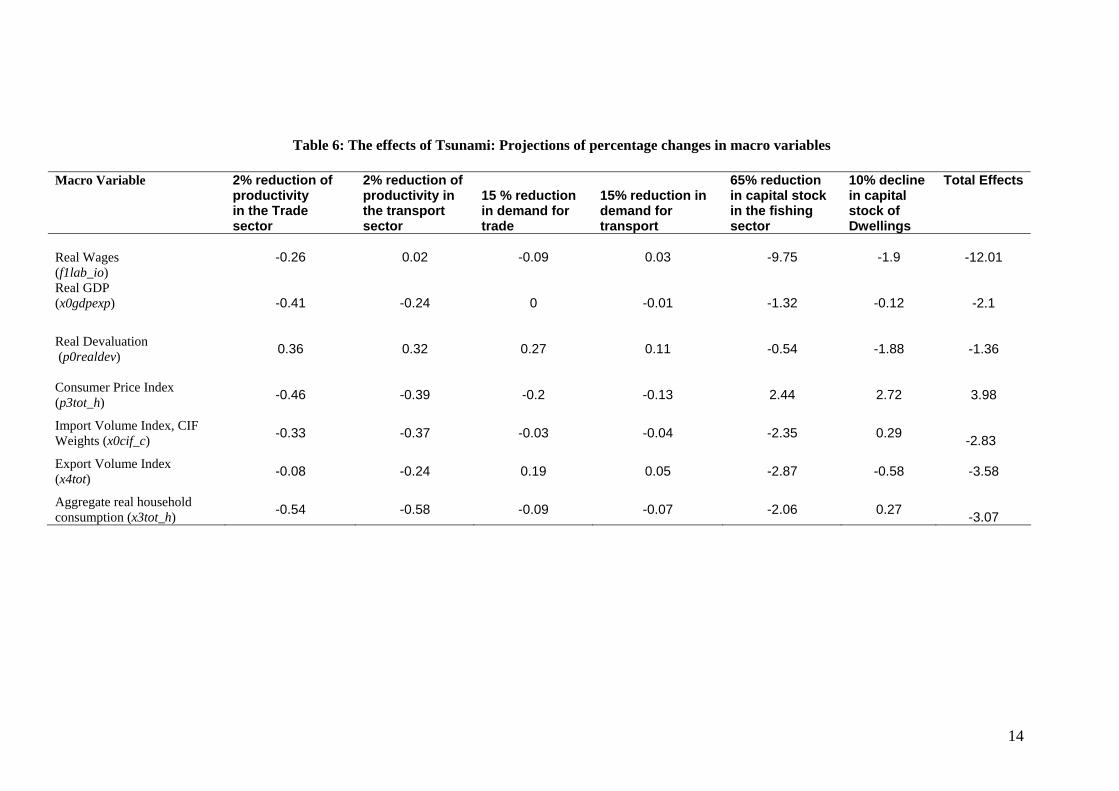
In this section, we present the results of the simulations described in the previous
section. The projected macroeconomic effects of the simulations related to the costs
of IOT are shown in Table 6. The total effects of the IOT are shown in the last column
of Table 6. It shows that the real GDP declines by about 2.1 and the consumer price
index is projected to increase by 3.98 percent. Real aggregate consumption is also
projected to decline around 3 percent. Since the balance of trade is fixed in this
closure, both export and import volumes are expected to decline. It can be observed
from Table 6 that the macroeconomic impacts of IOT are dominated primarily by the
reduction in capital stock in the fishing sector. In line with other assessments of IOT,
the fishing sector is the mostly affected sector in the Sri Lankan economy since two
thirds of the coastal area was hit by the waves. It directly contributes around 2 percent
to GDP in the economy. As expected, the macreconomic impacts demonstrate that
the there are some negative impacts on the economy in terms of real GDP, household
consumption and consumer price index.
Table 7 presents the projected sectoral impact of IOT. The results shown in table 7
indicate that the destruction of the capital stock in the fishing sector is projected to
reduce the output of fishing by about 19 percent. When we look at the projected
changes in output levels of some related sectors such as other agricultures, paper and
paper products, basic metals, and hotels and restaurants, it is clear that their negative
output responses are related to the negative effects of fishing sector.
So far we examined the effects of IOT on the Sri Lankan economy in isolation. As
noted earlier, many donor countries and global organisations pledged a large amount
of foreign aid to Sri Lanka immediately after the IOT. Therefore, many observers
believe that the negative impact of IOT will be offset by the effects of foreign aid
flows. To capture this aspect, the effects of an increase in aid were simulated with the
12

13
model in a relatively simple way via the balance of trade variable giving the economy
a `free’ gift of foreign exchange representing an increase in foreign capital in flows as
noted in the previous section. We have also increased the demand for construction by
10 percent in order to capture increasing activities in the construction sector.
The projections of the above experiments together with the effects of the IOT
experiments on macroeconomic variables are presented in Table 8. This table also
presents projections of combined effects of the IOT and the recovery package. In
contrast to the effects of IOT experiments, an increase in domestic absorption is
required to accommodate a large flow of foreign aid. Since aggregate employment
and capital stocks are fixed in the closure of our model, an increase in imports and /or
a decline in exports are necessary parts of the adjustment of domestic absorption to
accommodate an increase in foreign aid. According to the results shown in Column
nine of Table 8, the aggregate export volume is projected to decline by about 29
percent and the aggregate import volume is projected to increase by 12 percent. The
economy has the capacity to increase its imports relative to its exports as a result of an
increase in foreign aid. The above trade results are reflected in higher domestic
absorption. The increased domestic demand creates upward pressure on domestic
prices as reflected in the projected results of the consumer price index (an increase of
17 percent).
We now turn to the results of sectoral projections of an increase in foreign aid. These
projections are shown in column nine of Table 9. The industry specific results can be
explained by using some key features. Many export industries are projected to affect
and some non-tradeable industries are projected to expand.
14
Table 6: The effects of Tsunami: Projections of percentage changes in macro variables
Macro Variable 2% reduction of
productivity in the Trade sector
2% reduction of productivity in the transport sector
15 % reduction in demand for trade
15% reduction in demand for transport
65% reduction in capital stock in the fishing sector
10% decline in capital stock of Dwellings
Total Effects
Real Wages (f1lab_io)
-0.26 0.02 -0.09 0.03 -9.75 -1.9
-12.01
Real GDP (x0gdpexp) -0.41 -0.24 0 -0.01 -1.32 -0.12
-2.1
Real Devaluation (p0realdev) 0.36 0.32 0.27 0.11 -0.54 -1.88
-1.36
Consumer Price Index (p3tot_h) -0.46 -0.39 -0.2 -0.13 2.44 2.72
3.98
Import Volume Index, CIF Weights (x0cif_c) -0.33 -0.37 -0.03 -0.04 -2.35 0.29
-2.83
Export Volume Index (x4tot) -0.08 -0.24 0.19 0.05 -2.87 -0.58
-3.58
Aggregate real household consumption (x3tot_h) -0.54 -0.58 -0.09 -0.07 -2.06 0.27
-3.07

Table 7 : Projections of percentage changes in output level of different industries Industry
Decrease in productivity in the trade sector by 2%
Decrease in productivity in the transport sector
Decrease in demand for trade by 15%
Decrease in demand for Transport by 15%
Decrease in capital stock in the fishing sector
Decrease in demand capital stock in Dwellings by 10%
Tea Growing 0.32 0.16 0.15 0.08 3.48 -0.92
Rubber Growing 0.21 0.11 0.11 0.05 2.38 -0.66
Coconut Growing
0.09 0.01 0.06 0.03 0.57 -0.94
Paddy -0.06 -0.09 0.01 0 0.18 0.13
Minor Export Crops
0.02 0.01 0.01 0 0.23 -0.01
Tobacco 0.07 0.02 0.05 0.02 0.94 -0.04
Other Agriculture
-0.05 -0.07 0 -0.01 -0.41 0.08
Livestock -0.06 -0.09 0.01 0 -0.05 0.05
Firewood -0.09 -0.12 -0.01 -0.02 -0.2 0.17
Forestry 0.02 -0.02 0.03 0.01 0.24 -0.01
Fisheries 0.06 0.01 0.02 0.01 -18.97 0
Mining and Quarrying
0.15 0.07 0.07 0.02 1.86 -0.07
Tea Processing 0.24 0.07 0.15 0.06 3.38 0.48
Rubber Processing
0.11 0 0.1 0.03 2.31 1.05
Coconut Processing
0.3 0.12 0.19 0.08 5.04 0.91
Milling -0.06 -0.09 0.01 0 0.18 0.13
Food, Beverages and Other 0.03 0 0.02 0.01 -0.22 0
Textiles 0.04 0 0.18 0.07 2.17 -0.03 Garments 0.26 0.14 0.13 0.07 2.93 -0.16
Wood & Wood Products
0.04 0 0.04 0.02 0.89 -0.02
Paper & Paper Products
-0.15 -0.03 0.16 0.09 -15.54 -0.02
Chemicals and Fertilisers
-0.37 -0.46 -0.01 -0.02 -2.45 0.28
Petroleum -0.22 -0.16 0.04 0.02 -4.57 -0.03
Plastic and Rubber Products
0.05 0 0.05 0.02 0.78 0
Non Metalic & Other Mineral Products
0.1 0.03 0.08 0.04 1.3 -0.04
Basic Metal Products
0.35 0.22 0.21 0.09 -7.04 -0.11
15

16
Contd … Fabricated Metal Products
0.07 0 0.08 0.03 1.13 -0.05
Other Manufacturing
0.05 -0.03 0.11 0.05 1.56 -0.02
Electricity, Gas and Water -0.35 -0.12 -0.02 0 0.31 0.06
Construction -0.04 -0.05 0 -0.01 0.16 0.53
Wholesale and Retail Trade
-2.1 0.07 -0.18 0.03 2.41 -0.08
Hotels and Restaurants
-0.47 -0.49 -0.08 -0.07 -3.49 0.12
Transport 0.09 -2.07 0.06 -0.17 1.67 -0.02
Post and Communication
-0.48 -0.57 -0.04 -0.05 0.71 0.43
Banking Insurance and Real Estate
0.19 0.26 0.15 0.07 -16.18 -0.01
Ownership of Dwellings
0 0 0 0 0 -10
Public Administration and Defence
0.04 0.03 0.01 0.01 -0.94 0
Other Personal Services -0.49 -0.74 -0.07 -0.08 -0.28 0.49

Table 8: The combined effects of IOT and recovery package: Projections of percentage changes in macro variables Macro Variable
Combined effects of IOT and recover package
2% decline in productivity in the trade sector
2% decline in productivity in the transport sector
Decrease in demand for trade by 15%
Decrease demand for transport by 15%
Decrease in capital stock in the fishing sector by 65%
Decrease in capital stock in dwellings by 10%
Increase in balance of trade deficit by 10%
Increase in construction demand by 10%
Real Wages (f1lab_io)
-20.68 -0.26 0.02 -0.09 0.03 -9.75 -1.9 -8.33 -0.4
Real GDP (x0gdpexp) 0.29 -0.41 -0.24 0 -0.01 -1.32 -0.12 2.26 0.13
Real Devaluation (p0realdev) -14.58 0.36 0.32 0.27 0.11 -0.54 -1.88 -13.12 -0.11
Consumer Price Index (p3tot_h) 21.51 -0.46 -0.39 -0.2 -0.13 2.44 2.72 17.34 0.19
Import Volume Index, CIF Weights (x0cif_c) 9.42 -0.33 -0.37 -0.03 -0.04 -2.35 0.29 12.32 -0.06
Export Volume Index (x4tot) -25.57 -0.08 -0.24 0.19 0.05 -2.87 -0.58 -21.86 -0.18
Aggregate real household consumption (x3tot_h)
18.3 -0.54 -0.58 -0.09 -0.07 -2.06 0.27 21.07 0.3
17
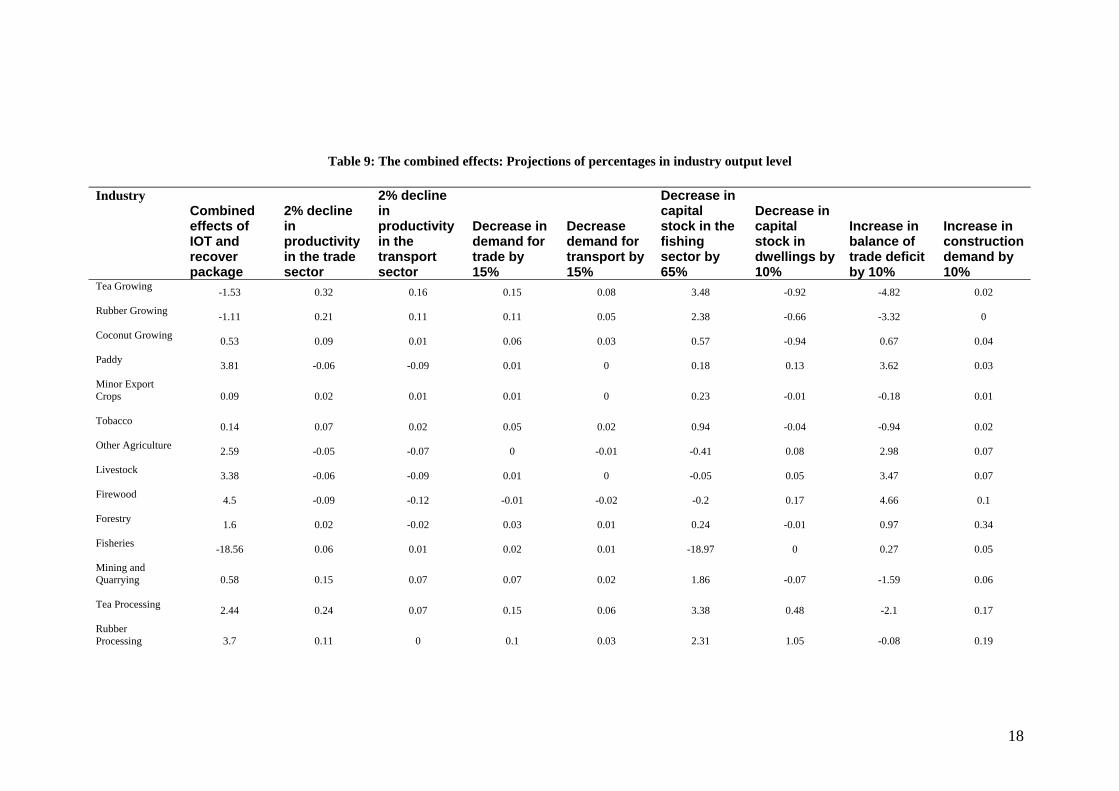
Table 9: The combined effects: Projections of percentages in industry output level Industry
Combined effects of IOT and recover package
2% decline in productivity in the trade sector
2% decline in productivity in the transport sector
Decrease in demand for trade by 15%
Decrease demand for transport by 15%
Decrease in capital stock in the fishing sector by 65%
Decrease in capital stock in dwellings by 10%
Increase in balance of trade deficit by 10%
Increase in construction demand by 10%
Tea Growing -1.53 0.32 0.16 0.15 0.08 3.48 -0.92 -4.82 0.02
Rubber Growing -1.11 0.21 0.11 0.11 0.05 2.38 -0.66 -3.32 0
Coconut Growing 0.53 0.09 0.01 0.06 0.03 0.57 -0.94 0.67 0.04
Paddy 3.81 -0.06 -0.09 0.01 0 0.18 0.13 3.62 0.03
Minor Export Crops
0.09 0.02 0.01 0.01 0 0.23 -0.01 -0.18 0.01
Tobacco 0.14 0.07 0.02 0.05 0.02 0.94 -0.04 -0.94 0.02
Other Agriculture 2.59 -0.05 -0.07 0 -0.01 -0.41 0.08 2.98 0.07
Livestock 3.38 -0.06 -0.09 0.01 0 -0.05 0.05 3.47 0.07
Firewood 4.5 -0.09 -0.12 -0.01 -0.02 -0.2 0.17 4.66 0.1
Forestry 1.6 0.02 -0.02 0.03 0.01 0.24 -0.01 0.97 0.34
Fisheries -18.56 0.06 0.01 0.02 0.01 -18.97 0 0.27 0.05
Mining and Quarrying
0.58 0.15 0.07 0.07 0.02 1.86 -0.07 -1.59 0.06
Tea Processing 2.44 0.24 0.07 0.15 0.06 3.38 0.48 -2.1 0.17
Rubber Processing
3.7 0.11 0 0.1 0.03 2.31 1.05 -0.08 0.19
18

Contd … Coconut Processing
1.61 0.3 0.12 0.19 0.08 5.04 0.91 -5.24 0.2
Milling 3.81 -0.06 -0.09 0.01 0 0.18 0.13 3.62 0.03
Food, Beverages and Other -0.02 0.03 0 0.02 0.01 -0.22 0 0.14 0.02
Textiles 1.55 0.04 0 0.18 0.07 2.17 -0.03 -0.92 0.05 Garments -1.81 0.26 0.14 0.13 0.07 2.93 -0.16 -5.19 0.03
Wood & Wood Products
0.97 0.04 0 0.04 0.02 0.89 -0.02 -0.08 0.07
Paper & Paper Products
-16.58 -0.15 -0.03 0.16 0.09 -15.54 -0.02 0.96 -2.06
Chemicals and Fertilisers
13.31 -0.37 -0.46 -0.01 -0.02 -2.45 0.28 15.77 0.57
Petroleum -7.59 -0.22 -0.16 0.04 0.02 -4.57 -0.03 -1.98 -0.68
Plastic and Rubber Products
0.15 0.05 0 0.05 0.02 0.78 0 -0.78 0.02
Non Metalic & Other Mineral Products
0.09 0.1 0.03 0.08 0.04 1.3 -0.04 -1.61 0.19
Basic Metal Products
-13 0.35 0.22 0.21 0.09 -7.04 -0.11 -8.4 1.68
Fabricated Metal Products
0.24 0.07 0 0.08 0.03 1.13 -0.05 -1.06 0.03
Other Manufacturing
1.42 0.05 -0.03 0.11 0.05 1.56 -0.02 -0.36 0.06
Electricity, Gas and Water 3.7 -0.35 -0.12 -0.02 0 0.31 0.06 3.85 -0.04
Construction 11.14 -0.04 -0.05 0 -0.01 0.16 0.53 1.53 9.03
19

20
Contd … Wholesale and Retail Trade
-1.47 -2.1 0.07 -0.18 0.03 2.41 -0.08 -1.76 0.13
Hotels and Restaurants
13.36 -0.47 -0.49 -0.08 -0.07 -3.49 0.12 17.44 0.39
Transport -0.61 0.09 -2.07 0.06 -0.17 1.67 -0.02 -0.2 0.04
Post and Communication
20.2 -0.48 -0.57 -0.04 -0.05 0.71 0.43 21.38 -1.17
Banking Insurance and Real Estate
-21.51 0.19 0.26 0.15 0.07 -16.18 -0.01 -6.11 0.12
Ownership of Dwellings
-10 0 0 0 0 0 -10 0 0
Public Administration and Defence
-9.33 0.04 0.03 0.01 0.01 -0.94 0 -0.86 -7.62
Other Personal Services 20.79 -0.49 -0.74 -0.07 -0.08 -0.28 0.49 21.91 0.05

6. Concluding Remarks
The results of our study demonstrate how a CGE model can provide some information
on the effects of IOT and on the likely effects of a reconstruction aid package on
tsunami affected economies such as Sri Lanka, India and Indonesia. However, our
results should be used with caution. It is important to note that among other things,
the value of our CGE modelling exercise is limited by the assumptions made, the
magnitudes of shocks (or values use for simulations), quality of the database (SAM
database and the elasticity parameters) used and the closure used in the study.
Particularly, the results should be approached with a sceptical attitude to the database.
Sri Lanka has a poor record in input-output and SAM databases in comparison to
many other developing countries. We developed a SAM database using some
primary information since there are no properly compiled input-output tables or SAM
databases for recent years. Therefore, the results shown in the previous sections
should be treated as an empirical guidance rather than precise values of changes in
different variables.
The results our modelling exercise indicate that it is important to consider the
combine effects of the IOT and the reconstruction package. While the IOT has
produced negative economic effects on the economy, the reconstruction package
would stimulate the economy. These results support the current view expressed in
Central Bank of Sri Lanka (2005) and the IMF (2005b).
21

References
Adams, P.D, Horridge, M. Madden, J. and Wittwer, G. (2002), Drought, Regions and
the Australian Economy Between 2001-02 and 2004-05, on Australia, General
Working Paper No. G-135 December 2002, Centre of Policy Studies and the
Impact Project, Monash University: Melbourne.
ADB (2005a), An Initial Assessment of the Impact of the Earthquake and Tsunami of
December 26, 2004 on South and Southeast Asia”, January 2005, ADB: Manila.
ADB (2005b), Rebuilding Lives After the Tsunami – Special Issues, ADB Review
April 2005.
ADB, JBIC and the World Bank (2005), Sri Lanka: 2005 Post-Tsunami Recovery
Program – Preliminary Damage and Needs Assessment, Monograph, Colombo.
Bandara, J.S. (1989). A Multi Sectoral General Equilibrium Model of the Sri Lankan
Economy with an Application to the Analysis of the Effects of External Shocks,
Unpublished Ph.D. Thesis, School of Economics, Melbourne: La Trobe
University.
Bandara, J.S. (1990). Recent Experience of Computable General Equilibrium
Modelling in Sri Lanka: A Survey, Upanathi, 5(1&2):57-81.
Bandara, J.S. and B. Coxhead (1999). Can Trade Liberalization Have Environmental
Benefits in Developing Country Agriculture? A Sri Lankan Case Study, Journal
of Policy Modeling, 21:349-374.
Blitzer, C.R. and R.S. Eckaus (1986). Modelling energy-economy interactions in
small developing countries: A case study of Sri Lanka , Journal of Policy
Modelling, 8:471-501
Centre For International Economics - CIE (1992), The Composition and Level of
Effective Taxes for Exporting and Import Competing Production in Sri Lanka,
Canberra.
Chong, F. (2005), “Rebuilding challenge begins”, The Australian, Wednesday March
16 2005, p.27.
DCS (2005), Imapct of Tsunami 2004 on Sri Lanka, DCS, Colombo.
De Melo, M.H. (1978). A General Equilibrium Investigation of Agricultural Policies
and Development Strategies: A Case Study of Sri Lanka, Ph.D. Dissertation,
University of Maryland, California.
Dixon, P.B., B. R. Parmenter, J. Sutton and D. P. Vincent (1982). ORANI: A
Multisectoral Model of the Australian Economy, North Holland: Amsterdam.
22

Government of Indonesia (2005), INDONESIA: Preliminary Damage and Loss
Assessment- The December 26, 2004 Natural Disaster, BAPPENAS: Jakarta.
Harrison, W.J. and K.R. Pearson (1998). Documentation of the GEMPACK Software
System, Centre of Policy Studies and Impact Project, Monash University,
Melbourne.
Horridge, J.M., B.R. Parmenter, M. Cameron, R. Joubert, A. Suleman and D. de Jong
(1995). The Macroeconomic, Industrial, Distributional and Regional Effects of
Government Spending Programs in South Africa, Working Paper G109, The
Centre of Policy Studies, Monash University, Melbourne
Horridge, M. Madden, J. and Wittwer, G. (2003), Using a Highly Disaggregated
Multi-Regional Single-Country Model to Analyse the Impacts of the 2002-03
Drought on Australia, General Working Paper No. G-144 October 2003, Centre
of Policy Studies and the Impact Project, Monash University: Melbourne.
HSBC (2005), “Sri Lanka: Every Dark Cloud Seems to Have a `Golden Lining’!!”,
Mimio, 10 January 2005.
IMF (2005a), “Request for Extension of Repurchase Expectations”, IMF: Washington
D.C.:
IMF (2005b) World Economic Outlook - April 2005, IMF: Washington, D.C.
Kandiah, K.(1999). A computable general equilibrium model of the Sri Lankan
economy with applications to analysis of the effects of the financial
liberalisation, Unpublished Ph.D. Thesis, School of Economics, Brisbane:
Griffith University.
Naranpanawa, A. (2003), “Trade and poverty linkage within a general equilibrium
framework: a case study of Sri Lanka”, Proceedings of the PhD conference in
economics and business, University of Western Australia, Perth.
Pyatt, G. and A. R. Roe (1977). Social Accounting for Development Planning with
special References to Sri Lanka, Cambridge University Press: Cambridge.
Somaratne, W.G. (1998). Policy Reforms and the Environment: A General
Equilibrium Analysis of Land degradation in Sri Lanka, Unpublished Ph.D.
Thesis, School of Business, Melbourne: La Trobe University.
Tittawella, M. (2005), “Rebuilding Sri Lanka – Post Tsunami”, Presentation to High
Level Coordinating Meeting held in Manila and organised by the ADB, 18
March, 2005.
23

Wittwer, G., McKirdy, S. and Wilson, R. (2003), Analysing the Economic Impacts of
a Plant Disease Incursion Using a General Equilibrium Approach, Preliminary
Working Paper No. OP-97 October 2003, Centre of Policy Studies and the
Impact Project, Monash University: Melbourne.
24

AdA
Figure 1: Tsunami Affected Areas in Sri Lanka
Source: Adopted from DCS (2005)
25

Figure 2: District-wise Distribution of Tsunami Deaths in Sri Lanka
Source: Adopted from DCS (2005)
26

Figure 3: District-wise Distribution of Number of Displaced People in Sri Lanka
as a Result of IOT
Source: Adopted from DCS (2005)
27