the economic impact at the national level of the … · 2018-04-19 · this report aims to ......
TRANSCRIPT

DISCUSSION DRAFT
The Economic Impact at the National Level of the
Illegal Conversion of Forests for Export-Driven
Industrial Agriculture
Climate Advisers
Natural Capital Advisors
Forest Climate Analytics
Arthur G Blundell, Emily E Harwell, Eduard T Niesten, and Michael S Wolosin
DISCUSSION DRAFT
2
EXECUTIVE SUMMARY
Between 2000-2012, half of all tropical deforestation was the result of illegal
clearing for industrial agriculture (Lawson et al. 2014). This report aims to
characterize the costs of this illegality. While the impacts are widespread, including
global, we focus our analyses on the costs to the countries in which the
deforestation occurs. We hope a broad estimate of financial loss will help convince
forest country actors, like Finance Ministers, of the gains to be made by enforcing
laws and regulations related to land use for industrial agriculture.
Illegal clearing creates losses by undermining a country’s objectives for the
management of its natural resources, like land and forests, which include, inter alia,
promoting:
Economic activity that generates jobs, investment, as well as tax revenue;
Production of timber and non-timber forest products, as well as the
maintenance of ecosystem functions like climate stabilization;
Contribution to the lives and livelihoods of rural people; and,
Protection of the rights of indigenous people, forest-owners, and forest-users.
Governments minimize the risk that these objectives will go unmet by using
legislation, where objectives are framed into policy, which is translated into law, then
elaborated and implemented through regulation. When effective—that is, when
rational, enforced, and otherwise incentivized—regulations serve as countermeasures
against operators pursing private interest counter to national objectives. When this
risk management fails and the ‘rule of law’ is violated, the country’s objectives
are not met, and the ‘common good’ suffers. In this paper we attempt to quantify
the costs of these losses.
DISCUSSION DRAFT
3
First, we provide a general legislative framework governing forest management and a
typology of violations of this ‘rule of law’ (where illegality is defined broadly as
operating without or exceeding authority, and/or evading taxes and fees). While it is
inherently difficult to evaluate the scope of illicit activity like illegal deforestation, it is
even more difficult to quantify the costs associated with this illegality. This is
especially true for costs that do not have observable market values, as in the case of
many environmental and social externalities. For example, it is highly likely that
deforestation disrupts ecosystem function, but quantifying the cost of such disruption
remains an inexact science and attempts to assign a number may risk under-valuing
the severity of impact.
We used global averages to calculate three major classes of loss, noting that we do
not suggest that only impacts that can be quantified are worth acknowledging and
addressing:
Tax evasion: conservatively estimated at ~US$2,300/hectare logged, based on
case studies;
Ecosystem function: ~$1,784/ha/year, based on Costanza et al. (1997)
valuation with the contribution of climate stabilization removed ($233/ha/yr)
because climate stabilization is more of a global good rather than a national
good; and,
Conflict with forest communities: ~$113/ha/year, based on the work of the
Munden Group (de Leon et al. 2013)—this estimate refers only to decreased
agricultural productivity due to conflict, and does not evaluate the costs of
conflict to the government, nor the communities themselves. These other
costs, though un-quantified, are undoubtedly much larger that the simple loss
in production.
We conclude that illegal deforestation costs countries at minimum $4,000/ha.
DISCUSSION DRAFT
4
We then evaluated these costs with case studies from Costa Rica (who, three decades
ago, decided to forego altogether deforestation for all agriculture); Liberia (an
emerging producer of palm oil—and potentially deforestation); and Indonesia and
Brazil—which together comprise more than half of all tropical tree loss. Indeed,
Indonesia is now one of the largest emitters of greenhouse gases globally due to the
widespread use of fires in land clearing, especially on peatlands. In contrast, Brazil
has reversed course and dramatically reduced deforestation, primarily by engaging
supply chains for industrial beef and soy production. In this reversal, Brazil has done
more than any other country to address global climate change.
In summary, we estimate that illegal deforestation for industrial agriculture
globally generated losses of more than $17 billion each year during the early
2000s. It cost Indonesia more than $4.9 billion per year in lost production due to
conflict with communities, lost tax revenue, and lost ecosystem function, not to
mention some share of the more than $16 billion in lost economic activity and
damage to human health from forest fires in 2015, many of which were associated
with land clearing for industrial plantations. Also highly likely but difficult to quantify
are costs associated with decreased investment and development assistance due to
damage to Indonesia’s reputation caused by this illegal use of fire and the
accompanying corruption and other illicit activity, like money laundering. In
contrast, by reducing forest clearing for soy plantations and cattle pastures,
Brazil has prevented many of the losses totaling more than $8.4 billion per year
associated with previous levels of illegal deforestation. We note that these
detrimental environmental and social impacts drove consumer campaigns that
ultimately led to a wave of voluntary corporate zero deforestation commitments in
order to maintain market access. Unaddressed, these severe impacts risk
undermining peace, security, and democracy itself, as agri-business corrupts local
elections, and plantations generate grievance among locals, often fueling violent
conflict.

DISCUSSION DRAFT
5
International carbon markets could provide another major source of income from
forest protection that is excluded above. Even at $5/tonne CO2, forested countries
would lose additional billions of dollars per year if illegal deforestation for agriculture
continues. These costs would be borne by legal and illegal actors alike, if markets
perceive even moderate levels of illegality to suggest the country is too risky or too
corrupt for investment.
While the costs of deforestation are substantial, these costs are rarely borne by the
agricultural operators themselves. Yet if they stop illegal land clearing, then they will
incur the costs of compliance. This ‘conflict of interest’ makes enforcement
necessary. But, the lessons from this paper suggest that while necessary,
enforcement is rarely sufficient; policing is almost impossible when everyone is
violating the law (as was the case in Brazil). Thus, additional incentives are also
necessary. In Costa Rica, for example, positive incentives, especially payments for
environmental services, helped drive change. And, as mentioned above, in Brazil,
consumer-campaigns drove producers to commit to zero-deforestation. Yet in both
cases, most operators still said that without law enforcement, they would have
continued clearing forest for expansion. So in the end, halting illegal forest
conversion requires both enforcement and incentives. Thus, stopping illegal
deforestation is an environmental and an economic issue, as well as an enforcement
issue. We conclude that if forest countries follow the lead of Costa Rica and Brazil
and engage in aggressive campaigns to halt illegal forest conversion for
industrial agriculture, then they would reap major economic benefits and avoid
many of the associated costs outlined herein.

DISCUSSION DRAFT
6
TABLE OF CONTENTS
Executive Summary ............................................................................................................................. 2
Table of Contents ................................................................................................................................ 6
Part 1: Introduction ............................................................................................................................. 7
1.1 Overview ................................................................................................................................................................... 8
1.2 Definition of terms ............................................................................................................................................... 8
Part 2. Legislative Framework Relevant to Forests & Agriculture ........................................... 10
2.1 Why violate the legislative framework? ................................................................................................... 11
2.2 How is the legislative framework violated? ........................................................................................... 12
Part 3: The impact of illegality associated with deforestation & industrial agriculture ..... 17
3.1 Impacts on Financial Capital ......................................................................................................................... 17
3.2 Impacts on Natural Capital ............................................................................................................................ 18
3.3 Impacts on Social/Human Capital .............................................................................................................. 19
3.4 Impacts on Political Capital ........................................................................................................................... 20
Part 4: Overview of costs of illegal deforestation for industrial agriculture ......................... 23
4.1 Financial Capital .................................................................................................................................................. 23
4.2 Natural Capital ..................................................................................................................................................... 24
4.3 Human/Social Capital ....................................................................................................................................... 30
4.4 Political Capital .................................................................................................................................................... 31
4.5 Summary of costs ............................................................................................................................................... 32
Appendix 1: Legislative Framework ............................................................................................... 38
A1.1 National Objectives for Natural Resources, Including Land ........................................................ 39
A1.2 How Illegality Undermines National Objectives for the Resource Sector ............................ 44
DISCUSSION DRAFT
7
A1.3 The Legislative Framework Related to Land Clearing .................................................................... 47
A1.4 The impact of illegality associated with deforestation & industrial agriculture ................ 54
Appendix 2: Costa Rica ..................................................................................................................... 58
Appendix 3: Indonesia ...................................................................................................................... 68
Appendix 4: Brazil ............................................................................................................................. 95
Appendix 5: Liberia ........................................................................................................................ 111
Literature Cited ............................................................................................................................... 122
PART 1: INTRODUCTION
A recent meta-analysis (Lawson et al. 2014) found that between 2000-2012 half of all
tropical deforestation was the result of illegal clearing for industrial agriculture.
The impacts of this illegality are widespread. As outlined in this paper, illegal
deforestation harms biodiversity and the people that rely on the forests for their lives
and livelihoods. The corruption involved undermines political institutions such as
local elections, and democracy more broadly. The impacts are also felt globally.
Illegal deforestation produces an estimated 1.47 gigatonnes of carbon dioxide-
equivalent [GtCO2e] each year—equivalent to about a quarter of all emissions in the
USA each year. In addition to the impact of these emissions on climate change,
there is a further international dimension: half of the illegal destruction was driven by
overseas demand for commodities including palm oil, beef, soy, and wood products.
While the climate impacts and demand-drivers may be global, dealing with illegal
deforestation is a sovereign right and, therefore, in order to better grasp the
impact of these practices, our paper examines the costs of this illegality to the
countries where this deforestation occurs. (Thus, we do not focus on the global
costs, nor do we examine the impact of deforestation for other uses, such as swidden

DISCUSSION DRAFT
8
agriculture. Likewise we do not compare the costs with any perceived benefits; given
that the activity is illicit, no amount of benefit would justify the deforestation. If the
government believes that the deforestation is of net benefit then they should revise
their legislative framework to legalize the activity; turning a blind eye only
encourages other illicit activity, like corruption.)
1.1 Overview
We begin with a definition of terms, then describe a generic legislative framework
(from policies into laws and regulations) and how a failure to enforce this ‘rule of
law’ undermines the ‘common good’. We then describe how this illegality generates
losses to the state. A more detailed discussion of this background can be found in
the appendices herein, as well as four case studies: Indonesia; Brazil; Liberia; and,
Costa Rica. Indonesia and Brazil are the heavyweights in tropical deforestation,
comprising half of all tree loss in the last 15 years. Liberia is an emerging player in
palm oil (and potentially deforestation driven by this plantation expansion); and
Costa Rica, who chose, more then 30 years ago, to forgo all deforestation (legal and
illegal) for agriculture.
1.2 Definition of terms
Deforestation: the permanent loss of natural tree cover, or the conversion of forest to
other uses, including agriculture (the definition used by the UN FAO [2012]).
Industrial agriculture: sometimes referred to as agribusiness; this is separate from
subsistence agriculture, i.e., crops grown for one’s own family’s consumption.
Commercial agriculture involves all sizes of operations, but industrial agriculture
generally refers to large-scale farming, often for export. For the purpose of this
report, industrial agriculture includes both ranching and crops, including mono-
culture tree crops (such as pulp plantations).

DISCUSSION DRAFT
9
Illegal deforestation: Clearing forests in a manner that violates the ‘rule of law’—i.e.,
harvesting without or in excess of authority, and/or evading taxes and fees. We
include violations of domestic law and regulation, and where legally binding,
customary law and ratified international treaties. Furthermore, we consider activities
illegal if the acts were in violation of law and regulation when committed, even if
subsequent law or the payment of ‘fees’ provided amnesty.
Currency note: $ indicates US dollars that, unless otherwise noted, have not been
indexed for inflation.

DISCUSSION DRAFT
10
PART 2. LEGISLATIVE
FRAMEWORK RELEVANT TO
FORESTS & AGRICULTURE
Illegal deforestation for industrial agriculture generates losses by undermining the
objectives that a state has for its forests. Appendix 1.1 examines these objectives in
detail, but in brief, deforestation undermines the states attempts to use its forests to:
Foster a stable economy through rational ‘land use’ and the promotion of
investment in the optimal use of its natural resources through:
o Sustainable forest management (SFM) based on ‘good governance’,
including the management of forests for the extraction of non-timber
forest products and in the promotion of eco-tourism; and,
o The conversion of forests to other uses, including agriculture. When
such a land-use decision is made it should consider land-ownership,
social and environmental impact, and whether or not the conversion is
economically advantageous and/or necessary for food security;
Maintain ecosystem services and cultural services; forests, for example,
provide clean water and air, reduce soil erosion, and provide habitat for
pollinators, as well as cultural and spiritual services;
Protect the rights of citizens whose lives and livelihoods depend on natural
resources, especially the rights to ownership, use, and/or access to forests and
forest products; and,
DISCUSSION DRAFT
11
Generate tax and other revenues that can be used to provide goods and
services to enhance the welfare of its citizens.
As examined in Appendix 1.2, tradeoffs among competing objectives are made
through political decision-making and then this policy is translated into, and
enforced through, laws, and then implemented through regulations. These
regulations serve as countermeasures to individual self-interest, necessary to prevent
the occurrence of actions that would adversely affect the ‘common good’. Thus, the
legislative framework is a fundamental component of risk management meant to
ensure the achievement of the national objectives. As such, violations—like illegal
deforestation—undermine the national good. This paper examines just how costly
these violations are.
2.1 Why violate the legislative framework?
Unfortunately, costly violations occur because the above, ‘ideal’, objectives are not
always the sole, or even the primary, driver regarding how policies are developed
into law or governing when this ‘rule of law’ is enforced. This is because
‘government’ is made up of individual actors—politicians, bureaucrats, civil servants—
whose self-interest, or interest as a member of a privileged group, is often in conflict
with the national interest. Corruption—the use of an official position for private
gain—is such a conflict-of-interest. Corruption includes decisions by individual actors
in government to manipulate the legislative process—including failing to invest in
enforcement1—in order to create conditions that allow them to exploit the system.
1 It important to recognize that lax enforcement is often the result of corruption. While in some cases the lack of
investment (including financial/human/technical resources) in enforcement capacity may be a rational decision (i.e.,
the benefits are outweighed by the cost), in many—if not most—cases the lack of capacity is the result of a lack of
‘political will’, i.e., corruptors want lax enforcement so that they can manipulate the legislative framework in order to
increase personal profit, even at the expense of the common good. That is, the ‘lack of capacity’ and the ‘lack of
DISCUSSION DRAFT
12
In other cases, operators undermine the national interest even without the
compliance of corrupt officials. Where enforcement is lacking, fraud—the intentional
deception, through concealment and/or misrepresentation, in order to gain an unfair
or illegal advantage—can rob the state of revenue and result in unacceptable social
and/or environmental impacts. In this way, weak governance feeds on itself,
undermining democracy more broadly.
Appendix A1.4 provides a typology for illegalities following from this corruption and
lax enforcement, including:
The evasion of tax (and other revenue);
The failure to manage impacts and distribute benefits equitably; and,
The exploitation of the sector by organized crime, including money
laundering.
In the next section, we focus on the illegalities associated most closely with land use
planning and deforestation for industrial agriculture. In order to estimate the costs
of this illegal deforestation, we must first define the illicit activities involved, however.
Then, based on this definition, we can begin to attribute losses and estimate the
associated costs.
2.2 How is the legislative framework violated?
Illicit behavior related to land use starts with the elite capture of the policymaking
process so as to weaken regulations in a way that benefits the elites. Similarly,
corruptors bribe officials to manipulate the process by weakening oversight,
providing unnecessary tax breaks in the guise of incentives, and/or allocating permits
to certain individuals.
political will’ are two sides to the same coin. If it does not make sense to enforce a law or regulation then the
authorities should withdraw (or amend) it, rather than ignore it.
DISCUSSION DRAFT
13
Once the legislative framework is established, however, compliant behavior—for
good or bad—is, by definition, legal. Illicit operators may, however, offer—or corrupt
officials may demand—payment (e.g., bribery, extortion, grease payments, hush
money) in order to allow violations of law and regulations. Here we develop a
typology of such crimes, in the rough order that they occur, related to deforestation
for industrial agriculture, including, inter alia:
The allocation of conversion rights: Perverting law/regulation by:
Manipulating the zoning process in order to improperly open up forests for
conversion (especially problematic where the area includes high conservation
value forest [HCVF] and/or forest claimed by local people);
Failing to follow gazettement procedures, including failing to investigate pre-
existing use/ownership rights, and/or ignoring indigenous/customary rights;
Failing to consult and obtain community consent (through Free, Prior and
Informed Consent [FPIC], for example);
Failing to compensate parties affected by industrial agriculture;
Providing unfair advantage in the bidding/permit allocation process (e.g.,
collusion in leaking minimum bid levels); and,
Allowing fraud and/or failure in environment & social impact assessments
(ESIA), mitigation efforts, and/or other management requirements.
The permitting process: Perverting law/regulation, by allowing operators to, inter
alia:
Commit fraud in ESIA management, including the actual assessment, as well
as the avoidance and mitigation of harms, and in monitoring and reporting;
Commit fraud in surveys of timber volume/value;

DISCUSSION DRAFT
14
Failing to map concession boundaries, including failing to identify and avoid
set-asides (e.g., culturally important sites, HCVF);
Providing false information to communities and/or coercing/intimidating
them;
Failing to craft adequate social agreements and benefit sharing agreements;
and,
Failing to comply with labor laws with respect to, inter alia, discriminatory
hiring, unfair contracting and compensation, unsafe working conditions,
violations of the right of freedom of association, use of child labor,
engagement in trafficking/slavery.

DISCUSSION DRAFT
15
Land clearing, including: perverting law/regulation by:
Clearing in advance of obtaining all licenses/permits;
Illegal use of heavy machinery without proper licenses;
Illegal use of fire to clear forest and slash;
o Accepting claims that third-parties are responsible for fires related to
agricultural concession areas rather than the concessionaires
themselves;
Illegal use of mechanical soil treatment;
Clearing outside concession areas and/or harvesting protected species;
Clearing more than the legal maximum area of the concession (i.e., leaving
less than the required legal reserve);
Clearing steep slopes, culturally important trees, and/or other no-go areas;
and,
Trafficking of illicit timber felled from any of the above areas.
Law enforcement, including, inter alia:
Failing to inspect, monitor, and, where appropriate, indict law-breakers;
Manipulating evidence/witnesses/court cases, including the timely exercise of
justice (e.g., failing to appeal within deadlines);
Violating judicial independence; and,
Failing to enforce penalties (fines, court-ordered compliance plans, jail time).
Tax (and non-tax) evasion; & other financial crimes, including:
Fraud in reporting and tax returns (false declarations/self-assessments);
Failure or falsification of audits;
DISCUSSION DRAFT
16
Improper transfer pricing;
Underpayment of tax/royalties/fees & other penalties; and,
Money laundering.
When any of these violations are committed, operators (even if they possess
otherwise valid licenses/permits) are, in fact, operating illegally. In many cases,
violations have material impacts on local communities, the environment, and the
other objectives that countries should, at least in principle, uphold. The next section
outlines many of the impacts associated with these illegalities. We then estimate the
associated costs of these impacts.
DISCUSSION DRAFT
17
PART 3: THE IMPACT OF
ILLEGALITY ASSOCIATED WITH
DEFORESTATION & INDUSTRIAL
AGRICULTURE
The illegalities outlined in Part 2 serve to undermine the ‘rule of law’ and, thus, the
ability of the state to achieve its objectives. This translates into direct and indirect
losses, many of which have financial implications that, for the sake of context, can be
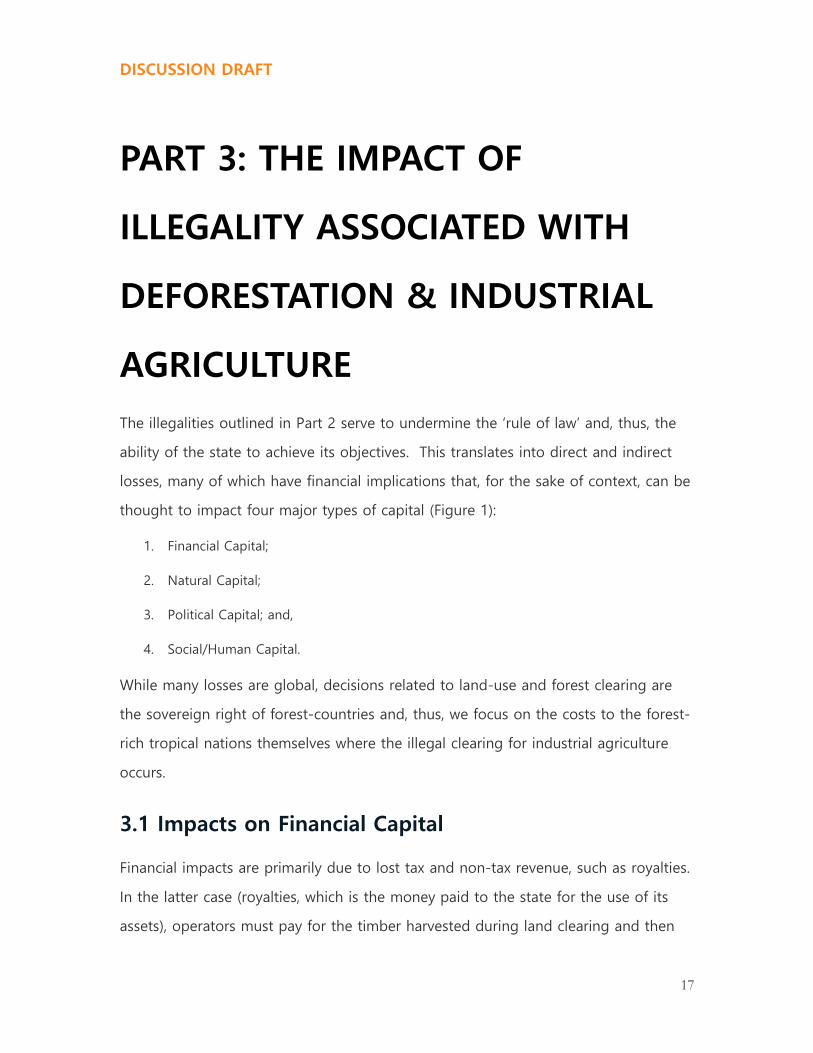
thought to impact four major types of capital (Figure 1):
1. Financial Capital;
2. Natural Capital;
3. Political Capital; and,
4. Social/Human Capital.
While many losses are global, decisions related to land-use and forest clearing are
the sovereign right of forest-countries and, thus, we focus on the costs to the forest-
rich tropical nations themselves where the illegal clearing for industrial agriculture
occurs.
3.1 Impacts on Financial Capital
Financial impacts are primarily due to lost tax and non-tax revenue, such as royalties.
In the latter case (royalties, which is the money paid to the state for the use of its
assets), operators must pay for the timber harvested during land clearing and then

DISCUSSION DRAFT
18
pay annual land rents to the state where the plantation is located. Illegal operators
evade some (or all) these royalties, although such evasion may require informal
payments to corrupt officials (e.g., bribes).
Unfortunately, the more a country’s economy relies on natural resources, the weaker
its governance often is, and the less likely it is to implement the ‘rule of law’ (see
Figure A1.1, Appendix A1.1). Such conditions are perceived by investors to be risky.
While risk drives away investment, those that do invest generally require greater
return (often leading them to ‘cut corners’, where the violation of laws/regulations
generates greater social and environmental harms). Furthermore, increasing
perceptions of risk decrease the credit worthiness of the country. All of which results
in greater costs of borrowing. Moreover, perceptions of risk undermine the
reputation of the country and the companies that operate therein. This decreases
the willingness of donors to assist both financially and with the transfer of
technology, not to mention that it undermines companies’ access to markets.
The above impacts damage the economy and undermine development, which further
decreases the ability of government to deliver goods and services to its citizens.
3.2 Impacts on Natural Capital
As outlined in Figure 1, the loss of forest undermines natural capital in many direct
ways. As watersheds are degraded, water quality and quantity decreases, soils erode
and fertility is lost. The loss of forest and the habitat it provides leads to a loss of
species, which can have immediate financial impacts on adjacent farms, for example,
when pollinators are lost. The loss of the trees impacts climate change, through
decreased sequestration and more immediately through massive inputs of
greenhouse gases when the trees are cleared using fire. We exclude the ‘climate-
protection’ value of forests from this economic analysis because most of that value

DISCUSSION DRAFT
19
goes to other countries—but it is important to note that some of the value of
avoided climate-impact is enjoyed by the forest-country itself.
Figure 1. The major types of capital at risk when a country’s legislative framework is violated with
respect to forest clearing for industrial agriculture.
3.3 Impacts on Social/Human Capital
When the country fails to protect a community’s rights to forests, people’s lives and
livelihoods are threatened. In the most egregious cases, and often in violation of
customary, if not statutory, law, countries have ignored peoples’ rights of ownership
of the land and the forests they contain, allowing companies to clear community-
owned land for ranches and plantations. Not surprisingly, communities see such
loses as a threat to their financial and social wellbeing, if not their very existence, and
FINANCIALCAPITAL NATURALCAPITAL HUMAN/SOCIALCAPITAL
POLITICALCAPITAL
Governmentrevenue- Avoidance
o Subsidies- Evasion
o Taxo Non-tax
§ Stumpage§ Reforestation
o Fees
Economy- Size- Productivity/profitability- Marketshare
Investment- Total- Return(Futurevalue)
Creditworthiness- Costofborrowing
Developmentassistance- $&technicaltransfer
Governance- Corruption
Reputation
Socialinvestment
EcosystemServices- Water
o Quantity§ Flooding
o Quality- Soil
o Fertility/productivityo Erosion
- Biodiversity- Carbon- Pollination
Fire
Jobs
Livelihoods- Land/farming- NTFPs
Communityrights- FPIC;participation- Compensation
Discrimination- Gender/Age- Ethnicity
Humanrights- Indigenousrights
o Access;Useo Ownership
Conflict
Health- Morbidity- Mortality
DISCUSSION DRAFT
20
conflicts over land have become widespread, often turning violent, leading to the
loss of life (de Leon et al. 2003).
Illegal deforestation also leads to loss of life when fire is used in clearing. The haze
further threatens health, and education suffers when schools are closed due to health
concerns.
It is important to note that people living in forest-rich countries do not feel these
impacts evenly. Losses are most acute for those living closest to the site of the
deforestation (Mullan 2014). But even in these communities, impacts are not equal.
Women practice swidden farming and collect forest products more than men, and
they are disproportionately affected by forest loss—even more so if the plantations
that take the place of forests preferentially hire young men. But even local men may
be disadvantaged if the plantations prefer to hire non-local labor (who are often
seen as more ‘reliable’ because, living on-site and not subject to ‘community
obligations’, they are more easily ‘managed’).
3.4 Impacts on Political Capital
All the impacts noted above undermine the trust of people in their government, as
well as the faith of the international community. This loss of trust makes
governments vulnerable, leading the elite to take steps to reinforce their power,
often through corruption, which serves to further undermine democracy, more
broadly.
In the next section we attempt to quantify these costs. We recognize that
through such an attempt we risk under-valuing the severity of losses when we fail to
measure adequately the more abstract impacts. It is not our intention to suggest
that only those impacts that can be quantified are those worth acknowledging and
addressing.
DISCUSSION DRAFT
21
Moreover, it is not our intention to assess whether these costs are ‘acceptable’. As
mentioned in the Introduction (Part 1), this is not a cost-benefit analysis; we make no
attempt to quantify the benefits of what is an illegal activity. If the state believes
that clearing is justified, it should amend its legislative framework to first de-
criminalize the activity.
It is our hope that recognizing the costs of illegal deforestation for industrial
agriculture will help strengthen the constituency demanding the halt to such activity
by both increasing the size of the constituency, as well as increasing its influence
(appealing to sympathetic government actors, such as Ministries of Finance). This
will help build the ‘political will’ for policy change to increase enforcement and
develop incentives, both of which, the case studies herein suggest, are necessary to
reverse trends and prevent such illegality.
In this hope we are reminded of the role that a similar study by Seneca Creek
Associates (2004) had in articulating the costs associated with illegal logging (Box 1).
Their description of the scope of the problem—while acknowledging the large gaps
in knowledge and large areas of uncertainty related to quantifying impacts—helped
coalesce support among government, civil society, as well as the private sector that
drove real change in the fight against illegal logging.

DISCUSSION DRAFT
22
Box 1: The cost of illegal logging
In their seminal paper, Seneca Creek Associates (2004) attempted to document
the cost of illegal logging to the US forest sector, positing that “illegal logging is
primarily a symptom of unclear or poorly enforced forest tenure, weak political
institutions, corruption, inadequate natural resources planning and monitoring,
and lax enforcement of sovereign laws and regulations. The problem appears to
be most acute in countries without private forest ownership or clearly controlled
tenure. Ambiguous forest tenure is a major impediment to legality as there is less
incentive to protect assets from theft and destruction.”
In the analysis completed for the American Forest & Paper Association, Seneca
Creek concluded “5% - 10% of the value of global wood products trade can be
traced to suspiciously produced roundwood…
“An economic simulation [model]…suggests that illegal material depresses world
prices by 7% - 16% on average, and U.S. prices by 2% - 4%...
“Absent illegal volume in the global market,…[an] annual increase in value of wood
product exports [from the USA each year would be] just over $460 million...This
represents a measure of the opportunity costs for U.S. exporters because of illegal
wood products in the global market...
“To be effective, solutions to the illegal logging issue must reduce the spread
between the costs of operating illegally and the costs of operating legitimately.
Policy makers should consider that raising costs for legal trade could have a
perverse and unintended impact.”

DISCUSSION DRAFT
23
PART 4: OVERVIEW OF COSTS OF
ILLEGAL DEFORESTATION FOR
INDUSTRIAL AGRICULTURE
As mentioned above, the full costs of illegal forest clearing for conversion to
industrial agriculture do not readily lend themselves to robust measurement. This is
due in large part to the clandestine nature of the activities. However, some of the
costs, such as those related to lost ecosystem services, are also difficult to quantify,
even under the best of circumstances. Nevertheless, the available literature does
offer some parameters that can be used to construct a sense of the order of
magnitude of various types of costs. We focus on Brazil and Indonesia as together
they represent half of the loss of tree cover over the past 15 years (Hansen et al.
2013). Thus, Appendix 3 & 4, for Indonesia and Brazil respectively, offer a more in
depth examination of the losses. Here we offer only those ‘headline’ losses. But
again, we aim to be conservative and these estimates should be considered
minimums; most of the losses are simply too difficult to quantify.
4.1 Financial Capital
Lost government revenue
The most direct cost to governments is that of revenue lost, including unpaid taxes
and royalties linked to timber harvests, as well as other fees tied to securing rights to
clear forests for conversion. (We do not estimate revenue from the
evasion/avoidance of annual land rental for plantations and pasture-land as this
DISCUSSION DRAFT
24
paper only examines losses associated with the land-allocation process up to the end
of the deforestation for land clearing.)
Gutierrez-Velez and MacDicken (2008) estimated lost government revenue from
illegal logging in Brazil at $2,880/ha. For Indonesia, we estimate (Appendix 3) that
losses averaged around $4 billion per year between 2009-2013 (the most recent data
available); assuming that half of this tax loss is from timber produced during clearing
for oil palm and pulp plantations, then this suggests lost fees and taxes of around
$3,848/ha for these two commodities. Based on case studies elsewehere, we use a
global average of $2,300/ha for the rest of the world.
Corrupt officials facilitate much of this evasion. Thus, government expenditure on
salaries, offices, vehicles, etc. for personnel who are not performing their duties is
also, arguably, a direct cost. We note that in 2013, the budget for the Indonesian
Ministry of Forestry was approximately a half-billion dollars, and in 2009, the Ministry
of Agriculture’s budget was even ten times higher (although almost half went to
subsidies [World Bank 2010]). The budget of the Brazilian Ministry of Agriculture was
approximately $2.5 billion in 2015. If these ministries fail to perform, then their
budgets could have been better spent elsewhere such as education, improving
healthcare, or on public infrastructure. However, quantifying this loss is beyond the
scope of this exercise.
4.2 Natural Capital
Ecosystem services
Costs linked to environmental damage caused by illegal forest clearing impose a
direct burden on government and on the wider economy. Costanza et al. (1997)
offered a global average value for tropical forest ecosystem services as $2,007/ha/yr,
more than half ($1,167/ha/yr) for erosion control and nutrient cycling.
DISCUSSION DRAFT
25
Because climate regulation is more of a ‘global’ rather than ‘national’ good, we
removed the $223/ha that corresponded to the climate-regulation component and
we use an adjusted value of $1,784/ha. We assume that the total clearing and
conversion of forest to industrial agriculture effectively negates the entirety of this
value. (Note, that we have not inflation-adjusted the Costanza figure [doing so
would raise the value from $1,784/ha in 1997 US$ to more than $2,684 in 2015
US$]).
We note that the Costanza figure is not without detractors. Mullan (2014)
summarizes the critique into three main points: 1) Costanza’s economic valuation is
valid for marginal change (e.g., losing 100 ha of forest in exchange for an oil
plantation), but less valid when calculating the economic value for the loss of all a
country’s forests in exchange for an undefined alternative; likewise, 2) scaling
economic value up to the country’s entire forest is questionable because ‘value’ will
necessarily depend on the characteristics of the local human population (e.g., its size
and proximity to the deforestation), as well as the availability of substitutes to the
‘commodities’ lost; and, 3) as any such commodity becomes more scarce, its value
should rise—which is difficult to model when scaling from valuations based on a
small area up to the entire forest of a country.
While these critiques are valid, we note that our estimates of the various losses does
not assume that all a country’s forests will be cleared. We only attempt to value the
loss of forests recently cleared for plantations; if anything as more forest is lost, the
remaining forest should increase in value. Moreover, Mullan (2014) herself
recognized that the loss of ecosystem services really does have impacts, specifically:
“1) forests provide soil protection and water regulation services, which in turn
reduce waterborne diseases, maintain irrigation water supply, and mitigate
risks of natural disaster; 2) forests provide habitat for birds, fish, mammals and
insects that affect human health and income generation opportunities; 3)

DISCUSSION DRAFT
26
clearing forest through use of fire can lead to respiratory illness and property
damage, particularly if the fires spread accidentally; and 4) tropical forests are
particularly high in biodiversity, making them important locally as well as
globally as a potential source of genetic material for new crop varieties and
pharmaceuticals.”
More recently Carrasco et al. (2014) carried out a spatially explicit meta-analysis
based on 30 studies of ecosystem service values in tropical forests from The
Economics of Ecosystems and Biodiversity (TEEB) database, while controlling for
economic, environmental, and methodological variables. They found a mean value of
$1,312/ha/yr, but with considerable variation across the tropics (Figure 2). While
ecosystem values in Brazil appear consistent the Costanza et al. (1997) value of
$1,784/ha/yr, Indonesia would appear to have values in excess, especially the islands
of Kalimantan and Sumatra where the majority of oil palm and pulp plantations are
located.
Figure 2. Ecosystem value of tropical forests. (I$=US$) Source: Carrasco et al. 2014.
A caveat: Carrasco et al. (2014) note that their “models present mixed results. They
perform better than direct benefit transfer under cross-validation ... but perform
worse than direct benefit transfer when trying to predict the validation dataset.”

DISCUSSION DRAFT
27
Based on an earlier critique by de Groot et al. (2012), Costanza et al. (2014)
reanalyzed their data and, while continuing to err on the side of being conservative,
they concluded that actual losses were, in fact, twice their 1997 estimate.
To be conservative then, we use the $1,784/ha/yr, but note that a re-analysis using
Costanza et al. (2014) would serve to increase the magnitude of losses by 100%,
whereas using the lower $1,312/ha/yr of Carrasco et al. (2014) across the tropics
(including for Brazil and Indonesia) would reduce losses worldwide from $6.3
billion/yr to $4.6 billion/yr.
We also note that Carrasco’s and Costanza’s economic valuation is a recurring cost;
$1,312/ha and $1,784/ha are the amounts of loss felt each and every year once
forests are lost. In our analysis, however, we aim to be conservative and treat the
cost as one-time, encountered in the year the forest was logged. If one were instead
to calculate the net present value (NPV) of Costanza’s annual losses then, at a
discount rate of 15%, the value of ecosystem services lost would approach
$12,000/ha.2
Carbon
While we do not include the climate-regulation component from Costanza et al.
(1997), if carbon markets develop, then countries would have the opportunity for
financial gain from any ‘stored carbon’, including through the avoidance of additional
deforestation. For example, the Government of Norway has signed bilateral Letters
of Intent with many forest-rich tropical countries, agreeing, for example, to make
payments of $5/tonne of avoided emissions up to $1 billion in Indonesia and Brazil,
and $150 million in Liberia (see case studies, Appendices 3-5).
2 Conversely, if you use $1,784/ha as the NPV, then it assumes (based on the same 15% discount rate) that recurring
losses are on average only ~$265/ha/yr.

DISCUSSION DRAFT
28
In order to access funding for reduced emissions from deforestation and forest
degradation (REDD), project-based approaches required that payments only be made
for ‘additional’ avoided deforestation, i.e., clearing that would—but for the carbon
payment—have occurred otherwise. In making this determination for projects, there
is, arguably, a presumption that the avoided deforestation was legal. Illegal
deforestation should have been stopped through enforcement, not through REDD
projects.
However, REDD has evolved to increasingly require action at the scale of
governments (e.g., the Warsaw Framework for REDD), measured against
internationally agreed crediting baselines, rather than crediting projects. The past
decade of REDD practice has also shown that stopping deforestation is as much an
issue of providing incentives to governments to better govern their land sector as it
is an issue of shifting the economic incentives at the level of the landholder. In this
model, it matters less whether or not the deforestation was legal, as long as the
REDD payments are only provided for deforestation reduction below an agreed
baseline.
Regardless of whether deforestation is legal or illegal, countries may face an
economic loss if they fail to meet and exceed baselines and access international
REDD payments. In such a case then unchecked illegal deforestation could represent
a lost REDD-opportunity, with foregone income on the order of $1,800/ha (e.g., in
Brazil, the Norway payments are based on $5/tonnes CO2-equivalent, assuming 367
tCO2e/ha). However, given the uncertainty in REDD markets and the inability to
distinguish whether losses are from continued legal deforestation or illegal
deforestation, we do not include the opportunity cost of REDD-based payments in
our calculation of losses. But we note that rampant illegal deforestation may
undermine trust in a country’s ability to perform in the REDD marketplace. In the
worst case, the carbon market would simply avoid contracts in the country
altogether. This would represent a true loss, although not on a per-hectare basis.

DISCUSSION DRAFT
29
Forest fire
The World Bank (2015; Box A3, Appendix 3) estimated that in 2015 fires in Indonesia
used illegally for forest clearing caused losses of $16.1 billion, or more than
$6,700/ha.3 Removing the World Bank’s estimate of lost revenue from logging
(which we included in the Financial Capital losses, above), the fire-losses still amount
to more than $5,092/ha.
The largest single component of the loss was carbon storage (based on a carbon
market at $5/tCO2e, as opposed to the impact of emissions on global climate
change). The World Bank noted that the use of fire remains widespread and
substantial each year. And while fires are now a relatively common occurrence in
Indonesia (Figure 3),4 2015 was exceptional due to the severe El Niño-related
droughts.
3 Tacconi (2003) estimated that the 1997 forest fires (also lit mainly for land clearing) cost Indonesia between $674-
799 million (~$5 billion in 2015$; or ~$1,000/ha) in medical treatment and business losses alone; Varma (2003)
estimated much larger losses: $20 billion (or $120 billion in 2015$; $24,000/ha) from the 1997 fires.
4 For example, during 2013—a non-El Niño year—fires only burned in Central Kalimantan and only for one week,
emitting 0.2 GtCO2e (Gaveau et al. 2014), whereas the 2015 fires emitted 10 times the amount. Moreover, the effects
are likely non-linear, rising exponentially with increasing aerosol particulate matter.

DISCUSSION DRAFT
30
Figure 3. Frequency of active fires detected in Indonesia between 2003-2015 (X 1000), based on
Aqua + Terra MODIS satellite. Source: Stevens (2015).
While nowhere near as severe as Indonesia’s fires, Brazil has also suffered widespread
forest fires associated with land clearing. Without attaching a financial value,
Reddington et al. (2015) calculated that since 2004, reduced deforestation has led to
a reduction in aerosolized particulates that has saved between 400-1,700 premature
adult deaths across South America.
4.3 Human/Social Capital
Cost of conflict
Like environmental damage, land conflicts associated with illegal forest clearing
impose direct costs on government and the economy as a whole. Direct costs
include those relating to physical intervention (e.g., to protect lives and property) and
the mediation of disputes (e.g., between communities and agricultural
concessionaires), as well as foregone tax revenues due to disruption in legitimate
production. Moreover, disrupted production has wider economic consequences in
terms of revenue, employment, trade, and so on.
The Munden Project represents one attempt to quantify one of the costs of
conflict—in their case: only the cost of disrupted production. To do so, they
analyzed the extent of overlap between indigenous territories and
agricultural/forestry concessions in several countries, including Brazil and Indonesia,
and then the value of production placed at risk by such overlap. Extrapolation from
their results yields average costs of $172/ha/yr for soy in Brazil and $498/ha/yr for
oil palm in Indonesia (we assume similar costs for pulp plantations).
Globally, conflicts over land rights can increase operating costs by a factor of 29; the
overlap between concessions and community lands may affect around $5 billion of
agricultural production annually; and the average loss for all commodities was

DISCUSSION DRAFT
31
$113/ha/yr (de Leon et al. 2013). It is important to note that these figures reflect
only the value of agricultural production at risk, not the total costs incurred. Thus,
they dramatically underestimate the true cost of conflict over illegal deforestation for
industrial agriculture.
4.4 Political Capital
Decreased investment
Collectively, the costs mentioned above can be expected to have the general effect
of weakening the investment climate in a given country. Corruption increases the
cost of doing business, undermines transparency, and amplifies risk. A government
unable or unwilling to reliably collect revenue will be less able to provide services.
Moreover, environmental damage threatens productivity, and land conflict generates
further instability.
Various authors examine how corruption undermines investment, and then link
reduced investment to reductions in economic growth. For example, Udenze (2014)
finds that a 1% increase in Transparency International’s corruption perceptions index
for low- and middle- income countries is associated with a 0.88% decrease in foreign
direct investment (FDI) as a share of GDP. Similarly, Mathur and Singh (2013) found
that a 1% decrease in corruption can increase FDI by 9% in emerging economies.
Moreover, the natural resource sector is a major driver of corruption (see Figure
A1.1). For example, in Appendix 3, we refer to a study by Burgess et al. (2012) in
Indonesia that links illegal deforestation and the improper allocation of logging
rights to campaign financing and the undermining of local elections. However, the
degree to which illegal forest clearing for industrial agriculture weakens the
investment climate cannot be isolated from corruption writ large; weak governance
will be accompanied by corruption across the economy as a whole, not just in the
forest sector.

DISCUSSION DRAFT
32
4.5 Summary of costs
Based on the above, we estimated the major costs of illegal deforestation for
industrial agriculture to Indonesia and to Brazil (Table 1). Given the existence of
additional known costs that, however, cannot be estimated credibly, the results must
be seen as conservative.
The analyses suggest that: a) for Brazil (when illegal deforestation was high [see
Appendix 4]), illegal clearing of forests for soy and cattle pasture costs over $8.5
billion each year (based on costs of more than ~$4,600/ha), and b) for oil palm and
pulp plantations in Indonesia clearing costs well over $3.2 billion each year
(based on costs of more than ~$6,100/ha). Adding in the some of the costs
associated with other agricultural commodities, and more importantly, with fires and
haze, the total losses for Indonesia climb to more than $9 billion in 2015. Thus,
the losses in Indonesia in 2015 are almost as much as all government reported
spending on health (~$11 billion), and by decreasing deforestation for agri-business,
Brazil likely saved about 7% of what government reported as spent on health (~$108
billion).
Expanding to the area lost for all industrial agriculture each year, estimated losses for
just these two countries amount to considerably more than $13.4 billion each year.
Applying a conservative $4,000/ha in losses5 to the area cleared illegally each year
worldwide (estimated by Lawson et al. [2014]) suggests that illegal deforestation for
industrial agriculture globally imposes costs over $17 billion per year, of which
more than $8.5 billion is linked to exports. Note that this value is based on
Lawson et al.’s (2014) mid-range value for the rate of illegal deforestation driven by
industrial agriculture (49% of all tropical tree loss between 2000-2012). Using
5 Note: the $4,000/ha assumes losses from tax evasion of ~$1,000/ha, the Munden global average for conflict-related
losses at $113/ha, and Costanza et al.’s estimate of ecosystem service [excluding climate regulation] $1,784/ha.
DISCUSSION DRAFT
33
Lawson’s low- and high-end estimates (36%-65%, respectively) produces a range of
loss between $13.1 billion to $22.3 billion for the three classes of loss in Table 1.
Again, as the analyses employ a number of conservative assumptions, the true costs
are likely to be substantially greater.

DISCUSSION DRAFT
34
Table 1: Major annual losses to Indonesia & Brazil generated by deforestation for industrial
agriculture: a) lost government revenue; b) environmental damage (and in the case of Indonesia,
the economic impact of fires used in land clearing); and, c) conflict with local communities over
land. (Source: see text; tree cover loss from Lawson et al. (2014)—average annual tree loss between
2000-2012.)
Indonesia
Conversion To
Annual Losses Oil Palm Pulp All Industrial Agriculture
Tree Cover (estimated) 313,500 ha 206,250 ha 825,000 ha
Direct loss of revenue $1.2 billion $800 million $3.2 billion
Environmental damage $560 million $370 million $1.5 billion
Land conflict $156 million $100 million $260 million
TOTAL COST/YEAR
$1.9 billion/yr
$1.3 billion/yr
$4.9 billion/yr
Per hectare losses $6,130/ha $6,130/ha $5,946/ha
Economic impact of fires $1.6 billion $1 billion $4.2 billion
TOTAL COST FOR 2015 $3.5 billion $2.3 billion $9.1 billion
Per hectare losses $11,118/ha $11,118/ha $11,104/ha
Brazil
Annual Losses Soy Pasture All Industrial
Agriculture
Tree cover 307,417 ha 1,374,333 ha 1,808,333 ha

DISCUSSION DRAFT
35
Direct loss of revenue $885 million $4 billion $5.2 billion
Environmental damage $550 million $2.5 billion $3.2 billion
Land conflict $53 million $53 million
TOTAL COST/YEAR
$1.5 billion/yr
$6.4 billion/yr
$8.5 billion/yr
Per hectare losses $4,836/ha $4,664/ha $4,693/ha
DISCUSSION DRAFT
36
While these costs of illegal deforestation are substantial, they are rarely borne by the
agricultural operators themselves. Yet, if the operators were to stop illegal land
clearing, then they would incur all the costs of compliance, including the foregone
expansion. This makes enforcement necessary.
The lessons learned in case studies (Appendix 2-5) suggest that albeit necessary,
enforcement is usually not sufficient to ensure compliance; incentives are also
necessary. In Costa Rica, for example, positive incentives, especially payments for
environmental services, drove change that led to a policy to forego deforestation
altogether—both legal and illegal—for agriculture. In Brazil, consumer-campaigns
drove producers to commit to zero-deforestation. In both cases, while the incentives
were critical, most operators nonetheless said that without law enforcement, they
likely would have continued clearing forest for expansion. Moreover, successful
enforcement is likely frequency-dependent. When the vast majority of the industry is
in violation of the ‘rule of law’, as it was in Brazil prior to the mid-2000s for example,
it is likely difficult to begin to enforce the law. It undoubtedly helps enforcement if
incentives can pull ‘good actors’ into compliance so that government enforcement
capacity is sufficient to push the remaining illicit operators into the legal, or out of
business. Without incentives, there may just be too many illicit operators for
enforcement officers to tackle.
In the end, halting illegal forest conversion is both an environmental and a core
economic issue (based on the losses identified herein and on the need for incentives
to drive change). We conclude that forest countries would reap major benefits,
through the avoided costs, from aggressive campaigns to halt illegal forest
conversion for industrial agriculture. Costa Rica, the first of our case studies, took
that step 30 years ago and has seen their GDP quintuple while forest cover has
doubled. Indonesia, in contrast, has sunk massive resources into incentives to
expand oil palm. While the expansion has been impressive, much of it has been
wasted with forest cleared but without successful planting. In the end, Indonesia has

DISCUSSION DRAFT
37
allowed massive human and environmental harms, and in doing so, has lost billions
in unproductive incentivizes. Indonesia—mostly those rural communities closest to
the deforestation—has suffered the losses without experiencing the anticipated gain.
With a greater understanding on these costs, it is our hope that countries will assess
the importance in reversing trends in illegal deforestation with respect to industrial
agriculture.
DISCUSSION DRAFT
38
APPENDIX 1: LEGISLATIVE
FRAMEWORK
Appendices 2-5 provide case studies from Costa Rica, Indonesia, Brazil and Liberia
that examine the types of losses generated by illegal deforestation for industrial
agriculture. In this first appendix we trace how countries protect their national
interest in their forest-resources through their legislative framework, and thus why
violations are consequential. It is these consequences that are assessed to estimate
losses.
We first examine how governments develop a legislative framework to translate
policies into laws and implementing regulations. In order to best manage their
resources, governments should develop their legislative framework based on
‘good governance’, which refers to those practices that incorporate the principles of:
Participatory and Equitable policies and laws;
Transparent and Efficient processes, reinforced by Monitoring & Evaluation;
Effective implementation that achieves policy objectives, through Enforcement
where necessary;
Accountability, including, anti-fraud and anti-corruption mechanisms; and,
All underlain by the application of the Rule of Law.

DISCUSSION DRAFT
39
A1.1 National Objectives for Natural Resources,
Including Land
In this section we deal briefly with the major objectives that, under good governance,
nations have for their natural resources, in particular land and the forests contained
therein.
Sustainable management
The natural resource sector is capable of delivering value/rents over time. In some
cases, such as mining, the resource is exhaustible and by definition, unsustainable.
Likewise, in some cases it may be rational for countries to clear forests for
agriculture. But in other cases, land can be best used for purposes that are at least
theoretically capable of replacing themselves: e.g., Forests—and the timber and non-
timber forest products [NTFPs, including inter alia foods, medicine, building materials]
they produce. However, in many cases government has not enforced SFM and
overharvest has driven a decline in merchantable products, which has driven a shift in
the sector. (For example, as deforestation increased in Indonesia, the timber industry
has shifted from plywood to pulp, which can use smaller trees [Forest Trends &
KAMH 2015]).
Investment
Through the quality of their governance, governments will be seen as responsible
actors or pariahs. Unfortunately, the more an economy’s reliance on natural
resources, there is a trend to greater amounts of corruption (Figure A.1a), and many
of the countries with the most tropical forest are not only considered highly
corrupt but many have high levels of illegality related to their forestry sector
(Figure A.1b). Both corruption and illegality make investors wary. As US Secretary of
State Colin Powell said “capital is a coward” and ‘good’ investors avoid excessive risk.

DISCUSSION DRAFT
40
Companies that are willing to take such risks often use ‘cost saving’ practices with
short time horizons that degrade the environment, inflame tensions with local
communities, and exacerbate corruption. Also common in high-risk areas are
speculators who lack technical expertise but take advantage of corruption and weak
institutions to trade on their crony networks to get licenses even when they have no
intention of actually operating (Harwell 2010). The result is a failure to generate the
expected jobs and government revenue, which then undermines poverty reduction
strategies and degrades citizens’ trust in their government.
Figure A1. a) Relation between economic importance of natural resources, % of GDP, and
governance, i.e., indicators of governance for rule of law = and corruption = ; and, b) relation
between illegal logging and corruption, i.e., Transparency International index of corruption. The size
of the bubbles indicates the volume of illegal roundwood in trade. (Source: 1a. data from World Bank:
data.worldbank.org/indicator/IQ.CPA.PROP.XQ; 1b. Seneca Creek Associates 2004)
Perceptions of weak governance and lax enforcement inhibit investment, and
they are increasingly having a direct effect on the market share as buyers (either
companies or individual consumers) discriminate based on a desire to avoid products
that have a negative impact on the environment and local communities. This
consumer reaction has spread to agricultural commodities grown on deforested
lands. In response, companies that use palm oil for example, have pledged to
purchase only from plantations that have caused zero deforestation. For the
0"
0.5"
1"
1.5"
2"
2.5"
3"
3.5"
4"
4.5"
0" 10" 20" 30" 40" 50" 60"
Governance"(0#=#low;#5#=#high)#
Economic"Reliance"on"Natural"Resources"(%#GDP)#
of its production suspect, Indonesia stands out as the country with both the highest rate of illegal
activity and the most suspicious volume.
Figure 1: Correlation Between Per Capita Income and Perceived Corruption
0
5
10
15
20
25
30
35
40
0 2 4 6 8 10
TI CPI Index
Per
Capita Incom
e ($ 0
00 P
PP
)
12
Sources: Transparency International; World Bank (GDI indicators)
Figure 2: Corruption and Illegal Forest Activity
0
5
10
-10 0 10 20 30 40 50 60 70 80
Oth AsiaW/C Africa
Eu-15
Malaysia
China
Canada
IndonesiaAcceding
EU
USA
Russia
Japan
Brazil
Oth L Am
Hig
h C
orr
up
tio
n (
TI)
High % Suspicious Log Supply
Over 20% Over 50%0
5
10
-10 0 10 20 30 40 50 60 70 80
Oth AsiaW/C Africa
Eu-15
Malaysia
China
Canada
IndonesiaAcceding
EU
USA
Russia
Japan
Brazil
Oth L Am
Hig
h C
orr
up
tio
n (
TI)
High % Suspicious Log Supply
Over 20% Over 50%
Note: Size of bubbles represents volume of suspect roundwood, including
imports. Sources: Transparency International; WRI/SCA estimates
of illegal logging
Page 8
DISCUSSION DRAFT
41
purposes of promoting investment and ensuring market access, therefore, countries
should increasingly be interested in ‘good governance’ to promote SFM.
Sound environmental management
Likewise, countries should be interested in sustainably maintaining a large proportion
standing forests in order to protect ecosystem function and the services it provides
(and to reduce costs to government [and society] from ‘externalities’ such as
pollution, erosion, natural disasters, control of invasive species). While not without
criticism (see Part 4.2), in a seminal paper in 1997, Costanza et al. estimated that
ecosystem services provided by tropical forests were worth more than $2,000/ha/yr,
including, inter alia:
$922 in nutrient cycling;
$315 in raw materials;
$245 in water erosion protection;
$223 in climate regulation;
$112 in recreation;
$87 in waste treatment; and,
$41 in genetic resources.
Similarly, work in the late-1980s compared the local value of NTFPs from a hectare of
Peruvian rain forest, and found the net present value (NPV) of fruits and latexes
alone to be $6,330/ha annually (minus labor and transport cost), or more than 10
times the timber value, and double the value of cleared land converted for other
uses (Peters et al. 1989). The value of tropical forests may increase dramatically if
carbon and biodiversity offsets6 take hold.
6 carbon: e.g., Reduction of Deforestation and Forest Degradation: rainforests.mongabay.com/redd/

DISCUSSION DRAFT
42
Rights (human, ownership, usufruct, access, etc.); equitable,
inclusive management
The UN Environment Programme (2009) reckons that at least 40% of all civil war
since the end of the Cold War were associated with natural resources. Governments
should want ‘good governance’ around resources to reduce conflict and to protect
their own citizens. Indeed, although often neglected in pursuit of economic
imperatives, the primary purpose of government is to provide for and improve
the lives of its citizens. This implies that governments are obligated not only to
provide basic services and protections from actors who would threaten citizens, but
states must themselves refrain from acting in a way that undermines its own
citizen’s wellbeing and security. Likewise, in addition to basic human rights, which
include the right to own property and the right to freedom of interference with one’s
home, government should uphold the law to protect statutory title and other
ownership rights, including, where recognized, customary rights, as well as rights
critical to livelihoods, such as the right to access traditional territories and community
forests, and related usufruct rights.
Revenue collection
In order to promote the wellbeing of it citizens, governments must collect revenue
to pay for goods and services. Taxes (income, corporate, etc.) serve this purpose, but
with respect to natural resources, royalties—referred to as stumpage in the forestry
sector, and as concession fees (including annual land rental fees) for the rights to
convert forests to fields—are paid by operators to government for the right to the
ongoing use of the public asset. Royalties are often based on a percentage of the
value of the asset, regardless of whether the asset is sold.
biodiversity: e.g., Business and Biodiversity Offsets Program: bbop.forest-trends.org

DISCUSSION DRAFT
43
From an economics perspective, optimal tax regimes generate government
revenue without unduly skewing decision-making, except to encourage favorable
activities and discourage activities counter to the national interest.
An example of a positive tax incentive with respect to forests: recognizing the
decline in the timber sector due to overharvesting of large trees, countries
may choose to bolster the development of other sectors by providing
incentives such as tax breaks, interest free loans, and price subsidies.
An example of taxation to discourage certain activities: although deforestation
for plantation expansion may be legal, governments may want to ensure that
the operators are not simply applying for clearing permits in order to access
timber that they would otherwise be prohibited from logging. In Indonesia
(see Appendix 3), for example, in order to remove such a perverse incentive,
the government taxed all profit (net of extraction costs) on all timber
harvested when clearing the forest for a new plantation. This was meant to
ensure that revenue from deforestation played no role in decisions regarding
whether or not to undertake the agricultural project. While such a regulation
does not prohibit clear-cutting, it drives preference by removing the perverse
financial incentive provided by selling the harvested trees.
If the taxes, royalties, and fees are less than the value of the lost asset (market,
ecosystem service, etc., and any associated management/clean up costs), then the
sector is effectively subsidized. That is, when trees are harvested, the ‘public good’
suffers, not just through the loss of valuable wood, but also through the loss of the
ecosystem functions that the forests provide, like maintenance of air and water
quality, and thus the public deserves to be compensated for its loss. In some cases,
the loss may not be large and may be justified by the larger benefits accrued, but in
others, it may not be in the nation’s interest to allow harvest when the payback is so

DISCUSSION DRAFT
44
low. Even in the latter case however, because of corruption or simply bad
management, trees are often cut even when it is not in the country’s interest.
Conflicting objectives
Clearly, many of these objectives are in opposition, and costs are not borne equally.
Given such market failure, there is a clear need for a regulatory regime.
A1.2 How Illegality Undermines National Objectives for
the Resource Sector
A country’s legislative framework is such a regulatory regime. As mentioned in the
main text (Part 2), when objectives clash, trade-offs must be made, and this
decision-making is inherently political. Such political decisions are made through a
legislative framework where objectives become policy, which generates law, which
requires regulations for elaboration and implementation.
Given that the legislative framework is how a country turns objectives into action, any
failure to enforce its laws and regulations increases the risk of adverse behaviors
undermining the national interest. Where individual behavior is at odds with this
national interest/common good, compliance with the legislative framework is costly,
thus requiring enforcement.
As mentioned in the main text (Part 2), in practice the government’s proper
institutional objectives are not always the sole, or even the primary, drivers of
decision-making regarding how and when the ‘rule of law’ is enforced. This is
because ‘government’ is made up of individual actors—politicians, bureaucrats, civil
servants—whose self-interest is often in conflict with the ‘national interest’.
Corrupt politicians and bureaucrats (including law enforcement) undermine
compliance with the law, and thus the national interest. Public officials may
accept/demand inducements in exchange for: a) allowing the commission of crime

DISCUSSION DRAFT
45
(e.g., accepting bribes to mark trees as harvestable outside a concession); and, b) the
omission of duty (e.g., accepting bribes to ignore violations). In the former case,
officials are directly and undeniably engaged in illegal acts, whereas in the latter
case, officials may maintain ‘plausible deniability’ in their conspiracy to allow
misconduct; they may shirk culpability by blaming their lack enforcement on a “lack
of capacity”. The distinction between acts of commission versus those of omission is
noteworthy “in that those acts involving payments to neglect duty are often more
accepted by society and, therefore, more deeply entrenched. A ‘naming and
shaming’ approach is less likely to be effective in increasing accountability. Further,
from an accountability and enforcement standpoint, it is more difficult to prove a
deliberate neglect of duty than it is to prove the direct involvement of officials in
illicit acts” (Blundell & Harwell 2010).
Specific acts of commission and omission that undermine the national interest
include, inter alia:
Inefficient revenue collection
Rent-seeking and rent-seizing officials7 use their position to solicit bribes in exchange
for permits, licenses, and concessions, for a stakeholder interest in an operation,
and/or allowing unrecorded/undervalued production—all of which reduce state
revenue.8 Major sources of loss include unnecessary tax breaks9 (and other
7 We use the term rent seeking to mean the use of influence to seek undue privilege, e.g., to obtain in/direct
involvement in commercial operations (e.g., officials abuse their entrusted power to obtain concessions for
themselves or their families [nepotism] or their associates [cronyism]). In contrast, rent seizing is when officials use
their position to control the distribution of rents (taxes, fees, contracts), e.g., writing regulations that favor their own
or associate companies (Blundell & Harwell 2010).
8 In 2011, globally, illicit outflows were almost $1 trillion, 80% from commercial tax evasion, the rest primarily from
laundering of the proceeds of crime, as well as corruption and bribery (Kar & Le Blanc 2013).
9 Globally between 2-6% of total GDP may be lost due to inappropriate tax incentives (Kumar 2013).

DISCUSSION DRAFT
46
incentives) and the acceptance of inappropriate transfer-pricing10. A lack of
transparency around such incentives leaves them open to corruption.
Failure to implement best practices and sustainable
management
Corrupt officials grant permits that allow the degradation of resources, which
undermines the long-term availability of resources and the function of ecosystem
services.
Inequitable distribution of costs and benefits from natural
resources
Investor protection is given primacy, undermining not just the national interest, but
human rights, property and usufruct rights, and environmental policy (such as climate
change mitigation).
Financial crime & organized crime
Having profited from the illicit activities detailed above, operators must then launder
the money into the legitimate financial system. The forest sector’s large capital
requirements, its international market, and sales in hard currency attract organized
crime looking to launder money. (Indonesia, for example, has made illegal logging a
predicate crime for money laundering.)
10 Inapprorpriate transfer pricing is where operators over-price their imports or under-price exports, as well as
manipulating fees for services, the use of intellectual property, etc., as a method of shifting profit from one country
to another. In this way they can move profits from a high-tax jurisdiction to a low- or no-tax jurisdiction. “The
extractives industry…is often cited as the worst offender” (Kumar 2013).

DISCUSSION DRAFT
47
A1.3 The Legislative Framework Related to Land
Clearing
With an understanding of why a legislative framework is necessary to protect the
national interest, as well as an understanding of how/why illicit activities undermine
these objectives, we now turn to the ‘rule of law’ related to forest clearing for
industrial agriculture. In this section we develop an ‘idealized’ pathway, beginning
with policy-formulation, through to the actual harvest and removal of trees. Based
on this pathway we then discuss where and how illegalities can intervene in the
process of deforestation for industrial agriculture
As mentioned, the legislative framework (policy laws regulations) around land
clearing sets out the ‘rules of the game’ regarding how the sector may operate.
With respect to industrial agriculture, a legislative framework based on the principles
of good governance and implementing best practices with respect to industrial
agriculture covers all steps in the process, progressing from land-use planning,
through allocation of concessions, operational planning, implementation of a
hierarchy of actions to mitigate harms, and into operations including site preparation,
which starts with the clear-cutting of forests to clear the land for pasture/plantations.
More specifically the process includes, inter alia:
Land-use planning
The most fundamental decision in the land clearing process is deciding what to
do/where. Based on land- and resource-policy objectives and strategic planning, the
government determines why certain uses may occur in certain areas and not in
others. Such decision-making must be participatory, inclusive of local governments,
landowners, and affected populations, and nested within different levels of
government.
DISCUSSION DRAFT
48
Change of zoning
In some cases, it may be in the national interest to change the zoning of a certain
forested area to allow a different use—germane to this paper: a change from forest
to agriculture. Such decision-making must be transparent, through a process that
includes public consultation, especially with affected communities.
The allocation process
Once an area is zoned for a particular use, and prior to allocating the rights to
operate, the regulator must ensure that there are no pre-existing rights/claims on the
given piece of land. Such assessments are facilitated through a clear gazettement
process (including field demarcation) with information on title/tenure registered into
a cadaster of land rights. Even when they do not hold ownership rights,
communities affected by proposed land clearing are entitled [at least under
international law] to free, prior, informed consent [FPIC]. This role in decision-
making is seen as a right in and of itself, but also as a safeguard for all other rights.
Providing there are no competing rights-holders, a preliminary impact assessment is
required to ensure that the permitted use will not unacceptably undermine
ecosystem services and/or community interests. Complete avoidance of harm is
desirable but where it is not possible, mitigation will be necessary to reduce the
harm to acceptable levels. At the end of this hierarchical approach to managing
negative impacts, proponents may be required to offset the harms that do remain,
further incentivizing as much harm reduction as possible.
Permitting
Once it is decided that the anticipated impacts are permissible, the government must
choose an operator [/licensee/permit-holder]. In order to maximize government
revenue, a competitive tendering process may be required to select the ‘winning’
operator. But in order to ensure that the winner is a company able to operate

DISCUSSION DRAFT
49
responsibly, a pre-qualification process is necessary to screen out all those that
have neither the technical nor financial ability, as well as those with outstanding
tax liabilities, and those that have committed gross violations of human rights.
Governments will to see the company’s business plan (including financing
arrangements) to verify that the company’s operation plan is financially viable.
Further, a performance bond may be required to ensure that companies fulfill
their responsibilities once operational. In many cases, an Inter-ministerial
Committee is empanelled in order to evaluate permits for large concessions.
Likewise, in many cases, the financial bid is not the sole criteria. Even though the
pre-qualification process ensures that only acceptable applicants may bid, the
government may include technical criteria in order to select the ‘best’ winning bid.
Environmental and social impact assessment
Under best practices, the winning company is first required to complete its own
environmental and social impact assessment (ESIA). This ESIA is more
detailed/company-specific than the initial government-led preliminary impact
assessment. Again, the avoidance/mitigation/offset hierarchy is employed to
optimize harm reduction and ensure that only permissible harms will occur. Where
‘clean-up costs’ are identified, the company must post a bond that will cover any
anticipated costs based on an outside company completing the clean up, should the
operator be unable (e.g., due to bankruptcy). The company must also consult with
communities about avoiding sites of important cultural and economic use (such as
religious areas and ‘forest gardens’—areas in the forest that people have ‘enriched’
by planting and/or tending to valuable species).
ESIAs require companies to consult affected communities. Local people will have
their own perception of what the agricultural project will bring (both good: jobs,
benefits-sharing, opportunities for small-holder participation, etc.; and bad: erosion,
pollution, deforestation, etc.). It is in company’s interest to modify their impacts—by
DISCUSSION DRAFT
50
modifying operational plans—to align with the communities’ expectations. Where
this is not possible, it is further in the company’s interest to manage public
expectations by working—through sensitization—to better align expectations with
reality. When expectations are out of line with reality, the company will fail to
satisfy the local community and will generate grievance—communities may
prevent the company from operating (through protests, blockades, arson, etc.) and/or
the company may try to coerce communities into compliance. When expectations
are in line with reality, however, the company is able to generate satisfaction
within the community, thus helping obtain the social license to operate.
Mapping and field delineation
Prior to operating, the company must demarcate in the field the exact boundaries
of their operations according to their business plan. This includes mapping setbacks
(slopes, water courses, culturally important sites, areas of high conservation value,
etc.) where operations are to be avoided, if not prohibited. Having identified these
‘no-go’ areas, the company must then identify and map the blocks in the field
where forest is to be cleared. This mapping will include an assessment of timber
volume and value (in part to ensure appropriate taxes and royalties/stumpage are
collected).
Annual operational plans
Based on the above, and prior to beginning ground operations, the company will be
required to report its more detailed annual management plan, including impacts
on: a) communities (based on community consultations, company social agreements
that outline, inter alia: avoidance of culturally important sites; requirements for the
purchase/use of local goods and services; benefits sharing); b) labor (practices
relating to hiring and contracting; working conditions [e.g., salaries and other
compensation; freedom of association], etc.); c) security arrangements; and d)
environmental standards of practice.

DISCUSSION DRAFT
51
Deforestation
The actual forest clearing process likely includes a prohibition on the use of fire,
and regulations related to: a) mechanical slash removal; b) appropriate soil
preparation (in part to avoid unnecessary carbon emissions); and c) the sale of wood
and other forest products harvested during clear-cutting.
Government revenue
In addition to various permit-, license-, inspection-, and other fees, government will
require companies to pay taxes and royalties throughout operations, including,
inter alia:
Income tax (based on net revenue);
Withholding tax;
Turn-over tax (based on gross revenue);
Import & export taxes;
Royalties:
o Stumpage (based on the volume/value of harvest, whether or not
sold);
o Annual land rental for the entire concession area.
Profit-tax on timber harvested11 (based on net revenue [after harvest costs are
deducted] from the sale of all harvested timber); and,
Reforestation fees (based on the cost to replace the clear-cut forest).
11 Called a ‘Timber Replacement Tax’ in Indonesia (see Appendix 3).

DISCUSSION DRAFT
52
Compensation to affected communities
Companies will be legally required to compensate communities affected by
operations, including those with usufruct rights. In addition to compensation for
loss, some countries require ‘benefits sharing’ with affected communities based on
turn-over or on profit; e.g., Indonesian law requires payments framed as ‘corporate
social responsibility’ (CSR). In other cases, social agreements are voluntarily
negotiated between the company and the community during consultation processes
and are not publicly disclosed. In some rare cases, the community itself may
contract out to develop industrial agriculture on their community land; in these
cases, laws/regulations specific to operations on state-land will not be operational.
Unfortunately even in these cases corruption/fraud can result in illegal land clearing
(see the case study of corruption driving the improper allocation of logging
concessions on community-deeded lands in Liberia, which resulted in criminal
convictions of the Managing Director of the Forestry Development Authority, his
directors, and $16 million in fines; Box 1, Appendix 4).
‘Idealized’ vs reality—the case for risk management through
legislation
The above ‘idealized’ legislative framework is the result of an assessment of the risk
posed by the various illegal behaviors (identified above, A1.2) on the national
objectives for natural resources, including land (A1.1). Based on this risk
assessment, risk management requires countermeasures to reduce the likelihood
that the harms occur, or at least to reduce their impact. As mentioned in Part 2,
countries manage this risk through the implementation and enforcement of their
legislative framework.
While in reality, not all countries have all the necessary countermeasures referred to
in the section above (A1.3), most countries do have a relatively comprehensive

DISCUSSION DRAFT
53
legislative framework. As is the case in forestry, where most countries have
‘relatively good’ laws and regulations, the problem with deforestation related to
industrial agriculture is that all too often the legislative framework is simply
ignored, either in the name of economic expediency or, worse, corruption.
Conflicting laws & regulations
Another problem is that, in practice, the legislative framework is often the result of
decades of law-making and multiple agencies drafting their own regulations. Not
surprisingly, often, laws and regulations appear to contradict each other (e.g., in
Indonesia, some regulations at the regional level contradict federal Ministerial
regulations). At best, such a conflict makes it difficult for companies to know how to
behave legally, at worst the legal uncertainty provides ‘cover’ for illicit activities. In
practice, jurisprudence exists to determine how to resolve such contradictions; at
the very least, unless otherwise noted, the most recent law takes precedence
(provided it complies with the nation’s constitution). The existence of conflicting
laws and regulations should not be an excuse for illicit behavior.

DISCUSSION DRAFT
54
A1.4 The impact of illegality associated with
deforestation & industrial agriculture
These illegalities serve to undermine the ‘rule of law’ and, thus, the ability of the
state to achieve its objectives. This translates into direct and indirect harms, many of
which have financial implications related to the four major types of capital (Part 2;
Figure 1): Financial Capital; Natural Capital; Political Capital; and, Social/Human
Capital. These broad impacts manifest in a number of harms/losses at the national
scale, including:
Financial Capital
Diversion of state assets and decreased revenue capture by government.
An increase in financial crime and associated organized crime.
Illegal use of fires to clear forest, which:
o Requires fire fighting, with costs borne by the state;
o Impacts the economy directly and indirectly (like cancelled flights and
reduced shipping due to the haze); and
o Jeopardizes human health, manifesting in increased morbidity and
mortality.
Natural Capital
Decreased/degraded ecosystem function:
o Hydrologic cycles (e.g., changing rainfall patterns in the Amazon);
o Water quality (e.g., siltation, pollution) and quantity (e.g., retention and
smoothing of water flow during dry seasons, including for irrigation);
o Air quality (e.g., haze), which can contribute to global climate change;

DISCUSSION DRAFT
55
o Soil quality (e.g., erosion and productivity/fertility), landslides, and
other property damage; and,
o Invasive species and the loss of pollinators and other beneficial
plants/animals.
Decrease in the value of natural assets, including those used by local people
for, inter alia:
o Farming sites used by swidden agriculturalists;
o Biodiversity (including bio-compounds with potential pharmaceutical
use, as well as other intellectual property)
o Timber and other building materials; and,
o Non-timber forest products, many of which have commercial and/or
cultural value, including inter alia:
Food varieties;
Fibers and plant products; and,
Medicinals.
Political Capital
Institutions become distorted when laws, policies, and institutional behaviors
are structured in ways that allow corrupt elites to improperly grant rights to
resources in a way that is direct, exclusive, and discretionary.
Decreased reputation, as institutions (both governments and companies) are
undermined and corruption/incompetence increases, the perception of risk
also increases, leading to, inter alia:
o Decreased investment and decreased economic growth;
o Decreased market access/share and/or price;
DISCUSSION DRAFT
56
o Decreased credit-worthiness; increased cost of borrowing; and,
o Decreased development assistance, including technology transfer;
o All of which undermines development.
Corruption of campaign financing, which undermines local elections, and
democracy more broadly.
Human/Social Capital
Loss of access to forest and forest products for local people
o Threatening lives, livelihoods and entire cultures;
Food security is undermined;
Incomes decrease; and,
Coping strategies are jeopardized (e.g., people are unable to
rely on forest products when subsistence agriculture is
compromised by drought).
o Marginalized people are most threatened;
Women may be disproportionately affected when forest-based
livelihoods (subsistence farming, collection of forest products)
are exchanged for male-dominated plantation jobs (with
preference often given to outside labor pools, who are seen as
more compliant than local laborers).
Indigenous people, living in closest proximity to the site[s] of
deforestation bear the most losses; in some cases the identity
of people are tied directly to physical attributes associated with
the forest (e.g., with important plant/animal species)—the loss
of which, threatens their very existence as an ethnic group.
DISCUSSION DRAFT
57
Increase in local grievance and land/resource conflicts, which, apart from
overarching human rights and well-being considerations:
o Require law enforcement and security expenditures;
o Cause interruptions to agricultural production/transportation; and,
o Undermines local title/tenure and other rights.
Caveats
The above is a generic list of the costs borne by countries when deforestation
proceeds illegally in order to expand industrial agriculture. We stress that not all
costs are equal, nor are they borne equally. Moreover, our ability to estimate costs is
not the same for all losses—there is variation in uncertainty regarding both the
likelihood of the loss and the magnitude of the cost. Indeed, in attempting to
quantify some harms we risk under-valuing the severity of the loss when we fail to
measure adequately the more abstract impacts. Moreover, it is not our intention to
suggest that only those impacts that can be quantified are those worth
acknowledging and addressing.
DISCUSSION DRAFT
58
APPENDIX 2: COSTA RICA
We have been able to demonstrate benefits – through
environmental education, watershed protection and ecotourism.
There is no real opposition to the idea of sustainability – we just
have to eliminate indifference. People should say “we need national
parks” with the same delight that they say “we don’t need an army”.
- Mario Bosa, Coordinator, Wildlife Conservation Society, 1995
In the late-1980s, the Government of Costa Rica became convinced that national
accounting systems that “recorded only the consumption value of natural resources,
and did not account for losses of natural capital, such as standing trees”
underestimated the true value of the nation’s forests (Brown and Bird 2011).
Export success “measured in current dollars masked the real economic losses
associated with soil erosion and the wider loss of ecological assets.” When the
World Wildlife Fund predicted that all of Costa Rica’s forests would disappear in less
than 40 years it “provoked a national reaction that led to the development of a plan
for reforestation…and the offering of tax incentives and financial support to those
who were willing to plant trees” (Castro 1997).
Up until then Costa Rica’s agricultural policies provided high subsidies, tax
incentives, and guaranteed prices, preferential interest rates (i.e., cheap credit), and
low land taxes.12 Costa Rica also had poorly defined property rights (i.e., insecure
12 Forested landowners paid higher land taxes than owners of cleared land (Brockett & Gottfried 2002).

DISCUSSION DRAFT
59
land tenure that rewarded land clearing in order to get formal title13), a corrupt
bureaucracy managing forests (Brockett & Gottfried 2002), and high private discount
rates, all of which encouraged the expansion of agriculture into forested areas
(Persson & Munasinghe 1997). When the economic crisis of 1979 hit with its high oil
prices and interest rates, Costa Rica found itself in a recession despite its political
stability. Banana and coffee prices—which dominated the agricultural sector—hit an all-
time low. In response, Costa Rica increased its export-led policies, including tax-free
zones for foreign investment and tax breaks for agriculture that was associated
with deforestation, especially cattle ranching. The environmental impact was
profound: in the 1960s two-thirds of the country was forested; by 1987, only a fifth of
its forest was left (REDDdesk 2015). The World Bank estimated that 80% of this
deforestation was for pasture and agriculture, nearly all on privately owned lands
(Ortiz Malavasi & Kellenberg 2012).
Fisher (2004) examined the relationship between deforestation and the economy in
Costa Rica, estimating the impact of the growth in: population; GDP; and, agricultural
production; as well as the impact of yield (multiplied by the value of exports) for
agriculture, ranching, and logging, harvested both sustainably and conventionally. In
her model, 55% of the variation in deforestation was explained by these variables
(P<<0.05)—suggesting that market forces do play a role in the landowners’ decision
to convert forest lands to non-forest uses. That is, according to her model: in 1995,
for every $1,000 increase in expected value of non-forest uses, 113 ha of forest were
destroyed; whereas, for every $1,000 increase in expected value of sustainable
forest/land use, 3,050 ha of forest were preserved (although neither on its own was
significant in her model). Fisher’s bottom line was that it would cost $44.73/ha/yr in
13 Cleared land (with formal title) was worth twice as much as forested land, moreover when squatters cleared the
land illegally, buyers of the land were not prosecuted provided they purchased the land “in good faith” (Persson &
Munasinghe 1997).
DISCUSSION DRAFT
60
order to stop deforestation completely across Costa Rica, or about $60.8 million
per year in 1995$. (In 2015$, these are the equivalent of ~$70/ha/yr and ~$95
million/yr to halt all deforestation.)
In contrast, Kishor and Constantino (1993) estimated that the ecosystem services
provided by Costa Rica’s tropical forests were worth more than14 $165-
214/ha/yr, including:
$120/ha/yr for carbon sequestration;
$15-25 for ecotourism;
$10-20 for hydroelectric power protection;
$7-17 for other hydrological benefits;
$13-32 for existence and options values; and,
$0.15 for pharmaceuticals from bioprospecting.
In 1990, without putting a value on it, the Ministry of the Natural Resources
[Ministerio de Recursos Naturales, Energía y Minas. 1990] cautioned that
deforestation was undermining:
Access to construction materials and other wood products;
Unchecked species of plants and animals that have possible and future
uses for consumption and industrial production;
Recreation and eco-tourism;
Control of erosion and sedimentation; and,
Education and research possibilities.
14 Kishor and Constantino (1993) acknowledge that their estimate is conservative as they were unable to quantify many
other ‘values’.

DISCUSSION DRAFT
61
The government “recognized the economic importance of natural forest
environmental service and their contribution to the local and global societies”
(Castro 1997). “The best estimate of the loss to Costa Rica in the depreciation of
the value of its forests, soils, and fisheries from 1970 to 1989 was the equivalent
of the gross domestic product for an entire year” (Brockett & Gottfried 2002). The
$60.8 million cost (estimated by Fisher 2004) to protect ecosystem services valued at
more than $225 million (by Kishore and Constantino 1993), not to mention more than
$2.7 billion per year (under Costanza et al. 1997), seems like a relative bargain.
Indeed the socially progressive government of President Arias realized that
deforestation was more costly to Costa Rica than the alternative, but that private
landowners needed incentives to reverse the trend in deforestation (e.g., Castro
[1997] estimated that producers earned $50/ha/yr in 1997 raising cattle). The
government’s ‘first generation’ policies—that focused on reforestation through
improved access to credit and technical assistance15—had been insufficient. Thus, in
1986, the forest sector was declared a ‘state of emergency’ (Navarro & Thiel 2007)
and a ‘second generation’ of policies was based on the concept of sustainable forest
management (SFM), including the first direct ban on forest conversion (Brown and
Bird 2011). A network of protected areas was created including 100,000 ha of private
land (Castro 1997). Policies continued to evolve with ‘third generation’ resource
management laws, including the Forest Law 7575 of 1996 that reinforced the ban
on deforestation and replaced perverse incentives with those meant to
compensate owners for the conservation of forest functions.
Natural Capital
Pagos por Servicios Ambientales [PAS]
One of the landmark incentives was the Payments for Environmental Service (see
15 Including the 1979 National Forest Policy.

DISCUSSION DRAFT
62
Box 4), administered by the Ministry of the Environment and Energy [Ministerio de
Ambiente y Energía (MINAE)] and financed primarily (~80%) through a 3.5% tax on
fossil fuels (~$10 million/yr in 2006; [Allebone-Webb et al. 2013]) and, to a lesser
extent, payments from beneficiaries and other sources.16 There are three types of
PAS contracts (Ortiz Malavasi & Kellenberg 2012):
1. Forest conservation contracts (85% of all contracts): $210/ha (equivalent to
$42/yr/ha), disbursed evenly over a five-year period (renewable) and targeted
at the conservation of existing forest.
2. Sustainable forest management [SFM] contracts (9% of all contracts): $327/ha,
disbursed over a five-year period, requiring SFM easements and a 15 year
commitment by the landowner
3. Reforestation contracts (6% of all contracts): $537/ha, disbursed over a five-
year period, requiring reforestation easements (with a commitment of 15-20
years, depending on the species planted).
Between 1997 and 2008, over 10,000 PSA contracts were issued across 500,000 ha (a
fifth of the country's forested area), $206 million was paid out to private landowners
(an average of $17.2 million/yr), and forest cover increased back to 50% (Allebone-
Webb et al. 2013). One criticism is that the high transaction costs favor relatively
wealthy landowners, typically those with larger farms. Indeed by 2008, 76% of PSA
funding had gone to farms larger than 30 ha (Brown and Bird 2011).
Regardless, according to an analysis of satellite images of the Sarapiquì region,
Arriagada et al. (2012) estimated the impact of the PSA program between 1997-2005
16 Including a forestry tax; a World Bank loan (through the Eco-markets Project 2001–2006); grants from: GEF; the
German government (for forest protection); the Norwegian government (for carbon sequestration), Conservation
International (for agroforestry contracts and tree planting), and the World Bank Mainstreaming Market Based
Instruments for Environmental Management (MMBIEM) project (Allebone-Webb et al. 2013).

DISCUSSION DRAFT
63
was to increase forest by the equivalent of about 10%-15% of each farm’s pre-PSA
forest cover,17 at the cost of approximately $43/ha/yr (which increased to ~$62/ha/yr
in 2006). Ignoring administrative costs (estimated at about 5%) and assuming that
the effect on forest cover was realized immediately and sustained over the eight-year
contract period, they estimate PSA cost-effectiveness of $255 to $382/ha/yr of
additional forest.
Carbon markets
In order to capitalize on the largest component of their ecosystem services, Costa
Rica pioneered the use of carbon-market mechanisms to reduce deforestation
through the Foundation for the Development of the Central Volcanic Cordillera
(FUNDECOR18), an NGO dedicated to restoring forests on privately held land in part
through carbon offsets aimed at international buyers. In 1996 Costa Rica sold its first
~734,000 tCO2e of certified emissions-reductions to a consortium of the Norwegian
government and energy companies for $36.70/tCO2e (Castro 1997). Further, in 2005,
Costa Rica and Papua New Guinea were the first to propose a mechanism within the
United Nations Framework Convention on Climate Change to reduce emissions from
deforestation. The Ministry of the Environment estimated savings of $50 billion “if
countries that have comparable advantages, such as fast-growing tropical forests,
develop joint implementation activities” to reduce emissions by 20% within 20 years
(Castro 1997). In 2007 Costa Rica became one of only four countries to commit to
becoming carbon neutral by 2021.
17 Because the analyses use remotely sensed forest cover, they cannot identify the quality of the forest or quantity of
ecosystem services gained, nor can they determine exactly how much of the PSA’s impact in the Sarapiquì region
comes from preventing the clearing of mature forest versus encouraging forest regrowth.
18 The interest from the fund was meant to cover all administrative costs for the first 11 years of activity.

DISCUSSION DRAFT
64
Other ecosystem service payments
In addition to emissions reduction, Costa Rica identified three major ecosystem
services for which the National Forest Financing Fund (FONAFIO) makes payments
(PPSA):
Protection of water sources;
Provision of scenic beauty; and,
Protection of biodiversity.
Unfortunately, international markets failed to develop and Costa Rica implements
PPSA as a national mechanism funded mainly through tax revenue, particularly from
hydrocarbons (REDDDesk 2015).
Water
The government also developed the business case for investing in forest cover for
hydroelectric producers. Forests smooth the rate of stream flow (and boost dry
season flow), and trees reduce sedimentation, especially important for power plants
with small (~5 hr capacity) reservoirs (Chomitz et al. 1998). At the time of inception,
PPSAs were expected to increase the price of water for users by 25-40% (Castro
1997). Between 2003 and 2008, the accumulated payments were ~$2,500/farm from
these PPSAs (Table A2.1) and other taxes.
Table A2.1. Sample agreements of payments for environmental services (PPSAs) between
FONAFIFO and private firms in Costa Rica. (Source: Ortiz & Kellenberg 2012).
Firm Watershed Watershed
Area (ha)
Contract
Area (ha)
Amount
(US$)
Energia Global Río Volcán
Río S
Fernando
5,870 4,311 $53,340
Hidroeléctrica Río Platanar 3,129

DISCUSSION DRAFT
65
Platanar
Compañía
Nacional de
Fuerza y Luz
Río Aranjuez
Río Balsa
Lago Cote
9,515
18,926
1,259
5,000
6,000
900
$5,188,400
Florida Ice &
Farm
Río Segundo 3,870 1,000 $272,727
TOTAL 42,569 18,611 $5,514,467
Biodiversity
In 1992, the first contract between the Costa Rican Biodiversity Institute (INBio) and
the pharmaceutical giant Merck was approved (Castro 1997). While “it is
extraordinarily difficult to assign a monetary value to biodiversity”, Chomitz et al.
(1998) considered the value to be low (at most $2/ha/yr for bioprospecting rights,
likely much less). Although, at the national level, they believed that prospects were
good due to Costa Rica’s “good logistics, a stable legal and institutional environment,
and ancillary information that increases the chance of finding a valuable
biochemical”.
Ecotourism
In addition to the forest owners, a major beneficiary of Costa Rica’s reform of its
forest policies has been the tourism industry (now approximately 12.5% of GDP; $5
billion in 2015 [World Economic Forum 2015]). In fact the relationship is symbiotic;
eco-tourism has helped reinforce the pro-environment policies. In 1999, Costa Rica
received one million foreign tourists for the first time. Since rebounding from the
global recession and concerns about terrorism, Costa Rica now welcomes more than
2.5 million international tourists each year (more than one-third of all visits to Central
America).

DISCUSSION DRAFT
66
Compliance
Agriculture, predominantly pineapples and bananas, requires substantial capital
investment, which makes their owners cautious about breaking the law, especially
when enforcement is likely (remote sensing is a useful law enforcement tool for
detecting illegal land clearing). “Furthermore, because their crops are destined for
export markets, where environmental concerns and issues like traceability loom large”
growers are likely to be compliant and avoid deforestation (Arriagada R et al. 2012).
“In contrast, many cattle ranchers are relatively small operators, whose product is
consumed locally, providing less of an incentive to respect the deforestation ban.
Similar developments have been observed with soy and cattle production in parts of
the Brazilian Amazon.” Thus, in the absence of financial incentives to maintain
forests, landowners would likely be tempted to allow deforestation to create more
pastureland.
Fortunately for Costa Rica, the policies appear to be working. Since the 1996 ban on
deforestation, the loss of mature forest has almost halved to 1.2%/yr19, and despite a
tripling in area under cultivation, “the proportion of pineapple and other export-
oriented cropland derived from mature forest declined from 16.4% to 1.9%”, with the
vast majority of cropland expansion replacing “pasture, exotic and native tree
plantations, and secondary forests” (Fagan et al. 2013). This is also despite the fact
that, in 2004, 40% of farmers said that they would have cleared forests if legally
permitted (Morse et al. 2009).
19 Deforestation rates elsewhere in Latin America exceeded 5%/year, on average (Fagan et al. 2013).

DISCUSSION DRAFT
67
Summary
The consequence of Costa Rica’s policy reform was that forested land was
reported to have more value than cleared land20 (Brockett and Gottfried 2002).
Indeed, since reversing its policy in the late 1980s, GDP has quintupled (in 2013$),
while forest cover has doubled. Costa Rica has recovered nearly 500,000 ha of
forests, having paid out more than $200 million to forest landowners.
Costa Rica addressed high levels of deforestation through robust policy reform,
including direct financial incentives for private landowners. “Economic reform was
aligned with national environmental priorities in order to achieve policy
coherence” (Brown & Bird 2011); ecotourism has reinforced environmental policies.
“Most of Costa Rica’s progress has been related to improved forest governance,
created through institutional and legal reform processes. More often than not,
the reform of Costa Rica’s forest-related institutions and the reform of legal
instruments have gone hand in hand” (Brown & Bird 2011). Governance decisions
have not only reversed national trends in deforestation and improved economic
performance, but they have reinforced democracy and rule of law more broadly. The
value in protecting forests, recognized three decades ago, has paid dividends—likely
beyond those initially imagined.
20 As one example, Brockett & Gottfried (2002) claim “some financial institutions now accept forested land as
collateral of higher value than cleared land”.

DISCUSSION DRAFT
68
APPENDIX 3: INDONESIA
This section examines the case of Indonesia as an example of how the idealized
legislative framework (identified in Appendix 1) operates in practice. This section
analyzes many of the key opportunities for illegality in the processes of: defining
forest use zones; identifying which areas can be released for conversion to “other
uses”, such as agriculture; allocating rights and operational permits; as well as the
process of clearing forests itself. Also discussed is how the specific illegal practices
undermine relevant policy goals. We then attempt to estimate the impact of these
illegal practices.
Introduction
Indonesia has one of the world’s highest rates of deforestation and carbon emissions,
largely due to the clearing of peat forests. A major contributor to this deforestation
has been the drive to expand oil palm plantations (Greenpeace 2013)—Indonesia is
now the global leader in the production of palm oil. By one estimate (Koh &
Wilcove 2008), half of all Indonesia’s oil palm plantations were established by
clearing natural forest; between 2000 and 2010, some 1.6 million ha of forest were
logged to make way for oil palm plantation and about the same for pulp plantations
(Abood et al. 2015). As outlined below, this expansion has been driven in large part
by government subsidies, but the irony is that—despite being a global leader in
palm oil and emissions from forest clearing—the subsidies that have been claimed
far exceed the actual amount of successful planting. So Indonesia has lost both vast
amounts of forests, as well as vast amounts of financial resources, without getting
the appropriate economic development. These losses are further compounded by
the fact that widespread illegal practices have subjected Indonesia to even more
losses. The next section outlines the legal requirements in the sector and the

DISCUSSION DRAFT
69
impacts of the frequent violation of this framework on forests, people, state
institutions, and state revenue.
Legislative framework & illegal practices
Part 2 and Appendix 1 outlined an ‘idealized’ typology for national objectives being
translated into a legislative framework, and on paper, Indonesia’s legislative
framework is relatively consistent with these best practices. But in practice, the goals
and the legislative framework are severely undermined by the persistence of
corruption and a failure to enforce the law.
Tax breaks/low interest loans/corrupt land use planning
The growth in oil palm and pulp sectors have come at a large cost to government, in
part through incentive programs (such as low/no-interest loans) used to promote
expansion. Officially, the Government of Indonesia (2011) views oil palm as a key
sector to launch its economic growth to become one of the largest economies in the
world.
Worldwide, increased demand for oil palm (including for ‘green’ biofuels) has
contributed to the expansion of the sector, and Indonesia in particular has benefited
from this demand as it is perceived to have a suitable climate, low land rentals, and
low labor and fuel costs. Indonesia’s energy policy21 called for the national energy
mix to include 5% biofuel use by 2025, and heavy industry to use at least 15%
biodiesel by 2020. District and provincial governments were also directed by
presidential decree to facilitate land acquisition for the expansion of plantations
needed to meet this increased demand, which the World Bank has estimated would
require an additional 1.4 million ha of plantations. International targets to meet
21 Presidential regulation 5/2006

DISCUSSION DRAFT
70
climate change goals,22 met in part through biofuels like oil palm, compound this
domestic demand.
Since 2006, a series of regulations provide direct incentives to develop or expand
plantations, including subsidized loans and credit at preferential rates (Casson et al.
2014). Oil palm companies are also eligible for income tax breaks, accelerated
amortization and depreciation, and a government guarantee against operational
losses. Foreign investment in particular is encouraged by allowing up to 95% foreign
ownership, whereas only 45% is allowed in most other sectors. In the area of
licensing, land use permits for plantation were expanded from 35 years to 60 years,
with extensions expanded from 25 years to 35 years,23 and the maximum land area
allowed per company doubled from 50,000 ha to 100,000 ha [for plantations in
Papua or West Papua the maximum is 200,000 ha].24 These incentives come at the
cost of foregone government revenue.
Key incentives have been extremely low export taxes on Crude Palm Oil and the
newly established Crude Palm Oil Support Fund. Through the early 2000s, export
tariffs were held below 5%, but in July 2015, faced with continuing decline in palm oil
prices, the government eliminated the export tax when Crude Palm Oil prices dip
below $750/t, which has not been exceeded since July 2014.25
Despite the lucrative incentives, concessionaries are slow to begin planting oil palm,
even after forests have been cleared. In Kalimantan alone, one of the centers of oil
palm development, Carlson et al. (2012) estimated that 79% of the area allocated for
oil palm up to 2010 had not been successfully planted. Although some of this lag is
22 e.g., India and the EU have mandatory targets of 20% and 10%, respectively, of all fuel use to be derived from
biofuel by 2020, and China has a mandatory target of 15% for transportation by 2020 (FAO 2008).
23 Investment law 25/2007
24 Ministry of Agriculture Decree 26/2007
25 When prices rise above the threshold, the tariff is $50/t Crude Palm Oil & $30/t for processed palm oil.
DISCUSSION DRAFT
71
due to plantation failure (and a lack of adequate due diligence on the part of
government to certify company capacity and monitor performance), the failure of
plantation establishment is also driven by persistent corruption that facilitates
otherwise illegal land clearance and timber theft. In many cases, fraud allowed
operators to profit from the harvest of trees and then to claim tax credit even
though reforestation and planting never occurred (KPK 2013).26
National Forest Estate Gazettement and Land Use Planning
As in the ideal, the first step in land-use planning in Indonesia is deciding what to
do, where, including the allocation of land for industrial agriculture. Land-use
boundaries include demarcating forested and non-forested land. For land identified
as forest, the Ministry of Environment and Forestry (MoEF)27 claims sole authority to
designate different use zones or “forest functions” based mainly on criteria related to
physical features (e.g., slope, soil type, rainfall, and resulting expected density of
timber species, and wildlife habitat). These use-zones dictate where forests will be
protected, where it will be used for a variety of production forestry schemes (where
forest cover is to be maintained), and where the forest can be converted to
silviculture or other non-forest uses, such as industrial agriculture. Some 70% of
Indonesia’s land mass has been designated within this Forest Estate (Kawasan Hutan)
and, thus, under the authority of the MoEF.
26 e.g., PT MHB (whose director, Probosutedjo, was a step-brother of former President Suharto) fraudulently reported,
and charged reforestation funds, for planting 79,452 ha of pulp plantations in Kalimantan during 1996/97, while only
20,000 ha had actually been planted (Pirard & Cossalter 2006).
27 Note that the Ministry has frequently changed names and corresponding authority. It was known as the Ministry of
Forestry from 1965-1998. In 1998, when oil palm was starting to boom, the ministry expanded to become the
Ministry of Forestry and Plantations. In 2000, however, the ministry again reverted to its forestry-only mandate, until
2015 under President Joko Widodo, when it became the Ministry of Environment and Forestry, likely in anticipation of
climate change financing in the forest sector.

DISCUSSION DRAFT
72
Until 2013, when a Constitutional Court case brought by district heads found the
practice of designation to be unconstitutional,28 most forest management rights were
designated by the MoEF without participation of local stakeholders, without
investigating pre-existing rights, and without demarcation of boundaries in the
field—a process collectively termed ‘gazettement’. The Ministry admitted in 2009
that only 12% of the total Forest Estate had been gazetted as required by law (Safitri
et al. 2015).
Also by law, designation of forest function for a given area is only the first step in
the process of enacting forest use zones. After these zones have been delineated on
a preliminary basis by the central ministry, an integrated boundary committee led by
the provincial government and including local-level administrative and forestry
officials must finish the formal “gazettement” process for the national Forest Estate.
This process, known as micro-delineation, involves fieldwork to physically identify the
boundaries of forest use zones in the field, investigate pre-existing rights to the area
including local community uses, and resolving any overlapping claims. Then,
according to the law, the provincial authority must install permanent boundary
markers in the field, map them (at a minimum of 1:100,000 scale), and then file the
map, along with a report signed by the committee (Berita Panitia Tata Batas, BPTB),
in the state’s ‘land gazette’.
In the rare case when this process has been undertaken, the information derived
from the formal gazettement process remains not only inaccessible to the public, it is
not even shared across sectors or between the central ministry and local districts; a
state of confusion that has led to overlapping extraction/use rights being issued by
different ministries, or even the same ministry, or even by the same single district.29
28 Constitutional Court ruling 45/PUU-IX/2011
29 As one example, in 2012 the KPK reported that over 5700 mining licenses were overlapping with other mining
licenses; this doesn’t even include overlaps with other sectors or local claims (KPK 2015.)
DISCUSSION DRAFT
73
One of the primary purposes of the gazettement process is to identify pre-existing
rights, and to resolve these issues so as to avoid overlapping claims and to clarify
tenure rights to land issued as concession. The 1999 National Forest Law specifies
that only forests that are unencumbered by pre-existing rights can be defined as
State Forest (Hutan Negara) and under the management authority of the MoEF.
Under the National Forestry Law, then, the existence of pre-existing rights to forests,
such as those of recognized customary communities, makes such land ineligible for
allocation as forestry or plantation concessions. Further, all land intended for non-
forest use is under the jurisdiction of the National Land Agency (Badan Pertanahan
Nasional, BPN) and the National Agrarian Law. However, if land is in the Forest
Estate it must first be released by the MoEF in order to be converted to other uses.
This process is explored in later sections below.
Illegalities in the forest gazettement process and their impacts
As noted above, as recently as 2009, the vast majority (88%) of the Forest Estate had
never been demarcated or enacted through the formal gazettement process. This
meant that the Ministry was routinely allocating land on which there were likely pre-
existing rights, including not only rights of local communities but even other
concessionaires from other sectors. This abrogation of the ministry’s responsibilities
to ensure that State Land is unencumbered led to the current insecurity around
title/tenure, which has facilitated both corruption and widespread conflict, often
turning violent.
There are many estimates of the scope of overlapping claims and conflicts, but by
any measure they are endemic. In 2012 the Corruption Eradication Commission
reported 1,918 agrarian conflicts between communities and companies, with 375
overlapping plantation permits in the province of Central Kalimantan alone (KPK
2015). That same year, President Yudhuyono told the press that his office had

DISCUSSION DRAFT
74
received reports of 8,495 conflicts for 2012 alone, 2,002 of which were “likely to erupt
into violence”.30
At around the same time that the Ministry openly admitted its failure to comply with
the formal gazettement procedures, the Corruption Eradication Commission (KPK
2015) conducted a risk assessment of the sector and found gazettement, spatial
planning, and licensing processes to be a significant opportunity for corruption and a
substantial source of state losses. The research found that state losses from
uncollected taxes and fees in the sector were roughly $3.5 billion annually.
Spatial planning and release of land from the national Forest Estate
Closely associated with the forest gazettement process taking place at the Ministry
level is the national spatial plan, a macro-scale process intended to complement the
twenty year National Long Term Development Policy.31 The national plan is intended
to create a cohesive national land strategy and to act as a framework for a planning
processes at provincial and district levels. The framework seeks to achieve security,
economic competitiveness and viability, and sustainability in the use of land to
enhance national cohesiveness and stability.
Under President Widodo, who came into office in October 2014, the National Mid-
term Development Plan defines the national vision as supporting a self-sustained,
progressive, fair, and prosperous Indonesia, specifically to “expand advantages of
economic competitiveness on the basis of natural resources”. The policy focuses on
“Three Dimensions of Development”: a) the importance of human development; b)
prioritized fields of food, energy/electricity, marine industry, tourism, and
manufacturing; and, c) social and regional equality. The strategy requires “law
enforcement and compliance”, “public safety and social order”, “politics and
30 “South Sumatra Shooting Puts Government in Cross Hairs,” Jakarta Globe, July 30, 2012.
31 Law 26 (2008) on spatial planning.

DISCUSSION DRAFT
75
democracy”, and “governance and administrative reform”. The spatial planning
process is a critical element in the management planning around valuable natural
resources, and so the stakes associated with the decision-making are high.
At the same time, the spatial planning process is both sequential and hierarchical,
with each successive unit of government required to align with the higher level plans.
Meanwhile, with wide authority granted to the districts, coupled with lax [or
incapable] enforcement and accountability for deviations, it is not surprising that
there is a lack of harmonization of the spatial plans among ministries and levels of
government. Moreover, as the process is bureaucratically complex and time
consuming, and with decisions related to allocation of valuable assets at play, it is,
therefore, highly vulnerable to corruption.
A key entry point for corruption is the process for changing the land use status of
forest to allow for conversion to “other” (non-forest) uses. This change can occur if a
ministry, governor, or district head argues for its necessity due to:
Social economic conditions, such as regional income, food security, or local
communities activity within a specific area;
Biophysical characteristics, such as the loss of forest cover or land being
designated as “idle”; and,
Political boundaries, such as the splitting of provinces or districts to create
new ones (an increasingly common process known as “flowering”
[pemekaran]).
By law, these revisions of land use zoning must be undertaken as part of the spatial
planning process and, therefore, in alignment with the framework of higher levels of
government. Based on the district’s requests for changes, the provincial government
proposes a revised provincial spatial plan to the Ministry of Public Works, who then
establishes an integrated team to examine the request. The resulting revised draft
provincial plan is sent to the Ministry of Home Affairs for final approval or, if needed,
DISCUSSION DRAFT
76
the Ministry requests changes to bring the provincial plan into alignment with the
national plan. After approval, the provincial government, in coordination with the
provincial parliament, drafts the regulation affirming the change. Once approved by
the provincial parliament, the provincial regulation is signed by the Governor. Then,
in order to be removed from the Forest Estate a request must be filed for the release
of the land, but it must first be zoned by the MoEF as ‘Conversion Forest’.
Otherwise, a revision to the spatial plan is required to change the area’s “forest
function”.
Provided the area meets the above criteria, a request for land to be released from
the Forest Estate is initiated by a proposal from a Minister, Governor, district head, or
leader of a business entity/foundation. The Minister of MoEF appoints an integrated
team of national and provincial technical specialists (the costs of the investigation are
borne by the party proposing the change). The Provincial government provides
“technical assistance” to the MoEF (although it not clear precisely what this assistance
should include). The Minister then reviews this report and decides whether to
approve the request of change.
Once the land is zoned as Conversion Forest, a Governor, district head or mayor may
submit a request for a release of land from the Forest Estate to Other Use. This
request must include a map with a minimum scale of 1:100,000. The Minister forms
an ad hoc team to evaluate the request and produce a survey and an impact report.
If impacts are deemed by the team to be severe, then a Strategic Environmental
Assessment [KLHS-kajian lingkungan hidup strategis] might be required by the MoEF.
Following “technical consideration” the Minister issues a letter of approval in
principle and a recommendation to the national parliament who then issues the final
approval for release. Once the parliament has approved, the Minister issues a formal
decree [surat keputusan] rezoning the area as no longer Forest Estate, thus allowing
other uses, such as industrial agriculture.

DISCUSSION DRAFT
77
Within one year of the release (with the possibility of two 6-month extensions), the
letter holder must conduct micro-delineation of the boundaries of the area.
Illegalities in the spatial planning process and release of land to “Other
Uses”
The Corruption Eradication Commission found that the broad powers granted under
decentralization to local district heads to allocate forest within their jurisdictions,
combined with the limited enforcement capacity (or perhaps more appropriately, the
limited political will) of higher levels of government, makes the release of forests for
conversion a particular chokepoint for corruption (KPK 2015). For example, in a case
study in Central Kalimantan in 2011, the Ministry of Forestry and the Judicial Mafia
Eradication Taskforce (a multi-agency anti-corruption body), revealed that only 67 of
352 plantations had obtained the proper certification of release from the Forest
Estate (which is not to say that the 20% of plantations with proper certification of
release were not in violation of other (un-assessed) regulations/laws).
Misuse of land use revisions
Although the spatial planning law allows land to be released from the Forest Estate if
it is deforested or otherwise degraded, it does not specifically require land to be
degraded in order to designate it for conversion. Indeed, in the past, land that
contains HCVF has been designated for conversion where local government has
argued that the land is required for other uses, including industrial agriculture, to
satisfy societal needs. While a 2011 Presidential Instruction32 prohibits conversion of
peat forests and primary forests on mineral soils, the moratorium only covers “new”
licenses and a lengthy delay before the instruction was issued allowed a flurry of
preliminary permits that still are able to clear natural forest for plantations
32 No. 10/2011
DISCUSSION DRAFT
78
(Murdiyarso et al. 2011). The moratorium also allows exemptions for projects in the
“national interest”, including food production.
Further, corruption is rife on the part of companies and local officials who stand to
benefit from timber sales when richly forested tracts are clear-cut for conversion.
This economic incentive provides motivation to either skip the process altogether
and designate land for “Other Use” without complying with regulations concerning
issues like competing claims or community consultation and/or to manipulate the
process in order to win the desired zoning change.
Illegal encroachment justifying subsequent clearing
Other illegal practices include paying or otherwise encouraging local community
members to encroach on the concession area, so that the government can, therefore,
use this as justification for a change in status to “Other Uses” as the land has
become ‘degraded’. Priatna et al. (2010) surveyed a variety of government and NGO
stakeholders and found that local government authorities often overlook
encroachment so that later it provides them with a stronger argument for requesting
the MoEF to rezone what is now non-forested areas.
Non-compliant Environmental and Social Assessment (AMDAL)
The AMDAL process is particularly relevant to the conversion of peat forests. It is
widely acknowledged as a box-ticking exercise, riddled with blatant fraud, including
common practices of cutting and pasting text from other assessment documents, but
forgetting to change the appropriate details like the specific location names. It is
reported to be an “open secret” that the proponents often pay the consultants and
government commission that reviews the report in order to win a favorable result
(McCarthy & Zen 2010).

DISCUSSION DRAFT
79
Non-compliant Land Clearing Permit
Once a company has completed the requirements for the plantation development
permit and the land use permit, including completing the AMDAL and mitigation
process, investigating and mapping any competing claims and set-asides, negotiating
agreements and compensation with local communities, and established a fire control
program, only then may a company request a land clearing permit (Ijin Pembukaan
Lahan). In order to sell any timber from the cleared land, the company must also
obtain a timber utilization permit. By law, these land clearing & timber utilization
permits are issued by the district head, but they also require recommendation from
the village head and agreement in principle from the Governor, all of which
frequently involve corrupt payments. The permit also requires a copy of the Annual
Activity Report, which will include reports of environmental and social mitigation
measures and monitoring activities as required by the AMDAL, and a report of
number/quality of seedlings ready to plant that is appropriate to the size of area to
be cleared. The local forestry office and the district head convene a joint field survey
to investigate the impacts of clearing and the feasibility of the plantation. These
teams are also vulnerable to corruption and there is little oversight over their
decision-making.
The timber utilization permit, which is only permitted on forests already zoned for
conversion, is issued by the district forestry office, and is a notorious opportunity for
corruption. A timber survey must first be completed in order to determine the taxes
and royalties that will be due on the harvested timber. Likewise, up until 2012, when
it was repealed after intense lobbying by business, operators were not permitted to
make any profit on timber harvested during land clearing. This was accomplished
through what is called a Timber Replacement Fee (basically equal to the net return
[profit] on all timber sold; see below). If the timber survey determines there is more
than 50 m3 of timber greater than 30 cm in diameter, then the company must
deposit a bank guarantee for 100% of the fees due on the expected yield. Local

DISCUSSION DRAFT
80
officials may solicit bribes in order to allow timber utilization permits to be issued for
forests not zoned for conversion and/or to under-report timber value (KPK 2015).
Rates of Illegality
A variety of reports on the scope of illegality make it clear that the sector is wracked
with violations. A government official in the MoEF himself admitted that one
Ministry study put the rate of illegality in the oil palm sector at 80% (Lawson et al.
2014). Central Kalimantan has especially high rates and has been the subject of the
most scrutiny. One district in this province is reported to have 89% of its plantations
in violation of the law (EIA 2014). A third of district heads across the country are
under investigation for corruption, including 13 cases involving corruption relating to
improper allocation of forests to plantation or mining companies (Kompas 2012). The
most common violation is reportedly clearing outside the boundaries of the
concession, which was reported in 61% of concessions analyzed. Indeed many
operators report that the bribes extorted by officials in order to win permits is what
drives operators to try to recoup these losses through such illegal logging activities
(Harwell 2009).
Illegality in the land clearing process is rife. In 2011, Hanif Budi Nugroho, the head of
the Forest Agency in Kotawaringin Timur, a district in Central Kalimantan, reported
that of 52 oil palm firms in the area, not one had obtained an timber utilization
permit, yet all had begun land clearing. In 2004-05, for example, the Supreme Audit
Agency investigated five companies in Central Kalimantan to assess their compliance
with timber utilization permit regulations and found all had undertaken land clearing
but not one had reported the timber from these activities and the local authorities
had failed to monitor compliance (EIA 2014).
A lack of enforcement
One of the prime drivers of illegality is the rampant corruption in the sector (KPK
2015), in part precipitated by the wide discretionary powers of local officials. For

DISCUSSION DRAFT
81
example, the Minister of Agriculture regulation No.14/2009 governing plantation
development on peat forbids the conversion of forest where more than 30% of the
area has peat deeper than 3 meters, but it still allows conversion of peat less than 3
meters. The license holder is expected to survey, delineate, and plant only in areas
that meet the regulation’s requirements. But the regulation is enforced after the
Location Permit is issued, not as part of the pre-licensing screening process. This
means that companies have already invested capital in obtaining the permit and now
face pressure to begin planting in order begin turning a profit. These pressures in
turn create incentives for companies to under-report areas that are greater than 3
meters and for local government to be lenient in enforcement of their protection.
These perverse incentives are exacerbated by limited institutional capacity for
enforcement such as resources for survey and field operations (Paoli et al. 2011).
Although apparently “buying” an AMDAL approval is a common practice, many
companies don’t even bother to get the permit at all, seemingly without penalty. EIA
(2014) analyzed 51 plantations in Central Kalimantan that had already begun land-
clearing activities, and found that only half had obtained the proper approvals.
Further, once approvals are obtained there is virtually no oversight on compliance
(McCarthy & Zen 2005, EIA 2014).
Other opportunities for corruption are the failure of companies to comply with the
standards of performance set out in their operational permits. In many cases non-
compliant companies are even allowed to establish plantations before the company’s
request for further release of land from the Forest Estate for conversion has been
approved. A 2010 regulation (PP33) required proof of procedural compliance with
requirements of the plantation’s development permit and land utilization permit
before a company is issued any subsequent requests for release of Conversion Forest
from the Forest Estate. But this clause was removed in the 2011 regulation (PP17).
Similarly, under the 2004 Plantation Law (UU18), the district head holds the right to
approve or reject a company’s request for expansion of existing licenses based on

DISCUSSION DRAFT
82
field verification of current performance, but there is ample opportunity for
corruption in order to encourage the approval of such requests without conducting
the requisite monitoring and evaluation.
ESTIMATE OF LOSSES
Financial Capital
Government revenue losses on logging
One of the biggest losses to government from deforestation is lost revenue (tax and
non-tax). Several estimates are available for Indonesia, all of the same order of
magnitude: Vit (2015) reports that illegal logging in Indonesia cost government on
the order of $6.5-8.9 billion in lost revenue from 2003 and 2014; similarly, Harwell
(2009) estimated annual revenue loss for the entire country on the order of $1-2
billion from 2003 to 2006.
In this appendix we attempt to update these estimates. Because the Ministry of
Agriculture does not report data to provide an estimate loss, we focus on MoEF data.
Export tax evasion
One of the best sources of data available is on the value of exports of forest-
products, including timber harvested during land clearing for plantations. As shown
in Figure A3.1, between 2009-2013 (the most recent data available), the UN Food
and Agriculture Organization reported ~$2.5 billion more in exports than did the
Ministry of Forestry33 for plywood/veneer + fibreboard + sawnwood. Assuming that
the Ministry of Forestry’s lower value is a result of under-reporting, then assuming an
33 Up to 2013 the Ministry of Forestry was still the MoF, and not yet the MoEF.

DISCUSSION DRAFT
83
average export tax rate of 20%, this tax evasion would result in losses of at least
$500 million in export taxes.
Figure A3.1: Export Taxes Lost Due to Under-reporting for sawnwood, plywood + veneer, and
fibreboard. The solid line is FAO export reports. The dotted green line is Ministry of Forestry export
reports. The numbers between the lines estimate the evaded export taxes, based on the difference
between FAO and Ministry of Forestry reports and assuming a 20% export tax.
What is not clear from MoEF reporting is how much of the exports that went
unreported (and presumably unassessed/untaxed) were associated with illegal land
clearing for industrial agriculture. For a number of reasons, however, it is likely that a
large proportion of this illicit timber did originate in what is termed ‘conversion
timber’ (Forest Trends & KAMH 2014). First, the trade shown in Figure A3.1 does not
include exports of wood chips or pulp—i.e., plantation-grown fibre—and thus, it
contains only wood that likely originated from natural forests. Further, of wood from
natural forests, according to the MoEF, the vast majority now comes from ‘clearing’
and what the ministry defines simply as “other sources” (i.e., not from managed
forests or community forests [Forest Trends & KAMH 2014]). Finally, the large
amounts of plantations reportedly planted (for both oil palm and pulp) could easily
supply the conversion timber needed to make up these volumes of wood reportedly
from land clearing and “other sources” (Figure A3.2).

DISCUSSION DRAFT
84
Figure A3.2: Difference in the Volume of Timber Produced During Land Clearing (‘conversion
timber’) as reported by the Ministry of Forestry (black line) versus the likely volumes harvested,
given the area reportedly planted for oil palm (dark grey bars) and pulp (light grey bars)
plantations. The bars assume 88 m3/ha of conversion timber were produced for each hectare reported
planted (source of planting data = Ministry of Agriculture for oil palm; Ministry of Forestry for pulp
plantations). 88 m3/ha is based on the average reported by industry (Forest Trends & KAMH 2014); if
this assumption is incorrect, and conversion timber produced from oil palm and pulp plantations were
really equal to the Ministry’s report of conversion timber production, then each hectare cleared would
have only yielded ~14.8 m3.
Figure A3.2 estimates the total amount of timber produced during land clearing for
oil palm and pulp plantations between 2009 and 2013, the most recent data
available from the Ministry of Agriculture (for oil palm) and Ministry of Forestry (for
pulp plantations). The figure was produced taking the area reported planted (which
is likely a conservative estimate of the area actually cleared because, as mentioned
above, much of the area allocated has not yet been planted) and multiplying it by
the average timber produced per hectare (i.e., 88 m3/ha, according to industry
reports [Forest Trends & KAMH 2014]).
Stumpage, reforestation & timber replacement fees
In addition to lost export taxes, Indonesia is likely failing to collect revenue from a
number of additional sources related to land clearing for industrial agriculture. Given
Assuming$88$m3/ha$produc>on$during$land$clearing$$[actual$produc>on$would$have$to$be$~14.8$m3/ha$$into$legal$supply$for$two$sources$to$=$reported$produc>on)$
pulp$planta>ons$
oil$palm$
Produc>on$reported$by$MoF$
(million$m
3)$

DISCUSSION DRAFT
85
the illicit nature of this illegal deforestation, it is difficult to quantify the exact extent
of the losses, but again we use Ministry of Forestry data to estimate the scale of the
overall losses from ‘conversion timber’ (i.e., the volume used by large operators in
the primary processing sector [mainly saw mills; ply/veneer mills; and wood chips and
pulp], all of which use more than 6,000 m3/yr of wood). We do this by estimating
the direct financial losses to government based on how much wood is being used in
excess of the legal supply. Many analysts such as Harwell (2009, 2011), Forest Trends
& KAHM (2014), and KPK (2015), have used such a ‘wood balance’ to estimate the
gap in legal supply. They have consistently found under-reporting of supply on the
order of 30 million m3/yr.
Based on this estimate of illegal wood use [that which exceeds the legal supply], we
then estimate losses, assuming that unreported wood also evades taxation, for three
major sources: reforestation fees, stumpage, and timber replacement fees.34 The
uncollected reforestation fee represents a loss of $16/m3 of illegal timber, while
stumpage is a percentage of the market price of timber.35 The timber replacement
fee, which was not required for pulp plantations, is calculated as the value of the
timber (which we assume to be $140/m3 as an average across all merchantable
species that would be harvested during land clearing), less the reforestation and
stumpages fees paid, less the cost of harvesting (which we assume to be $30/m3).
Figure A3.3 estimates the losses for these three fees under two scenarios, using
production levels reported by: a) the International Tropical Timber Organization
34 Other applicable fees and taxes are minimal and therefore not included, nor do we include losses from income tax
evasion due by mis-representation of actual profits, nor losses from smuggling.
35 In calculating of stumpage, Indonesia provides a substantial subsidy to industry by using a reference price that is
below the market price for the wood (e.g., $40 vs. an actual market value of $210/m3 for dipterocarp species from
Kalimantan). While this subsidy is technically ‘legal’, we include the foregone revenue as a ‘loss’.
DISCUSSION DRAFT
86
(ITTO); and, b) the Ministry of Forestry. 36 We further divide the losses between
outright evasion and avoidance, the latter being a subsidy that the Ministry gives to
industry by under-valuing timber when calculating royalty stumpage rates.
Given these losses, and the range in ‘consumption’ (from the low end of the range,
up to that based on ITTO reports), then over the five most recent years of data,
losses ranged from: $9-17.6 billion, or $0.5-4.5 billion/yr. Note that in 2013 losses
became disproportionately smaller because the timber replacement fee was
eliminated after intense industry lobbying. Note also that the Ministry never
reported any payments of this fee, despite the legal requirement; thus, any oil palm
plantation that cleared using a timber utilization permit was operating illegally if it
had not paid the timber replacement fee.
36 Here we note two sources of uncertainty around the amount of wood used by industry (those mills that use
>6,000 m3/yr). First, ITTO reports substantially more production than the MoEF does. Moreover, the MoEF has
serious inconsistencies in its reporting. Starting in 2012, they have reported volumes of both pulp and wood chips
under the category of ‘primary production’. However, logically, pulp is [secondarily] produced from wood chips, and
calling both ‘primary production’ is equivalent to ‘double counting’. Thus, as the lower range in wood volumes
needed to supply the reported production levels, we use the MoEF primary production data without the wood chips
(we use pulp volumes rather than chips in order to remain consistent with previous years when only pulp volumes
were reported).

DISCUSSION DRAFT
87
Figure A3.3: Some of the Tax Evasion & Avoidance Associated with Land Clearing for Industrial
Agriculture. The bottom grey bars represent the Ministry of Forestry’s target for revenue collection for
stumpage, reforestation and timber replacement fees (the latter was dropped in 2013). The dotted line
represents the Ministry’s reported rate of actual collection for these fees [note the Ministry did not
report any timber replacement fees collected during this period]. The top (lightest) grey bars represent
losses associated with the unreported, and thus illegal, supply necessary to meet the volume of wood
processed (i.e., demand). [In fact the amount of illegal logging may be much greater as this analysis
does not include small mills, nor does it include any estimate of smuggled timber, nor unreported
production (i.e., unreported demand; see Forest Trends & KAMH [2014] for details.)] The middle grey
bars (titled “subsidy”) reflect losses due to the deliberate under-valuing of market prices when
calculating stumpage. Most of the unreported supply in timber likely came from ‘conversion timber’
associated with pulp and oil palm plantations (see Figure A3.2; Forest Trends & KAMH 2014).
Note that if timber volumes produced from land clearing really are much larger than
reported (as Figure A3.2 suggests) then the losses are even greater than that
assumed in Figure A3.3. If Figure A3.2 is correct and the volumes of conversion
timber really are that large, then between 2009 and 2013, an additional 350 million
m3 of wood was harvested, unreported, and presumably untaxed. This would have
Illegal$supply$
Subsidy$
MoF$target$
Illegal$supply$
Subsidy$
MoF$target$

DISCUSSION DRAFT
88
resulted in an additional $27 billion loss in royalty, reforestation, and timber
replacement fees.
Overall, it is likely that between 2009-2013 losses were on the order of more than
$35-45 billion associated with timber harvested during land clearing. For perspective,
that is about 1% of GDP, or 10-13% of all government spending over the same
period.
If oil palm and pulp plantations contributed half of this, then the industrial
agriculture sector is responsible for losses of an order of magnitude of more than
$20 billion, or more than $4 billion/yr.
Natural Capital & Human/Social Capital
Losses due to forest fires
“Fire is an integral part of the process of large-scale conversion of the nation’s rich
forest assets, particularly peatlands, into agricultural lands for private benefit” (World
Bank 2015). These fires have caused a haze emergency that has repeatedly
enveloped the region, especially in drought-prone El Niño years. These fires require
fire-fighting, with further costs to human health, loss of productivity when airports
and shipping are impacted, and diplomatic crises as neighboring countries spar over
what should be done. But the largest costs (Box A3) are those associated with
natural resources. Fires, like forest loss generally, wreak havoc on ecosystem services
including those critical to human life, such as access to clean water, flood and
landslide control. In addition to these losses, in 2015 the fires pumped on the order
of 1.75 GtCO2e into the atmosphere—almost as much as all of Indonesia usually
emits in a single year from all sources. The fires made Indonesia the third highest
emitter of greenhouse gasses in the world in 2015.37
37 This is the estimated figure for 2015 stated in World Bank (2015). Emissions from burning peatland are particularly
problematic as they cannot be offset by forest regrowth because the accumulation of peat is only ~1 mm/yr.

DISCUSSION DRAFT
89
But even when eventually extinguished, fires leave devastating impacts that are less
visible to the public. As we will examine in this appendix, these include the loss of
local livelihoods and the widespread agrarian conflicts caused when forests claimed
by local communities are converted to plantations. These overlapping claims spawn
frequent demonstrations, blockades, and the destruction of property (both that of
the company and the community). The conflicts also frequently erupt into violence,
causing loss of life, as well as productivity losses and security costs, and a loss of
market share for Indonesian products associated with conflict and forest destruction.
As reported in Part 5, The Munden Project analyzed the extent of overlap between
indigenous territories and agricultural and forestry concessions in Indonesia, and the
value of production placed at risk by such overlap. Extrapolation from their results
yields average costs of $498/ha/yr for oil palm in Indonesia (we assume similar
costs for pulp plantations). Again we caution this only includes the value of lost
agricultural production; it does not include the costs of security arrangement, nor the
vast losses for communities caught up in the conflicts (Harwell 2013).

DISCUSSION DRAFT
90
Box A3: Costs of Clearing Forest by Fire in Indonesia
The World Bank (2015) examined the costs associated with fires used to clear forests in
Indonesia between June and October 2015. Over 100,000 fires destroyed 2.6 million ha of
forest at a total cost to Indonesia alone of an estimated $16.1 billion—for comparison: this
is twice the reconstruction costs of the Aceh tsunami. “Regional and global costs would be
much higher.”
As is usually the case—reflecting the location of oil palm plantations in particular—Sumatra
and Kalimantan accounted for most of the damage, but the area burned in Papua is
increasing, now reaching 10% of the national total. About one third of the national total
area burned was peatland; these areas are particularly attractive to industrial agriculture as
they generally are less inhabited (due to inundation and poor fertility) and thus, less
subject to competing land claims. “While not all fires are set to clear land for oil palm, oil
palm – an important and growing sector of the economy – is a large driver of land
conversion…The growth in the prevalence of fire correlates with the expansion of lucrative
agricultural commodities such as palm oil and acacia for wood fiber.”
Indonesian law prohibits the use of fire to clear forest. Nevertheless, the few hundred
businesses who do so gain substantially in savings relative to more expensive mechanical
clearing that conforms to regulations. Moreover, in addition to preparing land for
cultivation, fires are used to establish land claims and to drive inhabitants off land. If all
areas cleared by fire in 2015 were converted to oil palm, they would generate around $8
billion over the next three years, 85% of which accrue to a relatively small number of local
elites, while the costs are imposed on tens of millions of Indonesians, not to mention the
rest of Southeast Asia and the world.
Table A1.1. Composition of the Estimated $16.1 billion Cost of Forest Fires Associated with Land Clearing
in Indonesia in 2015. (From: World Bank 2015).
Issue $billion % Issue $billion %
Agriculture $4.8 30% Biodiversity $0.3 2%
Carbon emissions $4.0 25% Transportation $0.3 2%
Forestry $3.9 24% Fire suppression $0.2 1%
Trade $1.3 8% Human health $0.2 1%
Manufacturing & mining $0.6 4% School closures $0 0%
Tourism $0.5 3%
DISCUSSION DRAFT
91
Box A3: Costs of Clearing Forest by Fire in Indonesia (cont.)
hospital visits, and, therefore, cannot capture impacts in communities where there is poor
access to care. “Where available, actual costs [were] used. Damages are an estimate of the
amount of financing needed for reconstruction and rehabilitation, while losses represent
the reduction in economic activities and income resulting from the disaster.”
The total estimate of $16.1 billion is equivalent to 1.9% of GDP; almost three times as
much as the entire contribution of forestry to GDP; and more than all of all palm oil
exports in 2014. Of this total cost, the largest share (Table A3.1) was associated with
natural resources: agriculture (estate crops and food crops); the environment (including
biodiversity, but especially carbon emissions); and, forestry. “Real GDP growth in the
affected provinces may be lower by between 0.7 and 4.7 percentage points in 2015, all else
equal.”
“Agriculture and forestry have sustained estimated losses and damages of $8.8 billion…
Damages to agriculture include those to infrastructure and equipment, while losses capture
the cost of reclaiming burned lands for planting and the foregone production revenue
during this reclaiming period. As a result, the 2015 fires are estimated to cause additional
losses of about $800 million/yr for the next three in the case of estate crops (e.g., palm oil,
rubber, and coconut) and five years for forests. Damages to estate crops affected
companies and small-holder farmers. Costs to food crops $1.7 billion translate into lower
incomes for farmers and possible impacts on food security. Forestry losses of just under $4
billion include the lost value of timber and the cost of reforestation.”
While the World Bank study did not aim to assess global costs, the loss of stored carbon
may cost Indonesia on the order of $4 billion; the “[l]ost capacity for carbon storage
represents the single biggest cost of the fires, underscoring their global impact.
The haze killed at least 19 people and caused respiratory problems in a further half-a-
million at least. “The long-term costs cannot yet be quantified. Existing research suggests
long-term exposure to air pollutants correlates with increased cardiovascular and chronic
respiratory illness. A study on the effects of the 1998 Indonesian haze crisis on fetal, infant
and under-three child mortality showed that air pollution led to 15,600 fewer surviving
children.” In the short-term, however, schools were closed for more than one month for
DISCUSSION DRAFT
92
Political Capital
Finally, there are significant yet often unacknowledged political costs from a
plantation sector that, in the words of one report (EIA 2014), is “in abject chaos”.
Political institutions, including the fundamental democratic institution of elections, are
distorted for private profit.
Illegal deforestation undermining local elections
The need for income for administration of local districts is one driver of lax
enforcement, as is the use of access to forests as a political reward for support
during elections. An analysis (Burgess et al. 2012) of logging rates across the country
using satellite data measured that in the year leading up to local elections, logging in
protected areas (that is, logging that is clearly identifiable as illegal) jumped by 42%,
presumably permitted or facilitated by district officials in return for campaign funds
or simply to increase their popularity and win votes. While there was no impact on
production forest, in conversion forest, deforestation increased by 40% during
election years, and by 57% the year after, presumably as rewards for support.
Another study of Central Kalimantan (EIA 2014), where oil palm has expanded to
cover over 1 million ha, found that in the year of a local election, local sawmills
reported a spike in timber from land clearing sources, amounting to 150% of the
(legally permitted) annual allowable cut. At the same time the area under logging
concession had not increased suggesting the timber was sourced by illegal land
clearing for plantation.
Decentralization driving deforestation
The subdivision [pemekaran/flowering] of provinces and districts has become much
more frequent since the passage of Indonesia’s decentralization laws in the early
2000s that provides local government with increased management authority and
control over resource revenues, including allocation and permitting. There is a

DISCUSSION DRAFT
93
abundant work (e.g., ICG 2001, IPAC 2013) suggesting that this ‘flowering’ is in fact
driven by the desire to convert more forest into plantations, thus generating revenue
for local government, including from corrupt payments associated with the allocation
and operational licenses associated with the concessions. Indeed, some argue that
struggles over control over these corrupt revenues have led to incitement of ethnic
violence in Kalimantan and Papua.
Burgess et al. (2012) found that the increase in ‘district splitting’ was most dramatic
in the forested islands (Sumatra, Kalimantan, Sulawesi, and Papua)—from 146 districts
prior to decentralization to 311 districts in 2008, an increase of 213%. Moreover,
subdividing a province by adding one more district increased overall provincial
deforestation rate by 7.8%, with the increase coming at roughly equal rates in forest
zones where logging may be legal or illegal (production and conversion) and zones
where all logging is illegal (conservation).
For almost a decade, the central government has tried to force local authorities to
follow the legal permitting process, starting with the 2007 Spatial Planning Act
(UU26), which came into force in 2008, and then through the 2010 implementing
regulation (PP15) that provides for stiff penalties for officials who issue permits even
though the land has not been designated for that particular use under the
harmonized land use plan. District heads responded by challenging the
constitutionality of MoEF authority to unilaterally allocate concessions without
complying with the full gazettement process. Although the Constitutional Court
found in favor of the plaintiffs, the legality of concessions that were already allocated
without full gazettement remains an open question (Daemeter 2012).
Conclusion
These significant costs are borne by the Indonesian citizenry overall, for whose
benefit the state is mandated to manage forests. However, the costs are borne most
heavily by those who can least afford to pay them. The World Bank (2006) found

DISCUSSION DRAFT
94
that it is the country’s most vulnerable—women and the rural poor—who depend
most heavily on forests for their meager livelihoods. There are more than 36 million
of Indonesia’s poorest people living in the country’s “Forest Estate” and they are,
therefore, the ones living in closest proximity to health hazards, increased natural
disasters, and violent clashes with security connected to industrial agriculture sited
on forestlands. The losses outlined in this paper—of more than $9.1 billion—
undoubtedly vastly underestimate the losses to these affected
communities/indigenous peoples.

DISCUSSION DRAFT
95
APPENDIX 4: BRAZIL
Prologue
Twenty years ago, around the time that Costa Rica decided to forego deforestation
for agriculture altogether, Lykke (1997) estimated that the local economic value38 of
intact Amazonian forest was $9,230/ha (Table A4.1), which was less than half the
net present value (NPV) of the same area if used for intensive agriculture39 (logging
ranching/slash-and-burn annual cropping intensification to perennials). Thus,
unlike for Costa Rica, he predicted that because the benefits of deforestation
outweighed the costs, Brazil would continue to increase its rate of deforestation.
Table A4.1: Cost-benefit analysis of deforestation from Brazil’s viewpoint. Source: Lykke (1997; Table
7).
NPV/ha (1990$)
Costs of deforestation $9,230
Foregone:
- sustainable timber production 5,200
- non-timber forest products 500
- tourism 80
Reduced:
- water recycling 3,000
- fire protection 300
- watershed protection 150
Benefits of deforestation $24,380
38Based on 1990$ and a discount rate of 2%.
39 When Lykke included spill-over effects of urban employment (e.g., jobs in value-added agro- and timber-
processing), then NPV to Brazil of deforestation (local + urban) increased to $120,000/ha.
DISCUSSION DRAFT
96
The losses noted in Table A4.1 do not include the costs of deforestation at the
global level, which Lykke estimated to include losses of $6,750/ha in “carbon
storage”; $1,540/ha in “biodiversity protection”, $400/ha in “existence value” and
$80/ha in “recreation value”, which increased the total economic value (local +
global) to $18,000/ha, still well below the benefits-NPV of $24,380/ha.
Lykke also noted that his analysis was based on existing conditions. When he did his
analysis, for example, Brazil had distorting policies around land ownership that
provided perverse incentives to clear forest (i.e., they affected ranchers’ calculation of
‘benefits’—“land titles were granted in proportion to the amount of land cleared,”
and because land rights were not well enforced, “land being kept as virgin forest is
subject to encroachment by squatters who perceive the land as unoccupied”. This
encouraged ranching even though it had “very low or even negative productivity if
land speculation was not taken into account”.) If policies changed, then the benefits
from agriculture would change, as might the costs.
To that point, the cost-benefit analysis was relevant to 1985, when Brazil had lost
only ~14% of its Amazonian forest cover.40 As pointed out by Mullan (2014), the
costs of deforestation can best be estimated at the margin; Lykke predicted that “[a]s
the level of deforestation increases, the global costs of deforestation will rise
[especially as the value of stored carbon increases41], and it will eventually pass the
value of agricultural land. Until that point, the international community has to
provide incentives to induce Brazil to preserve the remainder of the forest…
[I]nternational transfers in excess of $9,000/hectare will be needed to secure that
40 Forest loss in 1985 was comprised of 63% pasture; 7% annuals; 2% perennials; and 28% fallow.
41 In 1985, for carbon sequestration, Lykke assumed: $45/tC (or ~$165/tCO2e), 150 tC/ha (or ~550 tCO2e/ha), & a
discount rate of 2%; the “biggest item on the balance sheet is the value of carbon…[which] is likely to continue
upwards”.
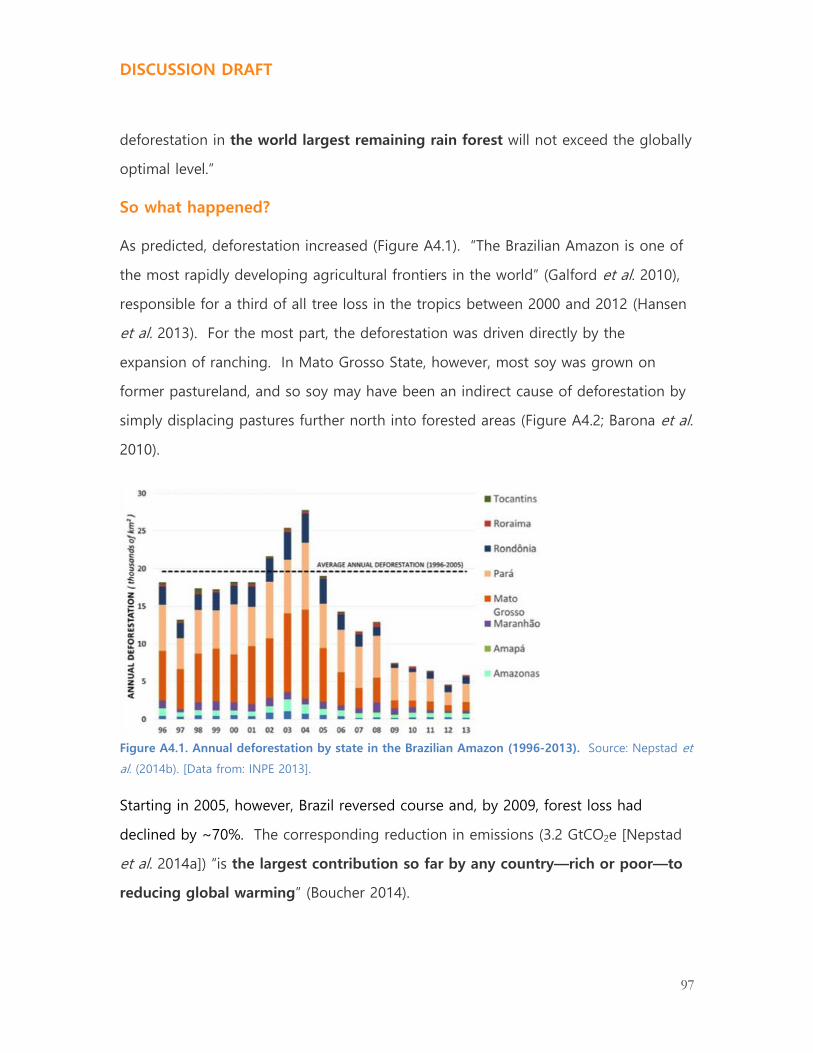
DISCUSSION DRAFT
97
deforestation in the world largest remaining rain forest will not exceed the globally
optimal level.”
So what happened?
As predicted, deforestation increased (Figure A4.1). “The Brazilian Amazon is one of
the most rapidly developing agricultural frontiers in the world” (Galford et al. 2010),
responsible for a third of all tree loss in the tropics between 2000 and 2012 (Hansen
et al. 2013). For the most part, the deforestation was driven directly by the
expansion of ranching. In Mato Grosso State, however, most soy was grown on
former pastureland, and so soy may have been an indirect cause of deforestation by
simply displacing pastures further north into forested areas (Figure A4.2; Barona et al.
2010).
Figure A4.1. Annual deforestation by state in the Brazilian Amazon (1996-2013). Source: Nepstad et
al. (2014b). [Data from: INPE 2013].
Starting in 2005, however, Brazil reversed course and, by 2009, forest loss had
declined by ~70%. The corresponding reduction in emissions (3.2 GtCO2e [Nepstad
et al. 2014a]) “is the largest contribution so far by any country—rich or poor—to
reducing global warming” (Boucher 2014).

DISCUSSION DRAFT
98
What did not change, unfortunately, was that more than 90% of all deforestation was
illegal (Box A4). Initially the Brazilian Forest Code required landowners to maintain
50% of their property in forest (i.e., a legal reserve), but since 1995 the Forest Code
increased the legal reserve to 80% (in the Cerrado, it remains at 50%). In response
to both the widespread deforestation and its illegality, “high-profile campaigns by
NGOs have linked deforestation to multinational corporations who buy agricultural
goods from forest-rich regions [and i]n response, some retailers and commodity
traders have imposed environmental criteria on their suppliers [including] zero-
deforestation agreements and standards issued by international multi-
stakeholder commodity roundtables” (Gibbs et al. 2015b).
The remainder of this appendix discusses what drove the landowners to commit this
illegal activity, and examines why the Forest Code was not enforced. We then
discuss the impact of this illegal clearing, outlining some of the major costs to Brazil.
Figure A4.2. Change in area for different land uses (2000-2006). From top left, clockwise, changes in:
a) total deforestation; b) pasture; c) total area harvested; and d) soy cultivation. Source: Barona et al.
2010.

DISCUSSION DRAFT
99
Illegality & the Forest Code
Stickler et al. (2013) estimated that the cost to soy and beef producers in
complying with the Forest Code was $3-5.6 billion in NPV. “The perceived
economic burden…may in part explain the massive, successful campaign launched by
the farm lobby to change the” Forest Code to undermine both the requirements for
the legal reserve and for the requirements for restoration.42 In 2012, Congress
passed a law to provide amnesty to landowners that deforested illegally through
mid-2008. “Amnesty afforded by the new [Forest Code] could lead to the perception
that illegal deforesters are unlikely to be prosecuted and may even be exonerated in
future law reforms” (Soares-Filho et al. 2014). Not surprisingly, many landholders
held a sense of impunity and the Forest Code was largely ignored (Nepstad et al.
2014b)—as mentioned above, more than 90% of deforestation for agriculture was
illegal during this period.
Long before the amnesty, in 2000, the state of Mato Grosso declared it would only
require 50% legal reserve in ‘transition forests’, which made up more than half of its
forests. It took five years for the federal government to over-rule the state’s
interpretation, during which time many landowners were given permits that were not
in compliance with the 50% legal reserve requirement of the Forest Code. This lack
of enforcement no doubt contributed to the widespread illegal behavior.
Political will to reform driven by NGO pressure
The lack of ‘political will’ for enforcement was driven, in part, because for decades
many saw deforestation “in terms of national sovereignty—as something raised by
foreign NGOs pressuring to save Amazon forests even at the cost of Brazilians’ right
42 Restoration costs range from $536 to $1327/ha depending on the type of adjacent land use and the intensity of
treatments required (Stickler et al. 2013). Banks-Leite et al. (2014) report even higher costs: up to $5000/ha during
the first 3 years of restoration.

DISCUSSION DRAFT
100
to economic development” (Boucher 2014). However, that began to change around
the start of the 21st century. The lack of political will ultimately led to the resignation
of the Minster of Environment, Marina Silva. In 2010, she ran for the Green Party to
replace President Lula, receiving 20% of the vote in the first round, “showing the
strength of the popular commitment to ending deforestation” (Boucher 2014).
Deforestation has, thus, been “recast as the wasteful exploitation of resources that
rightfully belonged to all Brazilians—particularly to forest peoples such as indigenous
groups and the rubber tappers—by powerful forces such as expanding soybean
farmers and cattle ranchers.”
Greenpeace’s 2006 report, Eating Up the Amazon, linked the soy industry to
deforestation, climate change, pollution, even slave labor to clear land. Within
weeks, processor and exporter associations announced that their members would not
buy from farmland deforested after June 24, 2006. The ‘Soy Moratorium’, recently
extended to 2016, is the first voluntary zero-deforestation agreement implemented in
the tropics (Gibbs et al. 2015a). In the two years prior to the moratorium nearly 30%
of soy expansion occurred through deforestation, in the two years after,
deforestation fell to ~1%, despite an increase of 1.3 million ha of soy in the Amazon
(Gibbs et al. 2015a). In areas not covered by the Moratorium, soy continues to
replace native vegetation (e.g., 11%-23% of planting in the cerrado between 2007-
2013; and nearly 40% in the eastern cerrado—“Brazil’s newest agricultural hotspot”).
In 2009, two other NGO reports, Amigos da Terra Amazônia Brasileira’s Time to Pay
the Bill and Greenpeace’s Slaughtering the Amazon, prompted a similar moratorium
from the beef industry. The agreements cover Pará, Acre, Rondônia, Amazonas and
Mato Grosso States, and two-thirds of the federally inspected slaughterhouses (Gibbs
et al. 2015b). Overall, deforestation rates fell on ranches: in 2009, 36% of ranches
had recent deforestation but this fell to 4% by 2013; moreover, 85% of ranches said
it that the agreements “were the driving force” (Gibbs et al. 2015b).

DISCUSSION DRAFT
101
Enforcement
Prior to the change in ‘political will’, even when enforcement occurred, only a small
fraction of penalties were enforced; in Mata Grosso State, less than 1% of those $180
million fines levied in 2005-6 were collected three years later (Brito 2009). One of
the limitations to enforcement has been data: INPE had been monitoring
deforestation in the Amazon since 1988 (PRODES), but the system was unable to
discriminate legal and illegal clearing for want of cadastral data (Stickler et al. 2013).
More recently, however, Brazil’s environmental protection agency, IBAMA, has been
using “satellite data and field visits to issue fines and embargo economic activities on
rural properties with illegal deforestation. The number of properties listed as
embargoed more than tripled in the last 5 years” (Gibbs et al. 2015). But
enforcement remains weak: “as of May 2014, roughly half of the registered properties
with deforestation >25 ha, 2009–2013, were not embargoed. Most of this
deforestation was illegal” (Gibbs et al. 2015b).
While enforcement has included closing illegal sawmills, jail terms for government
officials and illegal loggers/saw-millers, such “campaigns are often episodic and occur
in response to media coverage—which in turn is often generated by new monthly
data on deforestation or burning—[but] they have had a cumulative effect of making
deforestation a risky activity rather than accepted business as usual” (Boucher 2014).
Where it does occur, enforcement can be effective. Command and control policies
(Deter and PPCDAm programs) have been found to curb deforestation, with forest
saved ranging from 6,000 and 12,000 km2/yr during 2005, and likewise, from 2009
through 2011, the rural credit restrictions imposed by the Critical County program
suppressed deforestation by 2,700 km2 (Nepstad et al. 2014b).

DISCUSSION DRAFT
102
COSTS OF DEFORESTATION
When enforcement is combined with financial incentives for change, Brazil has been
able to change the calculus for landowners regarding deforestation and industrial
agriculture. There is a strong case to be made that the benefits of maintaining
forests now outweigh the cost of clearing for agriculture, even intensive, industrial
agriculture. Here we attempt to document some of these costs.
Financial Capital
Market access
The most obvious incentive is market access. Supply chain agreements incentivized
rapid change in meatpacker and rancher behavior related to deforestation and
property registration (Gibbs et al. 2015b). If producers were to revert to
deforestation-driven beef and soy production, it would compromise export markets
valued at more than $7 billion and $15.5 billion per year, respectively.
Natural Capital
Carbon
In Lykke’s 1997 cost-benefit analysis, the “biggest item on the balance sheet is the
value of carbon”. More than two-thirds of Brazil’s greenhouse gas emissions related
to agriculture were simply from deforestation (Galford et al. 2010, Fig. 9). Between
2001 to 2006, deforestation in Mato Grosso alone43 generated emissions equivalent
to all Brazil’s fossil fuel emissions (Galford et al. 2010).
Stickler et al. (2015b) estimate that carbon stocks would drop by almost a quarter,
from 2.2 to 1.6 GtCO2e, in the Xingu River headwaters if Brazil dropped the Forest
43 Between 2001-2006 industrial agricultural more than doubled in Mato Grosso to 100,000 km2, with intensive
double-cropping in 20% of this area, generating greenhouse gas emissions that averaged 179 Tg CO2-e/yr.

DISCUSSION DRAFT
103
Code’s legal reserve from 80% to 50% (likewise mean annual stream discharge [m3/s]
would increase by 70% and habitat fragment size would drop by more than 45%,
from 4,076 ha to only 2,218 ha). The relaxation of restoration requirements in the
2012 version of the Forest Code are projected to allow an additional 88 + 6 million
ha of legal deforestation with the potential to emit 18 + 4 GtCO2e. In contrast,
restoration to comply with the Forest Code could sequester up to 9 + 2 GtCO2e
(Soares-Filho et al. 2014).
While the carbon market continues to evolve, and thus, it is difficult to predict the
future opportunity cost of this carbon should it be lost to illegal deforestation.
However, under REDD, Norway has agreed to compensate Brazil at $5/tCO2e up to
$1 billion (assuming 367 tCO2e/ha; Stickler et al. 2013b). [Note: Lykke (1997)
assumed the value of sequestered carbon in 1990$ to be $18.35-$165/tCO2e and
emissions to be 550 tCO2e/ha; so the economic value of carbon under his model was
worth more than 3.5 times what Norway is now offering Brazil, despite the fact that
more than 5% of the Amazon rainforest has been lost since 1997.]
As a baseline deforestation rate, the Norway-Brazil agreement uses the average
annual rate of forest loss from 1996-2005, which for the Amazon was 19,500 km2/yr.
To date, over $670 million in compensation has been paid. Boucher (2014) notes
that this REDD agreement is not a carbon offset, “Norway does not get the right to
emit a single ton more of CO2 in exchange for its funding of Brazil’s reductions in
emission.” However, should Brazil reverse course, and fail to eliminate illegal
deforestation, then the remaining $330 million of the promised Norway money
would be lost (as well as the possibility of renewing/extending the agreement).

DISCUSSION DRAFT
104
Payment for ecosystem services
Legal reserve offsets
Soares-Filho et al. (2014) concluded that, regarding payments for ecosystem services,
“perhaps the most important mechanism is the Environmental Reserve Quota, a
tradable legal title to areas with intact or regenerating native vegetation exceeding
the [Forest Code] requirements could create a trading market for forested lands,
adding monetary value to native vegetation. Given the high costs of forest
restoration, exchange of [Environmental Reserve Quotas] could become a cost-
effective way to facilitate compliance, meanwhile protecting forest surpluses that
might otherwise be legally deforested.” Given the high costs of restoration
(>$ 500/ha), Environmental Reserve Quotas could be a valuable commodity.
Existing payments for ecosystem services in the Atlantic forest averaged only
$133/ha/yr, or $15.1 million/yr for every 1% increase in forest cover (this includes the
value of carbon’s contribution to local climate regulation, as opposed to its value in
the open carbon-market; Banks-Leite et al. 2014). Further examples of these
ecosystem services include:
Non-timber forest products44:
o 25 years ago, Anderson et al. (l99l) estimated that babassu fruit
contributed $85 million/yr in Maranhão, approximately twice the value
of the commercially exploited babassu oil—or a total of $7/ha/yr;
o In 1992, Lykke (1997) also estimated that:
In Pará, açai generated $55 million/yr;
In Amapá, palmito generated about $6 million/yr; and,
44 Peters et al. (l989) estimated the NPV of NTFPs in the Peruvian Amazon of $317/ha/year.

DISCUSSION DRAFT
105
In Acre, rubber generated $4.5 million/yr.
Precipitation: cleared land adjacent to forests “can alter convection patterns,
leading to increased dry season cloud cover, increased high energy storms,
and stronger storm clouds” (Galford et al. 2010). In 1997, Lykke estimated
that the loss of forest on “water recycling” was worth $60/ha/yr (in 1990$), or
a NPV of $3,000/ha;
Fires
Less quantifiable, but highly likely, is the relationship between deforestation and
increasing outbreak of fire. With intact forest, there is a “very low fire risk. Wild fires
happen maybe once every 500 years on a given hectare, i.e. the probability of fire is
0.2% per year” (Lykke 1997), but with loss of forests leading to lower precipitation,
fire frequency is likely to increase.
Costs associated with fire are the direct costs of fighting fires and the loss of assets,
but, as discussed in the chapter on Indonesia, (see Box A2.1, Appendix 2), there are
also costs that are more difficult to quantify, for example, human health, decreased
economic productivity due to disrupted transportation systems, and reputational risk.
Social/Human Capital
Social conflict
Likewise, highly likely, but difficult to quantify is the role of deforestation in
generating conflict between concessionaries and local communities. Indeed, the
expansion of industrial agriculture, soy and sugar plantations in particular, has
displaced smallholder famers and created grievances among indigenous
communities. In their Munden Project report, de Leon et al. (2013) highlight a pulp
plantation operated by Arazruz, the Barro do Riacho concession, which accounted for
over 70% of the group’s production. The concession was obtained in 1967, at the
height of the military dictatorship. But “[a]ccording to Brazilian law, land that is

DISCUSSION DRAFT
106
recognized as being traditionally used by indigenous peoples, in accordance to their
customs and traditions, is unalienable and the rights to it cannot be invalidated” (de
Leon et al. 2013). Thus, despite the company’s deed to the land, the local Tupiniquim
and Guarani peoples dispute Aracruz’s claim. Throughout their 45-year investment,
Aracruz’s “Annual and Sustainability reports indicate that the costs incurred as a
result of damage to property, invasions and occupations of land, illegal logging and
burning of plantations, and the destruction of seedlings by activists [not to mention
legal challenges filed each year] were extensive and continual” (de Leon et al. 2013).
For four indigenous groups, 13-25% of their territory is overlapped by soy farms
(Table A4.2). While this 7,640 ha is a very small part (less than 0.2%) of the area in
soy, the conflict jeopardizes more than $7.2 million/yr in soy production.
Extrapolated this loss to the entire soy sector would result in losses of around $53
million each year.
Table A4.2. Overlap Between Soy Concessions & Four Indigenous Territories in Brazil. Source: de
Leon et al. (2013).
Indigenous Group Territory (ha) Overlap with soy farms (ha) % overlap
Jatayvary 8,800 2,207 25
TI Guyraroka 11,401 1,454 13
Panambi-Lagos Rica 12,196 1,571 13
Takuara 9,700 2,408 25
Undoubtedly a more comprehensive documentation of overlap and grievance would
reveal much greater costs of deforestation-driven conflict than Table A4.2 suggests
given that almost a quarter of the Amazon is land recognized as belonging to
indigenous groups (Rights & Resources International 2015).

DISCUSSION DRAFT
107
Restoration
Given all these costs, Banks-Leite et al. (2014) estimated that the annual investment
required by Brazil to restore Atlantic forest-landscapes back to 30% of cover—
enough to revert species composition and ecological functions across farmlands to
levels found inside protected areas—was equivalent to only 6.5% of what Brazil
spends on agricultural subsidies, or 0.009% of GDP. Once regeneration was under
way, costs would be cut to one-fifth.
Who pays
Returning to Lykke’s (1997) admonition that “international transfers in excess of
$9,000/hectare will be needed” to control deforestation in Brazil. It is all the more
reasonable a recommendation given patterns of globalization related to the trade in
agricultural commodities produced by Brazil. Between 1990 and 2006, the carbon
liability embodied in soybeans exported from the Amazon was 128,000 MgCO2e,
while 120,000 MgCO2e were embodied in exported beef” (Figure A4.3; Zaks et al.
2009). This is roughly equivalent to the carbon liability for Brazil’s domestic
consumption. This makes the international community arguably just as responsible
for deforestation-related emissions in Brazil as the Brazilians themselves.
Figure A4.3. Carbon ‘liability’ from soy and beef in Brazil (1996-2006).
Soy (257 TgCO2e): Brazil = 50%, EU = 31%, Asia = 12%, rest of the world (RoW) = 6.7%; and,
Beef (240 TgCO2e): Brazil = 50%; E Europe = 13%; EU = 12%; Mideast = 8%; RoW = 14.4%.
(Source: Zaks et al. 2009; Figure 7)
DISCUSSION DRAFT
108
SUMMARY
While $670 million has already paid by Norway, illegal deforestation would
jeopardize up to $3.5 billion a year in carbon.45 To this can be added:
Reputation-risks that jeopardize exports of more than $20 billion/yr in soy
and beef;
Social conflicts that jeopardize at least $53 million a year in soy production;
and,
At least $15 million a year in ecosystem services;
Less easy to quantify, but highly likely are lost taxes of around $5 billion each year
(Table 1) and damaged human health due to fires and other alterations to local
climates. Added to this the losses from other industrial agricultural commodities, and
the annual losses are likely in excess of $8.5 billion (see Part 5). Should illegal
deforestation return to levels previously driven by industrial agriculture, we estimate
that Brazil stands to lose potentially much, much more.
45 1,900,000 ha/yr X $5/tCO2e X 367 tCO2e/ha
DISCUSSION DRAFT
109
Box A4: Brazil’s Forest Code
The Forest Code was designed to protect public interest on private land by requiring a
minimum percentage of the property that must be kept under forest cover (legal reserves),
as well as defining categories of ‘areas of permanent preservation’, including riparian zones,
steep slopes, and wetlands. The Forest Code’s legal reserve requirements have changed over
time (Stickler et al. 2013):
In 1965, the Forest Code first incorporated the “concept of forests as a common
good, imposing enforceable limits on the rights of property owners to alter their
forests”. Initially the legal reserve was 50% for properties in the Legal Amazon, 20%
for elsewhere.
In 1995, a temporary measure (MP 1.511) increased the legal reserve in the Amazon
to 80% and prohibited new clearing on properties with ‘abandoned or underused
areas’. MP 1.511 was made into law in 2012.
The 2012 Forest Code, however, also freed properties that were less than 440 ha in
the Amazon and less than 20 ha in the south from the legal reserve requirement, as
well as removed their obligation to pay fines if they had cleared forest illegally prior
to 2008. Because approximately 90% of properties qualified (Nepstad et al. 2014),
this amnesty effectively reduced Brazil’s “environmental debt” (i.e., including revenue
from fines) by 58% (Soares-Filho et al. 2014). In order to qualify for the amnesty,
landowners were required to register with their state’s cadastral system and come
into “eventual compliance with the law”, although rather than re-forest, they were
able to offset through the “acquisition of the deforestation rights (i.e., essentially, the
development rights) of another property in the same biome” (Soares-Filho et al.
2014).

DISCUSSION DRAFT
110
Box A4: Brazil’s Forest Code (cont.)
Compliance with the Forest Code
As mentioned above, almost the entire farming sector has operated illegal (only 10% of
clearing between 1997 and 2009 was in compliance with the legal reserve requirement
of the Forest Code; Table A4.3). In 1997, if the industry was to be fully compliant with
the Forest Code in the state of Mato Grosso, only 22,000 km2 were available for
clearing, while in 2005 it had declined to 13,000 km2—yet 20,000 km2 of forest was
cleared in just the four years from 1997-2001, climbing to approximately 30,000 km2
during the next four-year period (Stickler et al. 2013). More restrictive legal reserve
limits had little obvious impact on deforestation or compliance.
Table A4.3. Rates of compliance in the state of Mato Grosso with the 80% legal reserve (LR) provision in the
Brazilian Forest Code for new land clearing for industrial agriculture. Source: Stickler et al. (2013), Table 1.
With respect to Forest Code requirement for 80% LR
Compliant Illegal
1997-2001 12% 88%
2001-2005 10% 90%
2005-2009 10% 90%

DISCUSSION DRAFT
111
APPENDIX 5: LIBERIA
“Private sector investments in Liberia so far have delivered only
limited development to the majority of people living in Liberia.
Human rights violations as a result of business activities are
creating tension and conflicts between communities and
companies, as well as between communities and state
institutions. Conflicts over land rights are increasingly turning
violent, which, in a context where land disputes were one of the
factors causing the civil war, could potentially undermine
Liberia’s fragile peace.”
- Centre for Research on Multinational Corporations (2015)
The economy of Liberia is overwhelmingly dependent on agriculture. At present,
industrial agriculture accounts for 90% of exports, principally rubber and palm oil.
Moreover, agriculture underpins livelihoods for at least two thirds of the population;
rubber and oil palm together account for nearly 30% of formal employment in the
agricultural sector. Since the end of the civil war in 2003, Liberia has experienced
one of the greatest accelerations in deforestation in the world, driven by the
expansion of industrial agriculture (WRI & Global Forest Watch 2015). Fortunately,
however, much of this expansion has—so far—been restricted to areas of already
degraded forests.
Liberia contributes only a small portion of global deforestation, but the case is
illustrative of how a combination of dependence on natural resources and weak
governance results in economic loss. Although the country has developed a suite of
policies intended to protect communities and promote sustainable forest
management, growth of industrial agriculture is generating conflict and concomitant

DISCUSSION DRAFT
112
costs. Thus, illegality, in addition to threatening forests, creates a drag on
development and undermines long-term prospects for peace.
Liberia has a grim history with respect to forest management and illegal
deforestation. The Liberia Truth & Reconciliation Commission (2011) documented
how, during the civil war, illegal timber exports financed weapons purchases, loggers
evaded more than 85% of taxes, and security forces of the logging companies acted
as private militias. Not a single logging company that operated between 1980-2003
could demonstrate that they held a valid license; so the first Executive Order of the
President Ellen Johnson Sirleaf was to declare all claims to logging licenses to be null
and void.
In the post-conflict period, the international community has invested considerable
resources to support the reform of forest policy, laws, and regulations, as well as
build capacity for forest management. Nonetheless, the logging sector has been
slow to restart, in part because of complaints of high taxes (even though the majority
of taxes were set by the companies themselves through competitive bidding).
Moreover, the sector reverted to its old ways, operating with widespread illegality:
that is, between 2009-2011, operators attempted to circumvent government
regulations by pursuing Private Use Permits—meant to allow individual land owners
to harvest their timber—in community forests that covered about a quarter of
Liberia’s land (Box 3). Now, agricultural concessions, particularly oil palm companies,
are also being implicated in violating Liberian laws and regulations concerning
deforestation and encroachment on community forest-land (Global Witness 2015).

DISCUSSION DRAFT
113
Box A5: The Scandal over Community Forest Management & Private Use Permits
note: This box draws heavily on Global Witness, SAMFU, and SDI (2012)
After the United Nations Security Council lifted the sanctions in 2006 on imports of timber from
Liberia observers noted a host of problems with the execution of state-issued logging permits,
notably irregularities in the bidding processes, inadequate consultation with communities, and non-
payment of taxes and fees. More troubling, between 2009-2011, there was a sudden burst of
Private Use Permits (PUPs) issued by the Forestry Development Authority. These permits were
designed to regulate logging on private land, and are thus subject to far fewer restrictions than
permits issued for logging on land claimed by the state, e.g., PUP-regulations do not limit
concession size, have lower tax obligations, do not require sustainability, and do not specify
compensation levels for landowners; moreover, companies entering into arrangements with private
landowners are not subject to background checks and other pre-qualification criteria. Thus, PUPs
allowed logging companies to side-step safeguards that otherwise regulate logging on state-land
and in community forests.
By 2012, PUPs covered a quarter of the country, or nearly half of Liberia’s remaining intact
rainforest. Many were held by foreign companies; e.g., through subsidiaries, the Malaysian company
Samling held as much as 10% of the country’s area under PUPs.
Moreover, in violation of the Community Rights Law with respect to Forest Lands, which is very
prescriptive in how logging may proceed on lands held by communities, almost the entire area
under PUP was on lands claimed under community-held deeds. On the positive side (at least for
communities), while PUPs were an inappropriate permit-type for community lands, the fact that the
Ministry of Lands, Mines and Energy and the Forestry Development Authority approved the PUPs,
meant that the Government of Liberia had explicitly recognized that communities held statutory title
over most of Liberia’s rainforest.
In the end, a Presidential investigation found that the majority of these PUPs were highly
questionable: some were based on fraudulent land deeds; others covered community lands but
community members were unaware of any agreement with a timber company; others were backed
by forged letters from local leaders. In the end all the PUPs were cancelled, senior officials were
successfully prosecuted for their role in the fraud/corruption, and the government won $6 million in
penalties meant to replace lost taxes. In addition to this government loss, the investigations
revealed that communities were promised on the order of $1.50 to $3.00/m3 of harvested timber as
compensation for the loss of their trees, when logs can fetch up to $200/m3. This confirms that the
PUP deals were highly disadvantageous to Liberia’s forest-owning communities.
DISCUSSION DRAFT
114
Land conflicts, overlapping concessions, & interpretations of
legality
The difficulty with conflicts between oil palm concessionaires and communities over
land is that the concessionaires’ actions are not unambiguously illegal.46 Although
rights and responsibilities for timber concessions and mining concessions are
reasonably well defined (hence the above-mentioned scandal discussed in Box 3),
this is not the case with respect to agricultural concessions. Moreover, while oil palm
concessions define an area of interest, and a total surface area within the area of
interest that may be converted to plantations, how this relates to community forests
is left unclear. In principle, the Community Rights Law with respect to Forest Lands
of 2009 contains provisions emphasizing that communities have the right to
determine what happens on their lands, but what this means when the Government
issues a concession (which, through act of legislature and signature by President, has
the force of law) that overlaps with community lands is subject to debate.47
The Government of Liberia’s National Export Strategy48 includes a strong emphasis on
commercial agricultural products such as rubber and palm oil, noting that the sector:
“has received the highest committed amount of foreign direct investment in the
post-war years, totalling over $6 billion from just the four biggest players – Sime
Derby [sic] ($3.1 billion until 2025), Golden Veroleum ($2 billion until 2017),
Equatorial Palm Oil ($800 million until 2017) and SIFCA-Maryland Oil Palm
Plantations ($20 million until 2015).”
46 Althought their actions do fit well within the typical definition of land grabs (e.g., Lawson et al. 2014); and see
criticisms of government implementation of law (including, Wiley 2007; Sustainable Development Institute 2012).
47 Observers such as Global Witness (2012) and the SDI (2012) would argue that many of the concessionaires’ actions
are clearly illegal. An independent assessment commissioned by one concessionaire, Golden Veroleum, found
multiple instances interpreted as infractions of laws, regulations, and RSPO standards (TFT 2013).
48 http://www.moci.gov.lr/doc/Liberia_National_Export_Strategy2014_2018.pdf
DISCUSSION DRAFT
115
Given these figures, it is not surprising that the government at levels ranging from
local district officials to the President have been sympathetic to the companies in
their disputes with local communities. In allocating oil palm concessions, the
Ministry of Agriculture ignored the Ministry of Lands, Mines & Energy’s
acknowledgement through the PUPs that communities themselves own most of the
land in Liberia. (Although, to be fair, the Minister of Agriculture also ignored the fact
that she herself signed multiple contracts that overlap the same area.) Until Liberia
undergoes a process of regularizing land titles and use-rights throughout the
country, including the comprehensive registration of community lands and the
designation of community forests, conflicts are likely to intensify as the plantation
and timber sectors continue to expand.
Illegal Community Agreements
Companies claim they comply with the Community Rights Law with respect to Forest
Lands by entering into agreements with communities. However, there are indications
(Global Witness 2015) that many of these agreements may be the result of
misleading or even coercive tactics, rather than credible free, prior, informed consent
(FPIC) processes required by Section 2.2c of the Community Rights Law. Indeed, the
imbalance in negotiating power between companies and communities in and of itself
may undermine the legitimacy of many agreements. In brief, the ways in which oil
palm concessionaires’ actions may be considered land grabs include:
Failure to provide full information, making ‘informed consent’ impossible;
Offering inducements to community leaders, while excluding other
community members from the negotiation processes;
Intimidation of community members by having high ranking government
officials at meetings to exert pressure to sign agreements;
Providing information only in written form to illiterate people;

DISCUSSION DRAFT
116
Use of armed police and private security agents to intimidate and assault
community members; and,
Pushing negotiations while advocates could not reach communities during
the Ebola crisis.
The main consequences of these conflicts to date have been: negative press for the
oil palm companies and the Government of Liberia; delays in efforts to increase palm
oil production; conflict between companies and local communities; and, threats to
the bilateral agreement with Norway that would compensate Liberia for foregone
deforestation. These impacts would result in loss to all four types of Capital (Figure
2).
Reputational risk undermines Financial, Political, even
Social/Human Capital
Negative press for the companies can narrow their range of potential purchasers, as
an ever-increasing number of manufacturers using palm oil are making commitments
to socially and environmentally responsible sourcing. This could reduce government
revenue as a function of depressed volumes or prices; in the extreme, companies
could decide to withdraw entirely, jeopardizing some share of the $6 billion in
planned investments noted above.
Negative press, calling into question the government’s commitments to transparency,
equity, community rights, etc., could jeopardize willingness on the part of donors to
support continued reform, capacity building and development investments, and
further reduce interest of would-be investors from the private sector. President
Johnson-Sirleaf noted that a reputation for land conflict in general will depress future
investment, as summarized by the Centre for Research on Multinational Corporations
(2015):

DISCUSSION DRAFT
117
“The last few years have seen an increase in conflicts over land
and violent protests against iron ore, palm oil and rubber
corporations. In May 2015, protests turned violent when youth in
Sinoe county protested against the palm oil company Golden
Veroleum after years of simmering conflict regarding employment
issues, loss of crops, water pollution and damage to shrines. The
situation escalated after police tried to disperse the crowd and
several people were injured. In July 2014, violence erupted at the
mining site of ArcelorMittal in Nimba County, when protests by
youth escalated after they started demanding more employment
opportunities and protested against unpaid compensation for
crops and lacking implementation of development projects like
infrastructure, schools, health clinics and vocational training
centres. Other examples are the protests against the iron ore
company China Union in Bong county, oil palm company
Equatorial Oil Palm in Grand Bassa county, rubber company
Salala Rubber corporation in Margibi county, Maryland Oil Palm
corporation in Maryland county, and fierce protests against palm
oil company Sime Darby in Grand Cape Mount county that forced
President Sirleaf to intervene directly.”
Disrupted production undermines Financial Capital
These conflicts are disrupting production, lowering export volumes and reducing
government revenue. Thus far, such production delays have not significantly
impacted the palm oil sector, as existing processing capacity lags behind scale of
production. The Ebola crisis further delayed investment in expanded processing
capacity, which has in turn slowed conversion of forest to oil palm. However,
analysis of the overlap between community forests and concessions suggests that at

DISCUSSION DRAFT
118
least 5% of production from concessions is compromised, or on the order of $50
million/year (de Leon et al. 2013). This may be viewed as a conservative estimate, as
the analysis understated the extent of concessions and considered only formally
recognized community forests, as opposed to forests claimed through customary
rights.49
Threats to peace and security also undermine Financial and
Human Capital
Indeed, concerns over land conflict, particularly with oil palm given the extent of
concessions, extend beyond the investment climate. In November 2013, the UN
Panel of Experts on Liberia explicitly identified large-scale oil palm development as a
threat to peace and security, potentially contributing to renewed civil conflict (Jerving
2015).
Though not associated with illegal clearing, the experience of the ArcelorMittal-
Liberia iron ore mining company is instructive. Their mining venture required
conversion of some cropland and community forest. This took place legally, with a
comprehensive plan for compensation and in some cases resettlement, implemented
in close coordination with relevant government agencies (e.g., compensation
payments to 425 farmers ranged from $400 to $52,000, totalling $4.2 million during
Phase II [ArcelorMittal Liberia 2014]). Nevertheless, ArcelorMittal has faced chronic
conflicts, as in 2014 when protestors entered the mining area, destroyed and looted
equipment, and interrupted operations (Reuters 2014). Shots were fired by
protestors as well as government during this episode, with the government strongly
sympathetic to ArcelorMittal and expressing its belief that outsiders with no
49 An oft-cited study of the financial costs of community conflicts relating to mining and energy investments
concluded that, for a project in the US$3-5 billion range, conflicts can disrupt production at an annualized cost of
over $1 billion, or 20-35% of the overall investment (Franks et al. 2014).

DISCUSSION DRAFT
119
legitimate claims to compensation were trying to take advantage of the process (FPA
2014).
Carbon losses undermine Financial Capital through the loss of
Natural Capital
Perhaps the single largest investment in forest management in Liberia is the
arrangement between Liberia and the Government of Norway, as per the terms of a
‘Letter of Intent’ in which Norway promises $150 million in return for reduced
deforestation in Liberia. Agriculture is highlighted as one specific driver of
deforestation, and the Letter of Intent commits Liberia to a policy of “zero
deforestation” agriculture. Failure to address illegal clearing for oil palm could
jeopardize this deal and undermine prospects for additional ‘contracts’ predicated on
reduced carbon emissions from avoided deforestation. This then is a very concrete
instance of illegal clearing posing a threat to monetized ecosystem service values.50
An analysis of the options for a low-carbon economy for Liberia estimated that, at a
price of $5/t CO2e, Liberia could generate revenues on the order of $55 million/yr
(Lawrence et al. 2009). Taking into account average annual costs (including
coordination, monitoring and enforcement, as well as foregone revenue from logging
and future agricultural production), Lawrence et al. (2009) estimated that net revenue
would amount to about $27 million, which would make maintaining forests an
attractive proposition. The deal with Norway provides a direct incentive to move in
this direction as well as a crucial investment in the enabling conditions—not to
mention proof of ability to deliver—for future participation in carbon markets. If
50 Another ecosystem service that may be eroded by illegal forest clearing is the role of natural habitat in containing
reservoirs of disease, such as the Ebola virus. Deforestation can intensify interactions between humans and disease-
carrying species, and the economic impact of the Ebola epidemic has been severe, decreasing GDP by 10% or losses
of at least $240 million (World Bank 2015). However, the nature of the relationship between clearing for industrial
agriculture and Ebola is not sufficiently established to warrant its inclusion as a cost here.

DISCUSSION DRAFT
120
Liberia fails to control illegal deforestation by oil palm concessionaires (and others),
payments from Norway will cease and potential future carbon revenues may be lost.
Summary
While many of the known costs are difficult to quantify, there’s good evidence that
illegality related to the oil palm sector in Liberia could jeopardize a significant
portion of $6 billion in investment if reputational risks and operational constraints
(like conflict with local communities) drive away committed investors. Moreover,
failure to address illegal forest clearing will place at risk the $150 million committed
by the Government of Norway to help Liberia protect its forests, develop a low-
carbon economy, and position the country for participation in future carbon markets.
Potential losses related to degraded ecosystem services and uncollected taxes and
other government revenue due to corruption, fraud, and other illicit activities are less
easily quantified, but Part 5 of this report suggests that these could amount to well
over $4,000 per hectare per year. Reputational risks associated with corruption
and/or weak governance may undermine prospects for continued flows of
development assistance, and foreign direct investment, more broadly. The
government’s failure to deliver on poverty reduction schemes, not to mention direct
conflicts over land, may generate grievance among local people, thus undermining
peace and security.
As Liberia’s deforestation rate accelerates, these various types of costs will escalate
and the risks to the country will become more acute. While the components
discussed above cannot meaningfully be aggregated into a bottom line figure, there
is no doubt that the implications for the country can be severe. In the extreme,
illegal activities, unless curtailed, may not only undermine development, but could
help drive a resumption of civil conflict, even after almost 15 years of peace. The
Liberian case serves as a cautionary tale regarding the risks posed by illegal forest
DISCUSSION DRAFT
121
clearing for agriculture in contexts characterized by weak governance and high
resource dependence, especially in post-conflict settings.

DISCUSSION DRAFT
122
LITERATURE CITED
Abood S et al. 2015. Relative Contributions of the Logging, Fiber, Oil Palm, and Mining Industries to Forest Loss in
Indonesia. Conservation Letters, 8:58–67.
Allebone-Webb S, Jiménez-Aybar R, Matthews A, Stevens D. 2012. The GLOBE natural capital legislation study: A
review of efforts towards natural capital legislation in eight countries. GLOBE. London.
http://www.globeinternational.org/images/natural-capital-study/GLOBE-Natural-Capital-Legislation-Study.pdf
ArcelorMittal Liberia. 2014. Local farmers receive $4.2 million from ArcelorMittal Liberia. (March 3). ArcelorMittal-
Liberia. http://liberia.arcelormittal.com/news-and-media/press-releases/2014/mar/03-03-2014.aspx
Anderson A et al. 1991. The subsidy from Nature. Columbia University Press
Arriagada R et al. 2012. Do payments for environmental services affect forest cover? A farm-level evaluation from
Costa Rica. Land Economics. 88(2): 382–399.
Banks-Leite C et al. 2014. Using ecological thresholds to evaluate the costs and benefits of set-asides in a biodiversity
hotspot. Science. 345:1041.
Barona E, Ramankutty N, Hyman G, Coomes OT. 2010. The role of pasture and soybean in deforestation of the
Brazilian Amazon. Environmental Resource Letters 5 doi:10.1088/1748-9326/5/2/024002
Blundell A, Harwell E. 2010. Forest Governance and Corruption: A Risk Assessment Manual.
http://issuu.com/transparencyinternational/docs/2010_forestgovernanceriskmanual_en?e=2496456/2731147
Boucher D. 2014. How Brazil Has Dramatically Reduced Tropical Deforestation. Solutions Journal.
Brito B. 2009. O estado da Amazônia: multas posoperaca ̃ocurupirano Mato Grosso. No.12. Belem, Brazil: Imazon.
www.imazon.org.br.
Brockett CD, Gottfried RR. 2002. “State policies and the preservation of forest cover: Lessons from contrasting
public-policy regimes in Costa Rica.” Latin American Research Review. 37(1): 7-40.
Brown J, Bird N. 2011. Costa Rica’s sustainable resource management: successfully tackling tropical deforestation.
Overseas Development Institute.
Burgess R et al. 2012. The Political Economy of Deforestation in the Tropics. The Quarterly Journal of Economics,
Oxford University Press, vol. 127(4), pages 1707-1754
Carlson KM et al. 2012. Commited Carbon Emissions, Deforestation, and Community Land Conversion from Oil Palm
Planta on Expansion in West Kalimantan, Indonesia. PNAS Early Edi. doi: 10.1073/pnas.1200452109.
Carrascoa L et al. 2014. Economic valuation of ecosystem services fails to capture biodiversity value of tropical forests.
Biological Conservation. 178:163–170
Casson A et al. 2014. Large-scale plantations, bioenergy developments and land use change in Indonesia. CIFOR
Occasional paper 170.
Castro R. 1997. Government policy & sustainability of biodiversity in Costa Rica. In: Nature & Human Society: The
quest for a sustainable world. pp 500-504. (Ed. Raven P). National Academy Press. Washington, DC.
DISCUSSION DRAFT
123
Centre for Research on Multinational Corporations. 2015. Liberia Back in Business? Conflict and human rights issues
in a post conflict environment. https://www.somo.nl/wp-content/uploads/2015/06/Paper-Liberia-web-final.pdf
Chomitz KM, Brenes E, Constantino L. 1998. Financing environmental services: the Costa Rican experience and its
implications. Washington, D.C.: The World Bank.
Costanza R et al. 1997. The value of the world’s ecosystem services and natural capital. Nature. 387:253-260.
Costanza R et al. 2014. Changes in the global value of ecosystem services. Global Environmental Change. 26:152-158.
http://www.sciencedirect.com/science/article/pii/S0959378014000685
Daemeter Consulting. 2015. Indonesia’s Evolving Governance Framework for Palm Oil: Implications for a No
Deforestation, No Peat Palm Oil Sector. August 2015.
de Groot R et al. 2012. Global estimates of the value of ecosystems and their services in monetary units. Ecosystem
Services. 1(1):50–61.
de Leon R et al. 2013. Global Capital, Local Concessions :A Data-Driven Examination of Land Tenure Risk and
Industrial Concessions in Emerging Market Economies. The Munden Project.
EIA. 2014. PERMITTING CRIME: How palm oil expansion drives illegal logging in Indonesia.
Fagan M et al. 2013. Land cover dynamics following a deforestation ban in northern Costa Rica. Environmental
Resource Letters 8:1-9.
Fisher A. 2004. Cuanto Cuesta? Market-based solutions to forest conservation in Costa Rica. The Public Purpose. II: 47-
60.
Forest Trends and Koalisi Anti Mafia Hutan. 2015. Indonesia’s Legal Timber Supply Gap and Implications for
Expansion of Milling Capacity: A Review of the Road Map for the Revitalization of the Forest Industry, Phase 1.
http://www.forest-trends.org/documents/files/doc_4843.pdf
Franks D et al. 2014. Conflict translates environmental and social risk into business costs. PNAS 111(21): 7576–7581.
Front Page Africa. 2014. Tension, Protest in Nimba over Mittal’s Operations in Liberia. (July 4). Front Page Africa.
http://www.frontpageafricaonline.com/index.php/politic/2170-road-blocks-tension-protest-in-nimba-over-mittal-s-
operations-in-liberia.
Galford GL et al. 2010. The Amazon Frontier of Land-Use Change: Croplands and Consequences for Greenhouse Gas
Emissions. Earth Interactions. 14-015 DOI: 10.1175/2010EI327.1
Gaveau D et al. 2014. Four Decades of Forest Persistence, Clearance and Logging on Borneo. PLoS One. 9(7):e101654.
Gibbs H et al. 2015a. Brazil’s Soy Moratorium: Supply-chain governance is needed to avoid deforestation. Science
347 (6220):377.
Gibbs H et al. 2015b. Did Ranchers and Slaughterhouses Respond to Zero-Deforestation Agreements in the Brazilian
Amazon? Conservation Letters.
Global Witness, 2015. THE NEW SNAKE OIL? The violence, threats, and false promises driving rapid palm oil
expansion in Liberia. July 2015.
Global Witness, Save My Future (SAMFU), Sustainable Development Institute (SDI). 2012. Signing their lives away:
Liberia’s Private Use Permits and the Destruction of Community-Owned Rainforest.

DISCUSSION DRAFT
124
http://www.globalwitness.org/library/signing-their-lives-away-liberia%E2%80%99s-private-use-permits-and-
destruction-community-owned
Government of Indonesia. 2011. Masterplan for the Acceleration and Expansion of Indonesia’s National Economy.
Gutierrez-Velez V, MacDicken K. 2008. Quantifying the direct social and governmental costs of illegal logging in the
Bolivian, Brazilian, and Peruvian Amazon. Forest policy and economics. 10.2008, 4:248-256
Hansen M et al. 2013. High-resolution global maps of 21st-century forest cover change. Science. 342:850-853.
Harwell E. 2009. Wild Money”: The Human Rights Consequences of Illegal Logging and Corruption in Indonesia’s
Forestry Sector. Human Rights Watch: New York, USA.
Harwell E. 2010. Forests in fragile and conflict-affected states. Program on. Forests (PROFOR), World Bank.
Washington DC. http://web.worldbank.org/archive/website01306/web/pdf/forests_and_conflict_synthesis-paper-
nov2010.pdf
Harwell E. 2013. The Dark Side of Green Growth. Human Rights Watch: New York, USA.
Institute for Policy Analysis on Conflict (IPAC). 2013. Carving Up Papua: More Districts, More Trouble. IPAC report No
3. Oct 9, 2013.
International Crisis Group (ICG). 2003. Dividing Papua: How Not To Do It. Asian briefing paper No 24.
Jerving S. 2014. We want our land back': Liberian communities speak out about big palm oil. Mongabay Series: Palm
Oil (August 10). http://news.mongabay.com/2015/08/mrn-we-want-our-land-back-liberian-communities-speak-out-
about-big-palm-oil/
Kar D, Le Blanc B. 2014. Illicit Financial Flows from Developing Countries: 2002–2011. Global Financial Integrity. In:
Kumar C. Tax & Development: A scoping study of funding opportunities. Transparency & Accountability Initiative.
Kishor N & Constantino L. 1993. Forest management and competing land uses: An economic analysis for Costa Rica.
The World Bank. LATEN Dissemination Note 7.
Koh L & Wilcove D. 2008. Is oil palm agriculture really destroying tropical biodiversity? Conservation Letters 1:60-64.
KPK. 2015. Mencegah Kerugian Negara Di Sektor Kehutanan Sebuah Kajian Tentang Sistem Penerimaan Negara
Bukan Pajak Dan Penatausahaan Kayu. Jakarta, Indoensia.
Kumar, C. 2014. Tax & Development: A scoping study of funding opportunities. Transparency & Accountability
Initiative.
Lawrence K, Niesten E, Werker E. 2009. Economic Analysis of a Low Carbon Economy for Liberia. Available online at:
https://www.cbd.int/database/attachment/?id=772.
Lawson S et al. 2014. Consumer Goods and Deforestation: An Analysis of the Extent and Nature of Illegality in Forest
Conversion for Agriculture and Timber Plantations. Forest Trends Reports Series: Forest Trade and Finance. Forest
Trends: Washington D.C., USA.
Lykke E. 1997. A Cost-Benefit Analysis of Deforestation in the Brazilian Amazon.
http://www.ipea.gov.br/agencia/images/stories/PDFs/TDs/td_0455.pdf
Mathur A, Singh K. 2013. Foreign direct investment, corruption and democracy. Applied Economics. 45(8):991-1002.

DISCUSSION DRAFT
125
McCarthy J, Zen Z. 2015. Regulating the Oil Palm Boom: Assessing the Effectiveness of Environmental Governance
Approaches to Agro-industrial Pollution in Indonesia.
Ministerio de Recursos Naturales, Energía y Minas. 1990. Estrategia de conservacion para el desarrollo sostenible de
Costa Rica. ECODES.
Morse W et al. 2009. Consequences of environmental service payments for forest retention and recruitment in a
Costa Rican biological corridor. Ecology & Society. 14:23.
Mullan K. 2014. The Value of Forest Ecosystem Services to Developing Economies. Center for Global Development
Working Paper No. 379. https://ssrn.com/abstract=2622748 or http://dx.doi.org/10.2139/ssrn.2622748
The Munden Project. 2012. The Financial Risks of Insecure Land Tenure: An Investment View. Prepared for the Rights
and Resources Initiative, Washington, DC.
The Munden Project. 2013. Global Capital, Local Concessions: A Data-Driven Examination of Land Tenure Risk and
Industrial Concessions in Emerging Market Economies. Prepared for the Rights and Resources Initiative, Washington,
DC.
Murdiyarso D et al. 2011 Indonesia’s forest moratorium: a stepping stone to better forest governance? Working
Paper 76. CIFOR, Bogor, Indonesia.
Navarro G, Thiel H. 2007. On the Evolution of the Costa Rican Forestry Control System. VERIFOR Case Study 6. ODI.
Nepstad D et al. 2014a. Slowing Amazon deforestation through public policy and interventions in beef and soy
supply chains. Science. 344:1118.
Nepstad D et al. 2014b. Supplementary material.
http://science.sciencemag.org/content/suppl/2014/06/04/344.6188.1118.DC1/1248525.Nepstad.SM.pdf
Ortiz Malavasi E, Kellenberg J. 2012. Program of payments for ecological services in Costa Rica.
http://www.watershedconnect.com/documents/program_of_payments_for_ecological_services_in_costa_rica
Persson A, Munashinghe M. 1996. Chapter 11: Economywide policies and deforestation; the case of Costa Rica. In
Environmental impacts of macroeconomic and sectoral policies. (Ed. Munasinghe M.). International Society for
Ecological Economics.
Peters C. Gentry A, Mendelsohn R. 1989. Valuation of an Amazonian rainforest. Nature 339:655-656
Pirard R, Cossalter C. 2006. The Revival of Industrial Forest Plantations in Indonesia’s Kalimantan Provinces: Will they
help eliminate fiber shortfalls at Sumatran pulp mills or feed the China market? Working Paper 37. Bogor, Indonesia:
CIFOR.
Priatna, D, D’Arcy L, Persey S. 2010. To what extent are the RSPO biodiversity P&C supported and recognised by the
spatial planning processes that determine where oil palm expansion occurs? Zoological Society of London,
Deliverable 10.
REDDDesk. 2015. http://theredddesk.org/countries/costa-rica
Reddington E et al. 2015. Air quality and human health improvements from reductions in deforestation-related fire in
Brazi.l Nature Geoscience. 16 SEPTEMBER 2015 | DOI: 10.1038/NGEO2535, pp 1-4.
Reuters. 2014. “Shots fired as Liberia police quell ArcelorMittal mine protest.” (July 4). Available online at:
http://www.reuters.com/article/us-liberia-arcelormittal-sa-idUSKBN0F924020140704
DISCUSSION DRAFT
126
Safitri M et al. 2015. LEGALITY AND JUSTICE IN THE ESTABLISHMENT OF FOREST ZONES IN INDONESIA. Epistema
Institute, Jakarta.
Seneca Creek Associates, LLC. 2004. ‘Illegal’ Logging and Global Wood Markets: The competitive impacts on the US
wood products industry. University Place, WA: World Resources International, LLC.
Smith E, Rosenblum P. 2011. Government and Citizen Oversight of Mining: Enforcing the Rules. Revenue Watch
Institute.
Soares-Filho B et al. 2014. Cracking Brazil’s Forest Code. Science 344 (6182):363-364. doi: 10.1126/science.1246663
Steven J. 2015. Observations from a Grim Indonesian Fire Season. NASA Earth Observatory.
http://earthobservatory.nasa.gov/Features/IndonesianFires/?src=features-hp&eocn=home&eoci=feature
Stichting Onderzoek Multinationale Ondernemingen (SOMO). 2015. Liberia Back in Business? : Conflict and human
rights issues in a post conflict environment. SOMO (Centre for Research on Multinational Corporations): The
Netherlands.
Stickler C et al. 2013. Defending public interests in private lands: compliance, costs and potential environmental
consequences of the Brazilian Forest Code in Mata Grosso. Philosophical Transactions of the Royal Society B 368:
20120160. http://dx.doi.org/10.1098/rstb.2012.0160
The Forests Trust (TFT). 2013. Independent Assessment of Free Prior & Informed Consent Process, Golden Veroleum
(Liberia) Inc. The Forest Trust.
http://www.forestpeoples.org/sites/fpp/files/news/2012/10/TFT_GVL_Liberia_FPIC_Report_Final_Eng_low%20res.pdf.
Udenze O. 2014. The Effect of Corruption on Foreign Direct Investments in Developing Countries. The Park Place
Economist: Vol. 22. http://digitalcommons.iwu.edu/parkplace/vol22/iss1/17
Union of Concerned Scientists (UCS). 2015. Palm Oil Scorecard 2015: Fries, Face Wash, Forests. Union of Concerned
Scientists. http://www.ucsusa.org/global-warming/stop-deforestation/palm-oil-scorecard-2015#.VnG-GvmrTIU
United Nations Food and Agriculture Organization (FAO). 2012. Terms & Definitions. Forest Resources Assessment
Working Paper #180. http://www.fao.org/docrep/017/ap862e/ap862e00.pdf
Vit J. 2015. Indonesia losing billions from illegal logging. Mongabay. http://news.mongabay.com/2015/11/indonesia-
losing-billions-from-illegal-logging/
Wiley E. 2007. So Who Owns the Forest? An Investigation into Forest Ownership and Customary Land Tenure in
Liberia. RRI, Washington DC.
World Bank. 2010. Sustaining Economic Growth, Rural Livelihoods, and Environmental Benefits: Strategic Options for
Forest Assistance in Indonesia. December 2006.
World Bank. 2015. Reforming amid uncertainty. Indonesia Economic Quarterly (December).
World Economic Forum. 2015. The Travel & Tourism Competitiveness Report.
http://www3.weforum.org/docs/WEF_TT_Competitiveness_Report_2013.pdf
World Resource Institute (WRI) and Global Forest Watch. 2015. New Global Data Finds Tropical Forests Declining in
Overlooked Hotspots Global tree cover loss nears all-time high. Press Release. (September).
https://community.wri.org/NetCommunity/file/GFW_2014_UMD_press_release_FINAL.pdf?erid=1408565
Zaks D et al. 2009. Producer and consumer responsibility for greenhouse gas emissions from agricultural

DISCUSSION DRAFT
127
production—a perspective from the Brazilian Amazon. Environmental Resource Letters. 4. doi:10.1088/1748-
9326/4/4/044010
Zen Z, McCarthy J, Barlow C. 2005. Environmental Issues in An Age of Regional Autonomy: The Case of Pollution the
Plantation Sector of North Sumatra. Oil Palm Industry Economic Journal 5 (2): 23–36.