the economic impact of eli lilly and company in indiana · eli lilly and company (lilly) has a...
TRANSCRIPT

Economic Impact of
Eli Lillyin Indiana
and Company

1
The Economic Impact of Eli Lilly and Company on the State of Indiana and the Indianapolis-Carmel Metropolitan Statistical Area
June 2009
Prepared by
Bruce L. Jaffee, Professor and Chair, Department of Business Economics and Public Policy, in conjunction with the Indiana Business Research Center, Kelley School of Business, Indiana University, Bloomington, Indiana

2
Abstract
Eli Lilly and Company (Lilly) has a significant impact on both the size and the growth rate of the Indiana economy and the Indianapolis–Carmel metropolitan statistical area (MSA), which contains its headquarters and many of its facilities. Lilly has also had a significant impact on direct, indirect and induced employment in the state, ranking as one of Indiana’s largest employers and supporting additional jobs in other firms by a rate of nearly 2-to-1.
This study shows that in 2007 Lilly contributed $8.03 billion, approximately 3.3 percent, to Indiana’s gross state product (GSP is the state equivalent to gross domestic product or GDP). That is, if Lilly did not exist or moved all its operations to another state, Indiana’s GSP would be 3.3 percent lower than its current value. This figure, consistent with the definition of GDP, does not count the additional ripple effects associated with that loss. Lilly ranks #6 in Indiana in terms of number of employees and has a total statewide economic footprint of $4.1 billion.
Of special note is the “multiplier analysis” of Lilly’s total purchases and employment. By tracking the company’s spending in the state and region, we find that every dollar of Lilly’s spending on payroll and purchases is increased by approximately 58 percent in the state. From an employment perspective, the multiplier is even higher. For every employee on the Lilly payroll, there are an additional 1.8 jobs that can be attributed to Lilly’s presence in the state. All told, the Lilly payroll, employment direct effects, and employment ripple effects account for about 43,500 jobs across the state.
3
Introduction
Through its employment, purchases, and sales Eli Lilly and Company (Lilly) has a major economic effect on the State of Indiana. The primary purpose of this study is to estimate the impact of Lilly on the state economy and the 10-county Indianapolis-Carmel region.1
Our estimates focus on the corporate entity itself by tracing the impact of company operations on the state’s economy and its region. It should be noted that this approach is conservative in that it does not include any spending by retired Lilly employees nor any non-cash contributions that the company or its employees may make to the local economy through such activities as volunteer service. Furthermore, the study makes no attempt to quantify the effect of Lilly’s international reputation on the quality of life, name recognition, or prestige of Indianapolis and the State of Indiana.
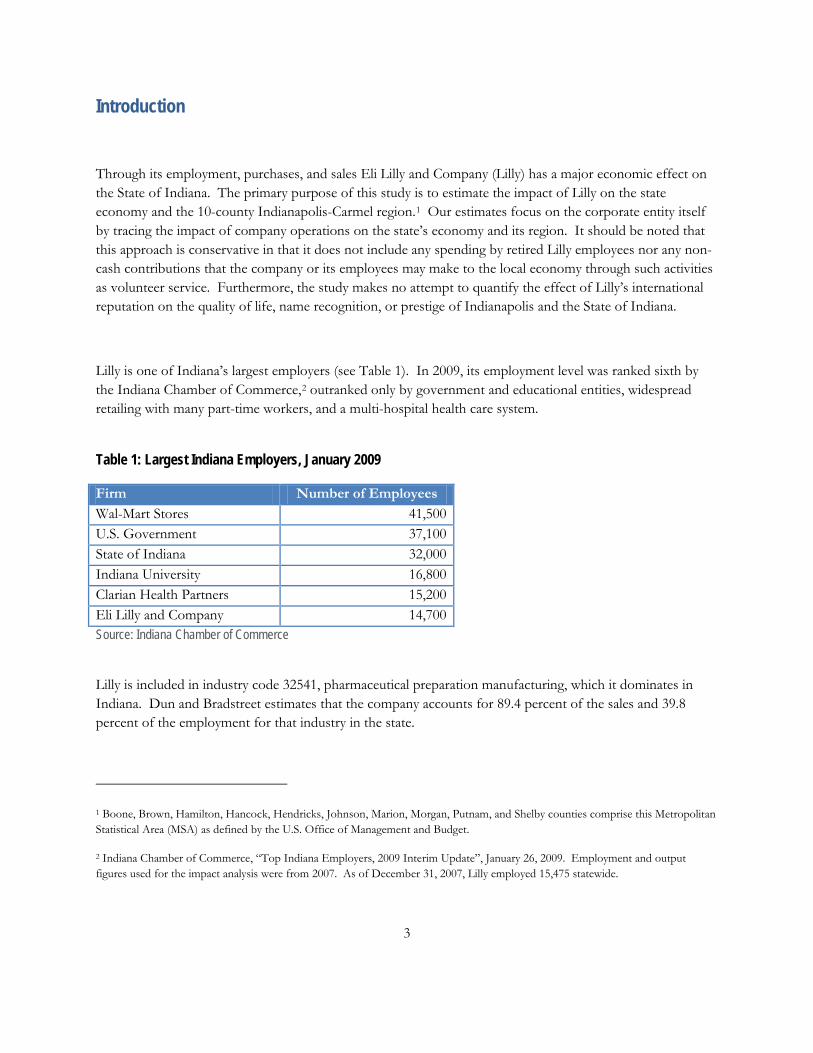
Lilly is one of Indiana’s largest employers (see Table 1). In 2009, its employment level was ranked sixth by the Indiana Chamber of Commerce,2
Table 1: Largest Indiana Employers, January 2009
outranked only by government and educational entities, widespread retailing with many part-time workers, and a multi-hospital health care system.
Firm Number of Employees Wal-Mart Stores 41,500 U.S. Government 37,100 State of Indiana 32,000 Indiana University 16,800 Clarian Health Partners 15,200 Eli Lilly and Company 14,700 Source: Indiana Chamber of Commerce
Lilly is included in industry code 32541, pharmaceutical preparation manufacturing, which it dominates in Indiana. Dun and Bradstreet estimates that the company accounts for 89.4 percent of the sales and 39.8 percent of the employment for that industry in the state.
1 Boone, Brown, Hamilton, Hancock, Hendricks, Johnson, Marion, Morgan, Putnam, and Shelby counties comprise this Metropolitan Statistical Area (MSA) as defined by the U.S. Office of Management and Budget.
2 Indiana Chamber of Commerce, “Top Indiana Employers, 2009 Interim Update”, January 26, 2009. Employment and output figures used for the impact analysis were from 2007. As of December 31, 2007, Lilly employed 15,475 statewide.

4
The company provided us with 2007 information for its total sales, employment, purchases, and capital expenditures in the State of Indiana and the Indianapolis-Carmel MSA. These data were integrated into an input-output model for the State of Indiana and the Indianapolis region. An input-output model is a detailed description of the structure of an economy. As described in the next section, the input-output model that we used was developed primarily by university and government researchers and, we believe, is the most up-to-date and most accurate structural model of Indiana and the region.
Economic Impact Calculations
The Indiana Business Research Center (IBRC) research team used the traditional input-output modeling approach to assess the size of the economic linkages associated with Lilly. The IMPLAN® modeling system software developed by Minnesota IMPLAN Group, Inc. has been used by more than 1,000 public and private institutions to measure the size of their economic presence in their local or state economies.3
Using data from the region or state economy, the IMPLAN modeling system estimates the economic impact of companies or public institutions.
The three types of effects estimated by the IMPLAN model—direct, indirect and induced effects—are important to understanding the nature of the economic ripple effects generated by Lilly in the regional economy around Indianapolis and in the state as a whole. Direct effects have to do with the change in dollars or employment associated with the direct spending made by Lilly as compensation to its employees and purchases from businesses for goods and services.
Indirect effects measure the change in dollars or employment caused by the next round of spending—the spending of the business from which Lilly buys goods and services. The manufacturer of the test tubes purchased by Lilly buys electricity to power the plant, buys material inputs for those test tubes and hires people to run the equipment. Those transactions are the indirect ripple effects associated with the Lilly purchases. The degree to which the money re-circulates in the local economy—or the magnitude of the multiplier—is determined by whether the manufacturer is located within the geographic unit of analysis. Officials at Lilly provided data to the IBRC as to the location of their vendors because this is critical in determining the regional economic ripple effects. Finally, induced effects—whether in dollars or employment—reflect changes in spending that result from the household income of employees that, in turn, change as output changes along the economic supply chain. For example, as Lilly production and sales increases, the output of the supply chain increases correspondingly. Those output changes also result in
3 Please see the appendix for a more detailed description of the IMPLAN software, or explore the IMPLAN website at: http://implan.com/index.php?option=com_content&task=blogcategory&id=83&Itemid=28.

5
changes in household income and spending. Induced effects represent the change in overall economic output and employment resulting from those household spending changes.
The total of all economic effects is the size of the economic impact and is the sum of the direct, indirect and induced effects. While Lilly officials provided figures for the taxes that Lilly pays directly to local and state governments, the IMPLAN model also tracks the tax effects associated with all the transactions and economic activity associated with the direct and ripple effects. For example, household spending at retailers generate state sales tax. In addition, those retailers also pay property taxes to local governments. As a result, this analysis was also able to estimate the state and local government tax flows.
The other reported measure is the multiplier. The multiplier is the magnitude of the economic response in a particular geographic area associated with a change—either an increase of a decrease—in the direct effects. For example, every dollar expended by Lilly on purchases and payroll is estimated to be multiplied by about 1.58 within the state of Indiana. Another way to look at it is that every dollar spent by Lilly produces, on average, almost $0.58 in additional economic activity in the state.
Data limitations required IBRC analysts to make a few adjustments to the modeling process. The average person thinks in terms of a company, whether it is a single storefront or a firm with many international operations. The economic input analysis, however, considers the impact of one or several establishments that may not represent the entire company operations. In the case of Lilly, the company operates several establishments throughout the world. Disentangling establishment data from company-based data can be a challenge. Lilly officials provided the IBRC data to conduct the analysis on both a “company report” basis as well as an establishment basis. When in doubt about the correct figure to use for modeling purposes, establishment data were used to model Lilly’s economic impact.
In addition to estimating the economic footprint for the 10-county Indianapolis-Carmel MSA,4
the IBRC also estimated a state-wide economic impact footprint.
4 The MSA is defined by the Office of Management and Budget. The 10 counties include Boone, Brown, Hamilton, Hancock, Hendricks, Johnson, Madison, Marion, Morgan, Putnam and Shelby counties.
6
Statewide Economic Footprint
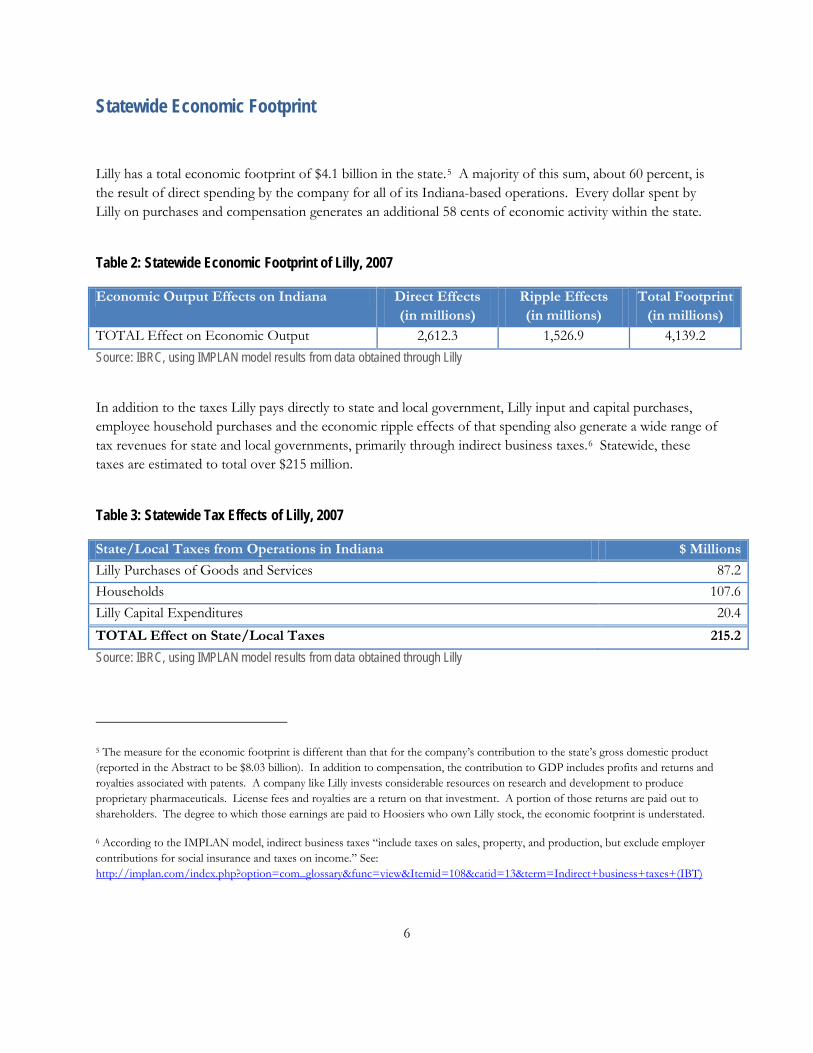
Lilly has a total economic footprint of $4.1 billion in the state.5
Table 2: Statewide Economic Footprint of Lilly, 2007
A majority of this sum, about 60 percent, is the result of direct spending by the company for all of its Indiana-based operations. Every dollar spent by Lilly on purchases and compensation generates an additional 58 cents of economic activity within the state.
Economic Output Effects on Indiana Direct Effects (in millions)
Ripple Effects (in millions)
Total Footprint (in millions)
TOTAL Effect on Economic Output 2,612.3 1,526.9 4,139.2 Source: IBRC, using IMPLAN model results from data obtained through Lilly
In addition to the taxes Lilly pays directly to state and local government, Lilly input and capital purchases, employee household purchases and the economic ripple effects of that spending also generate a wide range of tax revenues for state and local governments, primarily through indirect business taxes.6
Table 3: Statewide Tax Effects of Lilly, 2007
Statewide, these taxes are estimated to total over $215 million.
State/Local Taxes from Operations in Indiana $ Millions Lilly Purchases of Goods and Services 87.2 Households 107.6 Lilly Capital Expenditures 20.4 TOTAL Effect on State/Local Taxes 215.2 Source: IBRC, using IMPLAN model results from data obtained through Lilly
5 The measure for the economic footprint is different than that for the company’s contribution to the state’s gross domestic product (reported in the Abstract to be $8.03 billion). In addition to compensation, the contribution to GDP includes profits and returns and royalties associated with patents. A company like Lilly invests considerable resources on research and development to produce proprietary pharmaceuticals. License fees and royalties are a return on that investment. A portion of those returns are paid out to shareholders. The degree to which those earnings are paid to Hoosiers who own Lilly stock, the economic footprint is understated.
6 According to the IMPLAN model, indirect business taxes “include taxes on sales, property, and production, but exclude employer contributions for social insurance and taxes on income.” See: http://implan.com/index.php?option=com_glossary&func=view&Itemid=108&catid=13&term=Indirect+business+taxes+(IBT)

7
There are about 15,500 employees on the Lilly payroll.7
Table 4
But the employment effects go far beyond Lilly employees. Lilly’s expenditures on production inputs and capital equipment and construction, plus the household spending of Lilly employees also generates jobs. The direct employment effect in (of approximately 16,700 jobs) is a result of the jobs that are supported by the goods and services that Lilly purchases and the household purchases of Lilly employees. There are several rounds of spending that result from those jobs and that ripple effect spending supports another 11,000 jobs. All told, the Lilly payroll, employment direct effects, and employment ripple effects account for about 43,500 jobs across the state.8
Table 4: Statewide Employment Effects of Lilly, 2007
Employment Effects on Indiana Lilly Employees
Direct Effects Ripple Effects
Total Employment
TOTAL Effect on Employment 15,500 16,700 11,300 43,500 Source: IBRC, using IMPLAN model results from data obtained through Lilly
7 The issue of whether a worker at a Lilly facility is an employee, rather than a contract worker, is an important one. The degree to which a company contracts janitorial services, accounting and tax services, or facility maintenance, may understate the role that the company plays in the state’s employment picture. The employment of many types of contract and temporary workers is captured with the IMPLAN software. That said, it is likely that the employment estimates, in fact, underestimate Lilly’s employment impact in the state.
8 Not all jobs are created equally, however. These jobs (and the income related to those jobs) range from physicians working in hospitals to servers at restaurants.

8
Economic Footprint at the MSA Level
Lilly has an economic footprint of approximately $3.1 billion in the Indianapolis-Carmel Metropolitan Statistical Area. About 67 percent of this economic presence is the result of direct spending by the company for its operations in the 10-county MSA. For every dollar spent directly by Lilly on purchases and compensation in the Indianapolis-Carmel metro, there is an additional 47 cents of economic activity in the region.
Table 5: Regional Economic Footprint of Lilly, 2007
Economic Output Effects on Indianapolis-Carmel MSA
Direct Effects (in millions)
Ripple Effects (in millions)
Total Footprint (in millions)
TOTAL Effect on Economic Output 2,089.2 988.1 3,077.3 Source: IBRC, using IMPLAN model results from data obtained through Lilly
Lilly pays significant taxes directly to state and local government in the region. In addition, Lilly operating and capital purchases, employee household purchases and the economic ripple effects of that spending also generate a wide range of tax revenues for state and local governments, primarily through indirect business taxes.9
Table 6: Regional Tax Effects of Lilly, 2007
These taxes are estimated to total more than $175 million in state and local taxes generated in the MSA. Table 6 breaks down the sources of the tax revenues, whether Lilly’s purchase of goods and services or the households of Lilly employees.
State/Local Taxes from Operations in Indianapolis-Carmel MSA $ Millions Lilly Purchases of Goods and Services 71.0 Households 90.7 Lilly Capital Expenditures 14.4 TOTAL Effect on State/Local Taxes 176.2 Source: IBRC, using IMPLAN model results from data obtained through Lilly
9 According to the IMPLAN model, indirect business taxes “include taxes on sales, property, and production, but exclude employer contributions for social insurance and taxes on income.” See: http://implan.com/index.php?option=com_glossary&func=view&Itemid=108&catid=13&term=Indirect+business+taxes+(IBT)
9
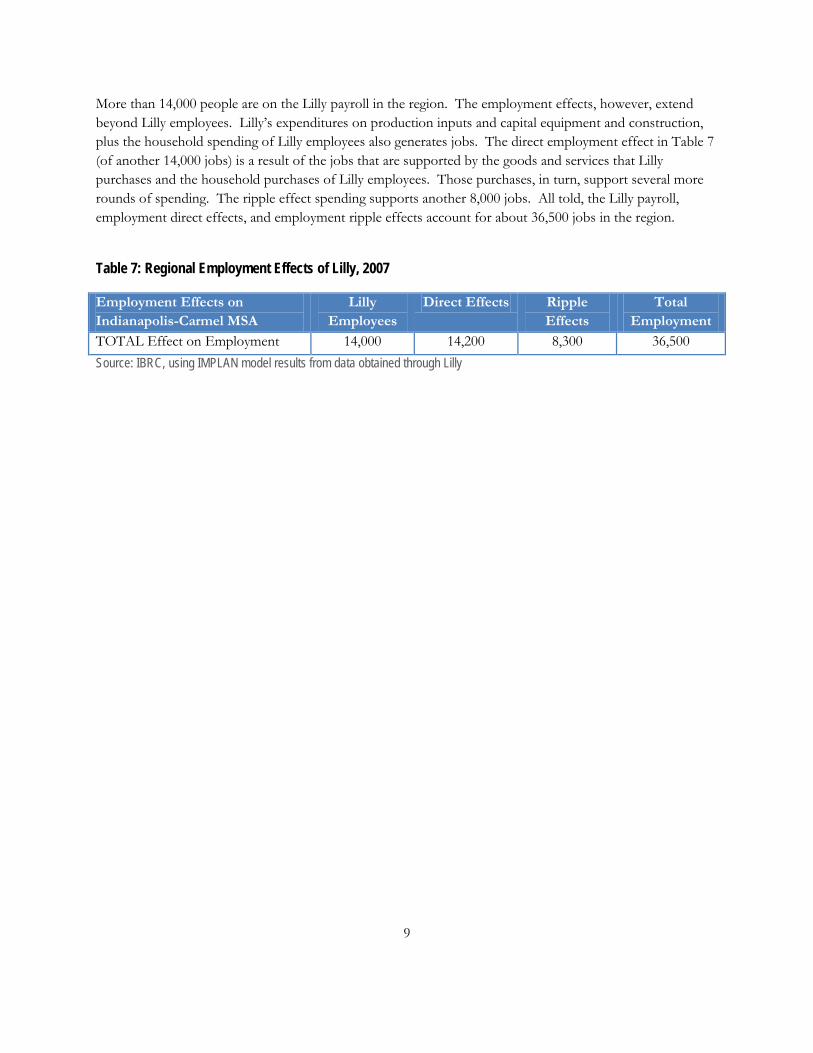
More than 14,000 people are on the Lilly payroll in the region. The employment effects, however, extend beyond Lilly employees. Lilly’s expenditures on production inputs and capital equipment and construction, plus the household spending of Lilly employees also generates jobs. The direct employment effect in Table 7 (of another 14,000 jobs) is a result of the jobs that are supported by the goods and services that Lilly purchases and the household purchases of Lilly employees. Those purchases, in turn, support several more rounds of spending. The ripple effect spending supports another 8,000 jobs. All told, the Lilly payroll, employment direct effects, and employment ripple effects account for about 36,500 jobs in the region.
Table 7: Regional Employment Effects of Lilly, 2007
Employment Effects on Indianapolis-Carmel MSA
Lilly Employees
Direct Effects Ripple Effects
Total Employment
TOTAL Effect on Employment 14,000 14,200 8,300 36,500 Source: IBRC, using IMPLAN model results from data obtained through Lilly

10
Appendix
Minnesota IMPLAN Group, Inc. (MIG) is the company responsible for the production of IMPLAN data and software. Using classic input-output analysis, IMPLAN can be used to measure the effect on a regional or local economy of a given change or event in the economy's activity. It also allows the user to build economic models estimating the effects of a proposed industry or economic change in a specific economic region.
How did IMPLAN come to be?
In the late 1970s and 1980s, the United States Department of Agriculture’s Forest Service found itself wrestling to answer questions about the economic impact of its work. Legislation required the forest service to report annually on the impact of its activities. So the forest service had developed a mainframe computing tool called IMPLAN, short for “impact analysis for planning.” Then it developed a DOS version of the software that could run on PCs.
In 1989, it needed help constructing better economic data sets—production, value-added, employment, wage, and supplier data—that it could run through the software to better demonstrate how forest service activities were affecting local economies. For help, the agency turned to Wilbur Maki, a University of Minnesota economics professor who’d worked on forestry issues in the past. Maki, in turn, called on his research assistants, Scott Lindall and Doug Olson.
In 1993, Lindall and Olson negotiated with the University of Minnesota and the forest service to spin off the economic databases they’d helped to develop and the technology they’d used to do it. They overhauled their earlier work and established a private company to sell it, the Minnesota IMPLAN Group. Their mission has been to provide affordable, user-friendly software and economic data that their clients can use to study regional economies—not just the effects of lost logging business, but what tourism or manufacturing contributes to the economy, what the results of increased or decreased product demand or employment in a particular industry will be, or how effective government spending is in bringing about economic development.
Minnesota IMPLAN Group doesn’t stake out a position on any of these questions, and it doesn’t try to generate answers. It’s neutral on the issues its clients are studying. IMPLAN software and the economic data that the company aggregates from government sources and sells to clients for their economic calculations are agnostic on the questions they’re used to answer. But the numbers that IMPLAN yields for clients—the

11
number of jobs that ethanol production is projected to bring to a state, the dollars of spending that a casino is expected to generate in the local economy—those numbers are hardly ever neutral. Minnesota IMPLAN Group isn’t in the advocacy business, but its clients are: government agencies, nonprofits, industry associations, independent consultants.
The economic theory behind IMPLAN
IMPLAN is built on a mathematical input-output (I-O) model developed by Wassily Leontief, the 1973 Nobel laureate in economics, to express relationships between sectors of the economy in a chosen geographic location. In expressing the flow of dollars through a regional economy, the input-output model assumes fixed relationships between producers and their suppliers based on demand. It also omits any dollars spent outside of the regional economy—say, by producers who import raw goods from another area, or by employees who commute and do their household spending elsewhere.
The idea behind input-output modeling is that it’s the inter-industry relationships within a region that largely determine how that economy will respond to change. In an I-O model, the increase in demand for a certain product or service causes a multiplier effect, layers of effect that come in a chain reaction. Increased demand for a product affects the producer of the product, the producer’s employees, the producer’s suppliers, the supplier’s employees, and so on, ultimately generating a total effect in the economy that is greater than the initial change in demand. Say demand for Andersen Windows’ wood window products increases. Sales grow, so Andersen has to hire more people, and the company may buy more from local vendors, and those vendors in turn have to hire more people… who in turn buy more groceries. The ratio of that overall effect to the initial change is called a regional multiplier and can be expressed like this:
(Direct Effect + Ripple Effects) / (Direct Effect) = Multiplier
The term “multiplier” can’t be used generically, though. Multipliers always express the ratio of overall effect to initial change by one of three measures: output (dollars’ worth of production), labor income, or jobs generated. So there are output multipliers, income multipliers, and employment multipliers. In gauging economic effects, one must be careful about which multiplier is being talked about. Users of IMPLAN or of any input-output model have to make the determination of what the initial change in the economy is—that is, whether they want to study a change in production, labor income, or employment. In general, output multipliers range between 1.3 to 1.8. But employment and labor-income multipliers can bounce around a lot more, depending on production and wage-per-worker data for a given industry and geographic region. Multipliers are very industry-sector and region specific.

12
As for defining those sectors, Leontief identified just 10 back when he first started working on input-output modeling in the 1920s. Today, Minnesota IMPLAN Group differentiates in its software and data sets between 509 sectors that are recognized by the U.S. Department of Commerce. Each sector has a unique output multiplier, because each industry sector has a different pattern of purchases from firms inside and outside of the regional economy. (The output multiplier is in turn used to calculate income and employment multipliers.)
Estimating a multiplier is not the end goal of IMPLAN users. Most wish to estimate other numbers and get the answers to the following questions: How many jobs will this new firm produce? How much will the local economy be affected by this plant closing? What will the effects be of an increase in product demand? Based on those user choices, IMPLAN software constructs “social accounts,” which are mathematical representations of economic interactions—the flow of dollars from purchasers to producers within the region. The data in those social accounts will set up the precise equations needed to finally answer those questions users have—about the impact of a new company, a plant closing, or greater product demand—and yield the answers.
Economists typically construct input-output models using aggregated production, employment, and trade data from local, regional, and national sources, such as the U.S. Census Bureau’s annual County Business Patterns report, and the U.S. Bureau of Labor Statistics’ annual report called Covered Employment and Wages. The IMPLAN database contains county, state, ZIP code, and federal economic statistics which are specialized by region, not estimated from national averages. Minnesota IMPLAN Group has data sets for the entire United States for the years 1990 through 2007. In addition to gathering enormous amounts of data from government sources, the company also estimates some data where they haven’t been reported at the level of detail needed (county-level production data, for instance), or where detail is omitted in government reports to protect the confidentiality of individual companies whose data would be easily recognized due to a sparse population of businesses in the area.
IMPLAN’s accessibility and ease of use also make it a target of criticism by some economists, who charge that in the wrong hands, the software—or any input-output model—will produce inflated results at best, and at worst, completely ridiculous projections. Anyone can point and click their way to an outcome without fully understanding the economics in which the tool is grounded and without knowing how to look at data sets with a nuanced eye. The IBRC has two analysts that have attended advanced training in the use of the IMPLAN modeling software. The estimates that the IBRC analysts generate are pressure-tested and triple-checked to ensure that they are accurate and reflect the most trustworthy application of the modeling software. In all instances, the most conservative estimation assumptions and procedures are used to produce the IMPLAN results.

13
Most of the above IMPLAN software description was culled from the magazine article “The Number Machine,” Twin City Business, February 2008. It can be found online at: http://www.tcbmag.com/features/features/95796p1.aspx.