the economic impact of tourism in georgia
TRANSCRIPT

Tourism Satellite Account Calendar Year 2010
The Economic Impact of Tourism in Georgia

2
Highlights
The Georgia visitor economy rebounded in 2010, recovering 98% of the losses experienced during the recession
Visitor spending increased 8% in 2010
The tourism sector sustained employment of more than 390,000 jobs in 2010

3
Key results
Total tourism demand tallied $28 billion in 2010, rebounding 8% after a 9.7% decline in prior year.
The direct GDP of the tourism sector grew 8.2% to $10.0 billion in 2010.
This economic activity sustained 391,000 jobs in 2010, including direct, indirect, and induced impacts.
10.4% of all jobs* in the state are directly and indirectly sustained by tourism activities. This is an increase in share since 2008 (9.9%) and 2009 (10.1%).
Including indirect and induced impacts, tourism in Georgia generated $2.4 billion in state and local taxes and $3.2 billion in Federal taxes in 2010.
* BLS QCEW total payroll employment

4
Important definitions
1. Total Tourism Demand: Includes visitor spending plus other spending streams in support of the traveler industry. This includes government spending and capital investment in support of tourism.
2. Tourism Industry GDP: Measures the value of production of “tourism characteristic industries” on behalf of travelers. This concept measures only the direct impact of the travel industry.
3. Tourism Economic Impact: Measures the full economic impacts of tourism demand, including indirect and induced impacts.

5
Illustrating the concepts
Travel & Tourism Industry
■ The direct effect of visitor spending
■ Focus of Tourism Satellite Account
■ Allows for industry rankings and comparisons
Travel & Tourism Economic Impact
The flow-through effect of total T&T demand across the economy
■ Expands the focus to measure the overall impact of T&T on all sectors of the economy

6
By monitoring tourism’s economic impact, policy makers can make informed decisions regarding the funding and prioritization of tourism development.
It can also carefully monitor its successes and future needs.
In order to do this, tourism must be measured in the same categories as other economic sectors – i.e. tax generation, employment, wages, and gross domestic product.
Why quantify the tourism economy?

7
What is this a challenge?
Most economic sectors such as financial services, insurance, or construction are easily defined within a country’s national accounts statistics.
Tourism is not so easily measured because it is not a single industry. It is a demand-side activity which affects multiple sectors to various degrees.
Tourism spans nearly a dozen sectors including lodging, recreation, retail, real estate, air passenger transport, food & beverage, car rental, taxi services, travel agents…

8
• The TSA was conceived by the UN World Tourism Organization and has since been ratified by the UN, Eurostat, and OECD.
• The standard has been adopted by over fifty countries around the world.
• The TSA deals with the challenge of measuring tourism in two important ways:
1. Defines the tourism economy
2. Provides methodology for calculating tourism GDP in a way that is consistent with economic accounts
The Tourism Satellite Account
9
• Enables comparisons of the importance of tourism to other sectors of the economy in terms of GDP, employment, and income
• Allows for benchmarking to other destinations
• Tracks the economic contribution of tourism over time
• Monitors strength by tracking capital investment
• Allows for extension analysis for of the full impact of tourism
Benefits of a TSA

10
Detailed Results

11
Tourism demand (spending)
Non-visitor private consumption expenditures (PCE) represent tourism consumer durables such as an RV, boat, or furniture for a vacation home. These rose 3.8% last year.
Government support for tourism, including the budgets for the Division of Tourism, tourism attractions, security, and other budget items in broad support of tourism, declined slightly by -2.3%.
Capital investment, including construction of hotels and attractions, as well as tourism infrastructure, grew modestly in 2010 after a 28% decline in 2009.
Domestic Visitor
Internat'l Visitor
Non-visitor PCE
Gov't Support
CAPEX Total
2006 21,537$ 1,613$ 179$ 33$ 3,532$ 26,895$ 2007 22,781$ 1,706$ 189$ 35$ 3,737$ 28,449$ 2008 23,285$ 1,950$ 189$ 38$ 3,309$ 28,771$ 2009 21,353$ 2,039$ 165$ 36$ 2,394$ 25,987$ 2010 23,072$ 2,357$ 171$ 35$ 2,418$ 28,054$
% change 2010/09 8.1% 15.6% 3.8% -2.3% 1.0% 8.0%
Tourism Demand by Category, $ million

12
Tourism demand by source
Business Day
Domestic visitor markets comprise the majority (82%) of tourism demand.
Capital investment in tourism-related construction and machinery & equipment is second in importance even after two consecutive years of contraction.
International visitor markets contributed 8% of tourism demand in Georgia last year.
Non-visitor PCE1%
CAPEX9%Internat'l Visitor
8%
Domestic Visitor82%
Gov't Support0.1%

13
Tourism demand growth
Business Day
$-
$5
$10
$15
$20
$25
$30
$35
2006 2007 2008 2009 2010
Domestic Visitor Internat'l Visitor CAPEX
Tourism Demand Trendbillions
Source: Tourism Economics

14
Translating spending into impact
Business Day
The direct impacts are quantified within travel-related sectors.
The indirect impacts include the benefits realized by the supply chain.
The induced impacts are generated as wages are spend within the state’s economy.
15
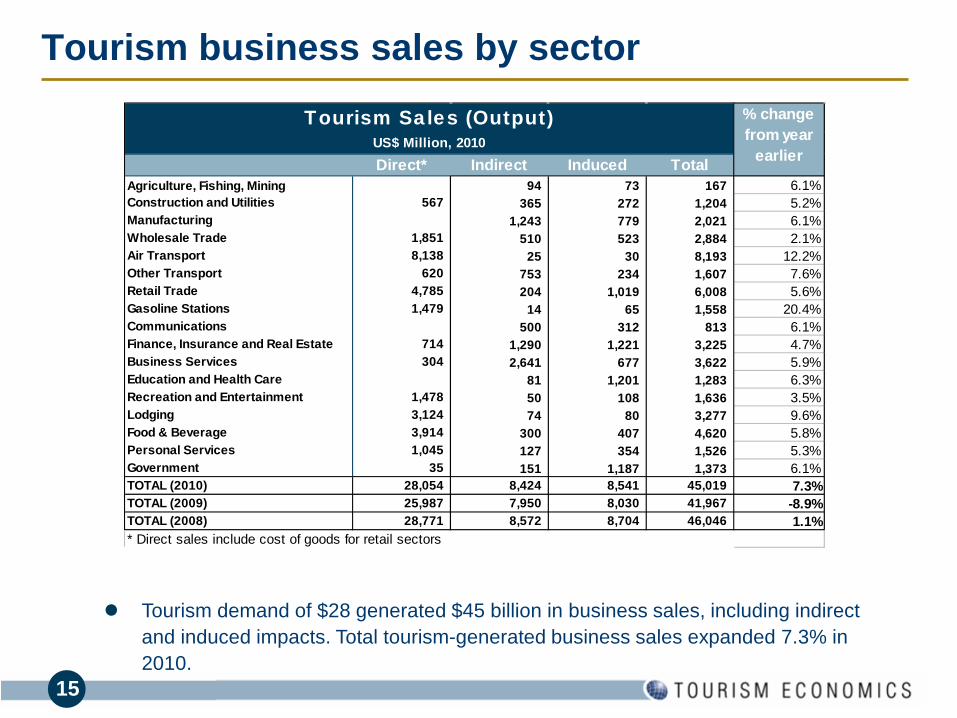
Tourism business sales by sector
Business Day
Tourism demand of $28 generated $45 billion in business sales, including indirect and induced impacts. Total tourism-generated business sales expanded 7.3% in 2010.
Direct* Indirect Induced TotalAgriculture, Fishing, Mining 94 73 167 6.1%Construction and Utilities 567 365 272 1,204 5.2%Manufacturing 1,243 779 2,021 6.1%Wholesale Trade 1,851 510 523 2,884 2.1%Air Transport 8,138 25 30 8,193 12.2%Other Transport 620 753 234 1,607 7.6%Retail Trade 4,785 204 1,019 6,008 5.6%Gasoline Stations 1,479 14 65 1,558 20.4%Communications 500 312 813 6.1%Finance, Insurance and Real Estate 714 1,290 1,221 3,225 4.7%Business Services 304 2,641 677 3,622 5.9%Education and Health Care 81 1,201 1,283 6.3%Recreation and Entertainment 1,478 50 108 1,636 3.5%Lodging 3,124 74 80 3,277 9.6%Food & Beverage 3,914 300 407 4,620 5.8%Personal Services 1,045 127 354 1,526 5.3%Government 35 151 1,187 1,373 6.1%TOTAL (2010) 28,054 8,424 8,541 45,019 7.3%TOTAL (2009) 25,987 7,950 8,030 41,967 -8.9%TOTAL (2008) 28,771 8,572 8,704 46,046 1.1%* Direct sales include cost of goods for retail sectors
Tourism Sales (Output) % change from year
earlierUS$ Million, 2010

16
Tourism sales
Business Day
Tourism Business Sales
01,0002,0003,0004,0005,0006,0007,0008,0009,000
Air
Tran
spor
t
Ret
ail T
rade
F&B
ev
Bus
. Svc
s.
Lodg
ing
Fin.
, Ins
ur.
Who
le. T
rade
Man
ufac
turin
g
Rec
reat
ion
Oth
. Tra
nsp.
Gas
Sta
tions
Per
s. S
vcs.
Gov
ernm
ent
InducedIndirectDirect*
$ million

17
Tourism industry GDP
Business Day
Tourism GDP is the value added of those sectors directly interacting with travelers.
The narrow definition of the tourism industry counts only tourism consumption, which excludes capital investment and general government support of tourism. This definition is consistent with economic accounts.
On this basis, tourism industry GDP reached $10 billion in 2010, accounting for 2.3% of total Georgia GDP.
Industry Composition 2009 2010 % Agriculture, Fishing, MiningConstruction and UtilitiesManufacturingWholesale TradeAir Transport 2,547 2,858 12.2%Other Transport 273 301 10.2%Retail Trade 746 787 5.5%Gasoline Stations 174 210 21.3%CommunicationsFinance, Insurance and Real Estate 431 430 -0.2%Business Services 124 128 3.9%Education and Health CareRecreation and Entertainment 731 754 3.2%Lodging 2,047 2,246 9.7%Food & Beverage 1,766 1,867 5.7%Personal Services 469 492 4.9%GovernmentTOTAL 9,307 10,074 8.2%
Tourism Industry GDP(US$ Million)
18
Tourism GDP Impact
The complete definition of the tourism demand includes capital investment and general government support of tourism.
Including the direct, indirect and induced impacts of total tourism demand, the tourism sector generated $20.3 billion of state GDP. This is 5.0% of the state economy.

19
Tourism GDP Impact
Business Day
Direct* Indirect Induced TotalAgriculture, Fishing, Mining 26 29 55 6.2%Construction and Utilities 380 243 193 816 5.3%Manufacturing 303 219 522 6.1%Wholesale Trade 149 344 353 846 5.0%Air Transport 2,858 9 10 2,877 12.2%Other Transport 301 525 129 954 7.3%Retail Trade 787 134 665 1,586 5.9%Gasoline Stations 210 10 44 264 17.9%Communications 251 155 406 6.1%Finance, Insurance and Real Estate 430 849 735 2,014 4.7%Business Services 128 1,470 387 1,986 5.9%Education and Health Care 48 747 795 6.3%Recreation and Entertainment 754 29 63 846 3.5%Lodging 2,246 47 50 2,344 9.6%Food & Beverage 1,867 143 194 2,204 5.8%Personal Services 492 66 186 745 5.4%Government 23 55 1,008 1,085 6.1%TOTAL (2010) 10,626 4,552 5,168 20,346 7.1%TOTAL (2009) 9,843 4,296 4,859 18,999 -9.1%TOTAL (2008) 10,995 4,632 5,267 20,894 1.3%
Tourism GDP (Value Added) % change from year
earlier(US$ Million)

20
Tourism GDP impact
Business Day
All sectors of the Georgia economy benefit from tourism activity directly and/or indirectly.
Tourism GDP Impact
0
500
1,000
1,500
2,000
2,500
3,000
Air
Tran
spor
t
Lodg
ing
F&B
Fin,
Insu
ranc
e
Bus
. Svc
s.
Ret
ail T
rade
Gov
ernm
ent
Oth
er T
rans
port
Who
lesa
le T
rade
Rec
reat
ion
Con
str,
Util
ities
Edu
, Hea
lth
Per
sona
l Ser
vice
s
InducedIndirectDirect
$ million

21
Ranking tourism industry employment
Business Day
The tourism industry directly employed 239,135 Georgians in 2010. This narrow measurement of tourism includes only those jobs directly supported by visitor activity and enables inter-industry ranking.
On this basis, tourism is the 5th largest private employer in the state of Georgia.
Rank Industry Value*1 Retail trade 402,069
2 Health care 395,959
3 Manufacturing 343,111
4 Administration and waste management 248,662
5 Tourism 239,135
6 Accommodation and food services (minus tourism) 219,277
7 Professional, Scientific, and Technical Services 216,413
8 Wholesale Trade 196,278
9 Construction 149,320
10 Finance and insurance 144,835
* Comparative data is BLS QCEW employment
Ranking of Employment2010

22
Total tourism employment
Business Day
The tourism sector directly and indirectly supported more than 391,000 jobs, or 10.4% of all payroll employment* in Georgia last year.
Tourism-related employment grew 2.0 in 2010 as visitor spending recovered.
Direct Indirect Induced TotalAgriculture, Fishing, Mining 1,501 1,228 2,729 1.7%Construction and Utilities 10,225 944 342 11,512 3.0%Manufacturing 3,701 2,119 5,821 1.7%Wholesale Trade 1,227 2,589 2,657 6,473 1.6%Air Transport 40,475 107 127 40,709 -0.4%Other Transport 9,583 8,054 2,459 20,096 3.0%Retail Trade 25,738 2,991 17,982 46,711 2.6%Gasoline Stations 4,599 177 863 5,639 -0.1%Communications 1,518 767 2,286 1.7%Finance, Insurance and Real Estate 6,846 6,079 12,925 1.7%Business Services 1,031 22,230 7,836 31,097 1.7%Education and Health Care 1,333 14,631 15,964 1.7%Recreation and Entertainment 28,095 1,052 2,572 31,720 2.0%Lodging 43,358 881 945 45,184 1.2%Food & Beverage 71,370 5,797 7,869 85,036 3.2%Personal Services 14,818 1,982 8,557 25,357 2.6%Government 67 924 794 1,785 1.8%TOTAL (2010) 250,588 62,627 77,827 391,042 2.0%TOTAL (2009) 245,238 61,619 76,492 383,348 -4.0%TOTAL (2008) 256,319 63,684 79,232 399,235
Tourism Employment % change from year
earlier
* BLS QCEW total payroll employment

23
Business Day
The restaurant, lodging, and retail sectors employed the most persons in the tourism sector.
Secondary benefits are realized across the entire economy through the supply chain and incomes as they are spent.
For example, 13,000 people are employed in the finance, insurance, and real estate sector as a result of tourism activity.
Tourism Generated Employment
-10
10
30
50
70
90
F&B
Ret
ail T
rade
Lodg
ing
Air
Tran
spor
t
Rec
reat
ion
Bus
Svc
s
Per
sona
l Ser
v
Oth
er T
rans
p
Edu
, Hea
lth
Fin,
Insu
r
Con
stru
ctio
n
Who
le.T
rade
Man
ufac
turin
g
Gas
olin
e
Thou
sand
s
InducedIndirectDirect
Total tourism employment

24
Tourism personal income
Business Day
$13.7 billion in compensation was generated by tourism demand in 2010, an increase of 6.2%
Direct Indirect Induced TotalAgriculture, Fishing, Mining 17 21 38 6.1%Construction and Utilities 548 98 66 712 3.1%Manufacturing 203 123 326 6.0%Wholesale Trade 89 193 198 480 5.2%Air Transport 2,455 8 9 2,471 8.5%Other Transport 199 441 98 738 5.8%Retail Trade 542 84 419 1,044 5.0%Gasoline Stations 99 4 20 123 9.4%Communications 133 69 202 6.0%Finance, Insurance and Real Estate 302 319 324 945 5.2%Business Services 51 1,142 313 1,506 5.9%Education and Health Care 36 644 680 6.3%Recreation and Entertainment 864 23 44 930 2.7%Lodging 1,310 27 28 1,365 11.3%Food & Beverage 1,285 101 137 1,522 4.4%Personal Services 355 53 150 558 4.6%Government 39 26 65 6.0%TOTAL (2010) 8,096 2,922 2,688 13,706 6.2%TOTAL (2009) 7,622 2,759 2,529 12,911 -7.4%TOTAL (2008) 8,232 2,975 2,742 13,949 1.3%
Tourism Income (Compensation) % change from year
earlier(US$ Million)

25
Tourism personal income
Business Day
Tourism generated the most personal income in the air transport, business services and food & beverage sectors.
The business services sector benefits strongly as a supplier to other tourism sectors.
On average, the tourism economy generated $35,084 in income per employee (including part-time).
Tourism Generated Income
0
500
1,000
1,500
2,000
2,500
Air
Tran
spor
t
F&B
Bus
ines
s S
vcs.
Lodg
ing
Ret
ail T
rade
Fin,
Insu
ranc
e
Rec
reat
ion
Oth
er T
rans
port
Con
str,
Util
ities
Edu
, Hea
lth
Per
sona
l Svc
s.
Who
lesa
le T
rade
Induced
Indirect
Direct
$ million

26
Tourism tax generation
Business Day
Taxes of $5.6 billion were directly and indirectly generated by tourism in 2010.
State and local taxes alone tallied $2.4 billion.
Each household in Georgia would need to be taxed an additional $706 per year to replace the tourism taxes received by state and local governments.
2008 2009 2010Federal Taxes 3,254 3,000 3,195 Corporate 443 404 433 Indirect Business 330 301 323 Personal Income 1,102 1,020 1,084 Social Security 1,378 1,276 1,356
State and Local Taxes 2,457 2,277 2,414 Corporate 184 168 180 Personal Income 350 323 344 Sales 1,027 936 1,004 Property 745 712 738 Excise and Fees 131 119 128 State Unemployment 21 19 21
TOTAL 5,710 5,278 5,609 % change year ago 1.1% -7.6% 6.3%
Tourism-Generated Taxes(US$ Million)

27
State government’s role
Government support of tourism is divided between collective (general support) and individual (specific support) spending.
Capital expenditures are also considered in proportion to tourists’ usage.
Current (operating) support of tourism contracted 2.3% in 2010.
Capital expenditures in support of tourism increased 1.5% on account of infrastructure.
FY 2011 CapitalGeneral Specific
Economic Development Aviation Hall of Fame 10,560$ Civil War Commission 4,800$ Music Hall of Fame 185,380$ Sports Hall of Fame 150,177$
Tourism 9,567,401$ Film, Video, and Music 494,696$
Natural Resources Historic Preservation 1,178,480$ Parks, Recreation and Historic Sites 14,052,601$ Coastal Resources 3,353,016$
Office of the GovenorGeorgia Council for the Arts 354,627$
Public SafetyAviation 1,264,997$ Department of TransportationGeorgia Aviation Authority 4,780,037$ Highway construction 8,941,563$ Highway construction and improvement- Special Project 100,119,863$ Total 10,062,097$ 25,334,673$ 109,061,426$ % change -5.0% -1.2% 1.5%
State Expenditures on TourismTOURISM ATTRIBUTION
Current

28
Tourism capital investment
More than $2.6 billion was invested by the tourism sector last year, including hotels, recreational facilities, and related government capital outlays.
After two years of contraction, tourism capital investment began its recover in 2010 with growth of 9%.
2007 2008 2009 2010 2010 % change
Construction 1,110,340,200$ 1,093,385,055$ 436,326,674$ 459,565,580$ 5%
Machinery and Equipment 2,478,577,839$ 2,059,535,755$ 1,850,605,775$ 2,052,996,640$ 11%
Government Capital Outlays 147,650,000$ 155,870,608$ 107,474,569$ 109,061,426$ 1%
Total 3,736,570,046$ 3,308,793,425$ 2,394,409,027$ 2,621,625,656$ 9%
Tourism Capital Investment

29
Tourism Economics, headquartered in Philadelphia, is an Oxford Economics company dedicated to providing high value, robust, and relevant analyses of the tourism sector that reflects the dynamics of local and global economies. By combining quantitative methods with industry knowledge, Tourism Economics designs custom market strategies, project feasibility analysis, tourism forecasting models, tourism policy analysis, and economic impact studies.
Our staff have worked with over 100 destinations to quantify the economic value of tourism, forecast demand, guide strategy, or evaluate tourism policies.
Oxford Economics is one of the world’s leading providers of economic analysis, forecasts and consulting advice. Founded in 1981 as a joint venture with Oxford University’s business college, Oxford Economics is founded on a reputation for high quality, quantitative analysis and evidence-based advice. For this, it draws on its own staff of 40 highly-experienced professional economists; a dedicated data analysis team; global modeling tools; close links with Oxford University, and a range of partner institutions in Europe, the US and in the United Nations Project Link.
For more information: [email protected] / +1 610 995 9600.
About Tourism Economics

30
For more information:
Adam Sacks, Managing Director [email protected]
Christopher Pike, Senior Economist