the economic state of the latino community in america · the economic state of the latino community...
TRANSCRIPT

October 2015
The Economic State of the Latino Community in America
More than 55 million people of Hispanic or Latino ethnicity live in the United States, comprising
17 percent of the country’s total population.1 Hispanics are the nation’s largest ethnic group and their
share of the U.S. population is expected to grow. Nearly one in three people living in the United
States will identify themselves as Hispanic or Latino by 2060.2
The Latino community trails the majority non-
Hispanic white population in many important
indicators of economic well-being, including
employment, income and wealth accumulation.
The gaps are largest for Latinos born outside the
United States. However, Latinos born in this
country—although still lagging by some
measures—are making progress on many fronts.
Hispanic women (Latinas) face special
challenges. The median Hispanic woman earns
only 88 percent of what the median Hispanic
man earns, and she earns little more than half of
the median white male earns.3 Moreover, most
Latinas have little access to services like day
care or parental leave that would allow them to
balance work and family and to earn higher
wages.
Nevertheless, there are reasons to be hopeful.
The relative youth of the Hispanic population,
the push toward greater education and an
entrepreneurial drive present opportunities for
the future.
This report examines multiple aspects of the
economic state of the Latino community in the
United States, including population growth,
geographic presence, demographics, educational
attainment, employment and earnings, the role of
Latinas, wealth and retirement security.
Together, these data help paint a portrait of
Latinos and their economic prospects for the future.
Key Facts
By 2060, one in three people living
in the U.S. will be Latino.
The “typical” (median) Hispanic
worker earns 72 percent of what the
“typical” non-Hispanic white earns.
Hispanic women earn just 55 cents
for every dollar earned by non-
Hispanic white men.
The median income of Hispanic
households is $42,500—nearly
$18,000 less than the median income
of non-Hispanic white households.
The median net worth of Hispanic
households is approximately one-
tenth that of non-Hispanic white
households.
Hispanic households are twice as
likely to live in poverty as non-
Hispanic white households.
U.S.-born Latinos are almost twice as
likely to have a bachelor’s degree as
foreign-born Latinos.
Note: In this report, the terms “Hispanic” and “Latino” are used interchangeably.
Prepared by the Democratic staff of the Joint Economic Committee 2
Population Growth
During the 1990s and 2000s, an influx of immigrants from Latin America and Mexico fueled a
period of rapid growth in the number of Latinos in the United States. At the peak between 1995 and
2000, the Latino population grew by an average of 4.8 percent per year.4
Over the past four years, growth has slowed to an average of 2.2 percent per year.5 Even at this
pace, Hispanics are the second fastest growing racial or ethnic group, trailing Asians.6
Last year alone, the number of Hispanics living in the United States increased by over 1.1 million,
accounting for almost half of the growth in the U.S. population in 2014.7 While immigration used to
be the primary driver of growth in the Hispanic population, it accounted for less than one-quarter of
this most recent increase, which was due to “natural growth” —the fact that the number of Latino
births in the United States exceeded the number of deaths.8
Over the long term, the growth of the Hispanic population will reshape the United States. The U.S.
Census Bureau estimates that the Hispanic share of the population will grow from 17 percent in 2014
to almost 30 percent in 2060. In comparison, the non-Hispanic white share of the population,
currently 62 percent, is projected to decline to less than 44 percent in 2060. The Asian share of the
population is expected to increase from 5 percent to 9 percent, while the non-Hispanic black share
will edge up from 13 percent to 16 percent.9
Geographic Presence
The Hispanic population is spread throughout the country. California has the largest number of
Latinos—nearly 15 million. Other states with large numbers of Latinos include Texas (10.4 million),
Florida (4.8 million), New York (3.7 million) and Illinois (2.2 million). In fact, over 60 percent of
the entire U.S. Hispanic population lives in one of these five states. Another 3.5 million Latinos live
in Puerto Rico.10
Hispanics make up the largest share of the total population of the state of New Mexico, where nearly
half (47.7 percent) of the residents are of Hispanic origin. They also make up a large percentage of
the population of California (38.6 percent), Texas (38.6 percent), Arizona (30.5 percent) and Nevada
(27.8 percent).
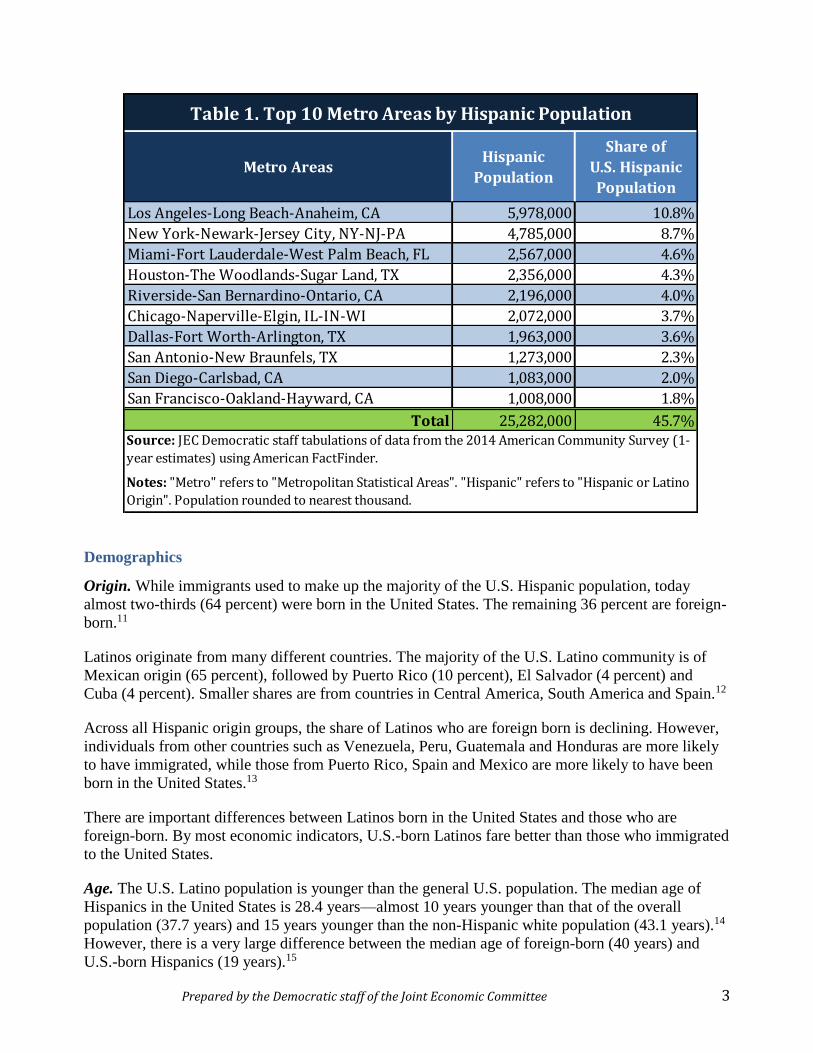
A large percentage of the total U.S. Latino population is clustered in 10 metropolitan areas, led by
Los Angeles-Long Beach-Anaheim, New York-Newark-Jersey City and Miami-Fort Lauderdale-
West Palm Beach. The Latino populations of these 10 cities alone make up 45.7 percent of the total
U.S. Latino population (see Table 1).
Prepared by the Democratic staff of the Joint Economic Committee 3
Demographics
Origin. While immigrants used to make up the majority of the U.S. Hispanic population, today
almost two-thirds (64 percent) were born in the United States. The remaining 36 percent are foreign-
born.11
Latinos originate from many different countries. The majority of the U.S. Latino community is of
Mexican origin (65 percent), followed by Puerto Rico (10 percent), El Salvador (4 percent) and
Cuba (4 percent). Smaller shares are from countries in Central America, South America and Spain.12
Across all Hispanic origin groups, the share of Latinos who are foreign born is declining. However,
individuals from other countries such as Venezuela, Peru, Guatemala and Honduras are more likely
to have immigrated, while those from Puerto Rico, Spain and Mexico are more likely to have been
born in the United States.13
There are important differences between Latinos born in the United States and those who are
foreign-born. By most economic indicators, U.S.-born Latinos fare better than those who immigrated
to the United States.
Age. The U.S. Latino population is younger than the general U.S. population. The median age of
Hispanics in the United States is 28.4 years—almost 10 years younger than that of the overall
population (37.7 years) and 15 years younger than the non-Hispanic white population (43.1 years).14
However, there is a very large difference between the median age of foreign-born (40 years) and
U.S.-born Hispanics (19 years).15
Metro AreasHispanic
Population
Share of
U.S. Hispanic
Population
Los Angeles-Long Beach-Anaheim, CA 5,978,000 10.8%
New York-Newark-Jersey City, NY-NJ-PA 4,785,000 8.7%
Miami-Fort Lauderdale-West Palm Beach, FL 2,567,000 4.6%
Houston-The Woodlands-Sugar Land, TX 2,356,000 4.3%
Riverside-San Bernardino-Ontario, CA 2,196,000 4.0%
Chicago-Naperville-Elgin, IL-IN-WI 2,072,000 3.7%
Dallas-Fort Worth-Arlington, TX 1,963,000 3.6%
San Antonio-New Braunfels, TX 1,273,000 2.3%
San Diego-Carlsbad, CA 1,083,000 2.0%
San Francisco-Oakland-Hayward, CA 1,008,000 1.8%
Total 25,282,000 45.7%
Table 1. Top 10 Metro Areas by Hispanic Population
Source: JEC Democratic staff tabulations of data from the 2014 American Community Survey (1-
year estimates) using American FactFinder.
Notes: "Metro" refers to "Metropolitan Statistical Areas". "Hispanic" refers to "Hispanic or Latino
Origin". Population rounded to nearest thousand.
Prepared by the Democratic staff of the Joint Economic Committee 4
Nearly one-third (32 percent) of Latinos today are younger than 18, compared to less than one-
quarter (23 percent) of the overall population, and less than one-fifth (19 percent) of non-Hispanic
whites.16 Notably, approximately one out of every four children living in the United States is
Hispanic.17
Latinos are under-represented in older age groups. Just 6 percent of the U.S. Latino community is 65
or older, compared to 14.5 percent of the overall population and 10 percent of the non-Hispanic
white population.18 Only one out of every 13 individuals over the age of 65 is Hispanic.19
Citizenship. Latinos make up a large share (46 percent) of the foreign-born population in the United
States and a majority of the unauthorized/undocumented resident population.20 According to the Pew
Research Center, there were 8.3 million unauthorized residents from Mexico, Central America and
South America residing in the United States in 2012. These individuals comprise 74 percent of the
total unauthorized population of 11.2 million residents.21 One-in-three (33 percent) Latinos 18 years
and older are not U.S. citizens compared to only one-in-10 (8 percent) of the overall adult
population.
Education
Less than two-thirds (64.7 percent) of Hispanics over the age of 25 have a high school degree. They
are four times less likely to have completed high school than non-Hispanic whites.22
But over the past several decades, more Latinos have pursued higher education. The percent with a
bachelor’s degree nearly doubled from 8 percent in 1990 to 15 percent in 2014.23 The share of recent
high school graduates enrolled in post-secondary education has increased from 43 percent in 1990 to
60 percent in 2013.24
There are large differences in the levels of education attained by first-generation Hispanics (born
outside the United States) and later generations. Seventy-five percent of U.S.-born Hispanics have
graduated from high school; only half of foreign-born Hispanics have high school degrees. Eighteen
percent of U.S.-born Hispanics hold a bachelor’s degree; just over 10 percent of foreign-born
Hispanics hold a bachelor’s degree.25
The increasing rates of educational attainment have paid off for Latino families in terms of higher
incomes and wealth. Latino families with a college-educated head of household earn 2.2 times more
income and have net worth 4.1 times greater than those without a college education.26
The relationship between education and economic well-being is complex. Over the long-run, the
benefits of a college degree are smaller for Latinos and African Americans than for whites and
Asians. Even for Latinos with a college degree, the unemployment rate is 3.9 percent, a full
percentage point higher than the unemployment rate for whites (2.9 percent).27

Prepared by the Democratic staff of the Joint Economic Committee 5
Employment
Latinos play an important role in many
industries and collectively they hold 16.3
percent of private-sector jobs.
Latinos are over-represented in several
sectors, including construction where they
hold more than one quarter of all jobs. They
also make up disproportionate shares of
employment in low-paying industries such as
agriculture and leisure and hospitality, where
they hold over one-fifth of all jobs (see
Figure 1).
On the other hand, Latinos are under-
represented in several high-paying industries,
including professional and business services,
financial activities and information. They are
also under-represented in the education and
health services industry—one of the most
rapidly expanding sectors of the economy.28
More than one-quarter (27 percent) of
Latinos work in service occupations
compared to 17 percent of whites. These
occupations include food service, grounds keeping and maintenance jobs. Very few Hispanics work
in typically higher-paying jobs, including architecture and engineering, which employ less than 1
percent of Hispanics workers.29
Unemployment rates for Latinos have consistently been higher than for non-Hispanic whites and for
the population as a whole. During the Great Recession, Hispanic unemployment soared to 13.0
percent—three points higher than the unemployment rate for the general population (10.0 percent).
However, the unemployment rate for Latinos has recovered somewhat more quickly than for others
(see Figure 2).
Since 2010, Hispanic employment has increased by over 4.7 million workers, accounting for about
40 percent of total employment gains in the United States. This is partly due to the fact that
Hispanics are more likely to work in the recently booming mining industry and the recovering
construction industry.30
The current unemployment rate among Latinos is 6.4 percent—almost 1.5 times the rate for whites
(4.4 percent).31 Over the past 12 months, the unemployment rate for Hispanic men has averaged 6.4
percent, 1.6 percentage points higher than the unemployment rate for white men (4.8 percent). Over
the same period, the unemployment rate for Hispanic women averaged 7.2 percent—2.6 percentage
points higher than the rate for white women (4.6 percent).

Prepared by the Democratic staff of the Joint Economic Committee 6
The unemployment rate is particularly high
for Latino youth. One-in-five (19.3 percent)
of Hispanics in their late teens and one-in-
10 (10.1 percent) Hispanics in their early
twenties were unemployed over the past 12
months.32 High unemployment rates for
young workers can hurt their long-term
employment and earning prospects.33
Hispanic workers also are more likely to be
underemployed. For example, among
individuals working part time, one-in-three
Hispanic workers are doing so because their
hours have been cut or they cannot find full-
time work. This is true for only one-in-five
white workers.34
Income and Earnings
The fact that many Hispanics work in
lower-paying occupations means that they
generally earn less than non-Hispanics.
Median weekly earnings of Hispanic
workers employed full time are 27 percent
less than median weekly earnings of non-
Hispanic white workers—$602 per week
versus $829 per week.35
The earnings disparity faced by Hispanic
workers translates to lower incomes for
Hispanic households. In 2014, median
income of all Latino households was
$42,500, $17,800 less than the median
income of non-Hispanic white households
($60,300) (see Figure 3).36 Foreign-born
Latinos fared worse with a median
household income of $34,600, while U.S.-
born Latinos fared somewhat better with a
median income of $47,000.37
Latinos are under-represented in top income
brackets and over-represented in bottom
brackets. Even though roughly 13 percent of
U.S. households are Latino, they make up
only 7.1 percent of households in the top
fifth of the income scale. On the other hand,
they make up 15 percent of households in
the bottom fifth of the income scale.38
Prepared by the Democratic staff of the Joint Economic Committee 7
Poverty
Higher rates of unemployment and lower earnings make Hispanic families among the most likely to
be in poverty. In 2014, 13.1 million Hispanics, including 5.7 million children, lived below the
poverty line.39
The poverty rate for Hispanics (23.6 percent) is more than 10 percentage points higher than the rate
for the non-Hispanics (12.9 percent), and 14 percentage points higher than the rate for non-Hispanic
whites (10.1 percent).40
Growing up in poverty has serious consequences for children’s economic well-being and future
outcomes. Almost 30 percent of Latino children live in a food-insecure household.41 Latino children
are 50 percent more likely to be raised in the bottom 20 percent of the income distribution as
children in white households.42 Research shows that children raised in households at the bottom of
the income scale are more likely to remain there as adults.43
The Role of Hispanic Women in the Workforce
Over 27 million Latinas live in the United States, including 18.6 million who are 18 years or older.
Latinas make up 7 percent of the total workforce and 15 percent of the female workforce.44 Those
shares likely will increase as the Hispanic population continues to grow.
Latinas play an important role in the
economic security of their families and they
make significant contributions to the
economy. Over 55 percent of Hispanic
women are in the labor force, including 62
percent of mothers with children younger
than 18.45 According to the Center for
American Progress (CAP), 40 percent of
married Latinas earn more than half of their
family’s income.46
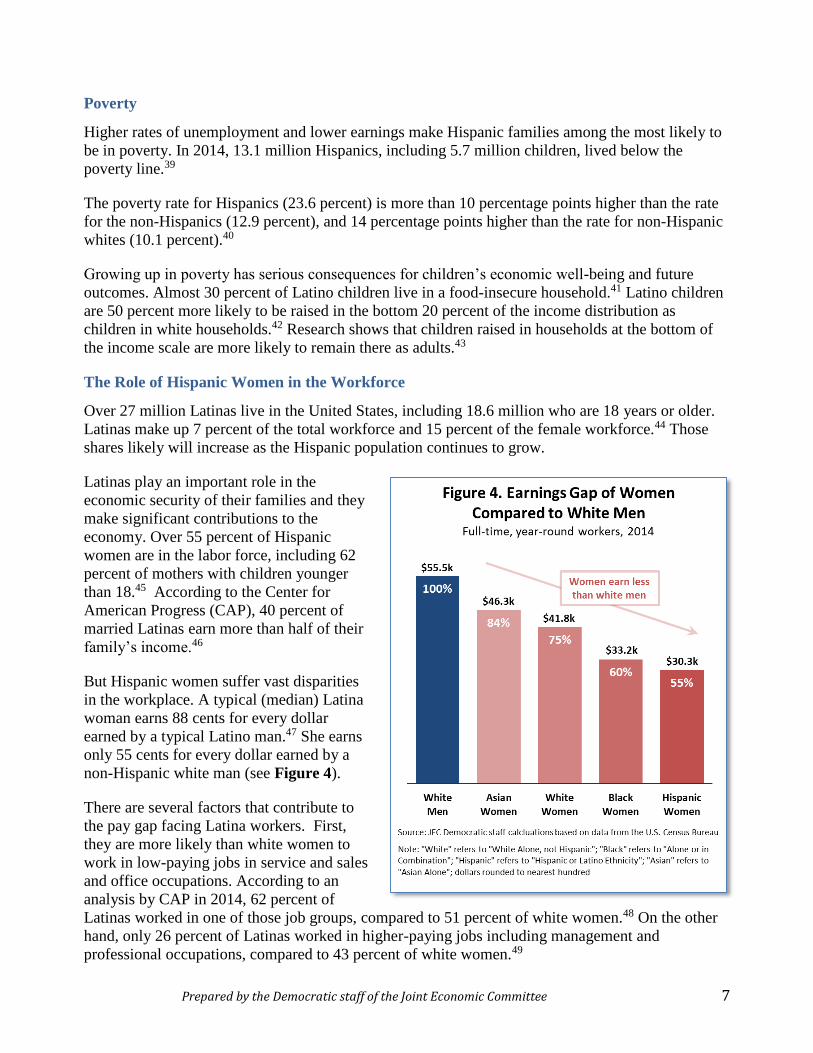
But Hispanic women suffer vast disparities
in the workplace. A typical (median) Latina
woman earns 88 cents for every dollar
earned by a typical Latino man.47 She earns
only 55 cents for every dollar earned by a
non-Hispanic white man (see Figure 4).
There are several factors that contribute to
the pay gap facing Latina workers. First,
they are more likely than white women to
work in low-paying jobs in service and sales
and office occupations. According to an
analysis by CAP in 2014, 62 percent of
Latinas worked in one of those job groups, compared to 51 percent of white women.48 On the other
hand, only 26 percent of Latinas worked in higher-paying jobs including management and
professional occupations, compared to 43 percent of white women.49

Prepared by the Democratic staff of the Joint Economic Committee 8
Second, Latinas generally have lower levels of education than white women. Only 16 percent of
Latinas 25 and older have earned a 4-year degree, compared to 33 percent of white women 25 and
older, making white women twice as likely as Latinas to hold a bachelor’s degree.50
Third, Latinas are more likely to work in jobs with reduced hours and to work part time
involuntarily.51 Researchers have shown that workers experience a wage bonus for putting in longer
hours, and a wage penalty for working fewer hours, a consequence that disproportionately hurts
minority women.52
Finally, Latinas are also more likely to earn the minimum wage—currently $7.25 per hour. The
Economic Policy Institute has estimated that raising the minimum wage to $12.00 per hour would
benefit more than four in 10 working Latinas.53
An additional challenge for Latinas is that they are often employed in jobs with no access to paid
sick leave, paid family leave and flexible schedules, making it more difficult to balance work and
family responsibilities.54 The disparity in access to these benefits is especially problematic for single
mothers. About a third (30.5 percent) of Hispanic families with children under 18 are headed by a
single mother, compared to one-fifth (21.4 percent) of white families with children.55Almost half
(46.3 percent) of families headed by a Hispanic single mother are in poverty.56
Economic Influence and Entrepreneurship
The Latino community accounts for a combined $1.3 trillion in economic activity. Their
contributions are projected to top $1.7 trillion by 2020.57
Latinos own 3.2 million businesses in the United States, according to the U.S. Small Business
Administration. Together, those businesses generate almost $500 billion in economic activity
annually.58 Hispanics are 1.5 times more likely than the general population to become
entrepreneurs, according to the Kauffman Index of Entrepreneurial Activity.59 The vast majority (90
percent) of immigrant entrepreneurs are Hispanic.60 In recent years, Hispanics have become
entrepreneurs at a faster rate than all of the other major racial/ethnic groups.61
Latinas have been strong contributors to the high rates of entrepreneurship among Hispanics.
According to an analysis by the Center for American Progress, Latina-owned businesses are “the
fastest-growing segment of the women-owned business market, and are starting up at six times the
national average.”62
However, the robust entrepreneurship in the Hispanic community also comes with challenges. Latino
business owners are more likely to be low-income entrepreneurs than white business owners. This is
largely due to the fact that a high number of Hispanic entrepreneurs are immigrants.63 As a result,
Latino business owners often must overcome large hurdles to be successful, including lack of access
to capital and high rates of failure.64
Wealth, Homeownership and Retirement Security
White households typically have 10 times more wealth than Hispanic households. In 2013, the
median net worth of Hispanic households was only $14,000 compared to about $142,000 for white
households—a difference of $128,000.65 The wealth divide has increased since the Great Recession.
The median net worth of Hispanic households fell by over 40 percent from 2007 to 2013, compared
to a drop of 26 percent among white households.66
Prepared by the Democratic staff of the Joint Economic Committee 9
The composition of wealth is also different for Hispanic and white households. Home equity makes
up a higher proportion of overall wealth for Hispanic households, despite the fact that they are much
less likely to own their own homes.67 Currently, 45 percent of Latino households own their homes
(compared to an almost 72 percent ownership rate among white households).68
Research suggests that in the period leading up to the financial crisis, Hispanic borrowers were more
likely to hold subprime mortgages, even after accounting for differences in income and credit
scores.69 While the reason for this are not clear, it may have been that this market was underserved
by traditional lenders offering conventional loans.70 The consequences have been severe for the
Hispanic community.
Hispanic homeowners have experienced high rates of delinquency and foreclosure.71 And although
home values have rebounded in recent years, the recovery has not kept pace with returns in the stock
market, leading to a slower recovery for Hispanic households.
Disparities in employment, earnings and wealth all contribute to the fact that Hispanics are generally
less financially prepared for retirement than groups. Latinos also are less likely to be covered by
employer-sponsored retirement plans. Only 12 percent of Latino households have access to a defined
benefit pension that guarantees lifetime income—half the rate of white and black households. Less
than 70 percent of working-age Latino households do not own assets in a retirement account
compared to 37 percent of white households. According to a 2013 report by the National Institute for
Retirement Security, four out of five Latino households headed by someone between the ages of 24-
64 have less than $10,000 in retirement savings, while half of white households have more than
$10,000.72
1 JEC Democratic staff calculations based on data from the U.S. Census Bureau, American Community Survey, 2014.
Individuals of Hispanic or Latino ethnicity can be of any race. 2 U.S. Census Bureau, 2014 National Population Projections: Summary Tables, Table 11 for projections and American
Community Survey, 2014 Table B03002 for current population. 3 JEC Democratic staff calculations based on data from U.S. Census Bureau, Table P-41. Work Experience—All
Workers by Median Earnings and Sex: 1967 to 2014. 4 Jens Manuel Krogstad and Mark Hugo Lopez, “Hispanic Population reaches record 55 million, but growth has cooled”
Pew Research (June 25, 2015). 5 Ibid. 6 U.S. Census Bureau, 2014 National Population Projections: Summary Tables, Table 11 for projections and American
Community Survey, 2014 Table B03002 for current population; Jens Manuel Krogstad and Mark Hugo Lopez,
“Hispanic Population reaches record 55 million, but growth has cooled” Pew Research (June 25, 2015). Based on
Annual Estimates of the Resident Population by Sex, Race, and Hispanic Origin: April 1, 2010 to July 1, 2014, between
July 1, 2010 and July 1, 2014, the Asian (alone) population increased by 14 percent, while the Hispanic population
increased by 9 percent. 7 U.S. Census Bureau 2014 Population Estimates – Estimates of the Components of Resident Population Changes by
Race and Hispanic Origin for the United States: April 1, 2010 to July 1, 2014 (2015). 8 JEC Democratic staff calculations based on U.S. Census Bureau 2014 Population Estimates – Estimates of the
Components of Resident Population Changes by Race and Hispanic Origin for the United States: April 1, 2010 to July 1,
2014. 9 U.S. Census Bureau, 2014 National Population Projections: Summary Tables, Table 11 for projections; and U.S.
Census Bureau, American Community Survey, 2014 Table B03002 for current population. 10 U.S. Census Bureau, American Community Survey, 2014 Table B03003: Hispanic or Latino Origin (Total
Population).
Sources
Prepared by the Democratic staff of the Joint Economic Committee 10
11 U.S. Census Bureau, American Community Survey, 2014 Table B060041: Place of Birth by Race (Hispanic or
Latino). 12 Bureau of Labor Statistics, “Civilian labor force levels for persons of Hispanic or Latino ethnicity age 16 and older, by
detailed ethnic group, 1990–2013 annual averages” (October 1, 2014). 13 Gustavo Lopez and Eileen Patten, “The Impact of Slowing Immigration: Foreign-Born Share Falls Among 14 Largest
U.S. Hispanic Origin Groups” Pew Hispanic Center (September 15, 2015). 14 U.S Census Bureau, American Community Survey, 2014, Table B01002: Median Age by Sex (Total Population),
B01002I: Median Age by Sex (Hispanic or Latino) and Table B01002H: Median Age by Sex (White Alone, not Hispanic
or Latino). 15 Renee Stepler and Anna Brown, “Statistical Portrait of Hispanics in the United States, 1980-2013” Pew Hispanic
Center (May 12, 2015). 16 JEC Democratic staff calculations based on data from U.S. Census Bureau, American Community Survey, 2014 Table
B01001I: Sex by Age (Hispanic or Latino), Table B01001H: Sex by Age (White Alone, not Hispanic or Latino) and
Table S0101: Age and Sex. 17 U.S. Census Bureau, American Community Survey, 2014 Table S0901: Children Characteristics. 18 JEC Democratic staff calculations based on U.S. Census Bureau, American Community Survey, 2014 Table B01001I:
Sex by Age (Hispanic or Latino), B01001H: Sex by Age (White Alone, not Hispanic or Latino), and Table S0101: Age
and Sex. 19 U.S. Census Bureau, American Community Survey, 2014 Table S0103 (7.6 percent of the population 65 and older are
Hispanic). 20 U.S. Census Bureau, American Community Survey, 2014 Table B05003: Sex by Age by Nativity and Citizenship
Status (Total Population) and Table B05003I: Sex by Age by Nativity and Citizenship Status (Hispanic or Latino). 21 Pew Hispanic Center, “Unauthorized Immigrant Population Trends for States, Birth Countries and Regions”
(December 11, 2014). In addition, Hispanic individuals from the Caribbean or Europe would add to the total Hispanic
unauthorized population residing in the United States. 22 U.S. Census Bureau, American Community Survey, 2014 Table C15002: Sex by Educational Attainment for the
Population 25 Years and Over, Table C15002H: Sex by Educational Attainment for the Population 25 Years and Over
(White Alone, not Hispanic or Latino) and C15002I: Sex by Educational Attainment for the Population 25 Years and
Over (Hispanic or Latino). 23 National Center for Education Statistics, “Fast Facts.” 24 National Center for Education Statistics, Digest of Education Statistics Table 302.20: Percentage of recent high school
completers enrolled in 2- and 4-year colleges, by race/ethnicity: 1960 through 2013. 25 Renee Stepler and Anna Brown, “Statistical Portrait of Hispanics in the United States, 1980-2013” Pew Hispanic
Center (May 12, 2015). 26 As determined by the education level of the family head; William R. Emmons and Bryan J. Noeth, “Why Didn’t
Higher Education Protect Hispanic and Black Wealth?” Federal Reserve Bank of St. Louis (August 2015). 27 Bureau of Labor Statistics, Current Population Survey, 2014 Table 7: Employment status of the civilian
noninstitutional population 25 years and over by education attainment, race, and Hispanic or Latino identity (2015). 28 Bureau of Labor Statistics, Table 5. Occupations with the most job growth, 2012 and projected 2022. 29 Bureau of Labor Statistics, Labor Force Characteristics by Race and Ethnicity, 2013 Table 7: Employed people by
occupation, gender, race, and Hispanic or Latino ethnicity, 2013 annual averages (August 2014). 30 Note that the recent weakness in energy prices has led to a decline in mining related employment over the last year that
has led to a flattening of the trend in Hispanic unemployment. 31 Bureau of Labor Statistics, Current Population Survey, Unemployment Rate – Black, 16 Years & Over (January 2005
through September 2015); Bureau of Labor Statistics, Current Population Survey, Unemployment Rate - White, 16
Years & Over (January 2005 through September 2015). 32 Bureau of Labor Statistics, Current Population Survey, 2014 Table 3: Employment status of the civilian
noninstitutional population by age, sex, and race. 33 Sarah Ayres Steinberg, “The High Cost of Youth Unemployment” Center for American Progress (April 5, 2013). 34 Bureau of Labor Statistics, Current Population Survey 2014, Table 22: Persons at work in nonagricultural industries by
age, sex, race, Hispanic or Latino ethnicity, marital status, and usual full- or part-time status. 35 Bureau of Labor Statistics, Table 3. Median usual weekly earnings of full-time wage and salary workers by age, race,
Hispanic or Latino ethnicity, and sex, 3rd quarter 2015 averages, not seasonally adjusted (October 20, 2015). 36 Carmen DeNavas-Walt and Bernadette D. Proctor, “Income and Poverty in the United States: 2013” U.S. Census
Bureau (September 2014). 37 JEC Democratic staff tabulations based on data from the Current Population Survey Table Creator.
Prepared by the Democratic staff of the Joint Economic Committee 11
38 Renee Stepler and Anna Brown, “Statistical Portrait of Hispanics in the United States, 1980-2013” Pew Hispanic
Center (May 12, 2015). Hispanic share of households updated for 2014. 39 U.S. Census Bureau, Table POV01: Age and Sex of All People, Family Members and Unrelated Individuals Iterated
by Income-to-Poverty Ratio and Race, 2014. 40 Carmen DeNavas-Walt and Bernadette D. Proctor, Income and Poverty in the United States: 2014, U.S. Census
Bureau (September 2015). 41 Feeding America, “Latino Hunger Fact Sheet.” 42 JEC Democratic staff calculations based on data from U.S. Census Bureau, Income and Poverty in the United States:
2013 Detailed Tables, Table HINC-04: Presence of Children Under 18 Years old—Households, by Total Money Income
in 2013, Type of Household, Race and Hispanic Origin of Householder and Table HINC-05: Percent Distribution of
Households, by Selected Characteristics Within Income Quintile and Top 5 Percent in 2013. 43 Sarah Fass, Kinsey Alden Dinan and Yumiko Aratani, Child Poverty and Intergenerational Mobility, National Center
for Children in Poverty (December 2009). 44 JEC Democratic staff calculations based on data from the Current Population Survey. 45 Bureau of Labor Statistics, Women in the Labor Force: A Databook (December 2014). 46 Milia Fisher, “Women of Color and the Gender Wage Gap” Center for American Progress (April 14, 2015). 47 JEC Democratic staff calculations based on data from U.S. Census Bureau, Table P-41. Work Experience—All
Workers by Median Earnings and Sex: 1967 to 2014. 48 Milia Fisher, “Women of Color and the Gender Wage Gap” Center for American Progress (April 14, 2015). 49 Ibid. 50 JEC Democratic staff calculations based on data from U.S. Census Bureau, American Community Survey, 2014 Table
B15002H: Sex by Educational Attainment For the Population 25 Years and Over (White Alone, Not Hispanic or Latino)
and Table B15002I: Sex by Educational Attainment For the Population 25 Years and Over (Hispanic or Latino). 51 Milia Fisher, “Women of Color and the Gender Wage Gap” Center for American Progress (April 14, 2015). 52 Ibid. 53 National Women’s Law Center, “Fair Pay for Women Requires a Fair Minimum Wage” (May 13, 2015). 54 Council of Economic Advisers, The Economics of Paid and Unpaid Leave (June 2014); Council of Economic
Advisers, Work-Life Balance and the Economics of Workplace Flexibility (June 2014). 55 U.S. Census Bureau, Table FM-2. All Parent/Child Situations, by Type, Race, and Hispanic Origin of Householder or
Reference Person: 1970 to Present. 56 U.S. Census Bureau, Table POV04: Families by Age of Householder, Number of Children and Family Structure,
2014, for families with children under the age of 18. 57 Matt Weeks, “Asians, Hispanics driving U.S. economy forward, according to UGA study” UGA Today (September 24,
2015). 58 U.S. Hispanic Chamber of Commerce, “History of the USHCC”. 59 Robert W. Fairlie, Arnobio Morelix, E.J. Reedy and Joshua Russel, The Kauffman Index of Startup Activity, National
Trends (2015). 60 Stephen Slivinski, Bootstraps Tangled in Red Tape, Goldwater Institute (February 23, 2015). 61 Better Business: How Hispanic Entrepreneurs Are Beating Expectations and Bolstering the U.S. Economy, Partnership
for a New American Economy (April 1, 2014). 62 Sophia Kerby, “The State of Women of Color in the United States” Center for American Progress (July 17, 2012). 63 Stephen Slivinski, Bootstraps Tangled in Red Tape, Goldwater Institute (February 23, 2015). 64 Ibid. 65 Rakesh Kochhar and Richard Fry, “Wealth Inequality has Widened Along Racial, Ethnic Lines Since End of Great
Recession” Pew Research (December 12, 2014). 66 Ibid. 67 JEC Democratic staff calculations based on data from U.S. Census Bureau, Tables on Wealth and Asset Ownership,
Table 2: Percent Holding Assets for Households, by Type of Asset Owned and Selected Characteristics: 2011 and Table
5: Mean Value of Assets for Households by Type of Asset Owned and Selected Characteristics: 2011. 68 U.S. Census Bureau, Residential Vacancies and Homeownership in the Second Quarter 2015 (July 28, 2015). 69 Chris Mayer and Karen Pence, “Subprime Mortgages: What, Where, and to Whom?” Federal Reserve Board Finance
and Economics Discussion Series (2008). 70 Ibid. 71 Patrick Bayer, Fernando Ferreira and Stephen L. Ross, The Vulnerability of Minority Homeowners in the Housing
Boom and Bust, National Bureau of Economic Research (May 2013). 72 Nari Rhee, PhD, Race and Retirement Insecurity in the United States, National Institute on Retirement Security
(December 2013).
Prepared by the Democratic staff of the Joint Economic Committee
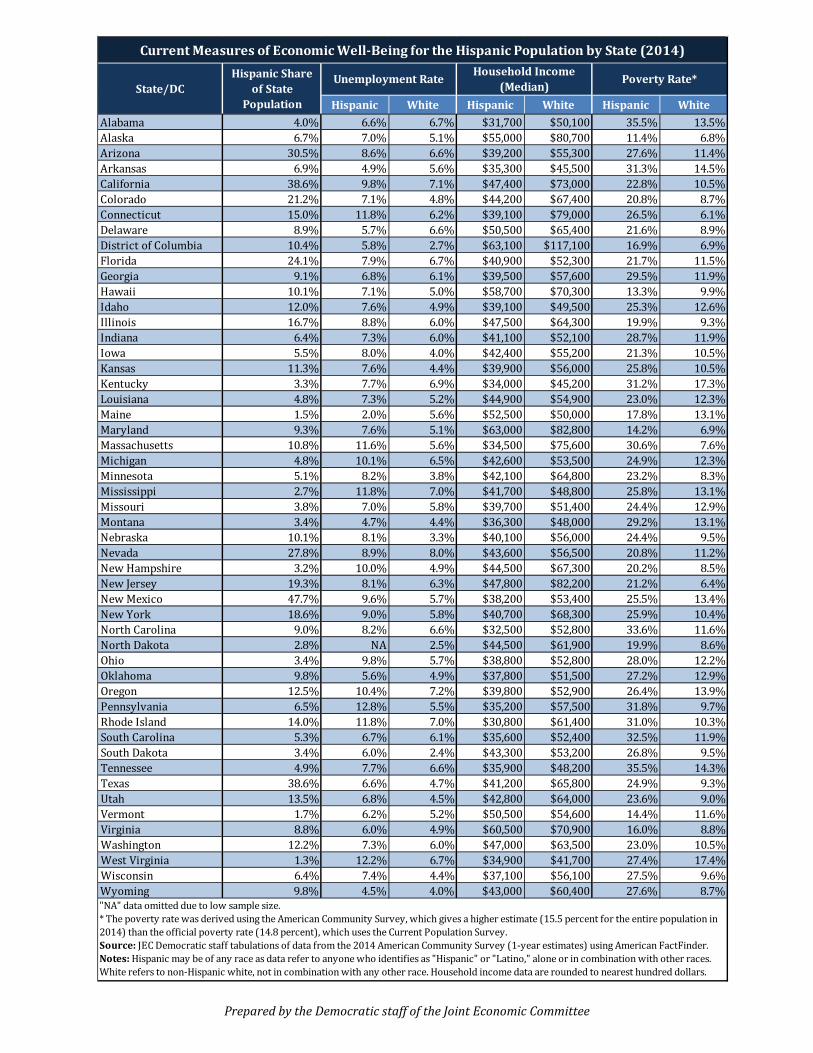
Hispanic White Hispanic White Hispanic WhiteAlabama 4.0% 6.6% 6.7% $31,700 $50,100 35.5% 13.5%Alaska 6.7% 7.0% 5.1% $55,000 $80,700 11.4% 6.8%Arizona 30.5% 8.6% 6.6% $39,200 $55,300 27.6% 11.4%Arkansas 6.9% 4.9% 5.6% $35,300 $45,500 31.3% 14.5%California 38.6% 9.8% 7.1% $47,400 $73,000 22.8% 10.5%Colorado 21.2% 7.1% 4.8% $44,200 $67,400 20.8% 8.7%Connecticut 15.0% 11.8% 6.2% $39,100 $79,000 26.5% 6.1%Delaware 8.9% 5.7% 6.6% $50,500 $65,400 21.6% 8.9%District of Columbia 10.4% 5.8% 2.7% $63,100 $117,100 16.9% 6.9%Florida 24.1% 7.9% 6.7% $40,900 $52,300 21.7% 11.5%Georgia 9.1% 6.8% 6.1% $39,500 $57,600 29.5% 11.9%Hawaii 10.1% 7.1% 5.0% $58,700 $70,300 13.3% 9.9%Idaho 12.0% 7.6% 4.9% $39,100 $49,500 25.3% 12.6%Illinois 16.7% 8.8% 6.0% $47,500 $64,300 19.9% 9.3%Indiana 6.4% 7.3% 6.0% $41,100 $52,100 28.7% 11.9%Iowa 5.5% 8.0% 4.0% $42,400 $55,200 21.3% 10.5%Kansas 11.3% 7.6% 4.4% $39,900 $56,000 25.8% 10.5%Kentucky 3.3% 7.7% 6.9% $34,000 $45,200 31.2% 17.3%Louisiana 4.8% 7.3% 5.2% $44,900 $54,900 23.0% 12.3%Maine 1.5% 2.0% 5.6% $52,500 $50,000 17.8% 13.1%Maryland 9.3% 7.6% 5.1% $63,000 $82,800 14.2% 6.9%Massachusetts 10.8% 11.6% 5.6% $34,500 $75,600 30.6% 7.6%Michigan 4.8% 10.1% 6.5% $42,600 $53,500 24.9% 12.3%Minnesota 5.1% 8.2% 3.8% $42,100 $64,800 23.2% 8.3%Mississippi 2.7% 11.8% 7.0% $41,700 $48,800 25.8% 13.1%Missouri 3.8% 7.0% 5.8% $39,700 $51,400 24.4% 12.9%Montana 3.4% 4.7% 4.4% $36,300 $48,000 29.2% 13.1%Nebraska 10.1% 8.1% 3.3% $40,100 $56,000 24.4% 9.5%Nevada 27.8% 8.9% 8.0% $43,600 $56,500 20.8% 11.2%New Hampshire 3.2% 10.0% 4.9% $44,500 $67,300 20.2% 8.5%New Jersey 19.3% 8.1% 6.3% $47,800 $82,200 21.2% 6.4%New Mexico 47.7% 9.6% 5.7% $38,200 $53,400 25.5% 13.4%New York 18.6% 9.0% 5.8% $40,700 $68,300 25.9% 10.4%North Carolina 9.0% 8.2% 6.6% $32,500 $52,800 33.6% 11.6%North Dakota 2.8% NA 2.5% $44,500 $61,900 19.9% 8.6%Ohio 3.4% 9.8% 5.7% $38,800 $52,800 28.0% 12.2%Oklahoma 9.8% 5.6% 4.9% $37,800 $51,500 27.2% 12.9%Oregon 12.5% 10.4% 7.2% $39,800 $52,900 26.4% 13.9%Pennsylvania 6.5% 12.8% 5.5% $35,200 $57,500 31.8% 9.7%Rhode Island 14.0% 11.8% 7.0% $30,800 $61,400 31.0% 10.3%South Carolina 5.3% 6.7% 6.1% $35,600 $52,400 32.5% 11.9%South Dakota 3.4% 6.0% 2.4% $43,300 $53,200 26.8% 9.5%Tennessee 4.9% 7.7% 6.6% $35,900 $48,200 35.5% 14.3%Texas 38.6% 6.6% 4.7% $41,200 $65,800 24.9% 9.3%Utah 13.5% 6.8% 4.5% $42,800 $64,000 23.6% 9.0%Vermont 1.7% 6.2% 5.2% $50,500 $54,600 14.4% 11.6%Virginia 8.8% 6.0% 4.9% $60,500 $70,900 16.0% 8.8%Washington 12.2% 7.3% 6.0% $47,000 $63,500 23.0% 10.5%West Virginia 1.3% 12.2% 6.7% $34,900 $41,700 27.4% 17.4%Wisconsin 6.4% 7.4% 4.4% $37,100 $56,100 27.5% 9.6%Wyoming 9.8% 4.5% 4.0% $43,000 $60,400 27.6% 8.7%
Household Income (Median) Poverty Rate*
Current Measures of Economic Well-Being for the Hispanic Population by State (2014)
"NA" data omitted due to low sample size.* The poverty rate was derived using the American Community Survey, which gives a higher estimate (15.5 percent for the entire population in 2014) than the official poverty rate (14.8 percent), which uses the Current Population Survey.Source: JEC Democratic staff tabulations of data from the 2014 American Community Survey (1-year estimates) using American FactFinder. Notes: Hispanic may be of any race as data refer to anyone who identifies as "Hispanic" or "Latino," alone or in combination with other races. White refers to non-Hispanic white, not in combination with any other race. Household income data are rounded to nearest hundred dollars.
State/DCUnemployment RateHispanic Share
of State Population