the economic value of on-premise signage · be sensitive to community and customer expectations,...
TRANSCRIPT

1
The Economic Value of On-Premise Signage
Prepared for the Signage Foundation, Inc.
Prepared by the Economics Center, University of Cincinnati
August 2012

ii
Principal InvestigatorJeff Rexhausen
Co-InvestigatorHenry Hildebrandt
Co-InvestigatorChristopher Auffrey, PhD
August 2012

i
University of CincinnatiThe Economic Value of On-Premise Signage
Businesses of all sizes and types use on-premise signs to communicate with their customers. It has been suggested that on-premise signs and the regulations that limit them can significantly impact the performance of some types of businesses, yet there has been limited recent research to inform decisions about sign investment or regulation. To provide more current insight, researchers at the University of Cincinnati conducted a national survey of businesses and a series of case studies. The purpose was to assess how changes in on-premise signage affect business performance. This report provides details about that research’s approach and results. Business owners responding to the national survey reported that additional and improved signs are associated with increases in their revenues and profits. The case studies suggest that signage visibility and conspicuousness are especially important, and that signage plays an important role in a business’ overall branding and marketing strategy.This research indicates that appropriately designed and located on-premise signage can be an important factor for retail business success. The implication of these results is that on-premise signage indirectly influences the vitality of a community and the quality of life of consumers by providing information about the availability of goods and services.
Examination of one field of economic theory – search theory – and application of this concept to the subject of signage presents a new explanation for why on-premise signs have positive economic impacts, not only for businesses, but also for consumers and communities: namely, signs make it easier for shoppers to obtain the information they need to make a purchase.
A national survey asked businesses about sign changes and the impact of those changes on business performance. In addition, detailed questions inquired about the nature of the business and the use of signs. The survey produced some significant findings regarding both economic impacts and sign preferences.
• Sign changes generally had significant, positive impacts on sales, number of transactions and profits. Roughly 60 percent of businesses reported increases averaging about 10 percent.
Executive Summary
i

ii
• Sign changes also led to small positive impacts on employment. Nearly a quarter of respondents reported hiring more people. • While most single establishments and small firms have either wall signs or pole signs, most large companies have both. In general, larger companies tend to have more types of signs. • Helping customers find their location was the most important purpose for respondents. Legibility is the most important characteristic of signs across all sizes of companies. • Business logos and the size and location of the signs were more important for companies with more establishments, for whom branding is presumably more important, compared with single establishment companies.
Among the case studies, positive business performance was generally associated with greater use of on-premise signage and better quality signs, as the following results indicate.
• The national lodging chain case study found that the use of a digital electronic sign to display pricing was associated with increased average occupancy rates. The impact appeared to be especially strong for properties with lower occupancy rates. • The national retail banking business case study found that pylon signs were strongly associated with high visibility, monument signs were moderately associated with high visibility, and wall signs contributed to identity but not visibility. In addition, pylon signs were associated with significantly more teller transactions. • The specialty store small business case study demonstrated the need for signage to reaffirm the value offered by a niche retailer. Sign design must be sensitive to community and customer expectations, and able to reinforce the brand of a small business. The signage should communicate a “promise” of value for a product and/or service that is not commonly found elsewhere. • The car dealership small business case study found that the addition of a video sign board was associated with increases in both service department revenue and customer traffic. An added benefit was the “goodwill” and reputational gain associated with using the video board for community- related public service messages.
Given the economic importance of signs, regulations should balance community design objectives with full knowledge of how sign design and location impact businesses success. Business success is important because of its impact on a community’s tax base, and it ultimately leads to the availability of greater fiscal resources to provide needed community services.
ii

iii
University of CincinnatiThe Economic Value of On-Premise Signage
Executive Summary
I. Introduction . . . . . . . . . . . . . . . . . . . . . . . . . . . . . . . . . . . . . . . . . . . . . . . . . . . . . . . . . . . . . . . . 1
II. Context . . . . . . . . . . . . . . . . . . . . . . . . . . . . . . . . . . . . . . . . . . . . . . . . . . . . . . . . . . . . . . . . . . . . . 5
A. The Problem . . . . . . . . . . . . . . . . . . . . . . . . . . . . . . . . . . . . . . . . . . . . . . . . . . . . . . . . . . . 5
B. Research Challenge . . . . . . . . . . . . . . . . . . . . . . . . . . . . . . . . . . . . . . . . . . . . . . . . . . . . 5
C. Previous Research . . . . . . . . . . . . . . . . . . . . . . . . . . . . . . . . . . . . . . . . . . . . . . . . . . . . . 6
D. Research Approach . . . . . . . . . . . . . . . . . . . . . . . . . . . . . . . . . . . . . . . . . . . . . . . . . . . . 8
III. Economic Theory and On-Premise Signs . . . . . . . . . . . . . . . . . . . . . . . . . . . . . . . . . . . 11
A. Origins of Search Theory . . . . . . . . . . . . . . . . . . . . . . . . . . . . . . . . . . . . . . . . . . . . . 12
B. Relevance of Search Theory to On-Premise Signage . . . . . . . . . . . . . . . . . . 13
IV. National Survey . . . . . . . . . . . . . . . . . . . . . . . . . . . . . . . . . . . . . . . . . . . . . . . . . . . . . . . . . . . . 17
A. Survey Approach . . . . . . . . . . . . . . . . . . . . . . . . . . . . . . . . . . . . . . . . . . . . . . . . . . . . . 17
B. Survey Results . . . . . . . . . . . . . . . . . . . . . . . . . . . . . . . . . . . . . . . . . . . . . . . . . . . . . . . . 17
V. Case Studies . . . . . . . . . . . . . . . . . . . . . . . . . . . . . . . . . . . . . . . . . . . . . . . . . . . . . . . . . . . . . . . 25
A. National Lodging Chain – Value Place . . . . . . . . . . . . . . . . . . . . . . . . . . . . . . . . 25
B. National Retail Banking Business . . . . . . . . . . . . . . . . . . . . . . . . . . . . . . . . . . . . . 27
C. Specialty Store Small Business – Bob Roncker’s Running Spot . . . . . . . 34
D. Car Dealership Small Business – Anderson Ford . . . . . . . . . . . . . . . . . . . . . . 39
VI. Summary of Research Findings . . . . . . . . . . . . . . . . . . . . . . . . . . . . . . . . . . . . . . . . . . . . . 43
VII. Conclusion . . . . . . . . . . . . . . . . . . . . . . . . . . . . . . . . . . . . . . . . . . . . . . . . . . . . . . . . . . . . . . . . . 47
A. Implications for Businesses . . . . . . . . . . . . . . . . . . . . . . . . . . . . . . . . . . . . . . . . . . . 47
B. Implications for Communities . . . . . . . . . . . . . . . . . . . . . . . . . . . . . . . . . . . . . . . . 48
C. Implications for Future Research . . . . . . . . . . . . . . . . . . . . . . . . . . . . . . . . . . . . . . 48
Appendices . . . . . . . . . . . . . . . . . . . . . . . . . . . . . . . . . . . . . . . . . . . . . . . . . . . . . . . . . . . . . . . . . . . . . . . . . 51
1. Survey Instruments . . . . . . . . . . . . . . . . . . . . . . . . . . . . . . . . . . . . . . . . . . . . . . . . . . . 51
2. Retail Banking Technical Appendix . . . . . . . . . . . . . . . . . . . . . . . . . . . . . . . . . . . 57
References . . . . . . . . . . . . . . . . . . . . . . . . . . . . . . . . . . . . . . . . . . . . . . . . . . . . . . . . . . . . . . . . . . . . . . . . . . 61
Acknowledgements . . . . . . . . . . . . . . . . . . . . . . . . . . . . . . . . . . . . . . . . . . . . . . . . . . . . . . . . . . . . . . . . 65
Table of Contents

iv

1
Communication is perhaps the single most important activity for the success of human societies (Richmond & McCroskey, 2009). Signs are among the most important elements of visual communication. The visual communication provided by signs on our streets and highways is essential for an effective transportation system to aid in getting us where we want to go. Similarly, the visual communication provided by on-premise business signage is essential for the efficient function of our system of commerce and the success of many businesses. Effective signage can drive job creation, generate tax revenues, and provide quality access to goods and services.
Communities depend on clear, legible and conspicuous signs for direction, safety and information. Businesses have a long established history of using signs to announce their products and services. On-premise business signs are especially important within the context of our highly mobile society where we frequently venture to unfamiliar areas. On-premise signage allows a business to cost-effectively communicate with potential customers who are moving through its trade area. The wayfinding, identification and marketing information provided by on-premise signage is essential for assisting existing and potential customers in finding the goods and services they seek. This connection between customers and businesses is crucial for business success, and the local governments that depend on the employment and tax revenues which businesses generate.
On-premise signs are a potentially powerful medium for commercial communication. Frequently, on-premise signage is a key element, which is often used with other media, to develop and maintain a business brand. The more consistently that brand is communicated, the greater the likelihood that existing and potential customers will associate it with specific expectations for price, product brand, or service quality at specific locations.
On-premise signs that are designed well and properly located are especially important for generating impulse sales. While some goods and services are primarily purchased on the basis of careful consideration and forethought, many others are impulse purchases. Indeed, impulse sales generate an important part of revenue for a wide variety of retail businesses. One study (Conroy 2004) found 68 percent of purchases during major shopping trips were unplanned, and 54 percent on smaller shopping trips. In these cases, on-premise signage is critical.
University of CincinnatiThe Economic Value of On-Premise Signage
I. Introduction

2
This study provides current analysis of how on-premise signage is linked to business success. A California study from the 1990s indicated that changes to the number and location of on-premise signage can have a direct impact on business performance (Ellis, Johnson & Murphy, 1997). That study – which used statistical analysis of signage, business performance and location-specific data for two business chains – found that an increase in the number of on-premise signs at a particular site had a significant and positive impact on sales, number of customer transactions, and the amount of the average transaction. Case studies also have been used extensively in the small business and signage trade literature to document the impact of signage on the economic performance of businesses. For example, the New York State Small Business Development Center (Conroy 2004) details a number of case studies. One case, based on the experience of a car wash, documents the association of improved sign legibility and visibility with higher sales, as well as suggesting that the introduction of message boards can lead to increased sales. Another case, based on the experience of a small restaurant, documents the association of improved sign visibility and conspicuousness with increased sales. While these case studies do not provide conclusive evidence of the economic value of on-premise signage, they do provide insight to specific causal mechanisms that may be useful for interpreting the statistical analyses of the survey data.
For decades, alancing the signage needs of individual businesses with the broader concerns of communities has been a concern of local officials, the sign industry, and planning and design professionals. Funding for essential local government services such as police, fire, roads, and education often depend on the success of local businesses. This linkage between on-premise signage, business success, and local government revenues (and the public services they fund) highlights the need for sign regulation process to be informed by research such as is being conducted here. Signs regulations can and should promote designs that promote business success while meeting appropriate local standards.
The impact of on-premise signage is dependent on visual elements that may interact with and complement a business’ marketing and branding strategies. Visual characteristics and perceptual concepts related to signs, symbols, semiotics, and the built environment have been addressed in Berger’s Seeing is Believing (2007) and the two groundbreaking treatises by Tufte (Envisioning Information (1990) and Visual Explanations (1997)). An appreciation for the layering of economic and marketing roles together with a visual identity program becomes important for understanding the contribution of on-premise signage within a comprehensive marketing strategy.
The research presented in this report provides an analysis of the economic effects of signage within a context of varied scales and types of business. The objective of the study is to provide an updated assessment of the impact of signage on businesses and communities. Several earlier publications have identified key issues and economic factors associated with on-premise signage, with “The Economic Value of On-Premise Signage”, “The Signage Sourcebook”, and” What’s Your Signage” providing reference and guidance for much of the past two decades. Except for the recent work of Taylor (2010; Taylor, Sarkees & Bang, 2012), the value of signage has lacked recent rigorous analysis.

3
This study uses survey data and case studies to bring the economic impact of on-premise signage into a clearer focus within prescribed theoretical frameworks and a diversity of sign applications. Venturi and Brown in “Learning from Las Vegas” (1971) analyzed the Las Vegas strip, its sign/buildings relationships, and their impact within our urban / suburban environment. Their study systematically assessed the visual impact of signs within a concentrated market area with ever-changing views from the automobile. Venturi was the first to connect on-premise signage to commercial symbols that contained economic value in their meanings beyond the direct communication objective and architectural product. Berger, Tufte, and others have provided additional understanding to advance the symbolic meanings contained in signage and signs. It is within such a broader framework that this research utilizes case studies in combination with economic data to bring the value of on-premise signage into a clear focus. Case studies are used for illustrating the diverse sign typologies and as an analytical interface with communities, brand identity, and the “marketing functions” of signs (Taylor, 2010).

4

5
The success of local retail businesses is important for creating jobs, generating tax revenues, and providing access to goods and services in communities both large and small (Blakely & Leigh, 2010). For most businesses, but especially those that sell retail goods and services, on-premise signs can be an important mechanism for attracting new customers and providing wayfinding for returning customers. This is especially true for businesses such as fast food restaurants, convenience stores, and gas stations for which impulse sales represent a substantial proportion of their total revenue (Conroy, 2004). Consequently, for a variety of economic and quality-of-life reasons, it is critical for the signage industry, businesses, and government agencies to maintain a current and nuanced understanding of how on-premise signs contribute to business performance.
B. Research Challenge
The primary research challenge has been to gather sufficient signage and business performance data to be able to reach conclusions about the effectiveness of on-premise signage. The need to collect both signage and performance data from a wide range of businesses, and draw from businesses’ own experiences became clear from understanding the strengths and limitations of previous studies. A two-stage online survey model was designed and implemented with an initial survey, coupled with an opportunity for approaching self-identifying businesses to participate in follow-up, in-depth case studies.
Despite the relatively large number of survey respondents that we contacted, few businesses were willing to share detailed information about their signage and business performance. Assurances were given that proprietary information would be kept confidential and, where requested, names of businesses would not be used in any study disclosures. Ultimately, after persistent pursuit of leads from a variety of sources, three national/regional businesses agreed to share the necessary signage and performance data.
A. The Problem
II. Context

6
Research assessing the impact of signage on business performance must begin with an understanding of the fundamental purpose of on-premise signage: communicating with potential customers about where the business is located and the nature of its product or service. As such, signs may serve to establish or fortify a consistent business brand or image (Conroy, 2004). For some businesses, multi-media branding strategies may involve static on- and off-premise (billboard) signs, as well as television, radio, newspapers and flyers. Few small businesses can afford or justify such strategies, and rely on their on-premise signs for much of their marketing, particularly if communicating with potential customers is simply about identifying their product or service and location. New technology is expanding the sign choices available to businesses for communicating with potential customers. Electronic messaging and video displays on signs are becoming increasingly common, especially for businesses whose brand or image requires that they are perceived as cutting-edge in the quality of their products or services (Post & Pfaff, 2007).
On-premise signage is one of the most basic and yet complex forms of visual communication. Signage serves as a multi-purpose media that can identify an organization, business or place while at the same time marketing an idea, service, or product. There are a number of factors that should be considered in choosing a design and location for an on-premise sign because of the different communication purposes and audiences. For example, businesses seeking to capture impulse sales along a major highway will need different types of signage to be successful than those located in a pedestrian-oriented business district (Conroy, 2004).
Previous research has established the importance of well-designed and appropriately-placed signage for generating business revenue and associated tax dollars (Ellis et al., 1997). The exhaustive literature review and annotated bibliography by Christadoulou (2009) is the most comprehensive assessment of the recent signage research literature, containing 227 citations. Edelman (2009), in his presentation of Christadoulou’s work, organized the literature into six areas: Business & Marketing, Graphic Design & Architecture, Engineering & Technology, Planning & Urban Design, Law and Psychology. Among these he found extensive overlap that made it difficult for researchers to organize the literature in a meaningful way.
Local governments recognize that sales, property, and income tax revenue are closely linked to the success of their businesses. In part to fortify arguments that signs are important for business success, seminal research was conducted to assess the impact of on-premise signage on the performance of a Southern California fast food restaurant chain and a national specialty import retailer (Ellis et al., 1997). The research used cross-sectional and time-series regression analyses to predict the impact of sign changes on site performance. For the fast food chain, a cross-sectional analysis estimated the effect of sign characteristics and control variables on sales revenue, number of transactions, and average amount per transaction. Among the variables included in the models, various signage improvements were the best predictors for all three outcome variables. For the specialty import retailer, multiple regression and time-series analysis estimated that sign specific changes or addition were associated with significant increases in sales revenues.
C. Previous Research

7
While the Southern California studies focused on fast food and specialty import chains, it has been argued that on-premise signage is likely to be even more important for small non-chain businesses (Conroy, 2004). Many small businesses do not have the relatively large marketing budgets and shared electronic media buys of national franchises. These small businesses are more likely to be dependent on their signage for most of their communication with potential customers.
Because the seminal investigation of the economic impact of signage used data from two chains, additional research is needed to determine if similar results extend to a broader range of retail businesses. Subsequent studies have contributed important and useful research in this area, yet none have estimated the economic value of on-premise signs across diverse business and local government contexts (Conroy, 2004). Consequently, important decisions about signage by businesses and local governments are frequently based on limited or no research because the results of existing studies are not adequately disseminated or are simply inapplicable. Indeed, local governments may impose stringent signage regulations based on vague aesthetic concerns, making it difficult for businesses to be creative and effective with their signage as a means of communicating with potential customers and without appreciating the potential economic and fiscal impacts of the restrictions. When a business depends on potential customers from outside of their community, effective signage becomes especially important. In such cases, signage location, visibility, and design are particularly critical. Equally critical is that local sign regulators recognize the need for creative approaches to signage for both business and community success (Blakely and Leigh, 2010).
The idea of communicating a coordinated visual message is important for business performance. A consistent approach to visual communication supports the branding of place by giving it a consistent identity. Businesses are working to sell their image, and local communities are doing the same but on a much larger scale. The ability of a business to successfully market itself is critical for the local economy. Branding serves to establish a base of customers, whether for a business or a community. When a sign is serving a community to its highest potential, such that it is visually appealing and noticed, it also seems to brand the business or organization that it represents. Eventually this image will be a familiar element for its viewers and they may want to know more about it (Heather, 2003). For both businesses and local governments, effectively designed and located signage is an essential part of a branding strategy (Heather, 2003).

8
D. Research Approach
Given the limitations of the earlier work, there is a clear need for an updated, rigorous study of the economic value of on-premise signage to guide both business and public policy decision-making. The purpose of this research is to address that need.
At the beginning of this project, the research team developed a conceptual framework for identifying possible relationships between on-premise signs and various economic impacts. The left side of this figure illustrates the complexity of on-premise signage. Research must consider more than just the size, number, and placement of signs; other signage and site characteristics can also play significant roles. On the right side, the listing of possible economic impacts suggests that signs may generate economic benefits not only for businesses but also for customers and communities.
While no single research project can examine all of these elements and their interrelationships, this study attempts to move beyond the basic considerations that have characterized most previous research. Toward this end, a multi-faceted approach was selected, which includes applying elements of economic theory, developing and implementing a survey of sign users, and conducting case studies of a diverse set of businesses. It is clear that on-premise signage is identified as a critical element for retail business and service industry providers for success, and it is also seen as indirectly influencing the vitality of the community. Therefore, this analysis takes a broad approach to considering the economic value of on-premise signage. This study is designed to appeal to a wide audience by attempting to use a common vocabulary to facilitate discussion of these findings among design professionals, regulatory professionals, and the sign industry.
Figure 1: Conceptual Framework for Economic Impacts of On-Premise Signs
9
III. Economic Theory and On-Premise Signs
Consideration of how signs benefit customers is an often overlooked, but a highly important dimension of the impact of on-premise signs. The recipients of the 2010 Nobel Prize in Economics were recognized for work in the area of search theory – a field that recognizes that information is not perfectly available, and obtaining it often requires time and other resources. Consequently, buyers often cannot purchase what or as much as they would like, nor can sellers meet these market demands efficiently. This research has implications for the sign industry because the principal purpose of on-premise signs – to provide information to potential buyers – is an area where this theory can be applied effectively.
The most fundamental sign message is typically about a) the existence of willing sellers and b) the types and prices of the items for sale, thus providing the most significant information that customers typically want. To the extent that signs effectively communicate the information sought by prospective customers, they reduce costs for consumers; conversely, when signs fail to communicate this information, they fail to reduce search costs of the consumers, businesses and communities. For businesses, a sign is often the primary way for the consumer to learn that the business even exists (Taylor, 2010). Significant economic research in this field continues today.
Customers’ search costs include the value of the additional time spent searching for goods and services that match their wants. The consumer must make a decision—informed by any available signage—about the shopping potential of the store versus the option of continuing to search for other potential opportunities. For this section, we use this well-developed search theory to explain the process of a consumer evaluating prospective stores. This theory can help researchers better understand the effect of information on consumer behavior, such as the impact of a more visible sign on “downstream” businesses. The theory can also help researchers better understand how quality signage can lead to less total driving, increasing safety and reducing travel costs.

10
This figure provides an overview of the implications of applying search theory to the field of business signage. Just as good signage has a series of three consequences that produce positive economic impacts, impaired signage has a comparable series of three adverse consequences that produce negative economic impacts.
A. Origins of Search Theory
Most students of economics are taught the basic model in which consumers enter a market, a price is determined, and then a subset of these consumers will complete transactions with producers if that price jointly suits them. This outcome depends on a set of assumptions that lead us to a familiar conclusion: that a single price will be established, allowing potential buyers and sellers to choose whether they will take part in a transaction, and leading to determination of how much of the product will be sold. One of these simplifying assumptions – that information is freely available to everyone –does not reflect the realities of imperfect and costly information that business owners and consumers face on a daily basis. In reality, perfect information rarely exists, which often leads to many different prices for the same product.
Economists in the middle of the 20th Century sought to reconcile the theoretical prediction of the basic model with the variation in prices observed all around us. It became clear that adjustments to the basic model would be necessary to gain understanding of a world in which transactions for the same good were being completed at quite different prices, or in which inferior goods were bought and sold for the same price as superior ones.
Figure 2: Impacts and Economic Theory: What Search Theory Tells Us

11
B. Relevance of Search Theory to On-Premise Signage
Toward this goal, search theory, which examines how people make choices with limited information was pursued most famously by economists George Stigler and John McCall. In order to properly study information, its costly1 nature had to be recognized. Search theory was originally applied to labor markets in the 1970s by Dale Mortenson and Christopher Pissarides. In 2010 the Royal Bank of Sweden chose to honor Professors Mortenson and Pissarides with a Nobel Memorial Prize in Economic Sciences2. In recent years, mainstream circles are recognizing the work that had already been scrutinized and affirmed by numerous scholars and graduate students for a generation.
In the work of Mortenson and Pissarides, search theory considers the employment decision of a job-seeker comparing an offer in hand against the “shadow of the future.” The certainty of the offer on the table must be balanced against the prospect of continuing his job search into the future to seek potentially an even greater wage. Continuing the search is risky, and takes time. Because any other offer would begin at a later time, it would have to be at a more lucrative wage to match the value of the offer in hand; and there is always the possibility that future job offers might be at lower wages, not higher.
A well-known finding from search theory is that more uncertainty about the future causes a delay in the searcher’s commitment. In other words, an offer in the present may be less attractive compared to a better offer that might occur if the search should continue. The job-seeker balances that potential upside gain by preparing to decline offers that are seen as unfavorable in comparison to anticipated future options.
Thus, in search theory, the searcher – whether a job seeker or a shopper – compares the value of the known alternative against the potential costs and benefits of continuing to search. It is clear that better information about these options makes it easier for searchers to form expectations about the unknown alternatives and whether or not to continue searching, assisting in producing a better match.In order to connect search theory with signage, suppose that the person is a prospective buyer driving down the street in search of a gift for a friend. She encounters a series of stores that may or may not sell an acceptable item. If business signage is inadequate, learning about a price and other qualities of a potential purchase may involve a costly decision to enter a store, requiring expenditures of both time and travel. It is in this situation that information -- not just about pricing but also about the quality and nature of the goods on sale -- will be useful in sharpening the perception of the future that enables a purchase to take place. In such a situation, higher quality signage reduces these information costs, making buyers and sellers better off.
1 Economists use the term “scarce” to recognize something that is inherently limited in quantity, and therefore deserving of a price; information represents different tiers of cost, with some of it being readily available and easily processed, and some being only one of those or neither.
2 Peter Diamond also shared in the Nobel Memorial Prize in Economics in 2010.

12
Signs provide signals to consumers. A store’s sign may signal price, quality, convenience, and/or reliability. This signaling is illustrated by competing gas stations that post their prices immediately next to each other. Other information on their signs may help them to compete on other factors, all of which assist the purchaser by providing information that reduces consumer uncertainty. This sign information not only helps stores compete with each other but also with internet retailers, who generally have a large advantage over store retailers in providing information to consumers.
Search theory also provides insights about businesses that are trying to complete a transaction with a searcher. In the labor market application of search theory, making a job offer is costly to the employer because he must invest time, first in finding and screening job candidates and then in training a new employee. Because of these costs (and the risk of entrusting key business elements to a new employee whose competence is uncertain), the employer is highly motivated to find effective means in searching for prospective employees. This is comparable to the circumstances in which business owners compete for customers. Although stores and other businesses are searching for customers and clients rather than employees, many forms of advertising -- television, radio, celebrity endorsements -- represent costly signals because advertising space is scarce. Among these, outdoor signage ranks favorably in terms of effectiveness according to surveys of consumers (Kellaris, 2011).
James Kellaris, who holds the Gemini Chair of Signage and Visual Communications in the University of Cincinnati’s Carl H. Lindner College of Business has illustrated how good signs reduce search costs by making information more available to consumers. Utilizing data collected in a 2011 survey of over 100,000 North American shoppers, Kellaris found that:
• Shoppers associate sign quality with store and product quality (34%); and • Shoppers make store choices based on the information communicated by store signs (29%).
Potential customers often lack significant pieces of information. Even when businesses attempt to convey this information through their on-premise signage, characteristics of those signs and the surrounding environment, as well as other impediments, often inhibit the communication of this information. Kellaris also found that nearly half (49.7%) of American consumers have driven by a desired business without finding it because of insufficient signage.
There are significant anecdotal examples where the loss of good signage caused measurable decreases in the value of businesses. When one motel that had a highly visible sign moved to a less conspicuous location, it found that occupancy rates decreased 36 percent, which reduced its $960,000 value by 42 percent (Bass, 2010). Furthermore, the loss of a sign can have consequences that extend to surrounding businesses and the larger community. Real estate appraiser Richard Bass documented the case of a business on the back side of a Florida mall that lost the pylon sign that gave it visibility. The loss of customers eventually led to closing the store. Because surrounding mall businesses relied on the traffic generated by that store, they also closed.

13
Search theory has explained the role of information and how higher costs of obtaining information reduces the welfare of both the consumer and the producer. For job seekers, lower search costs allow them to be more selective, implying greater productivity shared between worker, firm, and (ultimately) the consumer. For consumers, improving information through better signage will decrease the time and resources needed to investigate another vendor. Reducing information costs effectively makes everyone better off.
By facilitating less costly sales, better information through signage can positively affect the broader community through economic growth (especially through increased employment and wages) and a stronger base for sales, income and property taxes. While others may focus on the intangible impacts on communities of quality signage, such as their contributions to a sense of place and identity, as well as building social capital and community pride, we emphasize that search theory explains the economic benefit of signage.

14

15
IV. National Survey
To gain a broad perspective about a variety of on-premise signage considerations, a survey was prepared and distributed to all types of businesses in the US that use signs. The survey provided businesses the option of responding either online or by a mailed response. Questions were asked about sign changes and the impact of those changes on business performance. In addition, detailed questions inquired about the nature of the business and the use of signs (number, size, location, type).
Respondents were initially solicited by email, post cards and personal contacts. Also, newspaper and newsletter articles about the survey included information about the survey’s Internet address and asked businesses to complete the survey online. An effort was made to gain responses from a geographically diverse cross section of the different types of large and small businesses that use signs to attract and retain customers. This approach was used in order to collect responses from a wide range of such businesses rather than to produce a random national sample. While the objective of employing this method was to collect data from respondents who have greater awareness of on-premise signage issues, responses did not indicate a response bias toward heavy signage users; in fact, one third of respondents reported no sign changes in recent years. B. Survey Results
A total of 225 businesses responded to the nationwide survey of business sign users. Of these, 213 were usable responses. Of these respondents, 70 percent had a single establishment, while the remaining 30 percent were classified as either small (2-10 establishments) or large companies (more than 10 establishments). Single establishment businesses are more common among retail trade respondents (84%), and comprise about half of respondents in the accommodation and food service industry (52%).
A. Survey Approach
16
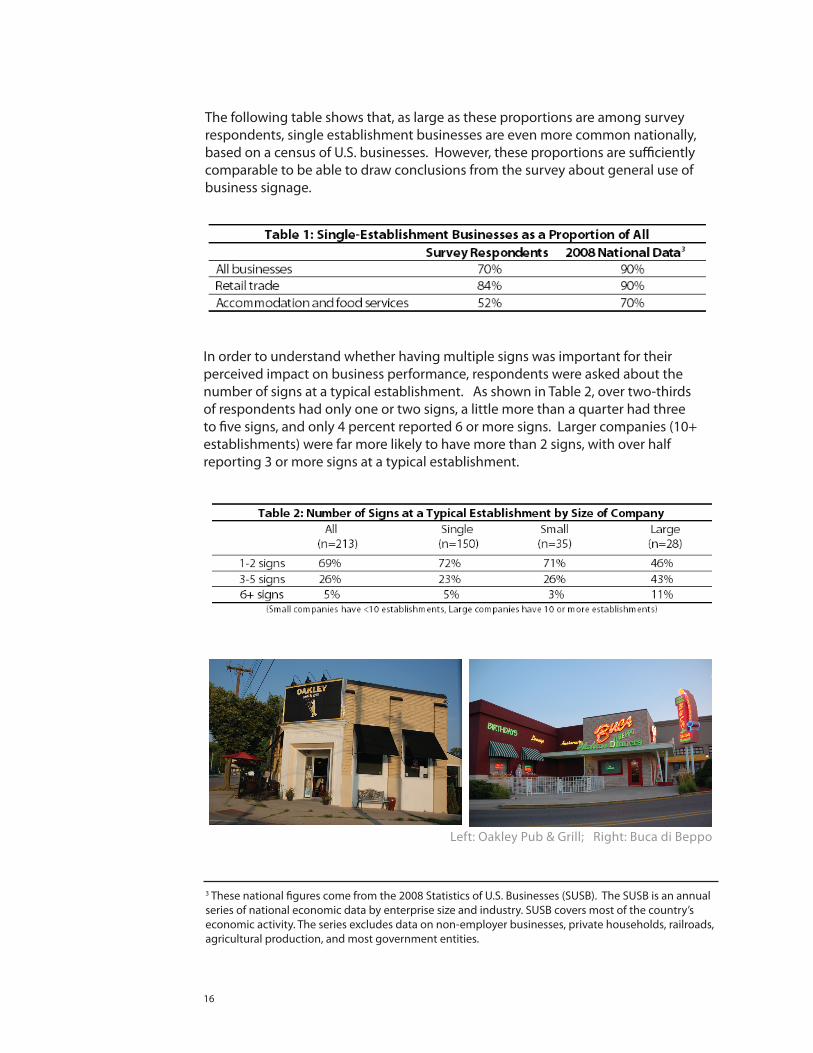
In order to understand whether having multiple signs was important for their perceived impact on business performance, respondents were asked about the number of signs at a typical establishment. As shown in Table 2, over two-thirds of respondents had only one or two signs, a little more than a quarter had three to five signs, and only 4 percent reported 6 or more signs. Larger companies (10+ establishments) were far more likely to have more than 2 signs, with over half reporting 3 or more signs at a typical establishment.
3 These national figures come from the 2008 Statistics of U.S. Businesses (SUSB). The SUSB is an annual series of national economic data by enterprise size and industry. SUSB covers most of the country’s economic activity. The series excludes data on non-employer businesses, private households, railroads, agricultural production, and most government entities.
Left: Oakley Pub & Grill; Right: Buca di Beppo
The following table shows that, as large as these proportions are among survey respondents, single establishment businesses are even more common nationally, based on a census of U.S. businesses. However, these proportions are sufficiently comparable to be able to draw conclusions from the survey about general use of business signage.
17
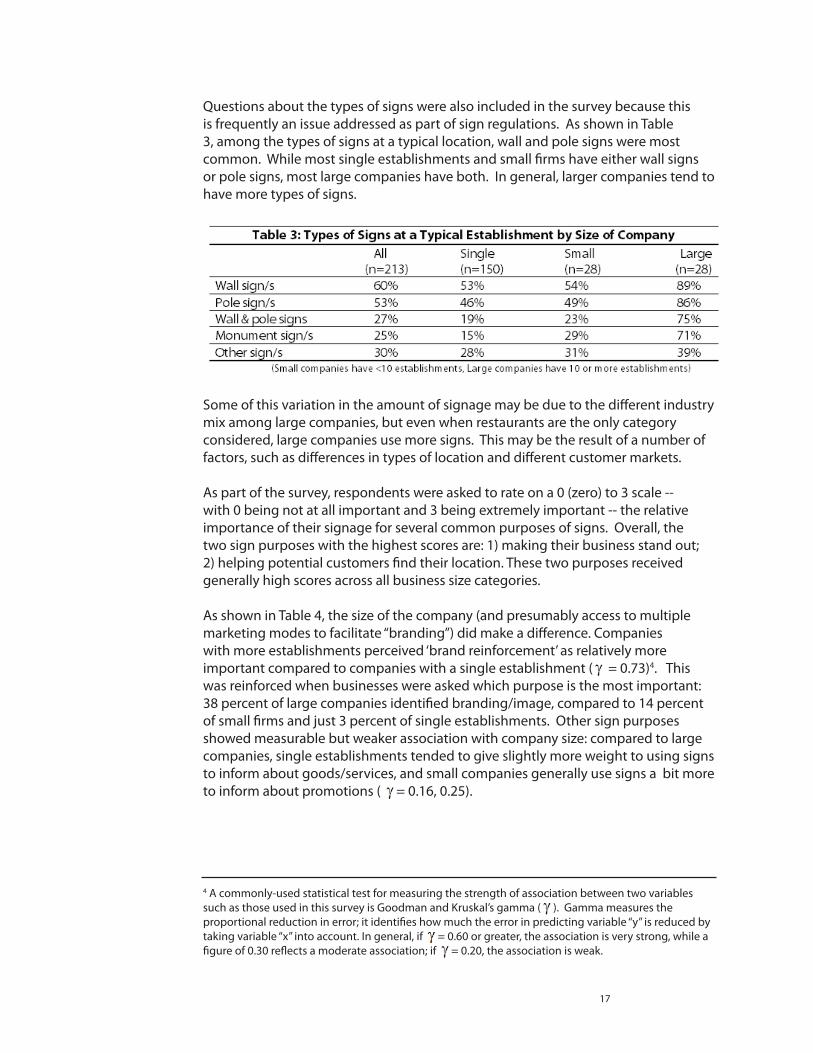
Questions about the types of signs were also included in the survey because this is frequently an issue addressed as part of sign regulations. As shown in Table 3, among the types of signs at a typical location, wall and pole signs were most common. While most single establishments and small firms have either wall signs or pole signs, most large companies have both. In general, larger companies tend to have more types of signs.
Some of this variation in the amount of signage may be due to the different industry mix among large companies, but even when restaurants are the only category considered, large companies use more signs. This may be the result of a number of factors, such as differences in types of location and different customer markets.
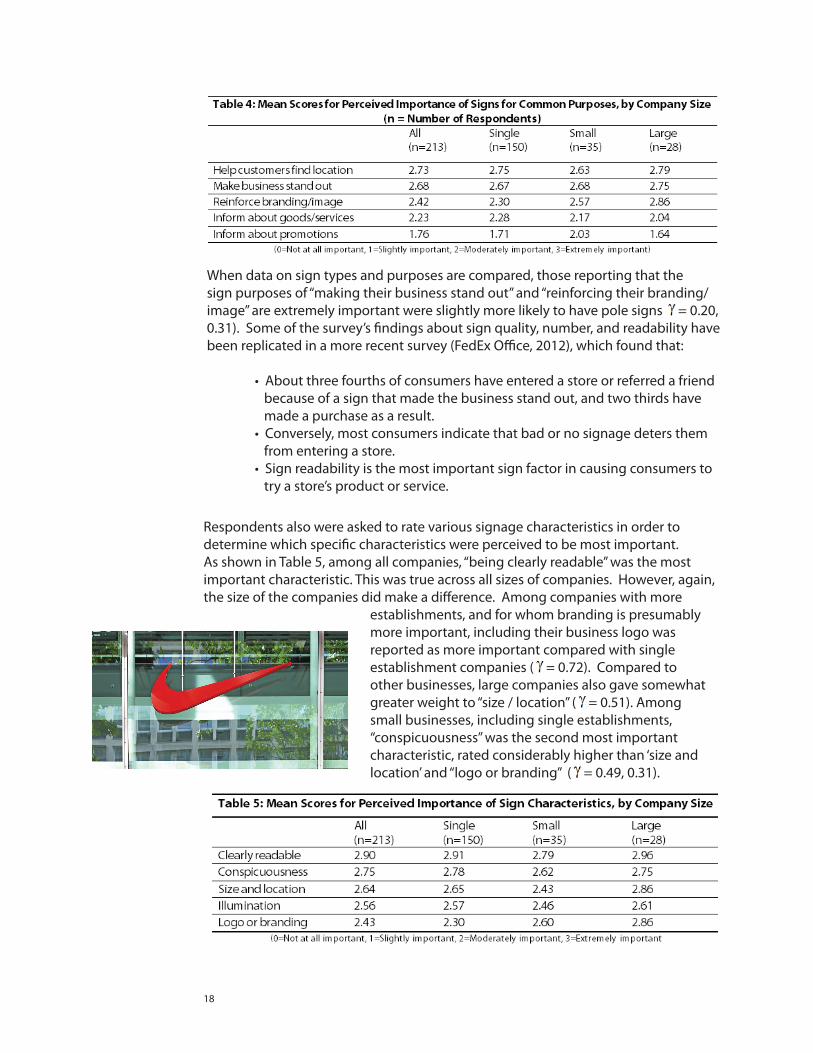
As part of the survey, respondents were asked to rate on a 0 (zero) to 3 scale -- with 0 being not at all important and 3 being extremely important -- the relative importance of their signage for several common purposes of signs. Overall, the two sign purposes with the highest scores are: 1) making their business stand out; 2) helping potential customers find their location. These two purposes received generally high scores across all business size categories.
As shown in Table 4, the size of the company (and presumably access to multiple marketing modes to facilitate “branding”) did make a difference. Companies with more establishments perceived ‘brand reinforcement’ as relatively more important compared to companies with a single establishment ( = 0.73)4. This was reinforced when businesses were asked which purpose is the most important: 38 percent of large companies identified branding/image, compared to 14 percent of small firms and just 3 percent of single establishments. Other sign purposes showed measurable but weaker association with company size: compared to large companies, single establishments tended to give slightly more weight to using signs to inform about goods/services, and small companies generally use signs a bit more to inform about promotions ( = 0.16, 0.25).
4 A commonly-used statistical test for measuring the strength of association between two variables such as those used in this survey is Goodman and Kruskal’s gamma ( ). Gamma measures the proportional reduction in error; it identifies how much the error in predicting variable “y” is reduced by taking variable “x” into account. In general, if = 0.60 or greater, the association is very strong, while a figure of 0.30 reflects a moderate association; if = 0.20, the association is weak.
18
When data on sign types and purposes are compared, those reporting that the sign purposes of “making their business stand out” and “reinforcing their branding/image” are extremely important were slightly more likely to have pole signs = 0.20, 0.31). Some of the survey’s findings about sign quality, number, and readability have been replicated in a more recent survey (FedEx Office, 2012), which found that:
• About three fourths of consumers have entered a store or referred a friend because of a sign that made the business stand out, and two thirds have made a purchase as a result. • Conversely, most consumers indicate that bad or no signage deters them from entering a store. • Sign readability is the most important sign factor in causing consumers to try a store’s product or service.
Respondents also were asked to rate various signage characteristics in order to determine which specific characteristics were perceived to be most important. As shown in Table 5, among all companies, “being clearly readable” was the most important characteristic. This was true across all sizes of companies. However, again, the size of the companies did make a difference. Among companies with more
establishments, and for whom branding is presumably more important, including their business logo was reported as more important compared with single establishment companies ( = 0.72). Compared to other businesses, large companies also gave somewhat greater weight to “size / location” ( = 0.51). Among small businesses, including single establishments, “conspicuousness” was the second most important characteristic, rated considerably higher than ‘size and location’ and “logo or branding” ( = 0.49, 0.31).

19
Two of these sign elements were associated with signage types. Those businesses reporting that the sign elements of being ‘clearly readable’ and ‘size/location’ are “extremely important” were somewhat more likely to have pole signs ( = 0.48, 0.44).
In order to assess how actual changes in signage might be related to the perception of the importance of signs, businesses were asked if they had made improvements in their signage over the past five years and their perceptions of the impact the sign changes had on four measures of business performance: (1) sales, (2) number of transactions, (3) profits and (4) staffing. About two thirds (66%) of all respondents reported one or more types of changes. Among the changes, as shown in Table 6, seven in ten of these companies reported making changes in their sign design. More than half (52%) improved sign visibility, while nearly half (47%) increased the number of signs, and three in ten made the signs larger. Because almost all changes consisted of more than one of these types of change, it was not possible to determine whether one change produces greater impacts than another.
Most of the companies reporting sign changes indicated that these sign changes had large, positive impacts across three of the four measures of business performance, with smaller but still positive impacts on the fourth measure. As shown in Table 7, between 59 percent and 65 percent of the companies making sign changes reported increases in profts, transactions and sales, with average increases of 9, 11, and 12 percent, respectively. These findings about the impact of enhancing on-premise signage are consistent with findings recently reported by Dr. Charles R. Taylor, John A. Murphy Professor of Marketing, and his colleagues at Villanova University (Taylor, Sarkees & Bang, 2012).
Increases in staffing were reported by a smaller proportion of the companies (23%), with an average increase of 6 percent. Employment growth may have been tempered by the national economic downturn rather than representing a different type of relationship with signage changes compared to sales, transactions and profits.

20
Additional analysis of the relationship between business performance and various signage factors revealed a number of sign characteristics that correlated with positive economic impacts.
• Businesses emphasizing ‘conspicuousness’ as a sign element were somewhat more likely to report larger increases in store sales ( = 0.45), and those giving a high priority to size/location were slightly more likely to report larger increases in store sales ( = 0.28). • Businesses with pole signs were somewhat more likely to report larger sales gains ( = 0.42). • Those that experienced gains in sales, customers, and profits were much more likely to attribute those gains at least partially to their sign changes ( = 0.80, 0.74, 0.75).
Some survey respondents included contact information with their surveys for additional follow-up. Researchers were able to reach roughly one third of those who provided this information (13 of 38), and they provided additional responses to questions during a brief interview. Most of these businesses surveyed were single establishments in free-standing structures or storefronts in a main business district . They were located on a site either having 45-50 mph speed limits and far from curb, or 25-30 mph and within 20ft of curb. Most interviewees indicated that 60 percent or more of their revenues were obtained from regular/repeat customers.
Most of these interviewed businesses added electronic message signs, and they indicated that their new signs had positive business impacts, but the results are skewed by what they characterized as poor general economic conditions. All affirmed that they had experienced an increase in business since they added new signs, but most were not very significant. Three or four contacts reported vast improvements (increases of over 40%) compared to business revenue prior to new signs. When questioned about use of their new signs, these businesses generally indicated that they had become more involved with sign “activities.” They referenced very active updating information (a couple times a week), constant design change, and posting community “reputation boosting” information. Illumination at night was mentioned by customers as a great attention-getting advertisement while closed. When asked what they would do differently or what they would do for their next sign update, many said they wanted more electronic messaging capabilities, having already witnessed the impact on business performance. Some wished for a video board, feeling this would dramatically boost business, but couldn’t be justified with current revenues and budget. These types of dialogues can serve as yet another foundation for future research.

21
This survey has generated numerous insights into how on-premise signage affects the business performance of retailers, hotels and eating places in order to inform important decisions about private signage investments as well as public discussions about signage restrictions. This research would have been much easier, and perhaps already completed, if the required data was available as part of public secondary datasets. Unfortunately, this is not the case, and this research has been required to rely on the cooperation of businesses to share proprietary data. Businesses agree to share data, usually on the condition that the results are shared with them, because they appreciate the need for this research for their own benefit as well as that of the communities where they operate.
Given that this survey captured self-reported information about individual businesses, questions may arise about its objectivity and validity. Fortunately, a body of marketing research has established that the self-reports of business owners about the factors that influence the performance of their business are highly correlated with those factors that could be identified using independent, objective data (see Robinson & Pearce, 1988; Venkatraman & Ramanuiam, 1986). Consequently, the results here can be reasonably considered to reflect the role of on-premise signage for a broad range of retail businesses.

22

23
Four case studies, drawn from a wide range of business sizes and types, offer detailed insights about the economic impacts that on-premise signage can have. Among the case studies, positive business performance was generally associated with greater use of on-premise signage and better quality signs.
A. National Lodging Chain – Value Place
Value Place is the largest economy extended-stay franchise in the country. Founded in 2002, it opened its 100th location in 2008, and its 175th in 2010. All properties have about 120 suites and are newly constructed.
According to the company’s website, its properties combine hotel convenience and apartment essentials. Its business model is designed to appeal particularly to small and mid-sized business owners and families who are relocating to a new community.
The company has specific signage standards. The primary sign requirements consist of a wall sign with the company’s logo on at least one side of the building, and a pole sign that displays its logo and pricing information.
The company also has several location criteria for its properties. The primary criteria are: interstate visibility, or at least a location along a primary arterial; a middle- to moderate-income area; and strong population density within a five-mile radius. These characteristics made it a useful case study.
V. Case Studies

24
Value Place Sign Configurations: Benefit of an Electronic Sign
Value Place has developed a number of pole sign configurations to help it communicate its message to potential customers. Its preferred arrangement utilizes an LED-lit changeable electronic sign. Changeable electronic signs are preferred because they can more effectively communicate multiple messages and because they are considered to be better at attracting attention.In those locations where sign regulations prevent the use of such signs, Value Place uses signs with large plastic numerals, similar to those that gasoline stations post to advertise their prices. Approximately 73 percent of all properties have changeable electronic signs, while 26 percent use signs with plastic numerals, and the remaining one percent lack any pricing signage.
How does the type of signage affect the performance of various properties? For those with changeable electronic signs, 2010 occupancy averaged 11.2 percentage points above breakeven, while those with plastic signs averaged 9.5
points above this threshold. However, further analysis of this data shows that the advantage attributable to changeable electronic signs is predominately realized by properties in the bottom performance quartile. To perform this analysis, properties were first divided according to the type of sign they use to advertise their pricing. Next, each of these two groups was divided into four quartiles, based on their occupancy rates, and each group was compared with the other on a quartile-by-quartile basis.
As shown in the figure 3, in each quartile, electronic sign properties had a higher average occupancy rate than properties with plastic signs, but the difference was small, except in
the lowest-performing quartile (Q4). This graph omits the scale for occupancy rate figure to protect the confidentiality of performance data provided by the company.
Specifically, the performance gain from the use of electronic signs was in the range of one to two percent in the top three quartiles, but it jumps up to a ten percent advantage in the lowest quartile, as shown in figure 4. This suggests that those locations that are already performing well and have plastic signs are likely to experience limited benefit from the installation of an electronic sign. On the
Figure 3: Impact of Sign Type
Figure 4: Performance Gain from Electronic Sign
25
other hand, such a sign change is likely to produce a substantial boost to the occupancy rates of properties that are currently struggling. This finding about economic benefits is consistent with other research on changeable electronic signs (van Bulck, 2011).
Signage with Price Information: Story of One Property
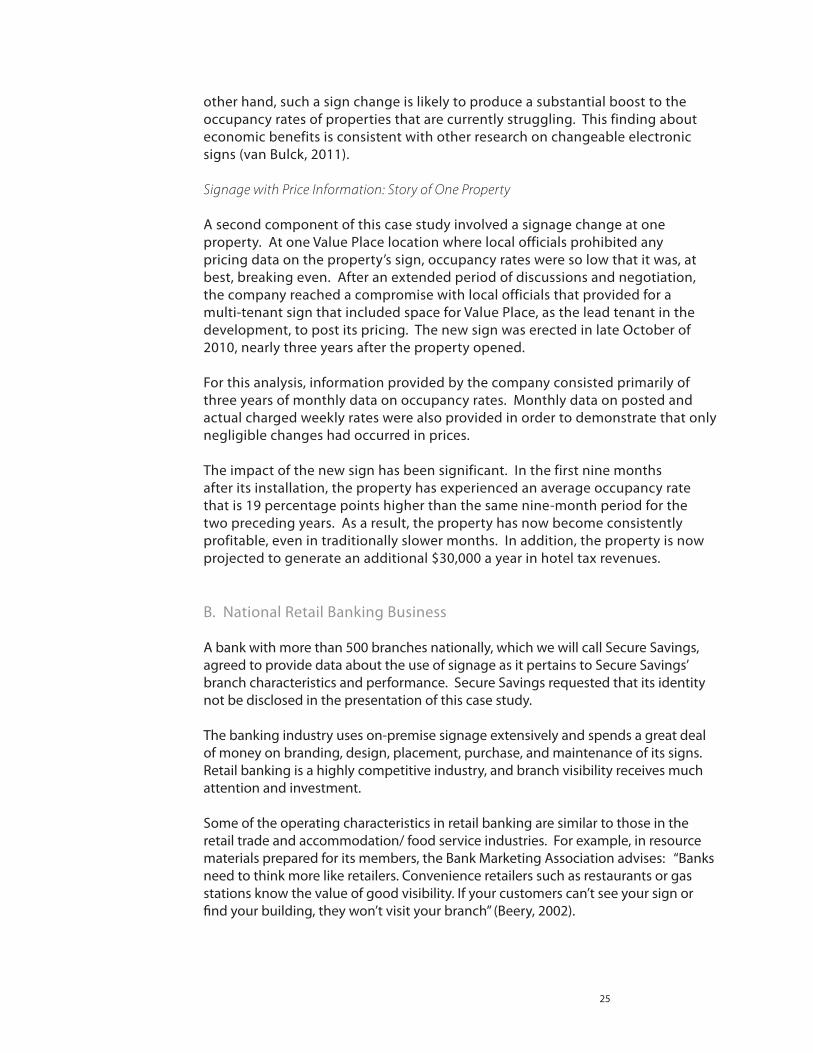
A second component of this case study involved a signage change at one property. At one Value Place location where local officials prohibited any pricing data on the property’s sign, occupancy rates were so low that it was, at best, breaking even. After an extended period of discussions and negotiation, the company reached a compromise with local officials that provided for a multi-tenant sign that included space for Value Place, as the lead tenant in the development, to post its pricing. The new sign was erected in late October of 2010, nearly three years after the property opened.
For this analysis, information provided by the company consisted primarily of three years of monthly data on occupancy rates. Monthly data on posted and actual charged weekly rates were also provided in order to demonstrate that only negligible changes had occurred in prices.
The impact of the new sign has been significant. In the first nine months after its installation, the property has experienced an average occupancy rate that is 19 percentage points higher than the same nine-month period for the two preceding years. As a result, the property has now become consistently profitable, even in traditionally slower months. In addition, the property is now projected to generate an additional $30,000 a year in hotel tax revenues.
B. National Retail Banking Business
A bank with more than 500 branches nationally, which we will call Secure Savings, agreed to provide data about the use of signage as it pertains to Secure Savings’ branch characteristics and performance. Secure Savings requested that its identity not be disclosed in the presentation of this case study.
The banking industry uses on-premise signage extensively and spends a great deal of money on branding, design, placement, purchase, and maintenance of its signs. Retail banking is a highly competitive industry, and branch visibility receives much attention and investment.
Some of the operating characteristics in retail banking are similar to those in the retail trade and accommodation/ food service industries. For example, in resource materials prepared for its members, the Bank Marketing Association advises: “Banks need to think more like retailers. Convenience retailers such as restaurants or gas stations know the value of good visibility. If your customers can’t see your sign or find your building, they won’t visit your branch” (Beery, 2002).

26
Signage concerns begin at the site selection stage. Selection criteria for Secure National Bank include visibility and convenience of access, along with population density and size. “We need to be visible so that, when people need us, in their minds, they know where we are,” stated one of the bank’s real estate executives.
Case Study Approach and Data
Secure Savings has extensive data on its branches, which permit a more extensive analysis that explores issues beyond the basic signage considerations that have dominated previous research. As with the previous case study, this analysis focused on 47 locations within a single metropolitan area, which serves to eliminate many non-signage factors that would otherwise be difficult or impossible to control for.
The dataset for this analysis includes details about:• Standard sign factors: number, type, size, height, design;• Unique data on visibility and placement; • Assessments of market factors for each branch location; and• Business performance metrics.
Two types of analysis are described here. The first examines the relationship between the sign packages for individual branches and an independently-conducted evaluation of branch visibility. The second analysis examines the impact of both of these dimensions on branch performance.
Comparing Signage to Banking Center Visibility
Using the data on these individual banking locations, it is possible to examine the relationship between the visibility score assigned to the banks and their on-premise signage characteristics. These scores were part of a broader six-factor assessment of banking center conditions that was performed by an outside consultant. To illustrate how scores were assigned to banking centers on these characteristics, the description of the visibility categories is presented. For more detail on the remaining categories please see the technical appendix.
The other five characteristics on which bank branches received a score from one to five (with 5 being the best score) were: location, accessibility, and parking for the banking center; and land use pattern (land use mix and density, traffic flow) and life cycle (age and economic vitality) of the surrounding area.
27
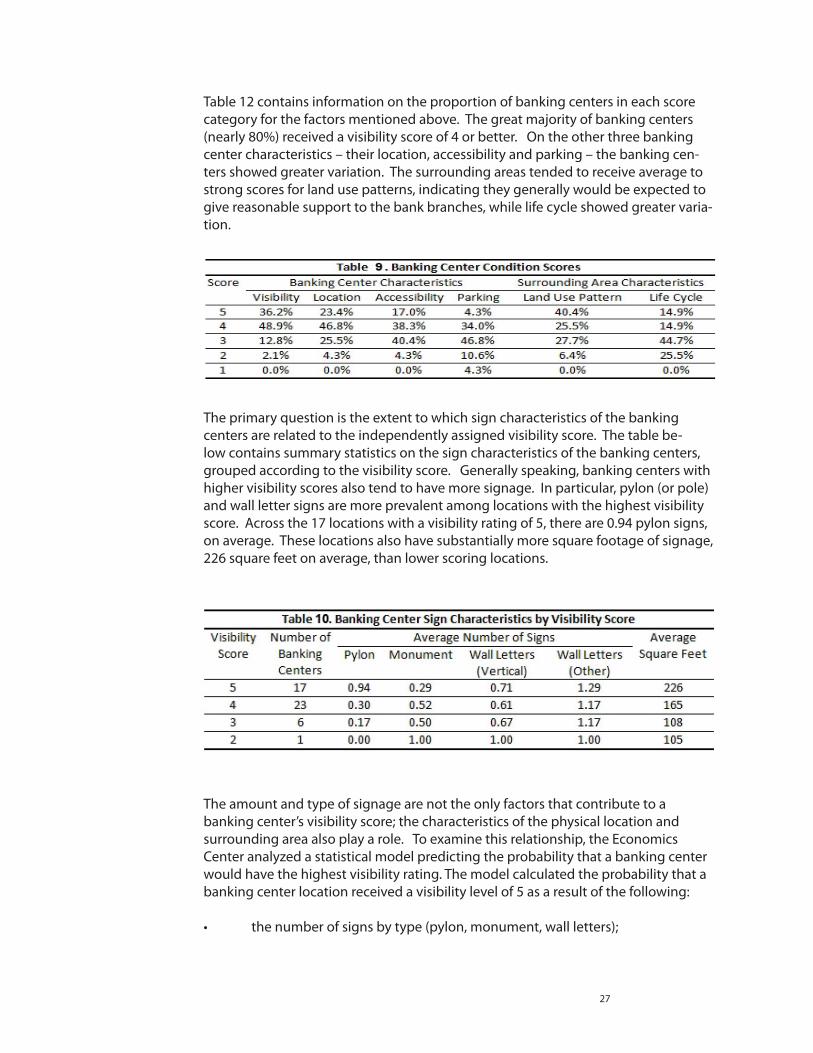
Table 12 contains information on the proportion of banking centers in each score category for the factors mentioned above. The great majority of banking centers (nearly 80%) received a visibility score of 4 or better. On the other three banking center characteristics – their location, accessibility and parking – the banking cen-ters showed greater variation. The surrounding areas tended to receive average to strong scores for land use patterns, indicating they generally would be expected to give reasonable support to the bank branches, while life cycle showed greater varia-tion.
The primary question is the extent to which sign characteristics of the banking centers are related to the independently assigned visibility score. The table be-low contains summary statistics on the sign characteristics of the banking centers, grouped according to the visibility score. Generally speaking, banking centers with higher visibility scores also tend to have more signage. In particular, pylon (or pole) and wall letter signs are more prevalent among locations with the highest visibility score. Across the 17 locations with a visibility rating of 5, there are 0.94 pylon signs, on average. These locations also have substantially more square footage of signage, 226 square feet on average, than lower scoring locations.
The amount and type of signage are not the only factors that contribute to a banking center’s visibility score; the characteristics of the physical location and surrounding area also play a role. To examine this relationship, the Economics Center analyzed a statistical model predicting the probability that a banking center would have the highest visibility rating. The model calculated the probability that a banking center location received a visibility level of 5 as a result of the following:
• the number of signs by type (pylon, monument, wall letters);

28
• the total square footage of signage;
• other banking center characteristic scores (location, accessibility, parking); • surrounding area characteristic scores (land use pattern, life cycle).
The modeling technique allows for estimating the impact that each included variable contributes to the outcome of interest. Thus, by taking into account what is known about the banking centers and the surrounding areas (condition scores), the model permits an assessment of the added value of the included sign characteristics on the visibility score. The table below contains the results.5
5 See the technical appendix for a table containing the full regression results.

29
Factors That Affect Bank Visibility
The statistical analysis indicates that three factors have effects of much greater magnitude than the others. These three –location, pylon signs, and monument signs – are illustrated in the figures 5 and 6.
Having the prime location in the market results in a 43% greater likelihood of receiving the highest visibility score, compared to just a good and visible location.
Figure 5: Illustration of a Storefront with front exterior sign

30
The monument sign increases the probability of a maximum visibility score by 38%; the pylon sign increases the probability by 91%.
As shown above, certain on-premise signage has the greatest impact on bank visibility. The presence of pylon and monument signs increases the probability that a banking center has the highest visibility rating, even after taking into account other characteristics of the banking center and surrounding area. Specifically, each pylon sign is estimated to nearly double the probability (91% increase) of a visibility rating of 5, while a monument sign increases the probability by a little more than one-third (38%). According to one bank executive, “Pylon is the first choice because it can be seen from farther away.” Acknowledging that mature trees occasionally block views of the signs, he observed that a pylon sign stands out more, which helps customers locate and drive to the bank more easily and safely.
Among the factors included in the model, the only other one that appears to have a significantly positive impact on visibility is one of the banking center characteristics – location – which produces a 43 percent increase in the probability of a top visibility score. The total square footage of signage is estimated to have a weak, negative
Figure 6: Illustration of a Storefront with front exterior sign, pole sign, and monument sign

31
relationship to the probability of having the highest visibility rating. Each additional square foot of signage on premise is associated with a decrease of 0.3 percent in the likelihood of the location having the highest visibility rating. This result may occur because banking centers in poorer quality locations are compensating with more signage.
Comparing Signage to Banking Center Performance
The second part of the analysis examines the impact of signage and other condition characteristics on branch performance. The sample consisted of the same 47 banking locations previously analyzed. The outcome of interest was average monthly teller transactions in 2011. This component of the analysis modeled the incremental impacts of on-premise signage and condition characteristics on the number of average monthly teller transactions. The model analyzed teller transactions as a function of:
• the number of signs by type (pylon, monument, wall letters);• other banking center condition scores (location, accessibility, parking); and• surrounding area condition scores (land use characteristics, life cycle).
Table 16 contains the results of the model.6 The results indicate that, when taking into account the other variables, a pylon sign is associated with 1.15 times the average monthly number of teller transactions. The statistical significance of this result is relatively weak, but the magnitude is roughly the difference between a bank having 375 daily teller transactions and 325 transactions. This difference is a considerable impact on monthly transactions, and no other signage characteristics exert a statistically significant impact on the outcome of interest.
Not surprisingly, the rating given to banking center parking is the only other variable that has an impact on teller transactions. As these transactions occur on-site, it is reasonable that banking centers with more available and more easily accessed parking would also tend to have more transactions.
6 See the technical appendix for a table containing the full regression results.

32
C. Specialty Retail Small Business – Bob Roncker’s Running Spot
This case study addresses a small business retail establishment in its expansion from one store to four stores in a major Midwestern city. The study examines a local spe-cialty store chain of four small stores specializing in running and walking shoes, ac-cessories, and apparel. These niche specialty retail stores provide an ideal case study for the effectiveness of signage and branding. The four retail outlets have a single owner. The original store has been in business for 30 years, adding three stores over the past several years. A program to refresh store signage in the context of an ex-panded branding strategy has paralleled the company’s bricks-and- mortar growth.
The first Bob Roncker’s was established in 1981, offering industry-specific advice and high quality running/walking products. This first store was located in an older street-car suburb business strip on a busy commuter artery that leads to both the down-town and a major university within the region. The regional trade area has about 1.2 million residents. Early in 2008, a second store was added in a similar, well-estab-lished commuter suburb near the outer interstate beltway, a substantial distance from the city core..Later in that year, a third store was opened in an historic suburb located alongside a popular bike / running path. A fourth store opened in 2009 near

33
a successful riverfront commercial development. All four stores are devoted to retail sales of quality specialty running / walking lifestyle products.
This small specialty retail store case study offers insight into the role of on-premise signs at several levels: as an element of communication within the context of a spe-cific streetscape; as an element of a comprehensive branding strategy within a niche market; and as reaffirming the stores’ commitment to quality goods and services. This study also demonstrates how a small retailer can use signage to target a specific, narrow market within an upscale residential community with strict sign regulations. The small retailer has fewer options for communicating with its existing and poten-tial customers. This requires that signage and branding strategies be an integrated package that is consistently applied.
Each of the four stores’ building configurations, architectural styles and signage regulations present unique challenges for on-premise signage. Each requires site-specific signage design while maintaining consistency in graphic communication. Graphic composition and sign ‘appropriateness’ need to be balanced while maintain-ing conspicuity and legibility.
Store One: The original store location
This two-story brick structure sits close to a major busy street in a small suburban commercial district outside the urban core of a major river city. The modest face-mounted sign has a distinctive logo and san serif calligraphic style typeface. The clarity of the sign itself is due to the careful composition of elements – logo and graphically-stylized business name. The clean design and signature-styled font let-ters reflect the owner’s desire for straightforward business dealings, personal service, and quality products. The well-designed painted sign is constructed and composed to reflect the commitment to customer satisfaction and product quality rather than conspicuity and over -powering visibility. Modesty and visual restraint set the theme for all of the four store signs, allowing consumers to focus on quality and service of their brand over expediency and budget.
Store One has four on-prem-ise signs: a face-mounted building sign on the second floor façade, a small face-mounted door sign providing store hour information, a very small bayonet mounted sign, and a sandwich curb sign for special events and sale an-nouncements. Because of the 10-foot sidewalk set back dis-tance of the building and the parallel curb parking, the two small face-mounted signs are only readable from directly across the street. It is a direct

34
view perpendicular to the building’s brick façade. This doesn’t allow visual access to the sign from moving traffic in either direction. A moveable sidewalk sandwich sign provides an opportunity to announce specials, but the curb parking and small sidewalk trees obscure any chance for good readability to the fast moving traffic. The bayonet sign is so small (approximately 9” x 20”) and placed under the awning as to obscure the communication value to all but pedestrians within 10 to 20 feet of the store entry. The store has updated its awning and added a distinctive brand graphic logo and descriptive stylized text that is located on the front of the awning’s sloped surface and fascia. The new awning design strategically plays off the color palette of the city’s dominant university to reinforce the store’s local commitment to its customer base. The awning is the best choice for added signage because regulatory codes allow only limited signage development and is restrictive to face-mount signs. The new awing signage has added a distinctive branding presence to the façade and a new communication identity that the building’s other signs are unable to provide. This signage addition also adds a ‘freshness’ to the façade and provides a point of location for the fast moving traffic. Personal interviews with customers noted that the new signage graphics have helped identify the store from the street and have contributed to their interest in visiting.
Store Two: Expansion store 1999
The first addition to the store chain occurred in 1999. Following the precedent of the original store, modest signs are placed more for communication with pedes-trian and slow moving traffic. This attitude and restraint is a response to the context of the small historic commercial district located within a quaint suburban neighbor-hood. A tenuous free-standing sign and a small, stylized, bayonet sign identify the store entry. Because of the building’s setbacks, curb parking, and adjacent buildings, the store window displays and entry are hidden from street traffic. A sandwich sign is also used to announce sales and events. The low-key signage attitude fits with the community’s desire for residential scale and historic references to maintain the up-scale historic subur-ban lifestyle. Signage here is only a re-minder for the entry and is not intended to take on much of a leadership role in expanding the con-sumer base. Other branding means are utilized. Signage is down-played with the bayonet-style sign, adding to the traditional small town atmosphere.

35
Store Three: Expansion store 2009
The established logo and stylized type of the original store helps the on-premise signs take a more prominent role at the third location. Located in a refurbished suburban train station, the signage must reach out to the community to pinpoint the store’s location and attract new customers. The abandoned railroad tracks are now a popular biking and running / walking route that gener-ates many retail opportunities. This location allows and requires the signs to pull away from the building and be
located for vehicular traffic, bicyclists, runners and walkers. A prominent sign gives motorists good viewing from adequate distances, and a temporary sandwich sign adds to the attractiveness of a quaint business. The ambiance of the park-like setting with generous entry distances allows the building’s face sign to be larger and out of balance to the station’s low roof profile and large overhangs. This location tolerates stronger on-premise signage with an increased scale. Conspicuity and readability are balanced within the established sign composition that contains the store brand. Impulse purchases happen often as the bike / running path attracts many consum-ers that require replacement of their specialized running / walking appeal, or are attracted to the new product availability.
Store Four: Expansion store 2009 The last expansion store is located within a revitalized urban setting near the down-town area. A renovated building awning and logo bayonet sign announce the store to pedestrians and vehicular traffic. Located in a popular evening entertainment district, this running store attracts persons that would not be visiting the suburban locations. A large wall sign that faces the active evening retail and entertainment
area also helps attract customers to the store for impulse and special sales buying. The building integration is successful in attracting retail sales in its enter-tainment district location, with the store offering expanded evening shopping hours. The signs are well-organized and the design quality supports the clean, well-manicured building. At this location the signage supports an image and message of quality retail products, and presents a comfortable ‘fit’ with the adjacent

36
businesses. As such, it demonstrates an inviting quality that supports its brand iden-tity. Signage in this location has an opportunity to impact sales. Sales are reported to be increasing, and this store and the original store generate the highest sales per month of the four store chain. It is also important to note that other branding activi-ties are utilized less in this location than in the other stores. It can be inferred that the on-premise signage is a major contributing factor to the store’s solid sale perfor-mance. On–premise signage is the most developed in this location, with the most signs in number and size as compared to the other three locations.
Overall Assessment
At first glance, small specialty businesses such as Bob Roncker’s may not seem to offer much in on-premise signage impact. Closer examination provides a greater understanding of the complex variables in on-premise signage and provides a view of a strategic approach to expansion and signage updating, which could be applied to future research involving the analysis of chain retailers. This case study provides a good illustration of how implementation of a branding plan and retail expansion plan that includes on-premise signage can positively impact business performance. According to the Bob Roncker’s business manager, Verne Johnson: “One of our primary goals, since converting our Glendale shop from a New Balance Concept store in 2008, has been on branding the Bob Roncker’s Running Spot name. It continued to be a key element in our marketing and advertising programs as we added stores in Loveland, later on in 2008, and Newport in 2009.
“Store signage has no doubt helped us in achieving that goal; improving the im-age of the Running Spot brand / identity in the greater Cincinnati marketplace. That, along with our continued focus on customer service and quality solution in footwear, apparel, fitness training programs, and other associated running / walking gear has helped us improve our sales performance at all store locations. This target branding strategy has helped make the Running Spot a successful and profitable business for over 30 years and has allowed the brand to expand into four complete stores.”
These comments are consistent with the results of a recent national consumer sur-vey that indicates that potential buyers take note of business signage, and make de-cisions based on it. Nearly three-quarters of respondents reported that they entered a business because signage caught their attention. Similarly almost 80 percent said that they remembered a business later because of the signs. Seventy-five percent of respondents also referred someone else to a business because of notable signage. (FedEx Office, 2012).
Small businesses like the Running Spot depend upon on-premise signage because of the communication value with potential customers. Better economic performance was reported in stores having the most complete and prominent signage. All stores are on healthy economic footing, with the original store and the store in the urban entertainment district showing the best performance. These two stores have the most complete signage package with fresh, legible signs placed in visible locations. While location and signage differences among the four stores preclude a rigorous statistical analysis of the role of on-premise signage in business performance, there

37
does appear to be a general correlation between superior signage and superior per-formance. This is also consistent with the business managers’ assessment that their signage has resulted in positive performance because it is able to effectively com-municate with large numbers of potential customers. D. Small Business – Chuck Anderson Ford
Chuck Anderson Ford is located in Excelsior Springs MO, which is part of the Kansas City metro area. The business is located within a typical commercial strip on an arte-rial highway.
In March of 2011, owner Mike Anderson added a new pylon video board to the exist-ing dealership signage, which includes a traditional Ford-logo pylon sign and other business signage. This sign was added primarily as part of an effort to increase the dealership’s service business. The new 30-foot pylon sign has a 96-square-foot full-animation, electronic message center. Previously, that portion of the dealership was identified by a 22-square-foot sign that read “Body Shop.”
The new sign was not only larger, but it offered better illumination and design, in ad-dition to its messaging capabilities. The electronic sign draws much more attention to Anderson’s business.
For example, in 2011, Anderson used the new sign to advertise a corporate tire sale, and even though a Goodyear Tire Center is located directly across the street, Ander-son Ford had the fourth-highest tire sales figure among US Ford dealers.

38
Case Study Approach
To assess the economic impact of the new sign, Anderson Ford provided monthly data on service department customers and sales for 2010 and 2011. To smooth out monthly fluctuations, the chart below presents the data as two-month averages. Using a base of 100 for the average monthly customer count during 2010, customer figures during 2011 increased from an index of 90 in January and February (the two months prior to adding the new sign) to 108 in the first two months after the new sign and 119 at the end of 2011, showing an average gain of 4.5 percent every two months.
In figure 7, note that 2011 showed an average year-over-year increase in the number of service customers of 6.5 percent during the ten months after the installation of the new sign.
Mike Anderson indicates that his current service clientele can be identified as 34 percent first-time/new customers and 66 percent regular/repeat customers. This suggests that more customers are learning about his business, and it is reasonable to assume that at least a portion of this new business is coming as a result of the new sign.
A similar analysis was performed on the sales figures, but these numbers were tracked against national auto parts store sales to account for the generally improving national economy. This analysis avoided figures for the winter months (December, January, February) because of the potential for weather-related distortions. Year-over-year figures were compared for the March-to-November periods of 2010 and 2011. This also corresponded well to the introduction of the new sign at Anderson Ford. While US auto parts sales for March-November 2011 were up 5.5 percent over the previous year, Anderson Ford service revenue increased by 10.8 percent in this nine-month period of 2011, compared to 2010. Overall, given the increase in busi-
Figure 7: Service Customers, 2010 v. 2011

39
ness since the sign was installed, Mike has hired three new salespeople, two service technicians and one body-shop person, increasing his employees from 28 to 34, and his business is still growing.
As important as these sales figures are for the dealership, revenue doesn’t tell the whole story. The new sign has directly contributed to other positive impacts – on the reputation/brand and visibility of the business. An estimated 30 percent of the new sign’s message time is focused on community announcements and public ser-vice messages. Examples include:
• Tornado-watch notices,• The community’s annual Oktoberfest, • A cancer walk-a-thon, and• Local student recognitions.
These messages generate attention and positive feedback for the business. Accord-ing to Anderson, “It’s about goodwill and being a member of the community. The sign has had a big impact on how we’re perceived.” When the company first decided to add the new sign, it was seen as an innovative idea that would help to set it apart for its competitors. Now, Anderson says, “The attention I’ve received has endorsed my decision. The sign has helped us to communicate with the customer on a con-tinual basis. We would for sure do it again!”

40

41
VI. Summary of Research Findings
The research shown in this report indicates that appropriately designed and located on-premise signage can be an important factor for retail business success. The implication of these results is that on-premise signage indirectly influences the vitality of a community though the availability of goods and services, jobs and public services. Sign regulations should balance community design objectives with full knowledge of how sign design and location impact businesses success. Business success is important because of its impact on a community’s tax base and ultimately leads to the availability of fiscal resources to provide needed services.
We began by providing an intellectual underpinning that uses economic theory to present a new explanation for why on-premise signs have positive economic impacts, not only for businesses, but also for consumers and communities. This explanation can foster more well-informed discussions between sign vendors and users and between sign users and regulators.
The following summarizes this study’s findings, based on a national business survey and business cases studies assessing the impact of on-premise signage on business performance.
The national business survey found:
• Legibility is the most important characteristic of signs across all sizes of companies;
• Use of business logos, and the size and location of the signs were more important for companies with more establishments, compared with single establishment companies;
• Sign changes generally had significant, positive impacts on sales, number of transactions, and profits;
• Sign changes had smaller positive impacts on employment.
Among the case studies, positive business performance was generally associated

42
with on-premise signage changes as the following indicates:
• The national lodging chain case found that the use of a digital electronic sign to display pricing was associated with higher average occupancy rates. The impact appeared to be especially strong for properties with lower occupancy rates; • The national banking case study found that pylon signs were strongly associated with high visibility; monument signs were moderately associated with high visibility; wall signs contributed to identity but not visibility. In addition, pylon signs were associated with significantly more teller transactions;• The small specialty store case study demonstrated the need for signage to reaffirm the value offered by a niche retailer. Sign design must be sensitive to community and customer expectations, and able to reinforce the limited brand of a small business. The signage should communicate a “promise” of value for a product and/or service that is not commonly found elsewhere;• The car dealership case study found that the addition of a video sign board was associated with large increases in both service department revenue and customer count. An added benefit was the “goodwill” and reputational gains associated with using the video board for community- related public service messages.
While many of these findings are statistically significant, larger sample sizes in surveys and case studies should be sought in future research. It is always appropriate to exercise caution when interpreting case study findings because results do not necessarily transfer from one industry or geographic setting to another. While these case study findings about particular individual businesses are not necessarily generalizable, they are important, particularly because the subject is so complex that a comprehensive analysis covering all business types and signage considerations is unlikely to be undertaken. Furthermore, the similarity of some case study findings with survey results suggests that this study deserves careful consideration by researchers, practitioners, and local officials.

43
VII. Conclusion
The research presented in this report provides current information for better understanding the economic impact of on-premise signage. The national business survey results provide insight to how different types and sizes of businesses use and value their signage. The survey results also provide details about the specific aspects of signs that different types of businesses consider most important. The case study results have reinforced the survey results and provide detailed examples of improved business performance resulting from specific changes in signage. The ultimate goal of this research has been to provide the signage stakeholders with timely, relevant information to inform their decisions about using on-premise signs to jointly serve the needs of both individual businesses and communities where they are located. As we have attempted to convey, the impact of signage on an individual business location is complicated by a number of factors related to the specific physical, social, and regulatory context of that location, as well as the specific customer base and product offered by the business. Our results suggest that careful identification and consideration of those factors is likely to result in more effective signage. The implication is that with respect to on-premise signage, one size does not fit all, and that to maximize their effectiveness, different types and sizes of business need tailor their signs to their specific needs. Most reputable sign companies already know and appreciate this, though this may be new insight for some businesses. Perhaps the stakeholders that can most benefit from our analyses are some of the sign regulators.
Our work should not be interpreted to suggest that all sign regulations hinder business performance. While this research has emphasized the important role of successful businesses in a community’s overall quality of life, we recognize that thoughtful signage design standards can accommodate both the needs of businesses and communities. Indeed, it is clear from our work that sign regulation incentivizing legible, visible, and conspicuous signs can boost business performance, especially for the small businesses that can catalyze growth.
A. Implications for Businesses
Businesses make decisions about their signage within the context of their available financial resources, target customer base, and location characteristics. The results

44
presented in this report emphasize the importance of carefully assessing the role signage plays in a business’ overall marketing and branding strategy given the specific characteristics of a particular location. The specific sign designs and types used to achieve these objectives will depend on multiple factors related to the business location, including view distance, street/road curvature, number of traffic lanes, speed limits, landscaping, building setback, and sightline obstructions from other signs, buildings, poles and berms, and potentially many other factors. The case studies reinforce the idea that particular signs may be effective for one type of business but not be well-suited for another. Clearly the digital electronic signs that work so well for the hotel chain would be ineffective for the specialty shoe store. Likewise, the video sign that works well to enhance sales and community relations for a single-establishment car dealer may be difficult for a banking chain to use at neighborhood branches and integrate into their national branding strategy.
B. Implications for Communities
Both private and public decisions about signs can have important implications for communities. As previously indicated, the results of this study show that signs that are legible, visible, and conspicuous are important for retail businesses. The implication is that sign regulations should balance community design standards with site-specific technical requirements for promoting business success. The alternative is that businesses are less successful and governments have less revenue to support their services. Second, it is important for planners and local officials to understand how the purposes and uses of signs differ for single establishments, small companies, and larger companies. Sign regulations that constrain one purpose may disadvantage the businesses that depend on it. This may be the case especially for smaller, single establishments, which are frequently more dependent on signs as a primary means of communicating their location and products or services to potential customers. On the other hand, regulations that encourage quality signage that communicates effectively at low cost may help small businesses. Given that such small businesses frequently serve as engines of job growth, such policies can be especially appropriate as part of neighborhood economic growth strategies.
C. Implications for Future Research
Taken together, the results of this research have significant implications for businesses and communities, and they suggest important considerations to guide future research in this area. Much of the work reported here is based on data collected directly from businesses, which are an irreplaceable source of information for signage research. Those who attempt to replicate this research will find that most businesses, regardless of size, are hesitant to share such detailed data about individual locations despite extensive assurances of confidentiality. Because research in this field is important for informing business investments as well as public policy, future research will benefit from efforts that would enable business signage and performance data to be made more accessible to researchers. Associations within the signage industry might be able to establish mechanisms or protocols to facilitate data availability while ensuring confidentiality.

45
This study can serve as a foundation and guide for practitioners and researchers who want to contribute to the development of more effective signs and improved signage practices. For those who are committed to this collaborative venture, new questions will arise from their application of these research findings, and future research will play a key role in the success of their efforts.

46

47
Appendicies
1. Survey Instruments

48

49
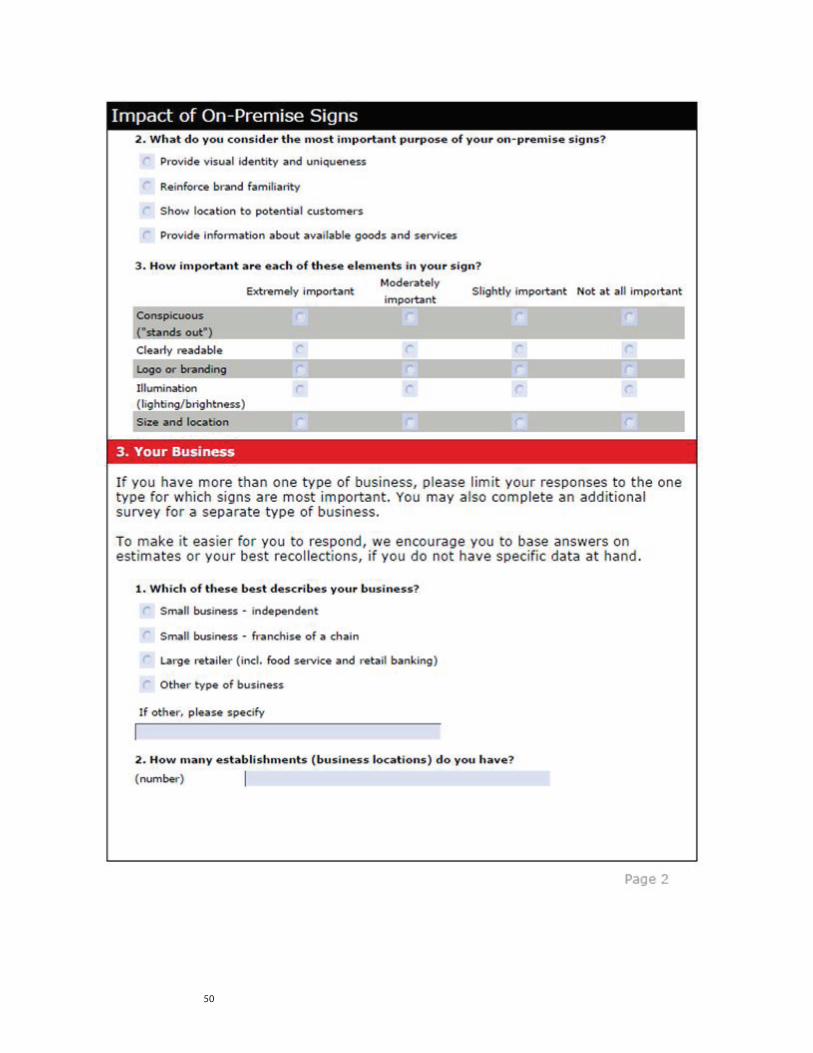
50

51

52

53
2. Retail Banking Technical Appendix
To examine the impact of signage and location characteristics on the visibility score, a binary variable taking on a value of 1 if the location received the highest score, and 0 otherwise, was constructed. Assuming that the probability of the outcome of interest is normally distributed gives rise to a standard probit model. As the coeffi-cients from a probit model are not directly interpretable they have been transformed into marginal effects. The marginal effects displayed in the table below give the change in the predicted probability of having the highest visibility rating for a given one-unit change in the explanatory variable.
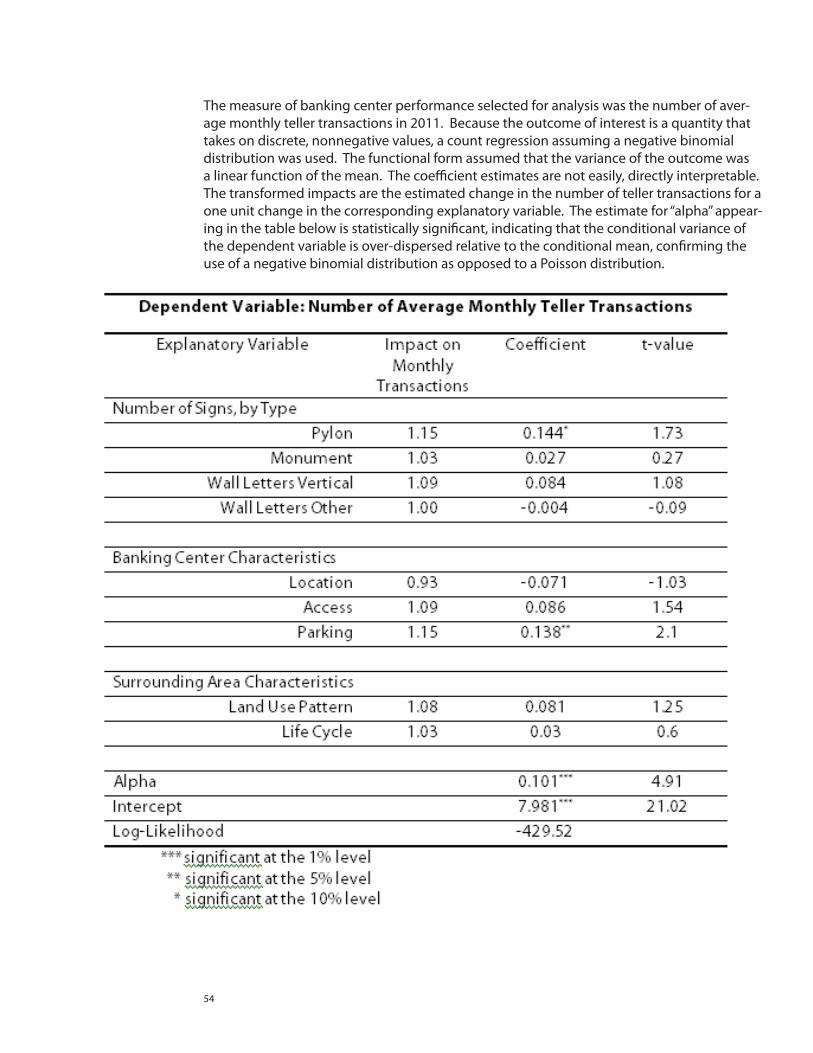
54
The measure of banking center performance selected for analysis was the number of aver-age monthly teller transactions in 2011. Because the outcome of interest is a quantity that takes on discrete, nonnegative values, a count regression assuming a negative binomial distribution was used. The functional form assumed that the variance of the outcome was a linear function of the mean. The coefficient estimates are not easily, directly interpretable. The transformed impacts are the estimated change in the number of teller transactions for a one unit change in the corresponding explanatory variable. The estimate for “alpha” appear-ing in the table below is statistically significant, indicating that the conditional variance of the dependent variable is over-dispersed relative to the conditional mean, confirming the use of a negative binomial distribution as opposed to a Poisson distribution.

55
There are several important potential sources of biases that impact the reliability of the results. As mentioned previously, the datasets analyzed were small and also focused on a single type of business in one industry. The small number of observa-tions may render the point estimates themselves inaccurate. Additionally, there may be important variables that have been omitted from the analyses due to lack of data. These omitted variables may be another source of inaccuracy. It is possible that, where data available, inclusion of these variables would change the sign, magnitude or significance of the remaining variables. Finally, as the data were not a random sample of businesses the results are not necessarily applicable to other industries or indicative of the impacts of business signage generally.

56

57
References
Bass, Richard W. (2011) “Planners, Signs and A Community’s Economic Well Being” Proceedings from the 2011 National Signage Research & Education Conference, Cincinnati, OH.
Beery, Al. (2002, May). “Site selection insight”. ABA Bank Marketing, 34(4), 28-30.
Berger, AA. (1989). Seeing is Believing, Mountain View, California: Mayfields Publishing Company.
Blakely E.J. & Leigh N.G. (2010). Planning Local Economic Development: Theory and Practice. Fourth edition. Thousand Oaks: Sage Publications.
Browning, G. (1996). “A Tangled Web”, National Journal, 28(36).
Christadoulou, J. (2009). Comprehensive Review of Literature on Signage: 1950 to Present. Washington DC: Signage Foundation, Inc.
Conroy, D. (2004). What’s Your Signage? Albany: New York State Small Business Development Center. Edelman, D. (2009). “Comprehensive Review of Literature on Signage: 1950 to Present.” Presentation at the National Signage Research and Education Conference, Cincinnati.
Ellis,S., Johnson, R., & Murphy R. (1997). The Economic Value of On-Premise Signage. San Diego: California Electric Sign Association.
FedEX Office. (2012). Hey There, What’s Your Sign? Insights into the Signage that Attracts Consumers.
Heather, K. (2003). “Economics and the Internet.” Teaching Business & Economics, 7(1).
Kellaris, J. J. (2011). “100,000 Shoppers Can’t Be Wrong: Signage Communication Evidence from the BrandSpark.” Presentation at the National Sign Research & Education Conference, Cincinnati.

58
Morris, M. (2001). The Economic Context of Signs: Designing for Success. In Morris, M., M. Hinshaw, D. Mace and A. Weinstein. Context-Sensitive Signage Design, Planning Advisory Service. Chicago: American Planning Association.
Post, G.V., & Pfaff J.F. (2007). “Internet Entrepreneurship and Economic Growth”. Journal of International Technology and Information Management, 16(3).
Richmond V.P., & McCroskey J.C. (2009). Human Communication Theory and Research, in DW Stacks and MB Salwen, eds., An Integrated Approach to Communication Theory and Research. New York: Routledge.
Robinson, R.B., Jr., & Pearce, J.A., II. (1988). “Planned patterns of strategic behavior and their relationship to business-unit performance”. Strategic Management Journal, 9(1): 43-60.
Taylor, C.R, Sarkees, M.E. & Bang, H. (2012). “Understanding the Value of On-Premise Signs as Marketing Devices to Businesses for Legal and Public Policy Purposes”. Journal of Public Policy & Marketing. Posted online on 28 June 2012.
Taylor, C.R. (2010). “Value Provided by On-Premise Signs: Measuring the Economic Value to the Business Enterprise” . Presentation at the National Sign Research & Education Conference, Cincinnati.
Taylor, C.R. (2005). “How excessive restrictions on signage backfire”, Journal of Consumer Marketing, Vol. 22 Iss: 6 pp. 304-305.
Taylor, C.R., Susan Claus, and Thomas Claus (2005), On-Premise Signs as Storefront Marketing Devices and Systems. Washington, DC: U.S. Small Business Administration.
Tufte, E. (1990). Envisioning Information. Cheshire, Connecticut: Graphic Press.
Tufte, E. (1997). Visual Explanations. Cheshire, Connecticut: Graphic Press.
van Bulck, Hendrikus E.J.M.L. (2011). “The Effectiveness of Outdoor Electronic Message Centers”. Presentation at the National Sign Research & Education Conference, Cincinnati.
Venkatraman, N., & Ramanujam, V. (1986). “Measurement of performance in strategy research: A comparison of approaches”. Academy of Management Review, 11(4): 801-814.
Venturi, R. & Brown, D.S. (1977). Learning from Las Vegas: The Forgotten Symbolism of Architectural Form. The MIT Press.
U.S. Census Bureau. (2011). Statistics of U.S. Businesses: 2008. U.S. Department of Commerce. http://www.census.gov/epcd/susb/2008/us/US--.HTM

59
U.S. Small Business Administration. (2003). The Signage Sourcebook: A Signage Handbook. First Edition. U.S. Small Business Administration and The Signage Foundation for Communication Excellence, Inc.
U.S. Small Business Administration. Understanding the Value of Signage. http://www.sba.gov/smallbusinessplanner/start/pickalocation/signage/text/ understand.html

60

61
Acknowledgements
The Research Team expresses its appreciation to the Signage Foundation, Inc. (SFI) for its financial sponsorship of this project and to the University of Cincinnati (UC) for its support.
The Team also wishes to acknowledge the many valuable contributions made by SFI Board and Review Team members, the helpful participation of numerous members of the sign industry and businesses that responded to the national survey, and the assistance of the other members of the UC Economics Center staff with special thanks to research economists, Jennifer Shand, PhD and Bejamin Passty, PhD..
Finally, the Team is deeply indebted to the people of the case study businesses, who provided invaluable information that made this research possible.