the economic viability of hard-coal-fired power plants … · project report the economic viability...
TRANSCRIPT
PROJECT REPORT
The economic viability of hard-coal-fired power plants demon-strated on the example of the planned hard-coal-fired power
plant in Mainz
Commissioned by “Economists against the Mainz hard-coal-fired power plant”
with the financial support of the European Climate Foundation
Dr. Helmuth-M. Groscurth
arrhenius Institute for Energy and Climate Policy
Parkstrasse 1a, D-22605 Hamburg [email protected] www.arrhenius.de
translated by Laura Radosh

1
CONTENTS
ABSTRACT 3
1 INTRODUCTION 5
1.1 The planned power plant in Mainz 5
1.2 Mission and approach 5
1.3 Background: Climate policy 5
2 HOW THE ELECTRICITY MARKET WORKS 8
2.1 Electricity production costs 8
2.2 Determining the price of electricity and power plant revenue 9
3 CHANGES IN CRITICAL PARAMETERS 13
3.1 Fuel prices 13
3.2 Effect of electricity feed-in from renewable sources 17
3.3 Changes in the power plant stock 19 3.3.1 Building new electricity production facilities 19 3.3.2 Effects on the price of CO2 21
3.4 General conclusions 24
4 THE PLANNED HARD-COAL-FIRED POWER PLANT IN MAINZ 25
4.1 Electricity production costs 25
4.2 Position of the Mainz power plant on the market 26
4.3 Kraftwerke Mainz-Wiesbaden AG’s record 28
4.4 Consequences for the planned hard-coal-fired power plant in Mainz 28
APPENDIX 30
Reference case data 30
Abbreviations 31
Literature 32
Directory of tables 33
Directory of figures 33

3
ABSTRACT
The German utility Kraftwerke Mainz-Wiesbaden AG is planning a hard-coal-fired heat and power plant with a gross electrical output of approximately 820 MW. An investment of circa 1.3 billion euro is slated.
This study shows that the economic viability of this investment is threatened by a variety of factors: • The many new power plants currently in construction or in planning will lower the price of
electricity, since new power plants have lower marginal costs than existing plants. This reduces the revenues of all power plants.
• Developments in 2008 have shown that in the upcoming years – after the financial and economic crisis has been resolved – we can expect sharp increases in the price of fuel. The price of coal may, as in 2008, rise more steeply than the price of gas. As a result, the operating costs of a hard-coal-fired power plant would increase more than its reve-nue.
• Greater utilization of renewable energy sources to produce electricity will, in the mid- and long term, result in conventional power plants not being used at full capacity. This has a direct impact on revenues. It also requires that conventional plants be able to react flexi-bly, which is difficult for hard-coal-fired plants to achieve.
• Many renewable energy facilities have no marginal costs at all. The increased use of re-newable energy will cut electricity prices during many hours. This is a further factor that reduces hard-coal-fired power plant revenues.
• However the greatest economic threat to hard-coal-fired power plants by far comes from climate policy objectives. Mid- and long-term climate protection goals can only be reached if specific CO2 emissions from electricity production are reduced from currently 600 g/kWh to 450 g/kWh by 2020 and to at most 150 g/kWh by 2050. This can not be achieved with the investments currently planned; to the contrary, the slotted investments put the achievement of these goals at risk. Therefore, the CO2 price will continue to rise until plants remain within the emission budget. Building new hard-coal-fired power plants to-day will in the near future force society to choose between either closing these plants prematurely or abandoning climate protection objectives.
New hard-coal-fired power plants lead to rising CO2 prices and thus also to higher prices
for electricity. Hard-coal-fired power plants therefore do not guarantee consumers affordable electricity prices long-term, but rather add considerable economic risks.
After weighing chances and risks, taking economic considerations and climate policy into
account, we advise public investors against building new hard-coal-fired power plants.

On the economic viability of hard-coal-fired power plants 5
1 INTRODUCTION
1.1 The planned power plant in Mainz
The German utility company Kraftwerke Mainz-Wiesbaden AG is planning a hard-coal-fired heat and power plant with a gross electrical output of around 820 MW.
A number of assessments from 2006 and 2007 have found similar power plants to be economically viable (e.g. PWC 2006). In 2008 however, key parameters changed considera-bly. For example we now know it is most probable that starting 2013, directly following the plant's planned start of operations, all carbon dioxide (CO2) emission allowances will be auc-tioned. The fuel prices these assessments were based on must also be reevaluated after the drastic price increases in 2008 and the price collapse that followed in the wake of the finan-cial and economic crisis. Existing assessments also ignore the interconnection between pow-er plant investments and climate protection policy. For example, the construction of hard-coal-fired power plants in particular affects the price of CO2 and thus also electricity produc-tion costs as well as electricity costs. The increased use of renewable energy sources, which shall decrease the operating time of conventional plants in the near future, has also been largely ignored to date.
1.2 Mission and approach
This report shows that investments in hard-coal-fired power plants are a great financial risk, particularly if one assumes that the climate protection objectives Germany and the EU envisage, and have in part ratified, will be implemented.
To illustrate this, we first describe how the electricity market works. We then look at how changes in key parameters affect market prices and power plant revenues. Using model cal-culations, we then determine whether these revenues are sufficient to compensate for in-vestments in hard-coal-fired power plants. We further analyze how changes in the stock of all power plants affect average specific CO2 emissions and how this in turn affects the price of carbon dioxide.
1.3 Background: Climate policy
Human-induced greenhouse gas emissions threaten to change the global climate, bringing – according to current scientific understanding – a plethora of negative consequences for the quality of life on Earth.
The Kyoto Protocol, which went into effect in 2005, set the first binding objectives to cap greenhouse gas emissions. Currently, "post-Kyoto” goals for the time period after 2012 are in negotiation. The international community aims to adopt a new protocol at the next climate conference in Copenhagen at the end of 2009.
Table 1 shows the changes that must be made on a global scale depending on CO2 con-centration levels as well as reductions that need to be made by the so-called Annex I parties to the Climate Framework Convention, including Germany. Germany and Europe aim to limit global warming to a rise of 2 degrees Celsius (EU Council 1996, CEC 2008, BMU 2007). To do so, the industrialized countries must reduce their emissions by 80% to 90% by the middle
6 On the economic viability of hard-coal-fired power plants
of the century. Newest scientific discoveries meanwhile suggest that this needs to be ad-justed to reductions as high as 95% (Meinshausen et al. 2009). In the following, a conserva-tive estimate in favor of hard-coal-fired power plants has been made of a “mere” 80% re-duction of greenhouse gas emissions.
Mid-term objectives of 25 to 40 percent reductions by 2020 can be derived from these long-term objectives for Annex I countries, as Table 1 illustrates.1 Accordingly, the EU has already set a one-sided goal of a 20% emissions reduction by 2020 with 1990 as base year (CEC 2008). If other countries come on board, the EU would be willing to accept a reduction of 30%. The German federal government aims for a reduction of 30% and is willing to ac-cept a target of 40% if the EU as a whole accepts a 30% reduction (BMU 2007).
Table 1. Greenhouse gas stabilization scenarios (adapted from UNFCCC 2007).
CO2 equiva-lent concen-
tration (parts per million)
Global mean temperature increase (°C)
Change in global CO2 emissions in 2050 (% of 2000
emissions)
Emission reduction goal for Annex I countries in 2050 (% of 1990 emis-
sions)
Emission reduction goal for Annex I countries in 2020 (% of 1990 emis-
sions)
445 - 490 2.0 - 2.4 - 80% to -50% -80% to -95% - 25% to -40%
535 - 590 2.8 - 3.2 -30% to +5% -40% to -90% -10% to -30%
590 - 710 3.2 - 4.0 +10 to 60% -30% to -80% 0 to -25%
Government emission reduction targets can only be reached if they are converted into
emission reduction requirements or incentives for specific emitters in individual sectors. The fact that emissions trading has been created to steer investments so that they have the greatest possible effect should not obscure the fact that emission reductions of this magni-tude can only be achieved if all sectors make substantial contributions that add up to the necessary reduction. Emissions trading may then determine whether individual sectors make reductions of a couple of percent more or less.
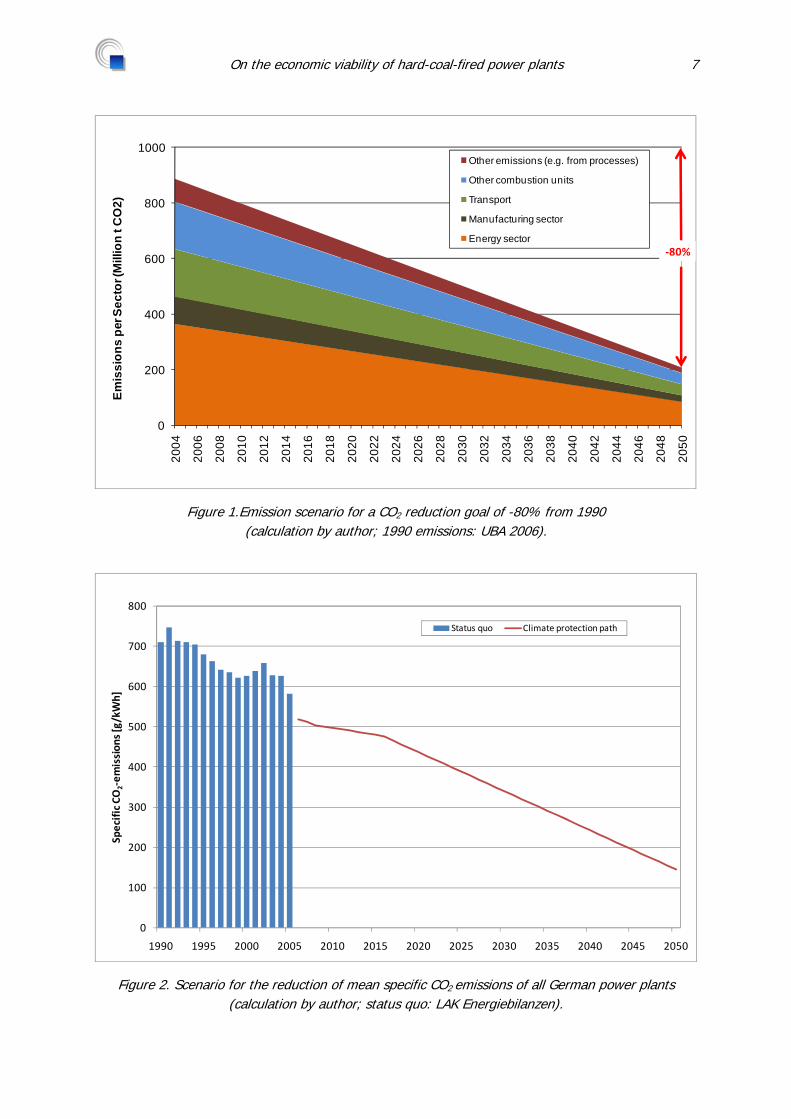
Figure 1 and figure 2 show a reduction scenario for the entire economy and for the elec-tricity industry. In this scenario, the reduction objective of -80% has been distributed fairly among the individual sectors. However this is a conservative analysis as it is still completely unclear how some sectors, such as the manufacturing sector or transportation, will be able to meet this target. It is therefore probable that the electricity production sector will have to reduce its CO2 emissions even more.
As can be seen in figure 1, the emissions budget for the energy industry (electricity and heat) decreases from currently over 300 mill. t CO2 to just under 85 mill. t by 2050. Thus the mean specific emission for electricity production would be 150 grams per kilowatt hour (g/kWh) (figure 2).2 Today, this value is at almost 600 g/kWh.
1 Annex I of the Kyoto Protocol lists the countries that have already made binding commitments to
cap their greenhouse gas emissions. It is basically a list of the industrialized countries, excluding the USA.
2 A more detailed illustration of this derivation can be found in Bode (2009).
On the economic viability of hard-coal-fired power plants 7
0
200
400
600
800
1000
2004
2006
2008
2010
2012
2014
2016
2018
2020
2022
2024
2026
2028
2030
2032
2034
2036
2038
2040
2042
2044
2046
2048
2050
Emis
sion
s pe
r Sec
tor (
Mill
ion
t CO
2)
Other emissions (e.g. from processes)
Other combustion units
Transport
Manufacturing sector
Energy sector‐80%
Figure 1.Emission scenario for a CO2 reduction goal of -80% from 1990 (calculation by author; 1990 emissions: UBA 2006).
0
100
200
300
400
500
600
700
800
1990 1995 2000 2005 2010 2015 2020 2025 2030 2035 2040 2045 2050
Specific CO
2‐em
ission
s [g/kWh]
Status quo Climate protection path
Figure 2. Scenario for the reduction of mean specific CO2 emissions of all German power plants (calculation by author; status quo: LAK Energiebilanzen).
8 On the economic viability of hard-coal-fired power plants
2 HOW THE ELECTRICITY MARKET WORKS
In this chapter, we explain how the wholesale electricity price is set on the European Energy Exchange (the German energy market - see also Groscurth and Bode 2009). First however we must delineate the costs incurred in the production of electricity and those parts of production costs that are relevant to the creation of prices.
2.1 Electricity production costs
A power plant’s electricity production costs are made up of a variable portion that is (usually) proportional to the amount of electricity produced and a fixed portion that is in-curred whether or not the plant produces electricity. To facilitate understanding, let us simpl-ify and assume that there are only three cost factors: • investment or capital costs; • fuel costs; • costs for CO2 emission allowances. Investment costs are typical fixed costs while the two other types are variable costs. As a rule, other conventional power plant expenses such as fixed and variable operating costs and maintenance costs are low in comparison to the three above-named factors, and shall there-fore be disregarded in this basic overview.3 Variable fuel costs and CO2 costs depend upon fuel prices, the power plant's level of utilization,4 the fuel’s specific CO2 emissions and the price of CO2.
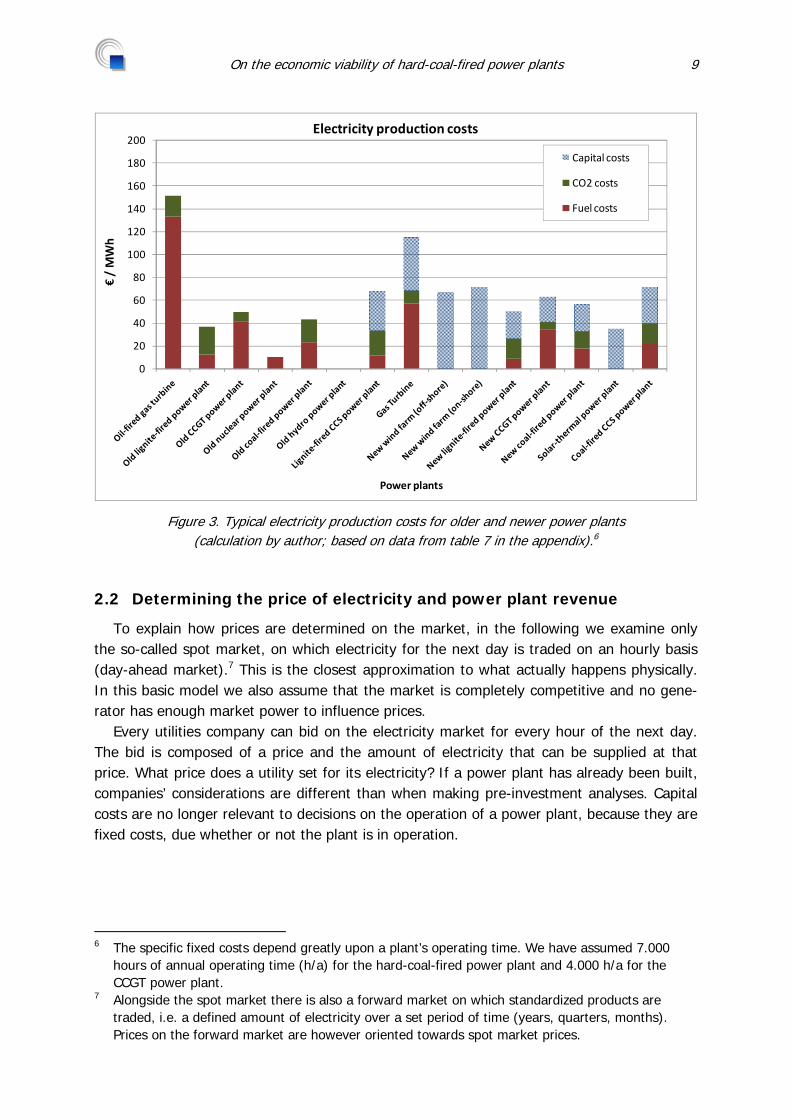
Figure 3 illustrates typical electricity production costs for old and new power plants. Old power plants that are already amortized no longer have capital costs. The capital costs of a new power plant depend greatly upon how many hours per year the plant is in operation. Thus the values given in figure 3 are typical, but may vary depending upon conditions. The calculation is based on a gas price of 20 €/MWh_f, a hard coal price of 8 €/MWh_f and a CO2
price of 20 €/t (see table 8 in the appendix).5 The hard-coal-fired power plant planned in Mainz is similar to the “new coal-fired power
plant” in figure 3, the existing natural-gas-fired combined cycle power plant is similar to the “new CCGT power plant.”
3 For renewable energy facilities this can look different. Wind farms for example have O&M costs of
15-30 €/MWh. Since this study concentrates on hard-coal-fired power plants, we nevertheless make this assumption to simplify our illustration.
4 A power plant’s level of utilization is the ratio of the electricity produced and the amount of fuel necessary to produce it. It is also known as the average power efficiency.
5 €/MWh_f: The addition of “_f” means that the price refers to the energy content of the fuel. End-ings with “_el” refer to the electricity produced.
On the economic viability of hard-coal-fired power plants 9
0
20
40
60
80
100
120
140
160
180
200
€/ MWh
Power plants
Electricity production costs
Capital costs
CO2 costs
Fuel costs
Figure 3. Typical electricity production costs for older and newer power plants (calculation by author; based on data from table 7 in the appendix).6
2.2 Determining the price of electricity and power plant revenue
To explain how prices are determined on the market, in the following we examine only the so-called spot market, on which electricity for the next day is traded on an hourly basis (day-ahead market).7 This is the closest approximation to what actually happens physically. In this basic model we also assume that the market is completely competitive and no gene-rator has enough market power to influence prices.
Every utilities company can bid on the electricity market for every hour of the next day. The bid is composed of a price and the amount of electricity that can be supplied at that price. What price does a utility set for its electricity? If a power plant has already been built, companies’ considerations are different than when making pre-investment analyses. Capital costs are no longer relevant to decisions on the operation of a power plant, because they are fixed costs, due whether or not the plant is in operation.
6 The specific fixed costs depend greatly upon a plant’s operating time. We have assumed 7.000
hours of annual operating time (h/a) for the hard-coal-fired power plant and 4.000 h/a for the CCGT power plant.
7 Alongside the spot market there is also a forward market on which standardized products are traded, i.e. a defined amount of electricity over a set period of time (years, quarters, months). Prices on the forward market are however oriented towards spot market prices.
10 On the economic viability of hard-coal-fired power plants
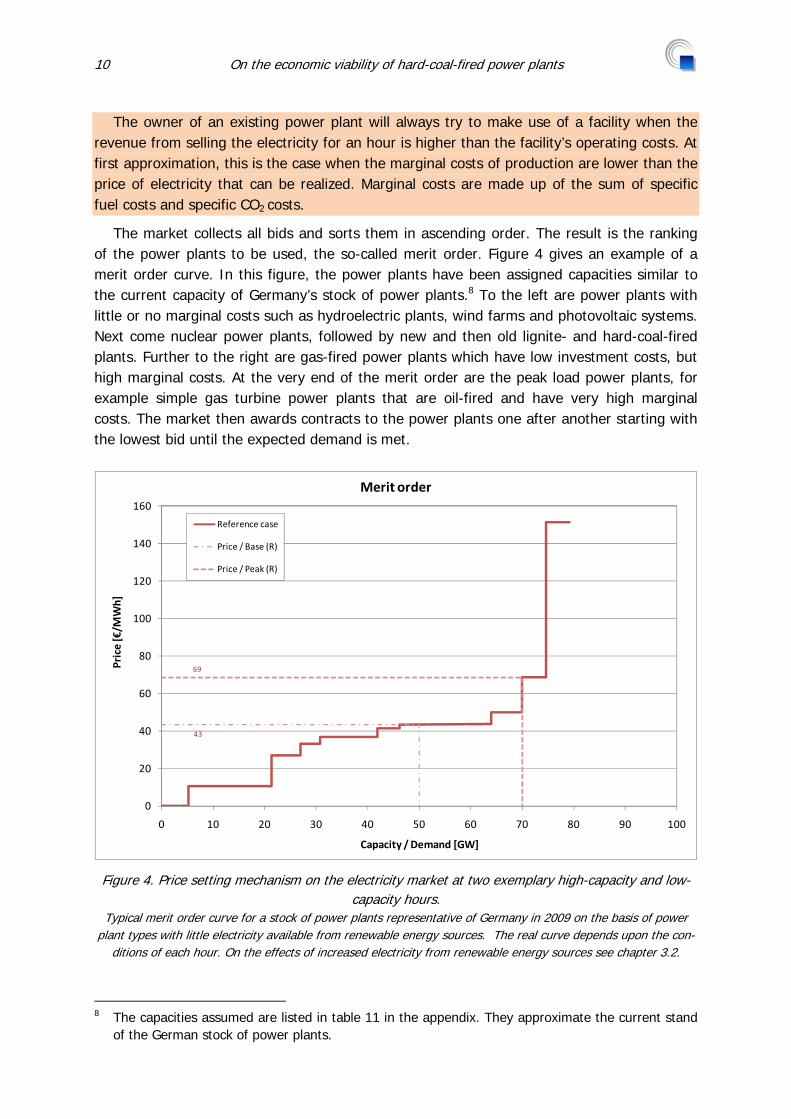
The owner of an existing power plant will always try to make use of a facility when the revenue from selling the electricity for an hour is higher than the facility’s operating costs. At first approximation, this is the case when the marginal costs of production are lower than the price of electricity that can be realized. Marginal costs are made up of the sum of specific fuel costs and specific CO2 costs.
The market collects all bids and sorts them in ascending order. The result is the ranking of the power plants to be used, the so-called merit order. Figure 4 gives an example of a merit order curve. In this figure, the power plants have been assigned capacities similar to the current capacity of Germany’s stock of power plants.8 To the left are power plants with little or no marginal costs such as hydroelectric plants, wind farms and photovoltaic systems. Next come nuclear power plants, followed by new and then old lignite- and hard-coal-fired plants. Further to the right are gas-fired power plants which have low investment costs, but high marginal costs. At the very end of the merit order are the peak load power plants, for example simple gas turbine power plants that are oil-fired and have very high marginal costs. The market then awards contracts to the power plants one after another starting with the lowest bid until the expected demand is met.
43
69
0
20
40
60
80
100
120
140
160
0 10 20 30 40 50 60 70 80 90 100
Price [€/M
Wh]
Capacity / Demand [GW]
Merit order
Reference case
Price / Base (R)
Price / Peak (R)
Figure 4. Price setting mechanism on the electricity market at two exemplary high-capacity and low-capacity hours.
Typical merit order curve for a stock of power plants representative of Germany in 2009 on the basis of power plant types with little electricity available from renewable energy sources. The real curve depends upon the con-
ditions of each hour. On the effects of increased electricity from renewable energy sources see chapter 3.2.
8 The capacities assumed are listed in table 11 in the appendix. They approximate the current stand
of the German stock of power plants.
On the economic viability of hard-coal-fired power plants 11
This is not a particularity of the electricity market but a common mechanism on complete-ly competitive markets.
The last power plant to be awarded a bid (the so-called marginal power plant) determines the electricity price paid to all suppliers. The utilities are not paid the amount they them-selves have bid, but rather a spot price determined by the last bidder.
Figure 4 illustrates this mechanism for two exemplary hours. The electricity price is de-termined by the demand and supply curves’ point of intersection. In this example, the de-mand is inelastic; demand does not sink when the electricity price rises (horizontal line in figure 4). This is a sensible assumption to make when estimating short-term demand, at least for the left and middle section of the merit order curve. Below we shall discuss the case of a reduction in demand due to high prices.
As long as there is enough capacity, the market price for electricity in any hour is equal to the marginal costs of the last power plant needed to meet the demand for electricity in this hour.
In times of low demand of 50 GW, the marginal power plant in figure 4 is a hard-coal-fired power plant and the price is thus 43 €/MWh. When demand rises, the demand curve moves to the right. It then intersects the supply curve at a higher price. At a demand of around 70 GW, the marginal power plant is gas-fired and the price rises to 69 €/MWh.
In reality, the merit order curve is less step-like, but rather ascends mostly continuously. This is because real individual power plants differ from one another and thus also have vary-ing marginal costs. It is however irrelevant to this basic overview whether the electricity price remains constant or varies slightly. More important is the fundamental effect, which can also be illustrated by a simplified model of Germany’s stock of power plants.
Recently, negative prices have also occasionally occurred on the market. This happens when the owners of conventional power plants want to avoid the expensive process of shut-ting down and starting up a facility within only a few hours. They are then willing to pay to be allowed to deliver electricity in the interim hours.
Up to now, we have only looked at one individual hour. However both the merit order
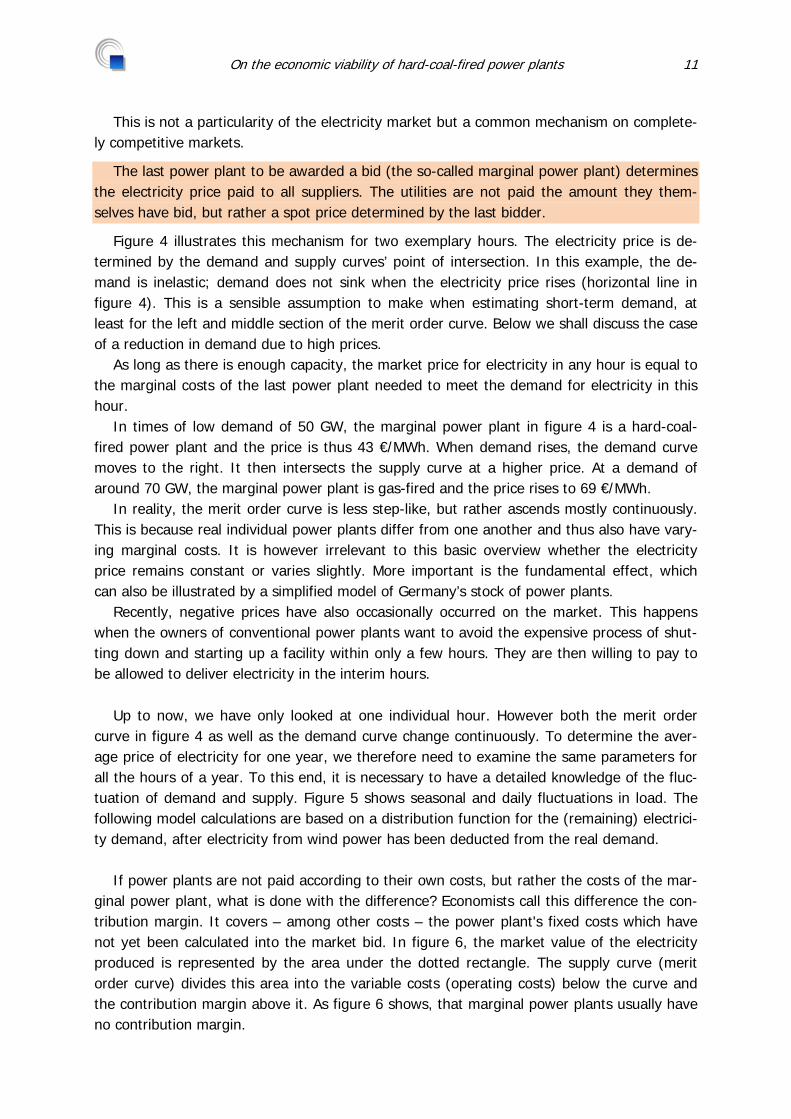
curve in figure 4 as well as the demand curve change continuously. To determine the aver-age price of electricity for one year, we therefore need to examine the same parameters for all the hours of a year. To this end, it is necessary to have a detailed knowledge of the fluc-tuation of demand and supply. Figure 5 shows seasonal and daily fluctuations in load. The following model calculations are based on a distribution function for the (remaining) electrici-ty demand, after electricity from wind power has been deducted from the real demand.
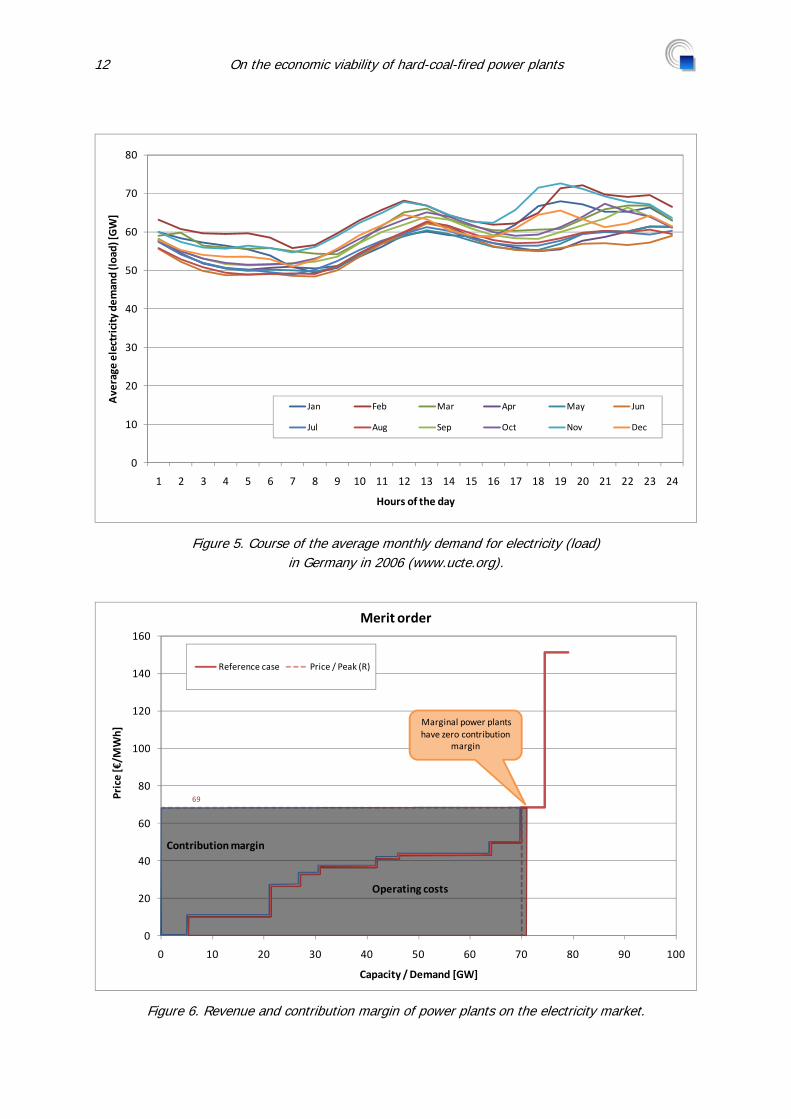
If power plants are not paid according to their own costs, but rather the costs of the mar-
ginal power plant, what is done with the difference? Economists call this difference the con-tribution margin. It covers – among other costs – the power plant's fixed costs which have not yet been calculated into the market bid. In figure 6, the market value of the electricity produced is represented by the area under the dotted rectangle. The supply curve (merit order curve) divides this area into the variable costs (operating costs) below the curve and the contribution margin above it. As figure 6 shows, that marginal power plants usually have no contribution margin.
12 On the economic viability of hard-coal-fired power plants
0
10
20
30
40
50
60
70
80
1 2 3 4 5 6 7 8 9 10 11 12 13 14 15 16 17 18 19 20 21 22 23 24
Average electricity dem
and (load) [G
W]
Hours of the day
Jan Feb Mar Apr May Jun
Jul Aug Sep Oct Nov Dec
Figure 5. Course of the average monthly demand for electricity (load) in Germany in 2006 (www.ucte.org).
69
0
20
40
60
80
100
120
140
160
0 10 20 30 40 50 60 70 80 90 100
Price [€/M
Wh]
Capacity / Demand [GW]
Merit order
Reference case Price / Peak (R)
Contribution margin
Operating costs
Marginal power plants have zero contribution
margin
Figure 6. Revenue and contribution margin of power plants on the electricity market.
On the economic viability of hard-coal-fired power plants 13
3 CHANGES IN CRITICAL PARAMETERS
3.1 Fuel prices
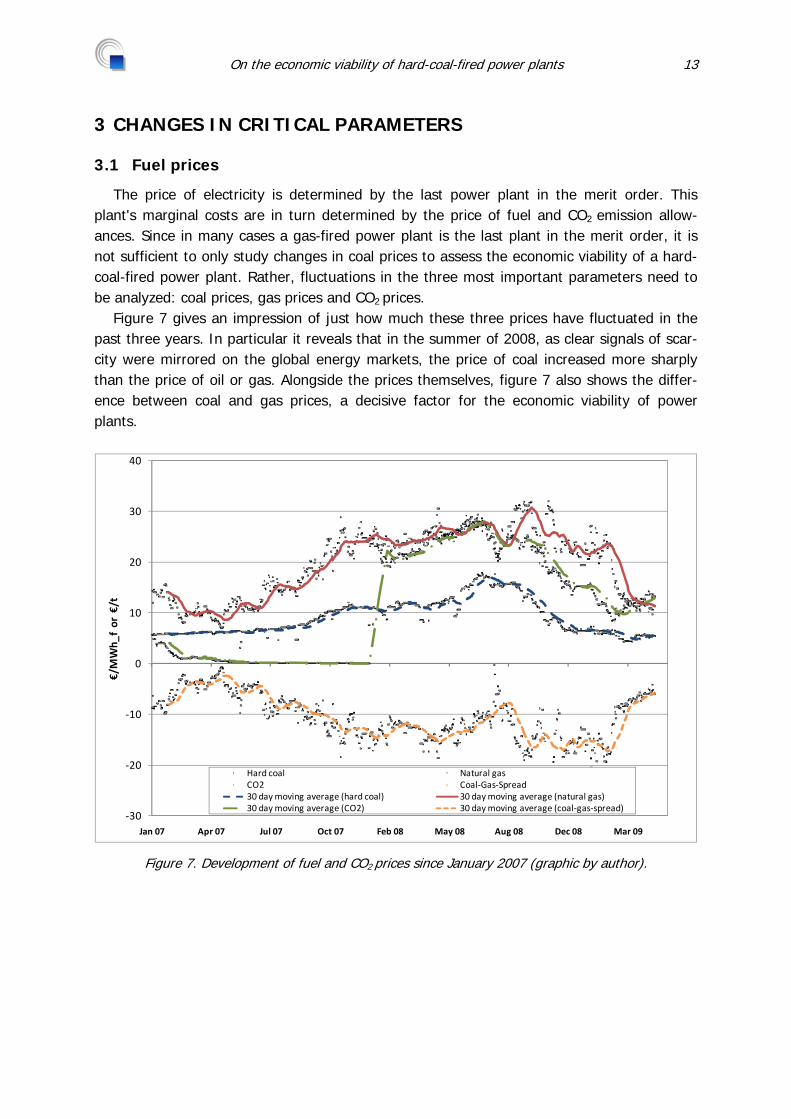
The price of electricity is determined by the last power plant in the merit order. This plant's marginal costs are in turn determined by the price of fuel and CO2 emission allow-ances. Since in many cases a gas-fired power plant is the last plant in the merit order, it is not sufficient to only study changes in coal prices to assess the economic viability of a hard-coal-fired power plant. Rather, fluctuations in the three most important parameters need to be analyzed: coal prices, gas prices and CO2 prices.
Figure 7 gives an impression of just how much these three prices have fluctuated in the past three years. In particular it reveals that in the summer of 2008, as clear signals of scar-city were mirrored on the global energy markets, the price of coal increased more sharply than the price of oil or gas. Alongside the prices themselves, figure 7 also shows the differ-ence between coal and gas prices, a decisive factor for the economic viability of power plants.
‐30
‐20
‐10
0
10
20
30
40
Jan 07 Apr 07 Jul 07 Oct 07 Feb 08 May 08 Aug 08 Dec 08 Mar 09
€/MWh_
f or €/t
Hard coal Natural gasCO2 Coal‐Gas‐Spread30 day moving average (hard coal) 30 day moving average (natural gas)30 day moving average (CO2) 30 day moving average (coal‐gas‐spread)
Figure 7. Development of fuel and CO2 prices since January 2007 (graphic by author).
14 On the economic viability of hard-coal-fired power plants
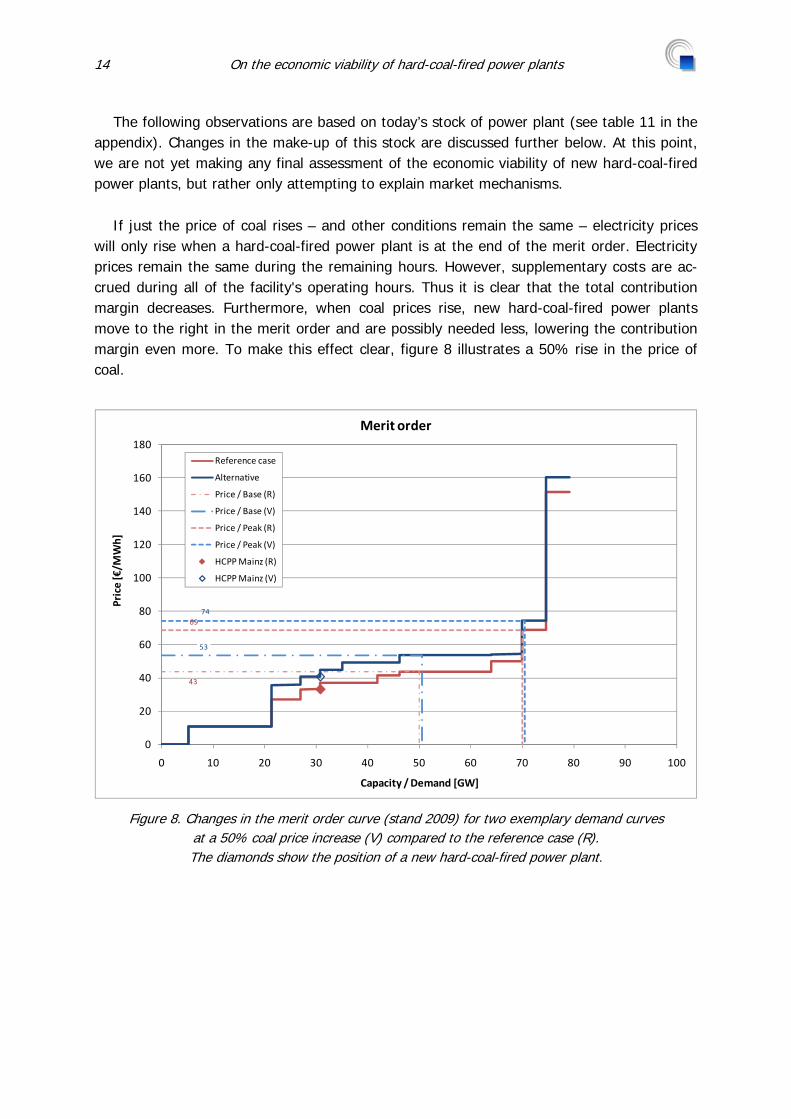
The following observations are based on today’s stock of power plant (see table 11 in the appendix). Changes in the make-up of this stock are discussed further below. At this point, we are not yet making any final assessment of the economic viability of new hard-coal-fired power plants, but rather only attempting to explain market mechanisms.
If just the price of coal rises – and other conditions remain the same – electricity prices
will only rise when a hard-coal-fired power plant is at the end of the merit order. Electricity prices remain the same during the remaining hours. However, supplementary costs are ac-crued during all of the facility's operating hours. Thus it is clear that the total contribution margin decreases. Furthermore, when coal prices rise, new hard-coal-fired power plants move to the right in the merit order and are possibly needed less, lowering the contribution margin even more. To make this effect clear, figure 8 illustrates a 50% rise in the price of coal.
43
53
6974
0
20
40
60
80
100
120
140
160
180
0 10 20 30 40 50 60 70 80 90 100
Price [€/M
Wh]
Capacity / Demand [GW]
Merit order
Reference case
Alternative
Price / Base (R)
Price / Base (V)
Price / Peak (R)
Price / Peak (V)
HCPP Mainz (R)
HCPP Mainz (V)
Figure 8. Changes in the merit order curve (stand 2009) for two exemplary demand curves at a 50% coal price increase (V) compared to the reference case (R). The diamonds show the position of a new hard-coal-fired power plant.
On the economic viability of hard-coal-fired power plants 15
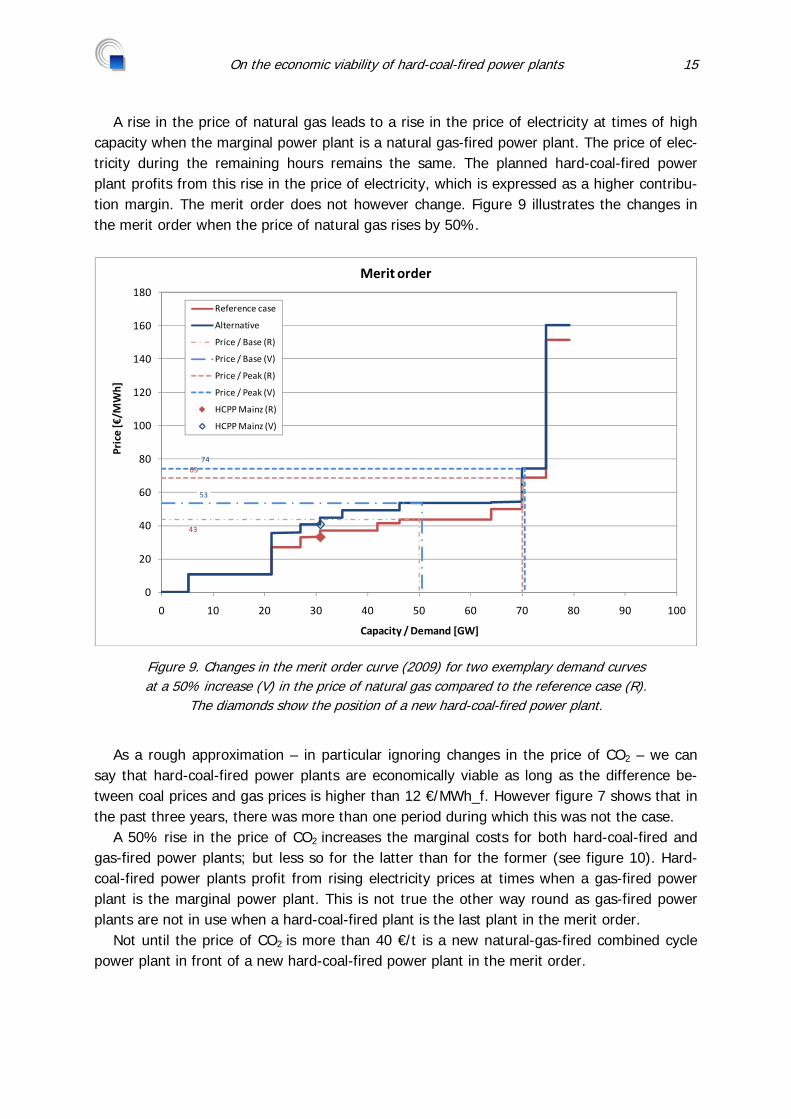
A rise in the price of natural gas leads to a rise in the price of electricity at times of high capacity when the marginal power plant is a natural gas-fired power plant. The price of elec-tricity during the remaining hours remains the same. The planned hard-coal-fired power plant profits from this rise in the price of electricity, which is expressed as a higher contribu-tion margin. The merit order does not however change. Figure 9 illustrates the changes in the merit order when the price of natural gas rises by 50%.
43
53
6974
0
20
40
60
80
100
120
140
160
180
0 10 20 30 40 50 60 70 80 90 100
Price [€/M
Wh]
Capacity / Demand [GW]
Merit order
Reference case
Alternative
Price / Base (R)
Price / Base (V)
Price / Peak (R)
Price / Peak (V)
HCPP Mainz (R)
HCPP Mainz (V)
Figure 9. Changes in the merit order curve (2009) for two exemplary demand curves at a 50% increase (V) in the price of natural gas compared to the reference case (R).
The diamonds show the position of a new hard-coal-fired power plant.
As a rough approximation – in particular ignoring changes in the price of CO2 – we can
say that hard-coal-fired power plants are economically viable as long as the difference be-tween coal prices and gas prices is higher than 12 €/MWh_f. However figure 7 shows that in the past three years, there was more than one period during which this was not the case.
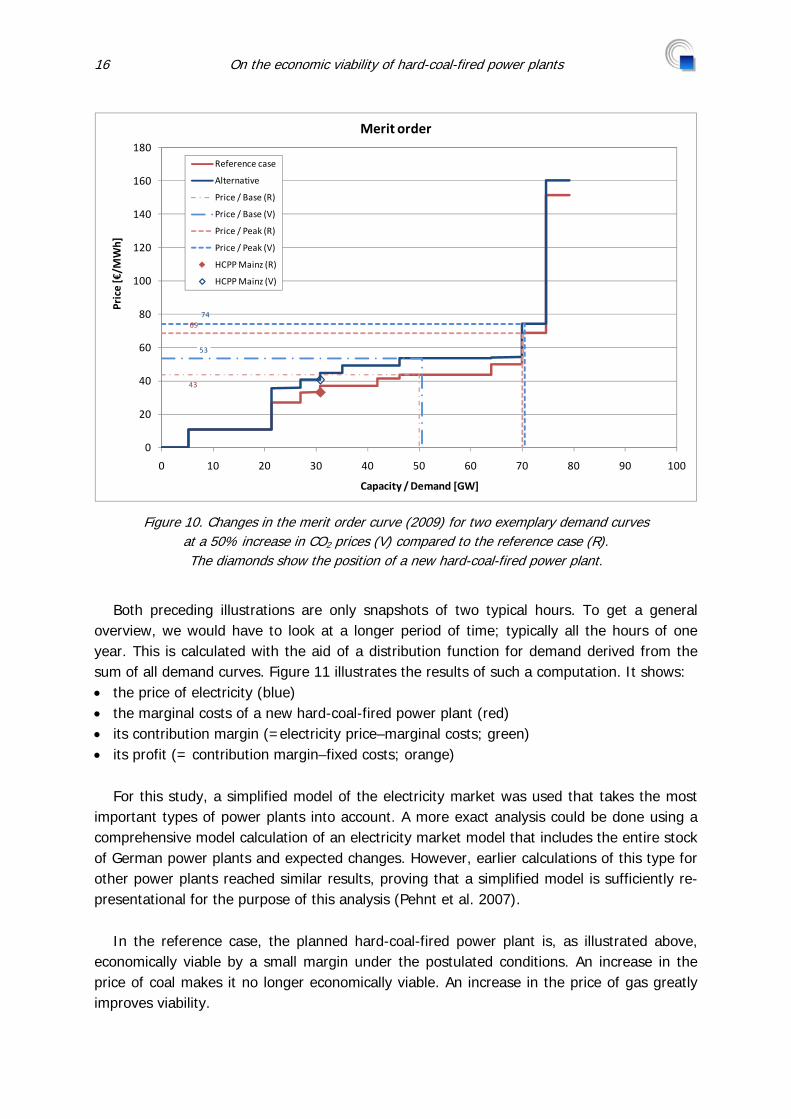
A 50% rise in the price of CO2 increases the marginal costs for both hard-coal-fired and gas-fired power plants; but less so for the latter than for the former (see figure 10). Hard-coal-fired power plants profit from rising electricity prices at times when a gas-fired power plant is the marginal power plant. This is not true the other way round as gas-fired power plants are not in use when a hard-coal-fired plant is the last plant in the merit order.
Not until the price of CO2 is more than 40 €/t is a new natural-gas-fired combined cycle power plant in front of a new hard-coal-fired power plant in the merit order.
16 On the economic viability of hard-coal-fired power plants
43
53
6974
0
20
40
60
80
100
120
140
160
180
0 10 20 30 40 50 60 70 80 90 100
Price [€/M
Wh]
Capacity / Demand [GW]
Merit order
Reference case
Alternative
Price / Base (R)
Price / Base (V)
Price / Peak (R)
Price / Peak (V)
HCPP Mainz (R)
HCPP Mainz (V)
Figure 10. Changes in the merit order curve (2009) for two exemplary demand curves at a 50% increase in CO2 prices (V) compared to the reference case (R). The diamonds show the position of a new hard-coal-fired power plant.
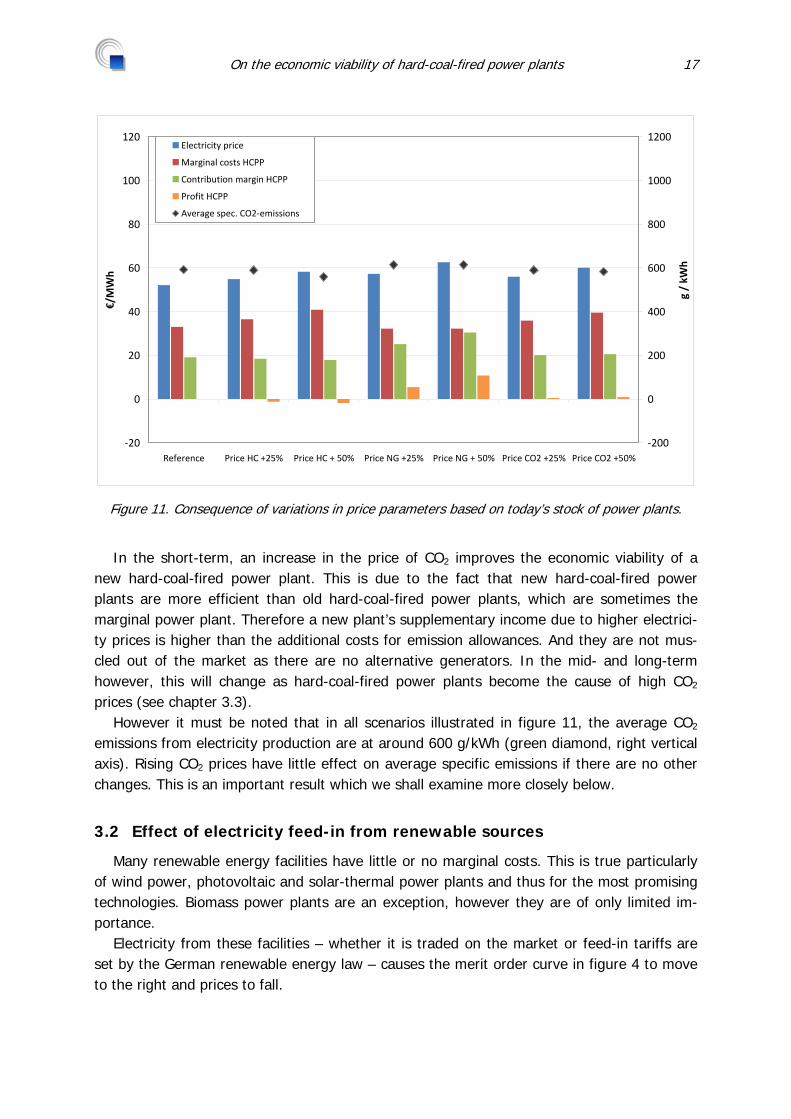
Both preceding illustrations are only snapshots of two typical hours. To get a general
overview, we would have to look at a longer period of time; typically all the hours of one year. This is calculated with the aid of a distribution function for demand derived from the sum of all demand curves. Figure 11 illustrates the results of such a computation. It shows: • the price of electricity (blue) • the marginal costs of a new hard-coal-fired power plant (red) • its contribution margin (=electricity price–marginal costs; green) • its profit (= contribution margin–fixed costs; orange)
For this study, a simplified model of the electricity market was used that takes the most important types of power plants into account. A more exact analysis could be done using a comprehensive model calculation of an electricity market model that includes the entire stock of German power plants and expected changes. However, earlier calculations of this type for other power plants reached similar results, proving that a simplified model is sufficiently re-presentational for the purpose of this analysis (Pehnt et al. 2007).
In the reference case, the planned hard-coal-fired power plant is, as illustrated above, economically viable by a small margin under the postulated conditions. An increase in the price of coal makes it no longer economically viable. An increase in the price of gas greatly improves viability.
On the economic viability of hard-coal-fired power plants 17
‐20
0
20
40
60
80
100
120
Reference Price HC +25% Price HC + 50% Price NG +25% Price NG + 50% Price CO2 +25% Price CO2 +50%
€/MWh
‐200
0
200
400
600
800
1000
1200
g / kW
h
Electricity price
Marginal costs HCPP
Contribution margin HCPP
Profit HCPP
Average spec. CO2‐emissions
Figure 11. Consequence of variations in price parameters based on today’s stock of power plants.
In the short-term, an increase in the price of CO2 improves the economic viability of a
new hard-coal-fired power plant. This is due to the fact that new hard-coal-fired power plants are more efficient than old hard-coal-fired power plants, which are sometimes the marginal power plant. Therefore a new plant’s supplementary income due to higher electrici-ty prices is higher than the additional costs for emission allowances. And they are not mus-cled out of the market as there are no alternative generators. In the mid- and long-term however, this will change as hard-coal-fired power plants become the cause of high CO2
prices (see chapter 3.3). However it must be noted that in all scenarios illustrated in figure 11, the average CO2
emissions from electricity production are at around 600 g/kWh (green diamond, right vertical axis). Rising CO2 prices have little effect on average specific emissions if there are no other changes. This is an important result which we shall examine more closely below.
3.2 Effect of electricity feed-in from renewable sources
Many renewable energy facilities have little or no marginal costs. This is true particularly of wind power, photovoltaic and solar-thermal power plants and thus for the most promising technologies. Biomass power plants are an exception, however they are of only limited im-portance.
Electricity from these facilities – whether it is traded on the market or feed-in tariffs are set by the German renewable energy law – causes the merit order curve in figure 4 to move to the right and prices to fall.
18 On the economic viability of hard-coal-fired power plants
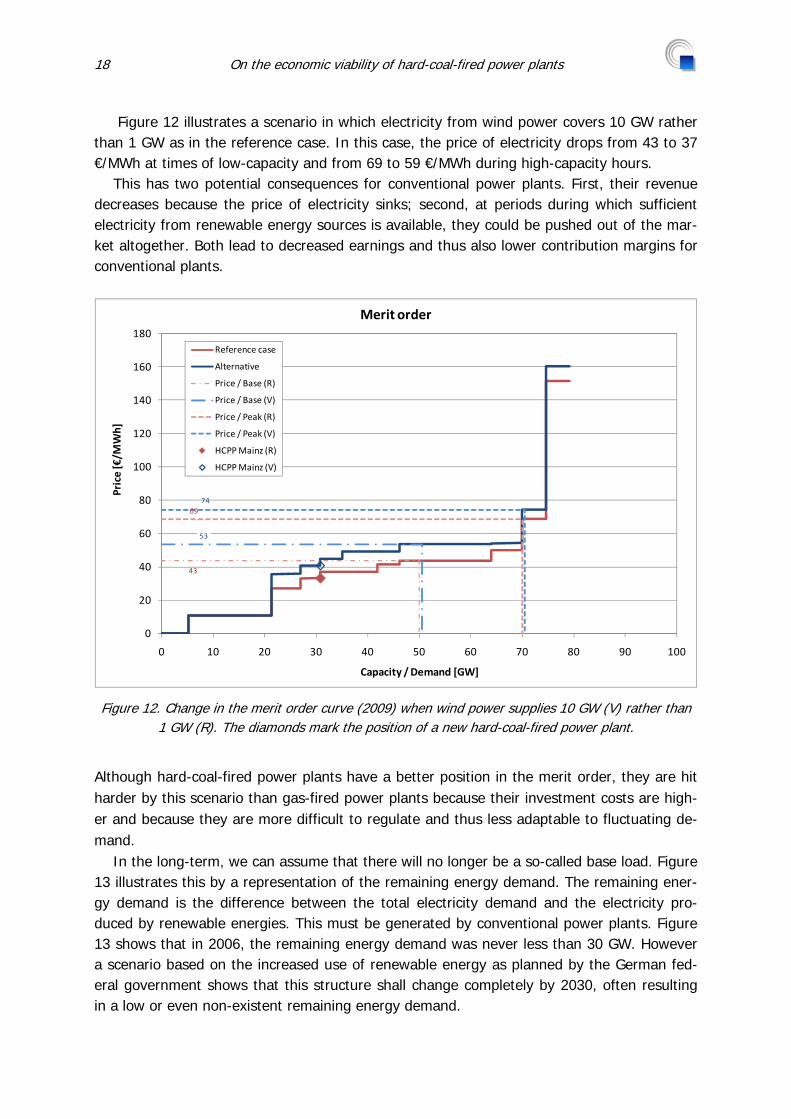
Figure 12 illustrates a scenario in which electricity from wind power covers 10 GW rather than 1 GW as in the reference case. In this case, the price of electricity drops from 43 to 37 €/MWh at times of low-capacity and from 69 to 59 €/MWh during high-capacity hours.
This has two potential consequences for conventional power plants. First, their revenue decreases because the price of electricity sinks; second, at periods during which sufficient electricity from renewable energy sources is available, they could be pushed out of the mar-ket altogether. Both lead to decreased earnings and thus also lower contribution margins for conventional plants.
43
53
6974
0
20
40
60
80
100
120
140
160
180
0 10 20 30 40 50 60 70 80 90 100
Price [€/M
Wh]
Capacity / Demand [GW]
Merit order
Reference case
Alternative
Price / Base (R)
Price / Base (V)
Price / Peak (R)
Price / Peak (V)
HCPP Mainz (R)
HCPP Mainz (V)
Figure 12. Change in the merit order curve (2009) when wind power supplies 10 GW (V) rather than 1 GW (R). The diamonds mark the position of a new hard-coal-fired power plant.
Although hard-coal-fired power plants have a better position in the merit order, they are hit harder by this scenario than gas-fired power plants because their investment costs are high-er and because they are more difficult to regulate and thus less adaptable to fluctuating de-mand.
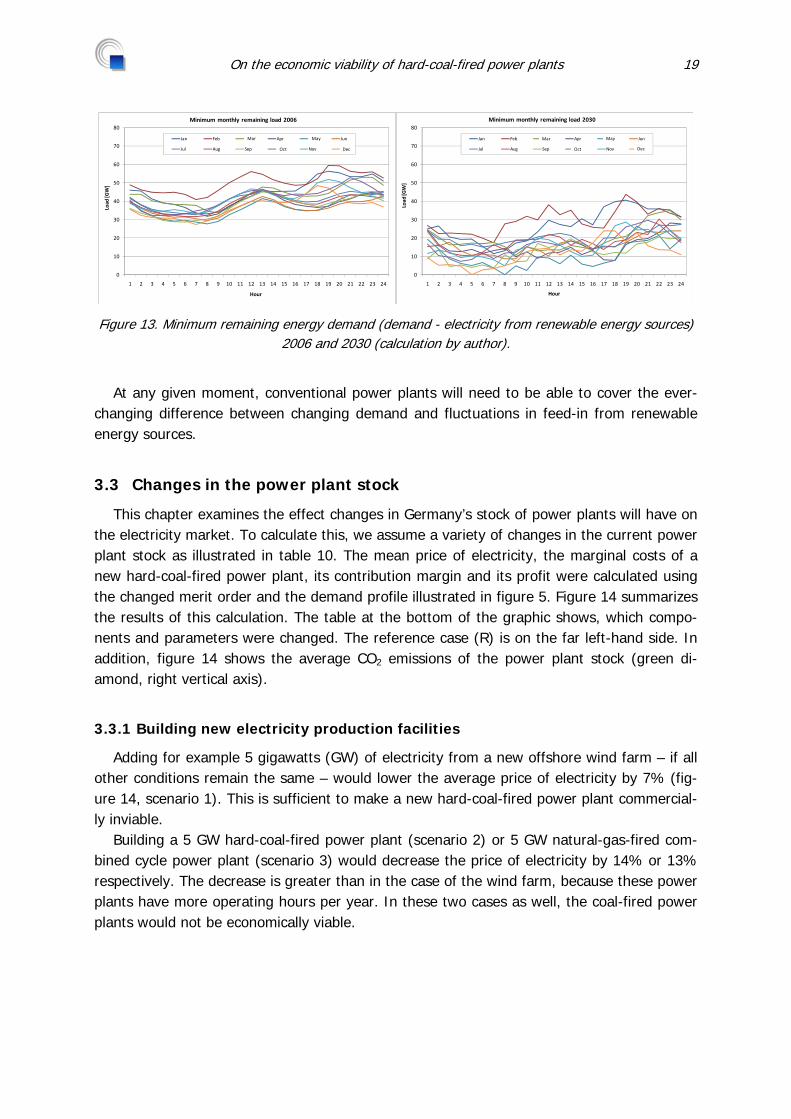
In the long-term, we can assume that there will no longer be a so-called base load. Figure 13 illustrates this by a representation of the remaining energy demand. The remaining ener-gy demand is the difference between the total electricity demand and the electricity pro-duced by renewable energies. This must be generated by conventional power plants. Figure 13 shows that in 2006, the remaining energy demand was never less than 30 GW. However a scenario based on the increased use of renewable energy as planned by the German fed-eral government shows that this structure shall change completely by 2030, often resulting in a low or even non-existent remaining energy demand.
On the economic viability of hard-coal-fired power plants 19
0
10
20
30
40
50
60
70
80
1 2 3 4 5 6 7 8 9 10 11 12 13 14 15 16 17 18 19 20 21 22 23 24
Last [G
W]
Stunde
Minimale monatliche Restlast 2006
Jan Feb Mrz Apr Mai Jun
Jul Aug Sep Okt Nov Dez
Hour
Load
[GW]
Minimum monthly remaining load 2006
May
DecOct
Mar
0
10
20
30
40
50
60
70
80
1 2 3 4 5 6 7 8 9 10 11 12 13 14 15 16 17 18 19 20 21 22 23 24
Last [G
W]
Stunde
Minimale monatliche Restlast 2030
Jan Feb Mrz Apr Mai Jun
Jul Aug Sep Okt Nov Dez
Hour
Load
[GW]
Minimum monthly remaining load 2030
May
DecOct
Mar
Figure 13. Minimum remaining energy demand (demand - electricity from renewable energy sources) 2006 and 2030 (calculation by author).
At any given moment, conventional power plants will need to be able to cover the ever-
changing difference between changing demand and fluctuations in feed-in from renewable energy sources.
3.3 Changes in the power plant stock
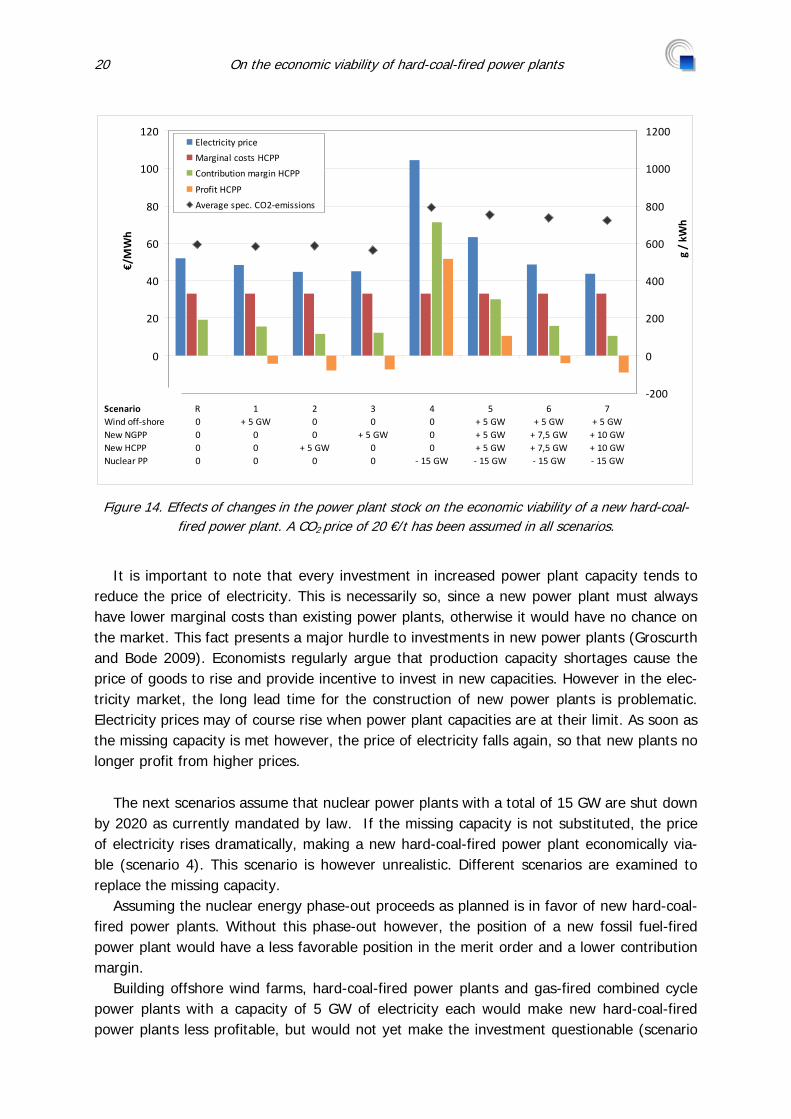
This chapter examines the effect changes in Germany’s stock of power plants will have on the electricity market. To calculate this, we assume a variety of changes in the current power plant stock as illustrated in table 10. The mean price of electricity, the marginal costs of a new hard-coal-fired power plant, its contribution margin and its profit were calculated using the changed merit order and the demand profile illustrated in figure 5. Figure 14 summarizes the results of this calculation. The table at the bottom of the graphic shows, which compo-nents and parameters were changed. The reference case (R) is on the far left-hand side. In addition, figure 14 shows the average CO2 emissions of the power plant stock (green di-amond, right vertical axis).
3.3.1 Building new electricity production facilities
Adding for example 5 gigawatts (GW) of electricity from a new offshore wind farm – if all other conditions remain the same – would lower the average price of electricity by 7% (fig-ure 14, scenario 1). This is sufficient to make a new hard-coal-fired power plant commercial-ly inviable.
Building a 5 GW hard-coal-fired power plant (scenario 2) or 5 GW natural-gas-fired com-bined cycle power plant (scenario 3) would decrease the price of electricity by 14% or 13% respectively. The decrease is greater than in the case of the wind farm, because these power plants have more operating hours per year. In these two cases as well, the coal-fired power plants would not be economically viable.
20 On the economic viability of hard-coal-fired power plants
‐20
0
20
40
60
80
100
120
R0000
1+ 5 GW
000
200
+ 5 GW0
30
+ 5 GW00
4000
‐ 15 GW
5+ 5 GW+ 5 GW+ 5 GW‐ 15 GW
6+ 5 GW+ 7,5 GW+ 7,5 GW‐ 15 GW
7+ 5 GW+ 10 GW+ 10 GW‐ 15 GW
€/MWh
‐200
0
200
400
600
800
1000
1200
g / kW
h
Electricity price
Marginal costs HCPP
Contribution margin HCPP
Profit HCPP
Average spec. CO2‐emissions
ScenarioWind off‐shoreNew NGPPNew HCPPNuclear PP
Figure 14. Effects of changes in the power plant stock on the economic viability of a new hard-coal-fired power plant. A CO2 price of 20 €/t has been assumed in all scenarios.
It is important to note that every investment in increased power plant capacity tends to
reduce the price of electricity. This is necessarily so, since a new power plant must always have lower marginal costs than existing power plants, otherwise it would have no chance on the market. This fact presents a major hurdle to investments in new power plants (Groscurth and Bode 2009). Economists regularly argue that production capacity shortages cause the price of goods to rise and provide incentive to invest in new capacities. However in the elec-tricity market, the long lead time for the construction of new power plants is problematic. Electricity prices may of course rise when power plant capacities are at their limit. As soon as the missing capacity is met however, the price of electricity falls again, so that new plants no longer profit from higher prices.
The next scenarios assume that nuclear power plants with a total of 15 GW are shut down
by 2020 as currently mandated by law. If the missing capacity is not substituted, the price of electricity rises dramatically, making a new hard-coal-fired power plant economically via-ble (scenario 4). This scenario is however unrealistic. Different scenarios are examined to replace the missing capacity.
Assuming the nuclear energy phase-out proceeds as planned is in favor of new hard-coal-fired power plants. Without this phase-out however, the position of a new fossil fuel-fired power plant would have a less favorable position in the merit order and a lower contribution margin.
Building offshore wind farms, hard-coal-fired power plants and gas-fired combined cycle power plants with a capacity of 5 GW of electricity each would make new hard-coal-fired power plants less profitable, but would not yet make the investment questionable (scenario
On the economic viability of hard-coal-fired power plants 21
5). In this case, the price of electricity would be around 60 €/MWh. This value is slightly above the reference case because wind farms, as opposed to nuclear power plants, do not generate constantly.
Newly generating 5 GW of wind power and 7.5 GW from both natural-gas-fired and hard-coal-fired power plants would decrease the price of electricity to around 50 €/MWh (scenario 6). This value is lower than in the reference case because the power no longer generated by nuclear power plants is replaced completely by conventional facilities and additional capacity is available from wind energy. In this scenario, new hard-coal-fired power plants are com-mercially unviable.
If alongside 5 GW of wind energy, hard-coal-fired and gas-fired power plants with a ca-pacity of 10 GW each are built, the price of electricity would fall to around 45 €/MWh, further worsening the situation for new hard-coal-fired power plants (scenario 7).
3.3.2 Effects on the price of CO2
At this point however, another factor is decisive: In all scenarios examined until now, the average specific CO2 emissions remain at 600g/kWh or – in the case of a nuclear energy phase out – even higher. However figure 2 shows that this value must fall to under 500 g/kWh by 2015 and to around 400 g/kWh by 2020 if long-term emission reduction objectives are to be met. Buying additional emission allowances in these dimensions is unrealistic, con-sidering the fact that all other countries would then have to make corresponding reduction commitments.
If CO2 emissions are too high, there will be a significant demand for emission allowances. This will lead to scarcity and thus rising CO2 prices. In the end, CO2 prices will continue to rise until countries remain within their emission budgets. There are only two ways that this can occur. Consumers, due to higher prices, could reduce their demand – whether by invest-ing in more efficient devices or by renouncing certain services. Alternatively, the power plant stock could be changed so that the same amount of electricity is produced with lower emis-sions.
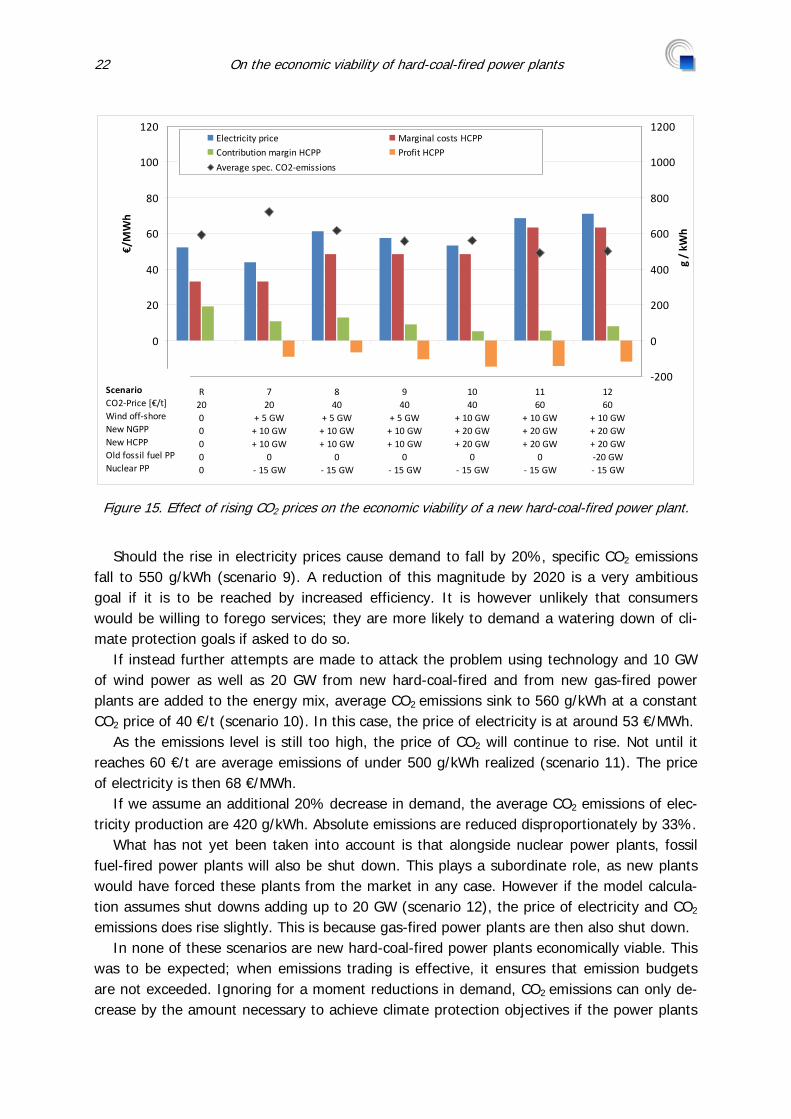
First however, the price of CO2 will rise. There are as yet no sound economic models to determine the interconnection of CO2 emissions and CO2 prices. Since the CO2 market func-tions on an EU – and increasingly on a global – level, the creation of such a model is quite difficult if not impossible. As usual in such cases, plausibility scenarios are then created to determine how the price of CO2 might react to certain emission levels. The results are sum-marized in figure 15.
A rise in the price of CO2 from 20 €/t (as in the reference case) to 40 €/t causes average emissions after the nuclear energy phase-out to fall from a level of 700 g/kWh only to around 600 g/kWh (scenario 8). This is due to changes in the merit order. The price of elec-tricity rises to 60 €/MWh.
22 On the economic viability of hard-coal-fired power plants
‐20
0
20
40
60
80
100
120
R2000000
720
+ 5 GW+ 10 GW+ 10 GW
0‐ 15 GW
840
+ 5 GW+ 10 GW+ 10 GW
0‐ 15 GW
940
+ 5 GW+ 10 GW+ 10 GW
0‐ 15 GW
1040
+ 10 GW+ 20 GW+ 20 GW
0‐ 15 GW
1160
+ 10 GW+ 20 GW+ 20 GW
0‐ 15 GW
1260
+ 10 GW+ 20 GW+ 20 GW‐20 GW‐ 15 GW
€/MWh
‐200
0
200
400
600
800
1000
1200
g / kW
h
Electricity price Marginal costs HCPP
Contribution margin HCPP Profit HCPP
Average spec. CO2‐emissions
ScenarioCO2‐Price [€/t]Wind off‐shoreNew NGPPNew HCPPOld fossil fuel PPNuclear PP
Figure 15. Effect of rising CO2 prices on the economic viability of a new hard-coal-fired power plant.
Should the rise in electricity prices cause demand to fall by 20%, specific CO2 emissions
fall to 550 g/kWh (scenario 9). A reduction of this magnitude by 2020 is a very ambitious goal if it is to be reached by increased efficiency. It is however unlikely that consumers would be willing to forego services; they are more likely to demand a watering down of cli-mate protection goals if asked to do so.
If instead further attempts are made to attack the problem using technology and 10 GW of wind power as well as 20 GW from new hard-coal-fired and from new gas-fired power plants are added to the energy mix, average CO2 emissions sink to 560 g/kWh at a constant CO2 price of 40 €/t (scenario 10). In this case, the price of electricity is at around 53 €/MWh.
As the emissions level is still too high, the price of CO2 will continue to rise. Not until it reaches 60 €/t are average emissions of under 500 g/kWh realized (scenario 11). The price of electricity is then 68 €/MWh.
If we assume an additional 20% decrease in demand, the average CO2 emissions of elec-tricity production are 420 g/kWh. Absolute emissions are reduced disproportionately by 33%.
What has not yet been taken into account is that alongside nuclear power plants, fossil fuel-fired power plants will also be shut down. This plays a subordinate role, as new plants would have forced these plants from the market in any case. However if the model calcula-tion assumes shut downs adding up to 20 GW (scenario 12), the price of electricity and CO2 emissions does rise slightly. This is because gas-fired power plants are then also shut down.
In none of these scenarios are new hard-coal-fired power plants economically viable. This was to be expected; when emissions trading is effective, it ensures that emission budgets are not exceeded. Ignoring for a moment reductions in demand, CO2 emissions can only de-crease by the amount necessary to achieve climate protection objectives if the power plants
On the economic viability of hard-coal-fired power plants 23
with the highest specific emissions are driven from the market. This applies in particular to new hard-coal-fired power plants.
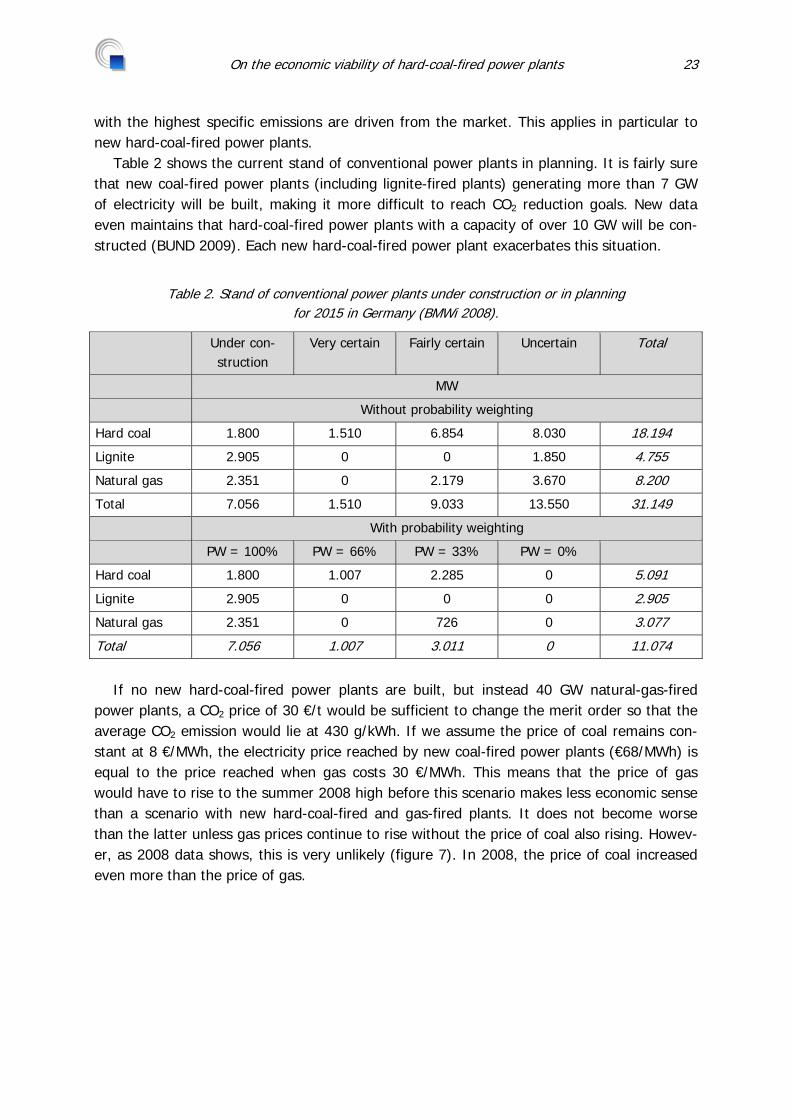
Table 2 shows the current stand of conventional power plants in planning. It is fairly sure that new coal-fired power plants (including lignite-fired plants) generating more than 7 GW of electricity will be built, making it more difficult to reach CO2 reduction goals. New data even maintains that hard-coal-fired power plants with a capacity of over 10 GW will be con-structed (BUND 2009). Each new hard-coal-fired power plant exacerbates this situation.
Table 2. Stand of conventional power plants under construction or in planning for 2015 in Germany (BMWi 2008).
Under con-struction
Very certain Fairly certain Uncertain Total
MW
Without probability weighting
Hard coal 1.800 1.510 6.854 8.030 18.194
Lignite 2.905 0 0 1.850 4.755
Natural gas 2.351 0 2.179 3.670 8.200
Total 7.056 1.510 9.033 13.550 31.149
With probability weighting
PW = 100% PW = 66% PW = 33% PW = 0%
Hard coal 1.800 1.007 2.285 0 5.091
Lignite 2.905 0 0 0 2.905
Natural gas 2.351 0 726 0 3.077
Total 7.056 1.007 3.011 0 11.074
If no new hard-coal-fired power plants are built, but instead 40 GW natural-gas-fired
power plants, a CO2 price of 30 €/t would be sufficient to change the merit order so that the average CO2 emission would lie at 430 g/kWh. If we assume the price of coal remains con-stant at 8 €/MWh, the electricity price reached by new coal-fired power plants (€68/MWh) is equal to the price reached when gas costs 30 €/MWh. This means that the price of gas would have to rise to the summer 2008 high before this scenario makes less economic sense than a scenario with new hard-coal-fired and gas-fired plants. It does not become worse than the latter unless gas prices continue to rise without the price of coal also rising. Howev-er, as 2008 data shows, this is very unlikely (figure 7). In 2008, the price of coal increased even more than the price of gas.
24 On the economic viability of hard-coal-fired power plants
3.4 General conclusions
All in all, investors face a dilemma. On the one hand, we need new power plants. On the other hand, the current rules of the market provide little incentive for investments in new facilities. The situation is made more difficult by the increased use of renewables and climate policy objectives.
To achieve long-term climate protection goals, long-term changes in the stock of Germa-ny’s power plants are necessary. Replacing existing fossil-fuel-fired power plants with new, more efficient plants of the same type is insufficient. To the contrary, this makes achieving the necessary long-term reduction of CO2 emissions more difficult, if not impossible.
A reduction in demand can make an important contribution. To date however, reduction objectives by increasing efficiency lie only at 13%. Potentially, increased efficiency could lead to a reduction of at least 30%. This does not however consider quantity effects which could increase the demand for electricity. Increased efficiency alone will not be enough to reach climate protection objectives. A contribution by decreased demand can be forced by very steep increases in electricity prices. However the concurrent economic and social conse-quences make the political feasibility and acceptability of this strategy questionable.
Building new hard-coal-fired power plants today will in the near future force society to choose either to close these plants prematurely, causing considerable economic losses, or to abandon climate protection goals. It is already foreseeable that the companies affected will lobby intensively for their facilities.
Building hard-coal-fired power plants leads to rising CO2 prices and thus also to higher prices for electricity. Hard-coal-fired power plants thus do not guarantee consumers afforda-ble electricity prices long-term, but rather lead to considerable additional economic risks.
However since there are also no incentives for the construction of gas-fired power plants, it must be asked whether the liberalized market can provide a solution at all or whether an integrated concept for electricity production in Germany or even Europe is not necessary.
On the economic viability of hard-coal-fired power plants 25
4 THE PLANNED HARD-COAL-FIRED POWER PLANT IN MAINZ
4.1 Electricity production costs
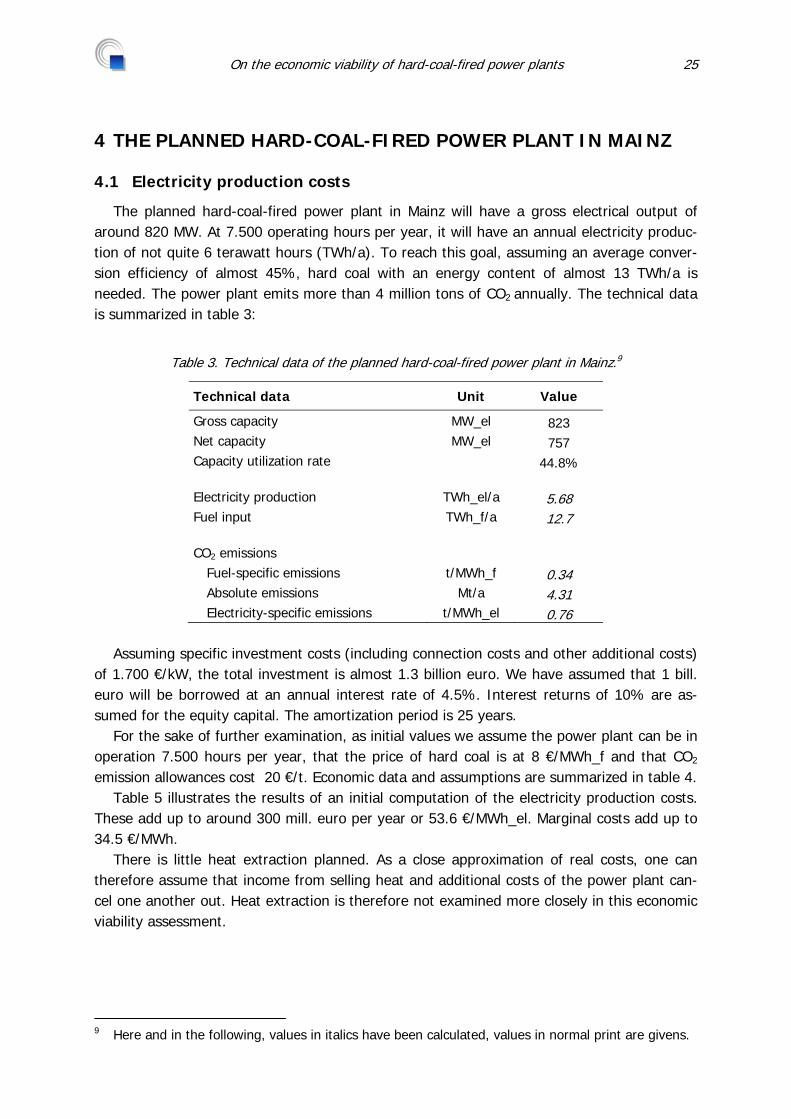
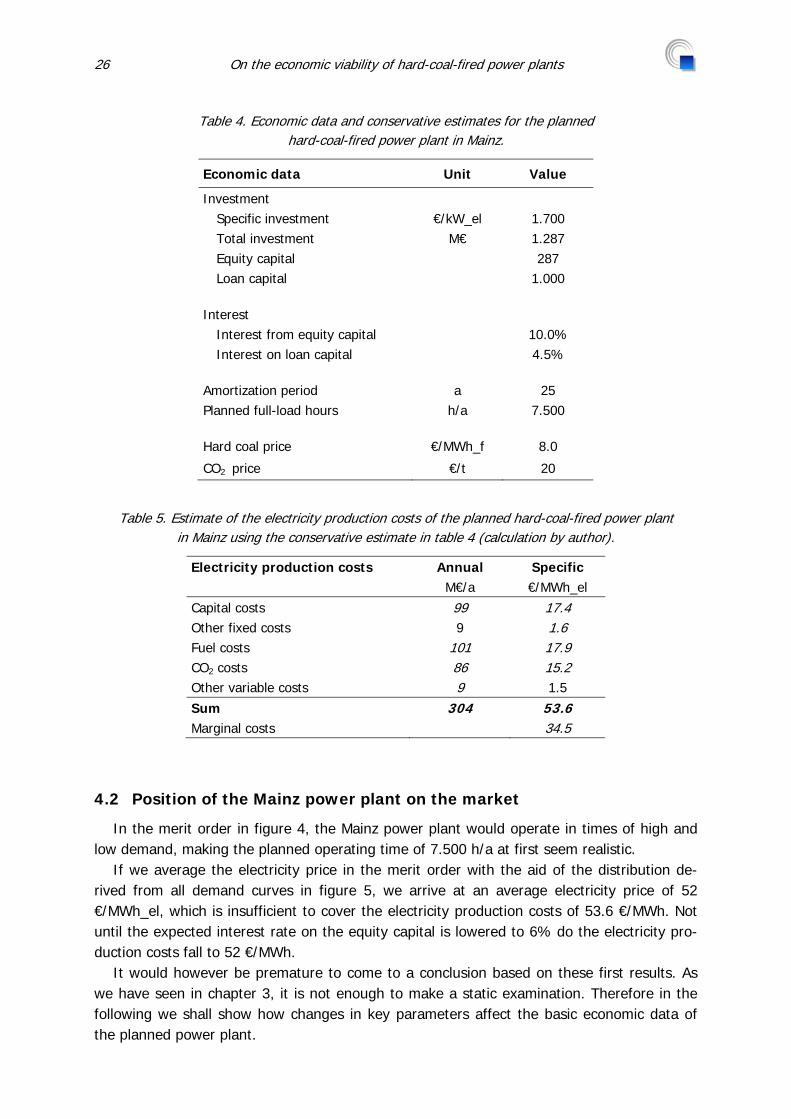
The planned hard-coal-fired power plant in Mainz will have a gross electrical output of around 820 MW. At 7.500 operating hours per year, it will have an annual electricity produc-tion of not quite 6 terawatt hours (TWh/a). To reach this goal, assuming an average conver-sion efficiency of almost 45%, hard coal with an energy content of almost 13 TWh/a is needed. The power plant emits more than 4 million tons of CO2 annually. The technical data is summarized in table 3:
Table 3. Technical data of the planned hard-coal-fired power plant in Mainz.9
Technical data Unit Value
Gross capacity MW_el 823 Net capacity MW_el 757 Capacity utilization rate 44.8% Electricity production TWh_el/a 5.68 Fuel input TWh_f/a 12.7 CO2 emissions
Fuel-specific emissions t/MWh_f 0.34 Absolute emissions Mt/a 4.31 Electricity-specific emissions t/MWh_el 0.76
Assuming specific investment costs (including connection costs and other additional costs)
of 1.700 €/kW, the total investment is almost 1.3 billion euro. We have assumed that 1 bill. euro will be borrowed at an annual interest rate of 4.5%. Interest returns of 10% are as-sumed for the equity capital. The amortization period is 25 years.
For the sake of further examination, as initial values we assume the power plant can be in operation 7.500 hours per year, that the price of hard coal is at 8 €/MWh_f and that CO2 emission allowances cost 20 €/t. Economic data and assumptions are summarized in table 4.
Table 5 illustrates the results of an initial computation of the electricity production costs. These add up to around 300 mill. euro per year or 53.6 €/MWh_el. Marginal costs add up to 34.5 €/MWh.
There is little heat extraction planned. As a close approximation of real costs, one can therefore assume that income from selling heat and additional costs of the power plant can-cel one another out. Heat extraction is therefore not examined more closely in this economic viability assessment.
9 Here and in the following, values in italics have been calculated, values in normal print are givens.
26 On the economic viability of hard-coal-fired power plants
Table 4. Economic data and conservative estimates for the planned hard-coal-fired power plant in Mainz.
Economic data Unit Value
Investment Specific investment €/kW_el 1.700 Total investment M€ 1.287 Equity capital 287 Loan capital 1.000
Interest
Interest from equity capital 10.0% Interest on loan capital 4.5%
Amortization period a 25 Planned full-load hours h/a 7.500 Hard coal price €/MWh_f 8.0
CO2 price €/t 20
Table 5. Estimate of the electricity production costs of the planned hard-coal-fired power plant in Mainz using the conservative estimate in table 4 (calculation by author).
Electricity production costs Annual Specific M€/a €/MWh_el Capital costs 99 17.4 Other fixed costs 9 1.6 Fuel costs 101 17.9 CO2 costs 86 15.2 Other variable costs 9 1.5 Sum 304 53.6 Marginal costs 34.5
4.2 Position of the Mainz power plant on the market
In the merit order in figure 4, the Mainz power plant would operate in times of high and low demand, making the planned operating time of 7.500 h/a at first seem realistic.
If we average the electricity price in the merit order with the aid of the distribution de-rived from all demand curves in figure 5, we arrive at an average electricity price of 52 €/MWh_el, which is insufficient to cover the electricity production costs of 53.6 €/MWh. Not until the expected interest rate on the equity capital is lowered to 6% do the electricity pro-duction costs fall to 52 €/MWh.
It would however be premature to come to a conclusion based on these first results. As we have seen in chapter 3, it is not enough to make a static examination. Therefore in the following we shall show how changes in key parameters affect the basic economic data of the planned power plant.
On the economic viability of hard-coal-fired power plants 27
0
10
20
30
40
50
60
70
80
90
7 8 9 10 11 12 13 14 15
Variable ope
rating
costs = marginal costs [€/M
Wh_el]
Price hard coal [€/MWh_f]
10 20 30 40 50 60
CO2 Price
Assumptions made so far
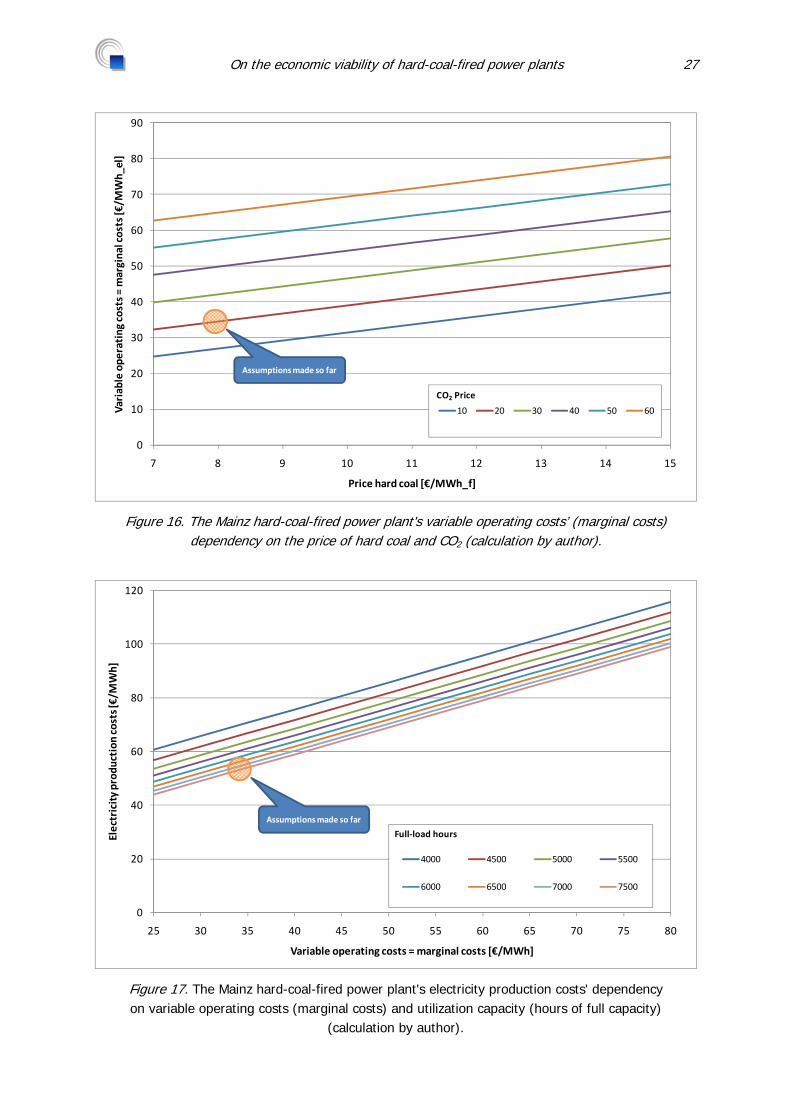
Figure 16. The Mainz hard-coal-fired power plant's variable operating costs’ (marginal costs) dependency on the price of hard coal and CO2 (calculation by author).
0
20
40
60
80
100
120
25 30 35 40 45 50 55 60 65 70 75 80
Electricity prod
uction
costs [€/M
Wh]
Variable operating costs = marginal costs [€/MWh]
4000 4500 5000 5500
6000 6500 7000 7500
Full‐load hours
Assumptionsmade so far
Figure 17. The Mainz hard-coal-fired power plant's electricity production costs' dependency on variable operating costs (marginal costs) and utilization capacity (hours of full capacity)
(calculation by author).
28 On the economic viability of hard-coal-fired power plants
4.3 Kraftwerke Mainz-Wiesbaden AG’s record
Occasionally the argument has been made that the Mainz hard-coal-fired power plant is needed to secure supply in the region. To this it must be said that a regional view of the power supply situation is inappropriate in a liberalized electricity market. Crucial rather are the capacity available on the German market and the existing grid capacity. In light of the long-term requirements of sustainable, environmentally sound electricity production, extend-ing the grid should be given priority over local conventional power plants.
Furthermore, Kraftwerke Mainz-Wiesbaden AG owns one of the most modern gas-fired power plants in Germany. They have however stated that this plant needs to be shut down when the present gas supply contract ends in 2014, because no more gas can be procured. If this were a true supply problem, the federal government would have to attend to it imme-diately. However, great efforts are already being made to build new pipelines to ensure Germany’s gas supply. If it is only a price problem, it should be remembered that higher gas prices lead directly to higher spot market prices for electricity. The existing gas-fired power plant, which has a better merit order position than other gas-fired power plants, will profit from this price raise. A contribution margin most definitely exists, because it is more efficient than the gas-fired power plant that acts as the marginal power plant. From a commercial point of view, it therefore makes no sense to shut the plant down.
4.4 Consequences for the planned hard-coal-fired power plant in Mainz
Figure 16 shows the dependency of the variable operating costs or marginal costs on the price of hard coal and of CO2. Figure 17 illustrates the dependency of all electricity produc-tion costs on the marginal costs and the power plant’s capacity utilization. From both figures one can see that the assumptions made until now are on the optimistic end of possible pa-rameter values. However the observations made in chapter 3 revealed a variety of risks faced by new hard-coal-fired power plants: • If more power plant capacity is created than is taken off the grid, the price of electricity
sinks to the extent that new power plants no longer generate a sufficient contribution margin.
• If the nuclear energy phase-out is rescinded, new conventional power plants will have a less advantageous position in the merit order and less operating hours.
• The increase of electricity production from renewable energy sources with zero marginal costs will result in ever more hours at very low spot market prices in the not too distant future, which will have a large effect on revenues. As figure 13 shows, the structure of the demand profile conventional power plants will need to meet shall change drastically in the near future. This will lead to less annual operating hours for conventional plants. Fur-thermore, this requires that these facilities be highly controllable. Gas-fired power plants are better equipped to deal with both these parameters than are hard-coal-fired power plants.
• Investors in new hard-coal-fired power plants also need to know that emissions trading could in the mid-term make their facilities uneconomical.
On the economic viability of hard-coal-fired power plants 29
All of these points burden hard-coal-fired power plants’ revenue side. On the expense side, we can expect both rising CO2 prices and rising prices for hard coal. When the current economic crisis is resolved and the demand for gas and oil rises and with it their prices, a similar development can be expected for hard coal. This was shown during the sharp rise in fuel prices in the course of 2008.
Since the power plant is at the margin of economic viability even under optimistic para-meters (figures 16 and 17) each worsening of these parameters represents a serious risk for investors. The economic consequences of an increase of power plant capacity and a rise in the price of CO2 can be seen in figure 14 and figure 15. In none of the realistic scenarios are new hard-coal-fired power plants economically viable.
Weighing chances and risks, taking economic considerations and climate policy into ac-
count, we advise in particular public investors not to build hard-coal-fired power plants.
30 On the economic viability of hard-coal-fired power plants
APPENDIX
Reference case data
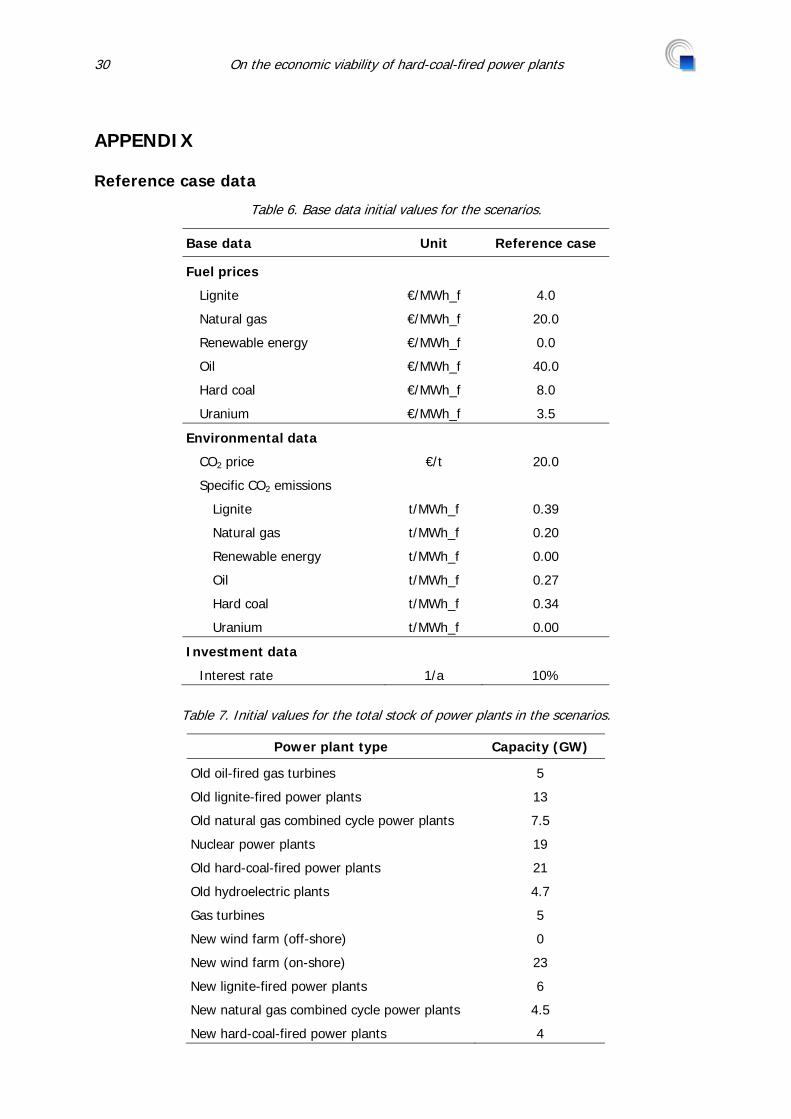
Table 6. Base data initial values for the scenarios.
Base data Unit Reference case
Fuel prices
Lignite €/MWh_f 4.0
Natural gas €/MWh_f 20.0
Renewable energy €/MWh_f 0.0
Oil €/MWh_f 40.0
Hard coal €/MWh_f 8.0
Uranium €/MWh_f 3.5
Environmental data
CO2 price €/t 20.0
Specific CO2 emissions
Lignite t/MWh_f 0.39
Natural gas t/MWh_f 0.20
Renewable energy t/MWh_f 0.00
Oil t/MWh_f 0.27
Hard coal t/MWh_f 0.34
Uranium t/MWh_f 0.00
Investment data
Interest rate 1/a 10%
Table 7. Initial values for the total stock of power plants in the scenarios.
Power plant type Capacity (GW)
Old oil-fired gas turbines 5
Old lignite-fired power plants 13
Old natural gas combined cycle power plants 7.5
Nuclear power plants 19
Old hard-coal-fired power plants 21
Old hydroelectric plants 4.7
Gas turbines 5
New wind farm (off-shore) 0
New wind farm (on-shore) 23
New lignite-fired power plants 6
New natural gas combined cycle power plants 4.5
New hard-coal-fired power plants 4
On the economic viability of hard-coal-fired power plants 31
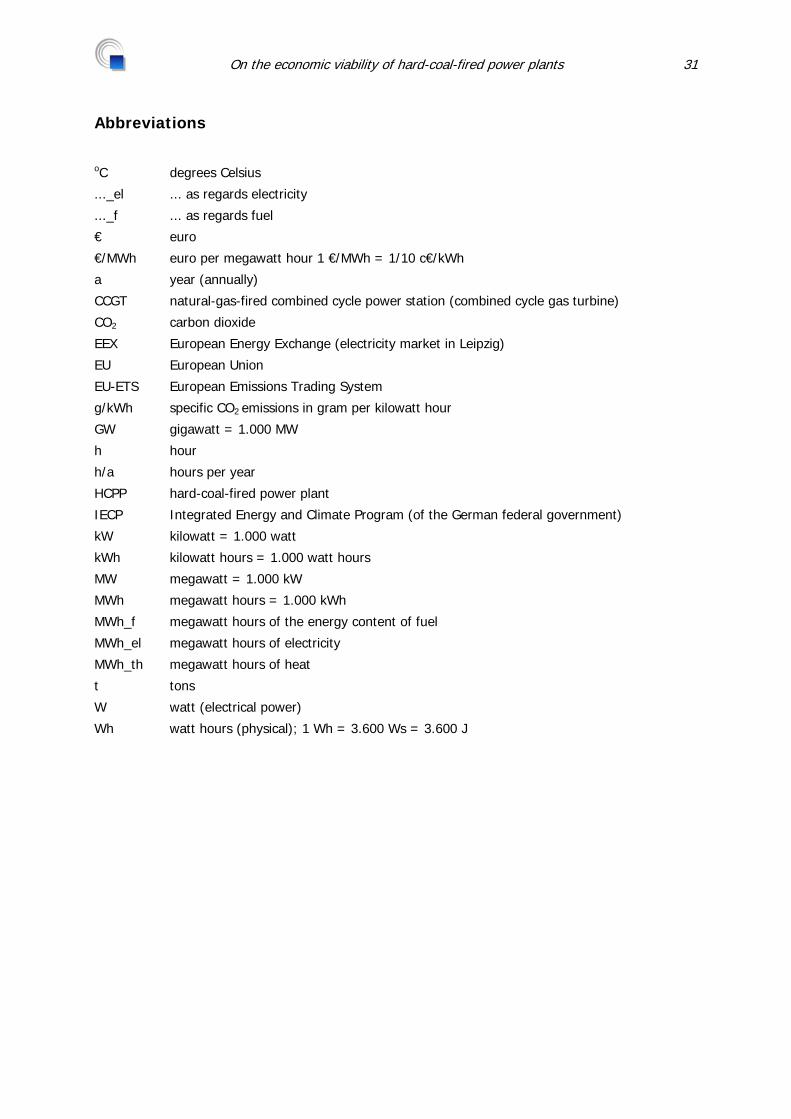
Abbreviations
oC degrees Celsius
..._el ... as regards electricity
..._f ... as regards fuel
€ euro
€/MWh euro per megawatt hour 1 €/MWh = 1/10 c€/kWh
a year (annually)
CCGT natural-gas-fired combined cycle power station (combined cycle gas turbine)
CO2 carbon dioxide
EEX European Energy Exchange (electricity market in Leipzig)
EU European Union
EU-ETS European Emissions Trading System
g/kWh specific CO2 emissions in gram per kilowatt hour
GW gigawatt = 1.000 MW
h hour
h/a hours per year
HCPP hard-coal-fired power plant
IECP Integrated Energy and Climate Program (of the German federal government)
kW kilowatt = 1.000 watt
kWh kilowatt hours = 1.000 watt hours
MW megawatt = 1.000 kW
MWh megawatt hours = 1.000 kWh
MWh_f megawatt hours of the energy content of fuel
MWh_el megawatt hours of electricity
MWh_th megawatt hours of heat
t tons
W watt (electrical power)
Wh watt hours (physical); 1 Wh = 3.600 Ws = 3.600 J
32 On the economic viability of hard-coal-fired power plants
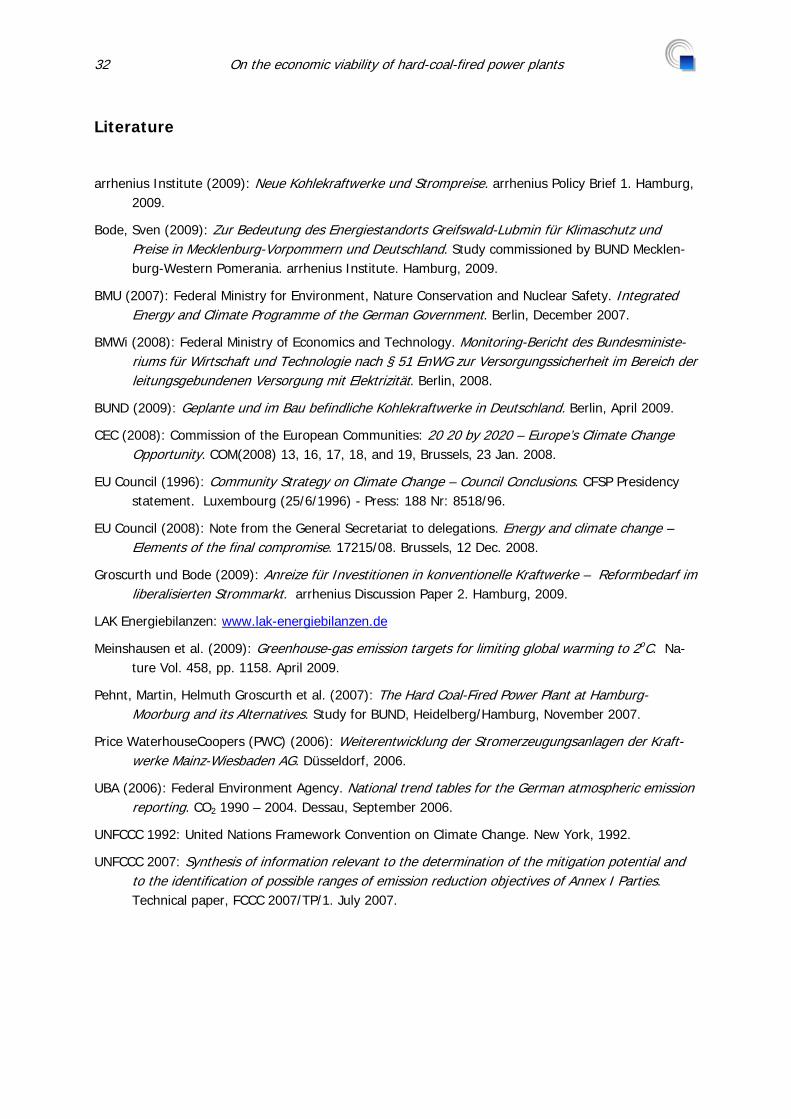
Literature
arrhenius Institute (2009): Neue Kohlekraftwerke und Strompreise. arrhenius Policy Brief 1. Hamburg, 2009.
Bode, Sven (2009): Zur Bedeutung des Energiestandorts Greifswald-Lubmin für Klimaschutz und Preise in Mecklenburg-Vorpommern und Deutschland. Study commissioned by BUND Mecklen-burg-Western Pomerania. arrhenius Institute. Hamburg, 2009.
BMU (2007): Federal Ministry for Environment, Nature Conservation and Nuclear Safety. Integrated Energy and Climate Programme of the German Government. Berlin, December 2007.
BMWi (2008): Federal Ministry of Economics and Technology. Monitoring-Bericht des Bundesministe-riums für Wirtschaft und Technologie nach § 51 EnWG zur Versorgungssicherheit im Bereich der leitungsgebundenen Versorgung mit Elektrizität. Berlin, 2008.
BUND (2009): Geplante und im Bau befindliche Kohlekraftwerke in Deutschland. Berlin, April 2009.
CEC (2008): Commission of the European Communities: 20 20 by 2020 – Europe’s Climate Change Opportunity. COM(2008) 13, 16, 17, 18, and 19, Brussels, 23 Jan. 2008.
EU Council (1996): Community Strategy on Climate Change – Council Conclusions. CFSP Presidency statement. Luxembourg (25/6/1996) - Press: 188 Nr: 8518/96.
EU Council (2008): Note from the General Secretariat to delegations. Energy and climate change – Elements of the final compromise. 17215/08. Brussels, 12 Dec. 2008.
Groscurth und Bode (2009): Anreize für Investitionen in konventionelle Kraftwerke – Reformbedarf im liberalisierten Strommarkt. arrhenius Discussion Paper 2. Hamburg, 2009.
LAK Energiebilanzen: www.lak-energiebilanzen.de
Meinshausen et al. (2009): Greenhouse-gas emission targets for limiting global warming to 2oC. Na-ture Vol. 458, pp. 1158. April 2009.
Pehnt, Martin, Helmuth Groscurth et al. (2007): The Hard Coal-Fired Power Plant at Hamburg-Moorburg and its Alternatives. Study for BUND, Heidelberg/Hamburg, November 2007.
Price WaterhouseCoopers (PWC) (2006): Weiterentwicklung der Stromerzeugungsanlagen der Kraft-werke Mainz-Wiesbaden AG. Düsseldorf, 2006.
UBA (2006): Federal Environment Agency. National trend tables for the German atmospheric emission reporting. CO2 1990 – 2004. Dessau, September 2006.
UNFCCC 1992: United Nations Framework Convention on Climate Change. New York, 1992.
UNFCCC 2007: Synthesis of information relevant to the determination of the mitigation potential and to the identification of possible ranges of emission reduction objectives of Annex I Parties. Technical paper, FCCC 2007/TP/1. July 2007.
On the economic viability of hard-coal-fired power plants 33
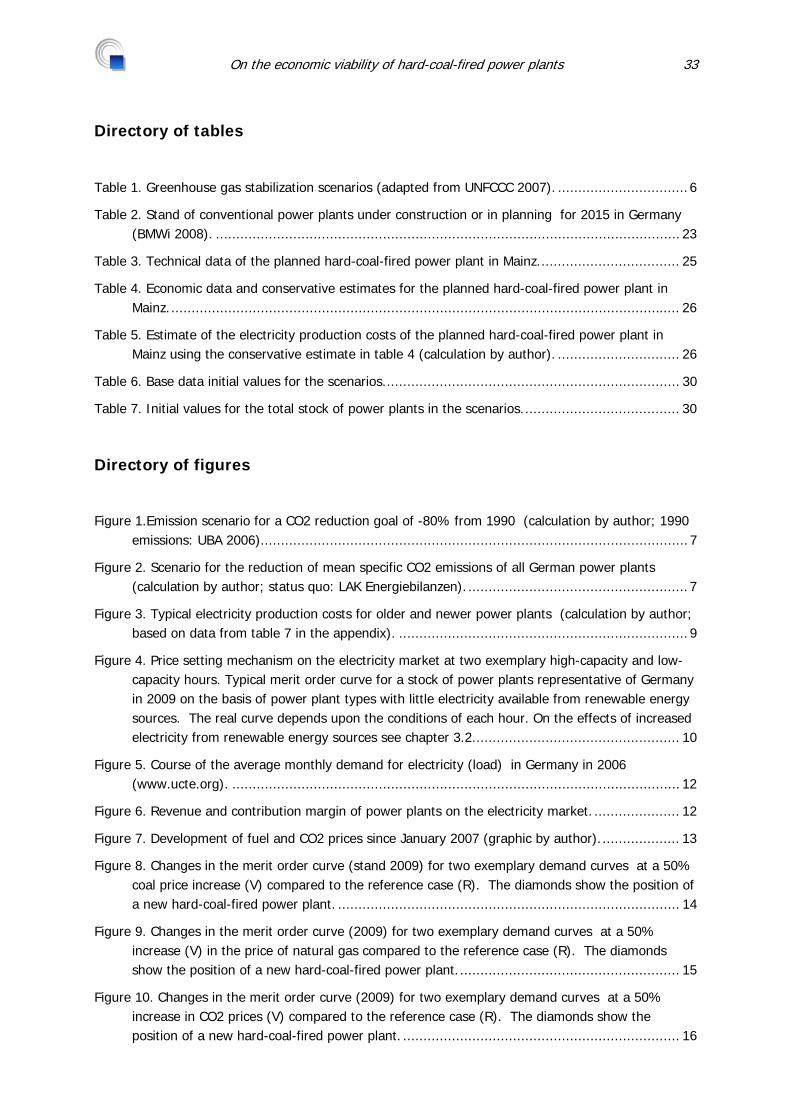
Directory of tables
Table 1. Greenhouse gas stabilization scenarios (adapted from UNFCCC 2007). ................................ 6
Table 2. Stand of conventional power plants under construction or in planning for 2015 in Germany (BMWi 2008). .................................................................................................................. 23
Table 3. Technical data of the planned hard-coal-fired power plant in Mainz. .................................. 25
Table 4. Economic data and conservative estimates for the planned hard-coal-fired power plant in Mainz. ............................................................................................................................. 26
Table 5. Estimate of the electricity production costs of the planned hard-coal-fired power plant in Mainz using the conservative estimate in table 4 (calculation by author). .............................. 26
Table 6. Base data initial values for the scenarios. ........................................................................ 30
Table 7. Initial values for the total stock of power plants in the scenarios. ...................................... 30
Directory of figures
Figure 1.Emission scenario for a CO2 reduction goal of -80% from 1990 (calculation by author; 1990 emissions: UBA 2006). ........................................................................................................ 7
Figure 2. Scenario for the reduction of mean specific CO2 emissions of all German power plants (calculation by author; status quo: LAK Energiebilanzen). ...................................................... 7
Figure 3. Typical electricity production costs for older and newer power plants (calculation by author; based on data from table 7 in the appendix). ....................................................................... 9
Figure 4. Price setting mechanism on the electricity market at two exemplary high-capacity and low-capacity hours. Typical merit order curve for a stock of power plants representative of Germany in 2009 on the basis of power plant types with little electricity available from renewable energy sources. The real curve depends upon the conditions of each hour. On the effects of increased electricity from renewable energy sources see chapter 3.2. .................................................. 10
Figure 5. Course of the average monthly demand for electricity (load) in Germany in 2006 (www.ucte.org). .............................................................................................................. 12
Figure 6. Revenue and contribution margin of power plants on the electricity market. ..................... 12
Figure 7. Development of fuel and CO2 prices since January 2007 (graphic by author). ................... 13
Figure 8. Changes in the merit order curve (stand 2009) for two exemplary demand curves at a 50% coal price increase (V) compared to the reference case (R). The diamonds show the position of a new hard-coal-fired power plant. .................................................................................... 14
Figure 9. Changes in the merit order curve (2009) for two exemplary demand curves at a 50% increase (V) in the price of natural gas compared to the reference case (R). The diamonds show the position of a new hard-coal-fired power plant. ...................................................... 15
Figure 10. Changes in the merit order curve (2009) for two exemplary demand curves at a 50% increase in CO2 prices (V) compared to the reference case (R). The diamonds show the position of a new hard-coal-fired power plant. .................................................................... 16
34 On the economic viability of hard-coal-fired power plants
Figure 11. Consequence of variations in price parameters based on today’s stock of power plants. ... 17
Figure 12. Change in the merit order curve (2009) when wind power supplies 10 GW (V) rather than 1 GW (R). The diamonds mark the position of a new hard-coal-fired power plant. ................. 18
Figure 13. Minimum remaining energy demand (demand - electricity from renewable energy sources) 2006 and 2030 (calculation by author). .............................................................................. 19
Figure 14. Effects of changes in the power plant stock on the economic viability of a new hard-coal-fired power plant. A CO2 price of 20 €/t has been assumed in all scenarios. .......................... 20
Figure 15. Effect of rising CO2 prices on the economic viability of a new hard-coal-fired power plant.22
Figure 16. The Mainz hard-coal-fired power plant's variable operating costs’ (marginal costs) dependency on the price of hard coal and CO2 (calculation by author). ................................ 27
Figure 17. The Mainz hard-coal-fired power plant's electricity production costs' dependency on variable operating costs (marginal costs) and utilization capacity (hours of full capacity) (calculation by author). .................................................................................................... 27