the economics and demographics that drive the us beer industry · sales to retailers by week. ......
TRANSCRIPT
Data that Drives the US Beer Industry
Lester Jones, Chief EconomistNational Beer Wholesalers Association
[email protected] @joneslester
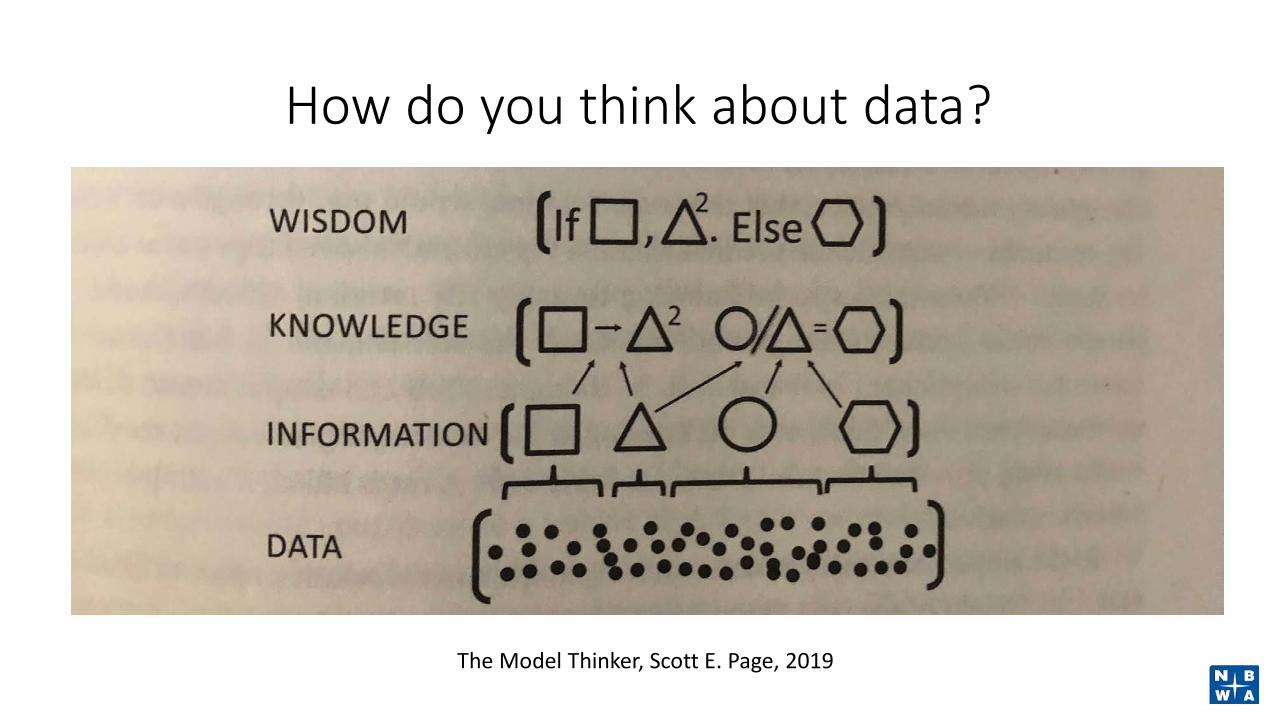
How do you think about data?
The Model Thinker, Scott E. Page, 2019

NBWA Data and Reports

Beer Purchasers’ IndexAll Segments for Feb 2017 vs Feb 2019
49
70
56
34
24
33
51
32
61 6255
43
34 36
71
52
-
10
20
30
40
50
60
70
80
90
100
Total Imports Craft Premium Lights PremiumRegular
BelowPremium
FMB Cider
Feb 2018 Feb 2019Source NBWA, Jan 2019.
An index of 50+ in a segment means volumes in that segment are expanding and an index below 50 indicates that volumes in that segment are contracting.
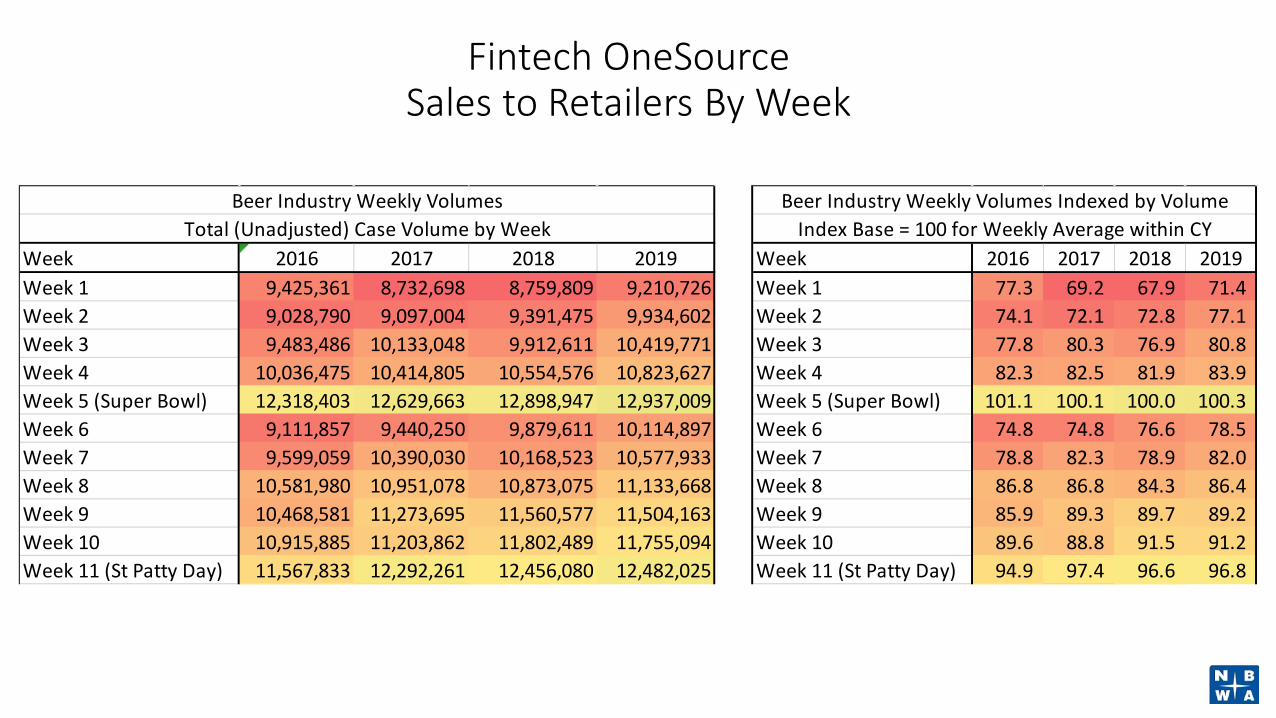
Fintech OneSourceSales to Retailers By Week
Week 2016 2017 2018 2019 Week 2016 2017 2018 2019Week 1 9,425,361 8,732,698 8,759,809 9,210,726 Week 1 77.3 69.2 67.9 71.4 Week 2 9,028,790 9,097,004 9,391,475 9,934,602 Week 2 74.1 72.1 72.8 77.1 Week 3 9,483,486 10,133,048 9,912,611 10,419,771 Week 3 77.8 80.3 76.9 80.8 Week 4 10,036,475 10,414,805 10,554,576 10,823,627 Week 4 82.3 82.5 81.9 83.9 Week 5 (Super Bowl) 12,318,403 12,629,663 12,898,947 12,937,009 Week 5 (Super Bowl) 101.1 100.1 100.0 100.3 Week 6 9,111,857 9,440,250 9,879,611 10,114,897 Week 6 74.8 74.8 76.6 78.5 Week 7 9,599,059 10,390,030 10,168,523 10,577,933 Week 7 78.8 82.3 78.9 82.0 Week 8 10,581,980 10,951,078 10,873,075 11,133,668 Week 8 86.8 86.8 84.3 86.4 Week 9 10,468,581 11,273,695 11,560,577 11,504,163 Week 9 85.9 89.3 89.7 89.2 Week 10 10,915,885 11,203,862 11,802,489 11,755,094 Week 10 89.6 88.8 91.5 91.2 Week 11 (St Patty Day) 11,567,833 12,292,261 12,456,080 12,482,025 Week 11 (St Patty Day) 94.9 97.4 96.6 96.8
Beer Industry Weekly VolumesTotal (Unadjusted) Case Volume by Week
Beer Industry Weekly Volumes Indexed by VolumeIndex Base = 100 for Weekly Average within CY

Fintech OneSourceSales to Retailers By Week in 2018
56789
1011121314151617181920
1 2 3 4 5 6 7 8 9 10 11 12 13 14 15 16 17 18 19 20 21 22 23 24 25 26 27 28 29 30 31 32 33 34 35 36 37 38 39 40 41 42 43 44 45 46 47 48 49 50 51 52
Mill
ions
of C
ases
Per
Wee
k
Weeks of 2018
LaborDay
Fourth of July
MemorialDay
Super Bowl
St Patty, NCAA and Cinco Thanksgiving
Winter Holidays
Fintech InfoSource™ single source database of aggregated sales-to-retailer transactions for both the Off-Premise and On-Premise Channels. Covers over 130,000 chain and independent retail accounts with over $27 billion in alcohol purchase transactions and 670 million cases in 2018. Also covers 3,600 distributors of which 650 are self distributing brewers.
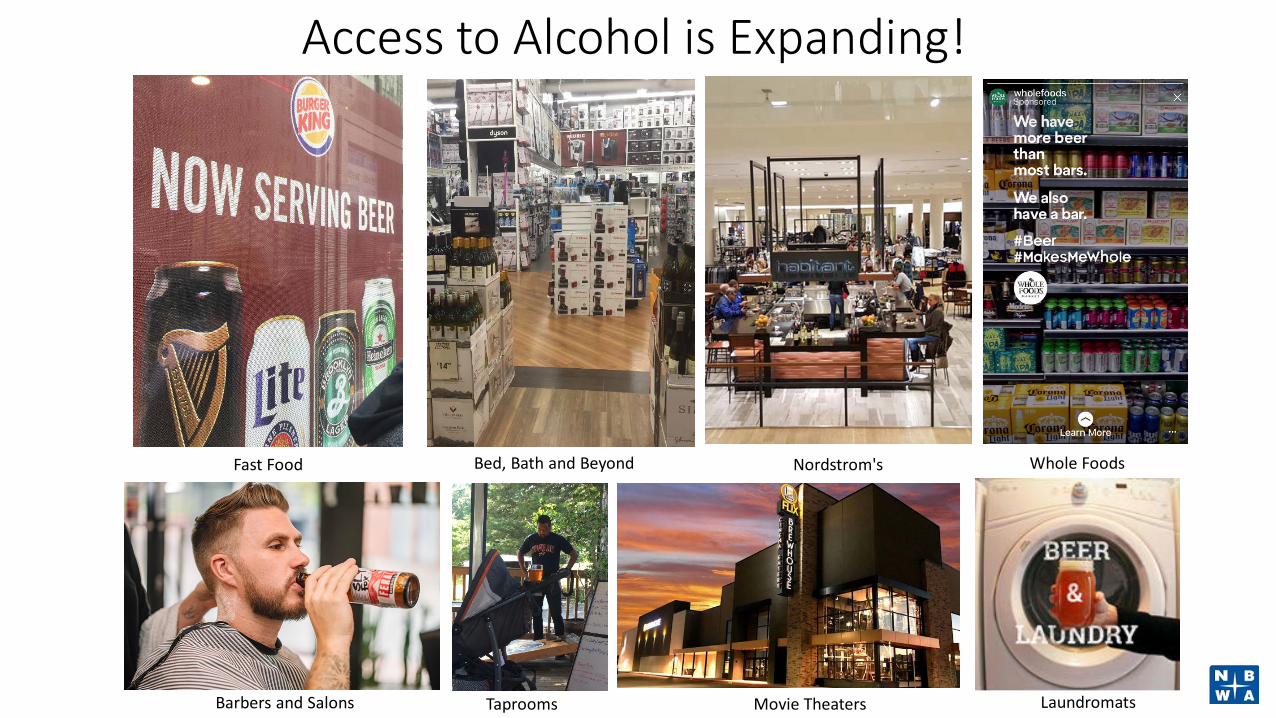
Access to Alcohol is Expanding!
Fast Food Nordstrom'sBed, Bath and Beyond
Barbers and Salons Taprooms Movie Theaters
Whole Foods
Laundromats

Even at The Library…

Total U.S. Retail Establishments Selling Alcohol 2008 to 2018
531,705 536,807553,458
571,290585,690
602,757 610,299625,276 631,699
644,647 644,939
400,000
450,000
500,000
550,000
600,000
650,000
700,000
2008 2009 2010 2011 2012 2013 2014 2015 2016 2017 2018
Source: TDLinx Account Tracker Report: Beer, Wine or Spirit Selling Accounts, 2018.
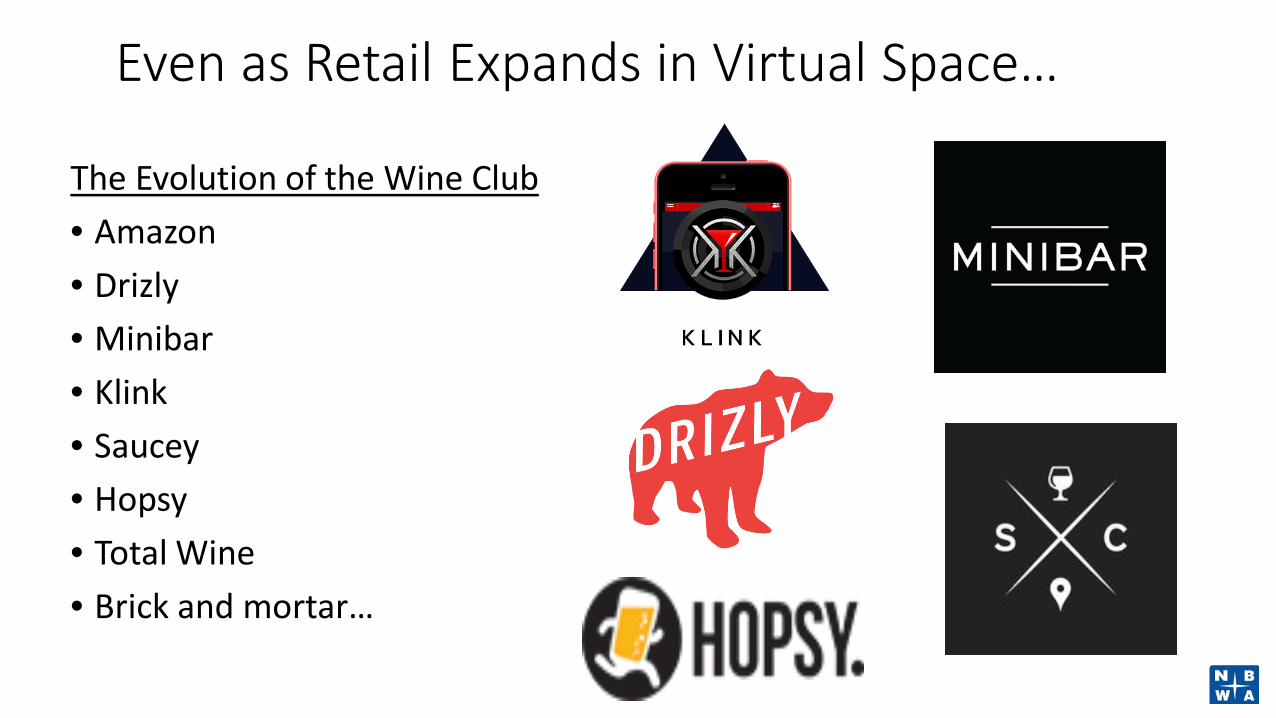
Even as Retail Expands in Virtual Space…
The Evolution of the Wine Club• Amazon• Drizly• Minibar• Klink• Saucey• Hopsy• Total Wine• Brick and mortar…
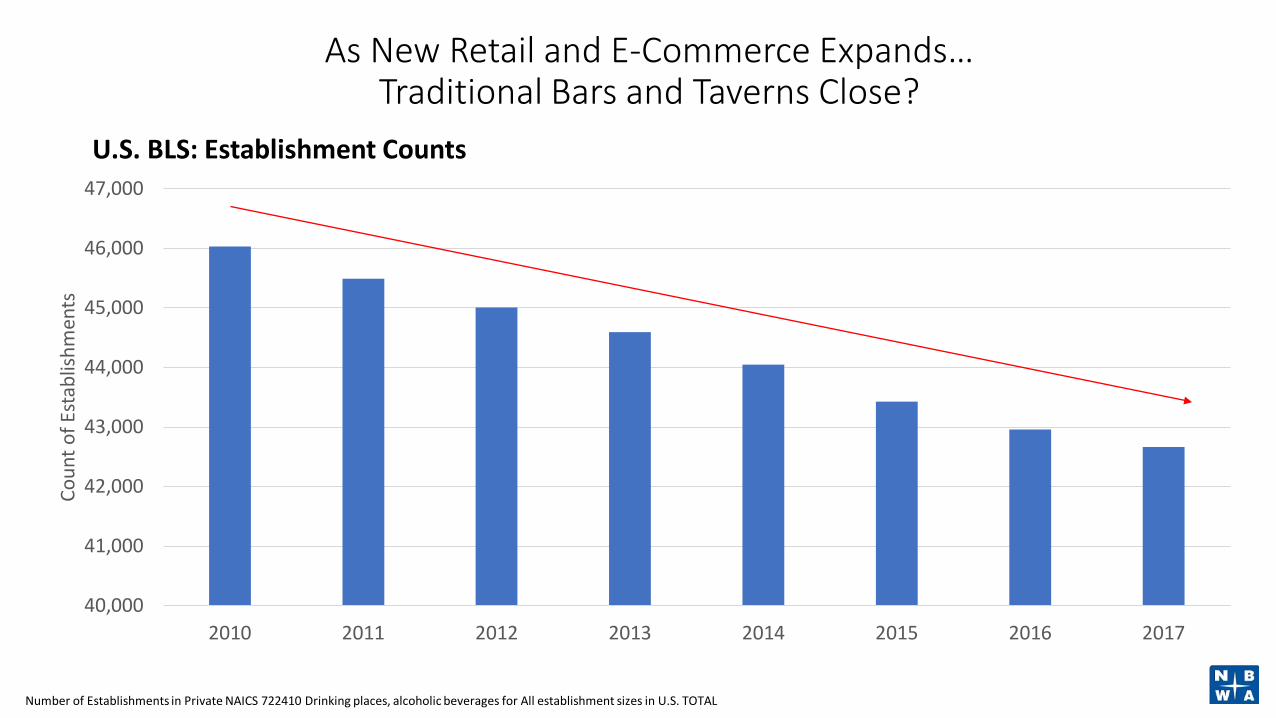
As New Retail and E-Commerce Expands…Traditional Bars and Taverns Close?
U.S. BLS: Establishment Counts
40,000
41,000
42,000
43,000
44,000
45,000
46,000
47,000
2010 2011 2012 2013 2014 2015 2016 2017
Coun
t of E
stab
lishm
ents
Number of Establishments in Private NAICS 722410 Drinking places, alcoholic beverages for All establishment sizes in U.S. TOTAL
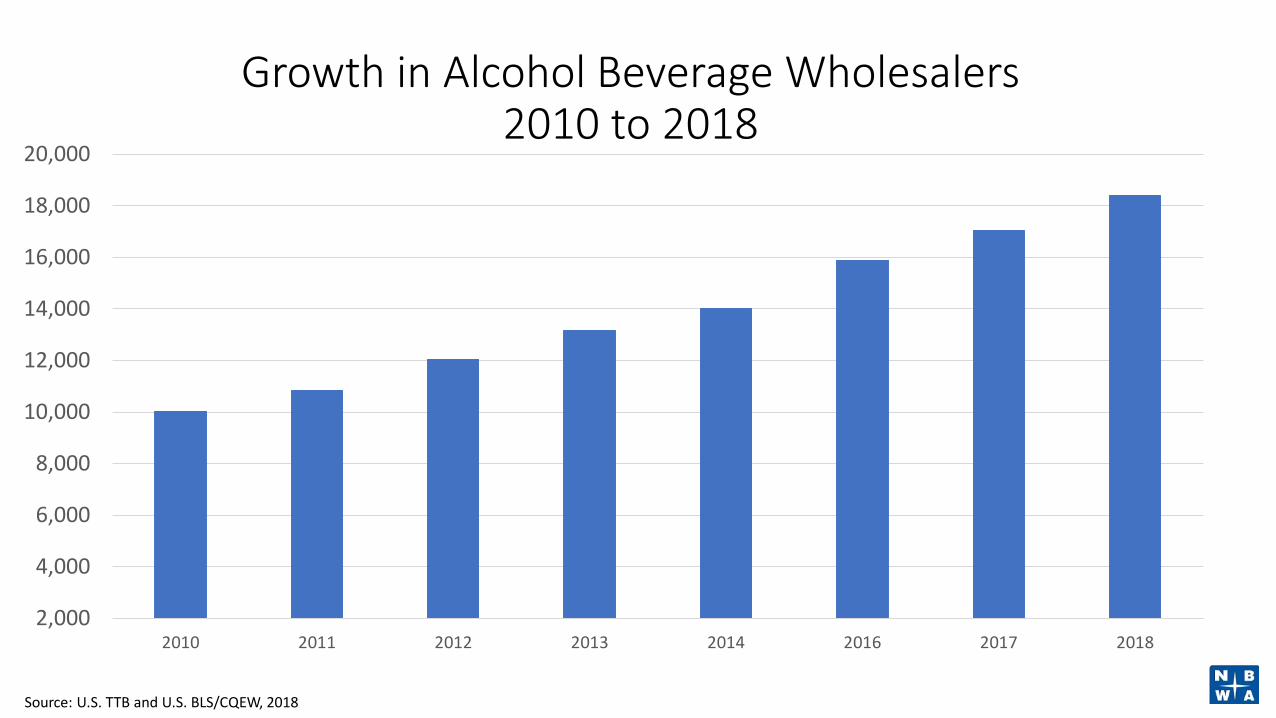
Growth in Alcohol Beverage Wholesalers2010 to 2018
2,000
4,000
6,000
8,000
10,000
12,000
14,000
16,000
18,000
20,000
2010 2011 2012 2013 2014 2016 2017 2018
Source: U.S. TTB and U.S. BLS/CQEW, 2018
0
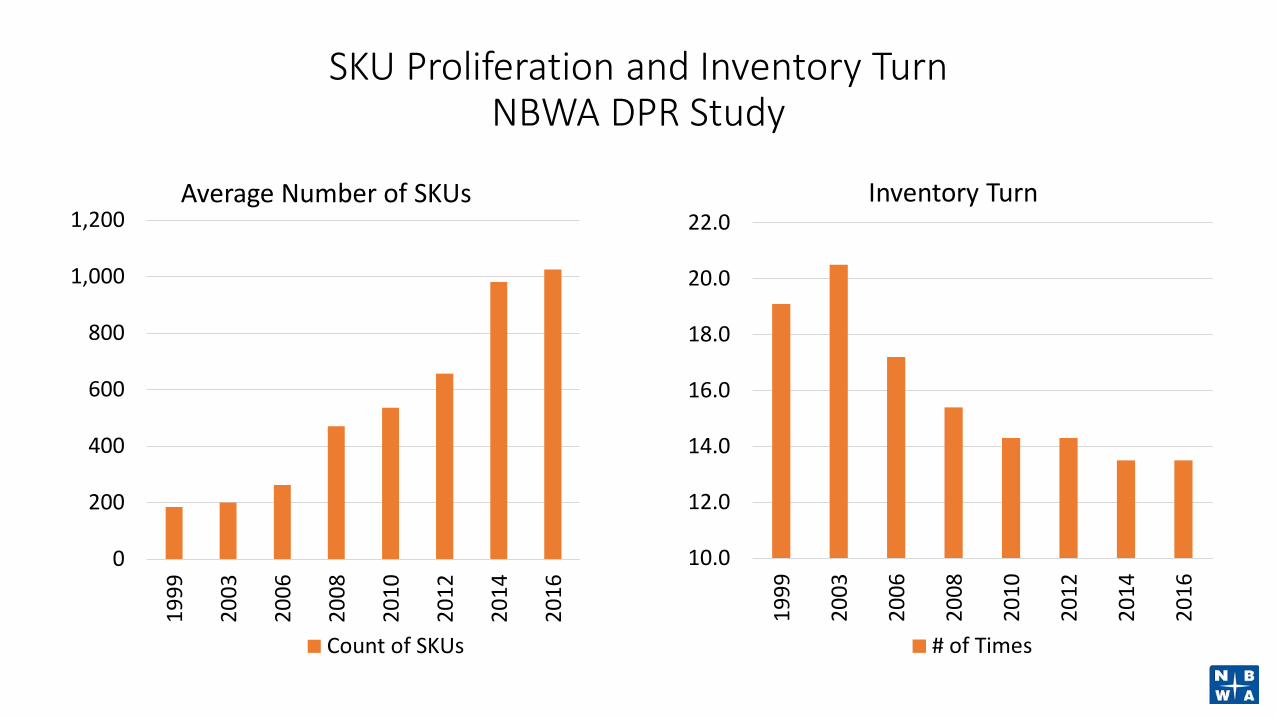
200
400
600
800
1,000
1,200
1999
2003
2006
2008
2010
2012
2014
2016
Average Number of SKUs
Count of SKUs
10.0
12.0
14.0
16.0
18.0
20.0
22.0
1999
2003
2006
2008
2010
2012
2014
2016
Inventory Turn
# of Times
Source: NBWA, Distributor Productivity Report.
SKU Proliferation and Inventory Turn NBWA DPR Study