the economics of climate change in the pacific...quantify key potential impacts of climate change in...
TRANSCRIPT

The Economics of Climate Change in the Pacific
Asian Development Bank 26 November 2013
Sydney, Australia

Key Questions
• How serious is the potential effect of climate change for the Pacific?
• What are the impacts of climate change on key economic sectors?
• How costly is climate change to the Pacific?
• How can countries adapt to a highly uncertain climate change?
• How much investment is needed for adaptation to climate change?

Background on the Pacific - Geography

Pacific Vulnerability
Economic Indicators
Cook Islands
Fiji Kiribati Marshall Islands
FSM Palau PNG Samoa Timor Leste
Tonga Vanuatu
Agriculture 4.6 12.1 26.3 15.0 27.8 5.5 29.1 9.8 3.3 18.8 23.9 Industry 9.0 22.0 8.2 13.1 9.1 8.4 44.2 27.9 85.6 21.1 10.1 Services of which
international tourism receipt
86.4
44.4
65.9
23.4
65.5
2.9
72.0
2.0
63.2
8.4
86.1
56.0
26.7
0.03
62.3
20.2
11.1
2.6
60.1
5.8
66.0
34.1 Tourism plus agriculture
49.0
35.5
29.2
17.0
36.2
61.5
29.1
30.0
5.9
24.6
58.0 Employment in agriculture
4.3
1.3
2.8
12.0
52.2
7.8
72.3
35.4
50.8
27.9
60.5
Regional Growth in Real GDP Per Capita, 2000-2012
Share of Pacific Economies Dependent on Natural Resources (GDP Share by Sector, %)

Study Approach
• Objective—to identify and indicatively quantify key potential impacts of climate change in the Pacific through 2100
• 3 components
– Climate modeling
– Sector impact assessment
• Sea level rise, water availability and storm risk
• Agriculture, marine/fisheries tourism and health
– Integrated assessment modeling
• FUND09
• PAGE 3.6

Methodology Modeling Framework
Impact Assessment
SRES Scenarios
Economic Assessment
,
GCM
RCM
Sectoral physical impact modeling
and assessment ( 5 sectors )
Country stocktaking
Integrated
assessment modeling
(PAGE 09)
SRES A2, A1B,
B1, B2
Economic Implications · Costs of climate change · Economics of adaptation · Funding/investment requirements
SRES A2, A1B
Change in
temperature, sea
level, precipitation,
extreme events
Integrated
assessment
modeling
(FUND3.6)
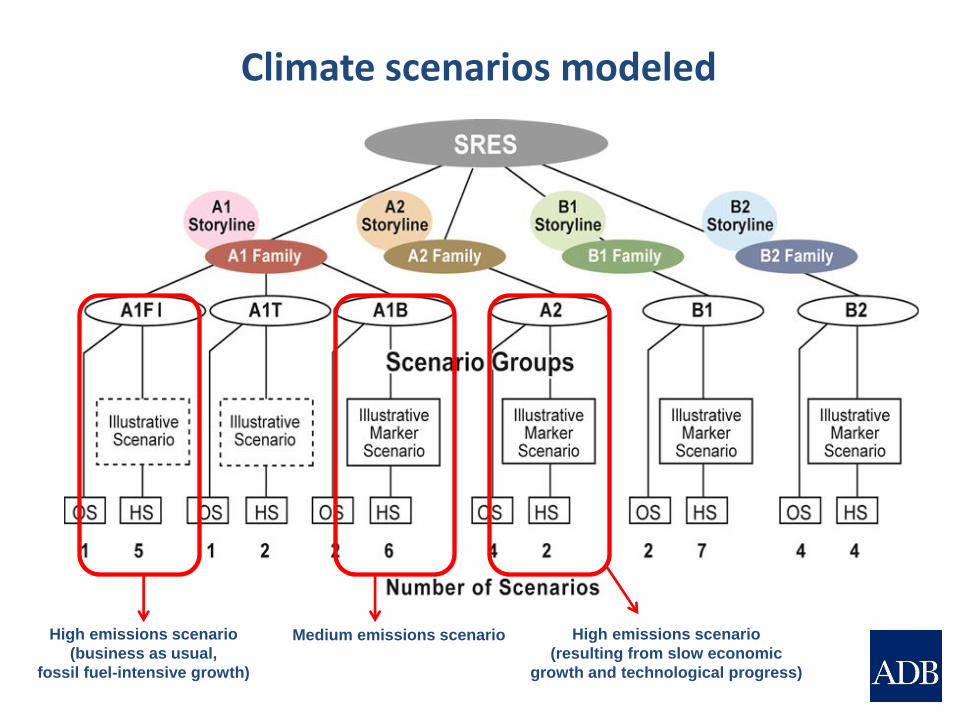
Climate scenarios modeled
High emissions scenario
(business as usual,
fossil fuel-intensive growth)
Medium emissions scenario High emissions scenario
(resulting from slow economic
growth and technological progress)

Average temperature differences 2061-2080 vs 1980-1999 (mean of GCMs under A1B (Medium Emissions) Scenario)
Timor-Leste
Papua New Guinea Fiji
Vanuatu
Solomon Islands Samoa

Rainfall – RegCM3 downscaling, mean of 16 GCMS, A1B (Medium Emissions) Scenario
Country Baseline Rainfall (mm) Projected Change in
2050 (%)
Projected Change in
2070 (%)
Papua New Guinea
Annual 3209 -7 -1
Peak Month (Dec) 313 -8 -13
Driest Month (Sep) 214 -10 -6
Solomon Island
Annual 3028 -8 -13
Peak Month (Mar) 369 -3 -21
Driest Month (Jun) 172 -10 -17
Vanuatu
Annual 2356 -6 -37
Peak Month (Mar) 364 -5 -34
Driest Month (Sep) 107 -8 -69
Fiji
Annual 2720 22 21
Peak Month (Mar) 480 5 31
Driest Month 102 3 -5
Samoa
Annual 2945 80 75
Peak Month (Jan) 437 29 14
Driest Month 113 123 149

Projected sea level rise (A1B (Medium Emissions) Scenario, 7 GCMs)
Sea level rise (m) relative to 2010
2050 2100
Extrapolation of historical Aviso data
GCM Low
GCM High
Extrapolation of historical Aviso data
GCM Low
GCM High
Fiji Islands 0.283 0.328 0.628 0.628 0.738 1.413
Papua New
Guinea 0.301 0.348 0.644 0.667 0.783 1.449
Samoa 0.212 0.260 0.556 0.470 0.585 1.251
Solomon
Islands 0.431 0.476 0.772 0.956 1.071 1.737
Timor-Leste 0.226 0.272 0.572 0.501 0.612 1.287
Vanuatu 0.257 0.304 0.604 0.571 0.684 1.359
Area (km2) % of land area
2050 2100 2050 2100
Mean of GCMs
0.3 1.4 0.002 0.008
10.8 15930.3 0.002 3.426
0.5 0.7 0.016 0.023
8.0 79.3 0.029 0.286
0.4 1.2 0.003 0.008
1.0 1.8 0.008 0.014

Crop growth modeling
Agricultural production situations
Climate change Impact analysis using DSSAT
Assessment of potential
adaptation options
Technology interventions
Climate projections from downscaling model
Soil data from global database
Data on varieties and management
GIS data on distribution of cropped area
Crop distribution maps

Agricultural modeling results commissioned for this study
(A1B (Medium Emissions) Scenario, ECHAM5 GCM, RegCM3 downscaling, no CO2 fertilization)
Crop Type Country
2050 2070
Worst case Best case Worst case Best case
Sugarcane Fiji -9.05 -5.11 -20.55 -7.13
Samoa 6.01 9.37 -2.30 5.69
Sweet potato PNG -59.16 -49.51 -59.14 -56.14
Solomon -14.97 -12.22 -31.02 -22.52
Maize Timor Leste -10.43 -6.07 -17.03 -13.51
Vanuatu -13.53 -8.03 n.d. n.d.

Parallel agricultural modeling results by
Rosegrant et al. (2013; A1B (Medium Emissions)
Scenario, 5 GCMs, CO2 fertilization included)
Yield effects from climate change 2050, compared with 2000 (%)
Papua New Guinea Solomon Islands Fiji
Crop Worst Case Best Case Worst Case Best Case Worst Case Best Case
Cassava, rainfed -30.8 -17.7 -27.8 -17.9 -36.5 -8.8
Maize, irrigated -3.2 4.0 -9.6 0.7 -6.1 2.3
Maize, rainfed -3.8 9.0 -16.5 -0.3 -7.0 1.0
Rice, irrigated -8.3 12.4 -7.6 10.8 -7.1 11.7
Rice, rainfed -7.5 11.7 -16.2 5.9 -11.0 3.5
Sugarcane, rainfed -3.6 3.4 -12.9 0.9 -8.3 2.8
Sweet potatoes, rainfed -10.9 -1.2 -15.0 1.5 -13.4 2.0
Taro, rainfed -13.0 3.6 -18.6 -4.7 -17.5 1.1

Marine/fisheries
• Thermal stress from increased ocean temperatures leads to coral bleaching – Estimated via
FUND
• Ocean acidification as a result of increased CO2 absorption
• Distribution of open ocean fisheries catches moves eastwards
0
10
20
30
40
50
60
70
80
90
100
2000 2025 2050 2075 2100 2125 2150 2175 2200
Actu
al
co
ver
as
a p
erc
en
tage o
f m
ax
imu
m c
ov
er
Projection of Coral Cover under Climate Change FUND A1B (Medium Emissions) Scenario

Tourism
• Changes in tourism arrivals as a result of a less attractive climate
• Declines in all countries relative to baseline
• Will be exacerbated by coral bleaching
-40%
-35%
-30%
-25%
-20%
-15%
-10%
-5%
0%
20
00
20
05
20
10
20
15
20
20
20
25
20
30
20
35
20
40
20
45
20
50
20
55
20
60
20
65
20
70
20
75
20
80
20
85
20
90
20
95
21
00
Imp
act
on
to
tal
tou
ris
m r
ev
en
ue
Fiji
Papua New Guinea
Samoa
Solomon Islands
East Timor
Vanuatu
Kiribati
Marshall Islands
Micronesia, Fed States
Nauru
Palau
Tonga
Tuvalu
The impact of climate change on total tourism revenue in 13
Pacific island nations for the A1B (medium emissions) scenario

Health
• Increased vector borne disease transmission
• Heat stress from increased heat and humidity, resulting in reparatory/ cardiovascular disease
• Increased food borne disease
Health effects for 14 Pacific island nations under the A2 (high emissions) scenario, FUND 3.6
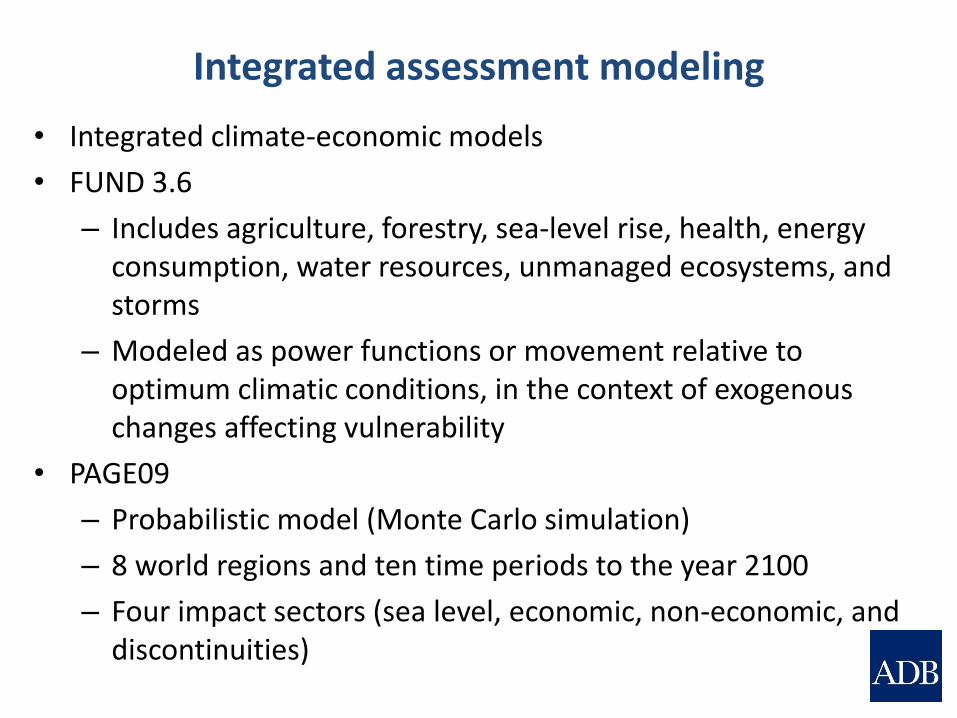
Integrated assessment modeling
• Integrated climate-economic models
• FUND 3.6
– Includes agriculture, forestry, sea-level rise, health, energy consumption, water resources, unmanaged ecosystems, and storms
– Modeled as power functions or movement relative to optimum climatic conditions, in the context of exogenous changes affecting vulnerability
• PAGE09
– Probabilistic model (Monte Carlo simulation)
– 8 world regions and ten time periods to the year 2100
– Four impact sectors (sea level, economic, non-economic, and discontinuities)
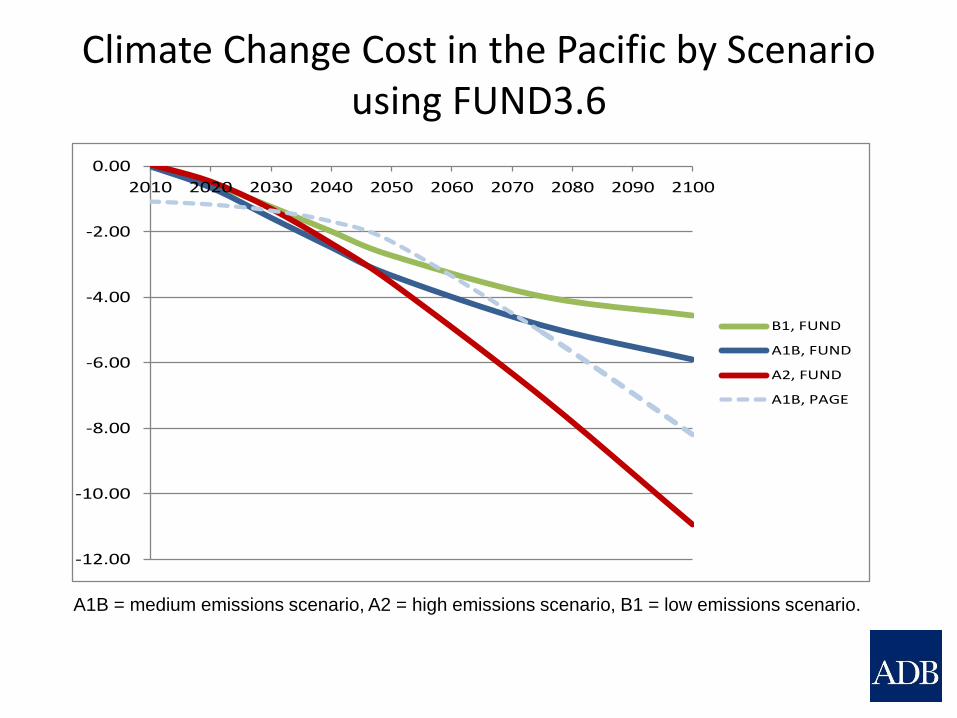
Climate Change Cost in the Pacific by Scenario using FUND3.6
-12.00
-10.00
-8.00
-6.00
-4.00
-2.00
0.00
2010 2020 2030 2040 2050 2060 2070 2080 2090 2100
B1, FUND
A1B, FUND
A2, FUND
A1B, PAGE
A1B = medium emissions scenario, A2 = high emissions scenario, B1 = low emissions scenario.

Climate Change Cost in the Pacific by Scenario using PAGE09
-14.00
-12.00
-10.00
-8.00
-6.00
-4.00
-2.00
0.00
2010 2020 2030 2040 2050 2060 2070 2080 2090 2100
450ppm, PAGE
A1B, PAGE
A1FI, PAGE
A1B, FUND
A1B = medium emissions scenario, A1FI = high emissions scenario.
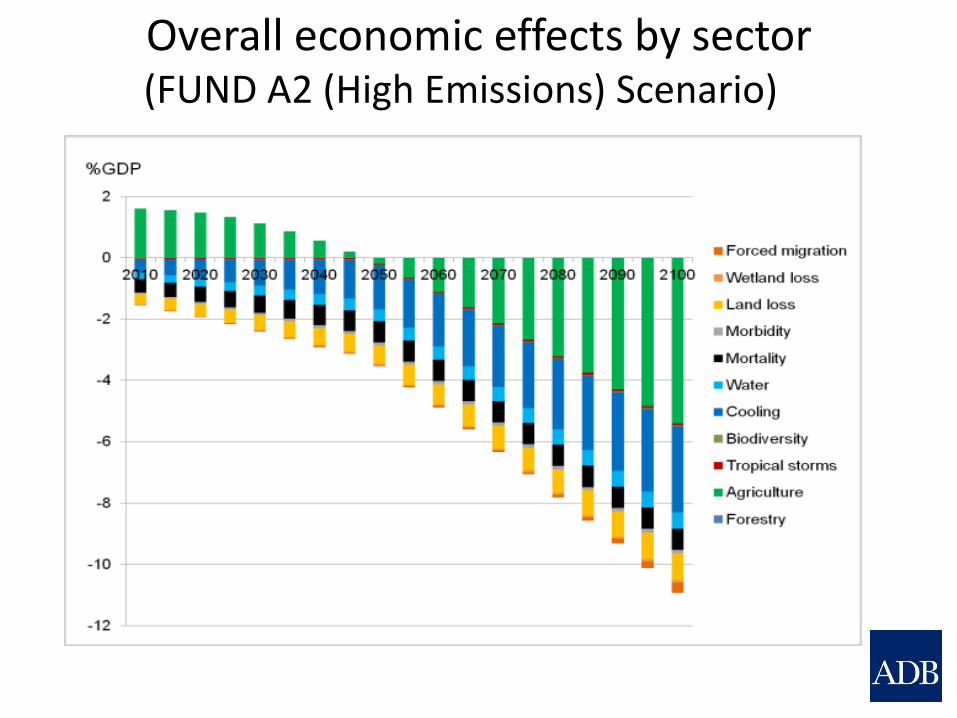
Overall economic effects by sector (FUND A2 (High Emissions) Scenario)
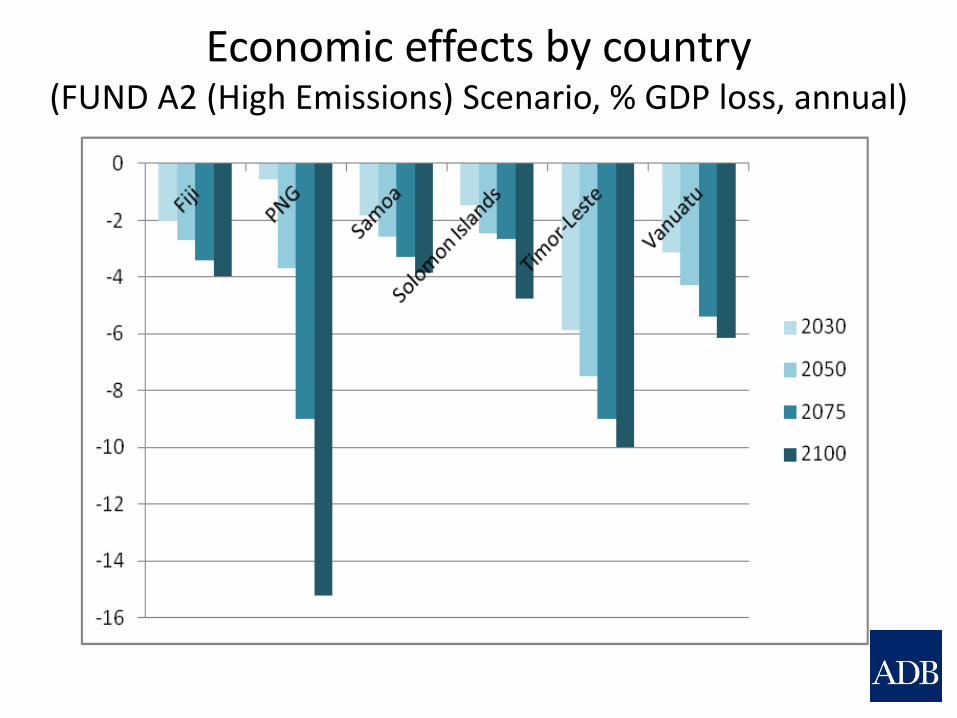
Economic effects by country (FUND A2 (High Emissions) Scenario, % GDP loss, annual)

Sectoral impacts by country (FUND A2 (High Emissions) Scenario, % GDP, annual)
-4.5
-4.0
-3.5
-3.0
-2.5
-2.0
-1.5
-1.0
-0.5
0.0
2030 2050 2075 2100
% of GDP Fiji Islands
-18.0
-16.0
-14.0
-12.0
-10.0
-8.0
-6.0
-4.0
-2.0
0.0
2.0
4.0
2030 2050 2075 2100
% of GDP Papua New Guinea
-4.0
-3.5
-3.0
-2.5
-2.0
-1.5
-1.0
-0.5
0.0
2030
% of GDP Samoa
-5.0
-4.5
-4.0
-3.5
-3.0
-2.5
-2.0
-1.5
-1.0
-0.5
0.0
2030
% of GDP Solomon Islands
-7.0
-6.0
-5.0
-4.0
-3.0
-2.0
-1.0
0.0
2030 2050 2075 2100
% of GDP Vanuatu
-12.0
-10.0
-8.0
-6.0
-4.0
-2.0
0.0
2.0
2030 2050 2075 2100
% of GDP Timor Leste Tropical
stormBiodiversity
Cooling
Forestry
WaterresourcesMortality
Morbidity
Dryland
Wetland
CoastalprotectionMigration
Agriculture

Probabilistic Annual Cost of Climate Change in the Pacific (PAGE09, A1FI (high emissions) scenario)

Annual average adaptation cost during 2010-2050 for Pacific, PAGE09
a. Adaptation target aimed at the impact by 2100
Scenario Adaptation target Annual average
cost Range
US$ million
Annual average
cost % GDP
Range % GDP
A1FI(a) 2100 worse case ( 95th percentile)* 446.7 214.6-775.4 1.52 0.78-2.54
A1FI(b) 2100 (4.5oC, 0.70 m SLR) 284.3 131.1-483.7 0.97 0.48-1.59
A1B 2100 (4.0oC, 0.65 m SLR) 253.1 118.9-438.4 0.86 0.44-1.43
450 ppm 2100 (2.5oC, 0.55 m SLR) 158.3 75.2-273.2 0.54 0.27-0.89
Note: The 95th percentile represents the critical point. Moving beyond, there is a low probability ( at 5% chance) that would lead to a catastrophic outcome
b. Adaptation target aimed at the impact by 2050
Scenario Adaptation target Annual average
cost Range
US$ million
Annual average
cost % GDP
Range % GDP
A1FI 2050 (2.5oC, 0.30 m SLR) 156.9 75.3-271.8 0.54 0.27-0.89
A1B 2050 (2.0oC, 0.30 m SLR) 126.5 59.7-222.8 0.43 0.22-0.71
450 ppm 2050 (1.9oC, 0.30 m SLR) 119.8 57.3-205.5 0.41 0.21-0.67
A1B = medium emissions scenario, A1FI = high emissions scenario.

Key messages
• Average temperatures in the Pacific are expected to rise by 2.0-3.0oC above the 1990 level in 2060-2080
• Sea level rise poses a risk of inundation and freshwater salinization
• Effects of climate change on key economic sectors (agriculture, fisheries and tourism) are negative and potentially large
• Health effects will compound other sectoral impacts • Climate change will cost the Pacific 2.2-3.5% of GDP
annually by 2050; further losses are expected by 2100. • Adaptation funding needs are substantial

Policy implications
• Mainstreaming climate change actions in development planning is crucial to avoid large climate impacts
• “Low regret” adaptation measures are essential – E.g. Stress tolerant varieties, interventions to reduce
disease transmission • Risk-based approaches can help prioritize adaptation
needs • Climate proofing of infrastructure can help improve long-
term sustainability • Improved access to climate finance is needed to support
adaption • Successful adaptation efforts require strong cooperation
and coordination within and beyond the region
Thank you.
FOR INFORMATION, CONTACT: Robert Guild Director, Transport, Energy and Natural Resources Division Pacific Department, ADB
[email protected] Cyn-Young Park Assistant Chief Economist , Economics and Research Department, ADB [email protected] OR VISIT www.adb.org/Pacific