the effect of big data and analytics on firm performance
TRANSCRIPT
1
The effect of big data and analytics on firm performance: An
econometric analysis considering industry characteristics
Oliver Müller IT University of Copenhagen, Rued Langgaards Vej 7, 2300 Copenhagen, Denmark [email protected]
Maria Fay University of Liechtenstein, Fürst-Franz-Josef-Strasse, 9490 Vaduz, Liechtenstein [email protected]
Jan vom Brocke University of Liechtenstein, Fürst-Franz-Josef-Strasse, 9490 Vaduz, Liechtenstein [email protected]
Abstract: The emergence of big data has stimulated enormous investments into business analytics solutions, but large-scale and reliable empirical evidence about the business value of big data and analytics (BDA) remains scarce. This paper presents the results of an econometric study that analyzes the direction, sign, and magnitude of the relationship between BDA and firm performance based on objective measurements of BDA assets. Using a unique panel data set that contains detailed information about BDA solutions owned by 814 companies during the timeframe from 2008 to 2014, on the one hand, and their financial performance, on the other hand, we estimate the relationship between BDA assets and firm productivity and find that live BDA assets are associated with an average of 3 to 7 percent improvement in firm productivity. Yet, we also find substantial differences in returns from BDA when we consider the industry in which a firm operates: While firms in IT-intensive or highly competitive industries are clearly able to extract value from BDA assets, we did not detect measurable productivity improvement for firms outside these industry groups. Taken together, our findings provide robust empirical evidence for the business value of BDA, but also highlight important boundary conditions.
Key words and phrases: IT business value, big data analytics, firm performance, productivity, econometric analysis.

2
1. Introduction
Unprecedented growth in data volume, variety, and velocity has emerged over the
course of the past decade, a phenomenon often referred to as “big data.” While for most
organizations data has traditionally been time-consuming and costly to acquire, today
many businesses are confronted with a data deluge. The following quote by Eric
Schmidt, former CEO of Google, illustrates the extent of the recent data explosion:
“There was five [E]xabytes of information created between the dawn of civilization
through 2003, but that much information is now created every two days, and the pace is
increasing” [21].
The emergence of big data has increased organizations’ demand for business analytics,
defined as the “extensive use of data, statistical and quantitative analysis, explanatory
and predictive models, and fact-based management to drive decisions and actions” [18,
p. 7]. A survey fielded by the Wall Street Journal [68] in collaboration with Oracle found
that 86 percent of surveyed executives consider the ability to gain insights from data to
be one of their top three business priorities. Similarly, according to studies by Gartner
[26] and IBM [33], business intelligence and analytics are today’s top priority for CIOs
and the top technology priority for CFOs. IDC [34] predicted that the worldwide market
for big data and business analytics solutions will increase by more than 50 percent
between 2015 and 2019, from $122 billion to more than $187 billion. And according to
Gartner [25], more than half of the world’s largest organizations will be applying
advanced analytics solutions to large datasets by 2018.
At the same time, the adoption of analytics solutions for extracting value from big data,
in the following called big data and analytics (BDA), is associated with substantial
financial investments for firms. For example, the three-year total cost of ownership for

3
an IBM PureData System for Analytics1, an appliance for big data processing, is
estimated to be $39 million, and the overall costs for a comparable Cloudera Hadoop
cluster2 for the same period sum up to more than $50 million [13].
These figures lead to the question whether investments in BDA pay off for companies,
that is, whether they actually generate business value. The need to conduct “critical,
intensive assessments of the actual impact of big data investment and use and
understand if and how one can attain instrumental benefits (such as performance and
profitability) […]” has recently also been raised in the IS literature by Abbasi et al. [1, p.
xi]. While the business and IT press is picturing companies that transformed their
businesses or even entire industries through the use of BDA, scientific evidence for the
business value of BDA is scarce. Existing empirical evidence has come either from
qualitative case studies that discuss the opportunities and challenges of BDA [58, 64] or
from surveys that are based on self-reported perceptual measures of business value
[44, 5, 54, 17], while large-scale studies that have drawn on objective measures of firm
performance, such as productivity, are rare. (Brynjolfsson et al. [12] and Tambe [62] are
exceptions.) These observations indicate a gap in the academic literature that a recent
report of the OECD [47, p.18] has also pointed out: “While [case] evidence […] strongly
suggests a positive link between [data-driven innovation] and productivity growth across
the economy, few empirical studies exist with robust quantitative estimates.”
Our study addresses this research gap by using econometric methods to investigate the
relationship between live BDA assets and firm performance. We compiled a unique
panel data set that contains detailed information about BDA solutions owned by 814
1 8 server racks and 1500 Terabytes of storage capacity 2 Cluster with 750 nodes
4
companies over a period of seven years from 2008 to 2014. By combining this
information with financial performance data from the Compustat database, we can
estimate the direction, sign, and magnitude of the relationship between BDA assets and
firm performance.
We find that over all industries ownership of live BDA assets is associated with an
average increase in productivity by about 4.1 percent, however we can only speculate
about the direction of the causality of this relationship. When we take industry
characteristics into consideration, the causality becomes clearer and we find that live
BDA assets are associated with substantial improvements in a firm’s productivity – 6.7
percent productivity gains in IT-intensive industries and 5.7 percent in competitive
industries. Taken together, our results provide robust empirical evidence for the
business value of BDA, but also highlight important boundary conditions.
The remainder of the paper is organized as follows. First, we review the literature on
BDA’s business value and on measuring the impact of IT on firm performance. Then we
develop our key hypotheses and describe our research design in detail. Next, we
present our empirical findings and then discuss their implications as well as their
limitations. The paper closes with a brief summary and outlook.
2. Background
2.1. Business Value of Big Data and Analytics
To understand the current discourse on BDA business value, it is useful to recall how
this class of IT is different from other enterprise IT. Already in 1971, Gorry and Scott
Morton [27], in their seminal article “A Framework for Management Information

5
Systems”, used the distinction between operational, managerial, and strategic
management activities, on the one hand, and structured (or programmed) and
unstructured (or non-programmed) problems, on the other hand, to distinguish different
categories of information systems. They coined the term Decision Support Systems
(DSS) to refer to a class of information systems meant to support humans in making
management and strategic decisions in unstructured problem situations (e.g., sales and
production planning) and distinguish these systems from the information systems for
supporting structured operational tasks (e.g., order entry, accounts management)
prevailing at that time. In today’s enterprise IT architectures, this distinction is still
reflected in the separation of transactional systems, for example, Enterprise Resource
Planning (ERP), Customer Relationship Management (CRM), or Supply Chain
Management (SCM), from analytical systems, such as, data warehouses, data mining
solutions, or dashboards.
Zuboff’s [69] “automate/informate” framework explains how transactional and analytical
IT differently affects firm performance. The framework distinguishes between IT that is
meant to automate operations by increasing the continuity and control of work
processes from IT that is meant to inform decision-makers by creating information that
improves the comprehensibility of an organization’s work processes. While Zuboff
compared the first type of systems with Ford’s automated assembly line, which was
meant to replace human labor with machines, she argued that the second type of
systems can “create a different and potentially more penetrating, comprehensive, and
insightful grasp of the business [that,] in turn, can serve as the catalyst for significant
improvement and innovation in the production and delivery of goods and services, thus
strengthening the competitive position of the firm” [69, p. 9]. According to this view,
transactional systems (e.g., ERP) mainly aim at improving the efficiency of existing
6
business processes, while analytical systems (e.g., BDA) enable managers to explore
new process, product, and service innovations.
Since the inception of the first DSS in the 1960s, analytical information systems have
undergone a number of evolutionary waves, from batch processing of structured
numerical data stemming from company-internal sources and using technologies like
relational databases, Structured Query Language (SQL), and report generators to real-
time processing of unstructured data originating from social media or sensor networks
and using technologies like distributed NoSQL databases, in-memory computing,
machine learning, and interactive visualization tools [1, 15]. But not only the data types
and technologies have changed, but also the information value chain, that is, how these
technologies are leveraged by managers to extract knowledge from data and support
decision making [1]. While the Business Intelligence (BI) applications from the 1990s
focused on providing management with a consistent set of metrics to measure past and
current business performance, today’s BDA applications enable analytics-savvy
mangers and data scientists to explore, discover, and predict [18, 1]. Hence, similar to
the way communication and collaboration technologies have transformed early DSS,
the latest developments around big data and analytics “give rise to a new class of big
data IT artifacts” [1, p.viii].
There is first quantitative evidence suggesting that BDA leads to measurable
improvements in firm performance. The existing quantitative studies can be roughly
divided into market research surveys and academic studies applying econometric
methods.
Most studies in the first category have been published in the business press or stem
from industry-sponsored research. For example, Davenport and Harris [18] showed a

7
positive correlation between intensity of analytics use and a firm’s annual growth rates,
based on a survey of 32 companies. Likewise, a survey among nearly 3,000 executives
conducted by IBM [36] found that top-performing organizations use analytics five times
as much as lower performers do. Similar results have been reported by major consulting
companies like Accenture [2] and Bain & Company [65].
Econometric studies go beyond simple correlational analysis and use research designs
that try to control for confounding effects and ensure a causal interpretation of the
associations between input and output variables. These methods have been used for
many years to investigate the business value of transactional IT systems, such as ERP,
CRM, and SCM systems [48, 32, 28, 4, 19].
The first econometric studies investigating the impact of analytical systems on firm
performance predate the BDA era and focused on DSS [35] and BI [22]. Although they
found a positive impact of these solutions on organizational performance, they at the
same time highlighted the importance of considering contextual moderators, such as
industry sectors, in the analysis [22].
Another prominent econometric study in the field comes from Brynjolfsson et al. [12],
who investigated the relationship between decision-making based on data and business
analytics—that is, data-driven decision making (DDD)—and firm performance. The
authors surveyed 179 large firms concerning their business practices, such as the use
of data for business decision-making or for creating new products and services, and
combined this data with financial data from the Compustat database. Using several
econometric models of firm productivity, profitability, and market value, they showed
that “firms that adopt DDD have output and productivity that is 5-6% higher than what

8
would be expected given their other investments and information technology usage” (p.
1).
Finally, the econometric study conducted by Tambe [62] investigated the relationship
between the distribution of big data skills and firm performance. In particular, Tambe
used the LinkedIn skills database to measure firms’ investments in big data skills
(especially Hadoop) and test whether these investments were associated with higher
firm productivity. The results indicated that “firms’ Hadoop investments were associated
with 3% faster productivity growth, but only for firms a) with significant existing data
assets and b) in labor networks characterized by significant aggregate Hadoop
investment” (p. 1).
In sum, there are well-grounded conceptual arguments and a small but emerging body
of empirical evidence for the business value of BDA. Yet, existing empirical studies
either predate the big data era (i.e., they focus on the business value DSS or BI) or rely
on self-reported surveys or proxy variables (e.g., BDA skills reported on social
networks) to quantify the business value of BDA. To the best of our knowledge, our
study is the first econometric study that uses primary data to operationalize BDA
through actual live BDA assets, which allows us to obtain more objective estimations of
BDA business value. The next section addresses the methodological challenges of
quantifying this business value.
2.2. Measuring the Impact of IT on Firm Performance
The impact of IT and IT investments (input or independent variable) on firm
performance (output or dependent variable) has been widely studied using a variety of
methodological approaches. Sabherwal and Jeyaraj’s [51] meta-analysis identified 303
empirical studies published from 1990 to 2013, and Schryen [55] identified 327 research
9
papers related to the business value of IT. However, only a handful of these studies
investigated the impact of BDA systems or its predecessors (i.e., BI, DSS) [20, 22, 35].
In the following section, we will hence focus on the wider range of studies on IT
business value in order to identify an approach most suitable for our objectives and
research design.
On the input side, early studies operationalized the independent variable of a firm’s IT
investments with highly aggregated measures, such as IT expenditures (for hardware,
software, personnel, etc.), technical IT assets (e.g., number of PCs and servers), or
human IT assets (e.g., number of IT employees). Only recently did studies start to look
at more disaggregated measures and at specific IT assets [55]. ERP systems have
been the most frequently studied specific IT asset, and Mangin et al.’s [43] literature
review covering 54 articles published from 1999 to 2014 found that most studies
reported a positive post-implementation impact of ERP systems on firm performance,
especially among large companies over a long period of time. In addition to the stream
of research that has focused on ERP systems, positive performance impacts have been
found for CRM systems [27, 4], SCM systems [19, 4], and knowledge management
(KM) systems [23].
On the output side, the most commonly used measure for firm performance has been
multi-factor productivity [55, 51]. Typically, researchers have related a measure of firm
output (e.g., sales or value-added) to a firm’s input factors, such as capital, labor, and
materials. The most commonly used functional form for this relationship in the literature
has been the Cobb-Douglas production function, which, in addition to the classical
production factors capital, labor, and materials, can include other input factors, such as
IT assets, and whose resulting coefficients can be interpreted as the marginal effects of
10
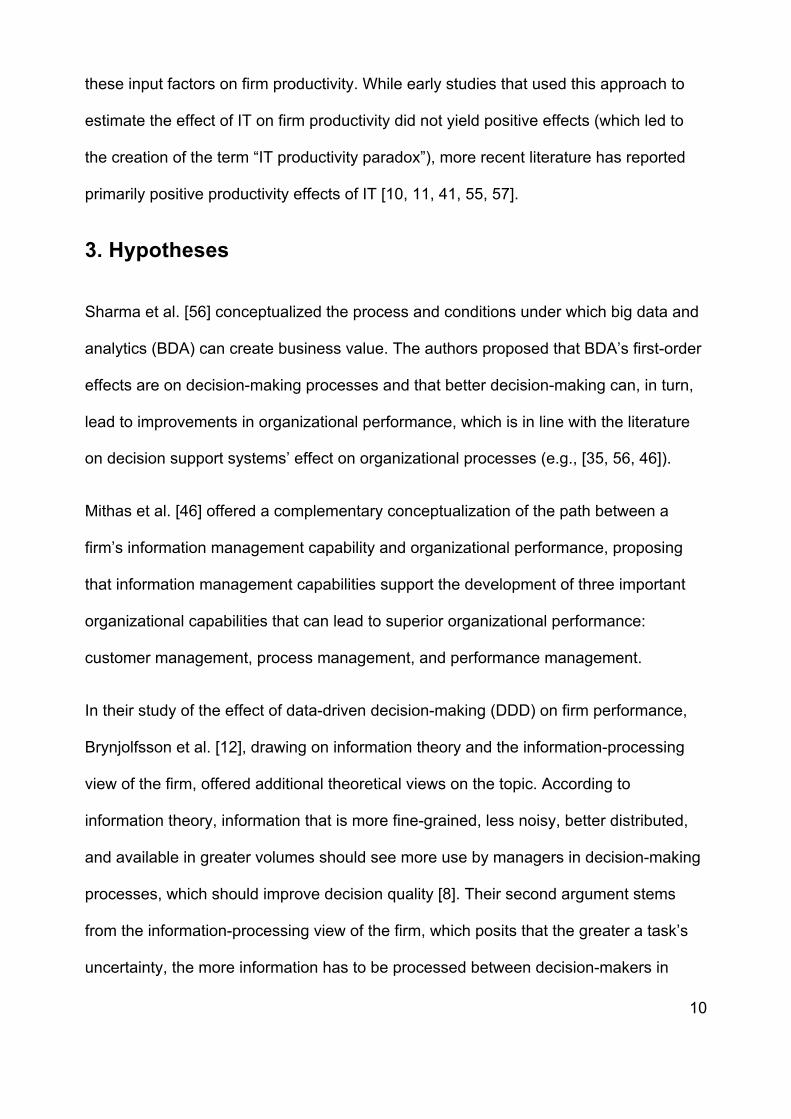
these input factors on firm productivity. While early studies that used this approach to
estimate the effect of IT on firm productivity did not yield positive effects (which led to
the creation of the term “IT productivity paradox”), more recent literature has reported
primarily positive productivity effects of IT [10, 11, 41, 55, 57].
3. Hypotheses
Sharma et al. [56] conceptualized the process and conditions under which big data and
analytics (BDA) can create business value. The authors proposed that BDA’s first-order
effects are on decision-making processes and that better decision-making can, in turn,
lead to improvements in organizational performance, which is in line with the literature
on decision support systems’ effect on organizational processes (e.g., [35, 56, 46]).
Mithas et al. [46] offered a complementary conceptualization of the path between a
firm’s information management capability and organizational performance, proposing
that information management capabilities support the development of three important
organizational capabilities that can lead to superior organizational performance:
customer management, process management, and performance management.
In their study of the effect of data-driven decision-making (DDD) on firm performance,
Brynjolfsson et al. [12], drawing on information theory and the information-processing
view of the firm, offered additional theoretical views on the topic. According to
information theory, information that is more fine-grained, less noisy, better distributed,
and available in greater volumes should see more use by managers in decision-making
processes, which should improve decision quality [8]. Their second argument stems
from the information-processing view of the firm, which posits that the greater a task’s
uncertainty, the more information has to be processed between decision-makers in

11
order to achieve a given level of performance [24]. One strategy to address this tradeoff
is to increase the organization’s information-processing capacity by investing in vertical
information systems that allow managers to plan and re-plan business operations
frequently by efficiently transmitting information from the point of origin to the point of
decision [24].
Taken together, the above outlined theoretical arguments suggest that technologies that
improve the collection of data and its efficient distribution in an organization, such as
BDA, should increase the use of this data in decision-making processes, which, in turn,
should improve decision quality and ultimately drive organizational productivity [12].
This leads us to our first hypothesis:
H1: BDA assets have a positive impact on firm productivity.
Industry-level factors are important context variables that moderate the impact of IT on
firm productivity, and among them is an industry’s IT intensity—sometimes called
information or data intensity—which has been found to play an essential role [53, 31].
This argument can be theoretically grounded in the literature on complementary assets
[63]. Teece [63] argued that in order to profit from a technological innovation in almost
all cases a firm needs to use the innovation in combination with other existing
capabilities or assets. For example, a BDA solution for building predictive models or
visualizing large datasets requires other IT assets, like transactional ERP or CRM
systems, that can act as data sources. These complementary IT assets are generic in
the sense that they do not need to be tailored to the BDA solution, and vice versa
(assuming that standard interfaces exist to exchange data between the systems).
Another example of complementary assets are data scientists that possess the
12
knowledge and skills to use BDA tools to extract patterns and trends from large
amounts of data. These human assets are more specialized, because they require
training and experience for effectively using the methods and tools in question and
developing technological and informational task complementarities in order to apply
them productively [40]. Especially this need for investments in human resources seems
to be crucial in the field of BDA. The importance of skilled data scientists has, for
example, been highlighted in a recent study by McKinsey Global Institute [44], who
found a 50-60 percent talent gap between the demand for deep analytical talent and its
supply by 2018. Similarly, a study by PricewaterhouseCoopers in cooperation with the
Business-Higher Education Forum and Gallup [49] found that 69 percent of employers
say that by 2021 they will prefer job candidates with data science and analytics over
ones without, but that only 23 percent of educators say that their graduates will have
these skills.
Various empirical studies have found that the availability of complementary
technological and human IT assets within a firm or its network (e.g., industry or
geographic region) is an important moderator of the business value of IT [9] and, more
specifically, BDA. For example, Stiroh [59, 60] showed that companies that are IT
producers (e.g., electronic equipment, industrial machinery and equipment) or heavy IT
users (e.g., wholesale, transportation and utilities, services) enjoyed much larger IT-
related productivity gains over the last few decades than other industries (e.g.,
agriculture, mining, construction) did. Similarly, Lee and Kim’s [38] review of the IT
investment literature found that studies with observations from high information-
intensive industries (e.g., financial services, insurance, retail, healthcare) report a more
positive impact of IT investments on firm performance than do those from low
information-intensive industries (e.g., construction, some manufacturing industries). In a

13
similar line, but specifically focusing on BDA, a recent study by the Centre for
Economics and Business Research (CEBR) [14] identified an industry’s data and IT
intensity as important moderating factors for the adoption of big data analytics and its
potential for increasing firm productivity. Finally, Tambe [62] found in his study on the
influence of investments in big data skills on firm productivity that only companies in
data-driven industries could extract business value from big data investments and that
there was a positive interaction effect between a firm’s investment in big data skills and
the pool of big data skills available in the industry the firm is operating in.
Taken together, the above outlined theoretical arguments and empirical evidence
suggest that companies in industries with low availability of complementary IT assets
(i.e., low IT-intensity) may experience difficulties in extracting business value from BDA
assets. Therefore, we formulate our second hypothesis as follows:
H2: The effect of BDA assets on firm productivity is higher in IT-intensive
industries than it is in other industries.
A second important industry-level context factor that moderates the impact of IT on firm
performance is the intensity of the competition [55]. Melville et al. [45] drew on two
theoretical foundations to explain the role of competitive pressure in extracting business
value from IT.
First, he states that under competitive pressure firms become more innovative, for
example, by utilizing existing IT assets (e.g., BDA) for enabling new business processes
(e.g., data-driven decision making), which, in turn, increases their productivity. The first
part of this argument is supported by the findings of Basole’s et al. [7] review of 472
articles published between 1977 and 2008 on the adoption of IT innovations by

14
enterprises, in which they found that for more than thirty years competitive pressure has
been among the top three external characteristics that trigger IT innovations. In the
context of BDA, the argument is further supported by Malladi and Krishnan’s [42, p. 9]
empirical results, which showed that “higher industry competitive intensity is positively
associated with the extent of business intelligence and analytics usage in organizational
business activities.” The second part of the argument, follows the same logic and is
backed up by the same evidence as Hypothesis 1.
Second, Melville draws on the X-efficiency hypothesis, which states that in the absence
of competitive pressure firms tend to build up slack and other inefficiencies while still
being able to stay in business [45]. This leads to decreased efficiency of individual
production input factors, such as capital, labor, and IT. Several empirical studies have
provided evidence for this argument (e.g., [37, 52, 39]). For example, Melville et al. [45]
found that the marginal product of IT is significantly lower in highly competitive
industries and proposed that “[t]hough less competitive industries utilize IT for similar
purposes […] the absence of competitive pressure leads to less efficient use of IT” [45,
p. 233].
Taken together, the above arguments suggest that strong competition (a) increases the
usage of BDA, which according to Hypothesis 1 drives firm productivity, and (b) leads to
more efficient use of BDA. Therefore, we define our third hypothesis as follows:
H3: The effect of BDA assets on firm productivity is higher in highly competitive
industries than it is in other industries.

15
4. Methods
4.1. Data
In cooperation with one of the world’s largest enterprise software vendors, we collected
a unique longitudinal dataset about its customers’ BDA assets. These assets included a
broad range of products that can broadly be organized into three categories: (1)
foundational database technologies, (2) data mining and machine learning solutions,
and (3) data visualization and presentation tools. The first product category comprised,
for example, databases and data warehouses running on high-performance in-memory
computing appliances, both on-premise and in the cloud, as well as tools for modeling
and management of data. In contrast to traditional data warehouse optimized for
processing structured numerical data in batch mode, these technologies are also
designed to handle unstructured (e.g., from social media) and streaming (e.g., from
senor networks) data. The second product category comprised, for example, advanced
analytics solutions including supervised and unsupervised machine learning algorithms
for predictive analytics, anomaly detection, text mining, or social network analysis. The
third product category comprised mainly solutions for visual intelligence (e.g.,
dashboards) and mobile or self-service interfaces for users.
We merged this data with financial data from the Compustat Global-Fundamentals
Annual database for companies that are publicly traded on U.S. stock markets. After
joining and cleaning the datasets, we were left with a balanced panel dataset containing
data on BDA assets as well as financial performance of 814 firms from 2008 to 2014—
overall 5,698 firm-year observations. The dataset contains information about companies
who have adopted BDA during the timeframe of our study (i.e., 2008-2014), who had
already adopted it before 2008, and who—as of 2014—have not adopted BDA at all.
16
This dataset opens unique opportunities to study the effect of BDA assets on firm
performance, as it contains a large sample of companies and is based entirely on
primary objective data comprising both cross-sectional and longitudinal observations.
Table 1 shows the definitions of our main variables of interest. The binary IT assets
variables have the value ‘0’ in the years preceding a system go-live and the value ‘1’ in
the year of go-live and all following years. Besides collecting data about BDA systems,
we also collected data about firms’ ERP, CRM, and SCM systems in order to control for
firms’ transactional IT assets. To test Hypothesis 2, we adopted a classification of
industry sectors’ IT-intensity from Stiroh [59, 60], which is based on the share of IT
capital stock in a firm’s total reproducible capital stock. Like Stiroh [59, 60], we
considered industries with an above-median IT capital stock share as IT-intensive
industries (i.e., wholesale trade, transportation, and public utilities, including
telecommunications, services, finance insurance and real estate, and durable
manufacturing). To test Hypothesis 3, we classified industries according to their
competitiveness using the Herfindahl–Hirschman Index (HHI), which measures the size
of firms in relation to the industry they operate in and therefore indicates the level of
competition among them [50]. Following Cetorelli and Strahan [16] and Zwanziger et al.
[70], we classify industries with an HHI in the lower twenty-fifth percentile of all
industries as highly competitive. (A low HHI indicates a low level of concentration and a
high level of competition.)

17
Table 1: Definition of Variables
Variable Definition
Firm Unique ID of firm
Year Year of observation
Industry Industry code at the 2-digit Standard Industry Classification (SIC) level
BDA Binary indicator variable: 1 indicates that the firm has BDA assets; otherwise 0
ERP Binary indicator variable: 1 indicates that the firm has ERP assets; otherwise 0
CRM Binary indicator variable: 1 indicates that the firm has CRM assets; otherwise 0
SCM Binary indicator variable: 1 indicates that the firm has SCM assets; otherwise 0
IT-intensity Binary indicator variable: 1 indicates that the firm is in an IT-intensive industry; otherwise 0
Competitiveness Binary indicator variable: 1 indicates that the firm is in a competitive industry, otherwise 0
Table 2 shows the development of the BDA diffusion rate in our dataset over time and
split up by industry groups. In 2008, about 61 percent of firms in our panel had already
had live BDA assets and this share increased to 79 percent over the seven years of
observation. When comparing the diffusion rate between IT-intensive and not IT-
intensive and competitive and not competitive industries, only marginal differences can
be found.

18
Table 2: Firms’ BDA Diffusion Rate over Time and by Industry Groups
BDA diffusion rate 2008 2009 2010 2011 2012 2013 2014
Overall 0.61 0.68 0.70 0.73 0.75 0.77 0.79
IT-intensive industries 0.62 0.68 0.72 0.74 0.76 0.77 0.79
Competitive industries 0.63 0.69 0.72 0.74 0.76 0.78 0.79
Table 3 shows the distribution of firms by industry groups (see Figure 1 in the Appendix
for a distribution by industries). The statistics show that our panel is mainly comprised of
firms in IT-intensive and competitive industries, predominantly from manufacturing,
which is probably due to our data collection strategy which was focused on the
customers of one of the world’s largest enterprise software vendors.
Table 3: Totals and Percentages of Firms in Industry Groups
Yes No
IT-intensive industries 564 (69.3%) 250 (30.7%)
Competitive industries 579 (71.1%) 235 (28.9%)
Table 4 provides an overview of the input and output variables required to estimate
productivity functions, and Table 5 shows their correlation coefficients. All data was
extracted from the Compustat Global-Fundamentals Annual database and was then
adjusted to 20103 values using domestic producer price indices obtained from the
OECD (Organisation for Economic Co-operation and Development).
3 The current OECD data uses 2010 as the default reference year.

19
Table 4: Descriptive Statistics for Input and Output Factors
Variable Mean Median SD Minimum Maximum
Sales (in Millions of US Dollars)
15,083.06 3,088.80 39,216.03 0 528,972.00
Labor (in Thousands of Employees)
34.53 8.40 96.95 0 2,201.00
Capital (in Millions of US Dollars)
6,273.18 686.51 18,775.34 0 276,419.80
Materials (in Millions of US Dollars)
9,937.51 1,735.34 30,650.40 0 478,069.90
Table 5: Correlations among Input and Output Factors
1 2 3 4
1 Sales 1.00
2 Labor 0.66 1.00
3 Capital 0.76 0.40 1.00
4 Materials 0.98 0.60 0.72 1.00
4.2. Model Specifications and Estimators
As discussed in Section 2.2., we apply techniques developed in the IT business value
literature to quantify the effect of BDA assets on firm performance. While there are a
number of approaches to measure the impact of IT on firm performance, we use the
Cobb-Douglas production function framework to measure the marginal effect of BDA on
firm output after accounting for various firm inputs (i.e., labor, capital, materials, IT
assets) and external factors (i.e., industry, year). Formally, the following regression
specification is used to test Hypothesis 1:
20
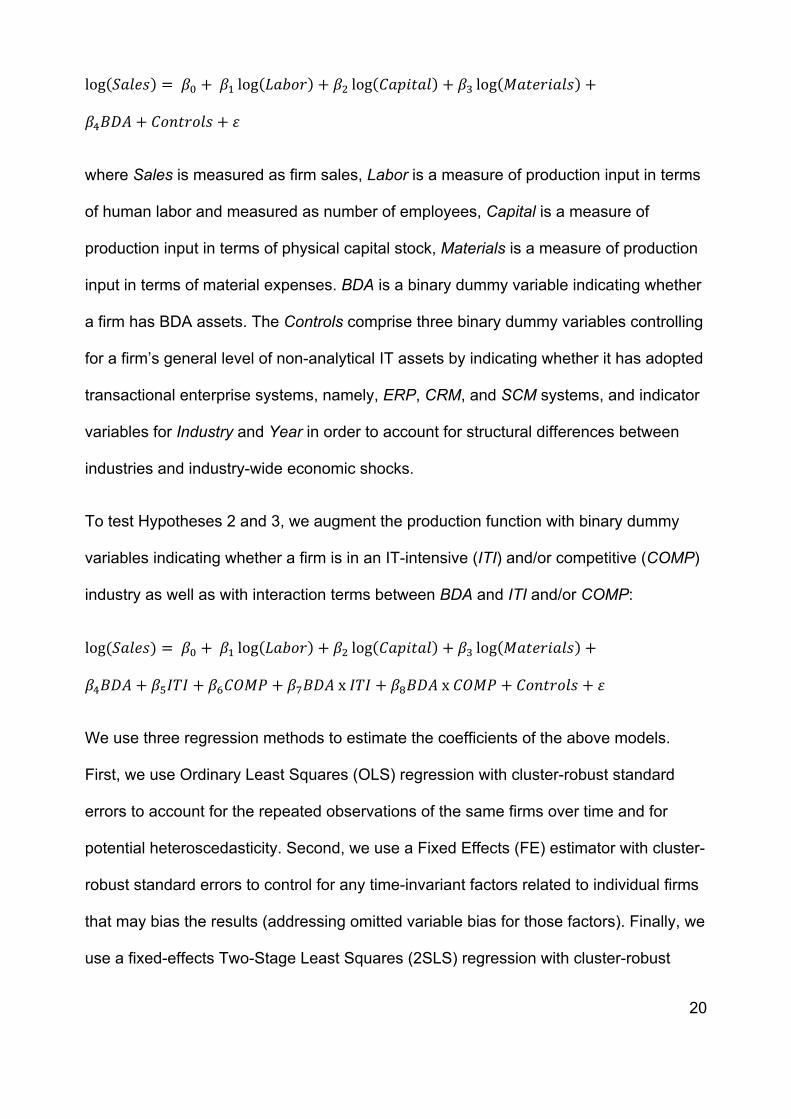
log 𝑆𝑎𝑙𝑒𝑠 = 𝛽, +𝛽. log 𝐿𝑎𝑏𝑜𝑟 + 𝛽3 log 𝐶𝑎𝑝𝑖𝑡𝑎𝑙 + 𝛽8 log 𝑀𝑎𝑡𝑒𝑟𝑖𝑎𝑙𝑠 +
𝛽:𝐵𝐷𝐴 + 𝐶𝑜𝑛𝑡𝑟𝑜𝑙𝑠 + 𝜀
where Sales is measured as firm sales, Labor is a measure of production input in terms
of human labor and measured as number of employees, Capital is a measure of
production input in terms of physical capital stock, Materials is a measure of production
input in terms of material expenses. BDA is a binary dummy variable indicating whether
a firm has BDA assets. The Controls comprise three binary dummy variables controlling
for a firm’s general level of non-analytical IT assets by indicating whether it has adopted
transactional enterprise systems, namely, ERP, CRM, and SCM systems, and indicator
variables for Industry and Year in order to account for structural differences between
industries and industry-wide economic shocks.
To test Hypotheses 2 and 3, we augment the production function with binary dummy
variables indicating whether a firm is in an IT-intensive (ITI) and/or competitive (COMP)
industry as well as with interaction terms between BDA and ITI and/or COMP:
log(𝑆𝑎𝑙𝑒𝑠) = 𝛽, +𝛽. log 𝐿𝑎𝑏𝑜𝑟 + 𝛽3 log 𝐶𝑎𝑝𝑖𝑡𝑎𝑙 + 𝛽8 log 𝑀𝑎𝑡𝑒𝑟𝑖𝑎𝑙𝑠 +
𝛽:𝐵𝐷𝐴 + 𝛽B𝐼𝑇𝐼 + 𝛽E𝐶𝑂𝑀𝑃 + 𝛽H𝐵𝐷𝐴x𝐼𝑇𝐼 + 𝛽J𝐵𝐷𝐴x𝐶𝑂𝑀𝑃 + 𝐶𝑜𝑛𝑡𝑟𝑜𝑙𝑠 + 𝜀
We use three regression methods to estimate the coefficients of the above models.
First, we use Ordinary Least Squares (OLS) regression with cluster-robust standard
errors to account for the repeated observations of the same firms over time and for
potential heteroscedasticity. Second, we use a Fixed Effects (FE) estimator with cluster-
robust standard errors to control for any time-invariant factors related to individual firms
that may bias the results (addressing omitted variable bias for those factors). Finally, we
use a fixed-effects Two-Stage Least Squares (2SLS) regression with cluster-robust
21
standard errors, Instrumental Variables (IV), and Fixed Effects (FE) to avoid potential
endogeneity issues. A well-known source of endogeneity in econometric studies on IT
business value is reverse causality, a situation in which the output determines one or
more of the inputs, rather than vice versa. For example, firms with high productivity can
build up slack resources that they may decide to invest in acquiring new, innovative
technologies, such as BDA. Another potential source of endogeneity is simultaneity
bias, that is, bias that arises because two or more variables are simultaneously
determined by the same omitted factors [4]. For example, if unobserved positive
external shocks to a firm’s output (e.g., because of an exceptionally high demand for its
products or hiring of a new highly-skilled management) occur during an observation
period, they may simultaneously increase productivity of the firm and its investments
into BDA assets. In such situations, firm’s BDA assets would be positively correlated
with productivity, but BDA assets would not be the cause of productivity gains. To
address these problems, we treat the BDA variable as well as the control variables for
ERP, CRM, and SCM as endogenous and use the average diffusion rates for these
systems in a company’s industry for a given year as instrumental variables to correct for
potential biases.
5. Results
The primary results regarding the estimates4 of the impact of BDA – as well as capital,
labor and materials5 – on firm output are shown in Table 6. As the Cobb-Douglas
production function measures the relationship between a firm’s inputs and its output,
and due to the log-transformation of the output variable, the coefficient of the BDA
4 All calculations were performed in Stata and R (PLM package) and yielded consistent results. 5 The estimated coefficients for capital, labor, and materials are comparable in magnitude to the values reported in the related literature (e.g., [29, 30, 61])

22
dummy variable can be interpreted as the percent productivity change associated with
owning BDA assets [4, 30].
To test Hypothesis 1, we estimate the general effect of BDA assets using three different
estimators. In Column 1 we examine the impact of BDA assets using a pooled Ordinary
Least Square (OLS) regression with cluster-robust standard errors. The results show a
positive and significant relationship between BDA and firm productivity, suggesting that
live BDA assets are associated with a 4.1% increase in firm productivity. Column 2
shows the results of estimating the same model using a Fixed Effects (FE) estimator,
which controls for additional time invariant firm-level factors. The coefficient of the BDA
variable remains significant and positive and is of the same magnitude (3.8%) as in the
model before. Finally, Column 3 shows the results of using a Two-Stage Least Squares
regression with Instrumental Variables and Fixed Effects (2SLS/IV with FE). In this
model, we treat the BDA variable as well as the control variables for a firm’s non-
analytical IT assets (i.e., ERP, CRM, SCM) as endogenous and use the average
percentage of adopters of BDA, ERP, CRM, and SCM in a firm’s industry as
instruments to control for potential biases arising from reverse causality or omitted
variables.6 The magnitude of the coefficient estimate of the BDA variable falls
considerably and becomes insignificant, indicating that the OLS and FE results should
be interpreted with caution and that direction of the causality between BDA and firm
productivity in these models remains unclear. Hence, our empirical evidence does not
fully support H1.
6 For all 2SLS/IV with FE models, we performed Hausman tests showing that the BDA, ERP, CRM, and SCM variables actually suffered from endogeneity and Weak Instruments tests ensuring that the instrumental variables are sufficiently strong correlated with the BDA, ERP, CRM, and SCM variables to act as valid instruments.

23
Column 4 shows the results of estimating a 2SLS/IV with FE model to test Hypothesis 2.
(In the following, we will only report the results of the 2SLS/IV with FE estimations, as
they are able to address potential endogeneity issues.) The main effect of BDA assets
on firm productivity becomes insignificant, but we see a significant positive relationship
between BDA assets and productivity for firms operating in IT-intensive industries. The
results suggest a 6.7% higher productivity for firms with live BDA assets in IT-intensive
industries, which compared to the models in Columns 1 and 2, is a substantial increase
in magnitude. As the 2SLS/IV estimator is able to control for endogeneity, we can be
more confident in interpreting these associations as causal relationships between BDA
assets and firm performance, hence providing empirical support for H2. Companies in
IT-intensive industries seem to profit substantially from live BDA assets, while
companies that are not in IT-intensive industries seem not to be able to extract
measurable productivity increases from BDA assets.
In Column 5 we examine the impact of BDA on firm productivity for companies in highly
competitive industries (Hypothesis 3). Again, the coefficient estimate for the main effect
of BDA assets is insignificant and the coefficient of the interaction term is significant and
positive. Comparing the productivity effect of BDA for companies in highly competitive
industries with the effect for companies in IT-intensive industries shows that it is slightly
lower in magnitude (5.7%), but still substantially larger than the estimates obtained
when averaging over all industries (H1). Again, these results indicate that live BDA
assets are associated with higher productivity for firms in highly competitive industries,
while for firms in non-competitive industries no measurable impacts can be observed.
Hence, the results support H3.

24
It is difficult to disentangle moderating effects of industry IT-intensity (H2) and
competitiveness (H3) on BDA business value, as many important industries in our
sample are both IT-intensive and highly competitive (e.g., manufacturing industries).
Column 6 shows the results of simultaneously considering the effect of both context
variables. The coefficient estimates for both interaction terms shrink in magnitude and
are only statistically significant at the 11% (for IT-intensity) and 24% (for
competitiveness) level. When considering these results in combination with the results
in Columns 4 and 5, it is likely that the lower coefficient estimates can be explained by
the reduced statistical power of the analysis when increasing complexity of the
regression model.

25
Table 6: Productivity Estimates
Dependent variable: log(Sales)
OLS FE 2SLS/IV with FE
2SLS/IV with FE
2SLS/IV with FE
2SLS/IV with FE
(1) (2) (3) (4) (5) (6)
log(Capital) 0.090*** 0.127*** 0.127*** 0.128*** 0.128*** 0.129***
(0.015) (0.029) (0.029) (0.029) (0.029) (0.029)
log(Labor) 0.296*** 0.472*** 0.472*** 0.471*** 0.471*** 0.470***
(0.024) (0.043) (0.043) (0.043) (0.043) (0.043)
log(Materials) 0.667*** 0.442*** 0.442*** 0.443*** 0.442*** 0.443***
(0.023) (0.035) (0.035) (0.035) (0.035) (0.035)
BDA 0.041** 0.038* 0.016 -0.031 -0.023 -0.047
(0.020) (0.021) (0.022) (0.032) (0.031) (0.037)
BDA x ITI 0.067* 0.053
(0.034) (0.033)
BDA x COMP 0.057* 0.039
(0.035) (0.033)
Industry dummies? Yes Yes Yes Yes Yes Yes
Year dummies? Yes Yes Yes Yes Yes Yes
IT Asset dummies? Yes Yes Yes Yes Yes Yes
Observations 5,698 5,698 5,698 5,698 5,698 5,698
R2 0.977 0.791 0.790 0.790 0.790 0.790
Adjusted R2 0.977 0.755 0.755 0.754 0.754 0.754
Notes: Robust standard errors are clustered on firms as shown in parentheses. IT Asset dummies include ERP, CRM, and SCM. All 2SLS/IV estimations use average percentage of BDA, ERP, CRM, and SCM adopters in a firm’s industry for a given year as instrumental variables.
*p<0.1; **p<0.05; ***p<0.01
26
6. Discussion
This paper is one of the first to quantify the impact of technical BDA assets on
productivity for a large and diverse sample of firms. Although prior studies (e.g., [12,
62]) have provided first empirical evidence for the positive impact of BDA on firm
performance, to the best of our knowledge our study is the first that completely relies on
objective measurements of BDA assets, rather than on self-reported perceptual
measures or proxies. In addition, our study is the first to provide detailed insights into
industry-specific differences in the business value of BDA. Hence, the main contribution
of our work is that it adds large-scale, reliable, and differentiated empirical evidence to
the emerging body of knowledge on the business value of BDA.
Our OLS and FE results for Hypothesis 1 indicate that when averaging over all
industries live BDA assets are associated with a 4 percent increase in firm productivity.
This estimate is in the range of effects that other econometric studies on the business
value of DDD [12] or investments in big data skills [62] have found, which lends
credibility to both our findings and theirs. However, the insignificant results obtained
from the 2SLS/IV with FE regression suggest that we have to be careful when
interpreting these relationships as a causal effect and that our estimates may be biased
due to reverse causality or omitted variables. Hence, building on our findings, future
research should continue to examine the causality between BDA and firm performance.
A promising approach might be to combine measures of BDA assets with data about
data-driven decision-making practices to model the information value chain at a more
fine-grained level, starting from the collection and extraction of knowledge from big data
via BDA assets over the actual use of this knowledge in decision making to enhanced
firm performance. In addition, it might also be helpful to consider other firm performance

27
measures than productivity. As Hitt et al. [30] noted, production functions are a “short
run measurement framework” (p. 80) and some firms or industries might not realize
short-term benefits from BDA, but rather mid- to long-term benefits. Or the benefits may
have a more intangible nature (e.g., more operational flexibility, deeper knowledge
about customers) and require unique measurement approaches in order to be detected.
Hence, another direction for future research is to triangulate and extend our findings
using different measurement instruments.
When testing Hypothesis 2 and 3, we found major differences in returns from BDA
between industries: While live BDA assets in firms in IT-intensive industries increase
productivity by 6.7 percent, we found no measurable productivity impacts of BDA assets
for firms outside of this group, supporting H2. Similarly, we found BDA-associated
productivity gains of 5.7 percent for firms in highly competitive industries and no
measurable productivity impact for firms that do not belong to those industries,
supporting H3. Both estimates were obtained by using 2SLS/IV with FE models which
control for reverse causality and omitted variables. Hence, when focusing at these
industry sub-groups, we can be more confident in interpreting the observed correlations
as cause-and-effect relationships. Our findings related to IT-intensity support the results
obtained by Tambe [62], who found that only firms with substantial data assets and
access to labor markets with big data skills are able to profit from big data investments.
These results can probably be explained by the fact that BDA solutions require
complementary IT assets and capabilities, such as transactional enterprise systems or
data scientists, that can provide the necessary data and skills to extract knowledge out
of this data. When it comes to industry competitiveness, our study is the first study
investigating its moderating effect on the process of extracting business value from big
data. It seems that BDA enables companies in highly concentrated markets to eliminate
28
slack, for example by automating routine decision-making tasks, and to design products
and services that offer superior value to the customer and are distinct from the
competition, for example, by making them smarter through data and algorithms [67].
Overall, our analysis of industry-specific differences in the value of BDA should motivate
future research to empirically investigate further industry-level moderators, such as, the
nature of the value proposition (e.g., product vs service, tangible vs intangible, physical
vs digital), the type of markets (e.g., B2B vs B2C), or different distribution channels
(e.g., online vs bricks-and-mortar).
Our findings also have important managerial implications. Overall, they suggest that
BDA is a productive investment and that the returns that can be yielded are more
lucrative than for many other types of IT assets [59, 60]. However, before deciding to
invest in BDA assets, managers should consider the specifics of the industry in which
they operate, as our findings suggest that only companies in IT-intensive and/or highly
completive industries experience measurable productivity improvements that can be
associated with BDA. By quantifying magnitude of these improvements, our study can
inform decision makers in preparing business cases calculating the costs and benefits
of BDA assets before making investment decisions.
7. Limitations
As is the case with any econometric study, our research design has certain limitations.
Methodologically, our findings can potentially be undermined by a multitude of
interrelated factors that influence firm productivity, not all of which we were able to
consider in our model specifications. Although we used instrumental variables
regression to address potential endogeneity problems, one has to be careful with
interpreting the relationship between BDA assets and productivity as a causal
29
relationship, as it is difficult to control for temporal precedence and alternative
explanations in an observational study. In addition, there are a number of limitations that
are related to our dataset. First, our dataset includes only companies that are publicly
traded on U.S. stock exchanges. Although our sampling choice was justified by the
availability of financial performance data, it restricts the generalizability of our findings to
medium and large enterprises that act in global markets. Second, we investigated only
companies that adopted BDA solutions from one particular vendor. Although this vendor
is among the global leaders in enterprise systems, care should be taken in transferring
our findings to BDA solutions that come from other vendors or are based on other
technical architectures (e.g. open-source solutions for distributed big data processing,
such as Hadoop). Third, our models do not include lagged variables to test for time lags
in the effect of BDA assets on firm productivity. Introducing time lags leads to a
decrease of the number of observations in a panel dataset, which, in our case, led to a
substantial reduction of the statistical power of our regression models. Testing for time
lags with larger datasets could therefore be another direction for further research.
Finally, our study focused on technical BDA assets, that is, ownership of hardware and
software licenses, and did not explicitly measure other types of BDA assets, such as,
BDA-related human resources or management capabilities [55]. Although the effects of
the latter types of assets on firm performance have been investigated in other studies
[12, 62], future research should aim to simultaneously quantify the business value of
technical, human, and managerial BDA assets.
8. Outlook
The market for BDA solutions is one of the fastest-growing IT markets, and while
companies across industries are making substantial investments in BDA, the body of
30
empirical evidence for the positive impact of BDA on organizational performance is still
only emerging. Against this background, our study makes a substantial contribution to
the body of knowledge on IT business value and business analytics by adding large-
scale, reliable, empirical evidence for the positive effect of BDA assets on firm
productivity while also highlighting industry-level variables that can constrain firms’
ability to profit from BDA. The fact that not all companies in our sample showed
immediate measurable productivity effects of BDA also provides motivation for further
research on the business value of BDA. Besides studying other industry-level
conditions, researchers should study the business value of various types of BDA assets,
such as infrastructural, transactional, informational, and strategic BDA assets [66]. In
addition, some organizational functions may benefit more from BDA than others. For
example, research has suggested that most companies implement BDA to support
customer-facing business processes [53, 6, 3].
9. References
1. Abbasi, A., Sarker, S., and Chiang, R. H. Big data research in information systems:
Toward an inclusive research agenda. Journal of the Association for Information
Systems, 17, 2 (February 2016), i – xxxii.
2. Accenture. Winning with analytics. 2016 (available at www.accenture.com/us-
en/~/media/Accenture/next-gen/hp-analytics/pdf/Accenture-Linking-Analytics-to-High-
Performance-Executive-Summary.pdf).
3. Acker, O., Gröne, F., Blockus, A., and Bange, C. In-memory analytics–strategies for
real-time CRM. Journal of Database Marketing & Customer Strategy Management, 18,
2 (July 2011), 129-136.
31
4. Aral, S., Brynjolfsson, E., and Wu D.J. Which came first, IT or productivity? The
virtuous cycle of investment and use in enterprise systems. Proceedings of the
International Conference on Information Systems, Milwaukee (December 2006), 1-22.
5. Asadi Someh, I., and Shanks, G. How Business Analytics Systems Provide Benefits
and Contribute to Firm Performance? Proceedings of the European Conference on
Information Systems, Münster (May 2015), 1-16.
6. Bange, C., Grosser, T., and Janoschek, N. Big Data Use Cases: Getting real on data
monetization. BARC Research Study, July 2015 (available at barc-
research.com/research/big-data-use-cases-2015/).
7. Basole, R. C., Seuss, C. D., and Rouse, W. B. IT innovation adoption by enterprises:
Knowledge discovery through text analytics. Decision Support Systems, 54, 2 (January
2013), 1044-1054.
8. Blackwell, D. Equivalent comparisons of experiments. The Annals of Mathematical
Statistics, 24, 2 (June 1953), 265-272.
9. Bloom, N., Sadun, R., and Van Reenen, J. Americans Do IT Better: US Multinationals
and the Productivity Miracle. American Economic Review, 102, 1 (February 2012), 167-
201.
10. Brynjolfsson, E., and Yang, S. Information technology and productivity: a review of
the literature. Advances in Computers, 43 (January 1996), 179-214.
11. Brynjolfsson, E., and Hitt, L. M. Paradox lost? Firm-level evidence on the returns to
information systems spending. Management Science, 42, 4 (April 1996), 541-558.
32
12. Brynjolfsson, E., Hitt, L. M., and Kim, H. H. Strength in numbers: How does data-
driven decision-making affect firm performance? Technical report. April 22, 2011
(available at ssrn.com/abstract=1819486)
13. Cabot Partners Group. Cost-Benefit Analysis: Comparing the IBM PureData System
with Hadoop Implementations for Structured Analytics. April 2015 (available at
tdwi.org/~/media/81023B6D9E3F4C9C870378E6FCD42227.PDF).
14. CEBR. Data equity. Unlocking the value of big data. Report for SAS. April 2017
(available at https://www.cebr.com/wp-content/uploads/2013/03/1733_Cebr_Value-of-
Data-Equity_report.pdf)
15. Chen, H., Chiang, R. H., and Storey, V. C. Business intelligence and analytics:
From big data to big impact. MIS Quarterly, 36, 4 (December 2012), 1165-1188.
16. Cetorelli, N., and Strahan, P. E. Finance as a barrier to entry: Bank competition and
industry structure in local US markets. The Journal of Finance, 61, 1 (February 2006),
437-461.
17. Côrte-Real, N., Oliveira, T., and Ruivo, P. (2016). Assessing business value of Big
Data Analytics in European firms. Journal of Business Research. Article in press
(available at: dx.doi.org/10.1016/j.jbusres.2016.08.011)
18. Davenport, T. H., and Harris, J. G. Competing on analytics: The new science of
winning. Boston: Harvard Business Press, 2007.
19. Dehning B., Richardson V.J., and Zmud R.W. The Financial Performance Effects of
IT-Based Supply Chain Management Systems in Manufacturing Firms. Journal of
Operations Management, 25, 4 (June 2007), 806–824.

33
20. De Oliveira, M. P. V., McCormack, K., and Trkman, P. Business analytics in supply
chains–The contingent effect of business process maturity. Expert systems with
applications, 39, 5 (April 2012), 5488-5498.
21. Einav, L., and Levin, J. The Data Revolution and Economic Analysis. Technical
report. Innovation Policy and the Economy, 14 (June 2014), 1-24.
22. Elbashir, M. Z., Collier, P. A., and Davern, M. J. Measuring the effects of business
intelligence systems: The relationship between business process and organizational
performance. International Journal of Accounting Information Systems, 9, 3 (September
2008), 135-153.
23. Feng, K., Chen, E.T., and Liou, W. Implementation of knowledge management
systems and firm performance: an empirical investigation. Journal of Computer
Information Systems, 45, 2 (January 2005), 92-104.
24. Galbraith, J. R. Organization design: An information processing view. Interfaces, 4,
3 (May 1974), 28-36.
25. Gartner. Magic Quadrant for Advanced Analytics Platforms. February 9, 2016
(available at www.gartner.com/doc/reprints?id=1-2YEIILW&ct=160210&st=sb).
26. Gartner. Magic Quadrant for Business Intelligence and Analytics Platforms.
February 4, 2016 (available at www.gartner.com/doc/reprints?id=1-
2XYY9ZR&ct=160204&st=sb).
27. Gorry, G. A., and Scott Morton, M. S. A framework for management information
systems. Cambridge: Massachusetts Institute of Technology, 1971.

34
28. Hendricks, K. B., Singhal, V. R., and Stratman, J. K. The impact of enterprise
systems on corporate performance: A study of ERP, SCM, and CRM system
implementations. Journal of Operations Management, 25, 1 (January 2007), 65-82.
29. Hitt, L. M., and Brynjolfsson, E. Productivity, business profitability, and consumer
surplus: three different measures of information technology value. MIS Quarterly, 20, 2
(June 1996), 121–142.
30. Hitt, L. M., Wu D. J., and Zhou, X. Investment in enterprise resource planning:
Business impact and productivity measures. Journal of Management Information
Systems, 19, 1 (Summer 2002), 71-98.
31. Hu, Q., and Quan, J.J. Evaluating the impact of IT investments on productivity: A
causal analysis at industry level. International Journal of Information Management, 25, 1
(February 2005), 39-53.
32. Hunton, J. E., Lippincott, B., and Reck, J. L. Enterprise resource planning systems:
comparing firm performance of adopters and nonadopters. International Journal of
Accounting Information Systems, 4, 3 (September 2003), 165-184.
33. IBM. The essential CIO: Insights from the global chief information officer study
executive summary. New York, NY: IBM Global Services, 2011.
34. IDC. Worldwide Big Data and Business Analytics Revenues Forecast to Reach
$187 Billion in 2019, According to IDC. Press release. May 23, 2016 (available at
www.idc.com/getdoc.jsp?containerId=prUS41306516).

35
35. Kohli, R., and Devaraj, S. Contribution of institutional DSS to organizational
performance: evidence from a longitudinal study. Decision Support Systems, 37, 1 (April
2004), 103-118.
36. LaValle, S., Lesser, E., Shockley, R., Hopkins, M. S., and Kruschwitz, N. Big data,
analytics and the path from insights to value. MIT Sloan Management Review, 52, 2
(Winter 2011), 21-31.
37. Lee, B., and Menon, N. M. Information technology value through different normative
lenses. Journal of Management Information Systems, 16, 4 (March 2000), 99-119.
38. Lee, S., and Kim, S. H. A lag effect of IT investment on firm performance.
Information Resources Management Journal, 19, 1 (January 2006), 43-69.
39. Leibenstein, H. Allocative efficiency vs." X-efficiency". The American Economic
Review, 56, 3 (June 1966), 392-415.
40. Lindbeck, A., and Snower, D. J. Multitask learning and the reorganization of work:
From Tayloristic to holistic organization. Journal of Labor Economics, 18, 3 (July 2000),
353–376.
41. Mahmood, M.A., and Mann, G.J. Information Technology Investments and
Organizational Productivity and Performance: An Empirical Investigation. Journal of
Organizational Computing and Electronic Commerce, 15, 3 (January 1995), 185-202.
42. Malladi, S., and Krishnan, M. Determinants of Usage Variations of Business
Intelligence & Analytics in Organizations–An Empirical Analysis. Proceedings of the
International Conference on Information Systems, Milan (December 2013), 1-22.

36
43. Mangin, P., Hovelaque, V., and Bironneau, L. Enterprise Resource Planning
contribution to firm performance: A literature review over the last 15 years. Proceedings
of the Congres International De Genie Industriel, Québec (October 2015), 1-10.
44. Manyika, J., Chui, M., Brown, B., Bughin, J., Dobbs, R., Roxburgh, C. and
McKinsey Global Institute. Big data: The next frontier for innovation, competition, and
productivity. June 2011 (available at www.mckinsey.com/business-functions/business-
technology/our-insights/big-data-the-next-frontier-for-innovation).
45. Melville, N., Gurbaxani, V., and Kraemer, K. The productivity impact of information
technology across competitive regimes: The role of industry concentration and
dynamism. Decision Support Systems, 43, 1 (February 2007), 229-242.
46. Mithas, S., Ramasubbu, N., and Sambamurthy, V. How Information Management
Capability Influences Firm Performance. MIS Quarterly, 35, 1 (March 2011), 237-256.
47. OECD. Data-driven innovation for growth and well-being. Interim synthesis report.
Paris: OECD Publishing, 2014.
48. Poston, R., and Grabski, S. The impact of enterprise resource planning systems on
firm performance. Proceedings of the International Conference on Information Systems,
Atlanta (December 2000), 479-493.
49. PriceWaterHouseCoopers. Investing in America’s data science and analytics talent.
Business Higher Education Forum, April 2017 (available at
https://www.pwc.com/us/en/publications/assets/investing-in-america-s-dsa-talent-bhef-
and-pwc.pdf).
37
50. Rhoades, Stephen A. The Herfindahl-Hirschman index. Federal Reserve Bulletin,
79, 3 (March 1993), 188-189.
51. Sabherwal, R., and Jeyaraj, A. Information Technology Impacts on Firm
Performance: An Extension of Kohli and Devaraj (2003), MIS Quarterly, 39, 4
(December 2015), 809-836.
52. Sathye, M. X-efficiency in Australian banking: An empirical investigation. Journal of
Banking & Finance, 25, 3 (March 2001), 613-630.
53. Saunders, A. Has Information Technology Leveled the Competitive Playing Field?
Wharton School, University of Pennsylvania, Philadelphia (2010). Working paper
(available at dspace.mit.edu/bitstream/handle/1721.1/68967/773931578-
MIT.pdf?sequence=2#page=59).
54. Schroeck, M., Shockley, R., Smart, J., Romero-Morales, D., and Tufano, P.
Analytics: The real-world use of big data. Executive report. NY: IBM Institute for
Business Value, 2012.
55. Schryen, G. Revisiting IS Business Value Research: What we already know, what
we still need to know, and how we can get there. European Journal of Information
Systems, 22, 2 (March 2013), 139-169.
56. Sharma, R., Mithas, S., and Kankanhalli, A. Transforming decision-making
processes: a research agenda for understanding the impact of business analytics on
organisations. European Journal of Information Systems, 23, 4 (July 2014), 433-441.

38
57. Sircar, S., Turnbow, J. L., and Bordoloi, B. A framework for assessing the
relationship between information technology investments and firm performance. Journal
of Management Information Systems, 16, 4 (March 2000), 69–97.
58. Sodenkamp, M., Kozlovskiy, I., and Staake, T. Gaining IS Business Value through
Big Data Analytics: A Case Study of the Energy Sector. Proceedings of the International
Conference of Information Systems, Fort Worth (December 2015), 1-19.
59. Stiroh, K. J. Information technology and the US productivity revival: what do the
industry data say? FRB of New York Staff Report. January 2001 (available at
papers.ssrn.com/sol3/papers.cfm?abstract_id=923623).
60. Stiroh, K. J. Investing in information technology: Productivity payoffs for US
industries. Current Issues in Economics and Finance, 7, 6 (June 2001), 1-6.
61. Tambe, P., Hitt, L. M., and Brynjolfsson, E. The extroverted firm: How external
information practices affect innovation and productivity. Management Science, 58, 5
(May 2012), 843-859.
62. Tambe P. Big Data Investment, Skills, and Firm Value. Management Science, 60, 6
(June 2014), 1452-1469.
63. Teece, D. J. Profiting from technological innovation: Implications for integration,
collaboration, licensing and public policy. Research policy, 15, 6 (December 1986), 285-
305.
64. vom Brocke, J., Debortoli, S., Müller, O., and Reuter, N. How in-memory technology
can create business value: insights from the Hilti case. Communications of the
Association for Information Systems, 34, 1 (January 2014), 151-167.

39
65. Wegener, R., and Sinha, V. The value of Big Data: How analytics differentiates
winners. Bain & Company, 2013 (available at
www.bain.com/Images/BAIN%20_BRIEF_The_value_of_Big_Data.pdf)
66. Weill, P., and Broadbent, M. Leveraging the New Infrastructure: How Market Leaders
Capitalize on IT. Boston: Harvard Business School Press, 1998.
67. Wixom, B.H., and Ross, J.W. How to Monetize Your Data. MIT Sloan Management,
January 2017 (available at sloanreview.mit.edu/article/how-to-monetize-your-data/)
68. WSJ. Custom Studios. Data mastery: The global driver of revenue. Oracle, CA,
2015 (available at www.oracle.com/us/dm/global-executive-study-2618506.pdf).
69. Zuboff, S. Automate/Informate: the two faces of intelligent technology.
Organizational Dynamics, 14, 2 (September 1985), 5-18.
70. Zwanziger, J., Melnick, G. A., and Bamezai, A. Costs and price competition in
California hospitals, 1980-1990. Health Affairs, 13, 4 (Fall 1994), 118-126.

40
10. Appendix
Figure 1: Distribution of firms by industries (SIC-1 level)

41
Oliver Müller is an Associate Professor in the Business IT department at the IT University of Copenhagen. He holds a BSc and MSc in Information Systems and a Ph.D. from the University of Münster's School of Business and Economics. In his research, Oliver studies how organizations create value with (big) data and analytics; for example, by enhancing judgment and decision making, supporting knowledge management, or automating business processes. His research has been published in the Journal of the Association of Information Systems, European Journal of Information Systems, Management Information Systems Quarterly Executive, European Journal of Operational Research, Decision Support Systems, and various others.
Maria Fay is a Ph.D. candidate in Business Economics (Information and Process Management) at the University of Liechtenstein. She holds a BSc and MSc in Business Informatics and is currently working on her dissertation investigating the relationship between advanced analytics and business value. Maria has experience in IT strategy and technology innovation consulting, and her current research interests include effects of technology adoption on firm performance and decision making.
Jan vom Brocke is professor for Information Systems at the University of Liechtenstein. He is the Hilti Endowed Chair of Business Process Management, Director of the Institute of Information Systems, and Vice-President Research and Innovation at the University of Liechtenstein. His research has been published, among others, in Management Information Systems Quarterly, Journal of Management Information Systems, European Journal of Information System, Information Systems Journal, Communications of the ACM, as well as in practitioner-oriented outlets such as MISQ Executive and MIT Sloan Management Review. He is author and editor of seminal books, including the International Handbook on Business Process Management. He has held various editorial roles and leadership positions in Information Systems research and education.

42
Oliver Müller, IT University of Copenhagen, Department of Business IT, Rued Langgaards Vej 7, 2300 Copenhagen, Denmark, +45 72185069, [email protected]
Maria Fay, University of Liechtenstein, Institute of Information Systems, Fürst-Franz-Josef-Strasse, 9490 Vaduz, Liechtenstein, +423 2651300, [email protected]
Jan vom Brocke, University of Liechtenstein, Institute of Information Systems, Fürst-Franz-Josef-Strasse, 9490 Vaduz, Liechtenstein, +423 2651300, [email protected],