the effect of board and audit committee characteristics on
TRANSCRIPT
The Effect of Board and Audit Committee Characteristics on
the Financial Performance of United Arab Emirates Firms
Abdulfattah Mohamed G Khalifa H
BM, MHR, MBA (Business)
A thesis submitted in fulfilment of the requirements for the degree of
Doctor of Business Administration
College of Business
Victoria University
Melbourne
Australia
July 2018
i
Abstract
Corporate governance has received a great deal of attention because of financial scandals
and corporate failures, such as with Enron, WorldCom, Global Crossing and Arthur
Andersen, to name a few. Although previous studies have explored the relationship
between corporate governance and financial performance, limited research exists on the
effects of corporate governance on financial performance in the United Arab Emirates
(UAE). The main purpose of this study was to study the effects of corporate governance—
comprising board characteristics and audit committee characteristics—on the financial
performance of listed companies in the UAE, covering the period from 2006 to 2015. In
addition, this study undertook a comparison of the changes to corporate governance
practices, based on the UAE corporate governance codes, for three different periods of
time between 2006 to 2007, 2009 to 2010 and 2013 to 2014. The study sample included
47 listed firms in the UAE.
This research adopted a multi-theoretic approach, incorporating agency theory and
resource dependence theory, to develop a context-specific UAE corporate governance
framework to guide the study. A multiple regression panel model was employed to
examine the effects of corporate governance characteristics on firm financial
performance. In addition, an ordinary least squares model, along with analysis of variance
testing, was employed to compare the effect of changes to financial performance arising
from changes to the UAE corporate governance codes.
The results demonstrated that board size and board meetings had a positive relationship
with financial performance, while, from an overall perspective, there was no association
between board composition (independent directors) and financial performance. The
variables of board members’ education and board members’ experience had an
insignificant relationship with firm financial performance. With respect to audit
committee characteristics, there was no significant relationship between audit committee
size and firm financial performance. However, there were positive relationships between
both audit committee composition and audit committee members’ education and firm
financial performance. Finally, the number of audit committee meetings had an overall
positive association with financial performance.
ii
The two amendments made to the corporate governance code during the study period
affected the audit and board committee characteristics, as intended by these amendments.
Of these amendments, the second amendment had the most significant effect on board
meetings, board members’ education, board members’ experience, audit committee
meetings and audit committee members’ education.
The potential policy implications arising from the study consist of the following: (i)
rationalising audit committee size to help improve firm financial performance; (ii) firms
to employ directors with a more diverse skill set to enhance board effectiveness; (iii)
strengthening corporate governance reporting; (iv) specifying a maximum proportion of
independent board members; (v) requiring all members of the audit committee to be
independent to better monitor the performance of the board; and (vi) requiring audit
committee members to have a recognised qualification in finance or significant expertise
in accounting and financial affairs.
iii
Declaration
I, Abdulfattah Mohamed G Khalifa H, declare that the Doctor of Business Administration
thesis entitled ‘The Effect of Board and Audit Committee Characteristics on the Financial
Performance of United Arab Emirates Firms’ is no more than 65,000 words in length,
including quotations and exclusive of tables, figures, appendices, bibliography,
references and footnotes. This thesis contains no material that has been submitted
previously, in whole or in part, for the award of any other academic degree or diploma.
Except where otherwise indicated, this thesis is my own work.
Signature: Abdulfattah Mohamed G Khalifa H Date: 4 July 2018

iv
Dedication
This thesis is lovingly dedicated to my father,
mother, wife, sisters and brothers for their support,
encouragement and constant love that have sustained
me throughout my life. I love you all dearly. I also
dedicate this work and give special thanks to my
supervisors, Dr Riccardo Natoli and Dr Segu Zuhair,
for their friendly support and encouragement.

v
Acknowledgments
I would like to express my special appreciation and thanks to my principal supervisor, Dr
Riccardo Natoli, for his guidance during the research and writing of this thesis. I would
also like to thank my associate supervisor, Dr Segu Zuhair, for encouraging my research
and allowing me to grow as a research scientist. His advice on both research and my
career has been priceless. I could not imagine having better advisors and mentors for my
study.
I would like to extend my gratitude to all the staff at the College of Business and Victoria
University. Thanks are also extended to all members of the college doctoral group. This
is a special group of people who I consider members of my extended family. We were
always there for each other and I will always appreciate the encouragement and goodwill
we shared.
I am grateful to Libya for providing me with a scholarship. In addition, special recognition
goes to my family for their support, encouragement and patience during my pursuit of the
Doctorate in Business Administration. Words cannot express how grateful I am to my
parents, wife, brothers and sister. The support and sacrifices they have made on my behalf
throughout writing this thesis, and my life in general, will not be forgotten. I would also
like to thank all my friends who supported me in striving towards my goal.

vi
Contents
Abstract ...................................................................................................................... i Declaration ............................................................................................................... iii Dedication ................................................................................................................. iv
Acknowledgments ..................................................................................................... v
Contents .................................................................................................................... vi List of Tables ............................................................................................................ xi List of Figures ........................................................................................................ xiii List of Abbreviations ............................................................................................. xiv
Chapter 1: Introduction ........................................................................................... 1 1.1 Background to the Study .................................................................................. 1 1.2 Definition of Key Terms ................................................................................... 5
1.2.1 Corporate Governance ............................................................................... 5 1.2.2 Board Characteristics ................................................................................. 5 1.2.3 Audit Committee Characteristics .............................................................. 6 1.2.4 Key Definitions of the Research ................................................................ 6
1.3 Research Problem ............................................................................................. 7 1.4 Aims of the Research ........................................................................................ 8 1.5 Overview of the Conceptual Framework and Research Method ...................... 8 1.6 Statement of Significance ............................................................................... 11 1.7 Organisation of the Thesis .............................................................................. 11
Chapter 2: Literature Review ............................................................................... 12 2.1 Introduction .................................................................................................... 12 2.2 Defining Corporate Governance ..................................................................... 12 2.3 Corporate Governance Theories ..................................................................... 13
2.3.1 Agency Theory ........................................................................................ 13 2.3.2 Stakeholder Theory ................................................................................. 17 2.3.3 Stewardship Theory ................................................................................. 20 2.3.4 Resource Dependence Theory ................................................................. 22 2.3.5 Transaction Cost Theory ......................................................................... 24 2.3.6 Multi-theoretic Approach to Corporate Governance Characteristics for
United Arab Emirates Listed Firms ........................................................ 29 2.4 Empirical Studies on Board Characteristics ................................................... 30
2.4.1 Board Size ............................................................................................... 31 2.4.1.1 Positive Associations between Board Size and Firm Financial
Performance ................................................................................................. 33 2.4.1.2 Negative and Insignificant Associations between Board Size and Firm
Financial Performance ................................................................................ 34 2.4.2 Board Composition .................................................................................. 35 2.4.2.1 Positive Associations between Board Composition and Firm Financial
Performance ................................................................................................. 36 2.4.2.2 Negative and Insignificant Associations between Board Composition
and Firm Financial Performance ................................................................ 37 2.4.3 Board Meetings ....................................................................................... 38

vii
2.4.3.1 Positive Associations between Board Meetings and Firm Financial Performance ................................................................................................. 39
2.4.3.2 Negative and Insignificant Associations between Board Meetings and Firm Financial Performance ....................................................................... 40
2.4.4 Board Members’ Education ..................................................................... 41 2.4.4.1 Positive Associations between Board Members’ Education and Firm
Financial Performance ................................................................................ 41 2.4.4.2 Negative and Insignificant Associations between Board Members’
Education and Firm Financial Performance ............................................... 42 2.4.5 Board Members’ Experience ................................................................... 43 2.4.5.1 Positive Associations between Board Members’ Experience and Firm
Financial Performance ................................................................................ 43 2.4.5.2 Negative and Insignificant Associations between Board Members’
Experience and Firm Financial Performance ............................................. 44 2.5 Empirical Studies on Audit Committee Characteristics ................................. 45
2.5.1 Audit Committee Size ............................................................................. 45 2.5.1.1 Positive Associations between Audit Committee Size and Firm
Financial Performance ................................................................................ 46 2.5.1.2 Negative and Insignificant Associations between Audit Committee Size
and Firm Financial Performance ................................................................ 47 2.5.2 Audit Committee Composition ................................................................ 48 2.5.2.1 Positive Associations between Audit Committee Composition and Firm
Financial Performance ................................................................................ 49 2.5.2.2 Negative and Insignificant Associations between Audit Committee
Composition and Firm Financial Performance ........................................... 49 2.5.3 Audit Committee Meetings ..................................................................... 50 2.5.3.1 Positive Associations between Audit Committee Meetings and Firm
Financial Performance ................................................................................ 51 2.5.3.2 Negative and Insignificant Associations between Audit Committee
Meetings and Firm Financial Performance ................................................. 51 2.5.4 Audit Committee Members’ Education ................................................... 52 2.5.4.1 Positive Associations between Audit Committee Members’ Education
and Firm Financial Performance ................................................................ 53 2.5.4.2 Negative and Insignificant Associations between Audit Committee
Members’ Education and Firm Financial Performance .............................. 53 2.6 Corporate Governance in the United Arab Emirates ...................................... 54
2.6.1 United Arab Emirates Corporations Act of 1984 .................................... 54 2.6.2 Role of United Arab Emirates Securities and Commodities Authority in
Corporate Regulations No. 3 of 2000 ..................................................... 55 2.6.3 Federal Law No. 2 of 2015 Concerning Commercial Companies .......... 56 2.6.4 The United Arab Emirates Corporate Governance Code ........................ 57
2.7 Literature Gap ................................................................................................. 61 2.8 Conclusion ...................................................................................................... 61
Chapter 3: Conceptual Framework and Research Methods Used .................... 63 3.1 Introduction .................................................................................................... 63 3.2 Conceptual Framework ................................................................................... 63 3.3 Corporate Governance Variables and Hypotheses Development ................... 66
3.3.1 Board Size ............................................................................................... 66 3.3.2 Board Composition .................................................................................. 68 3.3.3 Board Meetings ....................................................................................... 70
viii
3.3.4 Board Members’ Education ..................................................................... 72 3.3.5 Board Members’ Experience ................................................................... 74 3.3.6 Audit Committee Size ............................................................................. 76 3.3.7 Audit Committee Composition ................................................................ 78 3.3.8 Audit Committee Meetings ..................................................................... 80 3.3.9 Audit Committee Members’ Education ................................................... 82
3.4 Firm Financial Performance Variables and Control Variables ...................... 84 3.5 Research Methodology ................................................................................... 90
3.5.1 Research Method Types .......................................................................... 90 3.5.2 Research Methods Adopted by Previous Studies .................................... 91 3.5.3 Research Method for the Present Study .................................................. 92 3.5.3.1 Correlation Matrix .............................................................................. 93 3.5.3.2 Tests for Collinearity ........................................................................... 93 3.5.3.3 Tests for Autocorrelation and Heteroscedasticity ............................... 94 3.5.3.4 Ordinary Least Squares ....................................................................... 95 3.5.3.5 Panel Data Model ............................................................................... 95
3.5.3.5.1 Random-effects Model .................................................................. 96 3.5.3.5.2 Fixed-effects Model ....................................................................... 97
3.5.3.6 Hausman Test ...................................................................................... 97 3.5.3.7 Lagrange Multiplier Test ..................................................................... 98 3.5.3.8 Analysis of Variance ............................................................................ 98
3.6 Methods Used for This Research .................................................................... 99 3.7 Data Collection and Sources......................................................................... 101 3.8 Study Sample ................................................................................................ 102 3.9 Conclusion .................................................................................................... 103
Chapter 4: Results and Discussion ...................................................................... 104 4.1 Introduction .................................................................................................. 104 4.2 Descriptive Statistics .................................................................................... 104
4.2.1 Board Characteristics ............................................................................. 104 4.2.2 Audit Committee Characteristics .......................................................... 105 4.2.3 Firm Financial Performance Variables .................................................. 106
4.3 Correlation Matrix ........................................................................................ 109 4.4 Panel Data and Ordinary Least Squares Regression Analysis ..................... 112 4.5 Collinearity ................................................................................................... 112 4.6 Results of Research Objective 1 ................................................................... 113
4.6.1 Effects of Return on Assets ................................................................... 113 4.6.2 Effects of Return on Equity ................................................................... 114 4.6.3 Effects of Tobin’s Q .............................................................................. 116
4.7 Results of Research Objective 2 ................................................................... 118 4.7.1 Ordinary Least Squares ......................................................................... 118 4.7.1.1 Effects of Return on Assets Model ..................................................... 118 4.7.1.2 Effects of Return on Equity Model .................................................... 120 4.7.1.3 Effects of Tobin’s Q Model ................................................................ 121
4.7.2 Analysis of Variance ............................................................................. 123 4.7.2.1 One-way Analysis of Variance .......................................................... 123 4.7.2.2 Multiple Comparisons (Tukey’s Honestly Significant Difference) .... 125
4.7.2.2.1 Board Size ................................................................................... 126 4.7.2.2.2 Board Composition ...................................................................... 126 4.7.2.2.3 Board Meetings ........................................................................... 127 4.7.2.2.4 Board Members’ Education ......................................................... 127

ix
4.7.2.2.5 Board Members’ Experience ....................................................... 127 4.7.2.2.6 Audit Committee Size ................................................................. 127 4.7.2.2.7 Audit Committee Composition .................................................... 127 4.7.2.2.8 Audit Committee Meeting ........................................................... 128 4.7.2.2.9 Audit Committee Members’ Education ....................................... 128 4.7.2.2.10 Firm Financial Performance Variables ...................................... 128
4.8 Discussion of Research Objective 1 for All Models .................................... 129 4.8.1 Board Size ............................................................................................. 131 4.8.2 Board Composition ................................................................................ 131 4.8.3 Board Meetings ..................................................................................... 132 4.8.4 Board Members’ Education ................................................................... 133 4.8.5 Board Members’ Experience ................................................................. 134 4.8.6 Audit Committee Size ........................................................................... 134 4.8.7 Audit Committee Composition .............................................................. 135 4.8.8 Audit Committee Meetings ................................................................... 136 4.8.9 Audit Committee Members’ Education ................................................. 137
4.9 Discussion of Research Objective 2 ............................................................. 137 4.9.1 Board Size ............................................................................................. 140 4.9.2 Board Composition ................................................................................ 140 4.9.3 Board Meetings ..................................................................................... 141 4.9.4 Board Members’ Education ................................................................... 141 4.9.5 Board Members’ Experience ................................................................. 142 4.9.6 Audit Committee Size ........................................................................... 143 4.9.7 Audit Committee Composition .............................................................. 143 4.9.8 Audit Committee Meetings ................................................................... 144 4.9.9 Audit Committee Members’ Education ................................................. 145
4.10 Conclusion .................................................................................................. 146
Chapter 5: Conclusion and Recommendations ................................................. 147 5.1 Introduction .................................................................................................. 147 5.2 Research Summary ....................................................................................... 147 5.3 Research Conclusions ................................................................................... 150
5.3.1 Research Objective 1 ............................................................................. 150 5.3.1.1 H1: Board Size .................................................................................. 150 5.3.1.2 H2: Board Composition .................................................................... 151 5.3.1.3 H3: Board Meetings .......................................................................... 151 5.3.1.4 H4: Board Members’ Education ....................................................... 151 5.3.1.5 H5: Board Members’ Experience ...................................................... 152 5.3.1.6 H6: Audit Committee Size ................................................................. 152 5.3.1.7 H7: Audit Committee Composition ................................................... 152 5.3.1.8 H8: Audit Committee Meetings ......................................................... 152 5.3.1.9 H9: Audit Committee Members’ Education ...................................... 153
5.3.2 Research Objective 2 ............................................................................. 153 5.4 Contributions of the Study ............................................................................ 154 5.5 Implications .................................................................................................. 154
5.5.1 Improving Directors’ Skills ................................................................... 154 5.5.2 Strengthening Corporate Governance Reporting .................................. 155 5.5.3 Rationalising Audit Committee Size ..................................................... 155 5.5.4 Specifying a Maximum Proportion of Independent Members .............. 155 5.5.5 Specifying Independent Audit Committee Members ............................ 156

x
5.5.6 Requiring Audit Committee Members with Recognised Qualifications ........................................................................................ 156
5.6 Study Limitations and Directions for Further Research ............................... 156 5.6.1 Study Limitations .................................................................................. 156 5.6.2 Future Directions ................................................................................... 157
References.............................................................................................................. 159
Appendix 1: Hausman and Lagrange Multiplier Tests .................................... 184
Appendix 2: Variance Inflation Factor and Tolerance (1/VIF) Test ............... 187
Appendix 3: Tukey’s Honestly Significant Difference Tests ............................ 188
xi
List of Tables
Table 1.1: Definitions of Key Concepts in This Study .............................................. 6
Table 2.1: Summary of CG Theories........................................................................ 27
Table 2.2: Comparison of First and Second Codes of CG in the UAE .................... 60
Table 3.1: Summary of Previous Literature on the Relationship between Board Size
and Firm Financial Performance .......................................................................... 67
Table 3.2: Summary of Previous Literature on the Relationship between Board
Composition and Firm Financial Performance..................................................... 69
Table 3.3: Summary of Previous Literature on the Relationship between Number of
Board Meetings and Firm Financial Performance................................................ 71
Table 3.4: Summary of Previous Literature on the Relationship between Board
Members’ Education and Firm Financial Performance........................................ 73
Table 3.5: Summary of Previous Literature on the Relationship between Board
Members’ Experience and Firm Financial Performance ...................................... 75
Table 3.6: Summary of Previous Literature on the Relationship between Audit
Committee Size and Firm Financial Performance................................................ 77
Table 3.7: Summary of Previous Literature on the Relationship between Audit
Committee Composition and Firm Financial Performance .................................. 79
Table 3.8: Summary of Previous Literature on the Relationship between Audit
Committee Meetings and Firm Financial Performance........................................ 81
Table 3.9: Summary of Previous Literature on the Relationship between Audit
Committee Members’ Education and Firm Financial Performance ..................... 83
Table 3.10: Use of Accounting-based Measures of Financial Performance ............ 85
Table 3.11: Use of Market-based Measures of Financial Performance ................... 86
Table 3.12: Study Variables and Their Measures..................................................... 89
Table 3.13: Study Sample ....................................................................................... 102
Table 4.1: Descriptive Statistics of Board Characteristics ..................................... 105
Table 4.2: Descriptive Statistics of Audit Committee Characteristics ................... 106
Table 4.3: Descriptive Statistics of Firm Financial Performance ........................... 108
Table 4.4: Correlation Matrix ................................................................................. 110
Table 4.5: Results for VIF and Tolerance .............................................................. 113
Table 4.6: Random-effect Panel Data Regression Model for ROA ....................... 114
xii
Table 4.7: Random-effect Panel Data Regression Model for ROE ........................ 115
Table 4.8: Random-effect Panel Data Regression Model for Tobin’s Q Model .... 117
Table 4.9: ROA Models Using OLS for Three Sub-periods—Periods 1, 2 and 3 . 119
Table 4.10: ROE Models Using OLS for Three Periods—Periods 1, 2 and 3 ....... 120
Table 4.11: Tobin’s Q Models Using OLS for Three Periods—Periods 1, 2 and 3122
Table 4.12: ANOVA Test ....................................................................................... 124
Table 4.13: Multiple Comparisons (Tukey’s HSD) ............................................... 125
Table 4.14: Summary of Hypotheses Tests for All Models ................................... 130
Table 4.15: Comparative Analyses between Periods 1, 2 and 3............................. 138
Table 5.1: Summary of Hypotheses Tests for All Models ..................................... 150

xiii
List of Figures
Figure 3.1: Conceptual Framework for the Study .......................................................... 65

xiv
List of Abbreviations
2SLS Two-stage Least Squares
3SLS Three-stage Least Squares
ACCOM Audit Committee Composition
ACED Audit Committee Members’ Education
ACM Audit Committee Meetings
ACS Audit Committee Size
ADX Abu Dhabi Securities Exchange
AICD Australian Institute of Company Directors
ANOVA Analysis of Variance
ASX Australian Securities Exchange
BCOM Board Composition
BM Board Meetings
BMED Board Members’ Education
BMEX Board Members’ Experience
BS Board Size
CEO Chief Executive Officer
CG Corporate Governance
DFM Dubai Financial Market
ESCA Emirates Securities and Commodities Authority
FA Firm Age
FE Fixed-effects
FS Firm Size
GCC Gulf Cooperation Council
GFC Global Financial Crisis
HSD Honestly Significant Difference
IMF International Monetary Fund
KSA Kingdom of Saudi Arabia
LEV Leverage
LM Lagrange Multiplier
OECD Organisation for Economic Co-operation and Development
OLS Ordinary Least Squares

xv
PJSC Public Joint Stock Companies
RE Random-effects
ROA Return on Assets
ROE Return on Equity
UAE United Arab Emirates
UK United Kingdom
US United States
VIF Variance Inflation Factor

1
Chapter 1: Introduction
1.1 Background to the Study
Financial scandals and corporate failures, such as those involving Enron, WorldCom,
Global Crossing and Arthur Andersen, have led to considerable attention being devoted
to corporate governance (CG) issues. CG not only addresses the issue of corporate failure
via accountability and transparencyat the board and audit committee levels (Ghabayen
2012; Kirk 2009; OECD 2015), but also, as Clarke (2004) stated, provides economic
benefits to firms and is linked to the economic growth of a country1.
CG has long been considered to have significant implications for the growth prospects of
an economy because effective CG practices reduce risks for investors, attract investment
capital and improve the performance of companies (Spanos 2005). According to
Abhayawansa and Johnson (2007), for developing economies, such as the United Arab
Emirates (UAE), CG is important to build investor confidence to attract foreign and local
investors and expand trade. This is reflected in the actions of organisations such as the
Organisation for Economic Co-operation and Development (OECD), International
Monetary Fund (IMF) and World Bank, who have influenced developing countries to
improve their CG characteristics and regulatory infrastructure (Abhayawansa & Johnson
2007).
With increasing foreign investment in the Gulf States, and specifically the UAE, CG has
an important role to play in firms’ financial performance by encouraging transparent
monitoring of firm activity, with a focus on the training and development of directors
(Pearce Ii & Zahra 1992). CG is particularly important for the UAE to ensure it has a
good international standing. However, the literature on CG shows a paucity of studies on
the UAE, particularly in the area of board characteristics and audit committee
characteristics, which are pivotal aspects of monitoring transparency. During the past few
years, many countries around the world have issued their own codes of good CG. This is
evidenced by Middle Eastern countries, such as Kuwait, Saudi Arabia, Jordan and the
1 According to Tarus and Omandi (2013), corporate transparency reduces information asymmetry which in turn more effectively monitors managers’ decisions and helps mitigate the agency problem. This should lead to improvements in firm financial performance and, more importantly, steer the firm in the direction of shareholder objectives.
2
UAE, which have focused on implementing their own CG codes and regulations (Shehata
2015).
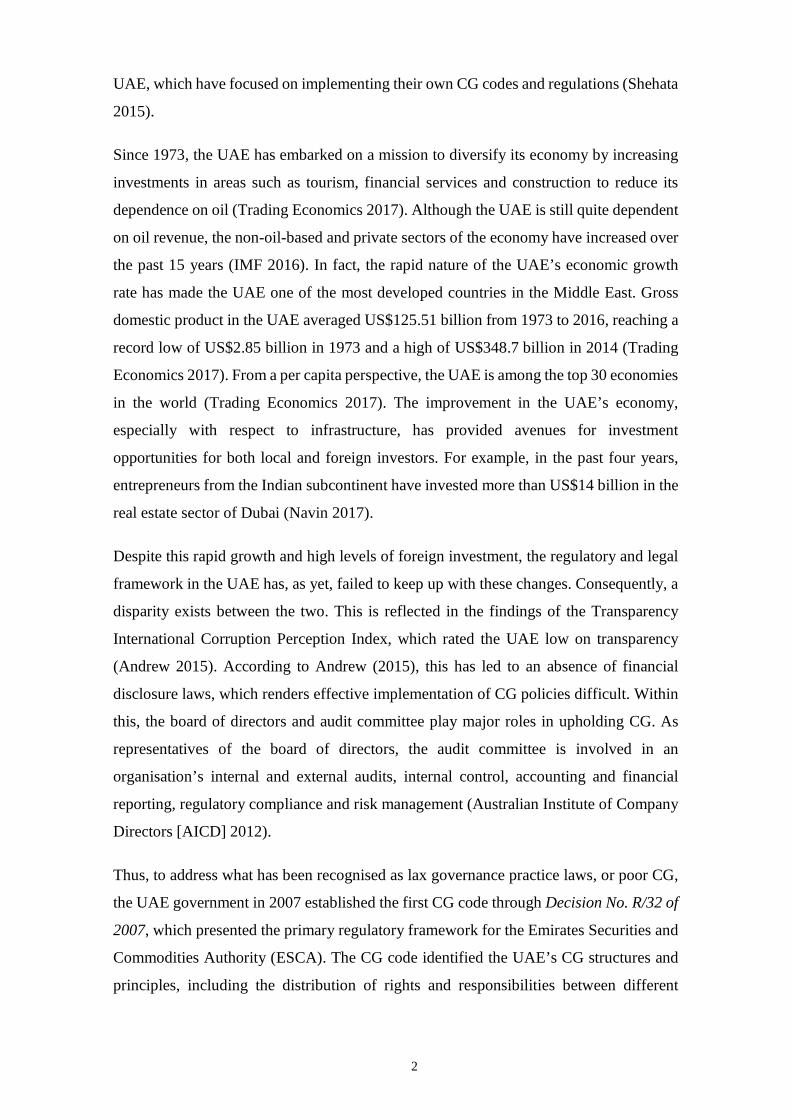
Since 1973, the UAE has embarked on a mission to diversify its economy by increasing
investments in areas such as tourism, financial services and construction to reduce its
dependence on oil (Trading Economics 2017). Although the UAE is still quite dependent
on oil revenue, the non-oil-based and private sectors of the economy have increased over
the past 15 years (IMF 2016). In fact, the rapid nature of the UAE’s economic growth
rate has made the UAE one of the most developed countries in the Middle East. Gross
domestic product in the UAE averaged US$125.51 billion from 1973 to 2016, reaching a
record low of US$2.85 billion in 1973 and a high of US$348.7 billion in 2014 (Trading
Economics 2017). From a per capita perspective, the UAE is among the top 30 economies
in the world (Trading Economics 2017). The improvement in the UAE’s economy,
especially with respect to infrastructure, has provided avenues for investment
opportunities for both local and foreign investors. For example, in the past four years,
entrepreneurs from the Indian subcontinent have invested more than US$14 billion in the
real estate sector of Dubai (Navin 2017).
Despite this rapid growth and high levels of foreign investment, the regulatory and legal
framework in the UAE has, as yet, failed to keep up with these changes. Consequently, a
disparity exists between the two. This is reflected in the findings of the Transparency
International Corruption Perception Index, which rated the UAE low on transparency
(Andrew 2015). According to Andrew (2015), this has led to an absence of financial
disclosure laws, which renders effective implementation of CG policies difficult. Within
this, the board of directors and audit committee play major roles in upholding CG. As
representatives of the board of directors, the audit committee is involved in an
organisation’s internal and external audits, internal control, accounting and financial
reporting, regulatory compliance and risk management (Australian Institute of Company
Directors [AICD] 2012).
Thus, to address what has been recognised as lax governance practice laws, or poor CG,
the UAE government in 2007 established the first CG code through Decision No. R/32 of
2007, which presented the primary regulatory framework for the Emirates Securities and
Commodities Authority (ESCA). The CG code identified the UAE’s CG structures and
principles, including the distribution of rights and responsibilities between different

3
participants in the corporation, such as the board of directors, managers, shareholders,
creditors, auditors, regulators and other stakeholders (ESCA 2007).
Although this was a positive step towards tightening governance and transparency issues,
Aljifri and Moustafa (2007) felt that the UAE first CG code could be improved to render
it more suitable for the UAE business environment. One way to approach this issue was
to make the CG code mandatory for listed companies in the Abu Dhabi Securities
Exchange (ADX) and Dubai Financial Market (DFM). Aljifri and Moustafa added that
international CG standards, such as the OECD Principles of Corporate Governance,
should act as the basis for implementation. Moreover, a report by the IMF (2007) stated
that the first UAE CG code was weak and required improvement. Consequently, the UAE
instituted a second CG code in 2009. This code further advanced and promoted the
adoption of good CG practices through many business sectors. As Ahmad (2010) stated,
the global financial crisis (GFC) was also a catalyst to introduce this improved CG code
to foster a greater sense of ‘safety’ for the UAE business environment. Thus, in 2009, the
UAE Ministry of Economy published the Ministerial Resolution No. 518 of 2009 (the
second CG code), which replaced the first CG code (Ministerial Resolution No. 518 of
2009). The main aim of the second CG code was to further enhance CG rules and
discipline standards for UAE public joint stock companies (PJSC) and institutions whose
securities were listed on the securities market. In 2010, the second CG code became
mandatory for all listed companies, with these companies required to comply with the
code by 30 April 2010 (Ministerial Resolution No. 518 of 2009).
With the advent of both CG codes, the UAE became a better environment to mitigate
corruption. This was reflected in Transparency International’s Corruption Perception
Index, which saw the UAE move from the thirty-first cleanest country in terms of
perceived corruption to twenty-third in 2015 (Andrew 2015). Thus, according to Andrew
(2015), the UAE had the lowest corruption perception index among the Gulf Cooperation
Council (GCC) countries. The shift to a more transparent and regulated financial
environment via the implementation of CG codes also had direct effects on board and
audit committee characteristics. Consequently, the main objective of this study is to
determine the relationship between the board and audit committee characteristics and the
firm financial performance of listed companies in the UAE. In addition, this study will
examine the influence of the changes to the CG codes on the financial performance of
listed companies in the UAE.

4
A few previous studies have focused on CG policies in the UAE. For example, Altamimi
and Charif (2012) examined the UAE national banks’ practices of CG, especially the role
of the board of directors in the formulation and implementation of bank policies and
strategies. Their report concluded that CG practices in the UAE were still poor, and
recommended that the government should implement training programs to improve CG
culture. In addition, Hussainey and Aljifri’s (2012) study recommended that
policymakers need to ensure that firms implement effective CG characteristics in the
UAE. This implementation should be appropriate for the UAE business environment,
while embracing international CG standards via the domestic codes of CG. This would
contribute to improved efficiency, effectiveness and governance of UAE listed firms.
Typically, most research regarding CG and its effect on firm financial performance has
been undertaken in developed countries, such as the United Kingdom (UK) and United
States (US) (Aguilera et al. 2006), while fewer studies have focused on developing
countries, where different cultural and economic considerations prevail. The few studies
that have examined CG in specific Middle Eastern countries are, as posited by
Ananchotikul (2007), difficult to generalise because of the variations in the regulatory
regimes. This lack of generalisability among Middle Eastern countries increases the
importance of a UAE-specific study examining the effect of CG characteristics on firm
financial performance.
While the primary purpose of CG characteristics is to protect the interests of investors
and shareholders (Ruparel 2015), an effective CG framework has the potential to produce
economy-wide benefits. Good CG frameworks enable all stakeholders to contribute to
the decision-making process, which has the potential to improve the public image of the
firm and build a strong relationship between the firm and its stakeholders, which are some
of the key elements of success in any organisation (Lipman & Lipman 2006). According
to Monks and Minow (2004), lack of a strong CG framework leads to weak CG practices,
which were among the main factors leading to the crises that affected the Asian stock
markets in 1997 to 1998. This resulted in the implementation of governance reforms in
the emerging markets to restore investor confidence by providing a secure institutional
platform on which to build a good investment market. Thus, the presence of an effective
CG system, within an individual business or group and through the economy as a whole,
helps deliver the degree of confidence that is necessary for the proper functioning of
market economy (Chen, Li & Shapiro 2011).

5
The main goals of the UAE CG practice are to ensure that firms are financially viable,
meet legal compliance, and consistently improve the value of the shareholders. Adopting
good CG principles can help firms attract investors, raise funds and strengthen the
foundation for financial performance. Companies that actively promote good CG practice
and apply the highest governance standards tend to attract more investors who are willing
to provide capital at a lower cost because the risk inherent in share investment is
significantly reduced (International Finance Corporation 2016).
As a result of a lack of research, not much is known about the key factors, or key
determinants, of CG in the UAE. Hence, an examination of CG in the UAE context is one
way of providing a deeper understanding of the extent to which the financial performance
of UAE companies is influenced by CG characteristics. Consequently, the present study
will draw from the above evidence and provide an analysis of the effect of board and
audit committee characteristics on the financial performance of UAE firms. In addition,
it will undertake a comparative analysis of the extent of the effect of CG codes on UAE
firm financial performance.
1.2 Definition of Key Terms
1.2.1 Corporate Governance
Although definitions of CG vary, the present research adopts the OECD (2015, p.9)
definition, in which CG involves a set of relationships between a company management,
its board, its shareholders and other stakeholders. This definition is the accepted UAE
definition of CG, and is also widely accepted elsewhere and has long-established
principles that aim to assist governments in their efforts to evaluate and improve their
frameworks for CG and to provide guidance for participants and regulators of financial
markets (Nickell 2006).
1.2.2 Board Characteristics
A firm’s board is an important CG characteristic that monitors and advises the top
management in performing their responsibility to protect the shareholders’ interest, which
can have direct implications for successful CG (Baysinger & Butler 1985; Hillman &
Dalziel 2003). Although studies vary in their selection of board characteristics, these
characteristics can comprise, but are not limited to, board size, board composition, board
meetings, board members’ education and board members’ experience.

6
1.2.3 Audit Committee Characteristics
As a subcommittee of the board, the audit committee provides an important function to
oversee corporate financial reporting and disclosure for public companies (Huang &
Thiruvadi 2010; Marsh & Powell 1989). As stated by Aldamen et al. (2012) and Pincus,
Rusbarsky and Wong (1989), the resultant enhancement of information quality should
lead to improved firm financial performance. Although studies vary in their selected audit
committee characteristics (Abbott, Parker & Peters 2004; Arens, Elder & Mark 2012;
Klein 2002), these characteristics can comprise, but are not limited to, audit committee
size, audit committee composition, audit committee meetings and audit committee
members’ education.
1.2.4 Key Definitions of the Research
Table 1.1 provides definitions of the key concepts used throughout the present research.
Table 1.1: Definitions of Key Concepts in This Study
Concepts Description
Corporate governance Involves a set of relationships between a company’s management, its board, its shareholders and other stakeholders. Also provides the structure through which the objectives of the company are set, and the means of attaining those objectives and monitoring performance are determined (OECD 2015, p.9).
Agency theory Explains the relationship between shareholders (principal) and company executives (agents) in business, and is concerned with resolving problems that can exist in agency relationships because of unaligned goals or different aversion levels to risk (Fama & Jensen 1983, p. 301).
Resource dependence theory
Explains the link between the external resources and behaviour of the organisation (Hillman, Withers & Collins 2009, p. 404).
Shareholders Anyone who legally owns at least one share of a company’s stock (Masoom 2013, p. 491).
Stakeholders Any group or individual who can affect or is affected by the achievement of the organisation’s objectives (Freeman 1984, p. 229).
Board size One of main determinant factors to decide the efficiency and decision-making process of a firm. Refers to the number of directors on the board, which also influences its effectiveness (Nazar 2015, p. 40).
Board composition (independent directors)2
A member of the board of directors who does not have a material or pecuniary relationship with the company or related people, except sitting fees (Singh 2005, p. 110). They are more likely to monitor the firm’s financial reports more effectively than executive directors because they are less likely to be influenced by the managers and can subsequently offer independent views on management (Lim 2011, p. 1011).
Board meetings An important way to improve the effectiveness of the board. The meetings of the board are important channels through which directors obtain firm-
2 The terms ‘board composition’ and ‘independent directors’ are used interchangeably throughout this thesis.

7
Concepts Description specific information and are able to fulfil their monitoring role (Adams & Ferreira 2009, p. 293).
Board members’ education
A director’s education background is defined as a good knowledge base and intellectual competence that can significantly influence decision making, managerial behaviour and the performance of the company (Hambrick & Mason 1984, p. 200).
Board members’ experience
The level of board members’ experience, which is the best way to cope with business complexities, competition and change (Johl, Kaur & Cooper 2015, p. 204).
Audit committee size The number of audit committee members chosen by the leading bodies, which affects the quality of financial reporting and corporate disclosures, and affects the commitment of members to monitor management and detect deceitful behaviour (Moses 2016, p. 63; Persons 2009, p. 295).
Audit committee composition (independent members)3
An independent audit committee is a fundamental component of good CG that leads to better controlling and monitoring of the management of the company (AICD 2012, p. 1).
Audit committee meetings
Indicates the diligence of the audit committee, based on the number of meetings occurring per year. This is used to assess the effectiveness of audit committees in monitoring the firm’s financial performance (Kikhia 2014, p. 100).
Audit committee members’ education
The knowledge or skill gains obtained through involvement in actual practice. Audit committee members are appointed with an appropriate mix of skills, experience and expertise to address complex and judgemental accounting matters (Kachelmeier, Rasmussen & Schmidt 2016, p. 252).
Firm financial performance
A subset of organisational effectiveness that covers operational and financial outcomes (Santos & Brito 2012, p. 98).
1.3 Research Problem
Despite many CG studies being undertaken on developed countries, there are relatively
few studies in a developing country context. Although empirical studies on CG in Middle
Eastern countries have primarily focused on the specific characteristics, dimensions or
attributes of CG, the literature is sparse on the contribution of some of the more important
CG characteristics in the UAE, particularly the characteristics of the audit committee and
board of directors (Hassan & Halbouni 2013). The relationship between CG and financial
performance is not as well understood in developing countries as it is in the developed
world (Elghuweel 2015). Consequently, the research problem for this study is:
To identify the relationship between board and audit committee characteristics
and the financial performance of UAE listed firms.
3 The terms ‘audit committee composition’ and ‘independent members’ are used interchangeably throughout this thesis.

8
1.4 Aims of the Research
The specific research questions arising from the research problem are:
1. RQ1: Do board and audit committee characteristics affect the financial
performance of UAE publicly listed firms?
2. RQ2: Have the UAE CG codes affected the financial performance of UAE
publicly listed firms?
The research objectives pursued to answer the research questions are:
a. Determine the relationship between the board and audit committee characteristics
and the firm financial performance of listed companies in the UAE.
To achieve this, the present research will undertake a panel regression model.
b. Determine the influence of the changes to the CG codes on the financial
performance of listed companies in the UAE.
To achieve this, the present research will employ an ordinary least squares (OLS)
regression model and analysis of variance (ANOVA) testing to analyse three periods to
enable effective comparison of the effect of changes to the CG code:
1. the period prior to adoption of the first CG code: 2006 to 2007 (Period 1)
2. the period two years after adoption of the first CG code: 2009 to 2010 (Period 2)
3. the period three years after adoption of the second CG code: 2013 to 2014 (Period
3).
A comparative analysis will be conducted to investigate the extent to which the listed
companies in the UAE adopted the CG codes and changes to CG practice, and their effect
on performance. The years between these periods are deemed to be transition periods and
are subsequently not included in the estimation models.
1.5 Overview of the Conceptual Framework and Research Method
A number of CG theories exist to guide analysis and understanding of CG. The ability of
a general CG framework to effectively and efficiently improve firm value4 has been
4 The terms ‘firm value’ and ‘firm financial performance’ are used interchangeably throughout this thesis.
9
questioned, with many arguing for the need to customise a general framework to suit local
needs (Brickley, Coles & Jarrell 1997). In response to this, the present research adopts a
multi-theoretic approach that incorporates agency theory and resource dependence theory
to determine a conceptual framework suitable for the UAE context. The framework
provides a conceptual foundation to examine the association between CG characteristics
and the financial performance of UAE listed companies.
Agency theory is employed to understand the relationships between principals (owners)
and agents (directors and managers). This theory explains how to best organise
relationships in which one party determines the work, while another party does the work
(Jensen & Meckling 1976). According to this theory, independent directors are able to
provide important monitoring functions in an attempt to resolve the agency conflict
between agents and principals—a factor that is not considered by any other theory. This
study provides support for the agency theory perspective that CG characteristics may
mitigate agency problems, leading to improvement in the performance of the company.
The main board characteristics in this study are captured via the following variables:
board size (Palaniappan 2017; Johl, Kaur & Cooper 2015; Katuse et al. 2013), board
composition via the proportion of independent directors (Barka & Legendre 2017; Aamir
& Sajid 2012; Yasser, Entebang & Mansor 2011), number of board meetings
(Palaniappan 2017; Bonazzi & Islam 2007; Lin & Lee 2008; Nuryanah & Islam 2011),
board members’ education (Francis et al. 2015; Darmadi 2013; Vo & Phan 2013) and
board members’ experience (Hsu 2010; Johl, Kaur & Cooper 2015).
With respect to resource dependence theory, Pfeffer and Salancik (2003) stated that this
is a management-based theory that focuses on a director’s resource role, which covers
some of the characteristics of the board and audit committees. The economy of the Gulf
States has been reliant on external human resources for a prolonged period, and it is vital
that this feature is incorporated into the study framework to capture the complex
relationship between the firm and its environment and resources. Supported by the
literature, the audit committee characteristics are represented by the following variables:
audit committee size (Mohammad et al. 2018; Azim 2012; Hamdan, Sarea & Reyad
2013), audit committee composition (Ilaboya & Obaretin 2015; Mohammad et al. 2018;
Yasser, Entebang & Mansor 2011), number of audit committee meetings (Alqatamin
2018; Aldamen et al. 2012; Hamdan, Sarea & Reyad 2013) and audit committee
members’ education (Aldamen et al. 2012; Alqatamin 2018; Hillman, Withers & Collins
2009). The two CG theories are examined in greater detail in Chapter 2.

10
The proposed framework also uses two accounting-based measures—return on assets
(ROA) and return on equity (ROE)—and the market-based measure of Tobin’s Q to
measure firm financial performance. In addition, three control variables are used: firm
age, firm size and leverage.
The following is a list of the hypotheses tested in this study, which align with the
aforementioned research questions and the multi-theoretic-based CG framework:
H1: There is a positive relationship between board size and firm financial
performance in the UAE.
H2: There is a positive relationship between board composition and firm financial
performance in the UAE.
H3: There is a positive relationship between board meetings and firm financial
performance in the UAE.
H4: There is a positive relationship between board members’ education and firm
financial performance in the UAE.
H5: There is a positive relationship between board members’ experience and firm
financial performance in the UAE.
H6: There is a positive relationship between audit committee size and firm financial
performance in the UAE.
H7: There is a positive relationship between audit committee composition and firm
financial performance in the UAE.
H8: There is a positive relationship between audit committee meetings and firm
financial performance in the UAE.
H9: There is a positive relationship between audit committee members’ education
and firm financial performance in the UAE.
To empirically examine the relationship between the board and audit committee
characteristics and firm financial performance of listed companies in the UAE, this study
collected data on 47 listed companies on the DFM and ADX, covering the period 2006
to 2015. The data sources are the DFM, the ADX, Mint Global, Orbis—Bureau van Dijk,
DataStream and annual reports. For Research Question 1, the data were analysed via a

11
multiple regression panel model, while, for Research Question 2, an OLS model and one-
way ANOVA testing were employed to identify changes to firm financial performance
associated with changes to the CG code.
1.6 Statement of Significance
The limited studies on CG in developing countries, and specifically in the UAE, have
resulted in a significant gap between foundation theories and practical applicability.
Specifically, the adoption of UAE CG codes and their effect on financial performance
has not been addressed in the literature. This study will fill this knowledge gap by
examining this relationship.
Further, based on a review of the relevant literature, agency theory and resource
dependence theory will be used to develop a CG framework for the study. This will better
suit the UAE context and enable more accurate identification of the relationships between
financial performance (dependent variable) and board and audit committee characteristics
(independent variables). To the best knowledge of the researcher, this is the first study to
examine these factors in the UAE context. The new insights derived from this study will
help foster greater awareness and understanding of the association between CG
characteristics and firm financial performance for the study population.
1.7 Organisation of the Thesis
The thesis is presented in five chapters. This first chapter has presented a summary of the
topic and provided the background for this research. Chapter 2 discusses CG theories and
previous studies to more fully understand the relationship between firm financial
performance and CG characteristics, with special reference to board and audit committee
characteristics. It concludes by providing a brief outline of the CG codes and practices in
the UAE. Chapter 3 outlines the conceptual framework developed for this study and
provides a discussion of the hypotheses tested. It also discusses the research methods
employed to achieve the objectives of the study and explains the statistical techniques
applied to analyse the study data. Chapter 4 discusses the results of the analysis, while
Chapter 5 consists of a summary of the research undertaken for this thesis, including the
main conclusions, policy implications and suggestions for future research.

12
Chapter 2: Literature Review
2.1 Introduction
The previous chapter introduced the subject matter of this thesis and articulated its
objectives. The current chapter discusses the theoretical issues and reviews the literature
to examine CG theories and the characteristics of boards and audit committees, both
generally and within the UAE context. This chapter is divided into eight sections. Section
2.2 discusses the definition of CG, while Section 2.3 reviews the main CG theories.
Section 2.4 reviews the main board characteristics, while Section 2.5 reviews the audit
committee characteristics in both a developed and developing country context. Section
2.6 reviews CG practice in the UAE, while Section 2.7 identifies the literature gap.
Section 2.8 presents a summary of the chapter.
2.2 Defining Corporate Governance
Typically, CG is defined in either narrow or broad terms, with narrow definitions based
on satisfying the interests of the shareholders, and broad definitions based on satisfying
the interests of stakeholders, such as employees, customers, suppliers and the government
(Gillan 2006). An example of a broad definition of CG is provided by Gillan and Starks
(1998), who defined CG as setting the firm direction and involvement in executive action,
supervision and accountability that extends beyond the narrow confines of management,
comprising the systemic control, rules and regulations of companies. Shleifer and Vishny
(1997) stated that CG deals with the ways that suppliers of finance to corporations assure
themselves of gaining a return on their investments. Child and Rodrigues (2003) opined
that the concept of CG includes all areas related to the affairs of the firm, either directly
or indirectly. Kiel and Nicholson (2003) stated that CG is a continuous process that is
indicative of organising and coordinating the organisational structures and helping sustain
the management, accountability, proper leadership, direction and control of the various
practices.
The OECD (2015) defined CG as involving a set of relationships between a company
management, its board, its shareholders and other stakeholders. Nickell (2006) defined
CG as one of the best ways for a company to provide a structure through which the goals
of the company are set, to determine the means of achieving these goals, and to provide

13
suitable incentives for the board and management to achieve their goals in terms of the
interests of the company and its shareholders.
From an operational perspective, this study adopts the OECD (2015) definition, which is
widely accepted and has long-established principles that aim to assist governments in
their efforts to evaluate and improve their frameworks for CG and to provide guidance
for participants and regulators of financial markets. Unsurprisingly, the various
definitions of CG are attributable to a wide variety of CG theories. These theories are
reviewed below to provide a theoretical framework for the study.
2.3 Corporate Governance Theories
A range of theories and frameworks have been developed to guide the study of CG. There
are five fundamental CG theories selected from the CG literature: (i) agency theory (Berle
& Means 1932); (ii) stewardship theory (Barney 1990; Donaldson 1990); (iii) stakeholder
theory (Freeman 1984); (iv) resource dependence theory (Pfeffer & Salancik 1978;
Thompson 1967); and (v) transaction cost theory (Williamson 1978, 1985, 1993).
According to Abdullah and Valentine (2009), these theories are associated with several
CG variables, such as the configuration of board members, audit committees, independent
directors and the role of top management.
According to Mallin (2016), these theories have been applied in several disciplines, such
as finance, economics, accounting, law, management and organisational behaviour, and
have contributed to the development of theoretical aspects of CG. Scholars have applied
agency theory to reflect a finance and economic perspective, whereas stakeholder theory
has been applied to reflect a social-oriented perspective, while stewardship theory has its
roots in psychology and sociology (Abdullah & Valentine 2009). Prior studies on CG in
UAE have utilised differing CG theories which demonstrates that there is no one CG
theory that applies to the UAE context. Consequently, the five aforementioned theories
are reviewed below to determine their appropriateness for the study’s aims within the
UAE context.
2.3.1 Agency Theory
Agency theory is based on the idea of separating ownership from control (management),
where the shareholders (who are the owners of the corporation and managers or directors)
are the controllers who have the authority to run the business for the corporation
shareholders (Fama & Jensen 1983). When pioneering agency theory for CG, Berle and
14
Means (1932) argued that this theory provides an explanation of the relationship between
business principles (owners) and agents (managers), which can be affected by the board
to make the right decisions and take responsibility for these decisions. According to
Jensen and Meckling (1976), separation is a key assumption of agency theory, and posits
a clear separation of the interests between managers and owners at the objective level,
which can enhance the performance of a firm and increase the wealth of shareholders.
Generally, agency relationships occur when the principals engage an agent to perform a
service on the principal’s behalf. Principals normally give decision-making authority to
the agents, and agency problems can arise because of increased inefficiencies and
incomplete information (Fama & Jensen 1983). The main concern of agency theory lies
in resolving the problems that exist in agency relationships between principals (e.g.,
shareholders) and agents of the principals (e.g., the chief executive officer [CEO]). The
first problem that agency theory addresses is the issue that arises when the desires or goals
of the principal and agent are in conflict, and the principal is unable to verify what the
agent is actually doing. The second problem arises when the principal and agent have
different attitudes towards risk because of different risk tolerances, and the principal and
agent may each seek to take different actions (Jensen & Meckling 1976).
Agency costs arise because of conflicts of interest that occur in corporate relationships as
a result of the separation of the interests of shareholders and management. These conflicts
usually present ethical individuals with opportunities for moral hazard (Jensen 1993).
Moral hazard conflict can occur when managers tend to choose investment forms suited
to their personal skills, which can increase their own value at the expense of the firm,
which then increases the potential cost of replacing them. Consequently, this allows
managers to gain a high degree of remuneration compensation from their firms (Shleifer
& Vishny 1997). Such moral hazard conflicts are commonly found in multinational
companies, where large cash flows are harder to control and external auditing and the
complexity of contracts expand exponentially, thereby leading to increased agency costs
(Jensen 1993).
Agency theory fundamentally focuses on the conflict of interest where those who are in
control of the company operations make decisions to enhance their own power and wealth
which may not necessarily lead to maximising the wealth of the shareholders (Abdullah
& Valentine 2009; Bosse & Phillips 2016). In this regard, CG in the UAE can be used to
change the rules under which the agent operates to restore the principal’s interests. For
15
instance, since agency theory incorporates agent motivation, CG policies can be designed
so that incentives discourage inappropriate behaviour and encourage behaviour that is in
the interest of the principal. Understanding the manner in which these characteristics
affect firm financial performance can help policymakers develop a more nuanced and
appropriate CG policy. The core assumptions of agency theory are that: (i) managers or
directors may maximise their own benefit, rather than improve principal value; (ii)
contracts are not costless when writing and implementing; (iii) information is shared
asymmetrically between shareholders and managers; and (iv) the parties have limited
rationality (Fama & Jensen 1983).
According to Jensen and Meckling (1976), agency costs are the sum of monitoring
expenditure by the principal to limit the abnormal activities of the agent. For instance,
because of asymmetric information between managers and owners, shareholders cannot
accurately measure the work of directors who know the detailed operations of the firm
(Fama & Jensen 1983). Thus, monitoring agents’ activities are an important duty of the
board to minimise agency problems and achieve higher firm financial performance. In
addition, the purpose of CG characteristics is to protect the interests of shareholders,
reduce agency expenses and ensure that managers and owners are acting alike. Therefore,
agency theory emphasises the need for CG characteristics to reduce these problems. It
also provides the basis of using internal and external characteristics for CG (Roberts,
McNulty & Stiles 2005).
In effect, agency theory is a precursor to explaining behaviours when there is actual goal
congruence. When the goals of the principal and agent are aligned, the assumptions of
agency theory are inappropriate to explain the behaviours of a principal and agent (Jensen
& Meckling 1976). The limitation of agency theory for explaining behaviours in the
principal–agent relationship is that agency theory has provided both predictions and
prescriptions for explaining individual behaviour when outside ownership is involved
(Jensen 1983). A key prescription of the theory is for principals to minimise agency costs
by imposing internal controls to restrain the agent’s self-serving behaviour (Jensen &
Meckling 1976). It is assumed that, if there is principal–agent goal congruence, the
agent’s self-interested utility-maximising behaviour will result in wealth maximisation
for the principal.
According to agency theory, the characteristics of the board and audit committee are
important in managing the monitoring activity of agents, which, as Roberts (2005)

16
indicated, is a strong contributor of firm financial performance. Empirical studies
increasingly recognise that the board plays a pivotal role in addressing agency costs,
which result from the separation of ownership and control. Boards monitor management
on behalf of their principals (shareholders), and seek to detect and remedy managerial
inefficiency and abuse (Onetto 2007). Pincus, Rusbarsky and Wong (1989) argued that
audit committees are used primarily in situations where agency costs are high to improve
the quality of information flows from the agent to the principal. According to agency
theory, to ensure the effectiveness of an audit committee, managers are encouraged to
prepare financial statements adequately to specify the return generated by the companies.
Thus, audit committees have a central role in reducing agency problems (Zahra & Pearce
1989).
More specifically, agency theory calls for building an institution of governance structures
through establishing a set of legal contracts by shareholders to monitor managers. First,
it suggests a reduction in the number of executive board members, which could enhance
the board’s independence (Berle & Means 1932). Further, board subcommittees, such as
audit, nomination and remuneration committees, are important instruments to monitor
managerial behaviour (Klein 1998). Second, the establishment of an internal control
system can help limit wealth expropriation by a firm’s management (Jensen & Meckling
1976). Third, designing a compensation and managerial incentive system that is linked to
financial performance can encourage top managers to improve their performance
(Chalevas 2011). This may subsequently limit exploitation of the firm’s resources by
managers for their personal interest (Jensen & Meckling 1976).
The UAE government has taken several steps over the years to reform the CG regime.
The development of the 2009 UAE CG code, which is the second CG code, constituted a
cornerstone of the reforms and aimed to reduce agency conflicts between managers and
shareholders by improving the transparency, accountability and responsibility of
corporate boards of directors. Thus, the application of an agency theoretical framework
becomes even more important in the context of the UAE. The agency conflict between
managers and shareholders is a traditional conflict and is still common in developed
countries (Michelberger 2016). However, the separation of ownership and management
may not be obvious in UAE government-owned companies because of concentrated
ownership, since the government has the right to intervene in the appointment of
management and key members of the boards. Therefore, the government acts as the
ultimate owner of these companies and maintains managerial authority.

17
Typically, agency theory studies emphasise relationships between the key stakeholders
in CG, such as board members, which significantly affect the roles and composition of
the board. In the UAE context, Kamal and Saadi (2013) analysed the relationships
between the board size, board committee and firm financial performance of UAE listed
firms based on data published in 2008. They found that: (i) board size significantly
influences UAE firms’ performance; and (ii) the number of board committees has no
significant effect on firms’ performance. This study provides support for the agency
theory perspective that CG characteristics may mitigate agency problems, thereby leading
to an improvement in the performance of listed companies in the UAE. Agency theory
also provides solutions to reduce agency conflicts and improve shareholder returns,
thereby resulting in improved firm financial performance (Jensen & Meckling 1976).
According to Roberts (2005), agency theory is considered the dominant theory in terms
of CG practices, with both stakeholder theory and stewardship theory stemming from it.
2.3.2 Stakeholder Theory
According to Freeman (1984), stakeholder theory considers the nature of the relationships
between firms and anyone who affects the processes and outcomes of the firm and its
stakeholders. The theory considers how a business creates value and wealth for its
stakeholders (customers, suppliers, employees, communities, financiers, shareholders,
banks and so forth) by converting their stakes into goods or services. Thus, stakeholders
have essential value and the power to push the firm to reach its goals.
Stakeholder theory argues that balancing the conflicting claims of the many stakeholders
in a firm must derive from the objective of the firm, as well as from inside and outside
the firm—such as customers, employees, stockholders, suppliers, non-profit groups,
governments, investors, political groups and the local community (Freeman 1984).
Mitchell, Agle and Wood (1997) proposed that stakeholders are characterised by
legitimacy, power, urgency (where urgency indicates the significance of the issue to the
stakeholder) or a mixture of these characteristics. Clarkson (1995) stated that stakeholders
are voluntary or involuntary risk-bearers. According to Abdullah and Valentine (2009),
stakeholder theory is related to groups who would cease to survive without the support of
the companies.
Therefore, stakeholder theory views the relationships between any firm and other groups
in its internal and external environment. It also considers how these relationships affect
the business activities and how the business conducts its activities to create high value for
18
stakeholders. According to Duckworth and Moore (2010), stakeholder theory has
succeeded in becoming as well-known theory in the business ethics fields, is used as one
of the frameworks in corporate social responsibility methods, and provides a way to
connect ethics and strategy.
According to Deegan (2012), the main concern of stakeholder theory is that all the groups
related to the business have the full right to be provided with important information about
how the company is affecting them, such as through pollution, provision of employment
and so forth. This type of information must be provided to stakeholders, even if they
decide not to use this information and even if they cannot directly affect the survival of
the company. The interconnection among several stakeholders increases the transparency
of corporations’ activities and performance. In this regard, stakeholder theory assists
companies to reach one of the CG characteristics—transparency—and helps firms
achieve their main goals, which include increasing profitability (Deegan 2012).
According to Carroll (1979), corporations have four major responsibilities: (i) economic
(to generate shareholder wealth); (ii) legal (to obey laws and regulations); (iii) ethical (to
recognise that the firm is part of a community, and subsequently has obligations towards
and an effect on others); and (iv) discretionary (to engage in philanthropy). Nonetheless,
O’Toole and Mayer (2013) espoused that profit generation should be the outcome of a
well-managed company. However, unlike O’Toole and Mayer, both Herciu and Serban
(2016) and Carroll (1979) argued that, if a firm creates value for its stakeholders, it will
also create value for its shareholders. Thus, stakeholder theorists believe that considering
all constituent groups is the optimal way to maximise overall firm financial performance
(Deegan 2012).
The underlying assumptions of stakeholder theory are: (i) corporations should operate not
only for the financial benefit of their owners, but also for the interests of the relevant
broader society (Kamla & Roberts 2010); (ii) executive directors are equally accountable
to all stakeholders—not only the firm’s owners and creditors, but also other corporate
stakeholders, such as employees, the government, the local community, customers and
suppliers (Clarke 1998); and (iii) companies should be strongly connected to notions of
morality in business and corporate social responsibility (Westphal & Zajac 2013).
According to Aguilera and Cuervo‐Cazurra (2009), stakeholder theory has been widely
embedded in CG studies and CG codes, yet has been criticised by some scholars. For
example, Sternberg (1997) criticised this theory from two perspectives. First, the
19
assumptions of stakeholder theory conflict with the central objective of the firm, which
is to maximise shareholder wealth. Second, stakeholder theory conflicts with the agent–
principal relationship, which suggests that managers are primarily accountable to
shareholders. As such, Sternberg argued that stakeholder theory is incompatible with the
basic principles of CG. In addition, Blattberg (2013) stated that a weakness of this theory
is that the interests of the various stakeholders can be, at best, compromised or balanced
against each other. Nevertheless, stakeholder theory remains a key CG theory (Solomon
2010).
According to Oates (2013) and Hosseini and Brenner (1992), this theory assumes that
managers successfully balance the competing demands of various stakeholder groups,
and effectively allocate competing claims to the firm’s resources and outcomes. All
stakeholder groups play an important role in a firm’s business operations, where no one
group of stakeholders is more dominant than another (Clarkson 1995; Hult et al. 2011).
Nevertheless, it is difficult for managers to implement the firm’s business strategy
because of various stakeholder groups having divergent interests, which will lead
managers to treat all stakeholder groups with the same priority. For example, customers
require good-quality products and services with lower prices, whereas suppliers require
higher prices. Thus, it is difficult for managers to satisfy all customers’ demands, while
adding value for shareholders (Sundaram & Inkpen 2004). As a result, a potential conflict
of interest among stakeholders can occur and ultimately harm firm financial performance.
This arises because stakeholder-based firms that adopt either an egalitarian or equalitarian
interpretation are generally unable to obtain equity or any other financial services.
Further, stakeholder theory excludes the notion of opportunistic managers who act in their
own self-interest by claiming that their decisions provide benefits for particular
stakeholder groups (Phillips, Freeman & Wicks 2007).
Pesqueux and Damak-Ayadi (2005) stated that the practice of stakeholder management
can result in higher stability and growth, which affects firm financial performance. Hence,
good CG must focus on creating a feeling of security, where a firm will consider the
interests of stakeholders, because the board of directors is responsible for the firm and its
stakeholders (Ljubojevic & Gordana 2011). Thus, from a stakeholder theory perspective,
the objective function of the firm is to maximise total long-term (rather than short-term)
firm market value (Jensen 2001). Here, the long-term market value of the firm is the
scorecard by which success is measured. Jensen (2001) posited that this can be

20
realistically achieved by making management decisions that consider the interests of all
stakeholders of the firm to maximise its value.
In the context of the UAE, the second UAE code (in 2009) included some provisions
related to the protection of shareholders’ and stakeholders’ equity (Article 5) (Steven &
Carla 2010). The board members in UAE corporations must be aware of the interests of
the company and its shareholders, and invest the utmost effort to adhere to applicable
laws, regulations and resolutions, as well as the articles of association and internal
regulations of the company.
2.3.3 Stewardship Theory
Stewardship theory was developed by Donaldson and Davis (1991) as an alternative
perspective to understand the existing relationships between ownership and management
of the company. This theory arises as an important counterweight to agency theory. This
theory draws on organisational psychology, where self-esteem (regardless of individual
motivation or incentive) significantly affects a firm’s managerial decision making
(Donaldson & Davis 1991).
As stated by Davis, Schoorman and Donaldson (1997), stewardship theory suggests that,
as stewards protect and maximise shareholders’ wealth through company performance,
the steward’s utility functions will also maximise. Notably, this definition recognises the
company executive as the steward acting or working for the principal. Hence, agents are
stewards who control and manage the firm responsibly to enhance firm financial
performance, since stewards place the value of the firm higher than their individual
interests (Abdullah & Valentine 2009). According to this theory, the behaviour of
stewards is assumed to be one of collective managers who are not motivated by individual
goals, but are stewards whose motives are aligned with the objectives of their principals.
Their goal is to increase the firm’s sales growth, which leads to the satisfaction of
principals because of enhanced performance (Donaldson & Davis 1991).
Stewardship theory proposes that the roles of executive managers are not those of a selfish
opportunist. Rather, executive managers aim to perform a successful role as a good
steward of corporate assets because of accountability. In many business fields, when the
boards and managers work together, this leads to enhanced firm non-financial
performance and to greater trust, empowerment, depth of experience, technical skills and
ease of communication between the two. Thus, stewardship theory specifies that the
21
managers at the top level also have non-financial motivations, which include the demand
for achievement, respect for authority and work ethic, and satisfaction from successful
performance (Muth & Donaldson 1998).
According to Davis, Schoorman and Donaldson (1997), in contrast to the predictions of
agency theory, stewardship theory relies on the notion that managers are not motivated
by individual interest, but instead by the objectives of principals. Hence, stewardship
theory advocates that managers who run firms are trustworthy (Siebels & Knyphausen
2012). This theory has been developed based on a number of assumptions, such as:
1. managers’ interests are aligned with owners’ interests (shareholders) (Davis,
Schoorman & Donaldson 1997)
2. so long as managers are trustworthy, CEO duality could be the most appropriate
system to run a company (Donaldson & Davis 1991); according to Nicholson and
Kiel (2007), agents have access to information about the firm, which makes them
highly capable of working towards the firm’s welfare
3. managers seek to employ the company’s resources in the best possible way to
maximise the company’s value (Nicholson & Kiel 2007) because any misconduct
in using these resources may affect their reputation and future career prospects
(Conyon & He 2011).
According to Donaldson and Davis (1991), CG research relies too heavily on an
organisational economic model that portrays human motivation and behaviour too
narrowly, whereby organisation economics discounts the behaviour of humans that
cannot be adequately explained by economic theory, such as cooperative activity among
individuals.
The above discussion indicates how stewardship theory exists in contrast to agency
theory, which suggests that there is no agency problem because of the mutual trust
between insiders and owners. However, this theory has some weaknesses, as stated by
Van Slyke (2006): (i) the role of the steward is oversimplified and unrealistic; (ii) the
theory fails to provide a satisfactory explanation of the complex behaviour of agents,
which is an important characteristic of the principle–agent interaction; (iii) there is a lack
of empirical evidence supporting the theory; and (iv) the theory includes a CEO who is
not chairperson of the board.
22
Although stewardship theory addresses some of the reductionist assumptions of agency
theory, it suffers from being static, as it considers the relationship of the principal–agent
at a single point in time and assumes no learning of individuals as a result of their
interactions. Stewardship theory also states that management and board members in a
firm may be motivated by aspects other than the desire for personal gain (Keay 2016).
With respect to the UAE, Steven and Carla (2010) point out that the 2009 CG code
(Article 3) recommends that companies consider an appropriate balance between
executive, non-executive and independent board members, provided that at least one-
third of members are independent members and the majority of members are non-
executive members who have technical skills and experience for the good of the company.
In addition, the code stipulates the importance of separating the positions of CEO and
chairperson. Thus, the code’s aim is to improve the accountability of firms’ management
by enhancing managerial supervision and monitoring. This is in direct contrast to the
assumptions of stewardship theory, which suggests that managers are trustworthy
individuals who may not need extensive monitoring of their management performance.
Stewardship theory may be appropriate in the UAE corporate context for companies
owned by families, who typically appoint their own relatives as directors and executives;
thus, appointed CEOs and directors are likely to be considered trustworthy.
2.3.4 Resource Dependence Theory
According to Pfeffer and Salancik (2003), resource dependence theory has become one
of the most influential organisational theories. It characterises the corporation as an open
system that is dependent on contingencies in the external environment. As Hatch (2018)
stated, resource dependence analysis begins by identifying an organisation’s required
resources and then traces them to their source. Thus, the theory proposes that
organisations are not self-contained or self-sufficient, but rely on their environment for
their existence, with the core of this theory focusing on how organisations gain access to
vital resources for survival and growth. According to Yusoff and Alhaji (2012), resource
dependence theory emphasises the role of boards in obtaining resources, rather than using
such resources. According to this theory, directors attempt to connect the company with
its external factors by co-opting the resources needed to survive.
According to Hillman, Withers and Collins (2009), a very important board function is the
provision of resources. This is the dominant perspective adopted by scholars in resource
dependence theory (Daily & Dalton 1992; Hillman, Cannella & Paetzold 2000; Pfeffer &

23
Salancik 2003). Resource dependence proponents propose that a board’s provision of
resources is directly related to firm financial performance, with these resources helping
the firm reduce uncertainty and lower transaction costs, and ultimately aiding in the
survival of the firm (Pfeffer 1972). In addition, this theory has implications for some
organisational aspects and actions, such as organisational structure, the recruitment of
board members and employees, contract structure and organisational strategies (Pfeffer
& Salancik 2003).
Many of the behaviours of boards of directors can be understood by a combination of
theories. For example, resource dependence theory can be used in conjunction with
agency theory to support large boards to reduce agency problems and boost firm financial
performance by transcending challenging market conditions (Goodstein, Gautam &
Boeker 1994). Scholars have also used resource dependence theory to explain the
composition of boards, especially in terms of outsider representation. For example,
Bathula (2008) stated that independent directors are appointed on the board to bring a
fresh perspective when the firm is not performing well. From resource dependence theory
perspective, it can be predicted that a well-diversified board will improve firm financial
performance.
Kaplan and Minton (1994) found that the poor financial or stock market performance of
a firm often leads to the appointment of financial directors to the board. Hermalin and
Weisbach (1991) stated that inside directors are replaced with experienced outsiders when
the firm financial performance is poor. Based on resource dependence theory, the longer
the tenure of a member, the higher will be his or her experience and knowledge gained,
which leads to improved firm financial performance. As a result, resource dependence
theory views the board as a resource that can not only supplement its need for other
resources, but can also influence the environment in its favour, and thereby improve firm
financial performance. Resource dependence theory is prevalent in supporting the
explanation of specific CG phenomena in emerging countries. The theory argues that
companies are dependent on resources, which provides opportunities for resource
providers to gain control over the companies (Pfeffer & Salancik 1978).
This theory relies on the important assumption that the board of directors not only
performs a monitoring role, but also provides necessary critical resources, such as
business contacts and contracts, knowledge, experience and expertise (Chen 2011;
Nicholson & Kiel 2007). Consequently, this can improve firm financial performance and
24
increase shareholders’ wealth (Pearce Ii & Zahra 1992). In addition, the board of directors
has the capability to represent the interests of different stakeholders, such as local
communities, government, employees, suppliers, customers, creditors, regulators and
policymakers (Hillman, Withers & Collins 2009). Consequently, the board of directors
will support the firm to achieve competitive advantage by serving as a direct link between
the firm and the environment within which it operates.
The board of directors in UAE listed firms plays an important role in securing financial
and non-financial resources, such as external financing, experience and transfer of
knowledge from foreign investors. In the UAE, some companies have been reliant on
external human resources for a prolonged period. In addition, government-owned
companies rely on the government as a resource provider; thus, their decision making can
be influenced by the government. With government influence, companies can easily gain
access to resources because this access is likely to be based on government directions
(Mohammed, Ahmed & Ji 2010). However, some types of government influence can be
detrimental to financial performance.
2.3.5 Transaction Cost Theory
According to Geyskens, Steenkamp and Kumar (2006), transaction cost theory has
become the principal theoretical framework for describing organisational boundary
decisions. The idea of transaction cost theory is that transaction costs set natural
boundaries for a firm. For example, the decision to make or buy is a simple cost
minimising decision. Simply, production costs are assumed to be lower in the market;
however, when transaction costs are accounted for, the expected total cost may become
higher. Thus, the natural boundaries are set where the total costs are minimised
(Geyskens, Steenkamp & Kumar 2006).
The basic premise of this theory and its origins were presented by Coase (1937) and then
Cyert and March (1963), who were among the first scholars to seek to formulate this
theory, which was later described and exposed by Williamson (1996a). This cost theory
asked why do firms emerge. Coase (1937) argued that transaction costs explain both the
existence of firms and their optimal size. In regard to the nature of the firm, Coase (1937)
identified certain transactions that are prohibitively costly if the parties involved can only
deal with instant market transactions. To undertake a market transaction, it is necessary
to identify the party with whom one wishes to deal, and then establish terms and
conditions, conduct negotiations and conclude a contract. The concept of transaction cost
25
theory has been continuously refined and reformulated to expand this theory to follow
new theoretical and empirical developments (Geyskens, Steenkamp & Kumar 2006).
Transaction cost theory is an integrative alliance of law, economics and organisations. A
firm is viewed as an organisation involving human resources with different views and
objectives. According to Abdullah and Valentine (2009), transaction cost theory states
that the goal of the company is to minimise the costs of exchanging resources in the
business environment and to reduce the costs of managing exchanges inside the company.
The transaction cost theory assumes that firms have become so large that they effectively
substitute for the market in determining the allocation of resources. In other words, the
organisation and structure of a firm can determine price and production (Abdullah &
Valentine 2009). This theory uses the transaction as the unit of analysis. Accordingly, the
combination of people with transactions implies that the transaction cost theory manager
is an opportunist who arranges firm transactions in regard to their interests (Williamson
1996b).
There are two main assumptions underlying transaction cost theory. First, decision
makers operate within a framework of bounded rationality (Simon 1982). Despite their
best efforts to deal with the complexity and unpredictability of the world around them,
they are limited in their ability to accurately predict and plan for the various contingencies
that may arise (Simon 1982). As a result, it is costly, both in time and resources, for
individuals to acquire and interpret information about the contracting environment and
the firm. The second assumption underlying the transaction cost framework is that of
opportunism. The assumption of opportunism suggests that some economic actors are
‘self-interest seeking with guile’ (Williamson 1975, p. 26) or subject to ‘frailties of
motive’ (Simon 1982, p. 303). Although not all parties are prone to such opportunistic
behaviour, the assumption of bounded rationality suggests that it is costly to identify
untrustworthy individuals ex-ante (Williamson 1996b).
According to Leiblein (2003), there are two important implications associated with these
assumptions. First, managers subject to bounded rationality find it costly to negotiate and
write complete contingent claims contracts that fully describe each party’s
responsibilities and rights for all future contingencies that could conceivably arise during
a transaction. That is, market contracts are incomplete. The notion of incomplete contracts
suggests that, when circumstances arise that are not accounted for in the original
agreement, individuals will need to negotiate revised terms that address the newly
26
uncovered contingency (Leiblein 2003). These renegotiations may lead to calculated
efforts to take advantage of the vulnerabilities of one’s trading partner in the hopes of
achieving a more favourable distribution of the joint economic profits derived from the
exchange. Consequently, managers will find it valuable to institute costly characteristics
to monitor and enforce contractual performance that allows them to identify non-
compliance and communicate instances of non-compliance to an arbiter that may provide
enforcement (Leiblein 2003).
This theory is applied as one of the CG theories to explain principal–agent problems and
ownership structure. Holmstrom and Milgrom (1991) used transaction cost theory to
analyse the multidimensional tasks in the principal–agent model. They analysed different
instruments—including employment contracts, ownership assignment and private
activities limitation—based on their cost and incentive benefit in solving principal–agent
problems. Considering the high-performance measurement cost, the researchers
suggested analysing incentive problems in totality. To be more specific, the CG
instruments should be combined to analyse the opportunity cost and measurement cost of
every aspect of the agent’s performance to achieve the lowest uncertainty and cost.
Besides Holmstrom and Milgrom’s study, other empirical studies have employed a
transaction cost framework (see Arifin 2006; Heide, Kumar & Wathne 2014); however,
no UAE studies have examined CG via this theory because of its limited applicability.
Table 2.1 provides a summary of the CG theories reviewed in this chapter, incorporating
their key tenets and assumptions, main propositions, key limitations and relevance to
UAE. The table demonstrates that no single theory encapsulates the wider environmental
influencing forces affecting firms in general, and especially in the UAE. As Christopher
(2010) stated, a multi-theoretic approach is required to overcome the limitations of the
predominant agency perspective in the governance literature. In keeping with the
sentiments of Christopher (2010), the present research adopts a multi-theoretic CG
approach that combines agency theory and resource dependence theory. The combination
of these theories reflects the UAE environmental influences affecting firms—for
example, both the agency theory and resource dependence theory describe the correlation
between board size and firm financial performance.
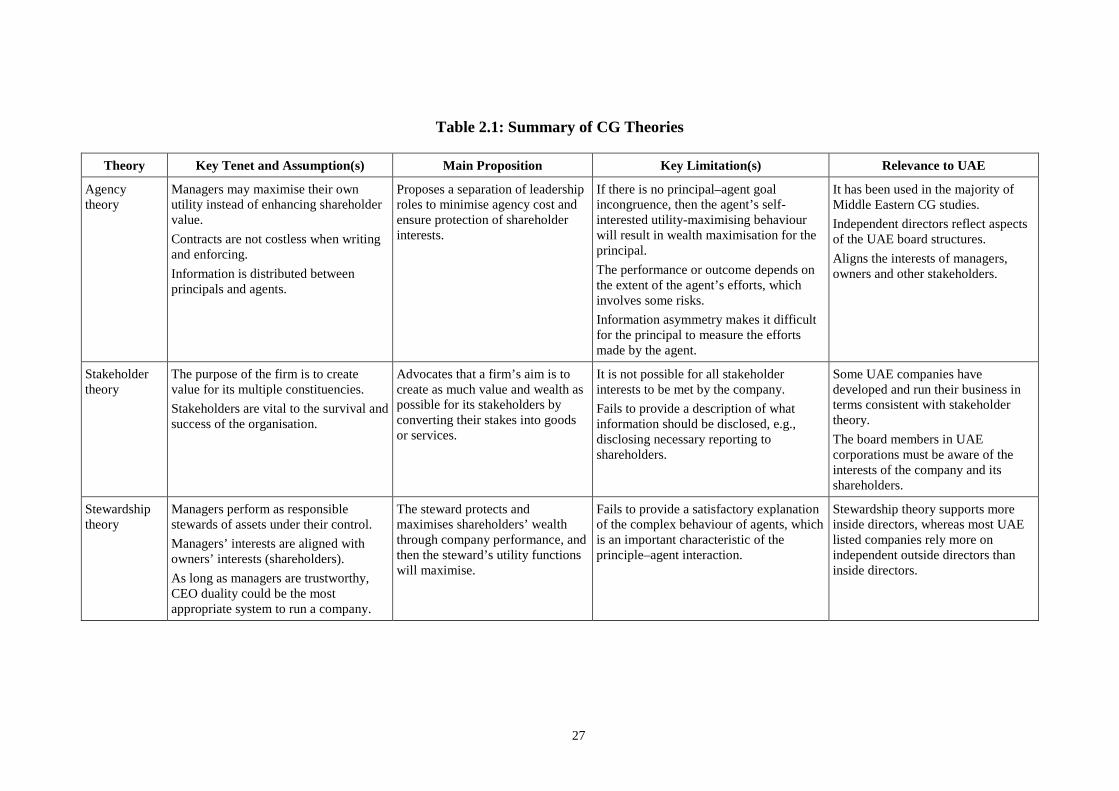
27
Table 2.1: Summary of CG Theories
Theory Key Tenet and Assumption(s) Main Proposition Key Limitation(s) Relevance to UAE
Agency theory
Managers may maximise their own utility instead of enhancing shareholder value. Contracts are not costless when writing and enforcing. Information is distributed between principals and agents.
Proposes a separation of leadership roles to minimise agency cost and ensure protection of shareholder interests.
If there is no principal–agent goal incongruence, then the agent’s self-interested utility-maximising behaviour will result in wealth maximisation for the principal. The performance or outcome depends on the extent of the agent’s efforts, which involves some risks. Information asymmetry makes it difficult for the principal to measure the efforts made by the agent.
It has been used in the majority of Middle Eastern CG studies. Independent directors reflect aspects of the UAE board structures. Aligns the interests of managers, owners and other stakeholders.
Stakeholder theory
The purpose of the firm is to create value for its multiple constituencies. Stakeholders are vital to the survival and success of the organisation.
Advocates that a firm’s aim is to create as much value and wealth as possible for its stakeholders by converting their stakes into goods or services.
It is not possible for all stakeholder interests to be met by the company. Fails to provide a description of what information should be disclosed, e.g., disclosing necessary reporting to shareholders.
Some UAE companies have developed and run their business in terms consistent with stakeholder theory. The board members in UAE corporations must be aware of the interests of the company and its shareholders.
Stewardship theory
Managers perform as responsible stewards of assets under their control. Managers’ interests are aligned with owners’ interests (shareholders). As long as managers are trustworthy, CEO duality could be the most appropriate system to run a company.
The steward protects and maximises shareholders’ wealth through company performance, and then the steward’s utility functions will maximise.
Fails to provide a satisfactory explanation of the complex behaviour of agents, which is an important characteristic of the principle–agent interaction.
Stewardship theory supports more inside directors, whereas most UAE listed companies rely more on independent outside directors than inside directors.

28
Theory Key Tenet and Assumption(s) Main Proposition Key Limitation(s) Relevance to UAE
Resource dependence theory
The board of directors not only performs a monitoring role, but also provides necessary critical resources, such as business contacts and contracts, knowledge, experience and expertise. Organisations are assumed to work towards acquiring control over resources that minimise their dependence on other organisations.
Organisations are not self-contained or self-sufficient—they rely on their environment for existence. The core of this theory focuses on how organisations gain access to vital resources for survival and growth.
Does not include the generation of internal resources as an important task in response to uncertainty reduction within a company. Does not consider the fact that external and internal factors are interrelated with regard to a company’s success or failure.
The UAE has been reliant on external human resources for a prolonged period, as this theory proposes.
Transaction cost theory
Transaction cost is caused by misaligned managers. Individuals within a firm are assumed to have bounded rationality. Framework suggests that some economic actors are self-interest seeking with guile.
Based on the principle that costs will arise when a company has directors to run the business.
Companies are not merely substitutes for market characteristics in forming efficient transactions.
No UAE studies have examined CG via this theory. Is used as a law, economics and organisation theory.
29
2.3.6 Multi-theoretic Approach to Corporate Governance Characteristics for
United Arab Emirates Listed Firms
Table 2.1 demonstrates that no single theory encapsulates the wider environmental
influencing forces affecting firms in general, and especially from a UAE context. As
Christopher (2010) stated, a multi-theoretic approach is required to overcome the
limitations of the predominant agency perspective in the governance literature.5 In
keeping with the sentiments of Christopher (2010), the present research adopts a multi-
theoretic CG approach that combines agency theory and resource dependence theory. The
combination of these theories reflects the UAE environmental influences affecting firms.
For instance, agency theory states that independent directors provide important
monitoring functions in an attempt to resolve the agency conflict between agents and
principals—a conflict ignored by stewardship theory. In addition, agency theory has
provided the basis for the governance standards, codes and principles developed by the
OECD (2004, 2015). More importantly, the 2009 UAE CG code, which constitutes a
cornerstone of the UAE CG reforms, aims to reduce agency conflicts between managers
and shareholders by improving the transparency, accountability and responsibility of
corporate boards of directors. Thus, the application of agency theory reflects the UAE
context.
In addition, the economy of the Gulf States has been reliant on external human resources
for a prolonged period. This feature is best reflected by resource dependence theory
because it provides a comprehensive explanation of the relationship between a firm and
its external environment and resources through boards to improve firm financial
performance (Pfeffer & Salancik 2003).
Given the circumstances outlined above, this research employs agency and resource
dependence theories as the principal theories in the theoretical framework to test the
developed hypotheses and explore the relationship between board of directors and audit
committee characteristics and the financial performance of UAE listed firms.
Having reached a multi-theoretic understanding of the concepts relevant to the present
research, the focus now is to critically review prior empirical studies that have examined
the effect of CG characteristics, with a focus on the effect of board and audit committee
5 Christopher (2010) presented a conceptual case for a more holistic governance model incorporating agency theory with stakeholder theory, resource dependence theory and stewardship theory.

30
characteristics on firm financial performance (Ibrahim, Raman & Saidin 2009; Ilaboya &
Obaretin 2015; Ntim & Oseit 2011). These studies are reviewed in the next two sections,
classified under board characteristics and audit committee characteristics.
2.4 Empirical Studies on Board Characteristics
One key element of CG is the role of boards of directors in overseeing firm financial
performance. According to Ram (2005), some board responsibilities include: (i) CEO
selection and succession; (ii) providing feedback to management on the organisation’s
strategy; (iii) compensating senior executives; (iv) monitoring financial performance and
risk; and (v) ensuring the accountability of the organisation to its investors. Moreover,
Boone et al. (2007) stated that boards hold the responsibility of policy making, setting
objectives, creating the mission statement and providing a general direction on the
company’s processes and procedures.
Therefore, boards of directors have important roles with respect to activities such as
designing and implementing strategy, and fostering links between the firm and its external
environment. In general, the most important role of the board of directors is to keep
monitoring the managerial functions of the company, as well as minimising the
difficulties inherent in the relationship between the principal (owners) and agent
(managers) (Elsayed 2011). As stated by Jensen and Meckling (1976), at the top of the
hierarchical corporate control systems is the board of directors, whose essential role is to
monitor the management by agents on behalf of the principals who selected its members
(Jensen & Meckling 1976).
According to Solomon (2010), boards should meet frequently, have independence, ensure
communication among board members and shareholders, consider suggestions from all
board members, have a high level of integrity, be aware of financial risks and manage
risks effectively. In this regard, Walker (2005) stated that the appropriate appointment
and compensation of directors is a considerable concern to which attention must be
devoted when constructing a board.
Many previous studies have identified the key board characteristics that play an important
role in terms of firm financial performance. For instance, an independent board is
generally viewed as part of efficient governance characteristics because independence
from management clearly enhances the ability of the board to exercise its oversight
function on behalf of principals (Liu & Fong 2010). Fama and Jensen (1983) also

31
supported the idea that independent directors have more incentive to protect the interests
of shareholders because of the importance of maintaining their reputation in the market.
Boone et al. (2007) stated that the board holds a very significant place in the design of a
corporate organisation, and stands accountable to stakeholders. Here, active and
successful boards of directors monitor management to reduce managerial activities
unaligned with shareholder interests. Thus, the quality of the decisions made by boards
affects the financial performance and value of firms, whereby more power and control in
monitoring management lead managers to act in the best interests of shareholders, thereby
reducing the agency conflict between managers and shareholders and leading to improved
financial performance. Therefore, boards’ characteristics and structures can affect firm
financial performance. Given this, the following subsections focus on the main board
characteristics that can affect a firm’s financial performance.
2.4.1 Board Size
According to Nicholson and Kiel (2007), board size relates to the number of directors on
the board who act on behalf of shareholders. Prior empirical studies show a mixed
response to the relationship between board size and firm financial performance (Aljifri &
Moustafa 2007; Johl, Kaur & Cooper 2015; Katuse et al. 2013; O’Connell & Cramer
2010). Therefore, the effect of board size on the performance of a firm is a debatable issue
in the research literature.
Currently, there is no one-size-fits-all approach for boards, which has caused continuing
debate regarding the appropriate board size for effective functioning. An optimal board
size is influenced by many factors, such as the size and complexity of the organisation,
the organisation’s business operations and the diversity of the business lines of the
organisation (Firth & Rui 2012). However, this has not precluded some scholars from
nominating an exact size. For instance, Bhagat and Black (2001) stated that board size
should comprise 11 members, while Cadbury (1992) stated that the ideal board size is
between eight and 10 members, with an equal number of executive and non-executive
directors. Agency theorists suggest that the optimal limit should be around eight directors
(Jensen 1993).
Meanwhile, Lipton and Lorsch (1992) suggested a maximum size of 10 members, since
more than 10 members will interfere with the group dynamics and hinder board
performance. Based on the second CG code in the UAE, the range of the board size should
32
be at least three members and a maximum of 15 members. This maximum range of 15
members aligns with Brown and Caylor (2004), who recommended between six and 15
members to enhance firm financial performance, and with Fauzi and Locke (2012), who
recommended between seven and 15 directors. The rationale for this range is that a small
board cannot suit all companies and a large board may provide a higher quality of
professional consultation and bring critical resources to the company, especially if the
organisation has complex operating activities or depends substantially on external
resources (Fauzi & Locke 2012).
According to Ramdani and Witteloostuijn (2010), the ‘one-size-fits-all’ design of CG,
which is applied to a wide variety of enterprises in many developed and developing
countries, may need to be more flexible to suit a range of different ‘best practices’,
according to organisations’ needs. It is clear from the discussion above that the effect of
board size on firm financial performance is not uniform across different countries.
Although there is no ideal size for a board, the right size of a board is driven by how
effectively the members can operate as a team and build a strong communication system
between them to make the right decisions.
According to resource dependence theory, partly because of their effective linkage
(Pfeffer & Salancik 1978) and diversity (Goodstein, Gautam & Boeker 1994), large
boards increase the likelihood of firms’ performance by improving companies’ ability to
co-opt the turbulent environment (Hambrick & D’Aveni 1992). This is in accordance
with the aspect of resource dependence theory that confirms that diversity and more
effective cohesion of large boards boosts firm financial performance by transcending
challenging market conditions (Goodstein, Gautam & Boeker 1994). The shortfalls in
linkage among smaller boards can undermine their access to credit. Moreover, large
boards mitigate the agency problem by performing their strategic function more
effectively, which is essential to reduce agency problems during periods of financial
turbulence or distress (Mintzberg 1983). Under such circumstances, the lack of diversity
in smaller boards increases uncertainty concerning strategic development (Goodstein,
Gautam & Boeker 1994; Mintzberg 1983). This ultimately increases the agency problem
and undermines performance in firms with smaller boards. As a result, this theory
signifies the presence of a positive relationship between board size and firm financial
performance. There are two different views in the extant literature on the relationship
between board size and firm financial performance—one view supports a large size, while
one view supports a small size.
33
2.4.1.1 Positive Associations between Board Size and Firm Financial Performance
There is a convergence of agreement with the argument that board size is linked to firm
financial performance. However, conflicting results exist regarding whether a small or
large board size is more effective. In this regard, agency theorists advocate that a large
board size is expected to decrease managers’ ability to dominate the board, and enables a
wider perspective on the managerial issues facing the company (Zahra & Pearce 1989).
This theory proposes that the board of directors acts as a representative of the various
shareholders and stakeholders of the company to monitor the performance and control
the activities of the managers (Fama & Jensen 1983). A larger board comprises a greater
number of directors working towards achieving the interests of the stakeholders in
monitoring and controlling the firm, and thereby improving the firm financial
performance (Kiel & Nicholson 2003). Thus, agency theory believes that a larger board
size enhances firm financial performance by achieving better monitoring through a large
group of people. As a result, this theory signifies the presence of a positive relationship
between board size and firm financial performance, favouring a large board size.
Almatari, Alswidi and Fadzil (2014b) used Tobin’s Q to measure the financial
performance of 162 non-financial companies in Oman during 2011 and 2012, which
indicated that a large board size was positively associated with firm financial
performance. This was because of the company having more relations to the external
environment, as well as more skilled and experienced members (resources) for decision
making to improve firm financial performance. Shukeri, Shin and Shaari (2012) indicated
a similar finding, where a large board size was more efficient in monitoring and
generating greater value for the firms. Their study used ROE to measure firm financial
performance for 300 Malaysian public listed companies, randomly selected for the year
of 2011.
The same positive finding was supported by De Andres and Vallelado (2008) in their
study of 69 large international commercial banks over the period 1996 to 2006. The banks
were chosen from six OECD countries (Canada, the US, the UK, Spain, France and Italy).
The study used OLS technique to test hypotheses and found that board size in banks was
related to directors’ ability to monitor and advise management, and that a large board size
could prove more efficient in monitoring and advising functions and creating more value.
In the extant literature on the relationship between board size and firm financial
performance, aside from those discussed above, other studies have found a positive
34
relationship between board size and firm performance that is consistent with agency
theory (Almatari, Alswidi & Fadzil 2014b; Almatari et al. 2012; Johl, Kaur & Cooper
2015; Kajola 2008; Klein 2002; Pearce Ii & Zahra 1992).
2.4.1.2 Negative and Insignificant Associations between Board Size and Firm Financial
Performance
Prior studies that found a negative relationship between board size and firm financial
performance were undertaken by Katuse et al. (2013); Boone et al. (2007); Eisenberg,
Sundgren and Wells (1998); Rashid et al. (2010); Bozec (2005); Mollah and Uddin (2007)
and O’Connell and Cramer (2010). Yermack (1996) undertook an empirical study on the
relationship between boards and firms’ financial performance using Tobin’s Q in a
sample of 452 large US industrial corporations between 1984 and 1991. The study found
that firm financial performance had a negative relationship with board size. A large board
size was seen to be slow in decision making, while the directors rarely criticised the
policies of top managers.
Vo and Phan (2013) undertook an empirical study in Vietnam on the relationship between
CG and firms’ performance, as measured by ROA, and selected 77 listed firms over the
period 2006 to 2011. The results supported the view that board size contributed negatively
to the financial performance of firms in Vietnam, and indicated that board size tended to
reduce financial performance. Chaudhry and Malik (2015) found the same result—that a
smaller board size contributed more to the success of 30 listed companies on the Karachi
Stock Exchange. The results concluded that board size has a negative effect on financial
performance, and supported that a larger board of directors might face more difficulty in
communicating between members, which damages firms’ performance.
Dabor et al.’s (2015) study revealed that a large board size reduced the profitability of
Nigerian listed companies on the Nigerian Stock Exchange. The study used a sample of
248 companies listed on the Nigerian Stock Exchange, with ROE and ROA used as
proxies for firm financial performance. The negative relationship was attributed to board
members spending too much energy and time on minor problems. Further, the larger
board size required major overhead costs that reduced company profit.
Sueyoshi, Goto and Omi (2010) examined 270 leading Japanese companies in
manufacturing industries from 1999 to 2006. All the sample firms were listed in the first
section of the Tokyo Stock Exchange. This study supported the idea that a small board

35
size is better than a large size in Japanese firms because it leads to quick and efficient
managerial communications among members, thereby resulting in more effective board
monitoring with increased firm performance. Thus, a large board size is inefficient in
terms of higher spending costs, as well as creating difficulties in ensuring clear plans and
regular meetings, and causing slow decision making because of the large number of
members and poor communication among members.
Min-Hsien and Jia-Hui (2007) conducted another CG study in Taiwan, using 232
manufacturing firms listed on the Taiwan Stock Exchange from 1999 to 2003. This study
concluded that a small board might be less encumbered with bureaucratic problems, more
efficient and more able to provide better financial reporting oversight, whereas a large
board has the disadvantage of high cost of coordination and delay in passing information,
which could lead to weak monitoring.
Other studies found that no relationship existed between firm financial performance and
board size (Aljifri & Moustafa 2007; Ghabayen 2012; Ibrahim & Samad 2011; Rouf
2011).
2.4.2 Board Composition
The board composition typically comprises executive directors and independent
directors, with each category characterised by different incentives and behaviours. Board
composition has long been considered an important board characteristic, which is
generally estimated by the proportion of independent directors as a proportion of total
board members (Haat et al. 2008). Previous studies have examined the relationship
between board composition and firm financial performance, and produced mixed results,
although theory suggests that a greater proportion of independent directors should make
the board more effective and lead to improved financial performances (Dalton et al. 1998;
Nuryanah & Islam 2011).
Board composition is an important component of the CG characteristic in any company,
since directors play a significant role in the performance of the firm (Boone et al. 2007).
Fama and Jensen (1983) supported the idea that independent directors have more
incentive to protect the interests of shareholders because of the importance of maintaining
their reputation in the market; thus, the performance of the company would improve. Lai
and Tam (2007) indicated that independent directors play an important monitoring role
in the Chinese CG characteristic. Kato and Long (2005) found that the adoption of

36
independent directors in Chinese listed companies helps improve the firm financial
performance. The relationship between board composition and firm financial
performance has been investigated in previous studies, and the results are discussed
below.
2.4.2.1 Positive Associations between Board Composition and Firm Financial
Performance
Many studies have been undertaken to examine the relationship between board
composition and firm financial performance. For example, Yasser, Entebang and Mansor
(2011) used a sample of 30 listed Pakistani firms between 2008 and 2009, and found a
positive relationship between board composition and firm performance. These study
results were consistent with a prior empirical study by Tian and Lau (2001), which stated
that the board size should be kept to a sizeable limit, and the board must be a suitable
mixture of directors.
Aamir and Sajid (2012) studied a sample of 91 listed firms in the Karachi Stock Exchange
for the year 2010, and the results demonstrated that independent directors led to improved
financial performance, compared with firms with no independent directors on their board.
A similar conclusion was reached by Tian and Lau (2001) in a study using a sample of
207 Chinese shareholding companies for the year 1996. Their study showed a positive
relationship between firm financial performance, as measured by ROA, and independent
directors. Specifically, they found that having more independent directors on the board
improved firm financial performance. The same result was demonstrated by Luan and
Tang’s (2007) study in Taiwan with a sample size of 259 firms during 1997 and 2001, as
well as Daily and Dalton’s (1992) study, which used the top 100 US listed firms for the
year 1989.
O’Connell and Cramer (2010) examined a sample of 77 non-financial firms listed on the
Irish Stock Exchange in 2001, and found a positive relationship between board
composition and firm financial performance. Kyereboah-Coleman and Biekpe’s (2006)
study also supported the notion that independent directors result in improved firm
financial performance. Hsu and Petchsakulwong’s (2010) study in Thailand collected
data from public non-life-insurance companies over the period 2000 to 2007, and used
Tobin’s Q, ROA and ROE to measure firm financial performance. It also found support
for a positive association between board composition and firm financial performance.

37
2.4.2.2 Negative and Insignificant Associations between Board Composition and Firm
Financial Performance
Kiel and Nicholson (2003) examined the associations between board composition and
corporate financial performance in 348 of the largest publicly listed companies in
Australia for the year 1996. Their study revealed a negative relationship between board
composition and firm financial performance, as measured by assets and revenue and the
market-based performance measure of Tobin’s Q. Ghabayen (2012) also found a
significant negative relationship between board composition and firm financial
performance for 102 non-financial listed companies in Saudi Arabia in 2011.
Cho and Kim (2007) analysed the effect of independent directors on corporate
performance during a period of governance reform in Korea. The study collected data
from 347 listed firms on the Korea Stock Exchange during 1999. They employed
regression analysis and found no significant relationship between independent directors
and firm financial performance.
Weir and Laing (2001) examined 320 UK companies covering 1995 to 1996 to test the
relationship between CG and firm financial performance, and their view was against the
agency theory. They found that independent directors were negatively associated with
firm financial performance because independent directors were only employed as part-
time members and were more likely to have other job commitments that could result in
devoting insufficient time to the firm. In addition, they may not understand certain issues
in the firm, and may ultimately make weak decisions. Another study by Mura (2007)
analysed data from companies in the UK for the period 1991 to 2001, and found that
board composition was negatively related to firm financial performance. A possible cited
reason for this was a lack of experience among board members.
Kajola (2008) studied the relationship between board composition and firm performance
in Nigeria by examining 20 non-financial firms between 2000 and 2006, and identified
no significant relationship between the two. In addition, Dabor et al. (2015) selected a
sample of 248 companies and used ROA and ROE as measures of firm performance to
study the effect of board independence on firm performance. They found no significant
relationship between board independence and firm financial performance.
Another study conducted by Rashid et al. (2010) used ROA and Tobin’s Q as financial
performance measures to examine the relationship between board composition and firm
38
economic performance in Bangladesh, examining 278 companies during the period 2005
to 2009. The results showed no significant relationship between board composition and
firm financial performance, thereby implying that the independent directors did not add
financial value to Bangladeshi listed firms. This finding was supported by Johl, Kaur and
Cooper (2015) through their study on 700 public listed firms in Malaysia for the year
2009.
Additionally, some studies failed to find a conclusive relationship between board
composition and firm financial performance (Pincus, Rusbarsky & Wong 1989).
Almatari, Alswidi and Fadzil (2014a) attained this result by examining the relationship
between board independence and firm financial performance in Oman. Their study used
ROA to measure firm financial performance, and the data were collected from 2011 to
2012.
The empirical studies reviewed above indicate that independent directors on the board
and their effects on financial performance are not the same in all business markets around
the world. Overall, the relationship between independent directors and firm financial
performance has provided mixed results in both developed and developing countries. The
high degree of diversity in the results of earlier studies on board composition and firm
financial performance means that the findings remain inconclusive. For this reason, this
study tests the effect of board composition on firm financial performance among UAE
listed companies.
2.4.3 Board Meetings
Board meetings provide board members with the chance to discuss and exchange ideas
regarding how they wish to monitor managers and firms’ strategies. A higher number of
board meetings per year indicates more active directors who are perceived to foster
greater oversight of the company (Firth & Rui 2012). Johl, Kaur and Cooper (2015)
suggested that board meetings are important for directors to perform their duties. The
number of board meetings held during a year is an important indicator of board
characteristics and is a requirement of CG codes in many countries, with listed firms
encouraged to have regular board meetings (Johl, Kaur & Cooper 2015). In some
countries, such as the UAE and Malaysia, the CG code requires the disclosure of the
number of meetings held in a year and the attendance record of each individual director
during the meetings held. Frequency of board meetings is an important way of improving
board effectiveness (Johl, Kaur & Cooper 2015). In this regard, the second CG code in
39
the UAE in 2009 states that listed companies should hold at least six meetings of the
board in any given year.
Jensen (1993) stated that regular responsibilities constitute most of the board’s meeting
time. As a result of the significance of board meetings to firm financial performance,
many studies have examined the relationship between board meetings and firm financial
performance in the context of developed and developing countries. Although the
literature review shows different results, the majority of the studies support a positive
relationship between board meetings and firms’ financial performance.
2.4.3.1 Positive Associations between Board Meetings and Firm Financial Performance
Johl, Kaur and Cooper (2015) maintained that board meetings and attendance at meetings
are important situations through which board members obtain firm-specific information
and full details about the firm’s financial performance. Moreover, these meetings allow
directors to fulfil their monitoring role. Francis, Hasan and Wu (2015) found a positive
relationship between attendance at board meetings and company performance based on
data collected from the Investor Responsibility Research Centre over the period 1998 to
2011.
A study conducted by Hsu and Petchsakulwong (2010) collected data from 18 Thai public
non-life-insurance companies over the period 2000 to 2007, using Tobin’s Q, ROA and
ROE to measure firm financial performance. They stated that the effectiveness of the
board of directors depends on the frequency of its meetings, with more meetings leading
to improved financial performance of the firm, since directors are provided with more
opportunity to monitor and review the performance of the company.
Vafeas (1999) examined 307 firms over the 1990 to 1994 period, selected from the largest
firms listed in the Forbes compensation survey for 1992, and found that board meeting
frequency was related to CG, consistent with agency theory. This study also used the
number of board meetings to measure board activity as an important dimension of board
operations, and confirmed that board meetings play an important role in the governance,
conformance and performance of companies, which was also stated by Lipton and Lorsch
(1992).
Another study conducted by Almatari, Alswidi and Fadzil (2014a) examined the
relationship between the board of director meetings and the performance of Oman
companies. They employed a multiple linear regression method to analyse the data

40
collected from 81 non-financial firms for the years 2011 and 2012 in Oman. Their
findings indicated a significant positive relationship between board meetings and Tobin’s
Q, as the measurement indicator for firm financial performance.
Ntim and Oseit (2011) investigated the effect of corporate board meetings on corporate
performance for a sample of 169 listed corporations in South Africa from 2002 to 2007,
using ROA and Tobin’s Q as financial performance measures. The findings indicated a
significant and positive association between frequency of board meetings and firm
financial performance. Their findings provide empirical support for agency theory, which
suggests that more frequent board meetings increase the capacity to effectively advise
and monitor the management processes, thereby improving the performance of the
companies (Ntim & Oseit 2011).
Similar findings were revealed by Tarak Nath and Apu (2013), who studied the
relationship between board meetings and Indian firm financial performance. The study
period was 2006 to 2011, with 52 Indian manufacturing companies listed on the Bombay
Stock Exchange. The results demonstrated that board meetings had a significant and
positive effect on firm financial performance. Joseph, Madugba and Okpe (2015) tested
the relationship between board meetings and financial performance for listed companies
in Nigeria over 2008 to 2014. They found a significant and positive relationship between
board meetings and firm financial performance.
2.4.3.2 Negative and Insignificant Associations between Board Meetings and Firm
Financial Performance
Evans, Evans and Loh (2002) examined a sample of 65 Australian firms covering the
period 1996 to 1999, and found a negative association between board size and the
frequency of board meetings. This result was supported by Johl, Kaur and Cooper (2015),
who found a significant negative relationship between the two.
Fich and Shivdasani (2006) examined a sample consisting of firms that appeared in the
1992 Forbes 500 list of largest corporations, based on assets, sales, market capitalisation
or net income, during the seven-year period from 1989 to 1995. They provided evidence
that aligned with the results of prior research showing that boards that met more
frequently were valued less by the market.
Johl, Kaur and Cooper (2015) used the financial and non-financial data of 700 public
listed firms in Malaysia for the year 2009, and confirmed that board meetings negatively
41
affected firm financial performance, as measured by ROA. This finding was supported
by Lipton and Lorsch (1992), who stated that frequent meetings can lead to resources
being channelled towards less productive activities, thereby negatively affecting firm
financial performance.
The above arguments indicate that there have been mixed findings regarding the effect of
board meetings on firm financial performance. In addition, since many existing studies
have been undertaken in developed countries, which have different institutional contexts
and CG practices, board meetings have varying effects on firm financial performance.
Thus, the present research will examine the influence of board meetings on firms’
financial performance in the UAE context.
2.4.4 Board Members’ Education
Board members’ education refers to the educational background of the board members.
Managers with higher educational qualifications are expected to be more capable than
those with lower educational qualifications. Wailerdsak and Suehiro (2004) posited that
educational level should be used to measure skills and competencies. According to
resource dependence theory, education is one of the external resources that enhances the
financial performance of firms (Pfeffer & Salancik 2003). A number of studies have
focused on the influence of board educational background on financial performance and
showed mixed results. The results on the relationship between board members’ education
and firm financial performance in the extant literature are discussed below.
2.4.4.1 Positive Associations between Board Members’ Education and Firm Financial
Performance
A small number of studies support the notion that the higher the board members’
education level, the better the firm financial performance. Finkelstein and Hambrick
(1996) used a sample of 100 firms—including computer, chemical and natural-gas
distribution companies—that were drawn from a population of the largest firms in each
industry for all fiscal years between 1978 and 1982. The study identified a positive and
significant relationship between the average education level of the top directors and
company performance. Cheng, Chan and Leung (2010) used Mainland Chinese firms to
study the influence of educational levels on firms’ financial performance. Their findings
indicated that members with higher educational levels led to enhanced firm financial
42
performance. The study also found that board members who held university degrees were
significantly positively associated with firm financial performance.
Almatari, Alswidi and Fadzil (2013) studied the relationship between board education
and firm financial performance, as measured by ROA. They stated that having a qualified
and educated member on the board improved firm financial performance. Fairchild and
Li (2005) stated that the board member must be fully equipped with management
knowledge to contribute positively to manage and lead the company, and ultimately
enhance and improve the firm’s performance. According to Wiersema and Bantel (1992),
members with high qualifications are more able to innovate than members with a lower
educational background; hence, highly educated members can lead to improving firm
financial performance. This result aligned with the findings from Ondersteijn, Giesen and
Huirne (2003), who examined the data of 114 farms in the Netherlands collected over the
period 1997 to 1999; Wilson, Hadley and Asby (2001), who examined a sample of 74
eastern England firms covering 1993 to 1997; and Hsu (2010), who examined 223 US
firms from 2000 to 2002.
Similarly, Darmadi (2013) examined the relationship between the educational
backgrounds of board members on firm financial performance, and employed a sample
consisting of 160 firms listed on the Indonesia Stock Exchange for the financial year
2007. The results indicated that postgraduate degrees and degrees from ‘prestigious’
high-ranked universities had significant positive effects on ROA.
2.4.4.2 Negative and Insignificant Associations between Board Members’ Education and
Firm Financial Performance
Some previous studies did not show a positive association between board members’
education and firm financial performance. For instance, Gottesman and Morey (2006)
studied the correlation between education and firm financial performance, as measured
by ROE, Tobin’s Q, ROA and adjusted ROA. The study used all New York Stock
Exchange listed firms during the period 1997 to 2003. They found that companies
managed by members who had Master of Business Administration or law degrees
performed no better than companies managed by members who did not have graduate
degrees. Thus, there was no association between education and the financial performance
of listed firms in the US. Vo and Phan’s (2013) study in Vietnam examined the
relationship between board education and the performance of Vietnamese firms. They
measured financial performance by ROA and collected data from 77 listed firms trading
43
over the period 2006 to 2011 in Vietnam. They found no relationship between the
education level of board members and the performance of Vietnamese firms.
Darmadi (2013) examined the Indonesian Stock Exchange for the financial year 2007 to
study the relationship between education and firm financial performance, and found a
significant and negative relationship between postgraduate degrees held by board
members and Tobin’s Q. He also found that board members holding developed-country
degrees were negatively related to ROA. Further, academic degrees held by board
members in finance-related disciplines negatively influenced firm financial performance,
while firms led by directors with qualifications from ‘prestigious’ universities showed
significantly higher profitability than others (Darmadi 2013).
As the review above illustrates, board members’ education and its influence on financial
performance are different from one country to another. As a result, the findings cannot be
generalised to the UAE and this topic requires further investigation.
2.4.5 Board Members’ Experience
Board members’ experience is related to the number of years of experience held by board
members. Managerial skills are not always obtained from high levels of educational
qualification because experience, leadership and entrepreneurial skills also play a
significant role in any business environment. Experience and skills are two of the most
important drivers of firm financial performance. According to Wu (2009), a successful
board of directors is recognised as a board consisting of members with different
backgrounds, with some having accounting experience, marketing experience and so on.
The greater the diversity of experience, the more likely the board will benefit the firm.
This finding was based on a study of 100 Chinese local companies listed on the Shanghai
Stock Exchange in 2008. The below sections discuss the extant literature on the results
of the relationship between board experience and firm financial performance.
2.4.5.1 Positive Associations between Board Members’ Experience and Firm Financial
Performance
Some prior studies have supported the relationship between board experience and firm
financial performance. Corner and Kinicki (1997) found a positive relationship between
firm financial performance and experienced team members, based on average years of
professional experience. This increased knowledge led to improved firm financial
performance. Resource dependence theory postulates that board members with various

44
experiences, skills, knowledge and expertise will result in good corporate performance
and positively affect firm financial performance (Pfeffer & Salancik 2003).
Vo and Phan (2013) examined the relationship between board members’ experience and
the performance of Vietnamese firms. They measured financial performance by ROA and
collected data from 77 listed firms trading over the period 2006 to 2011 in Vietnam. They
found a positive correlation between experienced board members and firm financial
performance. Hsu (2010) examined 223 US firms from 2000 to 2002, and also found a
positive relationship between board expertise and financial performance. Jenkins (2013)
examined the importance of board experience for firm financial performance for 150
South African listed companies in the period 2003 to 2011, and found a positive
relationship between them.
Johl, Kaur and Cooper (2015) used the financial and non-financial data of 700 public
listed firms in Malaysia for the year 2009, and concluded that board members who had
accounting or financial experience were positively associated with firm financial
performance. Another study conducted by Mura (2007) indicated that board members
with a lack of experience led to a negative relationship with firm financial performance,
based on analysing data collected from companies in the UK for the period 1991 to 2001.
Thus, Mura supported the notion that experienced board members improve financial
performance.
Zhu and Shen (2016) analysed data collected from 188 Fortune 500 companies from 1994
to 2007, and concluded that members with more experience were more aware of the
challenges in business environments and could better deal with problems. Conversely,
members with less experience experienced greater difficulty in managing their
relationships or communicating with other members, which led to poor financial
performance. This result was supported by Makhlouf, Laili and Basah’s (2014) study, in
which board members’ experience and qualifications were seen to be a significant factor
to support and improve firms’ performance.
2.4.5.2 Negative and Insignificant Associations between Board Members’ Experience
and Firm Financial Performance
A few published studies have demonstrated a negative relationship between board
members’ experience and firm financial performance. Wright and Deacon (2010) studied
the relationship between board experience and firm financial performance, with data
45
collected from a selected sample of New Zealand firms. This qualitative study found a
weak relationship between board member experience and the financial performance of
New Zealand companies.
According to the above discussion, studies on the effect of board members’ experience
on firms’ performance are somewhat inconclusive with respect to the Middle Eastern
region. Consequently, the present research will examine the influence of board members’
experience in the UAE.
2.5 Empirical Studies on Audit Committee Characteristics
Accounting scandals, corporate failures and concerns about the quality of financial
statements have led many countries around the world to focus on improving audit
committee effectiveness. As a subcommittee of the board, the audit committee provides
an important function by enhancing information quality, which results in increasing the
financial performance of the firm (Pincus, Rusbarsky & Wong 1989). The main objective
of the audit committee is to help the board oversee and monitor the firm’s financial
statements, including the financial reporting process, the audit process and compliance
with laws and regulations (Wild 1996). According to Dey (2008, p. 1151):
The audit committee is primarily responsible for overseeing the financial reporting
process on behalf of the board of directors, reviewing the financial disclosures, and
meeting privately, outside the presence of management, with the firm’s auditors to
discuss the internal accounting control policies and procedures.
Regulatory interest is the main role of audit committees with respect to CG (Abbott &
Parker 2000). As stated by Almatari, Alswidi and Fadzil (2014a), audit committee
members have a significant role in ensuring CG practices are followed in the auditing
process. According to Beasley et al. (2000), the proportion of financial fraud can be
reduced by establishing an audit committee. Given their importance, audit committees
are included in the present research by examining their relationship with the financial
performance of publicly listed UAE firms.
2.5.1 Audit Committee Size
Audit committee size refers to the number of audit committee members (Amer, Ragab &
Shehata 2014; Nuryanah & Islam 2011). Previous studies have revealed that companies
with audit committees operate better than those without them (Wild 1996), while others
46
have indicated that audit committees have no role to play in firm financial performance
(Vafeas & Theodorou 1998). The importance of audit committees has led researchers to
examine associations between them and firm financial performance.
The separation of ownership and control in contemporary business creates conflicts of
interest between managers and stakeholders, and this conflict is between the principal and
agent; hence, companies are obliged to use control characteristics (such as audit
committees) to reduce agency costs and information asymmetry (Kalbers & Fogarty
1998). Audit committee size is one of the most important dimensions of audit committee
characteristics. In this regard, agency theorists advocate that a larger committee has a
more diverse knowledge base and deeper understanding to monitor management
information systems, which can help reduce agency cost and boost firm financial
performance (Fama & Jensen 1983). Similarly, Pincus, Rusbarsky and Wong (1989)
argued that audit committees are used primarily in situations with high agency costs to
improve the quality of information flows from the agent to principal, thereby improving
firm financial performance. According to Pearce Ii and Zahra (1992), an audit committee
with an appropriate number of members enables members to use their experience and
expertise for the benefit of stakeholders. The results of the empirical relationship between
audit committee size and firm financial performance are discussed below.
2.5.1.1 Positive Associations between Audit Committee Size and Firm Financial
Performance
Agency theory posits that a larger number of audit committee members can enhance firm
financial performance by providing better monitoring. As a result, this theory signifies
the presence of a positive relationship between audit committee size and firm financial
performance, favouring a large committee size. Similar to the argument in support of
larger audit committees, resource dependence theory postulates that an audit committee
with a small size lacks diverse skills and experience, and is subsequently ineffective (Al
Matari, Al Swidi & Fadzil 2014). According to this theory, an audit committee with a
higher number of members would perform better than a smaller committee.
A small number of studies have identified a positive relationship between audit committee
size and firm financial performance. Kyereboah-Coleman (2008) examined data from 103
listed firms drawn from Ghana, South Africa, Nigeria and Kenya, covering the five-year
period from 1997 to 2001. They found that audit committee size positively affected the
financial performance of African listed companies from Nigeria, Kenya and South Africa.

47
Another study by Ibrahim, Raman and Saidin (2009) used a sample of 261 listed
companies in the Bursa Malaysia in 2004, and found that audit committee size had a
significant positive effect on firm financial performance, which they believed was due to
improvements in the quality of financial reporting. Hamdan, Sarea and Reyad (2013)
examined the effect of audit committee characteristics in Amman, and found a positive
relationship between the audit committee size and financial performance of 106 firms
listed on the Amman Stock Exchange Market over the period 2008 to 2009.
2.5.1.2 Negative and Insignificant Associations between Audit Committee Size and Firm
Financial Performance
Klein (2002) found a negative relationship between audit committee size and firm
financial performance. The results of this study indicated that large audit committee sizes
were not preferred for US firms because they led to an increase in earnings management.
In a study on firms in Malaysia and Singapore, Mohiuddin and Karbhari (2010) also
found no significant relationship between audit committee size and firm financial
performance.
Amer, Ragab and Shehata (2014) used audit committee size as a variable in their research
to oversee the effect of audit committee characteristics on companies’ performance in
Egyptian companies listed on the stock exchange, via measuring ROE, ROA and Tobin’s
Q. Their study did not find a significant relationship, which suggests that audit committee
size did not influence firms’ financial performance. Azim (2012) determined the
consequences of CG characteristics on the performance of companies, where audit
committee size was one of the characteristics. The sample size comprised 1,500
companies selected from the 500 top companies listed on the Australian Securities
Exchange (ASX) for 2004 to 2006. Their study found that audit committee size had a
negative effect on firm financial performance.
In Saudi Arabia, Almatari et al. (2012) examined the relationship between audit
committee size and firm financial performance, and concluded that there was no
significant relationship between size and financial performance. Conversely, Ghabayen’s
(2012) Saudi Arabian study, which was based on 102 firms, indicated that, although the
size of the audit committee played a significant role in improving the quality of financial
reporting, it did not correlate with firm financial performance, as measured by ROA.
48
Aldamen et al. (2012) shared the same view, contending that a smaller audit committee
size with good experience and financial expertise was more likely to be correlated
positively with firm financial performance. Their study collected and analysed data from
Australia’s top 300 companies by market capitalisation (S&P/ASX 300) during the period
of the GFC, from 2008 to 2009. Similar findings were revealed by Vafeas (1999), who
demonstrated that a large audit committee size was inefficient in terms of higher spending
cost, and created more difficulties in scheduling regular meetings, compared with smaller
audit committees, who were more likely to hold regular meetings and have better
communication among members, thereby achieving improved financial performance.
Mak and Kusnadi (2005) examined the effect of CG characteristics on Tobin’s Q, using
a sample of 460 Malaysian listed firms for the 1999 and 2000 financial years. Their study
revealed no relationship between the size of the audit committee and firm financial
performance. According to the above discussion, the size of the audit committee produces
different effects in different countries. Thus, this factor will be further examined in the
present research within the UAE context.
2.5.2 Audit Committee Composition
Another element of audit committee characteristics is audit committee composition.
Audit committee composition refers to the proportion of independent members compared
with total members in the committee (Almatari, Alswidi & Fadzil 2014b). According to
Uddin and Choudhury (2008), the role of an independent members on the audit committee
are vital in ensuring transparency. Audit committee members indirectly support CG
regulation via their direct link to good financial reporting (Carcello & Neal 2003b). This
can be seen in the Australian Corporate Governance Principles and Recommendations,
which demand that firms have an independent audit committee with at least three
independent directors (ASX CGC 2010).
In terms of financial fraud, Romano (2004) argued that an audit committee with only
independent members or with a majority of independent members does not reduce the
occurrence of accounting improprieties. Prentice and Spence (2006) refuted this argument
by contending that independent members in audit committees can improve financial
reporting. Carcello and Neal (2000) shared the same view—that greater audit committee
independence led to improved monitoring of the financial reporting process, and this
result aligned with the findings of Bronson et al.’s (2009) study. Beasley (1996) shared
the same view, contending that a larger number of independent members on the audit
49
committee can lead to increased levels of disclosure by listed companies, and facilitate
more effective monitoring of financial reporting. Overall, there are two contrasting views
in the extant literature on the relationship between audit committee composition and firm
financial performance, as discussed below.
2.5.2.1 Positive Associations between Audit Committee Composition and Firm Financial
Performance
A large quantity of literature has been developed regarding whether independent
members on audit committees improve corporate performance. Yasser, Entebang and
Mansor (2011) investigated the relationship between audit committee composition and
firm financial performance, and found that audit committee composition was positively
associated with firm financial performance when examining a sample of listed firms on
the Karachi Stock Exchange. This result was supported by Ilaboya and Obaretin’s (2015)
study in Nigeria, which found that independent audit committees improved the oversight
function of the committee. They identified a positive and significant relationship between
independent directors on audit committees and firm financial performance in Nigeria.
According to agency theory, audit committees should have independent members to help
owners monitor the activities of management. Here, independent auditors lead to a
positive relationship between audit committee composition and firm financial
performance (Almatari, Alswidi & Fadzil 2014a). Dey (2008) stated that audit
committees are more effective in monitoring a firm’s financial reporting process when
they have a larger number of independent members on the committee.
2.5.2.2 Negative and Insignificant Associations between Audit Committee Composition
and Firm Financial Performance
Some studies have found a strong negative relationship between audit committee
composition and performance. For example, Menon and Williams’s (1994) study
examined 23 cases from US over-the-counter firms and found a strong negative
relationship between audit committee composition and US firm financial performance.
Similar results were found by Abbott and Parker (2000), who contended that the degree
of independence of audit committees negatively affected firm income, after examining a
sample of 500 firms listed on the New York Stock Exchange for 1994 to 1995. According
to Klein (2002), having all independent members in the audit committee can be more
costly for the firm, which can lead to a negative relationship between audit committee
50
independence and profits. Specifically, a significant relationship was found only when
the audit committee had fewer independent directors.
Some other studies found no significant relationship between audit committee
composition and firm financial performance. For instance, Ibrahim, Raman and Saidin
(2009) found no significant relationship between the level of independence of the audit
committee and the performance of the firm. This result aligned with Ghabayen’s (2012)
findings, which identified no existing relationship between audit committee composition
and firm financial performance in Saudi Arabia.
Kajola (2008) studied the relationship between audit committee independence and
performance in Nigeria, and concluded that there were no potential relationships between
the two. In addition, Cotter and Silvester’s (2003) study found no significant relationship
between audit committee independence and firm financial performance. Their study used
each firm’s average earnings before interest and the tax–total assets ratio as financial
performance measures, and covered a three-year (1995 to 1997) period. This finding was
supported by Klein’s (1998) study, which employed test data collected from 485 US firms
listed on the S&P 500 for 1992, and 486 firms for 1993.
According to the above discussion, previous studies have produced inconclusive findings
regarding the effect of audit committee composition on firm financial performance. In
addition, institutional contexts are difficult to generalise to other nations. Consequently,
this study will test the relationship between audit committee composition and firm
financial performance in the UAE.
2.5.3 Audit Committee Meetings
Audit committee meetings refer to the number of meetings that the committee holds in a
year. Active audit committees are more likely to monitor management effectively, which
can lead to improved firm financial performance. Some argue that an increase in the
number of meetings provides more effective monitoring, which leads to improved firm
financial performance (Alqatamin 2018; Luo et al. 2009; Raghunandan & Rama 2017).
There are two different views in the extant literature on the relationship between audit
committee meetings and firm financial performance, as discussed below.
51
2.5.3.1 Positive Associations between Audit Committee Meetings and Firm Financial
Performance
A small number of studies have examined the relationship between audit committee size
and firm financial performance and indicated positive results. Hsu (2010) examined the
effect of audit committee meetings on firm financial performance for 223 US firms from
2000 to 2002. This study concluded that audit committee meetings are positively
associated with the financial performance of US firms, as measured by Tobin’s Q.
The same positive relationship was found by Almatari et al.’s (2012) study. They
collected data from 146 Saudi firms listed on the Saudi Stock Exchange in 2010,
excluding financial companies. The study showed a positive relationship between the
number of audit committee meetings and firm financial performance. These results lend
support to agency theory, which suggests that more committee meetings lead to better
monitoring of firms’ financial activities and can result in improved financial performance
(Almatari, Alswidi & Fadzil 2014a; Fama & Jensen 1983).
2.5.3.2 Negative and Insignificant Associations between Audit Committee Meetings and
Firm Financial Performance
Some studies have indicated a negative relationship between audit committee meetings
and firm financial performance. For instance, Aldamen et al.’s (2012) study during the
GFC collected and analysed data from Australian firms. They measured financial
performance via ROA, and their study showed a significant and negative relationship
between the number of meetings and firm financial performance. Yang and Krishnan
(2005) proved that the number of meetings of audit committees negatively affected
quarterly earnings management.
Hamdan, Sarea and Reyad (2013) conducted a study on Jordanian companies, and
measured audit committee meetings through the number of annual meetings the
committee held. They found no significant association between the number of meetings
and financial performance of 106 firms on the Amman Stock Exchange for the period
2008 to 2009.
Kikhia (2014) also studied the relationship between audit committee meetings and firm
financial performance via a sample of 112 non-financial companies listed on the Amman
Stock Exchange for the period 2010 to 2012. The results showed no significant
relationship. Alqatamin (2018) investigated the effect of audit committee characteristics

52
on companies’ performance, with a sample consisting of 165 non-financial companies
listed on the Amman Stock Exchange over the period 2014 to 2016. The results of the
study showed that audit committee meetings had an insignificant association with firm
financial performance.
Overall, the effects of audit committee meetings on firms’ performance displayed
different results from one country to another. Thus, the findings cannot be generalised
regarding the influence of audit committee meetings on firms’ financial performance.
Therefore, the present research will examine this issue in the UAE context.
2.5.4 Audit Committee Members’ Education
Audit committee members’ education refers to the educational background of the audit
committee members. In this regard, company policy plays an important role in employing
people with the right education, experience and knowledge (Almatari, Alswidi & Fadzil
2014a). Although audit committee members might come from a wide variety of
backgrounds, firms should have members who understand various accounting and
financial issues to attain effective auditing oversight (Abbott, Parker & Peters 2004).
According to resource dependence theory, education is one of the external resources that
enhance the financial performance of firms (Pfeffer & Salancik 2003).
Some previous studies have argued that audit committee members’ knowledge or
experience is directly associated with the committee’s effectiveness (Bedard, Chtourou
& Courteau 2004; McDaniel, Martin & Maines 2002). In addition, Jun Lin, Xiao and
Tang (2008) argued that the audit committee’s main task is to supervise corporate
financial reporting and auditing processes; therefore, its members should have the
capability to understand the issues being examined or discussed. According to Ruzaidah
and Takiah (2004), the success of audit committees depends on the expertise of the
members who are financially literate and conversant in financial reporting, internal
control and auditing because they are able to thoroughly understand, evaluate and assess
the financial statements. DeFond, Hann and Hu (2005) indicated that an audit committee
comprising members with prior financial knowledge is positively associated with
company performance. According to Carcello and Neal (2003a), an established company
in the declining stage of its development may benefit more from members with technical
or financial expertise who will concentrate on monitoring the company. Hillman and
Dalziel (2003) confirmed that members with higher qualifications can lead to increased
abilities in monitoring management processes, and contribute to strategic decision

53
making that can then lead to improve the financial performance of the firm. There are two
contrasting views in the extant literature on the relationship between audit committee
members’ education and firm financial performance, as discussed below.
2.5.4.1 Positive Associations between Audit Committee Members’ Education and Firm
Financial Performance
Only a few studies have examined the relationship between audit committee members’
education and firm financial performance. Of these studies, some found that audit
committee members with a financial background and knowledge were able to improve
firm financial performance. Hamid and Aziz (2012) studied the effect of audit committee
characteristics and firm financial performance over the period 2005 to 2010. Their study
used ROA to measure firm financial performance. They found that there was a positive
and significant effect on firm financial performance when the audit committee had
directors with accounting and financial backgrounds.
Yang and Krishnan (2005) used a sample of 250 firms in the US over the period 1996 to
2000, and found that audit committees with members who had financial knowledge could
significantly reduce incidents of internal control problems. Aldamen et al. (2012) studied
the relationship between audit committee characteristics and firm financial performance
by collecting and analysing data from Australia’s top 300 companies by market
capitalisation (S&P/ASX 300) during the period of the GFC (2008 to 2009). The findings
showed that audit committee members’ education was significantly and positively related
to firm financial performance.
2.5.4.2 Negative and Insignificant Associations between Audit Committee Members’
Education and Firm Financial Performance
Some studies have found a negative relationship between audit committee members’
education and firm financial performance. Abbott, Parker and Peters (2004) examined a
sample of US firms during the period 1991 to 1999, and concluded that audit committees
with independent members in which at least one member had financial skills and related
knowledge were negatively associated with firm financial performance.
Alqatamin (2018) investigated the effect of audit committee characteristics on
companies’ performance, with a sample comprising 165 non-financial companies listed
on the Amman Stock Exchange over the period 2014 to 2016. The results of the study

54
showed that audit committee members with education/experience in accounting or
finance had an insignificant association with firm financial performance.
Badolato, Donelson and Ege (2014) studied the relationship between audit committee
financial expertise and ROA in the UK, covering the years 2001 to 2008, and found that
audit committees with financial expertise were negatively associated with ROA. Overall,
according to the preceding discussion, education qualification is another significant
aspect of audit committee characteristics. The results of prior research support different
viewpoints about the effectiveness of audit committee members’ education and its
influence on financial performance. Hence, the present research will examine this factor
in the UAE context.
2.6 Corporate Governance in the United Arab Emirates
In 2006, the Hawkamah Institute for Corporate Governance was established to help fill
the CG gap in the UAE. This organisation was founded by international organisations,
including the OECD, the International Finance Corporation, the World Bank and regional
organisations, such as the Union of Arab Banks and Dubai International Financial Centre
Authority. The institute’s focus is on encouraging companies in the Middle East and
North Africa region to work within a healthy CG environment and framework. The
institute achieves this by helping corporations develop sound and globally standard CG
frameworks. It also helps directors and top executives build their skills to successfully
implement CG practices in their companies (Hawkamah 2016). Following is a discussion
of the changes and development of CG in the UAE context.
2.6.1 United Arab Emirates Corporations Act of 1984
The 1984 UAE Corporations Act incorporates articles that govern corporation
management processes. This Act has formed rules (from Article 95 to 118) related to the
board of directors’ selection, composition, duties and management processes (Federal
Law No. 8, 1984). The provisions of this law apply to commercial corporations
established or with head offices in the UAE.
With respect to commercial corporations, one of the main articles of the Commercial
Companies Law, which was published in the Official Gazette No. 137 in April 1984,
related to board and audit committee characteristics (Federal Law No. 8, 1984). Article
95 states the number of the directors and their term of office, provided that their number
55
is no less than three and no more than 12 directors, and their term of office does not
exceed three years. Article 98 requires that no director, either in his or her personal
capacity or as a representative of a corporeal body, can be a director in more than five
joint stock companies with their head offices within the state. Article 100 states that most
directors in a UAE company must be UAE nationals (Federal Law No. 8, 1984).
The 1984 UAE Corporations Act also states the chairperson’s and board of directors’
duties from Article 111 to 118. The chairperson and directors are liable towards the
company, the shareholders and third parties for acts of fraud, misuse of powers, any act
of default regarding the law or the company regulations, and maladministration (Federal
Law No. 8, 1984). This Act has formed rules and duties (from Article 144 to 151) related
to auditors and requires all corporations in the UAE to maintain proper financial records,
including minimum accounting reports, financial statements, statement of profit and notes
to these accounts. According to the Act, the annual audited accounts must be presented
before shareholders at an annual general meeting (Federal Law No. 8, 1984).
2.6.2 Role of United Arab Emirates Securities and Commodities Authority in
Corporate Regulations No. 3 of 2000
The ESCA states the rules and listing conditions of corporations and enhances CG
practices. This regulation highlights the disclosure to the ESCA (Articles 8 to 16), to the
stock market (Articles 17 to 27) and to the corporations (Articles 28 to 39) with the
objective of improving transparency and enhancing the accountability system (ESCA
2000). ESCA Decision No. 3 of 2000 requires the market to provide the board with the
balance sheet, profit and loss account and annual financial statements audited by an
accredited auditor within 90 days of the end of the financial year (ESCA 2000). The
ESCA states that corporations must fully disclose, with an appropriate level of
transparency, certain CG-related information, and requires listed companies to provide
information about the following:
• the percentage of the holdings of people who are not nationals in the company’s
capital
• the names of the members of the board of directors and executive managers, with
a statement of the shares owned by each of them and their relatives to the first
degree, and the membership of any of them on the boards of directors of other
PJSC

56
• the names of those who own or whose holdings coupled with those of their
dependent children amount to 5% or more of the shares of the company
• the amendments introduced to the company’s articles of association as soon as
these amendments are approved
• any change relating to the company’s management structure at the level of the
board of directors and executive management.
2.6.3 Federal Law No. 2 of 2015 Concerning Commercial Companies
The objective of this law is to contribute to regulating companies according to the various
international standards related to governance rules, protection of shareholders, supporting
foreign investment and promoting companies’ corporate social responsibility (Federal
Law No. 2, 2015). According to this law, the company can determine the method of
formation of the board of directors, the number of its members and the term of
membership, provided that the number of members is no less than three and no more than
11, and that the term of membership does not exceed three Gregorian calendar years,
commencing from the date of election or appointment. However, members may be re-
elected for more than one term (Federal Law No. 2, 2015).
According to this law, the board of directors should meet at least four times a year under
an invitation by the chairperson, unless the company’s articles of association provide for
more meetings. The chairperson can also invite the board members to convene whenever
at least two members demand, unless the company’s articles of association provide
otherwise. In addition, it states that, if a member of the board is absent from the meetings
of the board for three successive meetings or five intermittent meetings within the period
of the board, without any excuse acceptable to the board, this member can be deemed as
resigned (Federal Law No. 2, 2015).
All listed companies should have one or more auditors to audit the annual accounts of the
company. The company should prepare annual financial accounts, including the balance
sheet, profit and loss account and cash flow statement (Federal Law No. 2, 2015),
following the International Accounting Standards and Practices. Shareholders in any
company can obtain a free copy of the last audited accounts, the last report of the auditor
and the accounts of the group if it is a holding company. Having discussed the laws
regarding the concepts related to the present research, the next focus is on the CG codes.
57
2.6.4 The United Arab Emirates Corporate Governance Code
In 2007, the first CG code was published in the UAE through Decision No. R/32 of 2007,
with CG regulated by the ESCA until 2010 through this code (the old CG code). This was
the first CG code in the UAE. It identified the governance structures and principles,
including the distribution of rights and responsibilities between different participants in
the corporation, such as the board of directors, managers, shareholders, creditors,
auditors, regulators and other stakeholders (ESCA 2007).
The first CG code identified the rules and procedures for making decisions in corporate
relationships. It clarified the company’s management, shareholders’ rights, composition
of the board of directors and audit committee, board of directors’ election, board of
directors’ meetings and audit committee meetings. It also identified tasks and duties for
the board of directors, audit committee and chairperson of the board of directors. The CG
code provided for the company’s articles of association to determine the size of the board
and audit committee, and the remuneration of the directors of the board (ESCA 2007).
Despite the onset of the CG code, some believed that the governance code could still be
improved (Ahmad 2010). This was acknowledged by the government, who issued a
second code post-GFC to overcome the perceived gaps in the first code. Thus, in 2009,
the Ministry of Economy of the UAE published Ministerial Resolution No. 518 of 2009,
which is referred to as the second CG code. This code replaced the old code and enhanced
CG rules and discipline standards for UAE PJSC and institutions whose securities are
listed on the market, concerning governance rules and corporate discipline standards. In
2010, the CG code became mandatory for all listed companies, and compliance was
required by 30 April 2010. Ministerial Reregulation No. 518 reflects the continuing
efforts of the government to align the regulation of the investment markets in the UAE
with those of the leading international financial markets (Ahmad 2010).
This second CG code established good standards of CG and was largely based on
international standards. Both the Abu Dhabi Securities Exchange (ADX) and Dubai
Financial Market (DFM) are licensed and regulated by the ESCA. The UAE government
established the ESCA on 1 February 2000, pursuant to Federal Law No. 4 of 2000, under
the chairpersonship of the Minister of Economy and Commerce. Its function is to strength
the legislative structure through issuing regulations and instructions that ensure the
development of the organisational framework of UAE listed companies. It also regulates

58
and develops the primary and secondary markets, monitors the market and promotes a
safe and favourable environment for investors (ESCA 2000).
The ESCA is a legal entity reporting directly to the Economy Minister, with financial and
administrative independence and control and executive powers necessary to discharge its
tasks in line with the provisions of this law and the regulations issued for its
implementation. The ESCA (2000) may establish subsidiary branches or offices to
discharge the task of supervising and monitoring the markets, but may neither practice
trade activities nor seek benefit in any project or own or issue any securities. The ESCA
has issued a comprehensive business plan template to help companies comply with its
requirements. In their annual reports to the ESCA, listed companies must identify any
areas where they do not comply with any of the provisions or requirements of the CG
code (and any other relevant rules and regulations) and must set out their planned actions
to rectify any non-compliance (Ministry of Economy 2009). Thus, UAE listed companies
must follow the CG code when reviewing and publishing financial statements.
Under the second code, all listed companies must submit their annual report of CG
practices to the ESCA, and the ESCA can impose suspension and financial penalties if
the company infringes on the CG code. The main goal of this UAE CG code is ensuring
that organisations in sectors such as public banks, gas and oil working in the country are
financially viable and comply with the CG code, which aims to improve the firm and its
shareholders. This code covers a wide range of corporate practices. The issues covered
by this code relate to board structure, directors’ duties, chairperson and CEO roles, the
appointment of audit committees, the appointment of compliance officers, restrictions on
external auditors and annual compliance reports (Ahmad 2010).
According to Steven and Carla (2010), the second CG code includes certain themes, such
as the education of board members, the maximisation of individual participation in board
processes, the responsibility of the board in establishing clear rules and practices
promoting good governance, emphasising the importance of board committees and most
notably the audit committee, and nominating and remunerating the committees. The two
UAE CG codes have focused on making further improvements to CG rules. By doing so,
the ESCA has re-established investors’ confidence in the financial markets by improving
CG rules.
Although not within the scope of the present research, a third CG code in the UAE was
issued on 28 April 2016, when the chairperson of the ESCA issued Decree No. 7 RM of

59
2016. The third CG code established a new set of CG rules (ESCA 2016). These rules
came into force on 1 May 2016 and repealed the old governance code issued under Decree
No. 518 of 2009. These new rules are intended to provide a comprehensive overhaul of
the existing CG regime applicable to PJSC, and to complement the new commercial
companies law No. 2 of 2015. They also continue the UAE’s development into a global
standard market and business environment, and particularly raise the levels of good CG,
improve shareholders’ protection and promote companies’ social responsibility (ESCA
2016).
The important difference in the scope of application and enforcement between the first
and third codes is that the 2007 code exempted banks and financing, investment, banking
and financial intermediation companies that were subject to the control of the UAE
Central Bank from the scope of its rules. In contrast, the new rules made the provisions
of Part 1 (corporate discipline standards) and Part 3 (general provisions) applicable to the
aforementioned companies, but exempted them from the provisions of Part 2 (CG).
Exemption of foreign listed companies from the scope of application and enforcement
continues to apply in the governance code of 2016 (ESCA 2016).
According to Aimen and Nila (2014), UAE CG has a separate set of rules meant for
Central Bank–controlled companies, government corporations and large corporations that
are privately held. This creates some confusion in the differences in the codes for
government-owned entities. Strict standards have been applied for private institutions,
yet state-owned companies appear to be under the strong control of the government and
display less transparency in their operations. In the context of central banks, this
transparency is highly desired; hence, there is a need to align the CG codes for private
institutions with the central banking code (Aimen & Nila 2014).
The study period for the present research covers the first CG code (2007) and second CG
code (2010)6; thus, below is a discussion of the main differences between the principal
components of these two codes related to the study. The 2007 code stated that the tasks
and duties of the directors involve managing the company, while the second code stated
that the tasks and duties of the directors involve ensuring priority is given to the
company’s and shareholders’ interests when conflicts of interest arise. In addition,
6 As mentioned previously, the UAE instituted a second CG code in 2009 however its mandatory adoption came into effect in 2010.
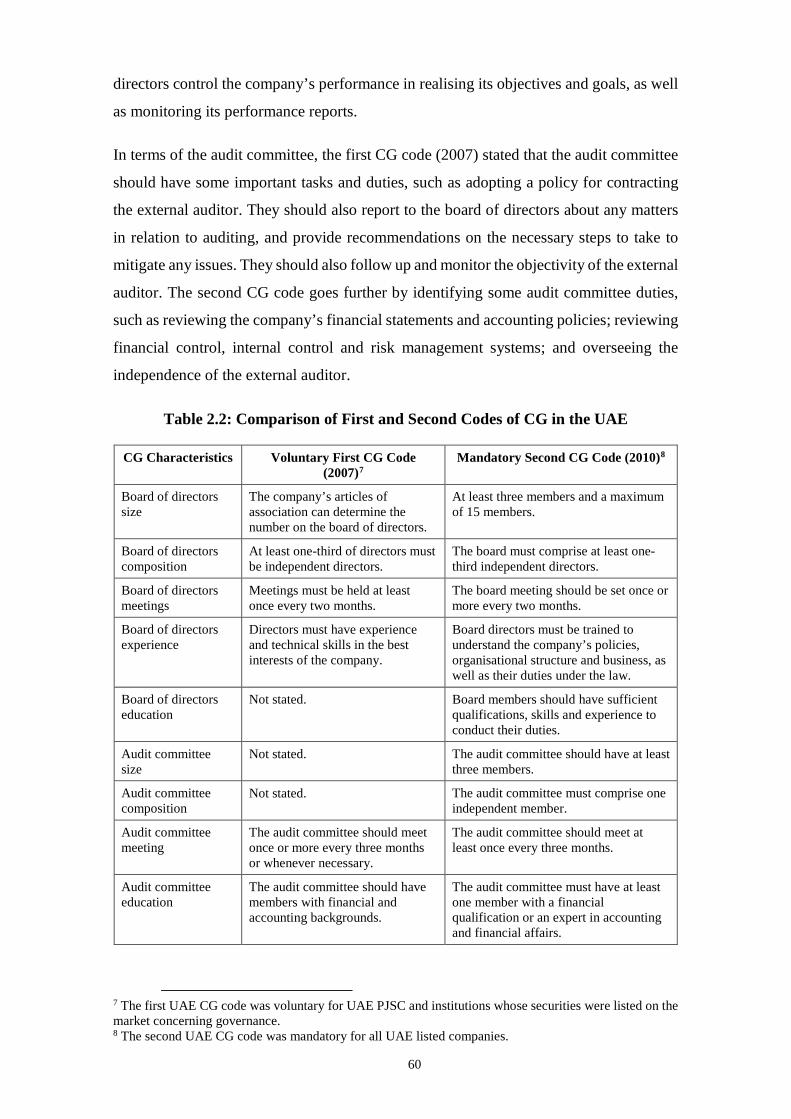
60
directors control the company’s performance in realising its objectives and goals, as well
as monitoring its performance reports.
In terms of the audit committee, the first CG code (2007) stated that the audit committee
should have some important tasks and duties, such as adopting a policy for contracting
the external auditor. They should also report to the board of directors about any matters
in relation to auditing, and provide recommendations on the necessary steps to take to
mitigate any issues. They should also follow up and monitor the objectivity of the external
auditor. The second CG code goes further by identifying some audit committee duties,
such as reviewing the company’s financial statements and accounting policies; reviewing
financial control, internal control and risk management systems; and overseeing the
independence of the external auditor.
Table 2.2: Comparison of First and Second Codes of CG in the UAE
CG Characteristics Voluntary First CG Code (2007)7
Mandatory Second CG Code (2010)8
Board of directors size
The company’s articles of association can determine the number on the board of directors.
At least three members and a maximum of 15 members.
Board of directors composition
At least one-third of directors must be independent directors.
The board must comprise at least one-third independent directors.
Board of directors meetings
Meetings must be held at least once every two months.
The board meeting should be set once or more every two months.
Board of directors experience
Directors must have experience and technical skills in the best interests of the company.
Board directors must be trained to understand the company’s policies, organisational structure and business, as well as their duties under the law.
Board of directors education
Not stated. Board members should have sufficient qualifications, skills and experience to conduct their duties.
Audit committee size
Not stated. The audit committee should have at least three members.
Audit committee composition
Not stated. The audit committee must comprise one independent member.
Audit committee meeting
The audit committee should meet once or more every three months or whenever necessary.
The audit committee should meet at least once every three months.
Audit committee education
The audit committee should have members with financial and accounting backgrounds.
The audit committee must have at least one member with a financial qualification or an expert in accounting and financial affairs.
7 The first UAE CG code was voluntary for UAE PJSC and institutions whose securities were listed on the market concerning governance. 8 The second UAE CG code was mandatory for all UAE listed companies.

61
The above table indicates the differences between the principal contents in the first and
second CG codes in the UAE with respect to the characteristics of the board and audit
committees that comprise a focus of this study. Although the first CG code was not
mandatory for listed companies in the UAE, it was designed to enhance CG rules and
discipline standards for UAE PJSC and institutions whose securities were listed on the
market concerning governance. The second CG code is mandatory for all listed
companies. The change from voluntary to mandatory meant that UAE listed firms were
now compelled to adopt the CG codes. Hence, even if a CG code did not change in content
from the first CG code to the second CG code (e.g., board of directors composition), the
mandatory nature of the second CG code meant that it had the ability to affect the firm
financial performance of UAE listed companies. Given the above, the present research
will compare the effect of changes to financial performance arising from changes to the
UAE CG codes.
2.7 Literature Gap
Studies on CG in general and the effect of board and audit committee characteristics in
particular are concentrated in the developed world and large emerging economies. A
review of the previous literature indicated that developing regions (such as the UAE) have
received little attention regarding the effect of CG characteristics on firm financial
performance. This has resulted in a significant gap between foundation theories and
practical applicability. As a result, more research is needed in different areas of CG to fill
the existing gap. The present research fills this gap by examining the main CG
characteristics (both board and audit committee characteristics) to assess their effect on
firm financial performance in the UAE. In addition, in light of the review in the previous
section, the present research will undertake a comparative analysis to examine the extent
to which both CG codes have affected the financial performance of UAE listed
companies. These two foci constitute the contribution of the present research.
2.8 Conclusion
This chapter has defined CG, followed by an operational definition for the study. It
reviewed CG theories with respect to their relevance to the UAE. From this, a multi-
theoretic approach was adopted to guide the study. This chapter then reviewed previous
CG studies with respect to the effect of CG characteristics on firm financial performance
in developed and developing countries. The focus was on studies that assessed the effects

62
of board and audit committee characteristics on firm financial performance. The board
characteristics discussed included board meetings, board members’ education, board
members’ experience, board composition and board size. The audit committee
characteristics discussed included the number of meetings, audit committee members’
education, audit committee size and audit committee composition.
The chapter then presented a general description of CG in the UAE, with the Hawkamah
Institute for Corporate Governance being the first step for the UAE to fill and bridge the
CG gap. Following this, this chapter discussed the adoption of CG codes in the UAE,
with a focus on the rights and responsibilities of both committees to enable good CG
practice. The gap in the literature was then identified and the contribution of the present
research was affirmed. The next chapter presents the conceptual framework and research
method for this study.
63
Chapter 3: Conceptual Framework and Research Methods
Used
3.1 Introduction
This chapter summarises the relationships between the variables under investigation,
based on the theoretical underpinnings examined in Chapter 2. These relationships
provide the basis for developing the conceptual framework for the study, which examines
the relationship between CG (via board and audit committee characteristics) and the firm
value of listed firms in the UAE. This chapter also provides details of the methods used
to test the model. Hence, to help achieve this, the chapter provides a justification for the
research method employed, which is a panel regression model, OLS regression and one-
way ANOVA. This is followed by a review of the data that were used to analyse the
relationships.
The organisation of this chapter is as follows. Section 3.2 explains the conceptual
framework developed for the study, while Section 3.3 summarises previous studies on
the selected independent variables, along with the research hypotheses proposed for the
study. Section 3.4 reviews the indicators comprising the dependent variables and control
variables of this study. Section 3.5 identifies and justifies the research method approach
used in this study. Section 3.6 describes the research methodology used to test the
hypotheses, which were developed earlier in this study. The design of the methodology
was based on previous studies into these relationships. Section 3.7 examines the data
collection process employed, while Section 3.8 describes the sample size and statistical
power of the research. Finally, Section 3.9 presents a summary of the chapter.
3.2 Conceptual Framework
Based on the literature review in Chapter 2 and the research questions to be investigated,
a conceptual framework was developed to encompass the associations between CG
characteristics and the firm value of UAE listed firms. The conceptual framework was
developed to clarify the relationship between the CG variables and firm financial
performance. The framework was derived by integrating two main CG theories (agency
theory and resource dependence theory) to test the developed hypotheses because of their
relevance to the UAE context.
64
As stated in section 2.3.6, summary table 2.1 showed that no single CG theory was able
to appropriately capture the UAE context. In situations where this is the case, Christopher
(2010) suggests that a more holistic governance model which incorporates more than one
theory should be considered. Apart from being used in many developing countries (see:
Alqatamin 2018; Dabor et al. 2015; Almatari, Alswidi and Fadzil 2014b; Hamid and Aziz
2012), agency theory is considered the dominant theory in terms of CG analysis. Agency
theory provides the basis for 2009 UAE CG code, which constitutes the foundation for
UAE CG reforms, with its aim to reduce agency conflicts between managers and
shareholders by improving the transparency, accountability and responsibility of
corporate boards of directors. Thus, the application of agency theory in developing a
conceptual framework for this study is an important first step in reflecting the UAE
context.
In addition, board of directors of listed firms in the UAE plays an important role in
securing financial and non-financial resources, such as external financing, experience and
transfer of knowledge from foreign investors. In the UAE, some companies have been
reliant on external human resources for a prolonged period (Mohammed, Ahmed & Ji
2010). This behaviour reflects resource dependence theory which proposes that a board’s
provision of resources is directly related to firm financial performance, with these
resources helping the firm reduce uncertainty and lower transaction costs, and ultimately
aiding in the survival of the firm (Pfeffer 1972; Pfeffer & Salancik 2003).
Thus, the combination of these theories appropriately reflects the UAE environmental
influences affecting firms. Consequently, this study employs agency and resource
dependence theories as the principal theories in the conceptual framework to test the
developed hypotheses and explore the relationship between board of directors and audit
committee characteristics and the financial performance of UAE listed firms. The
framework serves as the foundation for this study and is presented in Figure 3.1.
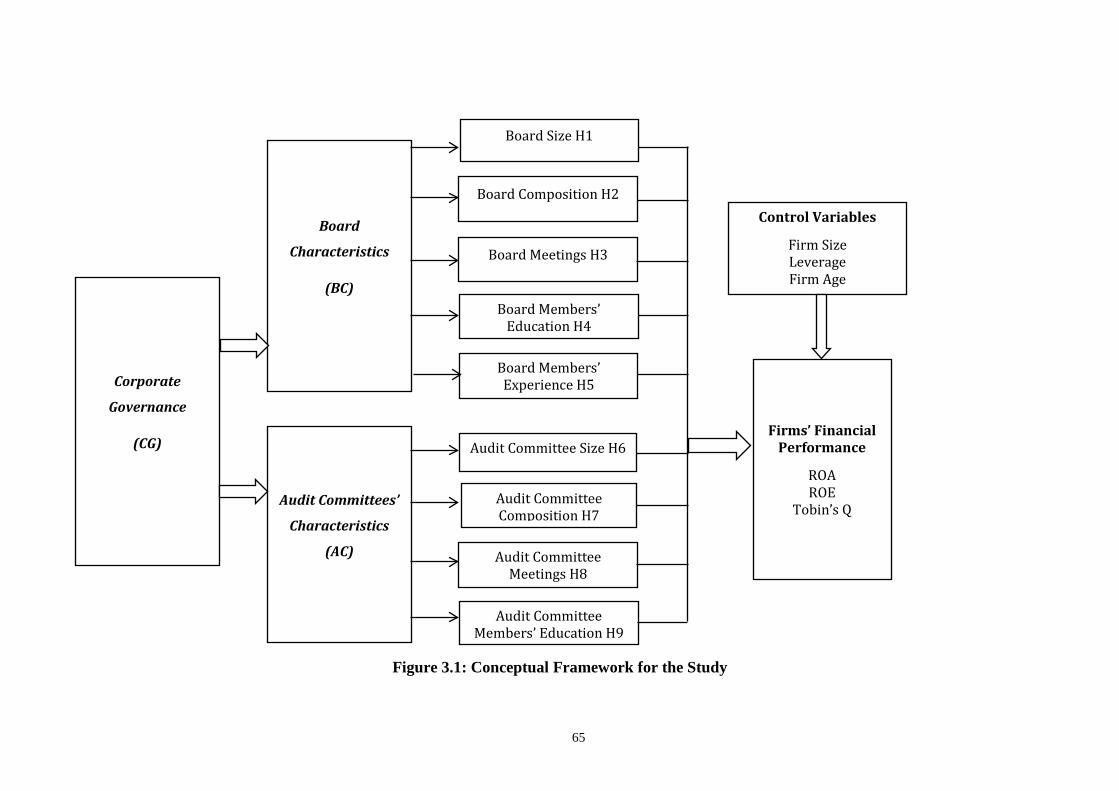
65
Figure 3.1: Conceptual Framework for the Study
Board Size H1
Firms’ Financial Performance
ROA ROE
Tobin’s Q
Board Composition H2
Audit Committee Composition H7
Audit Committee Size H6
Control Variables
Firm Size Leverage Firm Age
Board
Characteristics
(BC)
Audit Committees’
Characteristics
(AC)
Board Meetings H3
Board Members’ Education H4
Audit Committee Meetings H8
Audit Committee Members’ Education H9
Corporate
Governance
(CG)
Board Members’ Experience H5

66
As illustrated by the conceptual framework, the measure of CG is divided into two
characteristics: (i) board of directors; and (ii) audit committee. The variables that
comprise board characteristics are board size, board composition, board meetings, board
members’ education and board members’ experience. The variables comprising audit
committee characteristics are audit committee size, audit committee composition, audit
committee meetings and audit committee members’ education. Firm value is evaluated
based on the variables, ROA, ROE and Tobin’s Q. Further, firm age, leverage and firm
size are employed as control variables. The firm financial performance variables and
control variables are justified in Sections 3.3 and 3.4.
3.3 Corporate Governance Variables and Hypotheses Development
The conceptual framework presented above identifies the testable hypothesis for this
study based on the discussed literature review in Chapter 2 regarding the relationship
between board and audit committee characteristics and the financial performance of UAE
listed firms. Following is the list of variables and hypotheses tested in the study, the
details of which were developed earlier in this study.
3.3.1 Board Size
Board size relates to the number of directors on the board who act on behalf of
shareholders. Although board size is a critical factor influencing firm financial
performance, there is no ‘one-size-fits-all’ approach for firms. Hence, the optimal board
size may depend on firm and director characteristics. As mentioned in Chapter 2, several
empirical studies have argued that firms benefit from having larger boards for monitoring,
strategy formulation and access to resources. However, empirical studies have not
produced consistent results on the positive relationship between board size and firm
financial performance. This is confirmed by the summary presented in Table 3.1 below.

67
Table 3.1: Summary of Previous Literature on the Relationship between Board Size and Firm Financial Performance
Author (s) Place and Period
Variable Financial Performance
Measures
Applicable Theory Methods Used Main Result
Yermack (1996) US, 1984–1991 Board size Tobin’s Q Agency theory OLS and fixed-effects (FE) Negative
Coles et al. (2008) US, 1992–1998 Board size Tobin’s Q Not mentioned OLS and three-stage least squares (3SLS)
Positive for large diversified companies
Almatari, Alswidi and Fadzil (2014b)
Oman, 2011–2012
Board size ROA Agency and resource dependence theories
Multiple linear regression analysis
Positive
Johl, Kaur and Cooper (2015)
Malaysia, 2009 Board size ROA Not mentioned Regression analysis Positive
Rouf (2011) Bangladesh, 2006
Board size ROA and ROE Agency theory OLS No relationship
Ghabayen (2012) Kingdom of Saudi Arabia (KSA), 2011
Board size ROA Agency theory Correlation analysis and multiple linear regression analysis
No relationship
Ibrahim and Samad (2011)
Malaysia, 1999–2005
Board size ROE, ROA and Tobin’s Q
Agency theory FE model No relationship
Kajola (2008) Nigeria, 2000–2006
Board size ROE Agency theory Panel data analysis and OLS Positive
O’Connell and Cramer (2010)
Ireland, 2001 Board size Tobin’s Q and ROA
Agency theory OLS and two-stage least squares (2SLS)
Negative
Rashid et al. (2010) Bangladesh, 2005–2009
Board size Tobin’s Q and ROA
Agency theory Regression analysis Negative

68
According to agency theory, large boards mitigate the agency problem by performing
their strategic function more effectively, which is essential during periods of financial
turbulence or distress to reduce agency problems (Mintzberg 1983). This theory argues
that larger board size enhances firm financial performance by enabling better monitoring
through a large group of people. As a result, this theory signifies the presence of a positive
relationship between board size and firm financial performance, favouring large board
size. The same proposition is implied by resource dependence theory, which states that
larger boards can increase firms’ performance because of their external resource networks
of members. This study measures board size by counting the number of members on the
board. Based on agency theory and resource dependence theory, the present study
examines the following hypothesis:
H1: There is a positive relationship between board size and firm financial performance
in the UAE.
3.3.2 Board Composition
Board composition is related to the ratio of independent directors to total members on the
board. While the balance of evidence suggests that board composition improves company
performance, the findings of previous studies were mixed. The findings of these previous
studies, which were discussed in Chapter 2, are summarised in Table 3.2 below.

69
Table 3.2: Summary of Previous Literature on the Relationship between Board Composition and Firm Financial Performance
Author (s) Place and Period Variable Financial Performance Measures Applicable Theory Methods Used Main Result
Kiel and Nicholson (2003)
Australia, 1996–1998
Board composition
ROA and Tobin’s Q Agency and stewardship theories
Regression analysis Negative
Yasser, Entebang and Mansor (2011)
Pakistan, 2008–2009
Board composition
ROE Agency theory Multi-regressions Positive
Khan and Awan (2012) Pakistan, 2010 Board composition
ROA, ROE and Tobin’s Q Not mentioned T-test and group statistics
Positive
Kyereboah-Coleman and Biekpe (2006)
Ghana, 1995–2004 Board composition
ROA and ROE Agency and stakeholder theories
Multi-regressions Positive
Hsu (2010) US, 2000–2002 Board composition
Tobin’s Q Agency theory Regression analysis Negative
Ghabayen (2012) KSA, 2011 Board composition
ROA Agency theory Multiple regressions Negative
Dabor et al. (2015) Nigeria, 2004–2013
Board composition
ROA and ROE Stewardship, stakeholder and agency theories
Correlation and regression analysis
No relationship
Mura (2007) UK, 1991–2001 Board composition
Tobin’s Q Agency theory Regression analysis Negative
Kajola (2008) Nigeria, 2000–2006
Board composition
ROE Agency theory Panel data and OLS No relationship
O’Connell and Cramer (2010)
Ireland, 2001 Board composition
Tobin’s Q and ROA Agency theory OLS and 2SLS Positive

70
Board composition is an important inclusion, since almost all CG practices around the
world generally recommend that an independent member must be included on the board
of directors (Nuryanah & Islam 2011). Independent directors can provide sufficient
monitoring characteristics necessary to protect shareholders from the self-interests of
management. According to agency theory, including a majority of independent directors
on the board enhances its effectiveness and provides superior performance (Dalton et al.
1998). Thus, the following hypothesis is developed based on agency theory:
H2: There is a positive relationship between board composition and firm financial
performance in the UAE.
3.3.3 Board Meetings
Several studies have confirmed that board meetings—as measured by the number of
meetings per annum—play an important role in the governance, conformance and
performance of companies (Jensen 1993; Lipton & Lorsch 1992). With respect to the
empirical findings, there were mixed results arising from examining the relationship
between board meetings and firm financial performance. Table 3.3 summarises the
findings on the relationship between the number of board meetings and firm financial
performance.

71
Table 3.3: Summary of Previous Literature on the Relationship between Number of Board Meetings and Firm Financial Performance
Author (s) Place and Period Variable Financial Performance
Measures
Applicable Theory Methods Used Main Result
Ntim and Oseit (2011)
South Africa, 2002–2007
Board meetings ROA and Tobin’s Q Agency theory FE model Positive
Tarak Nath and Apu (2013)
India, 2006–2011 Board meetings Tobin’s Q Agency theory Multiple regressions OLS Positive
Vafeas (1999) US, 1990–1994 Board meetings ROA Agency theory Multiple regression analysis Negative
Johl, Kaur and Cooper (2015)
Malaysia, 2009 Board meetings ROA Not mentioned Regression analysis Negative
Evans, Evans and Loh (2002)
Australia, 1995–1999
Board meetings Tobin’s Q Agency theory Regression analysis Negative

72
Board meetings are related to CG in a manner that is consistent with agency theory.
Specifically, agency theory suggests that board meetings are positively related to firm
financial performance because they lead to better monitoring of firm activities and more
disciplined management, which can lead to enhanced financial performance of firms. The
UAE second CG code (2009) states that the board of directors in a listed company must
meet once or more every two months, and the majority of directors must attend these
meetings. Given the above, and based on agency theory, the present research examines
the following hypothesis:
H3: There is a positive relationship between board meetings and firm financial
performance in the UAE.
3.3.4 Board Members’ Education
Board members’ education refers to the educational background of board members. As
stated in Chapter 2, having a qualified and educated member on the board improves firm
financial performance (Almatari, Alswidi & Fadzil 2013). This variable measures the
educational qualifications from universities in developed countries held by the board
members. An underlying assumption here is that only those with higher academic skills
are able to gain admission into these institutions. As Table 3.4 demonstrates, a number of
studies have focused on the influence of board educational background on firm financial
performance, with the vast majority of studies identifying a positive relationship between
board members’ education and firm financial performance.
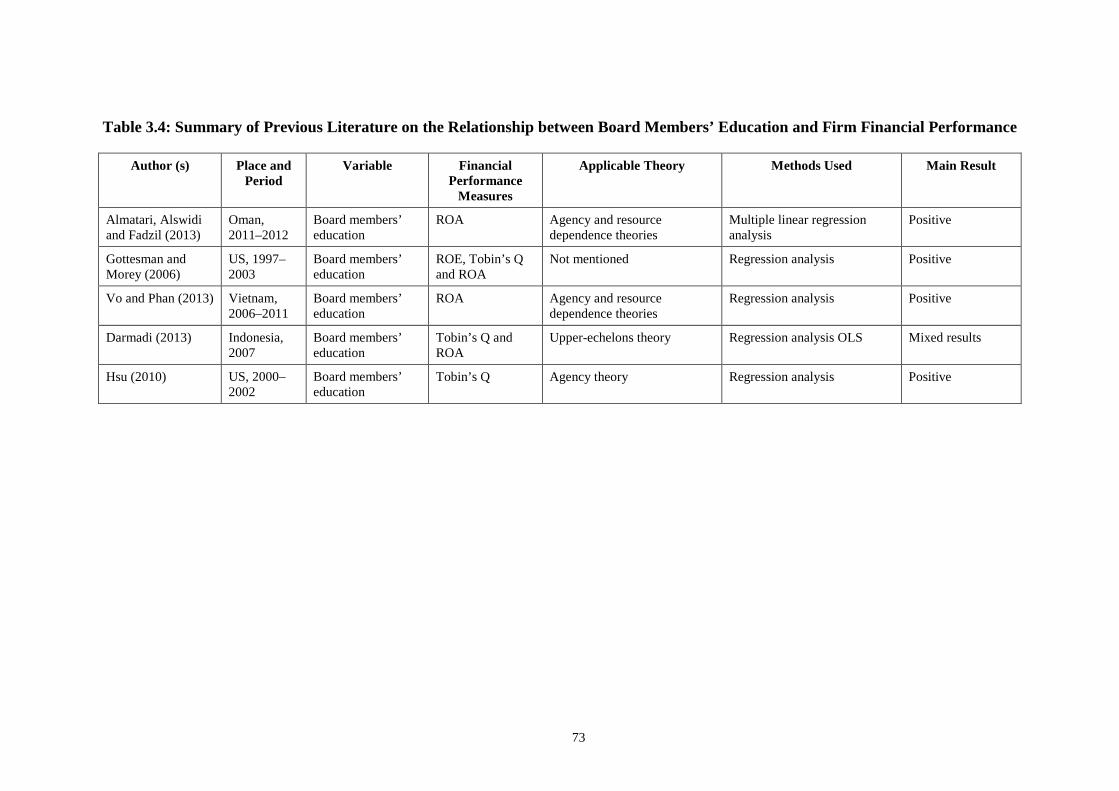
73
Table 3.4: Summary of Previous Literature on the Relationship between Board Members’ Education and Firm Financial Performance
Author (s) Place and Period
Variable Financial Performance
Measures
Applicable Theory Methods Used Main Result
Almatari, Alswidi and Fadzil (2013)
Oman, 2011–2012
Board members’ education
ROA Agency and resource dependence theories
Multiple linear regression analysis
Positive
Gottesman and Morey (2006)
US, 1997–2003
Board members’ education
ROE, Tobin’s Q and ROA
Not mentioned Regression analysis Positive
Vo and Phan (2013) Vietnam, 2006–2011
Board members’ education
ROA Agency and resource dependence theories
Regression analysis Positive
Darmadi (2013) Indonesia, 2007
Board members’ education
Tobin’s Q and ROA
Upper-echelons theory Regression analysis OLS Mixed results
Hsu (2010) US, 2000–2002
Board members’ education
Tobin’s Q Agency theory Regression analysis Positive

74
According to resource dependence theory, board members offer primary benefits—one
of which is advice and counsel. In theory, these benefits improve as a member’s education
and experience increase. Hence, the relationship between board members’ education and
firm financial performance is positive because education is one of the external resources
that lead to improved financial performance of a firm (Pfeffer & Salancik 2003). Based
on the resource dependence theory, this study examines the following hypothesis to test
the relationship between board members’ education and firm financial performance:
H4: There is a positive relationship between board members’ education and firm financial
performance in the UAE.
3.3.5 Board Members’ Experience
Managerial skills are not always achieved from high levels of educational qualification
because experience, leadership and entrepreneurial skills also play a significant role in
any business environment and are important drivers of firm financial performance.
Chapter 2 discussed the previous research that investigated the relationship between
board members’ experience and firm financial performance. Previous studies have
produced consistent results on the positive relationship between board size and firm
financial performance. This study measures experience by considering the number of
years of experience held by the board members who have been working as board
directors. Table 3.5 summarises the findings and demonstrates an overall positive
relationship between board members’ experience and firm financial performance.

75
Table 3.5: Summary of Previous Literature on the Relationship between Board Members’ Experience and Firm Financial Performance
Author (s) Place and Period Variable Financial Performance
Measures
Applicable Theory Methods Used Main Result
Vo and Phan (2013) Vietnam, 2006–2011
Board members’ experience
ROA Agency and resource dependence theories
Panel data analysis and flexible generalised least squares
Positive
Hsu (2010) US, 2000–2002 Board members’ experience
Tobin’s Q Agency theory Regression analysis Positive
Johl, Kaur and Cooper (2015)
Malaysia, 2009 Board members’ experience
ROA Not mentioned Regression analysis Positive
Mura (2007) UK, 1991–2001 Board members’ experience
Tobin’s Q Not mentioned Multivariate regression analysis
Positive
Zhu and Shen (2016)
Fortune 500 companies, 1994–2007
Board members’ experience
ROA and ROE Upper-echelons theory Regression analysis and generalised least squares
Positive
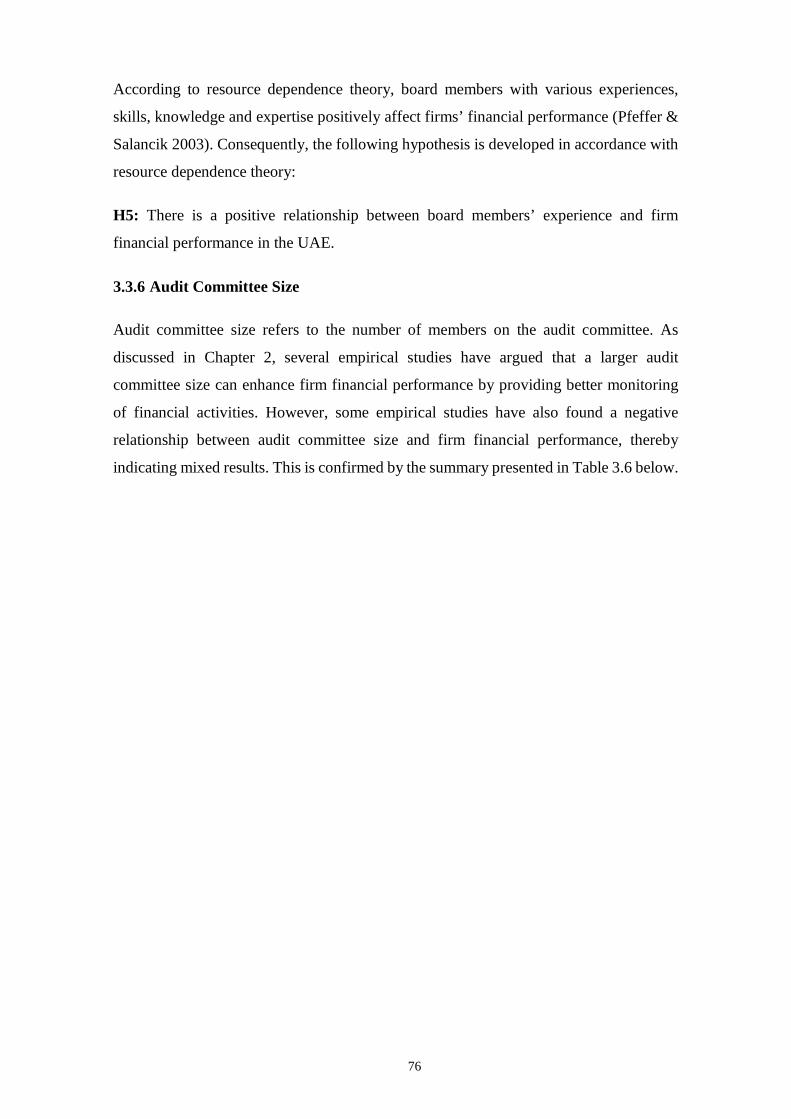
76
According to resource dependence theory, board members with various experiences,
skills, knowledge and expertise positively affect firms’ financial performance (Pfeffer &
Salancik 2003). Consequently, the following hypothesis is developed in accordance with
resource dependence theory:
H5: There is a positive relationship between board members’ experience and firm
financial performance in the UAE.
3.3.6 Audit Committee Size
Audit committee size refers to the number of members on the audit committee. As
discussed in Chapter 2, several empirical studies have argued that a larger audit
committee size can enhance firm financial performance by providing better monitoring
of financial activities. However, some empirical studies have also found a negative
relationship between audit committee size and firm financial performance, thereby
indicating mixed results. This is confirmed by the summary presented in Table 3.6 below.
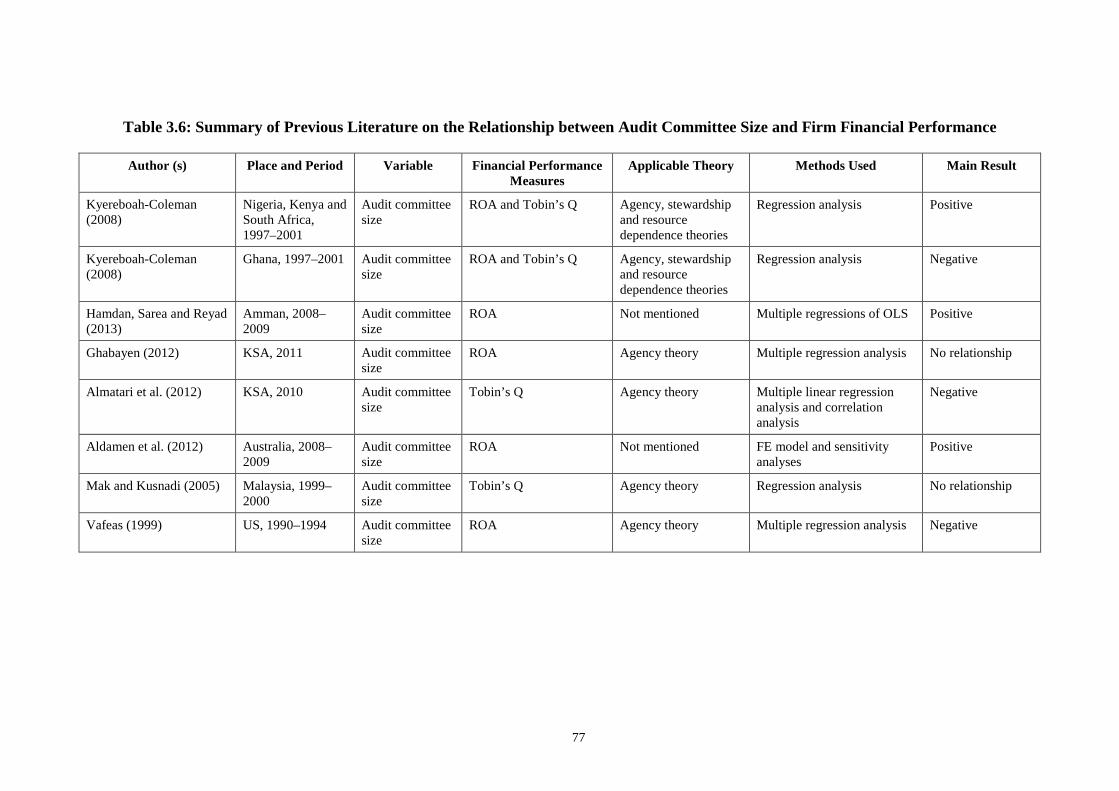
77
Table 3.6: Summary of Previous Literature on the Relationship between Audit Committee Size and Firm Financial Performance
Author (s) Place and Period Variable Financial Performance Measures
Applicable Theory Methods Used Main Result
Kyereboah-Coleman (2008)
Nigeria, Kenya and South Africa, 1997–2001
Audit committee size
ROA and Tobin’s Q Agency, stewardship and resource dependence theories
Regression analysis Positive
Kyereboah-Coleman (2008)
Ghana, 1997–2001 Audit committee size
ROA and Tobin’s Q Agency, stewardship and resource dependence theories
Regression analysis Negative
Hamdan, Sarea and Reyad (2013)
Amman, 2008–2009
Audit committee size
ROA Not mentioned Multiple regressions of OLS Positive
Ghabayen (2012) KSA, 2011 Audit committee size
ROA Agency theory Multiple regression analysis No relationship
Almatari et al. (2012) KSA, 2010 Audit committee size
Tobin’s Q Agency theory Multiple linear regression analysis and correlation analysis
Negative
Aldamen et al. (2012) Australia, 2008–2009
Audit committee size
ROA Not mentioned FE model and sensitivity analyses
Positive
Mak and Kusnadi (2005) Malaysia, 1999–2000
Audit committee size
Tobin’s Q Agency theory Regression analysis No relationship
Vafeas (1999) US, 1990–1994 Audit committee size
ROA Agency theory Multiple regression analysis Negative

78
Both agency theory and resource dependence theory posit that a larger audit committee
size performs better than a smaller size. Thus, both theories signify the presence of a
positive relationship between audit committee size and firm financial performance.
Consequently, the present research develops the following hypothesis based on both
aforementioned theories:
H6: There is a positive relationship between audit committee size and firm financial
performance in the UAE.
3.3.7 Audit Committee Composition
Audit committee composition plays an important role in improving monitoring of
management and can result in improved firm financial performance. Audit committee
composition is defined as the ratio of independent members to total members on the
committee. As reported in Chapter 2 and demonstrated in Table 3.7, a number of studies
have focused on the influence of audit committee composition on firm financial
performance, with some studies supporting a positive relationship between the two.
However, some studies have not supported this. This is confirmed by the summary
presented in Table 3.7 below.
79
Table 3.7: Summary of Previous Literature on the Relationship between Audit Committee Composition and Firm Financial Performance
Author (s) Place and Period
Variable Financial Performance
Measures
Applicable Theory Methods Used Main Result
Yasser, Entebang and Mansor (2011)
Pakistan, 2008–2009
Audit committee composition ROE Agency theory Multi-regressions Positive
Almatari, Alswidi and Fadzil (2014b)
Oman, 2011–2012
Audit committee composition ROA Agency and resource dependence
Multiple linear regression analysis
Positive
Ghabayen (2012) KSA, 2011 Audit committee composition ROA Agency theory Multiple regressions No relationship
Kajola (2008) Nigeria, 2000–2006
Audit committee composition ROE Agency theory Panel data and OLS No relationship
Cotter and Silvester (2003)
Australia, 1995–1997
Audit committee composition ROA Agency theory Regression analysis No relationship

80
Agency theory recommends that the audit committee should have independent members
to help with the objective of monitoring the financial activities of management, thereby
signifying a positive relationship between audit committee composition and firm
financial performance. Thus, the following hypothesis is developed based on agency
theory to test this relationship:
H7: There is a positive relationship between audit committee composition and firm
financial performance in the UAE.
3.3.8 Audit Committee Meetings
Active audit committee meetings play an important role in the governance, conformance
and financial performance of companies. This variable is defined as the number of audit
committee meetings that occur per year. With respect to the empirical findings, there have
been mixed results. Table 3.8 summarises the results of the relationship between the
number of audit committee meetings and firm financial performance in different
countries.

81
Table 3.8: Summary of Previous Literature on the Relationship between Audit Committee Meetings and Firm Financial Performance
Author (s) Place and Period
Variable Financial Performance
Measures
Applicable Theory Methods Used Main Result
Aldamen et al. (2012)
Australia, 2008–2009
Audit committee meetings
ROA Not mentioned FE model and sensitivity analyses
Negative
Hsu (2010) US, 2000–2002 Audit committee meetings
Tobin’s Q Agency theory Regression analysis Positive
Almatari et al. (2012)
KSA, 2010 Audit committee meetings
Tobin’s Q Agency theory Multiple linear regression analysis, descriptive statistics and correlation analysis
Positive
Almatari, Alswidi and Fadzil (2014b)
Oman, 2011–2012
Audit committee meetings
ROA Agency and resource dependence theories
Multiple linear regression analysis
Positive
Hamdan, Sarea and Reyad (2013)
Amman, 2008–2009
Audit committee meetings
ROA Not mentioned Multi-regression analysis No relationship
Alqatamin (2018) Jordan, 2014–2016
Audit committee members’ education
ROA Agency and resource dependence theories
Regression analysis No relationship
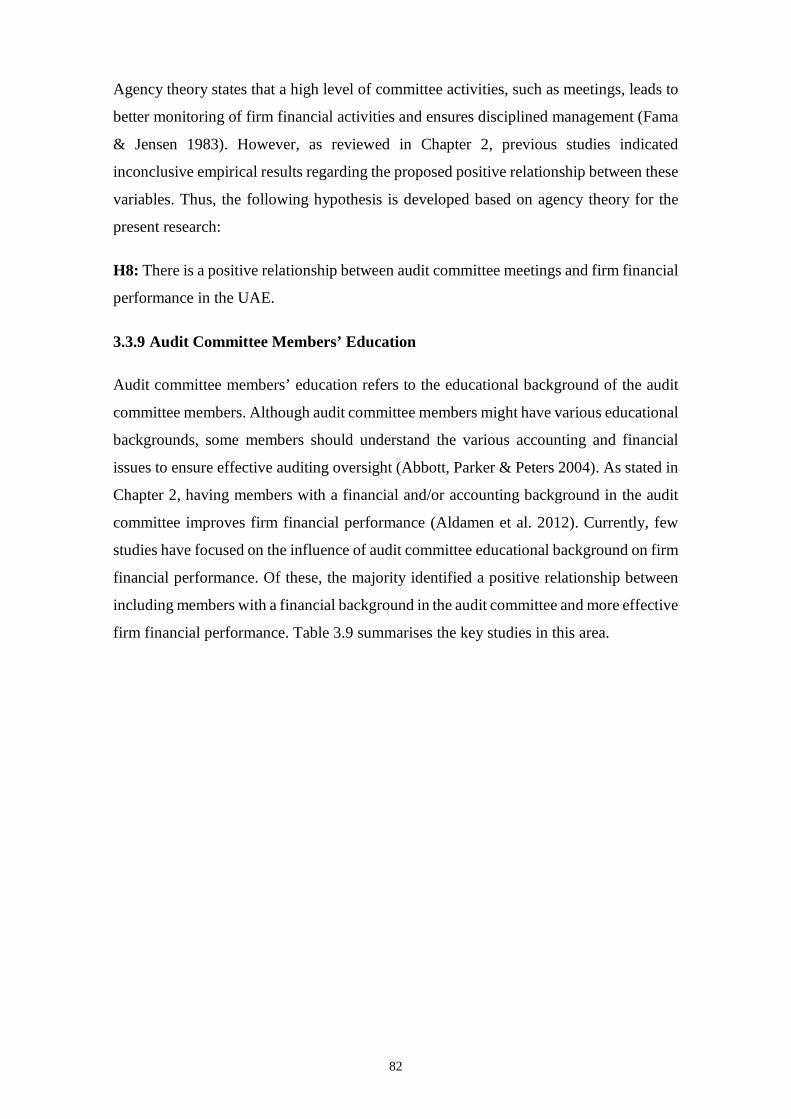
82
Agency theory states that a high level of committee activities, such as meetings, leads to
better monitoring of firm financial activities and ensures disciplined management (Fama
& Jensen 1983). However, as reviewed in Chapter 2, previous studies indicated
inconclusive empirical results regarding the proposed positive relationship between these
variables. Thus, the following hypothesis is developed based on agency theory for the
present research:
H8: There is a positive relationship between audit committee meetings and firm financial
performance in the UAE.
3.3.9 Audit Committee Members’ Education
Audit committee members’ education refers to the educational background of the audit
committee members. Although audit committee members might have various educational
backgrounds, some members should understand the various accounting and financial
issues to ensure effective auditing oversight (Abbott, Parker & Peters 2004). As stated in
Chapter 2, having members with a financial and/or accounting background in the audit
committee improves firm financial performance (Aldamen et al. 2012). Currently, few
studies have focused on the influence of audit committee educational background on firm
financial performance. Of these, the majority identified a positive relationship between
including members with a financial background in the audit committee and more effective
firm financial performance. Table 3.9 summarises the key studies in this area.
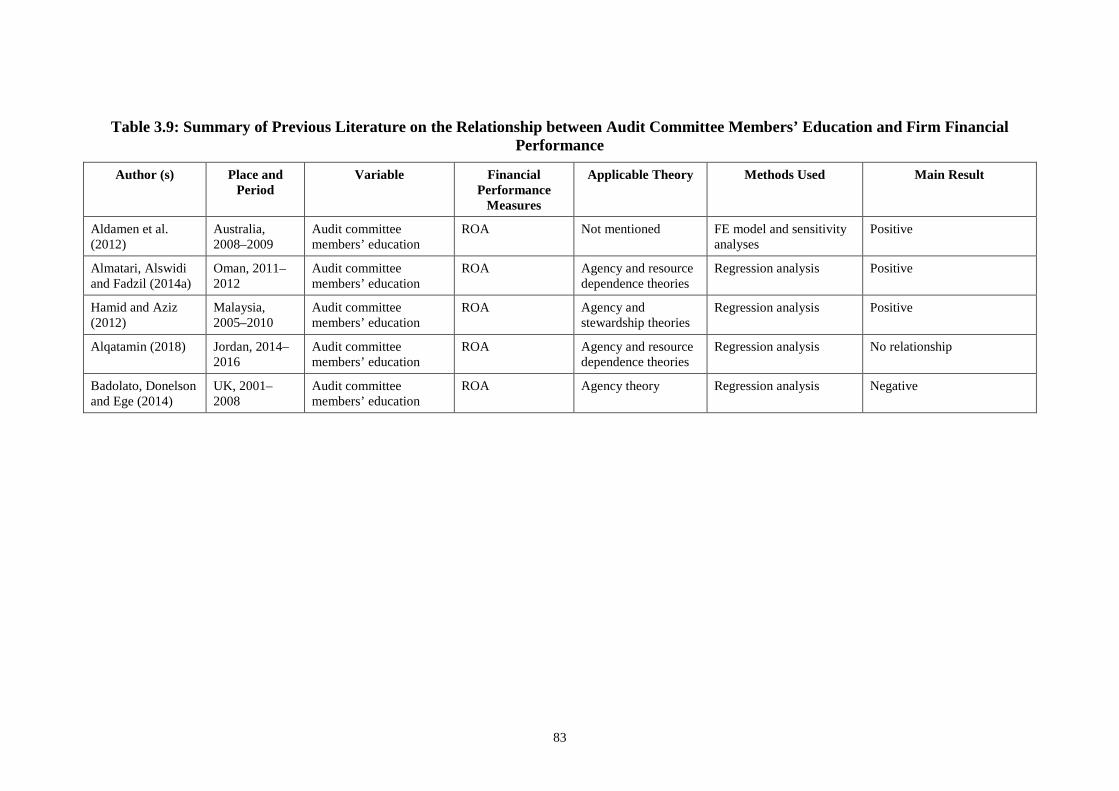
83
Table 3.9: Summary of Previous Literature on the Relationship between Audit Committee Members’ Education and Firm Financial Performance
Author (s) Place and Period
Variable Financial Performance
Measures
Applicable Theory Methods Used Main Result
Aldamen et al. (2012)
Australia, 2008–2009
Audit committee members’ education
ROA Not mentioned FE model and sensitivity analyses
Positive
Almatari, Alswidi and Fadzil (2014a)
Oman, 2011–2012
Audit committee members’ education
ROA Agency and resource dependence theories
Regression analysis Positive
Hamid and Aziz (2012)
Malaysia, 2005–2010
Audit committee members’ education
ROA Agency and stewardship theories
Regression analysis Positive
Alqatamin (2018) Jordan, 2014–2016
Audit committee members’ education
ROA Agency and resource dependence theories
Regression analysis No relationship
Badolato, Donelson and Ege (2014)
UK, 2001–2008
Audit committee members’ education
ROA Agency theory Regression analysis Negative

84
According to resource dependence theory, audit committee members will invariably
identify any issues and try to aid the organisation, which can enhance the performance of
the firm (Pfeffer & Salancik 2003). The present research employs two measures of
educational qualification—degrees in a financial discipline and degrees in a non-financial
discipline—to examine the following hypothesis:
H9: There is a positive relationship between audit committee members’ education and
firm financial performance in the UAE.
3.4 Firm Financial Performance Variables and Control Variables
The extant literature on CG and firm financial performance has identified several
measures of performance, which can be categorised into accounting- and market-based
indicators (Khatab et al. 2011). With respect to accounting-based measures, the most
common are ROA, ROE and profit margin. A study by Almatari, Alswidi and Fadzil
(2014c) reviewed the measurements used to assess financial performance in CG studies
and found that ROA is the most used accounting-based measure (46%), followed by ROE
(27%). These measures are shown in Table 3.10 below.
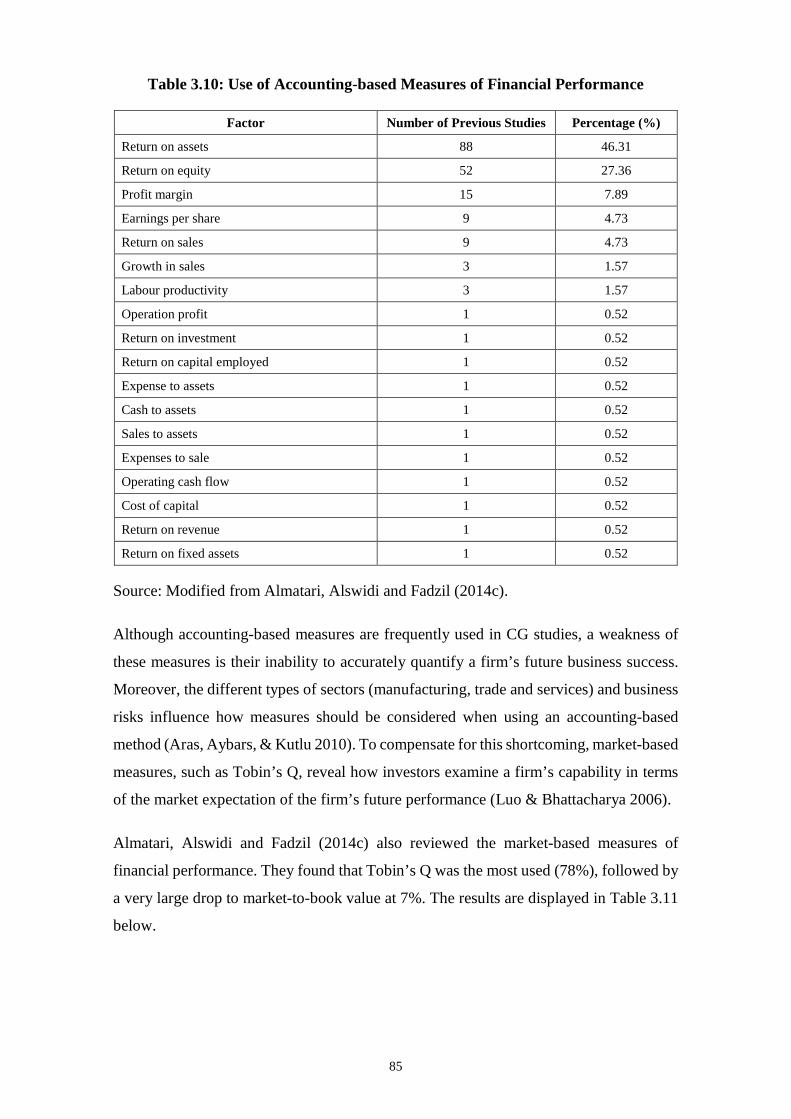
85
Table 3.10: Use of Accounting-based Measures of Financial Performance
Factor Number of Previous Studies Percentage (%)
Return on assets 88 46.31
Return on equity 52 27.36
Profit margin 15 7.89
Earnings per share 9 4.73
Return on sales 9 4.73
Growth in sales 3 1.57
Labour productivity 3 1.57
Operation profit 1 0.52
Return on investment 1 0.52
Return on capital employed 1 0.52
Expense to assets 1 0.52
Cash to assets 1 0.52
Sales to assets 1 0.52
Expenses to sale 1 0.52
Operating cash flow 1 0.52
Cost of capital 1 0.52
Return on revenue 1 0.52
Return on fixed assets 1 0.52
Source: Modified from Almatari, Alswidi and Fadzil (2014c).
Although accounting-based measures are frequently used in CG studies, a weakness of
these measures is their inability to accurately quantify a firm’s future business success.
Moreover, the different types of sectors (manufacturing, trade and services) and business
risks influence how measures should be considered when using an accounting-based
method (Aras, Aybars, & Kutlu 2010). To compensate for this shortcoming, market-based
measures, such as Tobin’s Q, reveal how investors examine a firm’s capability in terms
of the market expectation of the firm’s future performance (Luo & Bhattacharya 2006).
Almatari, Alswidi and Fadzil (2014c) also reviewed the market-based measures of
financial performance. They found that Tobin’s Q was the most used (78%), followed by
a very large drop to market-to-book value at 7%. The results are displayed in Table 3.11
below.
86
Table 3.11: Use of Market-based Measures of Financial Performance
Factor Number of Previous Studies Percentage (%)
Tobin’s Q 74 78.72
Market-to-book value 6 6.38
Abnormal returns; annual stock return 4 4.25
Price–earnings ratio 3 3.19
Dividend yield 3 3.19
Market value added 2 2.12
Log of market capitalisation 1 1.06
Stock repurchases 1 1.06
Source: Modified from Almatari, Alswidi and Fadzil (2014c).
Typically, accounting measures are used to reflect short-term profitability, while market-
based measures are used to reflect market evaluation for future profitability (Cochran &
Wood 1984). In addition, accounting measures (ROA and ROE) focus on the past
performance of the firm, whereas Tobin’s Q focuses on the market expectation of the
future performance of the firm. Although ROE and ROA are both measures for
profitability, they are different performance indicators. ROA illustrates how successfully
a firm uses its assets. Therefore, liquidity debt results in an increase in ROA. However,
there is no change in ROE for a similar company in the same situation, as it takes debt
into account (Loi & Khan 2012).
The three measures of ROA, ROE and Tobin’s Q contain distinct differences. First, the
accounting-based measures (ROA and ROE) are backwards-looking measures, whereas
the market-based measure (Tobin’s Q) is a forwards-looking measure of firm financial
performance (Shan & McIver 2011). In this situation, the accounting-based measures are
affected by accounting practices that emphasise management outcomes, while Tobin’s Q
also presents the investors’ assigned value to the firm’s tangible and intangible assets,
based on predicted revenue and cost streams (Almatari, Alswidi & Fadzil 2014c). In
addition, ROA may not show the actual value added to the company or to shareholders
because ROA is significantly affected by accounting policy, where companies can
manipulate accounting policies to obtain the accounting result they desire. For example,
accounting depreciation mainly affects net income, which is mostly based on a manager’s
judgement.
The ROE measure is also one of the most common firm financial performance measures;
however, it has some limitations. According to De Wet and Du Toit (2007, p. 2):

87
The first and most obvious flaw is that the earnings can be (and is) manipulated legally
within the framework of Generally Accepted Accounting Practice (GAAP) via changes
in accounting policy. The second flaw is that ROE is calculated after the cost of debt,
but before taking into account the cost of own capital. ROE increases with more
financial gearing, as long as the returns earned on the borrowed funds exceed the cost
of the borrowings. The danger inherent in increasing the financial gearing beyond a
certain level is that the increased financial risk may cause the value of the company
and the share price to fall. Pursuing a higher ROE may lead to wealth destruction,
which is not in line with the economic principles of shareholder value creation.
To obtain a more balanced representation of firm financial performance, the present
research will employ three different performance measurements to assess a firm’s
financial performance. It will employ the two most common accounting-based measures:
ROA and ROE (Aldamen et al. 2012; Johl, Kaur & Cooper 2015; Vo & Phan 2013;
Yasser, Entebang & Mansor 2011). The third measure is the market-based measure of
Tobin’s Q, which is the most widely used market-based measurement (Almatari, Alswidi
& Fadzil 2014b; Darmadi 2013; Tarak Nath & Apu 2013).
According to Veklenko (2016), using ROA, ROE and Tobin’s Q as three different
performance measures leads to producing different results because of the factors that
influence each of them. For instance, ROE considers the assets provided by shareholders,
while ROA includes all available assets that contribute to earnings. In contrast, Tobin’s
Q does not always fully represent firm performance and can also reflect market
expectations of growth opportunities that arise from external conditions, rather than
managerial decisions. Thus, the purpose of using three different performance measures
in this study is to examine whether the effect of governance is more pronounced on certain
performance measures, as reported by some previous studies. Previous studies found
several different results when they examined the relationships between CG characteristics
and financial performance, thereby implying that CG has different effects on several
different aspects of firm financial performance (Darmadi 2013; Johl, Kaur & Cooper
2015). Therefore, these three measures are used to obtain comprehensive results based on
the relationships between each financial indicator and CG characteristics.
The present study also employs control variables because it is acknowledged that other
variables may influence this relationship. Several previous studies have used different
control variables in both devoloped and devoloping countries, such as firm age, firm size,
leverage and firm age (Dzingai & Fakoya 2017; Ibrahim, Raman & Saidin 2009; Vo &
88
Phan 2013, Rahman & Mohamed 2006). Firm size is an important component in
controlling firm financial performance because large firms may have more agency
problems and subsequently need to incorporate strong governance mechanisms (Klapper
& Love 2004). According to Kinney and McDaniel (1989), larger companies have better
internal controls, better information systems and more resources to hire fully qualified
personnel, all of which can lead to quality financial reporting. Larger firms harness public
support, enjoy greater economies of scale, win laudable ratings and are more likely to
employ efficient financial reporting systems (Johnson, Khurana & Reynolds 2002).
Therefore, many CG studies have employed firm size as a control variable (Almatari et
al. 2012; Jackling & Johl 2009; Shan & McIver 2011; Vo & Nguyen 2014).
Cheng and Tzeng (2011) stated that there is a significant and positive relationship
between the value of the firm and its leverage. Adeyemi and Oboh (2011) examined a
sample size of 90 firms from Nigeria and found that the market value of a firm was
positively influenced by its choice of capital structure (level of leverage). Another study
conducted by Obradovich and Gill (2013) found that both financial leverage and CG were
correlated and subsequently affect a firm’s value. Conversely, Cheung et al. (2009)
supported the idea that weak CG could be correlated with higher debt levels; thus, poor
stock price performance attributed to leverage could also be partially and indirectly
caused by weak CG. In the CG context, leverage has been used as a control variable in
CG studies, such as those by Vo and Nguyen (2014), Chen et al. (2013) and Arora et al.
(2016). This variable is also employed in the present study.
Firm age is another common control variable employed in many CG studies, such as those
by Chung and Pruitt (1996), Bathula (2008), Barka and Legendre (2017), Vo and Nguyen
(2014) and Shan and McIver (2011). According to Autio, Sapienza and Almeida (2000),
more established companies exhibit economies of scale, display industry experience and
provide differentiated products, whereas younger firms fare better in developing export
capabilities and exhibiting resilience towards economic shocks. To counter the possibility
of bias in the study results, by reducing or removing the possibility that the observed
associations are not spurious (Lama 2013), the present study will employ firm size, firm
age and leverage as control variables. Table 3.12 presents a list of the operational
variables employed in this study.

89
Table 3.12: Study Variables and Their Measures
No Variables Measures Sources
1 Board characteristics (BC)
Board size (BS) The number of members in the board DFM, ADX, ESCA and firm annual and CG reports
Board composition (BCOM) The ratio of independent members to total members in the board
DFM, ADX, ESCA and firm annual and CG reports
Board meetings (BM) The number of board meetings held per year DFM, ADX, ESCA and firm annual and CG reports
Board members’ education (BMED)
The ratio of directors who hold a degree from developed-country universities to total members in the board
DFM, ADX, ESCA and firm annual and CG reports
Board members’ experience (BMEX)
The average number of years of experience of board members
DFM, ADX, ESCA and firm annual and CG reports
2 Audit committee characteristics (ACC)
Audit committee size (ACS) The number of members in the committee DFM, ADX, ESCA and firm annual and CG reports
Audit committee composition (ACCOM)
The ratio of independent members to total members in the committee
DFM, ADX, ESCA and firm annual and CG reports
Audit committee meetings (ACM) The number of committee meetings held per year DFM, ADX, ESCA and firm annual and CG reports
Audit committee members’ education (ACED)
The ratio of number of audit committee members holding a degree in a financial discipline to total committee members
DFM, ADX, ESCA and firm annual and CG reports
3 Financial performance
Return on Assets (ROA) (Net income) ÷ (average total assets) DFM, ADX, firm annual reports and Orbis—Bureau van Dijk and Datastream databases
Return on Equity (ROE) (Net income) ÷ (shareholder’s equity) DFM, ADX, firm annual reports and Orbis—Bureau van Dijk and Datastream databases
Tobin’s Q (Total market value of the firm) ÷ (total asset value of the firm)
DFM, ADX, firm annual reports and Orbis—Bureau van Dijk and Datastream databases
4 Control variables
Firm age (FA) The number of years since establishment Firm annual reports, DFM and ADX
Leverage (LEV) (Total debt) ÷ (shareholders’ equity) Firm annual reports and Orbis—Bureau van Dijk and Datastream databases
Firm size (FS) The natural logarithm of total assets Firm annual reports and Orbis—Bureau van Dijk

90
3.5 Research Methodology
This study investigates the relationship between CG characteristics (via board and audit
committee characteristics) and firm financial performance. This section presents the
research method employed based on the conceptual framework to address the set of
research hypotheses. Initially, this section discusses the broad research method type
(qualitative and quantitative) in relation to CG and the present research. Prior to
identifying the most appropriate research method to use for this study, this section
presents a review of the research methods used in previous studies in this area. The
research method used is then discussed in depth, followed by a summary of the data
collection and sample procedure that was undertaken in this study.
3.5.1 Research Method Types
It is important for all researchers to use and establish an appropriate approach for their
research in regard to the study problem. There are two broad types of research method
employed by most researchers: quantitative and qualitative. The qualitative method is
essentially an exploratory study (Veal 2005). It is applied to obtain an understanding of
the main reasons, opinions and motivations surrounding a study, and provides insights
into the problem or assists the researcher to generate ideas or hypotheses for quantitative
research (Veal 2005). According to Babbie (2015), this method is flexible and appropriate
to use when studying subtle nuances in the attitudes and behaviours of participants to
investigate and determine social processes over time. In addition, it presents a descriptive
and non-numerical approach of information to present a clearer picture of the
phenomenon (Berg & Lune 2012).
According to Tharenou, Donohue and Cooper (2007), the quantitative method is a
systematic empirical investigation of observable phenomena via statistical, mathematical
or computational techniques, and it gives stronger forms of measurement, reliability and
ability to generalise. Berg and Lune (2012) stated that the quantitative method is
employed via different types of statistical analysis that can be used to analyse the study
data with longer time periods and large sample sizes, leading to increased generalisation
capacity. Quantitative studies’ great strength is providing data that are descriptive—for
example, allowing researchers to collect samples of individuals, communities or
organisations that can be selected to ensure that the results will be representative of the
population studied. However, researchers encounter difficulties in terms of data

91
interpretation (Burns 2000). Some previous studies in CG have combined the two
methods (e.g., mixed methods) to obtain better results and explanations.
Given the stated research objectives, the present study applies the quantitative method.
To identify an appropriate and valid research method for the present study, the following
subsections will focus on a review of the main research methods presented in previous
CG studies.
3.5.2 Research Methods Adopted by Previous Studies
After developing the conceptual framework and research hypotheses for the study, the
focus of this section is on the research method employed. The conceptual framework
allows for association between CG and firm financial performance; thus, it is important
to review the research methods employed in previous studies. Many previous CG studies
have used regression analysis as the main tool of analysis (Alqatamin 2018; Dzingai &
Fakoya 2017; Hamid & Aziz 2012). Different analysis techniques—such as t-tests and
Hausman, collinearity, autocorrelation and heteroscedasticity tests—have also been used
(Amer, Ragab & Shehata 2014; Barka & Legendre 2017), along with descriptive analysis
to measure the mean, standard deviation or variance, and minimum and maximum
variables (Bhagat & Bolton 2008; Buallay, Hamdan & Zureigat 2017; Fooladi &
Chaleshtori 2011; Vo & Nguyen 2014). Descriptive statistics are one of the most common
analysis techniques used in many academic studies on CG.
With respect to multivariate regression analyses, the majority of CG studies employed an
OLS regression to examine the relationship between a single dependent variable and
several independent, or predictor, variables (Coles et al. 2008; Kajola 2008; O’Connell
& Cramer 2010; Rouf 2011). In addition, some used 2SLS and 3SLS to allow for potential
endogeneity and cross-correlation between the equations (Coles et al. 2008; Dzingai &
Fakoya 2017; O’Connell & Cramer 2010). Another type of regression approach
employed is panel data analysis (Dzingai & Fakoya 2017; Kajola 2008, O’Connell &
Cramer 2010). Two main panel data regression models (the fixed-effects [FE] model and
random-effects [RE] model) have different assumptions about the error term. The FE
model assumes that the individual effect term is constant, while the RE model assumes
the individual effect to be random disturbances drawn from probability distributions
(Baltagi 2008).
92
The Hausman test decides which method (FE or RE) would best suit the available data
for a study. Prior research—such as the studies by Bhagat and Bolton (2008); Dzingai
and Fakoya (2017); Zheka (2006); and de Almeida, De Lima and Lima (2009)—
employed this test in their CG studies to investigate the appropriate estimation to avoid
inconsistent and biased estimators.
3.5.3 Research Method for the Present Study
Study data can be analysed and interpreted by many research methods to meet the study
objectives and research questions (Veal 2005). The choice of data analysis depends on
several aspects, such as the type of variable, time series, nature of the variable, shape of
the distribution of a variable and study design adopted to collect information about the
variable (Singh 2007). As stated previously, the conceptual framework acts as the
foundation for this study. It establishes the relationships between board and audit
committee characteristics and a firm’s financial performance.
The dependent variables are defined as financial performance measured by ROA, ROE
and Tobin’s Q. The independent variables are defined as board size, board composition,
board meetings, board members’ education, board members’ experience, audit committee
size, audit committee composition, audit committee meetings, and audit committee
members’ education.
As demonstrated by Baddeley and Barrowclough’s (2009) study, although the OLS
regression has been used in similar studies, it is not ideal when FE (such as firm-specific
effects) are time invariant, yet unobservable. If the FE are ignored, especially when the
sample is over many years, heterogeneity bias is generated. The bias occurs because the
time-invariant FE that may affect individual cross-sectional units are not included in the
deterministic part of the model. Heterogeneity bias is a form of omitted variable bias that
would produce autocorrelated errors. Panel estimation method is the best approach to
resolve this issue, and can eliminate heterogeneity bias using either a FE model or RE
model (Baddeley & Barrowclough 2009).
Hence, panel regression analysis (RE model) and OLS are used to examine the
relationships between the variables shown in study model. Panel regression analysis and
OLS are the statistical methods used to estimate and analyse the relationships between
variables (Szekely, Rizzo & Bakirov 2007). Moreover, this statistical process is used to
analyse the relationship between a dependent variable and one or more independent

93
variables to understand the relationships between variables and their relevance to the real
problem being studied (Szekely, Rizzo & Bakirov 2007). Therefore, panel regression and
OLS methods are employed to investigate the relationship between firm financial
performance and board and audit committee characteristics.
To achieve the objective of this study, the results of the statistical analysis will be
presented via descriptive statistics and multiple regression analysis. Two panel models
will be examined—FE and RE—with a Hausman test performed on each. Since the data
in the first objective employ a panel structure (time cross-sectional data) for a 10-year
period, panel data regression is preferred to OLS. However, for the second objective, the
time series is for short periods (e.g., three periods for the CG codes); hence, the research
will test the data by using OLS. In addition, one-way ANOVA tests will be employed for
the second objective to compare the significant differences in mean values between the
three aforementioned periods.
Given the above, the next section discusses in depth the methods that will be adopted for
the analysis.
3.5.3.1 Correlation Matrix
A correlation matrix is used by researchers to obtain an overall picture of their study data
(Aldamen et al. 2012; Barka & Legendre 2017; Drobetz, Schillhofer & Zimmermann
2004). The matrix is a grid of the correlations among all the variables. Correlation values
range between ˗1 and +1. A correlation of +1 indicates that the variables are perfectly
positively correlated, while a correlation of ˗1 indicates a perfect negative correlation.
Values close to zero indicate either no relation or a relation that is not linear.
Multicollinearity occurs when independent variables are highly correlated (Tabachnick
& Fidell 2007). The problem of multicollinearity exists when the correlation among
independent variables is 0.80 or above (Grewal, Cote & Baumgartner 2004).
Multicollinearity can cause problems when it is unacceptably high (over 80%), and
should not be included in the final regression model (Shearer & Clark 2016).
3.5.3.2 Tests for Collinearity
Collinearity is a condition in which some of the independent variables are highly
correlated (Tabachnick & Fidell 2007). The major consequence is that the estimated
coefficients of regression model can be unreliable, and incorrect conclusions about the
94
relationship between outcome variable and predictor variables could be obtained (John,
Sastry & David 1998).
The variance inflation factor (VIF) is commonly used to identify the presence of
multicollinearity among predictor variables within a multiple regression (Wooldridge
2010). The VIF illustrates the degree for all independent variable that can be explained
by other independent variables to eliminate collinear variables—in other words, the
extent to which the change in one variable can change the coefficient. If the VIF is
between five and 10, multicollinearity is likely to be present and researchers should
consider dropping the variable (Wooldridge 2010). For weaker models, values above 2.5
may also be a cause for concern (John, Sastry & David 1998).
In addition to VIF, multicollinearity is detected by examining the tolerance for each
independent variable (O’Brien 2007). Tolerance is the amount of variability in one
independent variable that is not explained by the other independent variables. Tolerance
values less than 0.10 indicate collinearity (O’Brien 2007). If the present research
discovers collinearity in the regression output, it should reject the interpretation of the
relationships as false until the issue is resolved.
Specifically, as Draper and Smith (1981) stated, collinearity tends to inflate the variance
of at least one estimated regression coefficient (βi,j) because it can cause at least some
regression coefficients to have the wrong sign. Researchers can deal with collinearity by
one of the following:
1. Ignore it—if the prediction of y values is the object of the study, then collinearity
is not a problem
2. Use an estimator of the regression coefficients other than the least squares
estimators. An alternative is to use ridge regression estimators
3. Eliminate the ‘redundant’ variables by using a variable selection technique.
3.5.3.3 Tests for Autocorrelation and Heteroscedasticity
To ensure valid statistical inference when some of the underlying regression model’s
assumptions are violated, it is common to rely on ‘robust’ standard errors. Probably the
most popular of these alternative covariance matrix estimators was developed by White
(1980). Provided that the residuals are independently distributed, standard errors that are
obtained by assistance of this estimator are consistent even if the residuals are
heteroscedastic. Extending the work of White (1980) shows that it is possible to
95
somewhat relax the assumption of independently distributed residuals. The generalised
estimator produces consistent standard errors if the residuals are correlated within yet
uncorrelated between ‘clusters’.
Newey and West (1986) developed another approach to obtain heteroscedasticity and
autocorrelation consistent standard errors. Their Gaussian mixture model–based
covariance matrix estimator is an extension of White’s estimator, as the Newey-West
estimator with lag length zero is identical to the White estimator. Newey-West standard
errors were initially proposed for use with time-series data only. According to Baltagi
(2008), autocorrelation is only a problem in macro panels with long time series (over 20
to 30 years). However, the present research considers 10 years, from 2006 to 2015.
3.5.3.4 Ordinary Least Squares
In statistics, OLS is more commonly called linear regression. It can involve simple or
multiple regression, depending on the number of explanatory variables (Wooldridge
2010). It is used to estimate the unknown parameters in a linear regression model, with
the goal of minimising the sum of the squares of the differences between the observed
responses (values of the variable being predicted) in any given study data, and those
predicted by a linear function of a set of explanatory variables (Wooldridge 2010). This
method is used widely in CG studies. However, as mentioned earlier, Baddeley and
Barrowclough (2009) showed that a simple OLS can only be valid when all the
parameters of the models are constant across space. Thus, ignoring FE leads to
heterogeneity bias. One way to remedy this is via panel estimation through using either a
FE or RE model (Baddeley & Barrowclough 2009).
3.5.3.5 Panel Data Model
Regression panel data have been employed in some previous studies, such as those by
Kajola (2008) and O’Connell and Cramer (2010), who used them to test the relationship
between CG and firm financial performance. A panel data model is defined as involving
multiple cases observed at two or more time periods. The regression techniques used for
these kinds of data allow the researcher to take advantage of different types of information
(Baltagi 2008). Panel data regression involves longitudinal data, which typically include
time observations of a quantity of individuals. Thus, at least two dimensions are involved
in the observation of the data: (i) cross-sectional information reflected in the differences
96
between subjects; and (ii) time-series or within-subject information reflected in the
changes within subjects over time (Wooldridge 2010).
The sample in this study includes data both across firms and over time; thus, panel data
regression is the appropriate tool to be applied. Panel data analyses works best with a
large quantity of data points, which increases the degree of freedom and decreases the
collinearity among explanatory variables (Baltagi 2008). There are some advantages of
panel data over purely cross-sectional, or time-series, data. According to Baltagi (2008),
panel data are more informative, possess more variability, have less collinearity among
the variables, experience greater degrees of freedom and are more efficient (because time-
series studies have the problem of multicollinearity, and panel data are less likely to have
this problem, as the cross-sectional dimension provides lots of variability, thereby adding
more informative data).
The panel regression method identifies and measures effects that cannot be detected in
either pure cross-sectional or time-series data. It also allows researchers to construct and
test more complicated behavioural models than pure cross-sectional or time-series data.
Fewer restrictions are imposed on a panel data study than on a pure time-series study.
Another advantage of using this method is that it can incorporate micro-units, such as
individuals, firms and households, and it reduces biases arising from the aggregation of
individuals or firms. CG studies have increasingly relied on regression panel models to
analyse their study data because they are appropriate for regression panel data (Aldamen
et al. 2012; Kajola 2008; Vo & Phan 2013). Given this, the present research uses a panel
regression model to examine the relationship between board and audit committee
characteristics and firm financial performance in the UAE.
There are two panel methods used to fit the regression model: (i) FE model and (ii) RE
model.
3.5.3.5.1 Random-effects Model
The RE model assumes that the study data being analysed are drawn from a hierarchy of
diverse populations whose differences relate to that hierarchy (Diggle 2002). In
econometrics, the RE model is used in the analysis of hierarchical or panel data when
assuming no FE (it allows for individual effects). The RE model is a special case of the
FE model (Gardiner, Luo & Roman 2009). An important assumption of the RE estimation

97
is that the unobserved heterogeneity should not be correlated with the independent
variables (Diggle 2002).
The rationale behind the RE model is that, unlike the FE model, the variation across
entities is assumed to be random and uncorrelated with the predictor or independent
variables included in the model. As stated by Greene (2008a, p. 183):
The crucial distinction between fixed and random-effects is whether the unobserved
individual effect embodies elements that are correlated with the regressors in the
model, not whether these effects are stochastic or not.
According to Greene (2008a), if there are differences across entities that have some
influence on the dependent variable, then the study should use RE. An advantage of RE
is that researchers can include time-invariant variables. In the FE model, these variables
are absorbed by the intercept.
3.5.3.5.2 Fixed-effects Model
The FE models are statistical models that represent the observed quantities in terms of
explanatory variables that are treated as if the quantities were non-random. In terms of
panel data analysis, the FE model refers to an estimator for the coefficients in the
regression model. If the study assumes FE, it imposes time-independent effects for each
entity that is possibly correlated with the regressors (Diggle 2002). This model contrasts
with RE models and mixed models, in which either all or a few of the explanatory
variables are treated as if they arise from random causes. The same structure of model—
usually a linear regression model—can be treated as any of the three types, depending on
the analyst’s viewpoint, although there may be a natural choice in any given situation.
Thus, the FE model is a restricted version of the RE model (in which the variance of the
RE is shrunk to zero) (Diggle 2002). To decide between an RE and FE model, researchers
often rely on the Hausman specification test (Greene 2008a).
3.5.3.6 Hausman Test
The Hausman test is a statistical test that is used to compare the RE and FE models and
test whether FE or RE estimation would be more suitable for the regression model. This
test determines whether the biases inherent in the RE approach are small enough to
ignore, or whether the less restrictive FE model is more appropriate (Greene 2008b). With
respect to its application, if the Hausman test is statistically significant, one must use FE

98
regression. Conversely, for statistically insignificant results, one would employ RE
regression, which is used to determine whether one of the explanatory variables in a
regression suffers from endogeneity, omitted variable bias, measurement error or reverse
causality (Greene 2008b). To decide between FE and RE models, many previous CG
studies employed the Hausman test and confirmed that the preferred model was the RE
model (Al-Haddad, Alzurqan & Al-Sufy 2011; Dzingai & Fakoya 2017; Salehi, Moradi
& Paiydarmanesh 2017; Sprenger & Lazareva 2017).
3.5.3.7 Lagrange Multiplier Test
The Lagrange multiplier (LM) is a general principle for testing hypotheses about
parameters in a likelihood framework (Breusch & Pagan 1980). The hypothesis under the
test is expressed as one or more constraints on the values of parameters. To perform an
LM test, only an estimation of the parameters subject to restrictions is required. This is in
contrast with Wald tests, which are based on unrestricted estimates, and likelihood ratio
tests, which require both restricted and unrestricted estimates (Breusch & Pagan 1980).
The LM is known also as Breusch–Pagan LM and is used by researchers to decide
between using an RE regression or OLS regression to analyse their study data (Breusch
& Pagan 1980). The null hypothesis in the LM test states that variances across entities
are zero. If the test shows an insignificant difference across units, then no panel effect is
present and OLS is subsequently used.
3.5.3.8 Analysis of Variance
ANOVA is typically used to compare differences between more than two means (Veal
2005). Whether the means are from one population (with one mean) or from different
sub-populations (with different means) depends not only on the differences between the
means, but also on how much they are spread out or dispersed. The ANOVA test is an
exploratory analysis. It examines significance in the case of cross-tabulated means and
determines whether the differences revealed are within the acceptable significance levels.
The ANOVA test is capable of distinguishing effects in response to many different
sources of variations compared simultaneously, or in certain cases, through time. It has
the ability to identify interacting factors and to measure the scale of variation within a
hierarchy of effects (Veal 2005).
Many CG studies have used ANOVA to determine whether there are any statistically
significant differences between the means of more than two groups (Bijalwan & Madan
99
2013; Fitrijanti & Alamanda 2013; Mizuno 2014). As argued by Malhotra, Peterson and
Kleiser (1999), ANOVA is the most flexible and widely used technique of quantitative
analysis. Hence, the one-way ANOVA is specifically chosen in this study as a method to
compare the differences in mean values between the three observed periods to enable
effective comparison of the effect of the changes to UAE CG codes. The advantages of
using ANOVA derive from the following. First, ANOVA shows whether the means of
groups differ in some way. Second, ANOVA provides a more sensitive test of a factor
where the error term may be reduced (Cramer & Howitt 2004).
However, ANOVA does not pinpoint exactly where the significant difference lies if there
are more than two groups (Field 2009). To ascertain whether the means of the different
groups that integrate each of the variables are significantly different, a pairwise multiple
comparison post hoc test is used. There are a number of post hoc tests; however, there is
no clear consensus regarding which tests are the most appropriate (Cramer & Howitt
2004). The most commonly used for multiple comparison analysis statistics is the Tukey
test (Bijalwan & Madan 2013; Fitrijanti & Alamanda 2013; Mizuno 2014). In this
research, the post hoc Tukey’s honestly significant difference (HSD) test is used for the
second research objective, which aims to determine the influence of the changes to the
CG codes on the financial performance of listed companies in the UAE.
3.6 Methods Used for This Research
Based on a framework developed and formulated through a CG literature review, the
present study examines the relationship between CG characteristics and the financial
performance of UAE listed firms for the period 2006 to 2015. Specifically, the research
problem aims to identify the relationship between board and audit committee
characteristics and the financial performance of UAE listed firms. To address the research
problem, Research Question 1 asks:
RQ1: Do board and audit committee characteristics affect the financial
performance of UAE publicly listed firms?
This question aims to determine the effect of board and audit committee characteristics
on the financial performance of listed companies in the UAE. To accomplish this, a
multiple regression panel analysis is used to test nine hypotheses. To analyse the
relationship between board and audit committee characteristics and firm financial

100
performance, three equations are estimated, one for each of the financial performance
variables (ROA, ROE and Tobin’s Q). The estimated regression is in the form:
FPit = α + β1,tBSit + β2,tBCOMit + β3,tBMit + β4,tBMEDit + β5,tBMEXit + Σβ6,tACSit +
β7,tACCOMit + β8,tACMit + β9,tACEDit + β10,tFAit + β11,t LEVit + β12,tFSit + eit
where:
BS = board size BCOM = board composition BM = board meetings BMED = board members’ education BMEX = board members’ experience ACS = audit committee size ACCOM = audit committee composition ACM = audit committee meetings ACED = audit committee members’ education FA = firm age LEV = leverage FS = firm size FPit = financial performance, which includes ROA, ROE and Tobin’s Q, under company i over time t.
In addition, the overall research problem of this study is also addressed via Research
Question 2:
RQ2: Have the UAE CG codes affected the financial performance of UAE
publicly listed firms?
The second research question seeks to identify if the CG codes caused any change to the
relationship between the board and audit committee characteristics and financial
performance of listed companies in the UAE. To achieve this, a comparative analysis is
undertaken for three different periods: (i) 2006 to 2007, which was prior to the adoption
of the first CG code; (ii) 2009 to 2010, which was the period after the first CG was
adopted; and (iii) 2013 to 2014, which was three years after the adoption of the second
CG code. This comparative analysis is achieved via an OLS estimation and one-way
ANOVA. These techniques will measure and provide a comparison of the effect of the
changes to CG practices in these three different time periods. Three equations are
101
estimated—one for each of the financial performance variables. The estimated OLS
regression is in the form:
FPi = α + β1,BSi + β2, BCOM + β3,BMi + β4,BMEDi + β5,BMEXi + Σβ6,ACSi +
β7,ACCOMi + β8,ACMi + β9,ACEDi + β10,FAi + β11, LEVi + β12,FSi + ei
where:
BS = board size BCOM = board composition BM = board meetings BMED = board members’ education BMEX = board members’ experience ACS = audit committee size ACCOM = audit committee composition ACM = audit committee meetings ACED = audit committee members’ education FA = firm age LEV = leverage FS = firm size FP = financial performance, which includes ROA, ROE and Tobin’s Q.
3.7 Data Collection and Sources
The present study employs a quantitative research approach and uses secondary data to
investigate the relationship between CG characteristics and firm financial performance.
Veal (2005) stated that there are some sources that can be used to collect secondary data,
such as trade and business associations, media, books, articles, annual reports, web pages,
government organisations, government sources, census bureaus, securities and exchanges
and universities.
The secondary data of this study are obtained from different online sources. Some of the
data are collected from sources such as the DFM, ADX, Mint Global, Orbis—Bureau van
Dijk, DataStream, UAE listed firms’ website and ESCA. The data required to test the
developed model are collected from annual reports, CG reports, directors’ reports and
audit committees’ reports, particularly from the areas that focus on corporate information
and directors’ profiles. Data related to firm financial performance are obtained from
financial statements, such as balance sheets, income statements and cash flow statements
provided in firm annual reports.

102
3.8 Study Sample
The sample initially consisted of all UAE firms listed on the DFM and ADX as of July
2016. The selection of companies was determined by the availability of 10 years of data.
In total, there were 127 listed companies at that time, with 59 listed companies on the
DFM and 68 listed companies on the ADX for the 10 years from 2006 to 2015. The DFM
and ADX markets were chosen because companies on these markets are more likely to
attract and employ skilled and competent individuals on the board of directors and audit
committee. Further, these companies have great access to resources that are necessary for
their survival and can improve their performance and competitive position.
A purposive sampling technique was used to select companies. The listed companies
selected in this study had to meet three initial criteria: (i) provide information about board
and audit committee characteristics for the study period (2006 to 2015); (ii) provide
financial performance information; and (iii) possess complete data for the study period.
Based on these criteria, the number of firms was reduced to 61 because some listed firms
did not have information available on the key explanatory variables identified in this
study, while other firms did not have any information available via published accessible
sites. From there, another 14 companies were omitted from the study sample because they
contained outliers. Hair et al. (2010) suggested that outliers should be eliminated from
the data sample. As a result, the present study’s final sample comprised 47 listed firms9.
This is shown in Table 3.13 below.
Table 3.13: Study Sample
Firm Sample Size for Research Objective 2 Firms
Total UAE listed firms in 2016 127
Less:
• CG reports or annual reports not provided on official websites, such as ADX, DFM or company official websites in 2006 to 2015; no reports available; or few data available on the key explanatory variables of this research
(66)
• Outliers (14)
Final sample 47
Total observations (2006–2015) 464
9 The sample size of 47 listed companies (470 observations) for the period 2006 to 2015 comprised 464 total observations, rather than 470, because, in 2006 and 2007, three companies had omitted data.

103
3.9 Conclusion
This chapter has developed the conceptual framework for this study, while the multi-
theoretic approach was used as the basis to develop the hypotheses to examine the effect
of the board of directors and audit committee characteristics on firm financial
performance.
This study justified the use of the dependent variable as measured by ROA and ROE
(accounting-based measurement) and Tobin’s Q (market-based measurement). In
addition, for Research Question 1, the use of multiple regression panel analysis to test the
developed hypotheses was validated and justified. The use of an OLS and one-way
ANOVA was also established to address Research Question 2. Finally, the data collection
procedure and final sample size were discussed. The next chapter presents the statistical
results and analysis of this research.
104
Chapter 4: Results and Discussion
4.1 Introduction
Chapter 3 presented the conceptual framework for the study, which guided the
development of the hypotheses and analysis of data. It also presented the data collection
and research methods. The current chapter presents the results of the study and discusses
the results. Chapter 4 is structured in 10 sections to discuss the analysis of the relationship
between CG variables and firm financial performance variables by using the data
collected from UAE listed firms. Section 4.2 presents the descriptive statistics for the
study data, while Section 4.3 presents the initial statistical analysis, which consists of a
correlation matrix between the variables of the study. Section 4.4 presents the Hausman
test and Breusch–Pagan LM to determine the most appropriate approach panel regression
method to use. Section 4.5 presents a collinearity examination of the study results
according to its objectives, while Sections 4.6 to 4.9 present the findings and discuss the
first and second objectives. Section 4.10 concludes the chapter.
4.2 Descriptive Statistics
This section presents the descriptive statistics for the data used in the analysis. The
descriptive statistics report on the trends and patterns of data and provide the basis for
initial comparisons between variables. The descriptive statistics used in this study consist
of minimum, maximum, mean and standard deviation. For ease of presenting, this study
presents the descriptive statistics separately for board characteristics, audit committee
characteristics and firm financial performance. The descriptive statistics for all variables
are calculated covering the period from 2006 to 2015.
4.2.1 Board Characteristics
Table 4.1 provides the descriptive statistics for the variables related to board
characteristics. The mean size of boards in the sample was 7.70, ranging from five to 15
members. These statistics are in line with the recommendations of the first and second
UAE CG codes, which state that the company can determine the number of members on
the board of directors, while the second code also states that a board should have at least
three members and a maximum of 15 members.
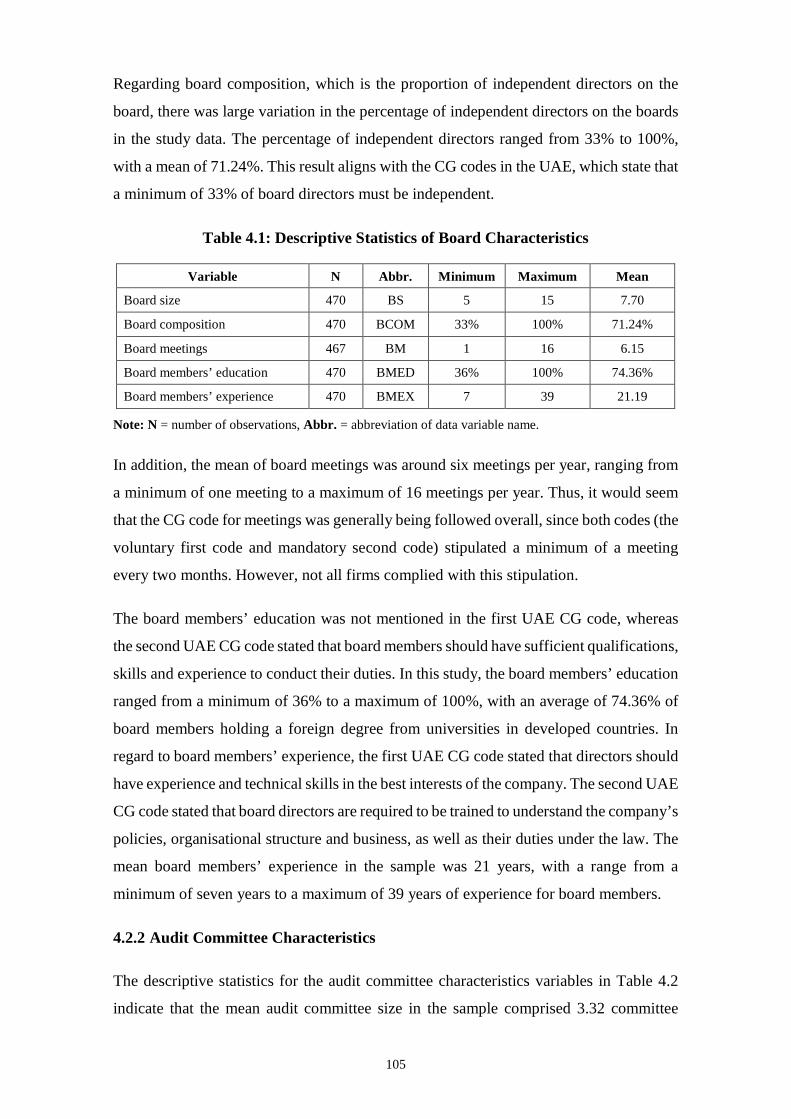
105
Regarding board composition, which is the proportion of independent directors on the
board, there was large variation in the percentage of independent directors on the boards
in the study data. The percentage of independent directors ranged from 33% to 100%,
with a mean of 71.24%. This result aligns with the CG codes in the UAE, which state that
a minimum of 33% of board directors must be independent.
Table 4.1: Descriptive Statistics of Board Characteristics
Variable N Abbr. Minimum Maximum Mean
Board size 470 BS 5 15 7.70
Board composition 470 BCOM 33% 100% 71.24%
Board meetings 467 BM 1 16 6.15
Board members’ education 470 BMED 36% 100% 74.36%
Board members’ experience 470 BMEX 7 39 21.19
Note: N = number of observations, Abbr. = abbreviation of data variable name.
In addition, the mean of board meetings was around six meetings per year, ranging from
a minimum of one meeting to a maximum of 16 meetings per year. Thus, it would seem
that the CG code for meetings was generally being followed overall, since both codes (the
voluntary first code and mandatory second code) stipulated a minimum of a meeting
every two months. However, not all firms complied with this stipulation.
The board members’ education was not mentioned in the first UAE CG code, whereas
the second UAE CG code stated that board members should have sufficient qualifications,
skills and experience to conduct their duties. In this study, the board members’ education
ranged from a minimum of 36% to a maximum of 100%, with an average of 74.36% of
board members holding a foreign degree from universities in developed countries. In
regard to board members’ experience, the first UAE CG code stated that directors should
have experience and technical skills in the best interests of the company. The second UAE
CG code stated that board directors are required to be trained to understand the company’s
policies, organisational structure and business, as well as their duties under the law. The
mean board members’ experience in the sample was 21 years, with a range from a
minimum of seven years to a maximum of 39 years of experience for board members.
4.2.2 Audit Committee Characteristics
The descriptive statistics for the audit committee characteristics variables in Table 4.2
indicate that the mean audit committee size in the sample comprised 3.32 committee
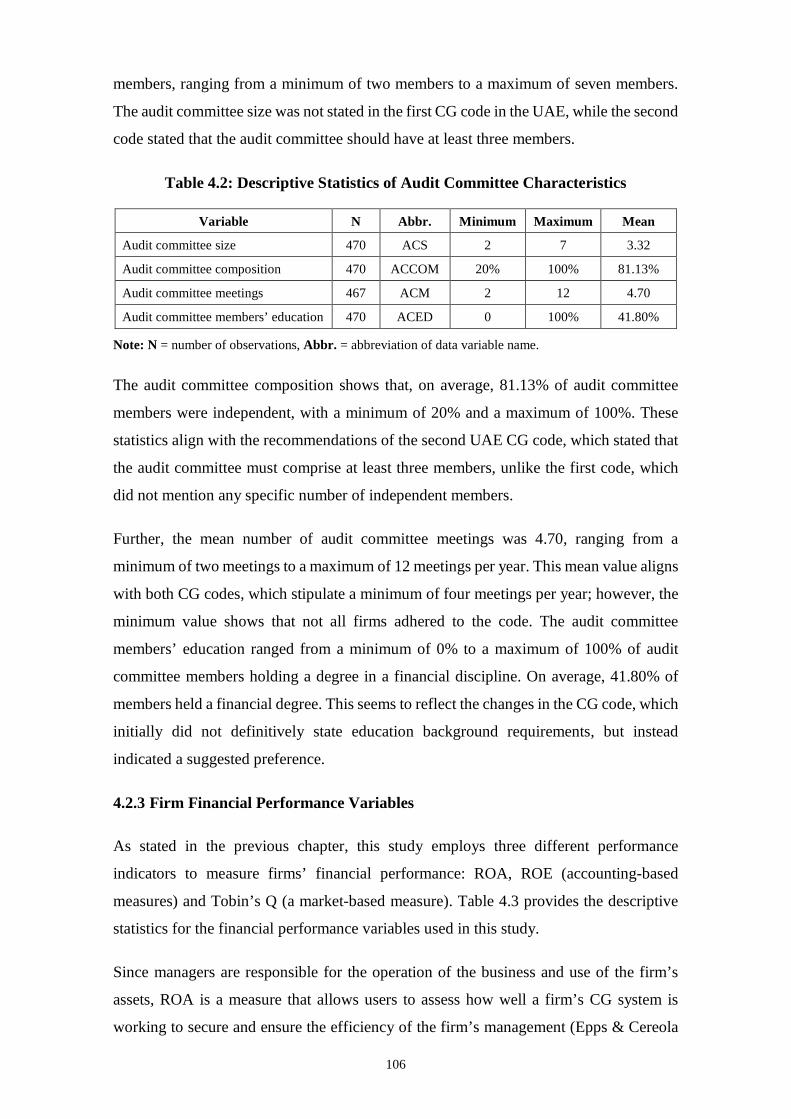
106
members, ranging from a minimum of two members to a maximum of seven members.
The audit committee size was not stated in the first CG code in the UAE, while the second
code stated that the audit committee should have at least three members.
Table 4.2: Descriptive Statistics of Audit Committee Characteristics
Variable N Abbr. Minimum Maximum Mean
Audit committee size 470 ACS 2 7 3.32
Audit committee composition 470 ACCOM 20% 100% 81.13%
Audit committee meetings 467 ACM 2 12 4.70
Audit committee members’ education 470 ACED 0 100% 41.80%
Note: N = number of observations, Abbr. = abbreviation of data variable name.
The audit committee composition shows that, on average, 81.13% of audit committee
members were independent, with a minimum of 20% and a maximum of 100%. These
statistics align with the recommendations of the second UAE CG code, which stated that
the audit committee must comprise at least three members, unlike the first code, which
did not mention any specific number of independent members.
Further, the mean number of audit committee meetings was 4.70, ranging from a
minimum of two meetings to a maximum of 12 meetings per year. This mean value aligns
with both CG codes, which stipulate a minimum of four meetings per year; however, the
minimum value shows that not all firms adhered to the code. The audit committee
members’ education ranged from a minimum of 0% to a maximum of 100% of audit
committee members holding a degree in a financial discipline. On average, 41.80% of
members held a financial degree. This seems to reflect the changes in the CG code, which
initially did not definitively state education background requirements, but instead
indicated a suggested preference.
4.2.3 Firm Financial Performance Variables
As stated in the previous chapter, this study employs three different performance
indicators to measure firms’ financial performance: ROA, ROE (accounting-based
measures) and Tobin’s Q (a market-based measure). Table 4.3 provides the descriptive
statistics for the financial performance variables used in this study.
Since managers are responsible for the operation of the business and use of the firm’s
assets, ROA is a measure that allows users to assess how well a firm’s CG system is
working to secure and ensure the efficiency of the firm’s management (Epps & Cereola
107
2008). Table 4.3 indicates that the overall mean for ROA was 5.43%, in which the
minimum mean was 5.18% in 2011 and the maximum mean was 5.71% in 2014. This
indicates firms’ increasing profitability, which implies that firms more efficiently used
their assets. Then, in 2015, there was a slight decrease in the mean value to 5.44%. For
all companies in the study sample, the ROA ranged from a minimum of 2.23% in 2009
to a maximum of 11.67% in 2007, with an overall standard deviation of 1.24%, which
suggests the variation was at a medium level.
The descriptive statistics for ROE provide a measure that shows investors the profit
generated from the money invested by shareholders (Epps & Cereola 2008). The results
indicate that, for all listed firms in the sample, the ranges were from a minimum of 0.20%
in 2007 to a maximum of 14.58% in 2008. In addition, overall mean for ROE was 3.99%,
while the minimum mean was 3.42% in 2011 and the maximum mean was 5.95% in 2015.
A rising ROE suggests that a company is increasing its ability to generate profit without
needing as much capital. It also indicates how well a company’s management is deploying
the shareholders’ capital.
Table 4.3 also contains the descriptive statistics of Tobin’s Q. It shows that there was
some fluctuation in the mean values during the whole period from 2006 to 2015. The
overall mean for Tobin’s Q was 0.79%, while the minimum ROE was 0.24% in 2009 to
a maximum ROE of 1.62% in 2014. It is considered that, the higher value of Tobin’s Q,
the more effective the governance mechanisms and the better the market’s perception of
the company’s performance. According to Weir, Laing and McKnight (2002), a higher
Tobin’s Q shows how closely the shareholders’ and managers’ interests have been
aligned, while a lower Tobin’s Q suggests greater managerial discretion.

108
Table 4.3: Descriptive Statistics of Firm Financial Performance
Abbr. Mean Std Deviation Min Max Percentiles
Year Valid N (%) (%) (%) 25 50 75
ROA
2006 44 5.397 1.378 2.999 10.490 4.445 5.392 6.204
2007 44 5.573 1.537 2.871 11.670 4.506 5.444 6.498
2008 47 5.530 1.250 2.454 9.971 4.781 5.445 6.176
2009 47 5.197 1.245 2.226 8.719 4.292 5.209 5.931
2010 47 5.277 1.266 2.930 8.754 4.351 5.285 6.022
2011 47 5.177 1.181 2.787 7.607 4.372 5.125 6.157
2012 47 5.231 1.010 2.863 7.354 4.446 5.309 5.801
2013 47 5.750 1.047 3.934 8.430 4.828 5.713 6.488
2014 47 5.711 1.244 2.771 8.679 4.959 5.787 6.595
2015 47 5.444 1.116 2.730 8.675 4.703 5.545 5.966
Overall 464 5.428 1.237 2.226 11.670 4.574 1.237 6.205
ROE
2006 44 3.634 1.733 0.210 8.977 2.640 3.315 4.946
2007 44 3.554 1.724 0.202 8.671 2.406 3.171 4.291
2008 47 3.767 2.190 0.651 14.580 2.567 3.476 4.137
2009 47 3.537 1.491 1.095 8.802 2.688 3.217 4.023
2010 47 3.582 1.397 0.317 6.845 2.578 3.680 4.471
2011 47 3.421 1.286 0.937 6.807 2.382 3.438 4.235
2012 47 3.453 1.133 0.934 6.876 2.793 3.390 4.130
2013 47 5.296 1.253 2.742 9.673 4.500 5.296 5.918
2014 47 5.670 1.524 3.222 11.414 4.794 5.458 6.261
2015 47 5.945 1.237 1.007 8.016 2.954 3.977 4.832
Overall 464 3.991 1.695 0.202 14.580 2.822 1.695 4.919
Tobin’s Q
2006 44 0.747 0.154 0.396 1.174 0.628 0.744 0.848
2007 44 0.791 0.193 0.317 1.337 0.684 0.805 0.930
2008 47 0.748 0.224 0.273 1.257 0.561 0.778 0.913
2009 47 0.772 0.198 0.243 1.228 0.618 0.745 0.919
2010 47 0.776 0.195 0.440 1.215 0.605 0.753 0.923
2011 47 0.750 0.179 0.420 1.075 0.584 0.784 0.894
2012 47 0.789 0.212 0.400 1.452 0.662 0.771 0.964
2013 47 0.813 0.164 0.450 1.300 0.750 0.822 0.901
2014 47 0.871 0.228 0.437 1.623 0.722 0.830 1.035
2015 47 0.820 0.171 0.390 1.110 0.735 0.842 0.929
Overall 464 0.790 0.201 0.243 1.623 0.655 0.201 0.919
Note: Valid N = number of observations, Abbr. = abbreviation of data variable name.
109
From an overall perspective, it can be noted that, from 2006 to 2007, ROA and Tobin’s
Q increased, while ROE decreased. The period between 2007 and 2008 shows that ROA
and Tobin’s Q decreased, while ROE increased. All the variables slightly increased in
2009 to 2010 and 2011 to 2012, while the period between 2013 and 2014 shows that ROA
decreased, while Tobin’s Q and ROE increased. In 2015, ROA and Tobin’s Q decreased,
while ROE increased. These differences show that the type of financial performance
measures used is important as the use of only one measure could be misleading. Thus, it
is vital to use more than one measure to provide strong findings.
4.3 Correlation Matrix
Correlation analysis is considered a measure to determine the direction and strength of
the linear association between pairs of variables. Table 4.4 presents the correlation values
of the variables for this study period. Overall, the correlations are low between all
variables, with no indication of strong correlations as per the criteria of 0.80 (Grewal,
Cote & Baumgartner 2004; Shearer & Clark 2016). Specifically, the results show
negligible and low correlation among all variables. For example, Table 4.4 shows a
correlation coefficient of -0.02 between board meetings (BM) and Tobin’s Q, which is
considered a low strength negative correlation, and shows a correlation coefficient of
0.48 between board size (BS) and audit committee size (ACS), which is considered a
moderate positive correlation. The results of the correlation matrix imply that the issue of
collinearity is not present in this study.
Regarding the correlation between dependent and independent variables, the results
suggest that board size is significantly correlated with the firm financial performance
variables of ROE, ROA and Tobin’s Q. Board composition is also significantly correlated
with ROA and Tobin’s Q. The test shows a significant correlation between board
meetings and both accounting-based measures (ROA and ROE). Board members’
education is significantly correlated with Tobin’s Q. Board members’ experience is
significantly correlated with ROE and Tobin’s Q. Audit committee composition is
significantly correlated with ROA and Tobin’s Q, while audit committee meetings are
significantly correlated with ROA and ROE. Audit committee members’ education is
significantly correlated with the firm financial performance variables of ROE, ROA and
Tobin’s Q.
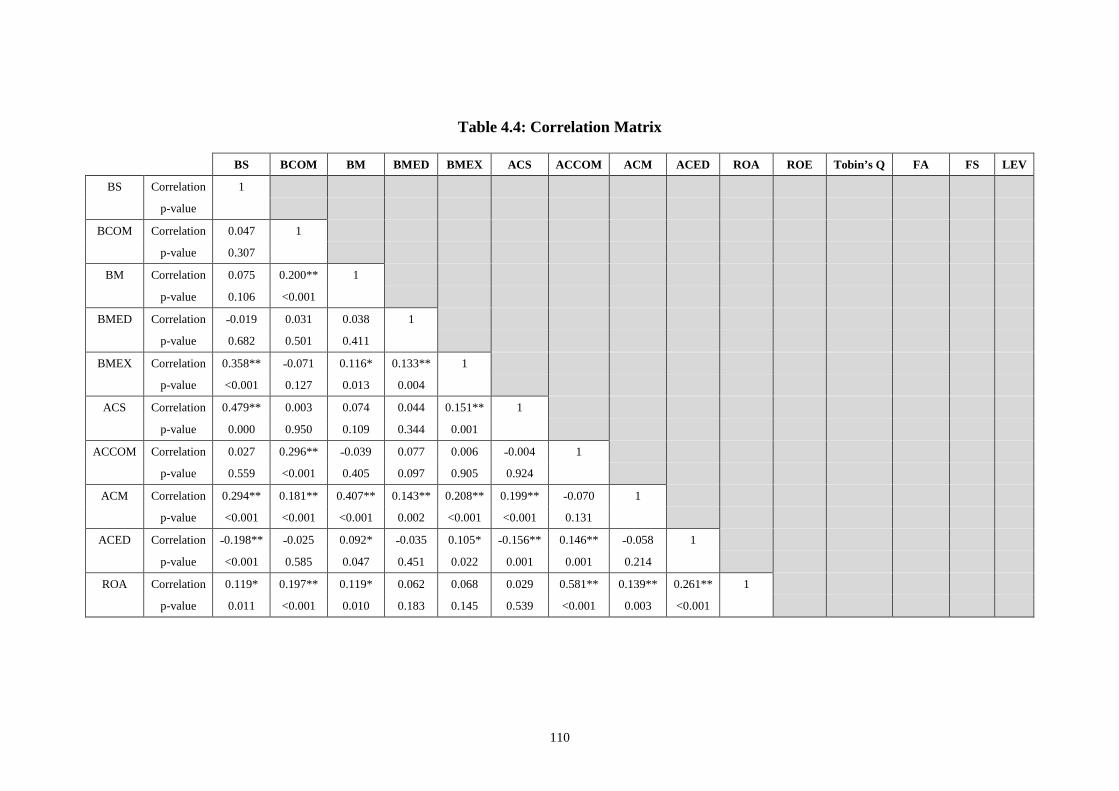
110
Table 4.4: Correlation Matrix
BS BCOM BM BMED BMEX ACS ACCOM ACM ACED ROA ROE Tobin’s Q FA FS LEV
BS Correlation 1
p-value
BCOM Correlation 0.047 1
p-value 0.307
BM Correlation 0.075 0.200** 1
p-value 0.106 <0.001
BMED Correlation ˗0.019 0.031 0.038 1
p-value 0.682 0.501 0.411
BMEX Correlation 0.358** ˗0.071 0.116* 0.133** 1
p-value <0.001 0.127 0.013 0.004
ACS Correlation 0.479** 0.003 0.074 0.044 0.151** 1
p-value 0.000 0.950 0.109 0.344 0.001
ACCOM Correlation 0.027 0.296** ˗0.039 0.077 0.006 ˗0.004 1
p-value 0.559 <0.001 0.405 0.097 0.905 0.924
ACM Correlation 0.294** 0.181** 0.407** 0.143** 0.208** 0.199** ˗0.070 1
p-value <0.001 <0.001 <0.001 0.002 <0.001 <0.001 0.131
ACED Correlation ˗0.198** ˗0.025 0.092* ˗0.035 0.105* ˗0.156** 0.146** ˗0.058 1
p-value <0.001 0.585 0.047 0.451 0.022 0.001 0.001 0.214
ROA Correlation 0.119* 0.197** 0.119* 0.062 0.068 0.029 0.581** 0.139** 0.261** 1
p-value 0.011 <0.001 0.010 0.183 0.145 0.539 <0.001 0.003 <0.001
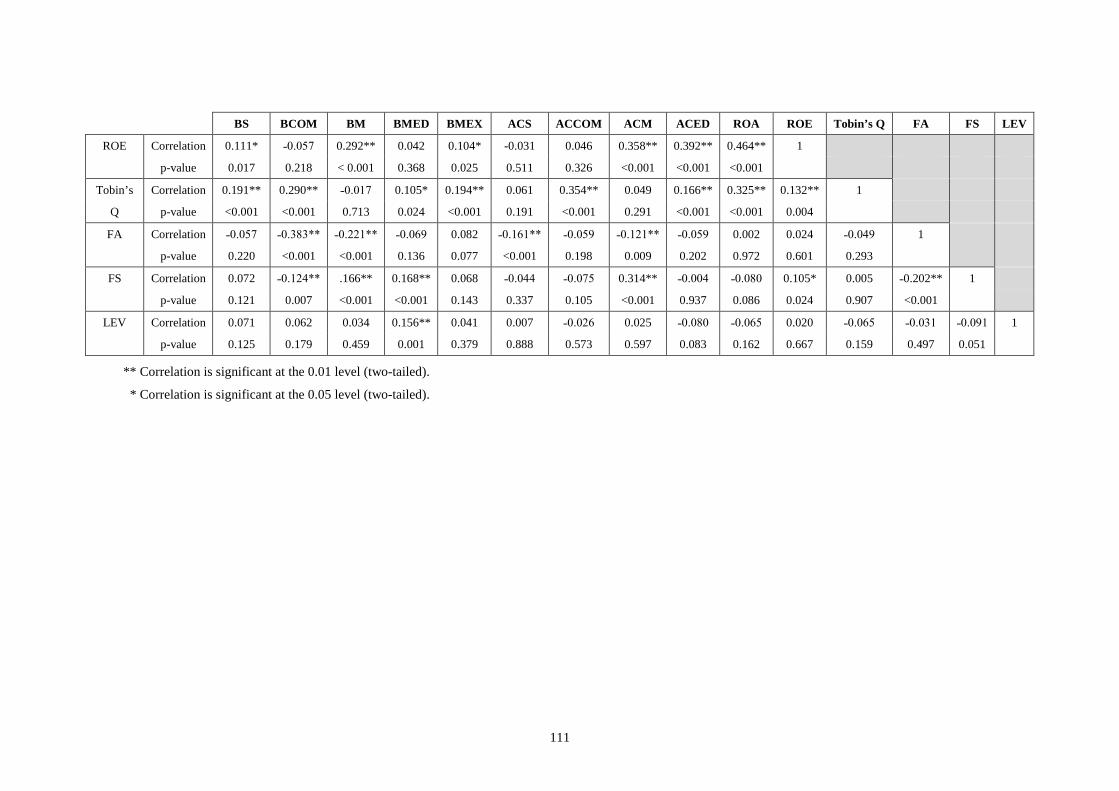
111
BS BCOM BM BMED BMEX ACS ACCOM ACM ACED ROA ROE Tobin’s Q FA FS LEV
ROE Correlation 0.111* ˗0.057 0.292** 0.042 0.104* -0.031 0.046 0.358** 0.392** 0.464** 1
p-value 0.017 0.218 < 0.001 0.368 0.025 0.511 0.326 <0.001 <0.001 <0.001
Tobin’s Correlation 0.191** 0.290** ˗0.017 0.105* 0.194** 0.061 0.354** 0.049 0.166** 0.325** 0.132** 1
Q p-value <0.001 <0.001 0.713 0.024 <0.001 0.191 <0.001 0.291 <0.001 <0.001 0.004
FA Correlation ˗0.057 ˗0.383** ˗0.221** ˗0.069 0.082 ˗0.161** ˗0.059 ˗0.121** ˗0.059 0.002 0.024 ˗0.049 1
p-value 0.220 <0.001 <0.001 0.136 0.077 <0.001 0.198 0.009 0.202 0.972 0.601 0.293
FS Correlation 0.072 ˗0.124** .166** 0.168** 0.068 ˗0.044 ˗0.075 0.314** ˗0.004 ˗0.080 0.105* 0.005 ˗0.202** 1
p-value 0.121 0.007 <0.001 <0.001 0.143 0.337 0.105 <0.001 0.937 0.086 0.024 0.907 <0.001
LEV Correlation 0.071 0.062 0.034 0.156** 0.041 0.007 ˗0.026 0.025 ˗0.080 ˗0.065 0.020 ˗0.065 ˗0.031 ˗0.091 1
p-value 0.125 0.179 0.459 0.001 0.379 0.888 0.573 0.597 0.083 0.162 0.667 0.159 0.497 0.051
** Correlation is significant at the 0.01 level (two-tailed).
* Correlation is significant at the 0.05 level (two-tailed).

112
4.4 Panel Data and Ordinary Least Squares Regression Analysis
The panel data model and OLS regression model are two of the most common methods
of analysis that have been used by many previous studies to analyse their study data (Cho
& Kim 2007; Coles et al. 2008; Yermack 1996). The present research applies the
Hausman test prior to employing multiple panel regression analysis to specify the
appropriate model. As stated previously, if the Hausman test is found to be insignificant,
an RE model is preferred, while a significant Hausman test means that an FE model is
preferred. In addition, a LM test is employed to choose either an RE or OLS regression
to test and analyse the study data. Further, the assumptions surrounding the regression
model for collinearity and normality are tested. Finally, the robust standard error for
regression estimates is computed to deal with any issue of heteroscedasticity. The results
of these tests are presented below.
4.5 Collinearity
Table 4.5 shows the results of the VIF and tolerance for the independent and control
variables in the model. Tolerance is a measure of collinearity, and a small tolerance value
indicates that the variable under consideration is almost a perfect linear combination of
the independent variable (Tabachnick & Fidell 2007). A tolerance (1/VIF) value of less
than 0.20 and a VIF value of greater than 10 indicates the presence of collinearity. The
results suggest that all variables in the regression model have VIF factor scores below the
benchmark of 10 and tolerance values greater than 0.20, which indicates the absence of
multicollinearity. The VIF and tolerance results are presented in full in Appendix 2.

113
Table 4.5: Results for VIF and Tolerance
Variable VIF Tolerance (1/VIF)
Board size (BS) 1.61 0.620
Board composition (BCOM) 1.52 0.655
Board meetings (BM) 1.30 0.769
Board members’ education (BMED) 1.13 0.885
Board members’ experience (BMEX) 1.28 0.783
Audit committee size (ACS) 1.42 0.703
Audit committee composition (ACCOM) 1.17 0.852
Audit committee meeting (ACM) 1.53 0.652
Audit committee members’ education (ACED) 1.14 0.876
Firm age (FA) 1.42 0.704
Leverage (LEV) 1.07 0.932
Firm size (FS) 1.37 0.730
4.6 Results of Research Objective 1
The first research objective of the study is to determine the relationship between board
and audit committee characteristics and the financial performance of listed companies in
the UAE. Three equations are estimated—one for each of the financial performance
variables. This objective has nine hypotheses, with a multiple panel regression analysis
used to test these hypotheses.
4.6.1 Effects of Return on Assets
To investigate the effect of board and audit committee characteristics on ROA, this study
uses panel data. However, some econometric issues need to be addressed in relation to
panel data. The LM test is employed to guide model selection. The result of the LM test
is significant (p-value < 0.001), thereby suggesting that panel regression is more suitable
than OLS. In addition, since panel data models can be specified as either FE or RE, a
Hausman test is employed. The Hausman test result is statistically insignificant (χ2 =
11.38, p-value = 0.497); consequently, an RE model is appropriate to use for ROA. The
results of the two tests (Hausman and LM) are presented in Appendix 1. The estimated
equation is as follows:
ROA = 0.941 + 0.082 BS − 0.002 BCOM + 0.090 BM + 0.002 BMED − 0.017 BMEX
− 0.035 ACS + 0.036 ACCOM + 0.107 ACM + 0.008 ACED − 0.001 LEV +
0.007 FA − 0.129 FS

114
Table 4.6: Random-effect Panel Data Regression Model for ROA
Variable RE Model Result
Estimate p-value
Independent variables
Board size (BS) 0.082 0.015 Pos, Sig
Board composition (BCOM) -0.002 0.080 Neg, Sig
Board meetings (BM) 0.090 0.017 Pos, Sig
Board members’ education (BMED) 0.002 0.527 Pos, Insig
Board members’ experience (BMEX) -0.017 0.151 Neg, Insig
Audit committee size (ACS) -0.035 0.736 Neg, Insig
Audit committee composition (ACCOM) 0.036 < 0.001 Pos, Sig
Audit committee meetings (ACM) 0.107 0.006 Pos, Sig
Audit committee members’ education (ACED)
0.008 < 0.001 Pos, Sig
Control variables
Leverage (LEV) -0.001 0.664 –
Firm age (FA) 0.007 0.239 –
Firm size (FS) -0.129 0.168 –
Constant 0.941 0.142 –
Model fit: Wald (chi-square) = 248.11, p-value < 0.001
R-squared = 0.430
Note: Pos = positive, Neg = negative, Sig = significant, Insig = insignificant.
The proposed RE model for ROA, with control variables LEV, FA and FS, is statistically
significant (χ2 = 248.11, p-value < 0.001) and able to fit the linear relationship between
ROA and the selected independent variables. This result, provided by the value of R2,
indicates that the predictors explain 43.0% of the variation in ROA.
Table 4.6 shows that board size, board meetings, audit committee composition, audit
committee meetings and audit committee members’ education have significant positive
relationships with ROA. In contrast, the results show a significant negative relationship
between ROA and board composition. The results of the RE model for ROA also show
no significant relationship between ROA and board members’ education with a p-value
of 0.527; board members’ experience with a p-value of 0.151; and audit committee size
with a p-value of 0.736. The results will be discussed in light of their associated
hypotheses in Section 4.8.
4.6.2 Effects of Return on Equity
For the ROE model, a LM test is used to check which model (OLS regression or panel
data model) is preferred to analyse the research data. The LM test result is highly

115
significant (χ2 = 36.58, p-value < 0.001), thereby suggesting that a panel regression is
necessary. The Hausman test is also used to determine which panel regression model is
preferred for ROE. The result of this test shows that the FE is not appropriate for the ROE
model, as the test is statistically insignificant (χ2 = 10.65, p-value = 0.559). The results
of the two tests are located in Appendix 1. The result confirms that the RE model is
preferred to test the study hypothesis for ROE. The results of these two tests indicate that
the RE model is the appropriate model to estimate. The estimated equation is as follows:
ROE = 0.655 + 0.141 BS − 0.014 BCOM + 0.211 BM + 0.004 BMED − 0.004 BMEX
− 0.380 ACS + 0.002 ACCOM + 0.366 ACM + 0.025 ACED + 0.002 LEV +
0.009 FA − 0.105 FS
Table 4.7: Random-effect Panel Data Regression Model for ROE
Variable RE Model Result
Estimate p-value
Independent variables
Board size (BS) 0.141 0.007 Pos, Sig
Board composition (BCOM) ˗0.014 0.010 Neg, Sig
Board meetings (BM) 0.211 < 0.001 Pos, Sig
Board members’ education (BMED) 0.004 0.432 Pos, Insig
Board members’ experience (BMEX) ˗0.004 0.776 Neg, Insig
Audit committee size (ACS) ˗0.380 0.016 Neg, Sig
Audit committee composition (ACCOM)
0.002 0.532 Pos, Insig
Audit committee meetings (ACM) 0.366 < 0.001 Pos, Sig
Audit committee members’ education (ACED)
0.025 < 0.001 Pos, Sig
Control variables
Leverage (LEV) 0.002 0.451 –
Firm age (FA) 0.009 0.347 –
Firm size (FS) ˗0.105 0.489 –
Constant 0.655 0.503 –
Model fit: Wald (chi-square) = 180.32, p-value < 0.001
R-squared = 0.352
Note: Pos = positive, Neg = negative, Sig = significant, Insig = insignificant.
Table 4.7 above shows that the proposed RE model for ROE, with control variables LEV,
FA and FS, is statistically significant (χ2 = 180.32, p-value < 0.001), thereby indicating
that the model is able to fit the linear relationship between the ROE and predictor
variables. The R2 indicates that the predictors explain 35.2% of variation in ROE. Two
board characteristics (board size and board meetings) have a significant positive

116
relationship with ROE, thereby indicating that any increase in board size and meetings
lead to increased ROE. In addition, two audit committee characteristics (audit committee
meetings and audit committee members’ education) have significant positive
relationships with ROE, with a p-value < 0.001. Meanwhile, significant negative
relationships are identified between ROE and board composition and audit committee
size. The result of the RE model for ROE also demonstrates an insignificant relationship
between ROE and board members’ education, with a p-value of 0.432; audit committee
composition, with a p-value of 0.532; and board members’ experience, with a p-value of
0.776. The results will be discussed in light of their associated hypotheses in Section 4.8.
4.6.3 Effects of Tobin’s Q
For the Tobin’s Q model, a LM test is used to check which model (OLS regression or
panel data regression) is preferred to analyse the research data. The LM test result is
highly significant (χ2 = 28.25, p-value < 0.001), thereby suggesting that panel regression
is necessary. Since panel data models can be specified as an FE or RE model, a Hausman
test is performed. The Hausman test result is statistically insignificant (χ2 = 19.93, p-
value = 0.068) and is located in Appendix 1. Hence, a RE model is appropriate to estimate
for Tobin’s Q. The estimated equation is as follows:
Tobin’s Q = 0.003 + 0.016 BS + 0.002 BCOM − 0.004 BM + 0.001 BMED + 0.004
BMEX + 0.010 ACS + 0.003 ACCOM − 0.006 ACM + 0.001 ACED − 0.001
LEV + 0.001 FA + 0.013 FS.

117
Table 4.8: Random-effect Panel Data Regression Model for Tobin’s Q Model
Variable RE Model Result
Estimate p-value
Independent variables
Board size (BS) 0.016 0.009 Pos, Sig
Board composition (BCOM) 0.002 < 0.001 Pos, Sig
Board meetings (BM) ˗0.004 0.502 Neg, Insig
Board members’ education (BMED) 0.001 0.055 Pos, Sig
Board members’ experience (BMEX) 0.004 0.052 Pos, Sig
Audit committee size (ACS) 0.010 0.592 Pos, Insig
Audit committee composition (ACCOM)
0.003 < 0.001 Pos, Sig
Audit committee meetings (ACM) ˗0.006 0.340 Neg, Insig
Audit committee members’ education (ACED)
0.001 0.004 Pos, Sig
Control variables
Leverage (LEV) ˗0.001 0.084 –
Firm age (FA) 0.001 0.242 –
Firm size (FS) 0.013 0.420 –
Constant 0.003 0.974 –
Model fit: Wald (chi-square) = 108.80, p-value < 0.001
R-squared = 0.253
Note: Pos = positive, Neg = negative, Sig = significant, Insig = insignificant.
Table 4.8 shows that the proposed RE model for Tobin’s Q, with control variables LEV,
FA and FS, is statistically significant (χ2 = 108.80, p-value < 0.001), thereby indicating
that the model is able to fit the linear relationship between Tobin’s Q and the predictor
variables. The RE model of Tobin’s Q accounts for 25.30% of the variance. The results
of this model show that four board characteristics (board size, board composition, board
members’ education and board members’ experience) have a significant positive
relationship with Tobin’s Q. In addition, two audit committee characteristics (audit
committee composition and audit committee members’ education) have a significant
positive relationship with Tobin’s Q. The results show no significant relationship between
Tobin’s Q and the following variables: board meetings with a p-value of 0.502; audit
committee size with a p-value of 0.592; and audit committee meetings with a p-value of
0.340. The results will be discussed in light of their associated hypotheses in Section 4.8.
With respect to all board and audit committee characteristics, the results of the two
accounting-based estimations (ROA and ROE) show that four of the nine independent
variables (board size, board meetings, audit committee meetings and audit committee

118
members’ education) are significant and positively related to ROA and ROE. In addition,
the relationship between board composition and ROA and ROE is significant and
negative. The variable of audit committee size is negatively related to ROA and ROE, but
the relationship is significant only in the ROE model, while audit committee composition
is positive for both ROA and ROE, but only significant for ROA. In contrast, the Tobin’s
Q model, which is a market-based measure of firm financial performance, produces
different results from the ROA and ROE models, except for two variables (board size and
audit committee members’ education) that have the same results as the ROA and ROE
models. The results will be discussed in more detail in Section 4.8.
4.7 Results of Research Objective 2
The second research objective aims to determine the influence of the changes to the CG
codes on the financial performance of listed companies in the UAE. To recall, for the two
CG codes, three time sub-periods were established:
1. 2006 to 2007 (Period 1)—the period prior to the adoption of the first CG code
2. 2009 to 2010 (Period 2)—the period two years after the first CG code was adopted
3. 2013 to 2014 (Period 3)—the period three years after the adoption of the second
CG code.
This study employs an OLS to provide the initial basis to compare the changes in the
relationships between board and audit committee characteristics and firm financial
performance among the three sub-periods. Three equations are estimated—one for each
of the financial performance variables for each of the three distinct time periods. The OLS
functions are estimated by the dependent variables (ROA, ROE and Tobin’s Q) and
independent variables (BS, BCOM, BM, BMED, BMEX, ACS, ACCOM, ACM and
ACED), controlled by firm size, firm age and leverage. This study also employs a one-
way ANOVA to measure and provide a comparison of the changes to CG practices in the
data between these three different periods.
4.7.1 Ordinary Least Squares
4.7.1.1 Effects of Return on Assets Model
Table 4.9 presents the results for the ROA model, which indicate that the estimated
equation is significant, and the test did not indicate any problems. Specifically, the
estimates for the three sub-periods models are highly significant (p-value < 0.001). The

119
R2 indicates that the predictors are able to explain 47.8% of variation in firm financial
performance for Period 1, 49.5% for Period 2 and 49.9% for Period 3. The results
demonstrate that the OLS model fits the study data for the three sub-periods.
Table 4.9: ROA Models Using OLS for Three Sub-periods—Periods 1, 2 and 3
Model Period 1 (2006–2007)
Period 2 (2009–2010)
Period 3 (2013–2014)
Estimate p-value Estimate p-value Estimate p-value
(Constant) ˗2.970 0.104 0.986 0.452 1.460 0.328
BS 0.100 0.248 0.163 0.009 ˗0.059 0.238
BCOM 0.003 0.767 0.006 0.354 0.001 0.890
BM 0.233 0.113 0.266 0.007 0.021 0.750
BMED 0.027 0.005 ˗0.002 0.732 ˗0.005 0.522
BMEX 0.023 0.525 ˗0.055 0.027 ˗0.024 0.270
ACS 0.067 0.777 ˗0.007 0.970 0.251 0.247
ACCOM 0.035 < 0.001 0.025 < 0.001 0.042 < 0.001
ACM ˗0.001 0.997 0.055 0.530 0.176 0.005
ACED 0.016 0.015 0.005 0.371 0.005 0.153
LEV 0.001 0.940 ˗0.001 0.745 0.004 0.447
FA 0.008 0.579 0.030 0.005 0.003 0.788
FS 0.030 0.884 ˗0.313 0.040 ˗0.030 0.829
R-squared 0.478 0.495 0.499
F-test (ANOVA) 5.720 6.440 6.720
p-value (F-test) < 0.001 < 0.001 < 0.001
Note: BS = board size, BCOM = board composition, BM = board meetings, BMED = board members’ education, BMEX = board members’ experience, ACS = number of members in the committee, ACCOM = audit committee composition, ACM = audit committee meeting, ACED = audit committee members’ education, LEV = leverage, FA = firm age, FS = firm size.
The results for board characteristics show no relationship between ROA and BS in
Periods 1 and 3; however, Period 2 is significant and positive. The association between
ROA and both BCOM and BM is positive for all three periods; however, it is significant
only for the Period 2 association between ROA and BM. The relationship between ROA
and BMED in Period 1 is significant and positive, while Periods 2 and 3 show no
significant relationship. Finally, there is no significant association between ROA and
BMEX for Periods 1 and 3, while Period 2 is significant and negative.
The results for the audit committee characteristics and ROA demonstrate no significant
relationship between ROA and ACS, while ACCOM is significant and positive for all
three periods. The association between ROA and ACM is significant and positive for
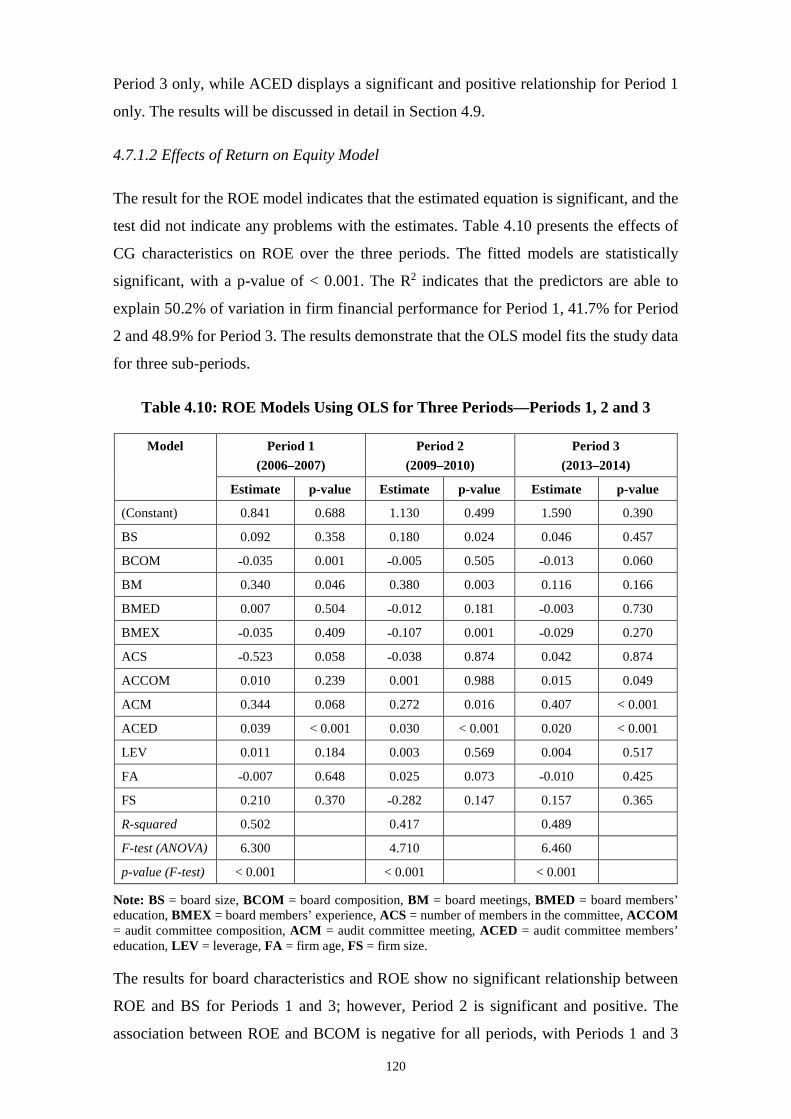
120
Period 3 only, while ACED displays a significant and positive relationship for Period 1
only. The results will be discussed in detail in Section 4.9.
4.7.1.2 Effects of Return on Equity Model
The result for the ROE model indicates that the estimated equation is significant, and the
test did not indicate any problems with the estimates. Table 4.10 presents the effects of
CG characteristics on ROE over the three periods. The fitted models are statistically
significant, with a p-value of < 0.001. The R2 indicates that the predictors are able to
explain 50.2% of variation in firm financial performance for Period 1, 41.7% for Period
2 and 48.9% for Period 3. The results demonstrate that the OLS model fits the study data
for three sub-periods.
Table 4.10: ROE Models Using OLS for Three Periods—Periods 1, 2 and 3
Model Period 1 (2006–2007)
Period 2 (2009–2010)
Period 3 (2013–2014)
Estimate p-value Estimate p-value Estimate p-value
(Constant) 0.841 0.688 1.130 0.499 1.590 0.390
BS 0.092 0.358 0.180 0.024 0.046 0.457
BCOM ˗0.035 0.001 ˗0.005 0.505 ˗0.013 0.060
BM 0.340 0.046 0.380 0.003 0.116 0.166
BMED 0.007 0.504 ˗0.012 0.181 ˗0.003 0.730
BMEX ˗0.035 0.409 ˗0.107 0.001 ˗0.029 0.270
ACS ˗0.523 0.058 ˗0.038 0.874 0.042 0.874
ACCOM 0.010 0.239 0.001 0.988 0.015 0.049
ACM 0.344 0.068 0.272 0.016 0.407 < 0.001
ACED 0.039 < 0.001 0.030 < 0.001 0.020 < 0.001
LEV 0.011 0.184 0.003 0.569 0.004 0.517
FA ˗0.007 0.648 0.025 0.073 ˗0.010 0.425
FS 0.210 0.370 ˗0.282 0.147 0.157 0.365
R-squared 0.502 0.417 0.489
F-test (ANOVA) 6.300 4.710 6.460
p-value (F-test) < 0.001 < 0.001 < 0.001
Note: BS = board size, BCOM = board composition, BM = board meetings, BMED = board members’ education, BMEX = board members’ experience, ACS = number of members in the committee, ACCOM = audit committee composition, ACM = audit committee meeting, ACED = audit committee members’ education, LEV = leverage, FA = firm age, FS = firm size.
The results for board characteristics and ROE show no significant relationship between
ROE and BS for Periods 1 and 3; however, Period 2 is significant and positive. The
association between ROE and BCOM is negative for all periods, with Periods 1 and 3

121
being significant. For BM, there is a significant and positive relationship for Periods 1
and 2, while BMED displays no significant relationships for all three periods. The
association between ROE and BMEX is negative for all periods, but is only significant
for Period 2.
In regard to the relationship between audit committee characteristics and ROE, the result
shows a significant and negative relationship between ROE and ACS for Period 1, while
the association between ROE and ACCOM is significant and positive for Period 3. For
the variables ACM and ACED, there is a significant and positive effect on ROE for all
three periods. The results will be discussed in Section 4.9.
4.7.1.3 Effects of Tobin’s Q Model
The results for the Tobin’s Q model are displayed in Table 4.11 overleaf and indicate that
the estimated equation is significant, and the test did not indicate any problems with the
estimates.
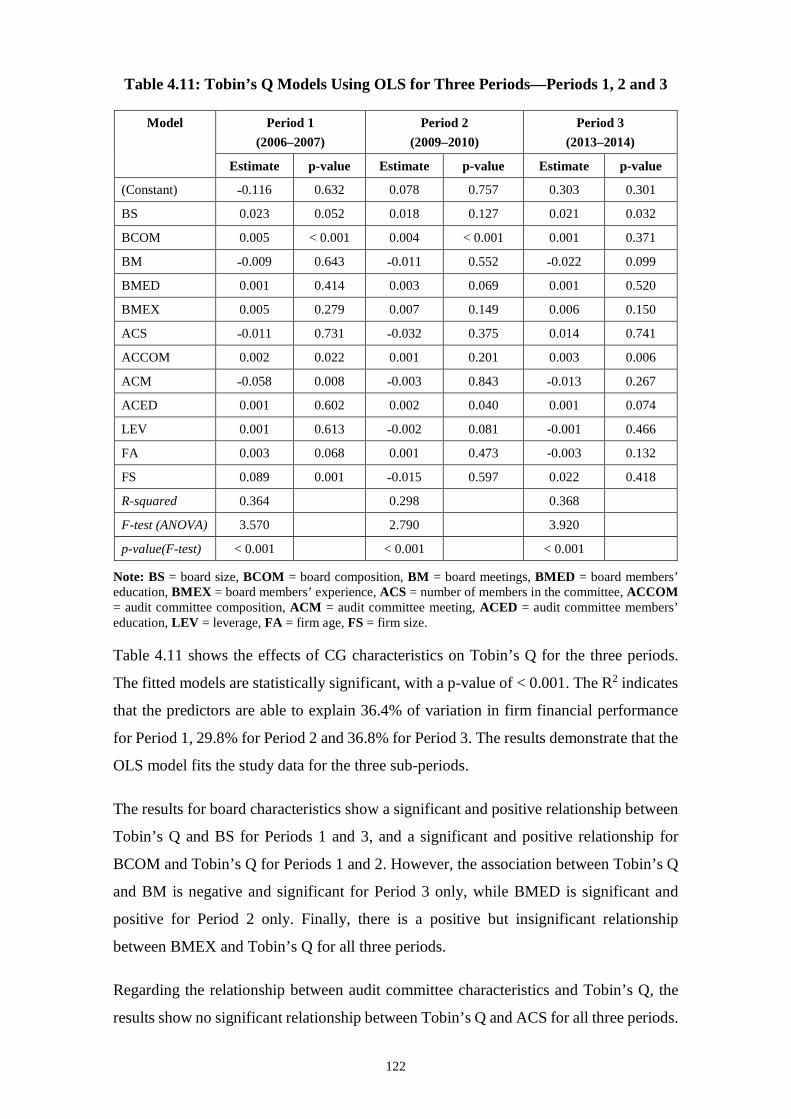
122
Table 4.11: Tobin’s Q Models Using OLS for Three Periods—Periods 1, 2 and 3
Model Period 1 (2006–2007)
Period 2 (2009–2010)
Period 3 (2013–2014)
Estimate p-value Estimate p-value Estimate p-value
(Constant) ˗0.116 0.632 0.078 0.757 0.303 0.301
BS 0.023 0.052 0.018 0.127 0.021 0.032
BCOM 0.005 < 0.001 0.004 < 0.001 0.001 0.371
BM ˗0.009 0.643 ˗0.011 0.552 ˗0.022 0.099
BMED 0.001 0.414 0.003 0.069 0.001 0.520
BMEX 0.005 0.279 0.007 0.149 0.006 0.150
ACS ˗0.011 0.731 ˗0.032 0.375 0.014 0.741
ACCOM 0.002 0.022 0.001 0.201 0.003 0.006
ACM ˗0.058 0.008 ˗0.003 0.843 ˗0.013 0.267
ACED 0.001 0.602 0.002 0.040 0.001 0.074
LEV 0.001 0.613 ˗0.002 0.081 -0.001 0.466
FA 0.003 0.068 0.001 0.473 -0.003 0.132
FS 0.089 0.001 ˗0.015 0.597 0.022 0.418
R-squared 0.364 0.298 0.368
F-test (ANOVA) 3.570 2.790 3.920
p-value(F-test) < 0.001 < 0.001 < 0.001
Note: BS = board size, BCOM = board composition, BM = board meetings, BMED = board members’ education, BMEX = board members’ experience, ACS = number of members in the committee, ACCOM = audit committee composition, ACM = audit committee meeting, ACED = audit committee members’ education, LEV = leverage, FA = firm age, FS = firm size.
Table 4.11 shows the effects of CG characteristics on Tobin’s Q for the three periods.
The fitted models are statistically significant, with a p-value of < 0.001. The R2 indicates
that the predictors are able to explain 36.4% of variation in firm financial performance
for Period 1, 29.8% for Period 2 and 36.8% for Period 3. The results demonstrate that the
OLS model fits the study data for the three sub-periods.
The results for board characteristics show a significant and positive relationship between
Tobin’s Q and BS for Periods 1 and 3, and a significant and positive relationship for
BCOM and Tobin’s Q for Periods 1 and 2. However, the association between Tobin’s Q
and BM is negative and significant for Period 3 only, while BMED is significant and
positive for Period 2 only. Finally, there is a positive but insignificant relationship
between BMEX and Tobin’s Q for all three periods.
Regarding the relationship between audit committee characteristics and Tobin’s Q, the
results show no significant relationship between Tobin’s Q and ACS for all three periods.
123
The association between Tobin’s Q and ACCOM is positive in all periods and is
significant for Periods 1 and 3. The association between Tobin’s Q and ACM is negative
in all three periods, but is only significant for Period 1, while ACED is positively
associated with Tobin’s Q in all periods and is significant for Periods 2 and 3. The results
will be discussed in Section 4.8.
4.7.2 Analysis of Variance
The ANOVA test has long been an important tool for researchers conducting studies on
multiple experimental groups (Bijalwan & Madan 2013; Fitrijanti & Alamanda 2013;
Mizuno 2014). However, ANOVA cannot provide detailed information on differences
among the various study groups, or on complex combinations of study groups. Thus, a
multiple comparison analysis test is conducted to fully understand group differences in
an ANOVA. This study uses the post-hoc Tukey HSD test in a multiple comparison
analysis statistic.
In this study, comparisons of the mean values of board and audit committee
characteristics and the financial performance of the UAE listed companies are tested to
determine any significant changes in CG practices during the three selected periods.
Specifically, one-way ANOVA and multiple comparison analysis (Tukey’s HSD) are
conducted to examine the difference between the groups by classifying the periods into
three groups in accordance with the changes in UAE CG codes.
4.7.2.1 One-way Analysis of Variance
A one-way ANOVA is employed to compare the difference between the means of the
dependent and independent variables in the three periods. Table 4.12 shows the results.
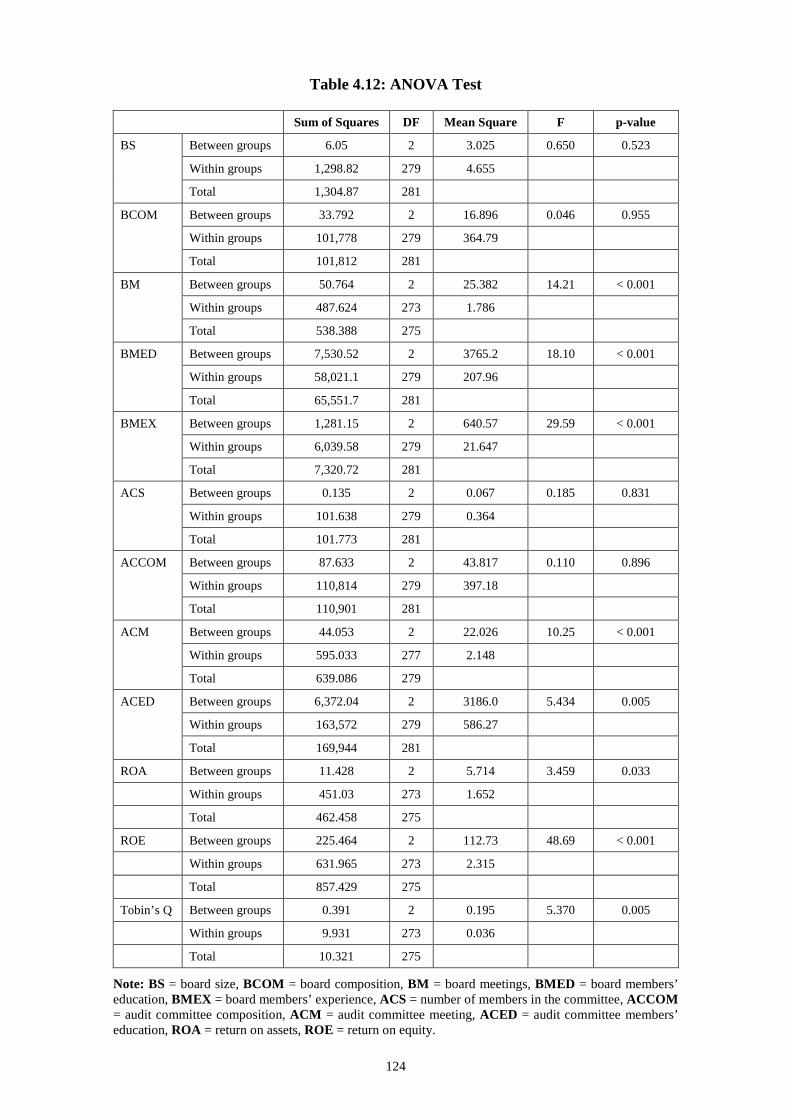
124
Table 4.12: ANOVA Test
Sum of Squares DF Mean Square F p-value
BS Between groups 6.05 2 3.025 0.650 0.523
Within groups 1,298.82 279 4.655
Total 1,304.87 281
BCOM Between groups 33.792 2 16.896 0.046 0.955
Within groups 101,778 279 364.79
Total 101,812 281
BM Between groups 50.764 2 25.382 14.21 < 0.001
Within groups 487.624 273 1.786
Total 538.388 275
BMED Between groups 7,530.52 2 3765.2 18.10 < 0.001
Within groups 58,021.1 279 207.96
Total 65,551.7 281
BMEX Between groups 1,281.15 2 640.57 29.59 < 0.001
Within groups 6,039.58 279 21.647
Total 7,320.72 281
ACS Between groups 0.135 2 0.067 0.185 0.831
Within groups 101.638 279 0.364
Total 101.773 281
ACCOM Between groups 87.633 2 43.817 0.110 0.896
Within groups 110,814 279 397.18
Total 110,901 281
ACM Between groups 44.053 2 22.026 10.25 < 0.001
Within groups 595.033 277 2.148
Total 639.086 279
ACED Between groups 6,372.04 2 3186.0 5.434 0.005
Within groups 163,572 279 586.27
Total 169,944 281
ROA Between groups 11.428 2 5.714 3.459 0.033
Within groups 451.03 273 1.652
Total 462.458 275
ROE Between groups 225.464 2 112.73 48.69 < 0.001
Within groups 631.965 273 2.315
Total 857.429 275
Tobin’s Q Between groups 0.391 2 0.195 5.370 0.005
Within groups 9.931 273 0.036
Total 10.321 275
Note: BS = board size, BCOM = board composition, BM = board meetings, BMED = board members’ education, BMEX = board members’ experience, ACS = number of members in the committee, ACCOM = audit committee composition, ACM = audit committee meeting, ACED = audit committee members’ education, ROA = return on assets, ROE = return on equity.

125
There were significant differences between the mean values of the following independent
variables: BM, BMED, BMEX, ACM and ACED. In addition, all three firm financial
performance measures showed significant differences within their respective means over
the three identified periods. Thus, from an overall perspective, changes to the CG codes
seem to have affected the CG characteristics and financial performance of UAE listed
firms. However, as stated previously, the ANOVA test does not indicate which pairs of
means are significantly different. To identify this, a post hoc Tukey test is performed.
4.7.2.2 Multiple Comparisons (Tukey’s Honestly Significant Difference)
This research employs a post hoc Tukey HSD test to determine whether there are any
statistically significant differences between the means of CG characteristics and firm
financial performance variables. The results are presented in Table 4.13, while Appendix
3 presents the full results, which include duplication.
Table 4.13: Multiple Comparisons (Tukey’s HSD)
Period (i) Period (j) Mean Difference (i-j)
Std Error
p-value
BS Period 2 Period 1 0.043 0.315 0.990
Period 3 Period 1 0.330 0.315 0.547
Period 2 0.287 0.315 0.633
BCOM Period 2 Period 1 ˗0.058 2.785 0.999
Period 3 Period 1 0.703 2.785 0.966
Period 2 0.762 2.785 0.960
BM Period 2 Period 1 0.313 0.198 0.256
Period 3 Period 1 1.026** 0.198 < 0.001
Period 2 0.713** 0.195 < 0.001
BMED Period 2 Period 1 4.536 2.103 0.081
Period 3 Period 1 12.500** 2.103 < 0.001
Period 2 7.965** 2.103 < 0.001
BMEX Period 2 Period 1 2.546** 0.679 < 0.001
Period 3 Period 1 5.220** 0.679 < 0.001
Period 2 2.675** 0.679 < 0.001
ACS Period 2 Period 1 0.032 0.088 0.930
Period 3 Period 1 0.053 0.088 0.818
Period 2 0.021 0.088 0.968
ACCOM Period 2 Period 1 ˗0.218 2.907 0.997
Period 3 Period 1 ˗1.276 2.907 0.899
Period 2 ˗1.057 2.907 0.930

126
Period (i) Period (j) Mean Difference (i-j)
Std Error
p-value
ACM Period 2 Period 1 0.493 0.215 0.058
Period 3 Period 1 0.968** 0.214 < 0.001
Period 2 0.475 0.215 0.071
ACED Period 2 Period 1 ˗0.217 3.531 0.998
Period 3 Period 1 9.973* 3.531 0.014
Period 2 10.190* 3.531 0.012
ROA Period 2 Period 1 ˗0.247 0.190 0.397
Period 3 Period 1 0.245 0.190 0.404
Period 2 0.493* 0.187 0.024
ROE Period 2 Period 1 ˗0.034 0.225 0.987
Period 3 Period 1 1.889** 0.225 < 0.001
Period 2 1.923** 0.221 < 0.001
Tobin’s Q Period 2 Period 1 0.005 0.028 0.980
Period 3 Period 1 0.082* 0.028 0.011
Period 2 0.076* 0.027 0.017
** Mean difference is significant at the 0.01 level. * Mean difference is significant at the 0.05 level.
Note: BS = board size, BCOM = board composition, BM = board meetings, BMED = board members’ education, BMEX = board members’ experience, ACS = number of members in the committee, ACCOM = audit committee composition, ACM = audit committee meeting, ACED = audit committee members’ education, ROA = return on assets, ROE = return on equity, Period 1 = 2006-2007, Period 2 = 2009-2010, Period 3 = 2013-2014.
4.7.2.2.1 Board Size
Board size (BS) comprises the number of directors on the board. The above results show
that there are no statistically significant differences between the time periods, which
implies that no significant changes occurred between the means of the numbers of
directors on the boards for listed companies in the UAE over the sub-periods. This
suggests that the implementation of the code was more about formalising and codifying
existing arrangements.
4.7.2.2.2 Board Composition
Board composition (BCOM) comprises the proportion of independent directors on the
board. The findings show no statistically significant differences between the means of the
board composition variable over the sub-periods. This finding suggests that the shift from
a voluntary to mandatory code did not materially affect board composition, which implies
that the firms in the sample period were following the first code and second code, which
stipulated that the board should comprise at least one-third of independent directors.
127
4.7.2.2.3 Board Meetings
Board meetings (BM) represent the number of meetings held per year. There is a
significant difference of means for Period 3, which encompasses the second CG code.
The recommendations in the first and second CG codes are fairly similar, as both expect
meetings to be held at least once every two months. Thus, the results suggest that firms
in the sample data were not adhering to the first CG code, and that the move to make the
second CG code mandatory had the effect of causing significantly more firms to follow
the stipulation. This will be discussed further in Section 4.9.
4.7.2.2.4 Board Members’ Education
There are statistically significant differences in the level of board members’ education
(BMED), which imply that there was a significant difference in the number of directors
who studied in foreign developed countries between the sub-periods. Hence, the change
to the governance rules caused significant changes to BMED within the listed companies.
This will be discussed further in Section 4.9.
4.7.2.2.5 Board Members’ Experience
Board members’ experience (BMEX) comprises the average number of years of
experience of board members. The Tukey post hoc test results show statistically
significant differences between means for all sub-periods. The study results suggest that
the second CG code emphasis on improving experience by having board members
undertake training to better understand company policies, structure and duties under law
has resulted in a positive effect among UAE listed firms. This will be further discussed
in Section 4.9.
4.7.2.2.6 Audit Committee Size
Audit committee size (ACS) relates to the number of members on the audit committee. A
Tukey post hoc test revealed no statistically significant mean differences over the three
periods. This implies that the changes to the CG codes have not led to any significant
changes to the ACS of UAE listed companies.
4.7.2.2.7 Audit Committee Composition
Audit committee composition (ACCOM) relates to the proportion of independent
members on the audit committee. The second CG code required at least one independent
128
member on the audit committee, while the first CG code did not state anything on this
matter. The Tukey post hoc test revealed no significant difference in the means of the
proportion of independent directors on the audit committees of UAE listed companies
between the three selected periods.
4.7.2.2.8 Audit Committee Meeting
Audit Committee meeting (ACM) comprises the number of meetings held per year. The
Tukey test for a statistically significant difference between the means of the ACM
variable over the selected periods was significant. Hence, although the wording of this
specific CG code did not change much, the fact that the first CG code was voluntary,
while the second CG code was mandatory, suggests that this could be the reason for the
significant change that resulted in increased ACM among the UAE listed companies.
4.7.2.2.9 Audit Committee Members’ Education
A Tukey post hoc test revealed statistically significant differences between the audit
committee members’ education (ACED) periods due to the onset of the second CG code.
Specifically, it resulted in a significant difference in the ratio of number of audit
committee members holding a degree in a financial discipline to the total members in the
committee over the selected periods. The findings for audit committee characteristic
changes and changes in the CG code are further discussed in Section 4.9.
4.7.2.2.10 Firm Financial Performance Variables
Firm financial performance comprises three measures: ROA, ROE and Tobin’s Q. The
Tukey post hoc test revealed differences in the financial parameters across the selected
periods. The results showed statistically significant findings for ROA, ROE and Tobin’s
Q after the adoption of the second CG code. Specifically, there was a significant increase
in ROA in Period 3 compared with Period 2, while ROE experienced a significant
increase in Period 3 compared with Periods 1 and 2. The result of the Tukey post hoc test
also showed a significant increase in Tobin’s Q in Period 3, compared with Periods 1 and
2. The significant results for all three firm financial performance measures showed
positive outcomes, thereby suggesting that changes to the second CG code had a positive
effect on the financial performance of UAE listed companies.

129
4.8 Discussion of Research Objective 1 for All Models
This section discusses the results of the panel data model that was used to examine the
relationship between the CG characteristics and firm financial performance of listed UAE
firms for the period 2006 to 2015. Table 4.14 below presents a summary of the results for
the study hypotheses. The present study developed nine hypotheses that were applied to
each of the firm financial performance measures.
The effects of board of directors and audit committee characteristics on ROA and ROE
were the same, while the results for Tobin’s Q model were slightly different (see Table
4.14). Five board characteristics had the same effect on ROA and ROE, one of which
(board size) had the same effect for all three financial performance measures. Thus, there
were differences between Tobin’s Q compared with both ROA and ROE for the
remaining four board characteristics of board composition, board meetings, board
members’ education and board members’ experience. In fact, of these four, three (board
composition, board meetings and board members’ experience) had different directional
effects. This is partly attributable to the fact that ROA and ROE are accounting-based
measures, which are backwards-looking (Shan & McIver 2011), whereas Tobin’s Q is a
market-based measure and is an indication of the (share) market expectation of the firm’s
financial performance (Almatari, Alswidi & Fadzil 2014c).

130
Table 4.14: Summary of Hypotheses Tests for All Models
Financial Performance
Hypothesis ROA ROE Tobin’s Q
H1: Board size is positively related to firm financial performance.
Pos, Sig Pos, Sig Pos, Sig
H2: Board composition is positively related to firm financial performance.
Neg, Sig Neg, Sig Pos, Sig
H3: Board meetings are positively related to firm financial performance.
Pos, Sig Pos, Sig Neg, Insig
H4: Board members’ education is positively related to firm financial performance.
Pos, Insig Pos, Insig Pos, Sig
H5: Board members’ experience is positively related to firm financial performance.
Neg, Insig Neg, Insig Pos, Sig
H6: Audit committee size is positively related to firm financial performance.
Neg, Insig Neg, Sig Pos, Insig
H7: Audit committee composition is positively related to firm financial performance.
Pos, Sig Pos, Insig Pos, Sig
H8: Audit committee meetings are positively related to firm financial performance.
Pos, Sig Pos, Sig Neg, Insig
H9: Audit committee members’ education is positively related to firm financial performance.
Pos, Sig Pos, Sig Pos, Sig
Note: Pos = positive, Neg = negative, Sig = significant, Insig = insignificant.
With respect to the four audit committee characteristics, two variables (audit committee
meetings and audit committee members’ education) were significant, while, for the other
two variables, audit committee size was significant for ROE, while audit committee
composition was significant for ROA. With respect to Tobin’s Q, two variables (audit
committee composition and audit committee members’ education) were significant, with
the latter variable in keeping with the ROA and ROE result. Two other variables (audit
committee size and audit committee meetings) had different directional effects compared
to ROA and ROE. The audit committee composition variable showed the same outcome
as the ROA model. The two differences in significance between ROA and ROE for audit
committee characteristics is unsurprising because, as indicated by Rappaport (1986);
Finegan (1991); and Koller Goedhart and Wessels (1996), the two financial performance
measures have different focuses.
A number of prior CG studies have also found different results using the same three
measures of firm financial performance, as demonstrated by Dincer and Oguz (2016);
Rouf (2014); Silwal (2016); Palaniappan (2017); Amer, Ragab and Shehata (2014);
Khatab et al. (2011); Daramadi (2013); Suadiye (2017); Chang-Jui (2011) and Teh et al.
(2016). For example, Suadiye (2017) found that board composition (independent

131
directors) had a significant negative effect for Tobin’s Q, an insignificant negative effect
for ROA and a positive relationship with ROE. The following subsections discuss the
results of Research Objective 1 for board and audit committee characteristics.
4.8.1 Board Size
Prior empirical studies have argued that firms benefit from having larger boards for
monitoring, strategy and resources, while other empirical studies have found that smaller
boards improve firm financial performance. The present study found that board size had
a significant positive effect on all proxies of firm financial performance (ROA, ROE and
Tobin’s Q). These findings indicate that large board sizes do contribute to firm financial
performance. This is probably due to the communication and coordination among firm
directors on the board in the UAE, which increase their ability to monitor and evaluate
executive managers, thereby implying that a large board size is associated with higher
financial performance among UAE listed companies.
The study findings support agency theory and resource dependence theory that larger
board sizes seem to be more effective than smaller ones. As stated by Goodstein, Gautam
and Boeker (1994) and Mintzberg (1983), smaller boards have the potential to increase
uncertainty concerning strategic development, which can hinder firm financial
performance. The second CG code identifies that boards should have at least three
members and up to a maximum of 15 members. This edict aligns with suggestions by
Brown and Caylor (2004) and Fauzi and Locke (2012), who ‘cap’ board size at 15 to
ensure well-functioning boards. The results of the present research are supported by
earlier studies (Almatari, Alswidi & Fadzil 2014b; Coles et al. 2008; Johl, Kaur & Cooper
2015; Kajola 2008; Klein 2002). In conclusion, the results of this study support the
hypothesis that a larger board size can lead to the improved financial performance of UAE
listed companies.
4.8.2 Board Composition
Board composition is defined as the proportion of independent directors represented on
the board. The results from the present research were mixed among the different
performance measurements. While the relationship was significant and negative between
market-based measured board composition and the accounting-based measures (ROA and
ROE), it had a significant and positive relationship with Tobin’s Q.

132
The ROA and ROE result is generally consistent with some previous studies (Ghabayen
2012; Kiel & Nicholson 2003), although it is inconsistent with predictions from agency
theory, where a majority of independent directors on the board would be expected to
enhance a firm’s effectiveness and provide superior performance (Dalton et al. 1998).
With respect to Tobin’s Q, the result implies that increasing the proportion of independent
directors on the board leads to increased firm financial performance. This result is
supported by other previous studies, such as those by O’Connell and Cramer (2010) and
Aamir and Sajid (2012).
A possible reason for the differences between market-based Tobin’s Q and the
accounting-based measures could be their fundamental differences. It is possible that the
implementation of the CG code as it relates to board composition has enhanced
confidence and the market participants expect a positive impact on firm value. This can
be interpreted as a market endorsement of the policy.
The findings of ROA and ROE support the argument that companies may include
independent directors on the board for legitimacy purposes, rather than for improvement
of firm financial performance (DiMaggio & Powell 2004). In other words, a possible
reason for the negative effect on ROA and ROE for UAE listed firms could be because
the increase in proportion of independent board members occurred to strictly comply with
the law. Another possible reason could be the insufficient knowledge held by independent
directors, which did not translate to increased firm financial performance. In addition, the
role of independent directors in UAE listed firms is still open to debate because of a lack
of clarification regarding what independent directors’ main role should be (Altamimi &
Charif 2012).
4.8.3 Board Meetings
Board meetings relate to the number of board meetings held in a year. The second UAE
CG code stated that the board must disclose the number of meetings held in a year and
details of the attendance of each individual director at the meetings held. Although the
first and second CG codes did not appear to change in terms of identifying the number of
meetings each year, the first UAE CG code was voluntary, while the second CG code was
mandatory for all listed companies in the UAE. This suggests that the mandatory
component has resulted in more board meetings and higher attendance.

133
The present research results indicated that board meetings had a significant and positive
effect on ROA and ROE, which suggests that more board meetings led to higher financial
performance of the UAE listed companies. This finding aligns with agency theory and is
supported by previous studies by Ntim and Oseit (2011) and Tarak, Nath and Apu (2013).
However, increasing the number of board meetings had an insignificant influence on
Tobin’s Q, which is supported by Evans, Evans and Loh (2002). A possible reason for
the negative effect of board meetings on firm financial performance, as measured by
Tobin’s Q, is that the market-based measure incorporates the outcomes of current
business strategy, as well as the market expectations of a firm’s future performance
(Demsetz & Villalonga 2001).
4.8.4 Board Members’ Education
Board members’ education is an important CG characteristic. According to resource
dependence theory, education is an external resource that should lead to enhanced firm
financial performance (Pfeffer & Salancik 2003). The results of the accounting-based
measures (ROA and ROE) were not significant, which is supported by an earlier study
by Vo and Phan (2013) conducted in Vietnam. These researchers also found no significant
relationship between the education level of board members and the performance of
Vietnamese firms. However, when Tobin’s Q was employed in the present research as
the dependent variable, it indicated that board members’ education was significant and
positively related to Tobin’s Q. Prior empirical studies that support this finding include
those by Gottesman and Morey (2006); Darmadi (2013); Ondersteijn, Giesen and Huirne
(2003); and Wilson, Hadley and Asby (2001). This seems to imply that the UAE market
perceives firms hiring board members with superior educational qualifications as an
indication/expectation of positive future financial performance.
From an accounting-based perspective, it seems that board members holding educational
qualifications from developed-country universities is a positive but not significant factor
for the financial performance of UAE listed firms. This view is supported by Darmadi
(2013) and Vo and Phan (2013). Since resource dependence theory states that education
is an external resource that enhances the financial performance of firms (Pfeffer &
Salancik 2003), this suggests that the role of board members’ education—particularly for
the financial performance of UAE firms—remains inconclusive.
134
4.8.5 Board Members’ Experience
According to Wu (2009), a good board of directors consists of members with different
backgrounds. Different backgrounds and experiences include accounting experience and
marketing experience, as well as other experience that can benefit the firm. The present
research found that board members’ education had an insignificant effect on the
accounting-based measures of firm value (ROA and ROE), but a significant and positive
effect on the market-based measure (Tobin’s Q).
Although there have been conflicting views on the relationship between board members’
level of experience and firms’ performance, resource dependence theory postulates that
board members with various experiences, skills, knowledge and expertise will result in
good corporate performance and positively affect firm financial performance (Pfeffer &
Salancik 2003). Given this, the market-based measure of Tobin’s Q supports this
assertion. With respect to the non-significant outcome for the accounting-based measures,
a possible reason for this result is that the UAE CG codes did not state the level of
experience that the members should hold. Although very little empirical research has been
undertaken in this area, this view is supported by Johl (2006). Thus, boards need to ensure
they have a suitable mix of members with appropriate skills and experience to cope with
business complexities, competition and change.
4.8.6 Audit Committee Size
According to Wild (1996), the main objective of the audit committee is to help the board
provide oversight and monitor the firm financial statements, including the financial
reporting process, audit process and compliance with laws and regulations. As a
subcommittee of the board, the audit committee provides an important function by
enhancing information quality, which results in increased financial performance of the
firm (Pincus, Rusbarsky & Wong 1989). In terms of audit committee size, the results of
this study were mixed among the different performance measurements. The relationship
was significant and negative for ROE, while the other two measures had non-significant
results.
One possible reason for the significant result for ROE could be due to a lack of
communication and coordination among firm audit committee members in the UAE,
which reduces their ability to monitor financial performance. This result is consistent with
Kyereboah-Coleman’s (2008) study, which found that a larger committee size led to poor
135
financial performance, since small committee sizes are more cost-effective, are able to
meet more regularly and have greater communication among members, which can lead
to improved firm financial performance.
Another possible reason for the result could be the lack of a specific description and
specification of the number of audit committee members in the UAE CG code, which
only recommended having at least three members on the committee. This code was not
uniformly followed, as some UAE forms only had two members (see Table 4.2).
Although no ideal size for an audit committee exists, the overriding concern is for the
committee to effectively operate as a team to monitor firm financial performance. Thus,
it is unsurprising that this research produced mixed results.
4.8.7 Audit Committee Composition
Audit committee composition refers to the proportion of independent members compared
with the total members in the committee. The present research found that audit committee
composition had a significant and positive effect on the ROA and Tobin’s Q measures,
while the ROE model demonstrated an insignificant and positive relationship with audit
committee composition.
One possible reason for the non-significant effect of audit committee composition on
ROE is that the ROE indicator measured the effectiveness of UAE firms taking advantage
of their equity base. That is, it indicated how effectively a company used its shareholders’
money (Almatari, Alswidi & Fadzil 2014c). Thus, it would seem that audit committee
members of UAE listed firms are less effective in taking advantage of their earnings
advantage from their equity base, as opposed to taking earnings advantage of their base
of assets. The findings of the ROA and Tobin’s Q models support agency theory, which
posits that independent members on the audit committee would help the owners to
monitor management activities to increase firm financial performance.
This study shows that an increased number of independent members on the audit
committee leads to enhanced financial performance of UAE listed firms, as measured by
ROA and Tobin’s Q. Prior studies support these findings. For example, Yasser, Entebang
and Mansor (2011) investigated the relationship between audit committee composition
and firm financial performance on listed firms in Karachi, and found that audit committee
composition was positively associated with firm financial performance. A similar result
was obtained by Ilaboya and Obaretin’s (2015) Nigerian study, which found that
136
independent audit committee members could improve the oversight function of the
committee, which could lead to improved firm financial performance.
4.8.8 Audit Committee Meetings
Audit committee meetings refer to the number of meetings held by the committee each
year. The present research demonstrated a significant and positive relationship between
audit committee meetings and the accounting-based measures (ROA and ROE) in the
UAE, yet found no relationship between audit committee meetings and firm financial
performance via the market value measure (Tobin’s Q). Thus, an increase in the number
of audit committee meetings improves the ROA or ROE of the firm, but is insignificant
for Tobin’s Q.
The different foci of the accounting-based measure versus the market-based measures
imply that a possible reason that audit committee meetings had a negative yet
insignificant effect via the Tobin’s Q model could be due to the audit committee focus.
Specifically, the charter of the audit committee is biased towards past performance
indicators and not towards future-looking expectations of market-based growth.
In addition, since the UAE CG codes have not specified a maximum number of annual
audit committee meetings, the mandatory nature of the second CG code could have
increased the number of meetings, which may have led to increased costs associated with
it, such as travel expenses and meeting fees, which can also negatively affect firm
financial performance, as stated by prior studies (e.g., Stewart & Kent 2006). Stewart and
Kent (2006) found a positive relationship between the amount of audit fees paid and the
frequency of audit committee meetings. This result from their study implied that audit
committees that meet more frequently pay more audit fees, and thereby negatively affect
firm financial performance (Malhotra et al. 2015). This result is contrary to agency theory
expectations.
Consequently, the findings of ROA and ROE in this study strongly support the agency
theory view, which states that a high level of committee activities, such as meetings, leads
to better monitoring of the firm financial activities and improved financial performance.
The result is supported by prior studies, such as those by Hsu (2010) and Almatari,
Alswidi and Fadzil (2014b).
137
4.8.9 Audit Committee Members’ Education
Audit committee members’ education refers to the type of educational background of the
audit committee members. The present research found that audit committee members’
education had a significant and positive effect on all proxies of firm financial performance
(ROA, ROE and Tobin’s Q). These findings indicate that audit members with an
accounting or financial background and knowledge lead to improved financial
performance of UAE listed companies.
This result is supported by previous studies. For example, Yang and Krishnan (2005)
found that audit committees with a member with financial knowledge could significantly
reduce the incidents of internal control problems, which could improve the firm financial
performance. Other previous studies supporting these findings include those by Aldamen
et al. (2012) and Almatari, Alswidi and Fadzil (2014a).
The study findings support resource dependence theory, which states that members with
a reasonable financial background are more effective in providing more monitoring to
control system mechanisms and firm financial performance. With respect to the UAE, the
result supports changes to the CG code, which stated, in regard to members’ education,
that the audit committee should have at least one member with a financial qualification
or an expert in accounting and financial affairs.
4.9 Discussion of Research Objective 2
This study employed comparative analyses to investigate the changes occurring in the
relationship between board and audit committee characteristics and firm financial
performance between the periods of 2006 to 2007, 2009 to 2010 and 2013 to 2014. The
study tested three financial performance models for the UAE: (i) the accounting-based
measure of ROA; (ii) the accounting-based measure of ROE; and (iii) the market-based
measure of Tobin’s Q. The results are presented in Table 4.15 below.
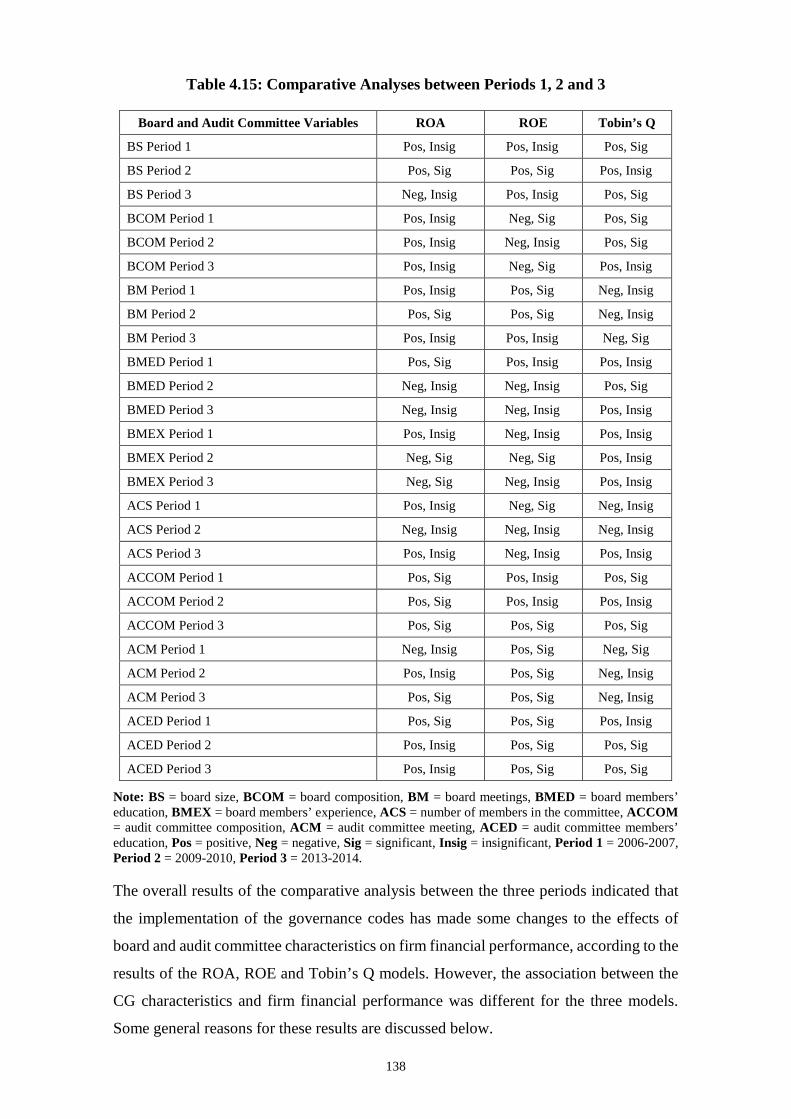
138
Table 4.15: Comparative Analyses between Periods 1, 2 and 3
Board and Audit Committee Variables ROA ROE Tobin’s Q
BS Period 1 Pos, Insig Pos, Insig Pos, Sig
BS Period 2 Pos, Sig Pos, Sig Pos, Insig
BS Period 3 Neg, Insig Pos, Insig Pos, Sig
BCOM Period 1 Pos, Insig Neg, Sig Pos, Sig
BCOM Period 2 Pos, Insig Neg, Insig Pos, Sig
BCOM Period 3 Pos, Insig Neg, Sig Pos, Insig
BM Period 1 Pos, Insig Pos, Sig Neg, Insig
BM Period 2 Pos, Sig Pos, Sig Neg, Insig
BM Period 3 Pos, Insig Pos, Insig Neg, Sig
BMED Period 1 Pos, Sig Pos, Insig Pos, Insig
BMED Period 2 Neg, Insig Neg, Insig Pos, Sig
BMED Period 3 Neg, Insig Neg, Insig Pos, Insig
BMEX Period 1 Pos, Insig Neg, Insig Pos, Insig
BMEX Period 2 Neg, Sig Neg, Sig Pos, Insig
BMEX Period 3 Neg, Sig Neg, Insig Pos, Insig
ACS Period 1 Pos, Insig Neg, Sig Neg, Insig
ACS Period 2 Neg, Insig Neg, Insig Neg, Insig
ACS Period 3 Pos, Insig Neg, Insig Pos, Insig
ACCOM Period 1 Pos, Sig Pos, Insig Pos, Sig
ACCOM Period 2 Pos, Sig Pos, Insig Pos, Insig
ACCOM Period 3 Pos, Sig Pos, Sig Pos, Sig
ACM Period 1 Neg, Insig Pos, Sig Neg, Sig
ACM Period 2 Pos, Insig Pos, Sig Neg, Insig
ACM Period 3 Pos, Sig Pos, Sig Neg, Insig
ACED Period 1 Pos, Sig Pos, Sig Pos, Insig
ACED Period 2 Pos, Insig Pos, Sig Pos, Sig
ACED Period 3 Pos, Insig Pos, Sig Pos, Sig
Note: BS = board size, BCOM = board composition, BM = board meetings, BMED = board members’ education, BMEX = board members’ experience, ACS = number of members in the committee, ACCOM = audit committee composition, ACM = audit committee meeting, ACED = audit committee members’ education, Pos = positive, Neg = negative, Sig = significant, Insig = insignificant, Period 1 = 2006-2007, Period 2 = 2009-2010, Period 3 = 2013-2014.
The overall results of the comparative analysis between the three periods indicated that
the implementation of the governance codes has made some changes to the effects of
board and audit committee characteristics on firm financial performance, according to the
results of the ROA, ROE and Tobin’s Q models. However, the association between the
CG characteristics and firm financial performance was different for the three models.
Some general reasons for these results are discussed below.

139
A possible reason for obtaining these different relationships is that the properties of
accounting measures are different to market measures. Although ROE and ROA are both
measures for profitability, they focus on different aspects. For example, ROA illustrates
how successfully a firm uses its assets. Therefore, liquidity debt results in an increase in
ROA. However, there is no change in ROE for a similar company in the same situation,
as ROE takes debt into account (Loi & Khan 2012). The ROA measure gauges the
operating and financial performance of the firm (Haniffa & Hudaib 2006) and the failure
of UAE companies to use assets to serve the economic interests of their shareholders may
affect the ROA. In contrast, the ROE is a measure of profit, but is also used as a measure
of the efficient use by management in deploying shareholders’ equity (Almatari, Alswidi
& Fadzil 2014c; Veklenko 2016).
Tobin’s Q presents a firm’s expected future growth opportunities, which can stem from
factors both endogenous and exogenous to managerial decisions. The inconsistent
findings of the firm financial performance measures in the present research are similar to
many prior CG studies (see Amer, Ragab & Shehata 2014; Chang-Jui 2011; Darmadi
2013; Dincer & Oguz 2016; Khatab et al. 2011; Palaniappan 2017; Rouf 2014; Silwal
2016; Suadiye 2017; Teh et al. 2016). Although some CG studies used only one measure
of firm financial performance to reduce the possibility of obtaining mixed results (Coles
et al. 2008; Ghabayen 2012; Johl, Kaur & Cooper 2015; Mura 2007; Vafeas 1999;
Yermack 1996), the present research posits that this is a suboptimal approach to adopt,
given that, as evidenced above, different financial performance measures predict different
results. Hence, for reasons of robustness, multiple measures of firm financial performance
are required.
While the OLS regression indicated differences in the effects of board and audit
committee characteristics on firm financial performance, it could not provide detailed
information on how these differences occurred among the various study groups.
Specifically, it could not provide detailed information about which change to each
variable caused the changes in the relationship between board and audit committee
characteristics and firm financial performance. Hence, to better understand the
differences that occurred to each variable, the present research conducted post hoc tests.
A class of post hoc tests that enable this type of detailed information is multiple
comparison analysis tests. The most commonly used multiple comparison analysis
statistics is the Tukey test. The discussion of these results is presented below.

140
4.9.1 Board Size
The results in Table 4.15 shows that changes to the UAE CG codes had an impact on the
relationship between board size and firm financial performance for all three measures
(ROA, ROE and Tobin’s Q). Specifically, ROA changed to significant after the first CG
code adoption (Period 2) and to negative and insignificant after the adoption of the second
CG code (Period 3). ROE changed to significant after the first CG code (Period 2) and
then to insignificant after the second CG code (Period 3), while Tobin’s Q changed from
significant in period 1 to insignificant in period 2 and then significant after the second
CG code (Period 3). However, as Table 4.13 demonstrated, the results indicated that
board size was not significantly different over the three selected periods for UAE listed
companies. This suggests that there was no significant effect on board size by changing
the UAE CG codes from voluntary to mandatory.
A possible reason for changing the relationship between board size and firm financial
performance may relate to changes that occurred to ROA, ROE and Tobin’s Q. The
accounting-based performance indicator (ROA) increased after adopting the second CG
codes in 2010, while an increase in ROE and Tobin’s Q was evident from 2007. This
result may imply increase confidence among investors after adopting the first CG code,
which led to increased equity investment.
4.9.2 Board Composition
Table 4.15 shows that the changes to the UAE CG codes had some effect on the
relationship between board composition and firm financial performance for the ROE and
Tobin’s Q measures of financial performance, while the relationship with ROA remained
unchanged for all periods. With respect to ROE, firm financial performance became
insignificant after the first CG code (Period 2) and returned to significant after the second
CG code (Period 3), while, for Tobin’s Q, board composition’s effect on firm financial
performance became insignificant after the second CG code.
However, as Table 4.13 shows, board composition had no significant change on the UAE
listed companies in the sample as a result of changes to the UAE CG codes. This result
reflects the fact that: (i) the guidelines from the first to second CG codes did not change
(boards had to comprise at least one-third independent directors); and (ii) the move from
a voluntary to mandatory CG code had no real effect on board composition, which
suggests that most UAE listed firms were complying with the voluntary first CG code. A
141
possible factor changing the relationship between board composition and firm financial
performance could relate to changes that occurred to ROA, ROE and Tobin’s Q. Overall,
the changes of the governance codes had some effect on the relationship between board
composition and financial performance. However, this effect did not seem to affect the
proportion of independent directors on board, which could be due to having the right
balance of board composition by the UAE firm to reflect that companies have complied
with the governance code requirements.
4.9.3 Board Meetings
Table 4.15 indicates that changes to the UAE CG codes affected the relationship between
board meetings and firm financial performance for all three models: ROA, ROE and
Tobin’s Q. Board meetings significantly and positively affected ROA after implementing
the first CG code (Period 2), but became insignificant after the second CG code (Period
3), while ROE become insignificant after the second CG code. In addition, Tobin’s Q’s
effect on firm financial performance became significant, albeit negative, after the second
CG code. As Table 4.13 shows, board meetings significantly increased after the second
CG code.
A possible reason for the change in the relationship between board meetings and firm
financial performance could be due to the guidelines for the number of meetings held per
year. As Table 2.2 shows, both the first and second UAE CG codes stated that board
meetings should be set once or more every two months; however, there was no maximum
limit recommended by the codes. Some boards of directors in UAE companies had around
16 meetings per year, which could negatively affect the relationship between meetings
and performance because of the costs associated with board meetings, such as travel
expenses and meeting fees. This result aligns with Fich and Shivdasani (2006), who stated
that boards that meet more frequently ware valued less by the market. In addition, Lipton
and Lorsch (1992) stated that frequent meetings can lead to resources being channelled
towards less productive activities and thereby negatively affect firm financial
performance.
4.9.4 Board Members’ Education
Table 4.15 shows that changes to the UAE CG codes affected the relationship between
board members’ education and firm financial performance. The relationship changed
from significant and positive in the first period (pre CG code 1) to insignificant and

142
negative in the second and third periods for the ROA accounting-based measure.
Although the relationship remained insignificant throughout for ROE (the other
accounting-based measure), it changed from positive in the first period to negative in the
second and third periods. For the market-based measure (Tobin’s Q), the relationship was
positive for all three periods; however, it changed from an insignificant relationship in
Period 1 to significant in Period 2, and then back to insignificant in Period 3. The Tukey
test (see Table 4.13) indicated that board members’ education significantly increased in
Period 3 compared with other periods, thereby suggesting that board members’ education
increased after adopting the CG codes.
Although board members’ education is an important resource for the UAE to improve its
financial performance—and is typically proxied via education qualification to equate to
managerial quality—other factors might also need to be considered, such as managerial
skills, networks and other skills obtained outside of an educational qualification. This
could act as a basis for future studies.
4.9.5 Board Members’ Experience
The result of the OLS test showed no significant changes in the relationship between
board members’ experience and firm financial performance for Tobin’s Q. However for
ROA, firm financial performance became significant and negative for both Periods 2 and
3 as opposed to positive and insignificant in Period 1. While for ROE, all three periods
had a negative direction but it was significant for Period 2. The Tukey multiple
comparisons test indicated that board members’ experience increased after adopting the
first and second UAE CG codes.
The first UAE CG code suggested that directors should have experience and technical
skills in the best interests of the company, while the second UAE CG code stated that
board directors are required to be trained to gain more experience in understanding the
company’s policies, organisational structure and business, as well as their duties under
the law. In light of the results from the present research, the UAE CG code should specify
the required competencies of directors. According to Kikhia (2014), board members who
have financial expertise enhance the quality of oversight by the board. This enhanced
oversight may substitute increased auditor effort and reduce the auditor’s assessment of
controlled risk, thereby resulting in improved firm financial performance.

143
4.9.6 Audit Committee Size
Table 4.15 describes the findings obtained by the OLS test to determine the difference in
the relationship between the board audit committee size variable and firm financial
performance because of changes to the CG rules in the UAE. The result showed that
changes in the UAE CG code had an insignificant effect on the relationship between audit
committee size and firm financial performance for ROA and Tobin’s Q, while the
relationship with ROE was negative for all three periods, although only the first period
(pre CG code 1) was significant. The Tukey test indicated that audit committee size had
no significant change in the UAE listed companies because of changes to the UAE CG
codes.
According to the second UAE CG code, the audit committee should have at least three
members, with no maximum number recommended. Hence, a large audit committee size
could negatively affect the relationship between the committee and the firm’s financial
performance because of accompanying increases in audit fees and costs. Vafeas and
Waegelein (2007) supported this contention when they examined the relationship
between audit committee characteristics and audit fees. They found that audit committee
size and the proportion of members serving on the audit committee were positively related
to audit fees. Although the UAE CG rules prescribe a specific minimum audit committee
size, they should also specify a maximum number to avoid increasing audit fees, which
may negatively affect firm financial performance.
4.9.7 Audit Committee Composition
The results for audit committee composition in Table 4.15 show that the changes to the
UAE CG code had some effect on the relationship between audit committee composition
and firm financial performance. The results of the OLS test showed a positive relationship
between audit committee composition and firm financial performance for all three
models. Specifically, the ROA remained unchanged for all periods. With respect to ROE,
the relationship between audit committee composition and firm financial performance
was positive for all three periods; however, it was only significant for Period 3 (after
implementation of the second CG code). For Tobin’s Q, the effect of audit committee
composition on firm financial performance was positive for all three periods and
significant for Periods 1 and 3. The Tukey multiple comparisons test indicated that the
difference in means for the proportion of independent directors was not significant, which
implied that there was no significant difference in the proportion of independent directors

144
on the board for listed companies in the UAE between all three periods. Hence, the
changes to the governance rules caused no significant changes to audit committee
composition in the listed companies.
According to the UAE CG code (see Table 2.2), the audit committee must comprise one
independent member, which may improve the performance of the firm. According to
agency theory, an increase in the proportion of independent auditors on the committee
can lead to more correct decisions being made, which implies a positive relationship
between audit committee composition and firm financial performance. However, UAE
listed companies might increase independent elements in their audit committee merely to
show that they strictly comply with the law, and thus may not necessarily benefit in terms
of financial performance. This is a possible reason for the insignificant relationship
between audit committee composition and firm financial performance. In addition, the
experience held by independent audit committee members may be insufficient to monitor
board activities.
4.9.8 Audit Committee Meetings
The result of the OLS test showed that the CG codes appear to have affected the
relationship between audit committee meeting and firm financial performance as
measured by ROA and Tobin’s Q with ROE unchanged. Specifically, although Table 2.2
shows that both the first and second UAE CG codes stated that the audit committee should
meet at least once every three months, the change from voluntary to mandatory may have
caused an effect resulting in an increased number of meetings (see Table 4.13). The Tukey
multiple comparisons test indicated that audit committee meetings for listed companies
in the UAE significantly increased in Period 3 compared with Period 1. Another possible
reason for this result is that the UAE CG codes did not state a maximum limit for
meetings. Hence, the increase in audit committee meetings could depend on the
companies themselves.
Although the CG code suggested that the audit committee should meet at least once every
three months, some firms did not strictly comply with this law, which could negatively
affect the firm financial performance (see Table 4.2). This is a possible reason for the
changes in the relationship between audit committee meetings and firm financial
performance.
145
4.9.9 Audit Committee Members’ Education
Table 4.15 describes the difference in the relationship between audit committee members’
education and firm financial performance during the changes to CG rules in the UAE.
The result shows that the changes to the UAE CG rule had an insignificant effect on the
relationship between audit committee members’ education and firm financial
performance for the ROA model (e.g., Periods 2 and 3). The relationship with ROE
remained unchanged for all three periods, while for Tobin’s Q it became significant after
the implementation of both CG codes (Periods 2 and 3). The Tukey test indicated
statistically significant differences between the audit committee members’ education
groups. A significant difference occurred in Period 3, which indicated a greater number
of audit committee members holding a degree in a financial discipline to the total
members in the committee, compared with the other two periods. Hence, the changes to
the governance rules in 2010 caused significant changes to committee members’
education within the listed UAE companies.
Having audit committee members with financial qualifications is very important for UAE
listed companies. However, this study found that audit committee members can come
from a wide variety of backgrounds and may not have sufficient financial or accounting
knowledge, which could negatively affect firm financial performance. According to
Abbott, Parker and Peters (2004), companies must have some members who understand
the various accounting and financial issues to attain effective auditing oversight.
According to the Australian Securities Exchange Corporate Governance Council, audit
committees in Australian companies must have some members with financial and/or
accounting backgrounds, and these members should be able to analyse and understand
financial statements (ASX 2007). The council requires companies to have at least one
member on the committee with a related education qualification, such as an accountant
qualification, as well as some members who have an understanding of the firm’s industry,
to reduce financial fraud and risk (ASX 2007).
The results of this study show that implementing CG codes does not necessarily enhance
firm financial performance, as other external economic factors have some direct
influences on corporate financial performance (Ahmed et al. 2014; Alqatamin 2018;
Demirhan & Anwar 2014; Tailab 2014). Although some variables remained unchanged
during the changes to the UAE CG codes, the majority of them did change, which affected
firm financial performance. However, compared with developed countries, UAE

146
management professionals may have lower expertise in translating CG rules into business
advantage. This conclusion is supported by the finding of Al-Malkawi, Pillai and Bhatti
(2014) that all GCC countries, including the UAE, need to improve board effectiveness.
This study reached the conclusion that a higher level of compliance with CG codes will
improve performance, as measured by various instruments. It is also notable that effective
boards and audit committees can compensate for shortfalls in compliance, at least to some
extent. According to the collected data in this study, most of the UAE listed firms were
sincere in complying with the codes to improve performance and gain stakeholder
acceptance.
4.10 Conclusion
This chapter has presented and discussed the empirical results on the effect of board and
audit committee characteristics on the financial performance of listed companies in the
UAE. It also analysed the effect of the changes made to the UAE CG rules on the
characteristics of the board and audit committee and firm financial performance.
Specifically, this chapter presented the results of statistical analysis, including descriptive
statistics and the results of the multiple regression analysis. This study applied multiple
panel data regression to address the first objective, which was more suitable than applying
multiple ordinarily linear regressions.
This chapter also presented the findings and a discussion of the results, with tables
presented separately according to the research objectives. This study determined the
relationship between the board and audit committee characteristics and financial
performance of listed companies in the UAE. The study found different results via the
three measures of firm financial performance (i.e., ROA, ROE and Tobin’s Q). This was,
in part, explained by how the accounting-based measures (ROA and ROE) are
backwards-looking measures, whereas the market-based measure (Tobin’s Q) is a
forward-looking measure of expected firm financial performance. This chapter has also
presented the results of the comparative analysis between the three periods, which
indicated that implementation of the UAE governance codes had some effect on firms
financial performance. The next chapter presents a summary of this thesis and provides
the study limitations and recommendations and offers directions for future research.
147
Chapter 5: Conclusion and Recommendations
5.1 Introduction
This chapter summarises the study and its conclusions and draws relevant implications.
Section 5.2 provides a summary of this thesis and presents the main objectives of this
study. Section 5.3 presents the findings of testing the relationships between the board and
audit committee characteristics and firm financial performance. Section 5.4 presents the
study’s contributions. Section 5.5 provides the implications of the study, while Section
5.6 presents the limitations of this study and provides directions for future research.
5.2 Research Summary
Chapter 1 presented an overview of this study. The effect of CG in the UAE context was
established as the research focus, given the dearth of studies that exist specifically in this
area. Some empirical studies on CG have primarily focused on the specific characteristics
and dimensions of the attributes of CG in Middle Eastern countries; however, the
literature is sparse on the contribution of some of the more important CG characteristics
in the UAE, particularly the characteristics of audit committees and boards of directors
(Hassan & Halbouni 2013). In the UAE, as a developing economy, CG is important to
build investor confidence to attract foreign and local investors to expand trade and
investment. The rapid nature of the UAE’s economic growth led the UAE to adopt CG
codes to help monitor management and improve the quality of financial reporting.
Prior UAE regulations in terms of CG have not been successful; hence, in 2006, the
Hawkamah Institute for Corporate Governance was established to improve CG in the
UAE. In 2007, the first CG code was published in the UAE. This code identified the
governance structures and principles, including the distribution of rights and
responsibilities between different participants in the corporation, such as the board of
directors, managers, shareholders, creditors, auditors, regulators and other stakeholders.
In 2010, a second CG code was introduced and became mandatory for all UAE listed
companies. This code enhanced CG rules and discipline standards for UAE listed firms.
In light of the above, and as stated in Chapter 1, the research problem for this study was:
To identify the relationship between board and audit committee characteristics
and the financial performance of UAE listed firms.

148
Addressing the research problem led to the formation of the two research questions:
1. RQ1: Do board and audit committee characteristics affect the financial
performance of UAE publicly listed firms?
2. RQ2: Have the UAE CG codes affected the financial performance of UAE
publicly listed firms?
Two research objectives were formed to answer the research questions. They were:
a. Determine the relationship between the board and audit committee characteristics
and the firm financial performance of listed companies in the UAE
b. Determine the influence of the changes to the CG codes on the financial
performance of listed companies in the UAE.
A conceptual framework based on a multi-theoretic approach (agency and resource
dependence theories) was developed to reflect the UAE context. This acted as the
foundation for the study. CG was divided into two main characteristics: board
characteristics and audit committee characteristics. The variables for board characteristics
were board size, board composition, number of board meetings, board members’
education and board members’ experience, while the variables for audit committee
characteristics were audit committee size, audit committee composition, number of audit
committee meetings and audit committee members’ education. A firm’s financial
performance was measured in three ways—with two accounting-based measures (ROA
and ROE) and a market-based measure (Tobin’s Q). In addition, three control variables
were employed: firm age, firm size and leverage.
The method used to address Research Objective 1 involved a panel regression model that
examined the following hypotheses:
H1: There is a positive relationship between board size and firm financial
performance in the UAE.
H2: There is a positive relationship between board composition and firm financial
performance in the UAE.
H3: There is a positive relationship between board meetings and firm financial
performance in the UAE.

149
H4: There is a positive relationship between board members’ education and firm
financial performance in the UAE.
H5: There is a positive relationship between board members’ experience and firm
financial performance in the UAE.
H6: There is a positive relationship between audit committee size and firm financial
performance in the UAE.
H7: There is a positive relationship between audit committee composition and firm
financial performance in the UAE.
H8: There is a positive relationship between audit committee meetings and firm
financial performance in the UAE.
H9: There is a positive relationship between audit committee members’ education
and firm financial performance in the UAE.
For Research Objective 2, the OLS regression model and a one-way ANOVA with Tukey
post hoc tests were employed to examine the potential association between firm financial
performance and changes to the CG codes. The periods selected for analysis were chosen
to detect meaningful (significant) differences pre- and post-establishment of the CG
codes. These periods were as follows:
1. Period 1 (2006 to 2007) to capture the period prior to the first CG code.
2. Period 2 (2009 to 2010), which commenced two years after the first CG code was
adopted.
3. Period 3 (2013 to 2014), which was three years after the second CG code was
adopted.
The models were tested on a study sample of 47 listed UAE companies on the DFM and
ADX covering a period of 10 years from 2006 to 2015. The following sections present
the study findings and summarise the study limitations and recommendations.

150
5.3 Research Conclusions
This section reports the conclusions drawn from the two research objectives of the study.
5.3.1 Research Objective 1
A panel regression model was used to test the nine hypotheses. The hypotheses
investigated the effect of board and audit committee characteristics on firm financial
performance in the UAE listed companies. The results for the three financial performance
measures (ROA, ROE and Tobin’s Q) indicated different effects on the dependent
variables. The analysis displayed mixed results, between board and audit committee
characteristics and firm financial performance in the UAE. The key findings are presented
below.
Table 5.1: Summary of Hypotheses Tests for All Models
Financial Performance
Hypothesis ROA ROE Tobin’s Q
H1: Board size is positively related to firm financial performance.
Pos, Sig Pos, Sig Pos, Sig
H2: Board composition is positively related to firm financial performance.
Neg, Sig Neg, Sig Pos, Sig
H3: Board meetings are positively related to firm financial performance.
Pos, Sig Pos, Sig Neg, Insig
H4: Board members’ education is positively related to firm financial performance.
Pos, Insig Pos, Insig Pos, Sig
H5: Board members’ experience is positively related to firm financial performance.
Neg, Insig Neg, Insig Pos, Sig
H6: Audit committee size is positively related to firm financial performance.
Neg, Insig Neg, Sig Pos, Insig
H7: Audit committee composition is positively related to firm financial performance.
Pos, Sig Pos, Insig Pos, Sig
H8: Audit committee meetings are positively related to firm financial performance.
Pos, Sig Pos, Sig Neg, Insig
H9: Audit committee members’ education is positively related to firm financial performance.
Pos, Sig Pos, Sig Pos, Sig
5.3.1.1 H1: Board Size
The first hypothesis (H1) stated that board size is positively related with firm financial
performance. The results showed a statistically significant positive relationship between
board size and firm financial performance, as measured by ROA, ROE and Tobin’s Q.
This finding supports Hypothesis 1, as well as agency theory and resource dependence
theory, which argue that larger board sizes should improve firm financial performance.
151
5.3.1.2 H2: Board Composition
The second hypothesis (H2) stated that board independence is positively related with firm
financial performance. Board independence depends on the proportion of independent
directors on the board. The empirical results showed a significant and negative
relationship between independent directors and financial performance as measured by
ROA and ROE, and a significant and positive relationship with financial performance as
measured by Tobin’s Q. This finding of Tobin’s Q supports agency theory, which argues
that a majority of non-executive directors on a board will positively influence corporate
performance through better monitoring, control and protection of shareholders’ interest
(Fama & Jensen 1983). Thus, the hypothesis was partly supported.
5.3.1.3 H3: Board Meetings
The third hypothesis (H3) stated that board meetings are positively related to firm
financial performance. Board meetings depend on the number of board meetings held in
a year. The empirical results showed a significant and positive relationship between board
meetings and firm financial performance as measured by ROA and ROE, and an
insignificant association with financial performance as measured by Tobin’s Q. The
finding of the ROA and ROE models supports agency theory, which argues that a greater
number of board meetings offers companies more benefits that outweigh the costs of
meetings, and can lead to better monitoring of the firm activities, ensure disciplined
management, and ultimately lead to enhanced firm financial performance. Thus, the
hypothesis was partly supported.
5.3.1.4 H4: Board Members’ Education
The fourth hypothesis (H4) stated that board members’ education is positively related to
firm financial performance. Board members’ education refers to the board members’
educational background. The results demonstrated a significant and positive relationship
between board members’ education and financial performance as measured by Tobin’s
Q, and an insignificant association with firm financial performance as measured by ROA
and ROE. The Tobin’s Q finding supports resource dependence theory, which argues that
education is one of the external resources that enhances the financial performance of
firms. Thus, the hypothesis was partly supported.
152
5.3.1.5 H5: Board Members’ Experience
The fifth hypothesis (H5) stated that board members’ experience is positively related to
firm financial performance. Board members’ experience relates to the number of years of
experience held by the board members. The empirical results showed a significant and
positive relationship between board members’ experience and firm financial performance
as measured by Tobin’s Q, yet an insignificant association with financial performance as
measured by ROA and ROE. The Tobin’s Q finding supports resource dependence
theory. Thus, the hypothesis was partly supported.
5.3.1.6 H6: Audit Committee Size
The sixth hypothesis (H6) stated that audit committee size is positively related to firm
financial performance. Audit committee size depends on the number of audit committee
members. The empirical results showed a significant and negative relationship between
audit committee size and firm financial performance as measured by ROE, yet no
significant association with financial performance as measured by ROA and Tobin’s Q.
The findings of all three estimates do not support agency and resource dependence
theories, which posit that larger audit committee sizes can enhance firm financial
performance by providing better monitoring. Thus, the hypothesis was not supported.
5.3.1.7 H7: Audit Committee Composition
The seventh hypothesis (H7) stated that audit committee composition is positively related
to firm financial performance. Audit committee independence indicates the proportion of
independent members on the audit committee. The results showed a significant and
positive relationship between committee composition and firm financial performance as
measured by ROA and Tobin’s Q, yet no significant association with firm financial
performance as measured by ROE. The findings of ROA and Tobin’s Q support agency
theory, which argues that increasing the number of independent auditors on the audit
committee can positively affect firm financial performance. Thus, the hypothesis was
partly supported.
5.3.1.8 H8: Audit Committee Meetings
The eighth hypothesis (H8) stated that audit committee meetings are positively related to
firm financial performance. Audit committee meetings indicate the number of audit
committee meetings held in a year. The results showed a significant and positive

153
relationship between audit committee meetings and firm financial performance as
measured by ROA and ROE, yet no significant relationship between audit committee
meetings and firm financial performance as measured by Tobin’s Q. The findings of ROA
and ROE support agency theory, which argues that more committee meetings lead to
better monitoring of firm financial activities and can result in improved financial
performance. Thus, the hypothesis was partly supported.
5.3.1.9 H9: Audit Committee Members’ Education
The ninth hypothesis (H9) stated that audit committee members’ education is positively
related with firm financial performance. Audit committee members’ education depends
on the number of auditors that have a financial background. The empirical results showed
a statistically significant positive relationship between audit committee members’
education and firm financial performance as measured by ROA, ROE and Tobin’s Q. The
findings support resource dependence theory, which states that education is one of the
external resources that can improve firm financial performance. Thus, the hypothesis was
supported.
5.3.2 Research Objective 2
The second research objective sought to determine the influence of the changes to the CG
codes on the financial performance of listed companies in the UAE. Specifically, the
study sought to identify the changes in the relationship between board and audit
committee characteristics and firm financial performance due to changes in the CG codes.
According to the results of the OLS regression, the changes to the UAE CG codes affected
the relationship between board and audit committee characteristics and firm financial
performance. In addition to the OLS regression, a one-way ANOVA with Tukey post hoc
tests provided further specific information regarding how the changes to each variable,
based on changes to the CG codes, affected the relationship between board and audit
committee characteristics and firm financial performance.
Specifically, the ANOVA test showed that, from an overall perspective, changes to the
CG codes resulted in a positive and significant increase on the financial performance of
listed companies in the UAE as measured by ROA, ROE and Tobin’s Q. Post hoc tests
on the ANOVA indicated that the adoption of CG codes did result in a significant positive
change to board meetings, board members’ education, board members’ experience, audit
committee meetings and audit committee members’ education (see Table 4.13), while

154
board size, board composition, audit committee size and audit committee composition
did not change.
5.4 Contributions of the Study
The present research contributes to the academic literature in the following ways:
1. The study developed a framework to address the effect of board and audit
committee characteristics on financial performance for UAE listed firms. By
doing so, this study provided a more accurate identification of relationships
between firm financial performance and board and audit committee
characteristics.
2. The study tested the effect of the first and second CG codes on financial
performance of UAE listed companies. Consequently, the present research
provided new insights into the impact that the changes to CG codes had on the
financial performance of UAE listed firms.
Due to the contributions outlined above, this study provides a significant contribution to
academia to understand the present CG characteristics in the UAE, which will help
stakeholders to understand CG practices in the UAE.
5.5 Implications
Board and audit committees are important factors to improve firm financial performance
in a structured and sustainable manner through a balanced approach and application of
good CG standards (OECD 2015). However, the results of this study also suggest that,
apart from the effect on firm financial performance caused by implementing CG codes,
there are other factors that influence firm financial performance. Nonetheless, the
findings of this study provide some important implications for listed firms in the UAE,
as well as for policymakers.
5.5.1 Improving Directors’ Skills
The study’s findings were mixed regarding the relationship between board of directors’
education and experience and UAE firm financial performance. From an accounting
measurement perspective, the impact of board members’ education and experience on
firm financial performance was inconclusive, however the Tobin’s Q measure showed
that the UAE market perceives firms hiring board members with superior educational

155
qualifications and experience as an indication of future positive financial performance.
From an overall perspective therefore, there does seem to be some impact which would
suggest that there is a lack of an appropriate skill base among members of the board of
directors. Thus, UAE firms should consider appointing directors with a more diverse skill
set to enhance board effectiveness. This will enable boards to work effectively as a team
in order to meet the challenges of a rapidly changing business environment which requires
boards to be flexible and responsive.
5.5.2 Strengthening Corporate Governance Reporting
The final sample comprised 47 listed firms out of a possible 127, which suggests that
most listed companies in the UAE provide reports with poor information in terms of CG
practices. Consequently, UAE listed firms need to improve the quality of CG reports to
more accurately reflect the firm’s relationship and to ensure that they comply with the
new rules arising from the UAE CG codes. Further, deliberate efforts should be invested
to establish a follow-up and compliance team to ensure that all firms not only comply,
but also meet the expectations of the regulatory body, as mandated in the CG code.
5.5.3 Rationalising Audit Committee Size
The analysis suggests the need to rationalise the size of audit committees, which were
found to exert a significant and negative influence on firm financial performance. The
UAE CG code does not mention a specific number of members to constitute an effective
audit committee size, and does not contain any specific guideline about the number of
audit committee members. This is an issue that could be investigated and supported with
more specific recommendations.
5.5.4 Specifying a Maximum Proportion of Independent Members
The overall findings suggest that too many independent directors negatively impact
financial performance. Currently, the UAE codes endorse a regulation requiring that
listed firms appoint a minimum one-third of board directors as independent directors.
This regulation aims to enhance director independence with regard to directors’
monitoring and supervisory role of firm managers. However, there is a large variation in
the percentage of independent directors on the boards in the study data, with a maximum
of 100% for a number of firms. Hence, the UAE should specify the maximum proportion
of independent members on the board to ensure that firms do not have 100% of
156
independent directors on the board, given that a well-diversified board can improve firm
financial performance.
5.5.5 Specifying Independent Audit Committee Members
The results showed that audit committees are more effective in monitoring a firm’s
financial reporting process when they have a larger number of independent members,
which can lead to enhanced firm financial performance. Given this, UAE listed firms
should consider having all members of the audit committee be independent from the
company to provide better monitoring, which improves board performance and firm
financial performance.
5.5.6 Requiring Audit Committee Members with Recognised Qualifications
Future policy should focus more on the relationship between audit committee members’
education and firm financial performance. The present research showed that, when audit
committee members have a recognised qualification in finance or significant expertise in
accounting and financial affairs, firm financial performance increased across all
measures. Thus, UAE listed firms should consider introducing a requirement whereby all
audit committee members must have a recognised qualification in finance or significant
expertise in accounting and financial affairs.
5.6 Study Limitations and Directions for Further Research
Although the results of the present research provide extensive evidence regarding CG
characteristics and associations with firm financial performance, there were still
limitations to the research. To fulfil the intent of this study as a basis for future research,
it is important to reflect critically and recommend directions for future research.
5.6.1 Study Limitations
The first limitation of this study was the exclusion of non-listed companies in the UAE
from the sample due to the UAE government decision to introduce the CG codes only for
listed companies in the ADX and DFM.
Second, the availability of secondary data for this study restricted the amount of available
data to assess UAE CG practice for listed companies. For instance, the number of listed
firms chosen was restricted to a sample size of 47, which constituted approximately 37%
of the population.

157
Third, the focus on secondary data meant that other potential factors that influence firm
financial performance—such as shareholder perceptions of CEOs—were omitted. Thus,
this study was confined to only a quantifiable list of factors affecting firm financial
performance. This approach meant that the views from a wide range of stakeholders—
such as regulators, investors, foreign corporate partners or consumers—were not
incorporated.
Fourth, this research used ROA, ROE and Tobin’s Q to measure firm financial
performance because these are traditional and common measurements. However, there
are other measures of firm financial performance, such as profit margin, earnings per
share and return on sales. Thus, this study was confined to a limited portion of firm
financial performance measures.
5.6.2 Future Directions
With respect to directions for future research, there are some potential opportunities for
further studies, as follows:
1. A comparative study of UAE with other Middle Eastern countries and/or
developing countries
2. An investigation of the effects of various other committees, such as remuneration
and nomination committees. Further studies could expand the notion of CG
beyond board and audit committee characteristics by exploring in greater depth
the effect of CG on the financial performance of UAE listed firms
3. An investigation of the difference between listed and non-listed companies in
terms of CG practices in the UAE. In 2016, the UAE introduced a third set of CG
codes. Thus, future studies could undertake a comparative study comparing 2016
to 2017 with previous years to identify any improvements from the
implementation
4. A qualitative study to provide more insight into certain CG characteristics. For
example, a qualitative study could determine the quality of board meetings and
audit committee meetings and their effect on firm financial performance
5. An investigation of the relationship between CG, corporate social responsibility
and the financial performance of UAE listed firms, which has not yet been
undertaken.

158
In the context of these future research possibilities, this study has provided a strong
foundation for opening the potential for more in-depth analysis of this important area of
CG research.

159
References
Aamir, K & Sajid, A 2012, ‘Effect of board composition on firm’s performance: a case of Pakistani listed companies’, Journal of Contemporary Research in Business, vol. 3, no. 10, pp. 853–563.
Abbott, LJ & Parker, S 2000, ‘Auditor selection and audit committee characteristics’, Auditing: A Journal of Practice & Theory, vol. 19, no. 2, pp. 47–66.
Abbott, LJ, Parker, S & Peters, GF 2004, ‘Audit committee characteristics and restatements’, Auditing: A Journal of Practice & Theory, vol. 23, no. 1, pp. 69–87.
Abdullah, H & Valentine, B 2009, ‘Fundamental and ethics theories of corporate governance’, Middle Eastern Finance and Economics, vol. 4, no. 4, pp. 88–96.
Abhayawansa, S & Johnson, R 2007, ‘Corporate governance reforms in developing countries: Accountability versus performance’, Reading in Auditing, vol. 2, pp. 84–98.
Adams, RB & Ferreira, D 2009, ‘Women in the boardroom and their impact on governance and performance’, Journal of Financial Economics, vol. 94, no. 2, pp. 291–309.
Adeyemi, SB & Oboh, CS 2011, ‘Perceived relationship between corporate capital structure and firm value in Nigeria’, International Journal of Business and Social Science, vol. 2, no. 19, pp. 131–143.
Aguilera, RV & Cuervo‐Cazurra, A 2009, ‘Codes of good governance’, Corporate Governance: An International Review, vol. 17, no. 3, pp. 376–387.
Aguilera, RV, Williams, CA, Conley, JM & Rupp, DE 2006, ‘Corporate governance and social responsibility: a comparative analysis of the UK and the US’, Corporate Governance: An International Review, vol. 14, no. 3, pp. 147–158.
Ahmad, A 2010, ‘Spotlight on corporate governance’, International Financial Law Review, vol. 29, no. 6, pp. 105–106.
Ahmed, H, Muhammad, C, Sehrish, J, Sana, N & Muhammad, I 2014, ‘Impact of micro economic variables on firms performance’, International Journal of Economics and Empirical Research, vol. 2, no.2, pp. 65–73.
AICD 2012, Audit committees: A guide to good practice, 2nd edn, The Auditing and Assurance Standards Board, the Australian Institute of Company Directors, the Institute of Internal Auditors-Australia.
Aimen, A & Nila, F 2014, ‘A comparative study of good corporate governance codes between Indonesia and United Arab Emirates’, Journal of Business and Management, vol. 16, no. 7, pp. 79–86.
Al Matari, EM, Al Swidi, AK & Fadzil, FHB 2014, ‘Audit committee characteristics and executive committee characteristics and firm performance in Oman: empirical study’, Asian Social Science, vol. 10, no. 12, pp. 98–113.

160
Aldamen, H, Duncan, K, Kelly, S, McNamara, R & Nagel, S 2012, ‘Audit committee characteristics and firm performance during the global financial crisis’, Accounting & Finance, vol. 52, no. 4, pp. 971–1000.
Al-Haddad, W, Alzurqan, ST & Al-Sufy, FJ 2011, ‘The effect of corporate governance on the performance of Jordanian industrial companies: An empirical study on Amman Stock Exchange’, International Journal of Humanities and Social Science, vol. 1, no. 4, pp. 55–69.
Aljifri, K & Moustafa, M 2007, ‘The impact of corporate governance mechanisms on the performance of UAE firms: An empirical analysis’, Journal of Economic and Administrative Sciences, vol. 23, no.2, pp. 71–93.
Al-Malkawi, Han, Pillai, R & Bhatti, M 2014, ‘Corporate governance practices in emerging markets: The case of GCC countries’, Economic Modelling, vol. 38, pp. 133–141.
Almatari, E, Alswidi, A & Fadzil, F 2013, ‘The effect of the internal audit and firm performance: A proposed research framework’, International Review of Management and Marketing, vol. 4, no. 1, pp. 34–41.
Almatari, E, Alswidi, A & Fadzil, F 2014a, ‘The effect on the relationship between board of directors characteristics on firm performance in Oman: Empirical study’, Middle-East Journal of Scientific Research, vol. 21, no. 3, pp. 556–574.
Almatari, E, Alswidi, A & Fadzil, F 2014b, ‘The effect of board of directors characteristics, audit committee characteristics and executive committee characteristics on firm performance in Oman: An empirical study’, Asian Social Science, vol. 10, no. 11, pp. 149–171.
Almatari, E, Alswidi, A & Fadzil, F 2014c, ‘The measurements of firm performance’s dimensions’, Asian Journal of Finance & Accounting, vol. 6, no. 1, pp. 24–49.
Almatari, Y, Alswidi, A, Fadzil, F & Almatari, E 2012, ‘Board of directors, audit committee characteristics and the performance of Saudi Arabia listed companies’, International Review of Management and Marketing, vol. 2, no. 4, pp. 241–251.
Alqatamin, RM 2018, ‘Audit committee effectiveness and company performance: Evidence from Jordan’, Accounting and Finance Research, vol. 7, no. 2, pp. 48-60
Altamimi, HA & Charif, H 2012, Corporate governance practices and the role of the board of directors: Evidence from UAE conventional and Islamic banks, Corporate Ownership & Control, vol. 10, no. 4, pp. 207–213.
Amer, M, Ragab, AA & Shehata, SE 2014, ‘Audit committee characteristics and firm performance: Evidence from Egyptian listed companies’, in Proceedings of the 6th Annual American Business Research Conference, New York, USA, pp. 9–10.
Ananchotikul, SB 2007, Essays on corporate governance in emerging markets, doctoral thesis, University of California, Berkeley, ProQuest.
161
Andrew, H 2015, UAE says no to corruption, viewed 12 September 2016, https://www.lexology.com/library/detail.aspx?g=9764a038-309a-45ee-9411-e59aa78e3fae.
Aras, G, Aybars, A & Kutlu, O 2010, ‘Managing corporate performance: Investigating the relationship between corporate social responsibility and financial performance in emerging markets’, International Journal of Productivity and Performance Management, vol 59, no. 3, pp. 229–254.
Arens, AA, Elder, RJ & Mark, B 2012, Auditing and assurance services: An integrated approach, Prentice Hall, Boston, MA.
Arifin, B 2006, ‘Transaction cost analysis of upstream-downstream relations in watershed services: Lessons from community-based forestry management in Sumatra, Indonesia’, Quarterly Journal of International Agriculture, vol. 45, no. 4, pp. 361–376.
Arora, A, Sharma, C & Sharma, C 2016, 'Corporate governance and firm performance in developing countries: Evidence from India', Journal of Finance, vol.16, no. 2, pp. 420–436.
Australian Securities Exchange Corporate Governance Council (ASX CGC) 2007, Corporate governance principles and recommendations, ASX Corporate Governance Council, Sydney, viewed 02 February 2016, https://www.asx.com.au/documents/asx-compliance/final-revised-principles-complete.pdf.
Australian Stock Exchange Corporate Governance Council (ASX CGC) 2010, Corporate governance principles and recommendations with 2010 amendments, ASX Corporate Governance Council, Sydney, viewed 17 May 2016, http://www.asx.com.au/about/corporate_governance/index.htm.
Autio, E, Sapienza, HJ & Almeida, JG 2000, ‘Effects of age at entry, knowledge intensity, and imitability on international growth’, Academy of Management Journal, vol. 43, no. 5, pp. 909–924.
Azim, MI 2012, ‘Corporate governance mechanisms and their impact on company performance: A structural equation model analysis’, Australian Journal of Management, vol. 37, no. 3, pp. 481–505.
Babbie, ER 2015, The practice of social research, 13th edn, Nelson Education, Belmont, CA.
Baddeley, M & Barrowclough, DV 2009, Running regressions: A practical guide to quantitative research in economics, finance and development studies, Cambridge University Press, New York.
Badolato, P, Donelson, D & Ege, M 2014, ‘Audit committee financial expertise and earnings management: The role of status’, Journal of Accounting and Economics, vol. 58, no. 2-3, pp. 208–230.
Baltagi, B 2008, Econometric analysis of panel data, John Wiley & Sons, Chichester, UK.

162
Barka, HB & Legendre, F 2017, ‘Effect of the board of directors and the audit committee on firm performance: A panel data analysis’, Journal of Management & Governance, vol. 21, no. 3, pp. 737–755.
Barney, JB 1990, ‘The debate between traditional management theory and organizational economics: Substantive differences or intergroup conflict?’, Academy of Management Review, vol. 15, no. 3, pp. 382–393.
Bathula, H 2008, Board characteristics and firm performance: Evidence from New Zealand, Auckland University of Technology, New Zealand.
Baysinger, BD & Butler, HN 1985, ‘Corporate governance and the board of directors: performance effects of changes in board composition’, Journal of Law, Economics, & Organization, vol. 1, no. 1, pp. 101–124.
Beasley, MS 1996, ‘An empirical analysis of the relation between the board of director composition and financial statement fraud’, Accounting Review, vol. 71, no. 4, pp. 443–465.
Beasley, MS, Carcello, JV, Hermanson, DR & Lapides, PD 2000, ‘Fraudulent financial reporting: consideration of industry traits and corporate governance mechanisms’, Accounting Horizons, vol. 14, no. 4, pp. 441–454.
Bedard, J, Chtourou, SM & Courteau, L 2004, ‘The effect of audit committee expertise, independence, and activity on aggressive earnings management’, Auditing: A Journal of Practice & Theory, vol. 23, no. 2, pp. 13–35.
Berg, BL & Lune, H 2012, Qualitative research methods for the social sciences, 8th edn, Pearson Education, Boston, MA.
Berle, A & Means, G 1932, The modern corporation and private property, Macmillan, New York.
Bhagat, S & Black, B 2001, ‘The non-correlation between board independence and long-term firm performance’, The Journal of Corporation Law, vol. 27, no. 2, pp. 231–273.
Bhagat, S & Bolton, B 2008, ‘Corporate governance and firm performance’, Journal of Corporate Finance, vol. 14, no. 3, pp. 257–273.
Bijalwan, JG & Madan, P 2013, ‘Board composition, ownership structure and firm performance’, Research Journal of Economics and Business Studies, vol. 2, no. 3, pp. 86–101.
Blattberg, C 2013, Welfare: Towards the patriotic corporation, viewed 12 July 2016, https://papers.ssrn.com/sol3/papers.cfm?abstract_id=2250348.
Bonazzi, L & Islam, SM 2007, ‘Agency theory and corporate governance: A study of the effectiveness of board in their monitoring of the CEO’, Journal of Modelling in Management, vol. 2, no. 1, pp. 7–23.
163
Boone, AL, Casares Field, L, Karpoff, JM & Raheja, CG 2007, ‘The determinants of corporate board size and composition: An empirical analysis’, Journal of Financial Economics, vol. 85, no. 1, pp. 66–101.
Bosse, DA & Phillips, RA 2016, ‘Agency theory and bounded self-interest’, Academy of Management Review, vol. 41, no. 2, pp. 276–297.
Bozec, R 2005, ‘Boards of directors, market discipline and firm performance’, Journal of Business Finance & Accounting, vol. 32, no. 9, pp. 1921–1960.
Breusch, TS & Pagan, AR 1980, ‘The Lagrange multiplier test and its applications to model specification in econometrics’, The Review of Economic Studies, vol. 47, no. 1, pp. 239–253.
Brickley, JA, Coles, JL & Jarrell, G 1997, ‘Leadership structure: Eeparating the CEO and chairman of the board’, Journal of Corporate Finance, vol. 3, no. 3, pp. 189–220.
Bronson, SN, Carcello, JV, Hollingsworth, CW & Neal, TL 2009, ‘Are fully independent audit committees really necessary?’, Journal of Accounting and Public Policy, vol. 28, no. 4, pp. 265–280.
Brown, LD & Caylor, ML 2004, ‘Corporate governance and firm performance’, doctoral thesis, Georgia State University, Atlanta, Georgia.
Buallay, A, Hamdan, A & Zureigat, Q 2017, ‘Corporate governance and firm performance: evidence from Saudi Arabia’, Australasian Accounting Business & Finance Journal, vol. 11, no. 1, pp. 78–98.
Burns, R 2000, Introduction to research methods, Addison Wesley Longman, London, England.
Cadbury, A 1992, Report of the committee on the financial aspects of corporate governance, Gee Professional Publishing, London.
Carcello, JV & Neal, TL 2000, ‘Audit committee composition and auditor reporting’, The Accounting Review, vol. 75, no. 4, pp. 453–467.
Carcello, JV & Neal, TL 2003a, ‘Audit committee characteristics and auditor dismissals following “new” going-concern reports’, The Accounting Review, vol. 78, no. 1, pp. 95–117.
Carcello, JV & Neal, TL 2003b, ‘Audit committee independence and disclosure: Choice for financially distressed firms’, Corporate Governance: An International Review, vol. 11, no. 4, pp. 289–299.
Carroll, AB 1979, ‘A three-dimensional conceptual model of corporate performance’, Academy of Management Review, vol. 4, no. 4, pp. 497–505.
Chalevas, CG 2011, ‘The effect of the mandatory adoption of corporate governance mechanisms on executive compensation’, The International Journal of Accounting, vol. 46, no. 2, pp. 138–174.

164
Chang-Jui, L 2011, ‘An examination of board and firm performance: Evidence from Taiwan’, The International Journal of Business and Finance Research, vol. 5, no. 4, pp. 17–34.
Chaudhry, MH & Malik, QA 2015, ‘Impact of corporate governance on firm performance’, Research Journal of Recent Sciences, vol. 4, no. 5, pp. 103–107.
Chen, HL 2011, ‘Does board independence influence the top management team? Evidence from strategic decisions toward internationalization’, Corporate Governance: An International Review, vol. 19, no. 4, pp. 334–350.
Chen, L, Liu, C, Dong, X, Wu, Q & Wang, G 2013, Corporate governance and firm performance: Empirical evidence from China, 2013 Conference on Education Technology and Management Science (ICETMS 2013), Atlantis Press, Nanjing, China.
Chen, V, Li, J & Shapiro, D 2011, ‘Are OECD-prescribed “good corporate governance practices” really good in an emerging economy?’, Asia Pacific Journal of Management, vol. 28, no. 1, pp. 115–138.
Cheng, LT, Chan, RY & Leung, T 2010, ‘Management demography and corporate performance: evidence from China’, International Business Review, vol. 19, no. 3, pp. 261–275.
Cheng, M & Tzeng, Z 2011, ‘The effect of leverage on firm value and how the firm financial quality influence on this effect’, World Journal of Management, vol. 3, no. 2, pp. 30–53.
Cheung, Y-L, Jing, L, Lu, T, Rau, PR & Stouraitis, A 2009, ‘Tunneling and propping up: an analysis of related party transactions by Chinese listed companies’, Pacific-Basin Finance Journal, vol. 17, no. 3, pp. 372–393.
Child, J & Rodrigues, SB 2003, ‘Corporate governance and new organizational forms: Issues of double and multiple agency’, Journal of Management and Governance, vol. 7, no. 4, pp. 337–360.
Cho, DS & Kim, J 2007, ‘Outside directors, ownership structure and firm profitability in Korea’, Corporate Governance: An International Review, vol. 15, no. 2, pp. 239–250.
Christopher, J 2010, ‘Corporate governance—a multi-theoretical approach to recognizing the wider influencing forces impacting on organizations’, Critical Perspectives on Accounting, vol. 21, no. 8, pp. 683–695.
Chung, KH & Pruitt, SW 1996, ‘Executive ownership, corporate value, and executive compensation: a unifying framework’, Journal of Banking & Finance, vol. 20, no. 7, pp. 1135–1159.
Clarke, T 1998, ‘The stakeholder corporation: A business philosophy for the information age’, Long Range Planning, vol. 31, no. 2, pp. 182–194.
165
Clarke, T 2004, ‘Theories of corporate governance’, in T. Clarke (ed.), the philosophical foundations of corporate governance, Thomas Clarke, New York, pp. 31–355.
Clarkson, ME 1995, ‘A stakeholder framework for analysing and evaluating corporate social performance’, Academy of Management Review, vol. 20, no. 1, pp. 92–117.
Coase, RH 1937, ‘The nature of the firm’, Economica, vol. 4, no. 6, pp. 386–405.
Cochran, PL & Wood, RA 1984, ‘Corporate social responsibility and financial performance’, Academy of Management Journal, vol. 27, no. 1, pp. 42–56.
Coles, JL, Daniel, ND & Naveen, L 2008, ‘Boards: Does one size fit all?’, Journal of Financial Economics, vol. 87, no. 2, pp. 329–356.
Conger, J & Lawler, EE 2009, Sharing leadership on corporate boards: A critical requirement for teamwork at the top, Marshall School of Business Working Paper, viewed 23 December 2015, https://ssrn.com/abstract=1313353.
Conyon, MJ & He, L 2011, ‘Executive compensation and corporate governance in China’, Journal of Corporate Finance, vol. 17, no. 4, pp. 1158–1175.
Corner, PD & Kinicki, AJ 1997, ‘A proposed mediator between top team demography and financial performance—Academy of Management proceedings’, Academy of Management, vol. 1, no. 1, pp. 7–11.
Cotter, J & Silvester, M 2003, ‘Board and monitoring committee independence’, Abacus, vol. 39, no. 2, pp. 211–232.
Cramer, D & Howitt, DL 2004, The Sage dictionary of statistics: A practical resource for students in the social sciences, 1st edn, Sage, London.
Cyert, RM & March, JG 1963, A behavioural theory of the firm, Wiley, Englewood Cliffs, New Jersey.
Dabor, AO, Isiavwe, DT, Ajagbe, MA & Oke, AO 2015, ‘Impact of corporate governance on firms’ performance’, International Journal of Economics, Commerce and Management, vol. 3, no. 6, pp. 634–653.
Daily, C & Dalton, D 1992, ‘The relationship between governance structure and corporate performance in entrepreneurial firms’, Journal of Business Venturing, vol. 7, no. 5, pp. 375–386.
Dalton, DR, Daily, CM, Ellstrand, AE & Johnson, JL 1998, ‘Meta-analytic reviews of board composition, leadership structure, and financial performance’, Strategic Management Journal, vol. 19, no. 3, pp. 269–290.
Darmadi, S 2013, ‘Board members’ education and firm performance: Evidence from a developing economy’, International Journal of Commerce and Management, vol. 23, no. 2, pp. 113–135.
166
Darmadi, S 2013, ‘Do women in top management affect firm performance? Evidence from Indonesia. Corporate Governance’, The International journal of business in society, vol. 13, no. 3, pp. 288-304.
Davis, JH, Schoorman, FD & Donaldson, L 1997, ‘Toward a stewardship theory of management’, Academy of Management Review, vol. 22, no. 1, pp. 20–47.
De Almeida, JEF, De Lima, GASF & Lima, IS 2009, ‘Corporate governance and ADR effects on earnings quality in the Brazilian capital markets’, Corporate Ownership and Control, vol. 7, no. 1, p. 55-62.
De Andres, P & Vallelado, E 2008, ‘Corporate governance in banking: The role of the board of directors’, Journal of Banking & Finance, vol. 32, no. 12, pp. 2570–2580.
De Wet, J & Du Toit, E 2007, ‘Return on equity: A popular, but flawed measure of corporate financial performance’, South African Journal of Business Management, vol. 38, no. 1, pp. 59–69.
Deegan, C 2012, Australian financial accounting, McGraw-Hill Education Australia, North Ryde, NSW.
Defond, ML, Hann, RN & Hu, X 2005, ‘Does the market value financial expertise on audit committees of boards of directors?’, Journal of Accounting Research, vol. 43, no. 2, pp. 153–193.
Demirhan, HG & Anwar, W 2014, ‘Factors affecting the financial performance of the firms during the financial crisis: evidence from Turkey’, Ege Stratejik Araştırmalar Dergisi, vol. 5, no. 2, pp. 65–80.
Demsetz, H & Villalonga, B 2001, ‘Ownership structure and corporate performance’, Journal of Corporate Finance, vol. 7, no. 3, pp. 209–233.
Dey, A 2008, ‘Corporate governance and agency conflicts’, Journal of Accounting Research, vol. 46, no. 5, pp. 1143–1181.
Diggle, P 2002, Analysis of longitudinal data, Oxford University Press, New York.
DiMaggio, PJ & Powell, WW 2004, The iron cage revisited: Institutional isomorphism and collective rationality in organizational fields, The New Economic Sociology, Princeton University Press, Princeton, New Jersey.
Dincer, HH & Oguz, E 2016, Corporate governance and firm performance: The case for Turkey, Project in CFM, Lund University, Lund.
Donaldson, L & Davis, JH 1991, ‘Stewardship theory or agency theory: CEO governance and shareholder returns’, Australian Journal of Management, vol. 16, no. 1, pp. 49–64.
Donaldson, L 1990, ‘The ethereal hand: Organizational economics and management theory’, Academy of Management Review, vol. 15, no. 3, pp. 369–381.
Draper, N & Smith, H 1981, Applied regression analysis, Wiley, New York.
167
Drobetz, W, Schillhofer, A & Zimmermann, H 2004, ‘Corporate governance and expected stock returns: Evidence from Germany’, European Financial Management, vol. 10, no. 2, pp. 267–293.
Duckworth, HA & Moore, RA 2010, Social responsibility: Failure mode effects and analysis, 1st edn, CRC Press, Boca Raton.
Dzingai, I & Fakoya, MB 2017, ‘Effect of corporate governance structure on the financial performance of Johannesburg stock exchange (JSE)-listed mining firms’, Sustainability, vol. 9, no. 6, pp. 867–882.
Eisenberg, T, Sundgren, S & Wells, MT 1998, ‘Larger board size and decreasing firm value in small firms’, Journal of Financial Economics, vol. 48, no. 1, pp. 35–54.
Elghuweel, MI 2015, Empirical essays on corporate governance and corporate decisions in emerging economies: The case of Oman, University of Glasgow, Glasgow.
Elsayed, K 2011, ‘Board size and corporate performance: The missing role of board leadership structure’, Journal of Management & Governance, vol. 15, no. 3, pp. 415–446.
Emirates Securities & Commodities Authority (ESCA) 2000, The Authority Board Resolution No. (3) of 2000 on the Regulations of Disclosure and Transparency and the amendments, United Arab Emirates.
Emirates Securities & Commodities Authority (ESCA) 2007, Corporate governance code through decision No. R/32 of 2007, Corporate Governance Code, United Arab Emirates.
Emirates Securities & Commodities Authority (ESCA) 2016, The Chairman of Authority's Board of Directors' Resolution No. (7) of 2016 Concerning the Standards of Institutional Discipline and Governance of Public Shareholding Companies, United Arab Emirates.
Epps, RW & Cereola, SJ 2008, ‘Do institutional shareholder services (ISS) corporate governance ratings reflect a company’s operating performance?’, Critical Perspectives on Accounting, vol. 19, no. 8, pp. 1135–1148.
Evans, J, Evans, R & Loh, S 2002, ‘Corporate governance and declining firm performance’, International Journal of Business Studies, vol. 10, no. 1, pp. 1–18.
Fairchild, L & Li, J 2005, ‘Director quality and firm performance’, Financial Review, vol. 40, no. 2, pp. 257–279.
Fama, EF & Jensen, MC 1983, ‘Separation of ownership and control’, Journal of Law and Economics, vol. 26, no. 2, pp. 301–325.
Fauzi, F & Locke, S 2012, ‘Board structure, ownership structure and firm performance: A study of New Zealand listed-firms’, Asian Academy of Management Journal of Accounting & Finance, vol. 8, no. 2, pp. 43–67.
168
Federal Law No. (2) 2015, Concerning commercial companies, civil, commercial and family law, United Arab Emirates.
Federal Law No. (8) 1984, Commercial companies, and the laws in amendment, United Arab Emirates.
Fich, EM & Shivdasani, A 2006, ‘Are busy boards effective monitors?’, The Journal of Finance, vol. 61, no. 2, pp. 689–724.
Field, A 2009, Discovering statistics using SPSS, Sage Publications, London.
Finegan, PT 1991, ‘Maximizing shareholder value at the private company’, Journal of Applied Corporate Finance, vol. 4, no. 1, pp. 30–45.
Finkelstein, S & Hambrick, DC 1996, Strategic leadership: Top executives and their effects on organizations, Southwestern Publishing, Nashville.
Firth, MA & Rui, OM 2012, Does one size fit all? A study of the simultaneous relations among ownership, corporate governance mechanisms, and the financial performance of firms in China, In: Boubaker S., Nguyen B., Nguyen D. (eds) Corporate Governance. Springer, Berlin, Heidelberg.
Fitrijanti, T & Alamanda, AR 2013, ‘Analysis of disclosure of GCG in Sharia banking, Zakah, social performance, and financing risk-study on Sharia banking in Indonesia’, International Proceedings of Economics Development and Research, vol. 59, no. 30, pp. 146–158.
Fooladi, M & Chaleshtori, N 2011, Corporate governance and firm performance, International Conference on Sociality and Economics Development, IACSIT Press, Singapore, pp. 484–489.
Francis, B, Hasan, I & Wu, Q 2015, ‘Professors in the boardroom and their impact on corporate governance and firm performance’, Financial Management, vol. 44, no. 3, pp. 547–581. Francis, B, Hasan, I & Wu, Q 2015, Professors in the boardroom and their impact on corporate governance and firm performance, Financial Management, vol. 44, no. 3, pp. 547–581.
Freeman, RE 1984, Strategic management: A stakeholder approach, Cambridge University Press, Cambridge.
Gardiner, JC, Luo, Z & Roman, LA 2009, ‘Fixed-effects, random-effects and GEE: What are the differences?’, Statistics in Medicine, vol. 28, no. 2, pp. 221–239.
Geyskens, I, Steenkamp, J & Kumar, N 2006, ‘Make, buy, or ally: A transaction cost theory meta-analysis’, Academy of Management Journal, vol. 49, no. 3, pp. 519–543.
Ghabayen, MA 2012, ‘Board characteristics and firm performance: Case of Saudi Arabia’, International Journal of Accounting and Financial Reporting, vol. 2, no. 2, pp. 168–200.
169
Gillan S & Starks, L 1998, ‘A survey of shareholder activism: Motivation and empirical evidence’, Journal of Applied Corporate Finance, vol. 2, no. 3, pp. 1–38.
Gillan, SL 2006, ‘Recent developments in corporate governance: An overview’, Journal of Corporate Finance, vol. 12, no. 3, pp. 381–402.
Goodstein, J, Gautam, K & Boeker, W 1994, ‘The effects of board size and diversity on strategic change’, Strategic Management Journal, vol. 15, no. 3, pp. 241–250.
Gottesman, AA & Morey, MR 2006, ‘Does a better education make for better managers? An empirical examination of CEO educational quality and firm performance’, Pace University Press, New York.
Greene, WH 2008a, Econometric analysis, 6th edn, Pearson/Prentice Hall, Upper Saddle River, New Jersey.
Greene, WH 2008b, ‘The Measurement of Productive Efficiency and Productivity Growth’, in H. Fried, K. Lovell & S. Schmidt (ed.), The econometric approach to efficiency analysis, Oxford University press, New York, pp. 92–250.
Grewal, R, Cote, JA & Baumgartner, H 2004, ‘Multicollinearity and measurement error in structural equation models: Implications for theory testing’, Marketing Science, vol. 23, no. 4, pp. 519–529. Haat, M, Rahman, R & Mahenthiran, S 2008, Corporate governance, transparency and performance of Malaysian companies, Managerial Auditing Journal, vol. 23, no. 8, pp. 744–778. Hair, J, Black, W, Babin, B & Anderson, R 2010, Multivariate data analysis, 7th edn, Upper Saddle River, Pearson Education International, New Jersey. Hambrick, DC & D’Aveni, RA 1992, ‘Top team deterioration as part of the downward spiral of large corporate bankruptcies’, Management Science, vol. 38, no. 10, pp. 1445–1466.
Hambrick, DC & Mason, PA 1984, ‘Upper echelons: The organization as a reflection of its top managers’, Academy Of Management Review, vol. 9, no. 2, pp. 193–206.
Hamdan, AM, Sarea, AM & Reyad, SMR 2013, ‘The impact of audit committee characteristics on the performance: Evidence from Jordan’, International Management Review, vol. 9, no. 1, pp. 32–41.
Hamid, A & Aziz, R 2012, ‘Impact of the amendments of Malaysian code of corporate governance (2007) on governance of GLCS and performance’, World Academy of Science, Engineering and Technology, International Journal Of Social, Behavioral, Educational, Economic, Business and Industrial Engineering, vol. 6, no. 11, pp. 3181–3186.
Haniffa, R & Hudaib, M 2006, ‘Corporate governance structure and performance of Malaysian listed companies’, Journal of Business Finance & Accounting, vol. 33, no. 8, pp. 1034–1062.

170
Hassan, M & Halbouni, S 2013, ‘Corporate governance, economic turbulence and financial performance of UAE listed firms’, Studies in Economics and Finance, vol. 30, no. 2, pp. 118–138.
Hatch, MJ 2018, Organization theory: Modern, symbolic, and postmodern perspectives, 4th edn, Oxford University Press, London.
Hawkamah 2016, Hawkamah strategy, Hawkamah: The Institute for Corporate Governance, United Arab Emirates, viewed 27 May 2016, https://www.hawkamah.org/about-us/strategy/.
Heide, JB, Kumar, A & Wathne, KH 2014, ‘Concurrent sourcing, governance mechanisms, and performance outcomes in industrial value chains’, Strategic Management Journal, vol. 35, no. 8, pp. 1164–1185.
Herciu, M & Serban, A 2016, ‘Creating value–from corporate governance to total shareholders return: An overview’, Studies in Business and Economics, vol. 11, no. 2, pp. 36–50.
Hermalin, BE & Weisbach, MS 1991, ‘The effects of board composition and direct incentives on firm performance’, FM: The Journal of the Financial Management Association, vol. 20, no. 4, pp. 101–112.
Hillman, AJ & Dalziel, T 2003, ‘Boards of directors and firm performance: Integrating agency and resource dependence perspectives’, Academy of Management Review, vol. 28, no. 3, pp. 383–396.
Hillman, AJ, Cannella, AA & Paetzold, RL 2000, ‘The resource dependence role of corporate directors: Strategic adaptation of board composition in response to environmental change’, Journal of Management Studies, vol. 37, no. 2, pp. 235–256.
Hillman, AJ, Withers, MC & Collins, BJ 2009, ‘Resource dependence theory: A review’, Journal of Management, vol. 35, no. 6, pp. 1404–1427.
Holmstrom, B & Milgrom, P 1991, ‘Multitask principal-agent analyses: Incentive contracts, asset ownership, and job design’, Journal of Law, Economics, & Organization, vol. 7, no. 2, pp. 24–52.
Hosseini, JC & Brenner, SN 1992, ‘The stakeholder theory of the firm: A methodology to generate value matrix weights’, Business Ethics Quarterly, vol. 2, no. 2, pp. 99–119.
Hsu, H-E 2010, ‘The relationship between board characteristics and financial performance: an empirical study of United States initial public offerings’, International Journal of Management, vol. 27, no. 2, pp. 332–341.
Hsu, W & Petchsakulwong, P 2010, ‘The impact of corporate governance on the efficiency performance of the Thai non-life insurance Industry’, The Geneva Papers on Risk and Insurance—Issues and Practice, vol. 25, no. 1, pp. 28–49.
Huang, H-W & Thiruvadi, S 2010, ‘Audit committee characteristics and corporate fraud’, International Journal of Public Information Systems, vol. 6, no. 1, pp. 71–82.
171
Hult, T, Mena, J, Ferrell, O & Ferrell, L 2011, ‘Stakeholder marketing: A definition and conceptual framework’, AMS Review, vol. 1, no. 1, pp. 44–65.
Hussainey, K & Aljifri, K 2012, ‘Corporate governance mechanisms and capital structure in UAE’, Journal of Applied Accounting Research, vol. 13, no. 2, pp. 145–160.
Ibrahim, DN, Raman, KJ & Saidin, FBS 2009, ‘Audit committee characteristics and quality of unaudited financial accounts’, Singapore Management Review, vol. 31, no. 2, pp. 19–33.
Ibrahim, H & Samad, FA 2011, ‘Corporate governance mechanisms and performance of public-listed family-ownership in Malaysia’, International Journal of Economics and Finance, vol. 3, no. 1, pp. 105–115.
Ilaboya, O & Obaretin, O 2015, ‘Board characteristics and firm performance: Evidence from Nigerian quoted companies’, Academic Journal of Interdisciplinary Studies, vol. 4, no. 1, pp. 283–290.
International Finance Corporation 2016, International Finance Corporation—a member of the World Bank Group, viewed 3 February 2017, http://www.ifc.org/wps/wcm/connect/corp_ext_content/ifc_external_corporate_site/home.
International Monetary Fund 2007, United Arab Emirates: Financial System Stability Assessment, Country Report No.07/357, Washington, D.C.
International Monetary Fund 2016, United Arab Emirates: 2016 Article IV Consultation-Staff Report; Staff Supplement; Public Information Notice on the Executive Board Discussion, IMF Country Report No. 16/251, July 2016, Washington, D.C.
Jackling, B & Johl, S 2009, ‘Board structure and firm performance: evidence from India’s top companies’, Corporate Governance: An International Review, vol. 17, no. 4, pp. 492–509.
Jenkins, KC 2013, Outside directors’ experience and the effect on company value: A South African study, doctoral thesis, University of Manchester, Manchester.
Jensen, MC & Meckling, WH 1976, ‘Theory of the firm: managerial behavior, agency costs and ownership structure’, Journal of Financial Economics, vol. 3, no. 4, pp. 305–360.
Jensen, MC 1983, ‘Organization theory and methodology’, Accounting Review, vol. 58, no. 2, pp. 319–339.
Jensen, MC 1993, ‘The modern industrial revolution, exit, and the failure of internal control systems’, Journal of Finance, vol. 48, no. 3, pp. 831–880.
Jensen, MC 2001, ‘Value maximization, stakeholder theory, and the corporate objective function’, Journal of Applied Corporate Finance, vol. 14, no. 3, pp. 8–21.

172
Johl, SK 2006, Corporate entrepreneurship and corporate governance: An empirical analysis, doctoral thesis, University of Nottingham, Nottingham.
Johl, SK, Kaur, S & Cooper, BJ 2015, ‘Board characteristics and firm performance: evidence from Malaysian public listed firms’, Journal of Economics, Business and Management, vol. 3, no. 2, pp. 339–343.
John, R, Sastry, P, & David, D 1998, Applied Regression Analysis: A Research Tool, 2ed edn, Springer-Verlag New York, New York.
Johnson, VE, Khurana, IK & Reynolds, JK 2002, ‘Audit‐firm tenure and the quality of financial reports’, Contemporary Accounting Research, vol. 19, no. 4, pp. 637–660.
Joseph, U, Madugba, JU & Okpe, II 2015, ‘Impact of corporate board meetings on financial performance: Evidence from selected listed companies in Nigeria’, International Journal of Economics and Finance, vol. 7, no. 12, pp. 268–274.
Jun Lin, Z, Xiao, JZ & Tang, Q 2008, ‘The roles, responsibilities and characteristics of audit committee in China’, Accounting, Auditing & Accountability Journal, vol. 21, no. 5, pp. 721–751.
Kachelmeier, S, Rasmussen, S & Schmidt, JJ 2016, ‘When do ineffective audit committee members experience turnover?’, Contemporary Accounting Research, vol. 33, no. 1, pp. 228–260.
Kajola, SO 2008, ‘Corporate governance and firm performance: The case of Nigerian listed firms’, European Journal of Economics, Finance and Administrative Sciences, vol. 14, no. 14, pp. 16–28.
Kalbers, LP & Fogarty, TJ 1998, ‘Organizational and economic explanations of audit committee oversight’, Journal of Managerial Issues, vol. 10, no. 2, pp. 129–150.
Kamal, H & Saadi, H 2013, ‘Corporate governance, economic turbulence and financial performance of UAE listed firms’, Studies in Economics and Finance, vol. 30, no. 2, pp. 118–138.
Kamla, R & Roberts, C 2010, ‘The global and the local: Arabian Gulf States and imagery in annual reports’, Accounting, Auditing & Accountability Journal, vol. 23, no. 4, pp. 449–481.
Kaplan, SN & Minton, BA 1994, Appointments of outsiders to Japanese boards: Determinants and implications for managers. Journal of Financial Economics, vol. 36, no. 2, pp. 225–258.
Kato, T & Long, CX 2005, ‘CEO turnover, firm performance, and corporate governance in Chinese listed firms’, Social Science Research Network, Colgate University Press, New York.
Katuse, P, Kiambati, KK, Ngugi, P & Waititu, A 2013, ‘Role of board size on financial performance of commercial banks’, Journal of Social Science, vol. 2, no. 3, pp. 254–262.
173
Keay, A 2016, ‘Stewardship theory: Is board accountability necessary?’, International Journal of Law and Management, vol. 59, no. 6, pp. 1–24.
Khan, A & Awan, SH 2012, ‘Effect of board composition on firm’s performance: a case of Pakistani listed companies’, Interdisciplinary Journal of Contemporary Research in Business, vol. 3, no. 10, pp. 853–863.
Khatab, H, Masood, M, Zaman, K, Saleem, S & Saeed, B 2011, ‘Corporate governance and firm performance: A case study of Karachi stock market’, International Journal of Trade, Economics and Finance, vol. 2, no. 1, pp. 39–43.
Kiel, GC & Nicholson, GJ 2003, ‘Board composition and corporate performance: How the Australian experience informs contrasting theories of corporate governance’, Corporate Governance: An International Review, vol. 11, no. 3, pp. 189–205.
Kikhia, HY 2014, ‘Board characteristics, audit committee characteristics, and audit fees: Evidence from Jordan’, International Business Research, vol. 7, no. 12, pp. 98–110.
Kinney, WR & McDaniel, LS 1989, ‘Characteristics of firms correcting previously reported quarterly earnings’, Journal of Accounting and Economics, vol. 11, no. 1, pp. 71–93.
Kirk, G 2009, ‘Corporate governance and the financial crisis’, OECD Financial Market Trends, vol. 96, no. 1, pp. 1–30.
Klapper, LF & Love, I 2004, ‘Corporate governance, investor protection, and performance in emerging markets’, Journal of Corporate Finance, vol. 10, no. 5, pp. 703–728.
Klein, A 1998, ‘Firm performance and board committee structure’, The Journal of Law and Economics, vol. 41, no. 1, pp. 275–304.
Klein, A 2002, ‘Audit committee, board of director characteristics, and earnings management’, Journal of Accounting and Economics, vol. 33, no. 3, pp. 375–400.
Koller, T, Goedhart, M. & Wessels, D 1996, Valuation: Measuring and managing the value of companies, John Wiley & Sons, New Jersey.
Kyereboah-Coleman, A & Biekpe, N 2006, ‘The link between corporate governance and performance of the non-traditional export sector: Evidence from Ghana’, Corporate Governance: The International Journal of Business in Society, vol. 6, no. 5, pp. 609–623.
Kyereboah-Coleman, A 2008, ‘Corporate governance and firm performance in Africa: A dynamic panel data analysis’, Studies in Economics and Econometrics, vol. 32, no. 2, pp. 1–24.
Lai, L & Tam, H 2007, ‘Independent directors and the propensity to smooth earnings: A study of corporate governance in China’, The Business Review, vol. 7, no. 1, pp. 328–335.

174
Lama, TB 2013, ‘Empirical Evidence on the Link Between Compliance with Governance of Best Practice and Firms' Operating Results’, Australasian Accounting, Business and Finance Journal, vol. 6, no. 5, pp. 63–80.
Leiblein, MJ 2003, ‘The choice of organizational governance form and performance: Predictions from transaction cost, resource-based, and real options theories’, Journal of Management, vol. 29, no. 6, pp. 937–961.
Lim, R 2011, ‘Are corporate governance attributes associated with accounting conservatism?’, Accounting & Finance, vol. 51, no. 4, pp. 1007–1030.
Lin, T-T & Lee, Y 2008, ‘Organizational characteristics, board size and corporate performance’, Journal of Global Business Management, vol. 4, no. 2, pp. 338–347.
Lipman, FD & Lipman, LK 2006, Corporate governance best practices: Strategies for public, private, and not-for-profit organizations, 1st edn, John Wiley & Sons, New Jersey.
Lipton, M & Lorsch, JW 1992, ‘A modest proposal for improved corporate governance’, Business Lawyer, vol. 48, no. 1, pp. 59–77.
Liu, H & Fong, MW 2010, ‘Board characteristics of medium and large Chinese companies’, Corporate Governance: The International Journal of Business in Society, vol. 10, no. 2, pp. 163–175.
Ljubojevic, L & Gordana, L 2011, ‘Improving the stakeholder satisfaction by corporate governance quality’, Skola Biznisa, vol. 1, no. 2, pp. 22–35.
Loi, H & Khan, A 2012, Determinants of firm growth: Evidence from Belgian companies, Unpublished Master’s thesis, State University of Ghent, Kortrijk, Belgium.
Luan, CJ & Tang, MJ 2007, ‘Where is independent director efficacy?’, Corporate Governance: An International Review, vol. 15, no. 4, pp. 636–643.
Luo, H, Labelle, R, Piot, C & Thornton, D 2009, ‘Board monitoring, audit committee effectiveness, and financial reporting quality: Review and synthesis of empirical evidence’, Journal of Forensic & Investigative Accounting, vol. 1, no. 2, pp. 1–41.
Luo, X & Bhattacharya, CB 2006, ‘Corporate social responsibility, customer satisfaction, and market value’, Journal of Marketing, vol. 70, no. 4, pp. 1–18.
Mak, YT & Kusnadi, Y 2005, ‘Size really matters: Further evidence on the negative relationship between board size and firm value’, Pacific-Basin Finance Journal, vol. 13, no. 3, pp. 301–318.
Makhlouf, MH, Laili, NHB & Basah, MYA 2014, ‘Board of directors’ characteristics and firms’ performance among Jordanian firms, proposing conceptual framework’, International Journal of Technical Research and Applications, vol. 2, no. 4, pp. 18–23. Malhotra, D, Poteau, R & Russel, P 2015, An Empirical examination of the relationship between audit fee and firm performance, International Journal of Business, Accounting, & Finance, vol. 9, no. 2, pp.112–122.

175
Malhotra, NK, Peterson, M & Kleiser, SB 1999, ‘Marketing research: a state-of-the-art review and directions for the twenty-first century’, Journal of the Academy of Marketing Science, vol. 27, no. 2, pp. 160–183.
Mallin, C 2016, Corporate governance, Oxford University Press, Oxford.
Marsh, HL & Powell, TE 1989, ‘The audit committee charter: RX for fraud prevention’, Journal of Accountancy, vol. 165, no. 2, pp. 55–69.
Masoom, K 2013, The entrepreneur’s dictionary of business and financial terms, 1st edn, PartridgeIndia, Delhi.
McDaniel, L, Martin, RD & Maines, LA 2002, ‘Evaluating financial reporting quality: The effects of financial expertise vs. financial literacy’, The Accounting Review, vol. 77, no. 1, pp. 139–167.
Menon, K & Williams, JD 1994, ‘The use of audit committees for monitoring’, Journal of Accounting and Public Policy, vol. 13, no. 2, pp. 121–139.
Michelberger, K 2016, ‘Corporate governance effects on firm performance: a literature review’, Regional Formation and Development Studies, vol. 20, no. 3, pp. 84–95.
Min-Hsien, C & Jia-Hui, L 2007, ‘The relationship between corporate governance and firm productivity: evidence from Taiwan’s manufacturing firms’, Corporate Governance: An International Review, vol. 15, no. 5, pp. 768–779.
Ministry of Economy 2009, The governance rules and corporate discipline standards for UAE public joint stock companies (PJSC), United Arab Emirates Government, UAE.
Mintzberg, H 1983, Power in and around organizations, Prentice-Hall Englewood Cliffs, New Jersey.
Mitchell, RK, Agle, BR & Wood, DJ 1997, ‘Toward a theory of stakeholder identification and salience: Defining the principle of who and what really counts’, Academy of Management Review, vol. 22, no. 4, pp. 853–886.
Mizuno, M 2014, ‘Corporate governance, institutional investors, and firm performance in France’, Journal of Business and Finance, vol. 2, no. 1, pp. 33–46. Mohammad, W, Wasiuzzaman, S, Morsali, S & Zaini, R 2018, The Effect of audit committee characteristics on financial restatements in Malaysia, Journal of Asia-Pacific Business, vol. 19, no. 1, pp. 4-22.
Mohammed, NF, Ahmed, K & Ji, X-D 2010, ‘Accounting conservatism, corporate governance and political influence: evidence from Malaysia’, Asian Review of Accounting, vol. 25, no. 2, pp. 288–318.
Mohiuddin, M & Karbhari, Y 2010, ‘Audit committee effectiveness: A critical literature review’, AIUB Journal of Business and Economics, vol. 9, no. 1, pp. 97–125.

176
Mollah, AS & Uddin, M 2007, ‘Ownership structure, corporate governance, and firm’s performance in emerging markets: Evidence from Bangladesh’, International Journal of Finance, vol. 19, no. 1, pp. 4315–4333.
Monks, R & Minow, N 2004, Corporate governance, 3rd edn, Blackwell Business, Oxford.
Moses, T 2016, ‘The impact of audit committee size on the quality of financial reporting in quoted Nigerian banks’, International Journal of Advanced Academic Research, vol. 2, no. 5, pp. 62–74.
Mura, R 2007, ‘Firm performance: Do non‐executive directors have minds of their own? Evidence from UK panel data’, Financial Management, vol. 36, no. 3, pp. 81–112.
Muth, MM & Donaldson, L 1998, ‘Stewardship theory and board structure: A contingency approach’, Corporate Governance, vol. 6, no. 1, pp. 5–28.
Navin, H 2017, Dubai real estate’s India connection, GulfNews, UAE, viewed 9 November 2017, https://gulfnews.com/business/property/dubai-real-estate-s-india-connection-1.2038751.
Nazar, RA 2015, Impact Of Corporate Board Size On Corporate Performance: Evidence From Sri Lanka. International Journal of Management and Applied Science, vol. 1, no. 2, pp. 40–44.
Newey, WK & West, KD 1986, ‘A simple, positive semi-definite, heteroskedasticity and autocorrelationconsistent covariance matrix’, Econometrica, vol. 55, no. 3, pp. 703–708.
Nicholson, GJ & Kiel, GC 2007, ‘Can directors impact performance? A case‐based test of three theories of corporate governance’, Corporate Governance: An International Review, vol. 15, no. 4, pp. 585–608.
Nickell, W 2006, The CEP-OECD Institutions Data Set (1960–2004), 1st edn, Centre for Economic Performance, London School of Economics and Political Science, London.
Ntim, CG & Oseit, KA 2011, ‘The impact of corporate board meetings on corporate performance in South Africa’, African Review of Economics and Finance, vol. 2, no. 2, pp. 83–103.
Nuryanah, S & Islam, S 2011, ‘Corporate governance and performance: Evidence from an emerging market’, Malaysian Accounting Review, vol. 10, no. 1, pp. 17–42.
O’Brien, RM 2007, ‘A caution regarding rules of thumb for variance inflation factors’, Quality & Quantity, vol. 41, no. 5, pp. 673–690.
O’Connell, V & Cramer, N 2010, ‘The relationship between firm performance and board characteristics in Ireland’, European Management Journal, vol. 28, no. 5, pp. 387–399.
177
O’Toole, J & Mayer, D 2013, Good business: Exercising effective and ethical leadership, 1st edn, Routledge Taylor & Francis Group, New York.
Oates, G 2013, ‘Exploring the links between stakeholder type, and strategic response to stakeholder and institutional demands in the public sector context’, International Journal of Business and Management, vol. 8, no. 21, pp. 50–62.
Obradovich, J & Gill, A 2013, ‘The impact of corporate governance and financial leverage on the value of American firms’, International Research Journal of Finance and Economics, vol. 1, no. 1, pp. 1–14.
OECD 2004, Organisation of economic cooperation and development principles of corporate governance, OECD Publishing, Paris.
OECD 2015, OECD principles of corporate governance, OECD Publishing, Paris.
Ondersteijn, C, Giesen, G & Huirne, R 2003, ‘Identification of farmer characteristics and farm strategies explaining changes in environmental management and environmental and economic performance of dairy farms’, Agricultural Systems, vol. 78, no. 1, pp. 31–55.
Onetto, AE 2007, ‘Agency problems and the board of directors’, Journal of International Banking and Financial Law, vol. 1, no. 2, pp. 414–417.
Palaniappan, G 2017, ‘Determinants of corporate financial performance relating to board characteristics of corporate governance in Indian manufacturing industry: An empirical study’, European Journal of Management and Business Economics, vol. 26, no. 1, pp. 67–85.
Pearce Ii, JA & Zahra, SA 1992, ‘Board composition from a strategic contingency perspective’, Journal of Management Studies, vol. 29, no. 2, pp. 411–438.
Persons, OS 2009, ‘Audit committee characteristics and earlier voluntary ethics disclosure among fraud and no-fraud firms’, International Journal of Disclosure and Governance, vol. 6, no. 4, pp. 284–297.
Pesqueux, Y & Damak-Ayadi, S 2005, ‘Stakeholder theory in perspective’, Corporate Governance: The International Journal of Business in Society, vol. 5, no. 2, pp. 5–21.
Pfeffer, J & Salancik, GR 1978, The external control of organizations: A resource dependence approach, Harper and Row Publishers, New York.
Pfeffer, J & Salancik, GR 2003, The external control of organizations: A resource dependence perspective, 1st edn, Stanford University Press, Harper & Row, New York.
Pfeffer, J 1972, ‘Size and composition of corporate boards of directors: The organization and its environment’, Administrative Science Quarterly, vol. 17, no. 2, pp. 218–228.
Phillips, RA, Freeman, RE & Wicks, AC 2007, ‘What stakeholder theory is not’, Business Ethics Quarterly, vol. 13, no. 2, pp. 479–502.
178
Pincus, K, Rusbarsky, M & Wong, J 1989, ‘Voluntary formation of corporate audit committees among Nasdaq firms’, Journal of Accounting and Public Policy, vol. 8, no. 2, pp. 239–265.
Prentice, RA & Spence, DB 2006, ‘Sarbanes-Oxley as quack corporate governance: How wise is the received wisdom’, The Georgetown Law Journal, vol. 95, no. 10, pp. 1843–1909.
Raghunandan, K & Rama, DV 2017, ‘Determinants of audit committee diligence’, Accounting Horizons, vol. 21, no. 3, pp. 265–279. Rahman, R & Mohamed, A 2006, Board, audit committee, culture and earnings management: Malaysian evidence, Managerial Auditing Journal, vol. 21, no. 7, pp. 783–804.
Ram, C 2005, Boards that deliver—advancing corporate governance: From compliance to competitive advantage, 1st edn, Jossey-Bass: A Willey Imprint, New York.
Ramdani, D & Witteloostuijn, AV 2010, ‘The impact of board independence and CEO duality on firm performance: a quantile regression analysis for Indonesia, Malaysia, South Korea and Thailand’, British Journal of Management, vol. 21, no. 3, pp. 607–627.
Rappaport, A 1986, Creating shareholder value: The new standard for business performance, 1st edn, Simon & Schuster, New York Free Press, New York.
Rashid, A, De Zoysa, A, Lodh, S & Rudkin, K 2010, ‘Board composition and firm performance: Evidence from Bangladesh’, Australasian Accounting, Business and Finance Journal, vol. 4, no. 1, pp. 76–95.
Roberts, J 2005, ‘Agency theory, ethics and corporate governance’, Advances in Public Interest Accounting, vol. 11, no. 4, pp. 249–269.
Roberts, J, McNulty, T & Stiles, P 2005, ‘Beyond agency conceptions of the work of the non-executive director: Creating accountability in the boardroom’, British Journal of Management, vol. 16, no. 1, pp. 5–26.
Romano, R 2004, The Sarbanes-Oxley Act and the making of quack corporate governance, Yale School of Management Working Papers, University of Pennsylvania Press, Philadelphia, Pennsylvania.
Rouf, A 2014, ‘The relationship between corporate governance and value of the firm in developing countries: Evidence from Bangladesh’, Journal of Economics and Business Research, vol. 18, no. 1, pp. 73–85.
Rouf, M 2011, ‘The relationship between corporate governance and value of the firm in developing countries: Evidence from Bangladesh’, The International Journal of Applied Economics and Finance, vol. 5, no. 3, pp. 237–244.
Ruparel, AP 2015, With $2 bn investments in H1 2015, Dubai a new favourite for Indians, The Indian Express, viewed 12 July 2016, http://indianexpress.com/article/business/business-others/with-2-bn-investments-in-h1-2015-dubai-a-new-favourite-for-indians/.

179
Ruzaidah, R & Takiah, M 2004, ‘The effectiveness of audit committee in monitoring the quality of corporate governance’, Corporate Governance: An International Perspective Malaysian Institute of Corporate Governance, MICG Publication, pp. 154–175.
Salehi, M, Moradi, M & Paiydarmanesh, N 2017, ‘The effect of corporate governance and audit quality on disclosure quality: Evidence from Tehran Stock Exchange’, Periodica Polytechnica Social and Management Sciences, vol. 25, no. 1, pp. 32–48.
Santos, JB & Brito, LAL 2012, ‘Toward a subjective measurement model for firm performance’, Bar-Brazilian Administration Review, vol. 9, no. 2, pp. 95–117.
Shan, YG & Mciver, RP 2011, ‘Corporate governance mechanisms and financial performance in China: Panel data evidence on listed non-financial companies’, Asia Pacific Business Review, vol. 17, no. 3, pp. 301–324.
Shearer, R & Clark, T 2016, ‘Are we drawing the correct conclusions? Regression analysis in the nonprofit literature’, Canadian Journal of Nonprofit and Social Economy Research, vol. 7, no. 1, pp. 22–28.
Shehata, NF 2015, ‘Development of corporate governance codes in the GCC: An overview’, Corporate Governance, vol. 15, no. 3, pp. 315–338.
Shleifer, A & Vishny, RW 1997, ‘A survey of corporate governance’, The Journal of Finance, vol. 52, no. 2, pp. 737–783.
Shukeri, SN, Shin, OW & Shaari, MS 2012, ‘Does board of director’s characteristics affect firm performance? Evidence from Malaysian public listed companies’, International Business Research, vol. 5, no. 9, pp. 120–127.
Siebels, JF & Knyphausen, D 2012, ‘A review of theory in family business research: the implications for corporate governance’, International Journal of Management Reviews, vol. 14, no. 3, pp. 280–304.
Silwal, PP 2016, ‘Effects of corporate governance on the performance of Nepalese firms’, The International Research Journal of Management Science, vol. 1, no. 2, pp. 43–59.
Simon, HA 1982, Models of bounded rationality: Behavioral economics and business organization, vol. 2, The Massachusetts Institute of Technology, MIT Press Cambridge, MA, pp. 478–505.
Singh, K 2007, Quantitative social research methods, Sage, New Delhi.
Singh, S 2005, Corporate Governance: Global Concepts and Practices, Excel Books India, New Delhi.
Solomon, J 2010, Corporate governance and accountability, 3rd edn, John Wiley & Sons, London.

180
Spanos, LJ 2005, ‘Corporate governance in Greece: Developments and policy implications’, Corporate Governance: The International Journal of Business in Society, vol. 5, no. 1, pp. 15–30.
Sprenger, C & Lazareva, O 2017, Corporate governance and investment: Evidence from Russian unlisted firms, National Research University Higher School of Economics Press, Shabolovka, Moscow, Russia, pp. 1–52.
Sternberg, E 1997, ‘The defects of stakeholder theory’, Corporate Governance: An International Review, vol. 5, no. 1, pp. 3–10.
Steven, B & Carla, S 2010, United Arab Emirates: Changes in Corporate Governance Legislation Ministerial Resolution No. 518 of 2009, viewed 25 May 2016, http://www.mondaq.com/x/96232/corporate+governance/changes+in+corporate+go%20vernance+legislation+ministerial+resolution+no+518+of+2009. Stewart, J & Kent, P 2006, Relation between external audit fees, audit committee characteristics and internal audit, Accounting & Finance, vol. 46, no. 3, pp. 387–404.
Suadiye, G 2017, ‘The effects of corporate governance practices on firm performance: Empirical evidence from Turkey’, Clear International Journal of Research in Commerce & Management, vol. 8, no. 11, pp. 45–50.
Sueyoshi, T, Goto, M & Omi, Y 2010, ‘Corporate governance and firm performance: Evidence from Japanese manufacturing industries after the lost decade’, European Journal of Operational Research, vol. 203, no. 3, pp. 724–736.
Sundaram, AK & Inkpen, AC 2004, ‘The corporate objective revisited’, Organization Science, vol. 15, no. 3, pp. 350–363.
Szekely, G, Rizzo, L & Bakirov, N 2007, ‘Measuring and testing independence by correlation of distances’, Annals of Statistics, vol. 35, no. 6, pp. 2769–2794.
Tabachnick, B & Fidell, L 2007, ‘Multivariate analysis of variance and covariance’, Using Multivariate Statistics, vol. 3, no. 4, pp. 402–407.
Tailab, MM 2014, ‘Analyzing factors effecting profitability of non-financial US firms’, Research Journal of Finance and Accounting, vol. 5, no. 22, pp. 17–26.
Tarak Nath, S & Apu, M 2013, ‘Impact of board composition and board meeting on firms’ performance: a study of selected Indian companies’, Vilakshan: The Ximb Journal of Management, vol. 10, no. 2, pp. 99–112. Tarus, D & Omandi, E 2013, Business case for corporate transparency: evidence from Kenya, European Journal of Business and Management, vol. 5, no. 3, pp. 113–126.
Teh, BH, Ong, TS, Samuel, AB & Ng, SH 2016, ‘An empirical study of auditors switching, corporate governance and financial performances of Malaysian public listed companies (PLCS)’, Jurnal Pengurusan, vol. 47, no. 1, pp. 43–53.
Tharenou, P, Donohue, R & Cooper, B 2007, ‘Management research methods’, Cambridge University Press, Port Melbourne.

181
Thompson, JD 1967, Organizations in action: Social science bases of administrative theory, Transaction Publishers, Nebraska.
Tian, JJ & Lau, C-M 2001, ‘Board composition, leadership structure and performance in Chinese shareholding companies’, Asia Pacific Journal of Management, vol. 18, no. 2, pp. 245–263.
Trading Economics 2017, Trading, economics—UAE GDP, viewed 19 August 2017, http://www.tradingeconomics.com/united-arab-emirates/gdp. Uddin, S & Choudhury, J 2008, Rationality, traditionalism and the state of corporate governance mechanisms: Illustrations from a less-developed country, Accounting, Auditing and Accountability Journal, vol. 21, no. 7, pp. 1026–1051.
Vafeas, N & Theodorou, E 1998, ‘The relationship between board structure and firm performance in the UK’, The British Accounting Review, vol. 30, no. 4, pp. 383–407.
Vafeas, N & Waegelein, JF 2007, ‘The association between audit committees, compensation incentives, and corporate audit fees’, Review of Quantitative Finance and Accounting, vol. 28, no. 3, pp. 241–255.
Vafeas, N 1999, ‘Board meeting frequency and firm performance’, Journal of Financial Economics, vol. 53, no. 1, pp. 113–142.
Van Slyke, DM 2006, ‘Agents or stewards: Using theory to understand the government-nonprofit social service contracting relationship’, Journal of Public Administration Research and Theory, vol. 17, no. 2, pp. 157–187.
Veal, AJ 2005, Business research methods: A managerial approach, 2nd edn, Pearson Education Australia/Addison Wesley, South Melbourne, Victoria.
Veklenko, K 2016, The Impact of Board Composition on the Firm’s Performance in Continental Europe, University of Twente, Enschede, Netherlands.
Vo, D & Phan, T 2013, ‘Corporate governance and firm performance: Empirical evidence from Vietnam’, Journal of Economic Development, vol. 6, no. 2, pp. 62–78.
Vo, H & Nguyen, M 2014, ‘The impact of corporate governance on firm performance: empirical study in Vietnam’, International Journal of Economics and Finance, vol. 6, no. 6, pp. 1–13.
Wailerdsak, N & Suehiro, A 2004, ‘Top executive origins: Comparative study between Japan and Thailand’, Asian Business & Management, vol. 3, no. 1, pp. 85–104.
Walker, D 2005, Governing the corporation: Regulation and corporate governance in an age of scandal and global markets, John Wiley & Sons, UK.
Weir, C & Laing, D 2001, ‘Governance structures, director independence and corporate performance in the UK’, European Business Review, vol. 13, no. 2, pp. 86–95.
Weir, C, Laing, D & McKnight, PJ 2002, ‘Internal and external governance mechanisms: their impact on the performance of large UK public companies’, Journal of Business Finance & Accounting, vol. 29, no. 5, pp. 579–629.

182
Westphal, JD & Zajac, EJ 2013, ‘A behavioral theory of corporate governance: Explicating the mechanisms of socially situated and socially constituted agency’, Academy of Management Annals, vol. 7, no. 1, pp. 607–661.
White, H 1980, ‘A heteroskedasticity-consistent covariance matrix estimator and a direct test for heteroskedasticity’, Econometrica: Journal of the Econometric Society, vol. 48, no. 4, pp. 817–838.
Wiersema, MF & Bantel, KA 1992, ‘Top management team demography and corporate strategic change’, Academy of Management Journal, vol. 35, no. 1, pp. 91–121.
Wild, JJ 1996, ‘The audit committee and earnings quality’, Journal of Accounting, Auditing & Finance, vol. 11, no. 2, pp. 247–276.
Williamson, OE 1975, Markets and hierarchies: Analysis and antitrust implications: A study in the economics of internal organization, Free Press, New York.
Williamson, OE 1978, Markets and hierarchies: Analysis and antitrust implications, 1st edn, Free Press, New York.
Williamson, OE 1985, The economic institutions of capitalism firms markets relational contracting, Free Press, New York.
Williamson, OE 1993, ‘The evolving science of organisation’, Journal of Institutional and Theoretical Economics, vol. 149, no. 1, pp. 36–63.
Williamson, OE 1996a, ‘Economics and organization: A primer’, California Management Review, vol. 38, no. 2, pp. 131–146.
Williamson, OE 1996b, The mechanisms of governance, Oxford University Press, New York.
Wilson, P, Hadley, D & Asby, C 2001, ‘The influence of management characteristics on the technical efficiency of wheat farmers in eastern England’, Agricultural Economics, vol. 24, no. 3, pp. 329–338.
Wooldridge, JM 2010, Econometric analysis of cross section and panel data, MIT Press, Massachusetts.
Wright, N & Deacon, N 2010, ‘Attributes of “experienced” board members’, New Zealand Journal of Applied Business Research, vol. 8, no. 1, pp. 1–13.
Wu, W 2009, ‘Board composition and firm performance: A quantitative study on Chinese listed companies’, Journal of Management, vol. 2, pp. 28–65.
Yang, JS & Krishnan, J 2005, ‘Audit committees and quarterly earnings management’, International Journal of Auditing, vol. 9, no. 3, pp. 201–219.
Yasser, QR, Entebang, HA & Mansor, SA 2011, ‘Corporate governance and firm performance in Pakistan: the case of Karachi Stock Exchange (KSE)-30’, Journal of Economics and International Finance, vol. 3, no. 8, pp. 482–491.
183
Yermack, D 1996, ‘Higher market valuation of companies with a small board of directors’, Journal of Financial Economics, vol. 40, no. 2, pp. 185–211.
Yusoff, WFW & Alhaji, IA 2012, ‘Insight of corporate governance theories’, Journal of Business & Management, vol. 1, no. 1, pp. 52–63.
Zahra, SA & Pearce, JA 1989, ‘Boards of directors and corporate financial performance: A review and integrative model’, Journal of Management, vol. 15, no. 2, pp. 291–334.
Zheka, V 2006, Corporate governance and firm performance in Ukraine, Heriot-Watt University Centre for Economic Reform and Transformation Discussion Paper, vol. 5, pp. 1–68.
Zhu, DH & Shen, W 2016, ‘Why do some outside successions fare better than others? The role of outside CEOs’ prior experience with board diversity’, Strategic Management Journal, vol. 37, no. 13, pp. 1–28.
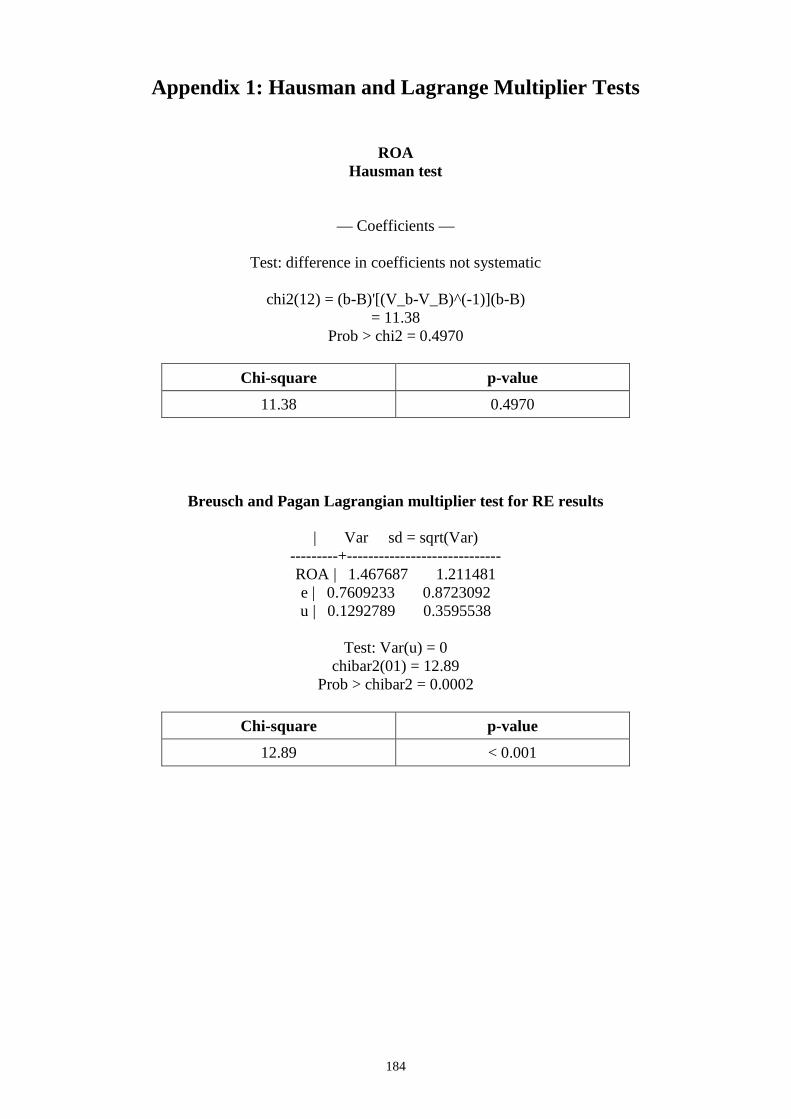
184
Appendix 1: Hausman and Lagrange Multiplier Tests
ROA Hausman test
— Coefficients —
Test: difference in coefficients not systematic
chi2(12) = (b-B)'[(V_b-V_B)^(-1)](b-B) = 11.38
Prob > chi2 = 0.4970
Chi-square p-value
11.38 0.4970
Breusch and Pagan Lagrangian multiplier test for RE results
| Var sd = sqrt(Var) ---------+----------------------------- ROA | 1.467687 1.211481 e | 0.7609233 0.8723092 u | 0.1292789 0.3595538
Test: Var(u) = 0
chibar2(01) = 12.89 Prob > chibar2 = 0.0002
Chi-square p-value
12.89 < 0.001
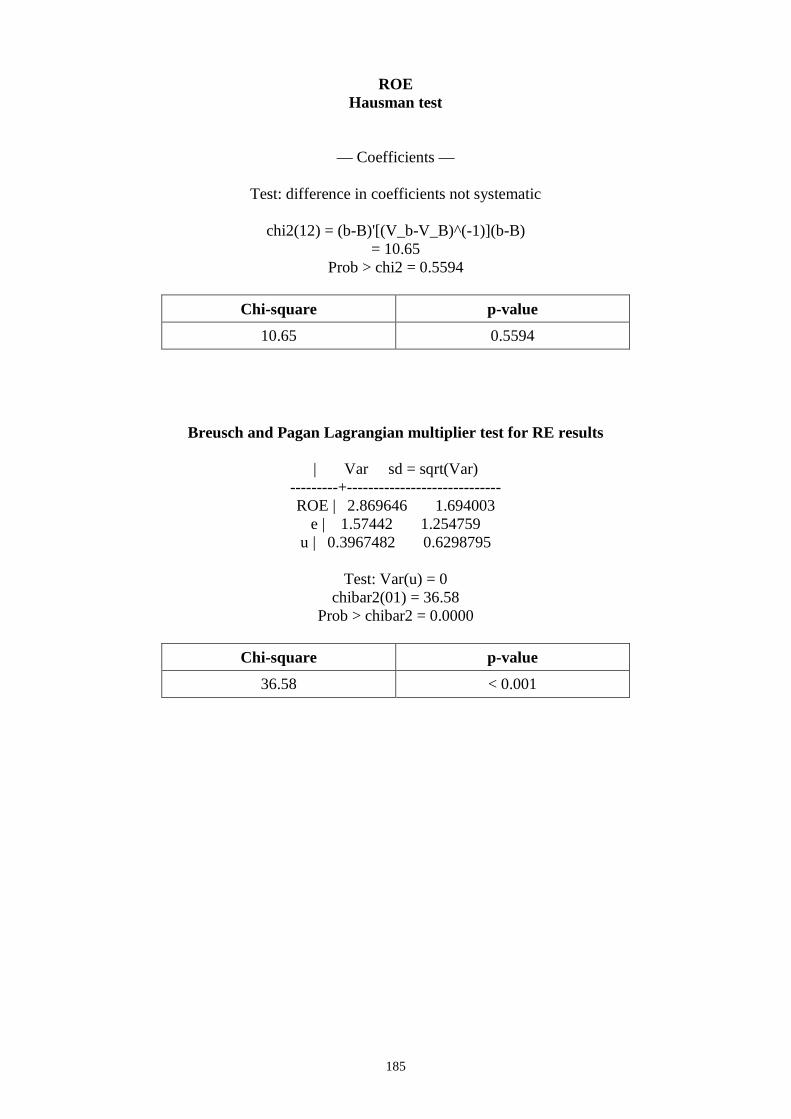
185
ROE Hausman test
— Coefficients —
Test: difference in coefficients not systematic
chi2(12) = (b-B)'[(V_b-V_B)^(-1)](b-B) = 10.65
Prob > chi2 = 0.5594
Chi-square p-value
10.65 0.5594
Breusch and Pagan Lagrangian multiplier test for RE results
| Var sd = sqrt(Var) ---------+----------------------------- ROE | 2.869646 1.694003
e | 1.57442 1.254759 u | 0.3967482 0.6298795
Test: Var(u) = 0
chibar2(01) = 36.58 Prob > chibar2 = 0.0000
Chi-square p-value
36.58 < 0.001
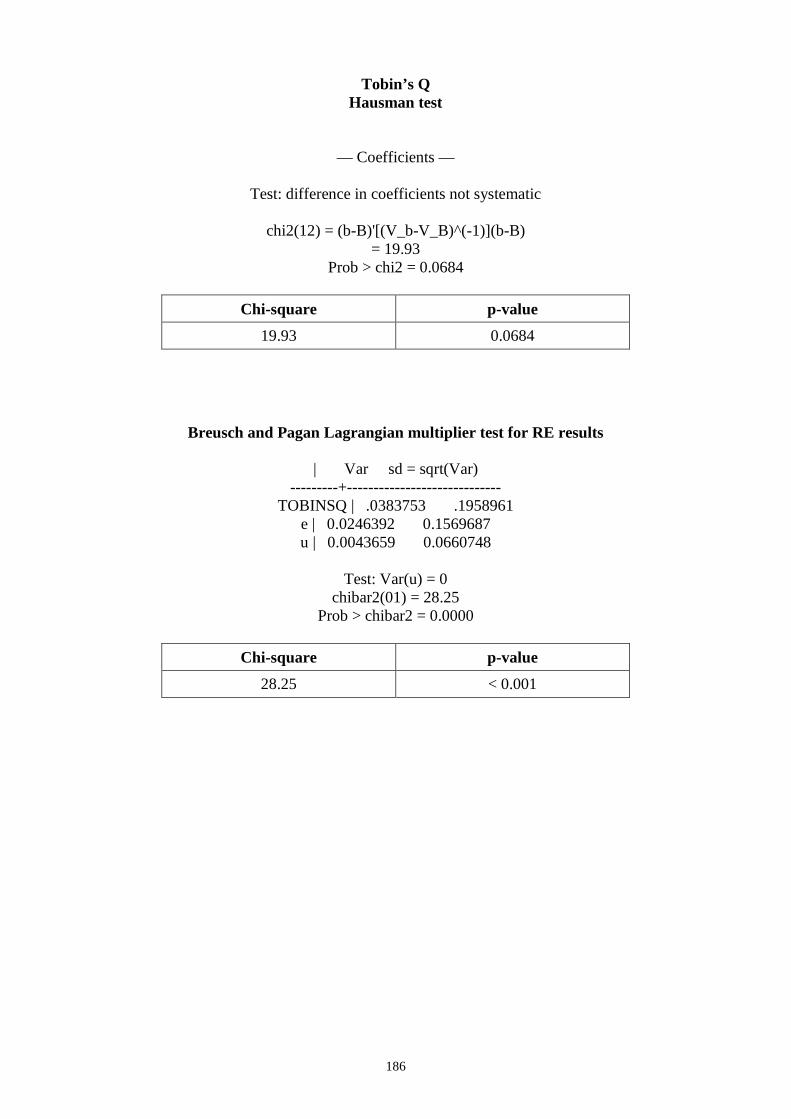
186
Tobin’s Q Hausman test
— Coefficients —
Test: difference in coefficients not systematic
chi2(12) = (b-B)'[(V_b-V_B)^(-1)](b-B) = 19.93
Prob > chi2 = 0.0684
Chi-square p-value
19.93 0.0684
Breusch and Pagan Lagrangian multiplier test for RE results
| Var sd = sqrt(Var) ---------+-----------------------------
TOBINSQ | .0383753 .1958961 e | 0.0246392 0.1569687 u | 0.0043659 0.0660748
Test: Var(u) = 0
chibar2(01) = 28.25 Prob > chibar2 = 0.0000
Chi-square p-value
28.25 < 0.001

187
Appendix 2: Variance Inflation Factor and Tolerance (1/VIF)
Test
VIF test
Variable | VIF 1/VIF -------------+------------------------------------------ BS | 1.61 0.620173 ACM | 1.53 0.652454 BCOM | 1.52 0.655951 ACS | 1.42 0.703426 BM | 1.30 0.769265 BMEX | 1.28 0.783620 ACC | 1.17 0.852060 ACED | 1.14 0.876637 BMED | 1.13 0.885693 FIRMAGE | 1.42 0.704973 FSlogAsset | 1.37 0.730837 LEVERAGES | 1.07 0.932718
-------------+---------------------- Mean VIF | 1.33

188
Appendix 3: Tukey’s Honestly Significant Difference Tests
Multiple Comparisons (Tukey HSD) Year(i) Year(j) Mean
Difference (i-j)
Std Error
Sig. 95% Confidence Interval
Lower Bound
Upper Bound
BS 2006–2007 2009–2010 ˗0.043 0.315 0.990 ˗0.78 0.7
2013–2014 ˗0.330 0.315 0.547 ˗1.07 0.41
2009–2010 2006–2007 0.043 0.315 0.990 ˗0.70 0.78
2013–2014 ˗0.287 0.315 0.633 ˗1.03 0.45
2013–2014 2006–2007 0.330 0.315 0.547 ˗0.41 1.07
2009–2010 0.287 0.315 0.633 ˗0.45 1.03
BCOM 2006–2007 2009–2010 .05894 2.78596 0.999 ˗6.5056 6.6235
2013–2014 ˗0.70309 2.78596 0.966 ˗7.2676 5.8615
2009–2010 2006–2007 ˗0.05894 2.78596 0.999 ˗6.6235 6.5056
2013–2014 ˗0.76202 2.78596 0.960 ˗7.3266 5.8025
2013–2014 2006–2007 0.70309 2.78596 0.966 ˗5.8615 7.2676
2009–2010 0.76202 2.78596 0.960 ˗5.8025 7.3266
BM 2006–2007 2009–2010 ˗0.313 0.198 0.256 ˗0.78 0.15
2013–2014 ˗1.026* 0.198 < 0.001 ˗1.49 ˗0.56
2009–2010 2006–2007 0.313 0.198 0.256 ˗0.15 0.78
2013–2014 ˗0.713* 0.195 0.001 ˗1.17 ˗0.25
2013–2014 2006–2007 1.026* 0.198 < 0.001 0.56 1.49
2009–2010 0.713* 0.195 0.001 0.25 1.17
BMED 2006–2007 2009–2010 ˗4.53691 2.1035 0.081 ˗9.4934 0.4195
2013–2014 ˗12.50223* 2.1035 < 0.001 ˗17.458 ˗7.5458
2009–2010 2006–2007 4.53691 2.1035 0.081 ˗.4195- 9.4934
2013–2014 ˗7.96532* 2.1035 0.001 ˗12.921 ˗3.0089
2013–2014 2006–2007 12.50223* 2.1035 < 0.001 7.5458 17.4587
2009–2010 7.96532* 2.1035 0.001 3.0089 12.921
BMEX 2006–2007 2009–2010 ˗2.546* 0.679 0.001 ˗4.14 ˗0.95
2013–2014 ˗5.220* 0.679 < 0.001 ˗6.82 ˗3.62
2009–2010 2006–2007 2.546* 0.679 0.001 0.95 4.14
2013–2014 ˗2.675* 0.679 < 0.001 ˗4.27 ˗1.08
2013–2014 2006–2007 5.220* 0.679 < 0.001 3.62 6.82
2009–2010 2.675* 0.679 < 0.001 1.08 4.27
ACS 2006–2007 2009–2010 ˗0.032 0.088 0.930 ˗0.24 0.18
2013–2014 ˗0.053 0.088 0.818 ˗0.26 0.15
2009–2010 2006–2007 0.032 0.088 0.930 ˗0.18 0.24
2013–2014 ˗0.021 0.088 0.968 ˗0.23 0.19
2013–2014 2006–2007 0.053 0.088 0.818 ˗0.15 0.26
2009–2010 0.021 0.088 0.968 ˗0.19 0.23
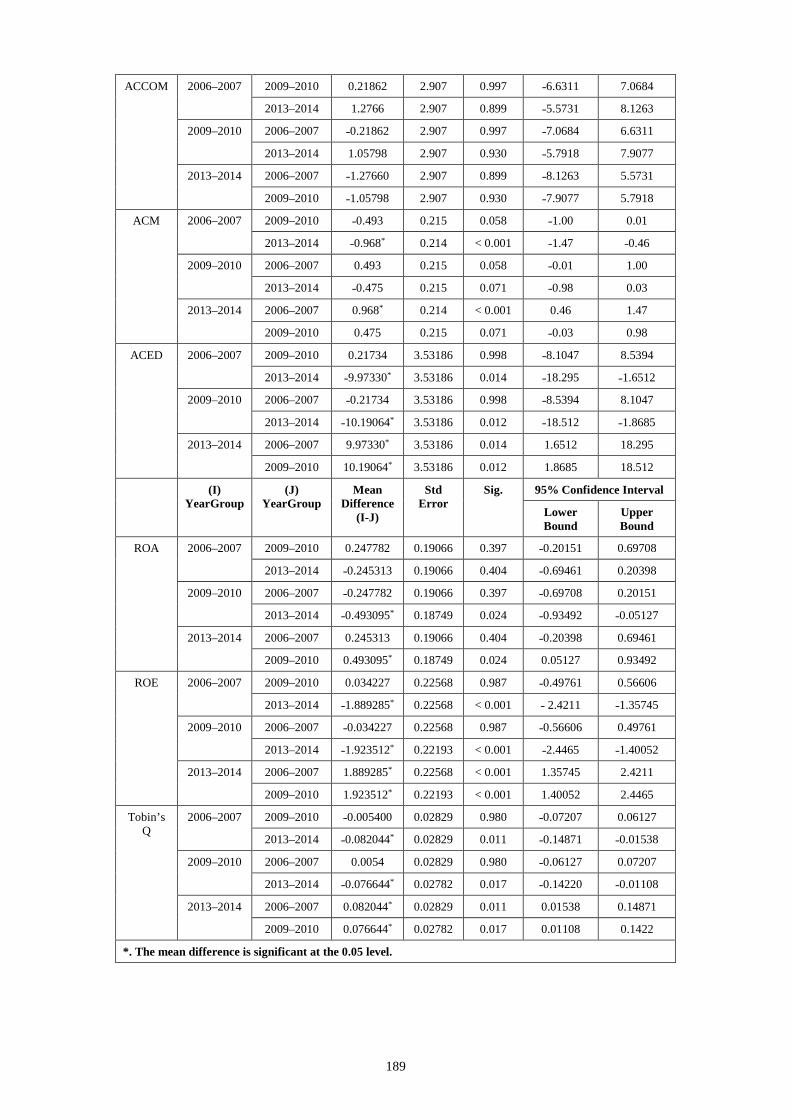
189
ACCOM 2006–2007 2009–2010 0.21862 2.907 0.997 ˗6.6311 7.0684
2013–2014 1.2766 2.907 0.899 ˗5.5731 8.1263
2009–2010 2006–2007 ˗0.21862 2.907 0.997 ˗7.0684 6.6311
2013–2014 1.05798 2.907 0.930 ˗5.7918 7.9077
2013–2014 2006–2007 ˗1.27660 2.907 0.899 ˗8.1263 5.5731
2009–2010 ˗1.05798 2.907 0.930 ˗7.9077 5.7918
ACM 2006–2007 2009–2010 ˗0.493 0.215 0.058 ˗1.00 0.01
2013–2014 ˗0.968* 0.214 < 0.001 ˗1.47 ˗0.46
2009–2010 2006–2007 0.493 0.215 0.058 ˗0.01 1.00
2013–2014 ˗0.475 0.215 0.071 ˗0.98 0.03
2013–2014 2006–2007 0.968* 0.214 < 0.001 0.46 1.47
2009–2010 0.475 0.215 0.071 ˗0.03 0.98
ACED 2006–2007 2009–2010 0.21734 3.53186 0.998 ˗8.1047 8.5394
2013–2014 ˗9.97330* 3.53186 0.014 ˗18.295 ˗1.6512
2009–2010 2006–2007 ˗0.21734 3.53186 0.998 ˗8.5394 8.1047
2013–2014 ˗10.19064* 3.53186 0.012 ˗18.512 ˗1.8685
2013–2014 2006–2007 9.97330* 3.53186 0.014 1.6512 18.295
2009–2010 10.19064* 3.53186 0.012 1.8685 18.512 (I)
YearGroup (J)
YearGroup Mean
Difference (I-J)
Std Error
Sig. 95% Confidence Interval
Lower Bound
Upper Bound
ROA 2006–2007 2009–2010 0.247782 0.19066 0.397 ˗0.20151 0.69708
2013–2014 ˗0.245313 0.19066 0.404 ˗0.69461 0.20398
2009–2010 2006–2007 ˗0.247782 0.19066 0.397 ˗0.69708 0.20151
2013–2014 ˗0.493095* 0.18749 0.024 ˗0.93492 ˗0.05127
2013–2014 2006–2007 0.245313 0.19066 0.404 ˗0.20398 0.69461
2009–2010 0.493095* 0.18749 0.024 0.05127 0.93492
ROE 2006–2007 2009–2010 0.034227 0.22568 0.987 ˗0.49761 0.56606
2013–2014 ˗1.889285* 0.22568 < 0.001 ˗ 2.4211 ˗1.35745
2009–2010 2006–2007 ˗0.034227 0.22568 0.987 ˗0.56606 0.49761
2013–2014 ˗1.923512* 0.22193 < 0.001 ˗2.4465 ˗1.40052
2013–2014 2006–2007 1.889285* 0.22568 < 0.001 1.35745 2.4211
2009–2010 1.923512* 0.22193 < 0.001 1.40052 2.4465
Tobin’s Q
2006–2007 2009–2010 ˗0.005400 0.02829 0.980 ˗0.07207 0.06127
2013–2014 ˗0.082044* 0.02829 0.011 ˗0.14871 ˗0.01538
2009–2010 2006–2007 0.0054 0.02829 0.980 ˗0.06127 0.07207
2013–2014 ˗0.076644* 0.02782 0.017 ˗0.14220 ˗0.01108
2013–2014 2006–2007 0.082044* 0.02829 0.011 0.01538 0.14871
2009–2010 0.076644* 0.02782 0.017 0.01108 0.1422
*. The mean difference is significant at the 0.05 level.